the Creative Commons Attribution 4.0 License.
the Creative Commons Attribution 4.0 License.
 | 18 Mar 2019
Resolving the influence of temperature forcing through heat conduction on rock glacier dynamics: a numerical modelling approach
Alessandro Cicoira
Jan Beutel
Jérome Faillettaz
Isabelle Gärtner-Roer
Andreas Vieli
In recent years, observations have highlighted seasonal and interannual variability in rock glacier flow. Temperature forcing, through heat conduction, has been proposed as one of the key processes to explain these variations in kinematics. However, this mechanism has not yet been quantitatively assessed against real-world data.
We present a 1-D numerical modelling approach that couples heat conduction to an empirically derived creep model for ice-rich frozen soils. We use this model to investigate the effect of thermal heat conduction on seasonal and interannual variability in rock glacier flow velocity. We compare the model results with borehole temperature data and surface velocity measurements from the PERMOS and PermaSense monitoring network available for the Swiss Alps. We further conduct a model sensitivity analysis in order to resolve the importance of the different model parameters. Using the prescribed empirically derived rheology and observed near-surface temperatures, we are able to model the correct order of magnitude of creep. However, both interannual and seasonal variability are underestimated by an order of magnitude, implying that heat conduction alone cannot explain the observed variations. Therefore, we conclude that non-conductive processes, likely linked to water availability, must dominate the short-term velocity signal.
- Article
(6029 KB) - Full-text XML
- BibTeX
- EndNote


For several rock glaciers, and especially in Switzerland, surface displacements have been calculated over long time periods (Chaix, 1923; Wahrhaftig and Cox, 1959; Barsch and Hell, 1975; Francou and Reynaud, 1992; Berthling et al., 1998) by using position time series of landmark features (boulders). Since these early investigations, velocity variability has been detected on a multi-year scale. In the past decades, starting with some measurements on Gruben rock glacier (Haeberli, 1985), seasonal velocity variability has been observed on such creeping periglacial landforms. Even though differences exist between individual rock glaciers, velocity peak maxima are in general observed between summer and early winter and minima between spring and early summer (Delaloye et al., 2010). In the past years, advances in monitoring techniques and the introduction of continuously measuring DGPS (differential global positioning system) loggers (Buchli et al., 2012) have confirmed the previous observations on several rock glaciers and have further highlighted velocity peaks on a daily to a weekly scale, which are predominantly present during the melt season (Wirz et al., 2016a; Kenner et al., 2017; Buchli et al., 2018).
In order to explain the above introduced observations, classical concepts from related disciplines – geotechnical engineering and glaciology – have been applied to rock glacier research. Interannual velocities have been compared against climatic variables and external temperature forcing has been proposed as one of the key factors controlling the observed long-term flow variations (Roer et al., 2005; Krainer and He, 2006; PERMOS, 2016a). Similarly, temperature forcing has also been suggested as one of the most important factors controlling rock glacier flow velocity variability on a seasonal scale (Arenson et al., 2002; Kääb et al., 2007; Delaloye et al., 2010; Wirz et al., 2016b). Wirz et al. (2016b) have suggested liquid precipitation, snowmelt, air and ground temperature as the main factors controlling rock glacier flow on interannual, seasonal and shorter timescales. Previous studies (Johnson, 1978; Barsch, 1992; Krainer and He, 2006, amongst others) highlighted the influence of water on rock glacier and their dynamics. Possible positive feedback processes between rising temperature and increased deformation have also been suggested (Ikeda et al., 2008; Buchli et al., 2018).
Table 1Summary of field sites. The borehole locations are given in the CH1903+ coordinate system. The values of the geometrical and physical properties of the rock glaciers are given (thickness, slope, volumetric ice content and thermal diffusivity) as discussed in Sect. 2. For the ice content an acceptable range of values is proposed according to the literature (Hoelzle et al., 1998; Arenson et al., 2002). The mean observed rock glacier bottom temperature, measured at the lower end of the shear horizon (from summer 2006 to summer 2015) and surface velocity (from summer 2009) are reported, as well as the interannual and seasonal velocity variations relative to the mean velocity (from summer 2012 to summer 2016) (PERMOS, 2016a).

Even though great improvements have been achieved in this field, our understanding of the processes governing rock glacier dynamics and their relation with external forcings and controlling factors remains at a qualitative level, and many questions remain unanswered. However, it is clear that, in order to understand rock glacier dynamics, the complex thermo-hydro-mechanical behaviour of the ice-rich frozen soil and its coupling with the climate have to be considered. In particular, when aiming to understand the influence of temperature forcing on permafrost creep and its relative importance on rock glacier dynamics, we have to consider two aspects. On one hand, the thermal regime of a rock glacier is mainly controlled by heat conduction, driven by external temperature forcing (Vonder Mühll et al., 2003; Haeberli et al., 2006). Nevertheless, in some cases other processes have been observed, like air and water advection through the permafrost matrix (Hanson and Hoelzle, 2004; Zenklusen Mutter and Phillips, 2012; Scherler et al., 2014; Luethi et al., 2017; Pruessner et al., 2018). On the other hand, from glaciological studies, it is well known that the rate of deformation of ice is described by a power law (Nye, 1952; Glen, 1955) and depends on ice viscosity, which in turn depends on ice temperature (Mellor and Testa, 1969; Duval et al., 1983). Therefore, heat conduction forced by external surface temperature variations is expected to influence rock glacier creep. However, investigations that quantitatively couple temperature evolution and rock glacier rheology are rare and remain very limited (Kääb et al., 2007; Müller et al., 2016). The numerical modelling study by Kääb et al. (2007) investigated this process, but has two main limitations: it used a rock glacier rheology that has been derived for pure ice, and more importantly, it applied this rheology to a purely synthetic set-up and could not directly compare the results to real-world observations.
In this study, we quantify the relative importance of the conductive thermal influence on flow and extend previous research (Kääb et al., 2007) by applying the most up-to-date rheological relation available for rock glacier material (Arenson and Springman, 2005a) to four real-world rock glaciers and constrain the modelling with observations from borehole measurements, kinematics surveys and DGPS observations available from the Swiss Permafrost Monitoring Network PERMOS (here on named PERMOS) and PermaSense monitoring networks (https://doi.org/10.13093/permos-2016-01).
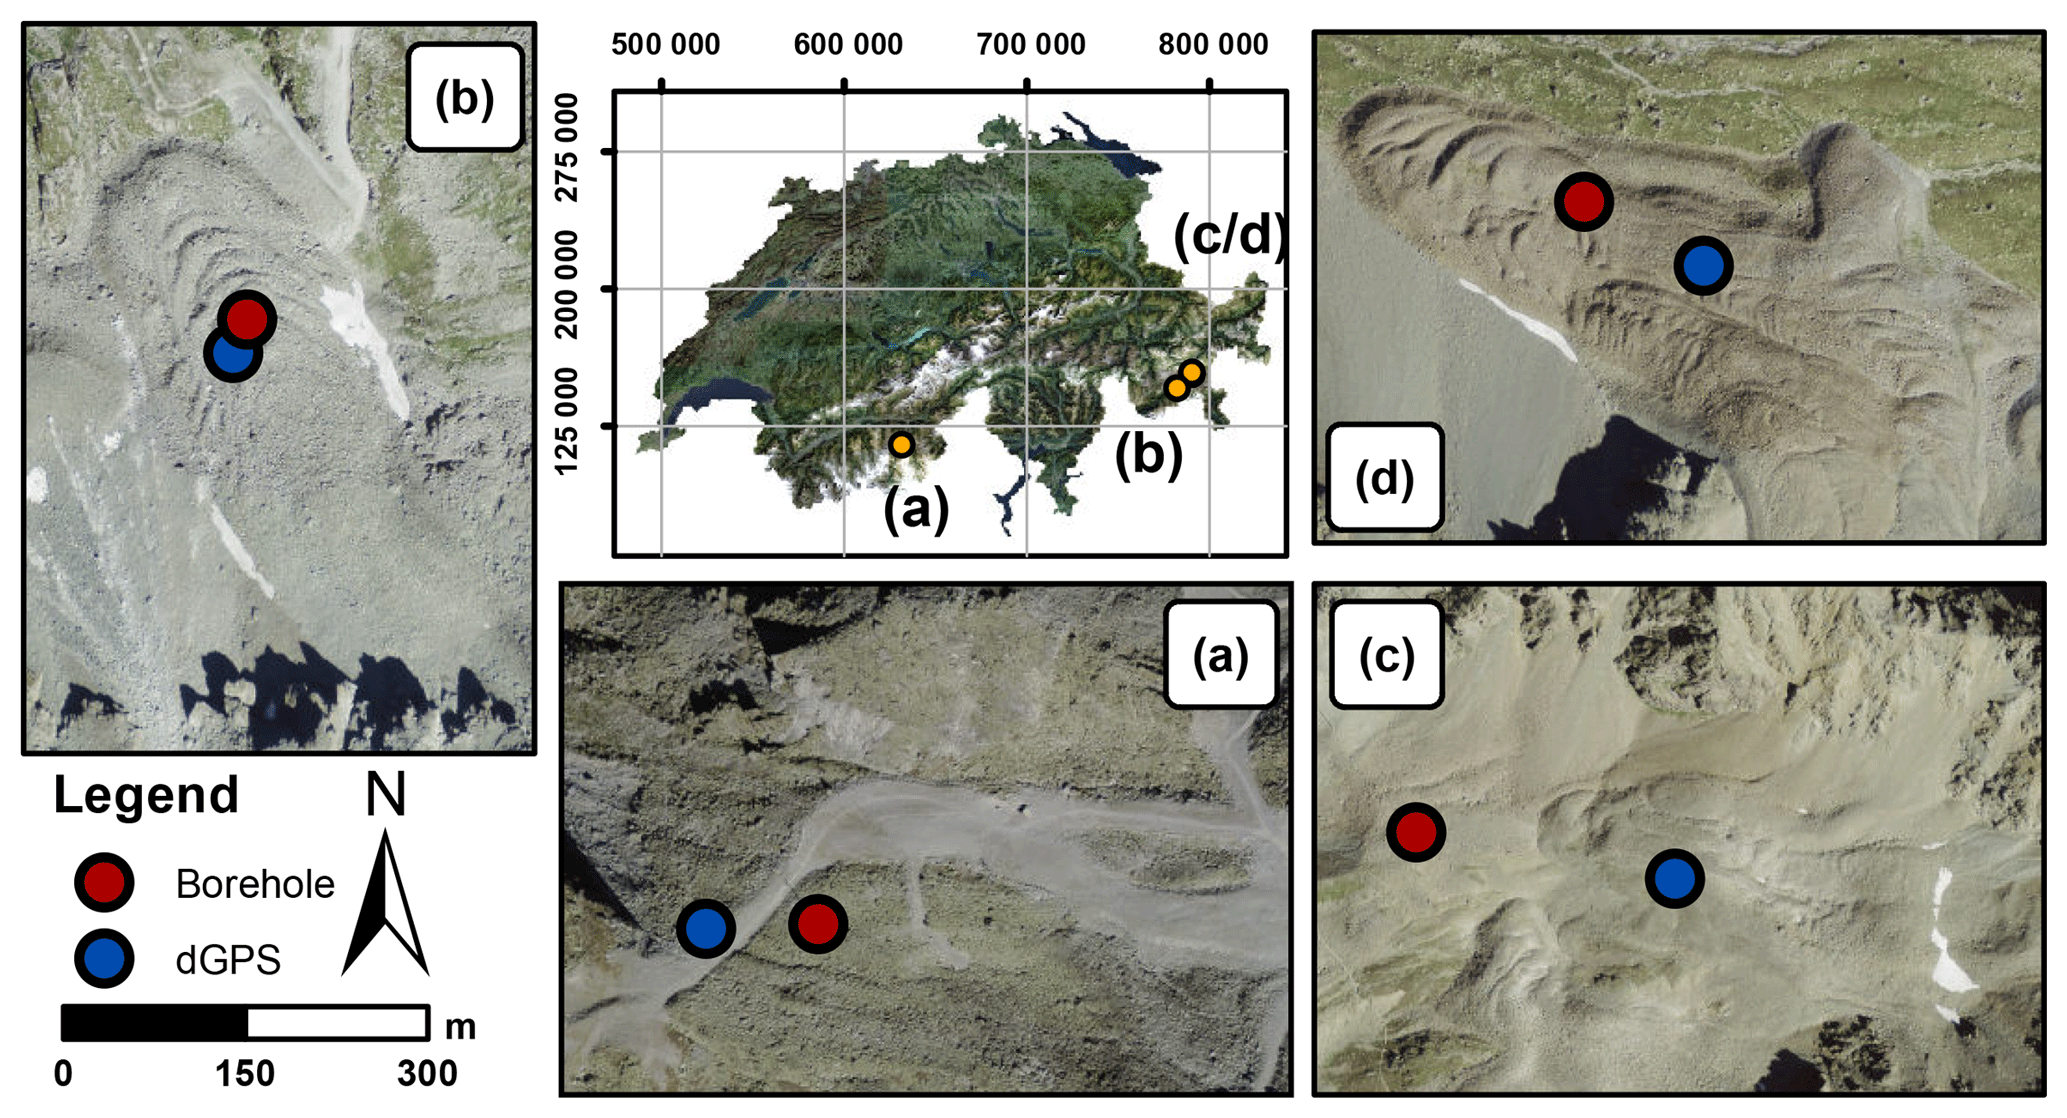
For constraining the numerical modelling investigations, we use observational data from four rock glaciers in the Swiss Alps, namely from the rock glaciers Ritigraben located in the Valais, and Murtèl-Corvatsch (hereafter called Murtèl), Schafberg, and Muragl all located in the Engadine (Fig. 1). These rock glaciers have been selected based on the availability of several years of data on highly time-resolved surface displacements and subsurface temperatures from boreholes. Further, several borehole deformation profiles are available for different time steps for all rock glaciers. This type of data is rather unique and made available through the PERMOS monitoring network.
These four rock glaciers cover a wide range of geometric settings and dynamic states: thickness, slope and flow velocity from decimetres to several metres per year; for an overview see Table 1. The rock glaciers are located at elevations between 2500 to 2900 m a.s.l. and their aspect is north to north-west. Their lithology mainly consists of crystalline formations, with prevailing granodiorite and schist for Murtèl and gneiss for Muragl, Schafberg and Ritigraben. The internal structure and deformation profiles are known for all four rock glaciers from boreholes (Haeberli et al., 1998; Arenson et al., 2002; Lugon and Stoffel, 2010). Here, we define the rock glacier thickness on the basis of their deformation profiles, which are dominated by shear horizon a few metres thick at 18 to 30 m depth. Laboratory shear experiments have been undertaken on cores from boreholes for the two rock glaciers Murtèl and Muragl and were used by Arenson and Springman (2005a) to derive an empirical creep rheology (Arenson et al., 2004; Arenson and Springman, 2005b), which is also used in the flow-modelling investigations of this study (for details see Sect. 3.3).
2.1 Ritigraben
The Ritigraben rock glacier is located above the village of Grächen (VS) and originates from the northern slope of the Gabelhorn (3135 m a.s.l.). It develops a simple linear flow lobe of about 500 m length on a steep slope (27∘ in the proximity of the borehole, Fig. 1 and Table 1) and terminates at the upper end of the Ritigraben gully. The surface is affected by the ski slope facilities that have been built on the rock glacier. Accounting for the steep slope and the geometrical setting, the flow unit is only 20 m thick and the flow velocities are rather high relative to other rock glaciers. Continuous DGPS measurements have provided velocity data since 2012, showing a mean value of 1.4 m a−1 and strong seasonal and interannual variations of more then 45 % and 25 % respectively; see Table 1. Even though no ice cores have been analysed, volumetric ice content has been estimated in previous studies at 30 %–70 % (Lugon and Stoffel, 2010; Luethi et al., 2017). Borehole measurements since 2002 show warm permafrost temperatures close to the melting point and the progressive development of a talik at a depth between 10 and 12 m (Zenklusen Mutter and Phillips, 2012), which has been related to the influence of water infiltration and air circulation (Luethi et al., 2017).
2.2 Murtèl-Corvatsch
The Murtèl rock glacier originates from the north wall of Piz Murtèl (3432 m a.s.l.) and is characterised by a single lobe of 27 m thickness with well-developed surface morphology of lobate furrows and ridges (Fig. 1a) that can be attributed to compressive flow, and buckle and folding (Loewenherz et al., 1989; Kääb and Weber, 2004; Frehner et al., 2015). Consistent with a low surface slope of 12∘, this rock glacier flows rather slowly at 0.14 m a−1 (amongst others Kääb et al., 1998; Müller et al., 2014; see Table 1). Murtèl is probably the best-studied rock glacier in the world, with continuous temperature monitoring data from boreholes available since 1987 (Haeberli et al., 1988, 1998). The drillings from 1987, 2000 and 2015 (Haeberli et al., 1988; Vonder Mühll et al., 2003) and geophysical investigations (Haeberli et al., 1998; Arenson et al., 2002, 2010) revealed relatively ice-rich material in the main rock glacier body with an estimated volumetric ice content close to 100 %. The temperatures within the main body of the rock glacier are between −4 and −1 ∘C and therefore relatively cold compared to other instrumented rock glaciers in Switzerland (Vonder Mühll et al., 2003; PERMOS, 2016a). Annual velocities have been measured since 2009 by a geodetic survey of 11 surface markers around the borehole (PERMOS, 2016a). Further, several years of borehole deformation data (at time intervals of several months) are available from 1987 to 1994 (Haeberli et al., 1998; Arenson et al., 2002). The time-averaged yearly velocities show an increasing trend, coherent with observations for other rock glaciers throughout the Swiss Alps, as shown in the PERMOS Glaciological Report no. 12–15 (PERMOS, 2016a).
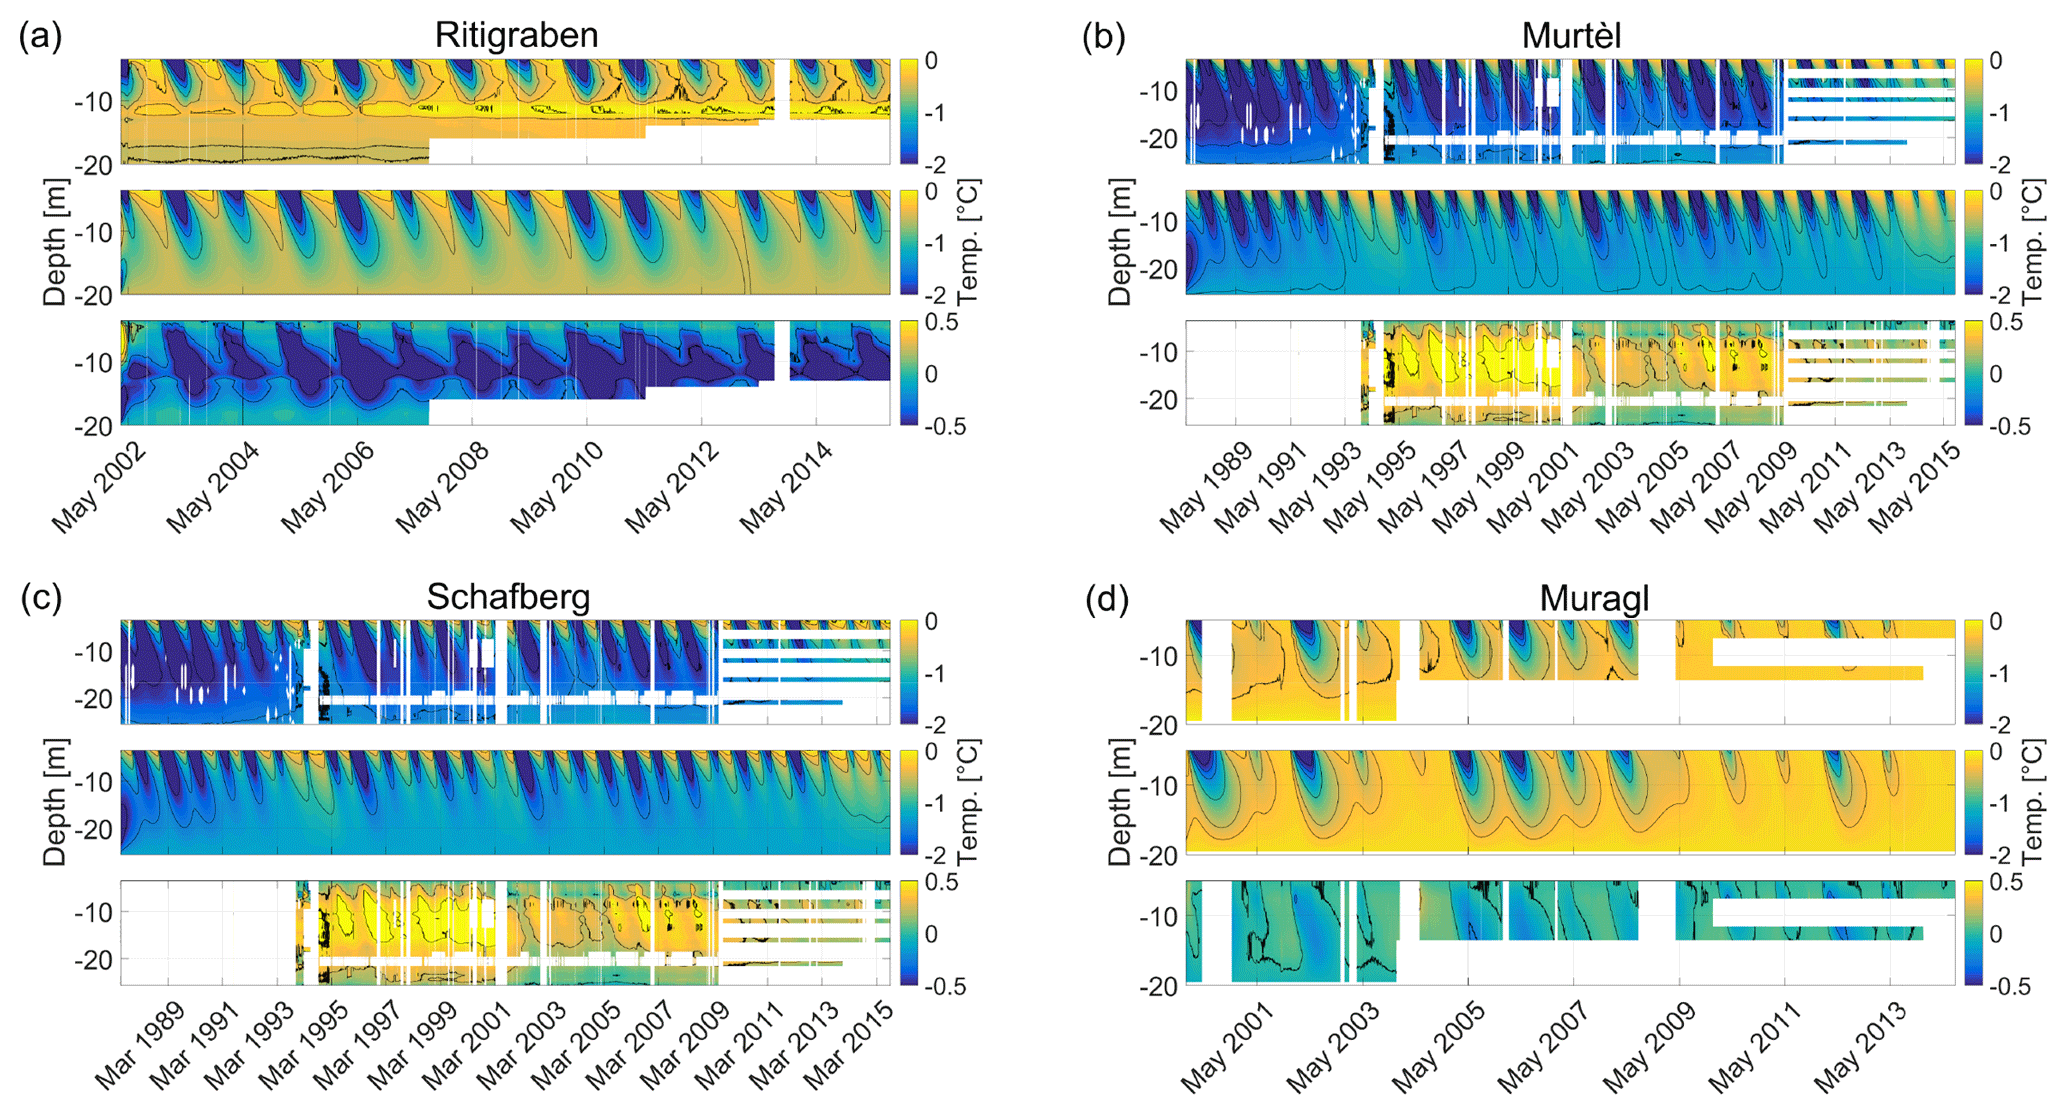
Figure 2Contour plots of ground temperatures time series (colour coded) for rock glaciers (a) Ritigraben, (b) Murtèl, (c) Schafberg and (d) Muragl. Each panel shows, from top to bottom, measured temperatures, modelled temperatures and differences between the measured and the modelled temperatures. Note the different temperature scales of the lower sub panels with the temperature differences.
2.3 Schafberg
The Schafberg rock glacier originates in a cirque south of the Piz Muragl ridge, has an extent of less than 300 m and an average surface slope of 18∘ (Table 1, Fig. 1c). In the lower part, the rock glacier splits into two separate tongues as a result of a bedrock outcrop. This study focuses on the north-western lobe, where in 1997 a borehole was drilled and temperatures were monitored thereafter within PERMOS. This lobe has a thickness of approximately 26 m and a flow velocity of 0.3 m a−1. Investigations by Vonder Mühll (1993) show a volumetric ice content ranging from 35 % to 100 %. Hoelzle et al. (1998) investigated internal deformation profiles from borehole measurements in relation to photogrammetric analysis. Continuous daily velocities have been measured by DGPS within the PermaSense framework since 2012 approximately 200 m upstream of the borehole location and show clear seasonal variations with an amplitude of up to 39 % relative to the mean velocity and a rising interannual trend (33 % increase in the observed period).
2.4 Muragl
The Muragl rock glacier is located on the western side of the ridge of Piz Muragl (3156 m a.s.l.) and consists of several generations of overlapping flow units of variable flow velocity (Fig. 1d). The main lobe, where the borehole is located, moves at 1.5 m a−1, is approximately 25 m thick and has a surface slope of 20∘ (Table 1). The annual surface motion has been available from terrestrial survey since 2009, whereas continuous daily velocities from DGPS measurements at the lower end of the lobe have been measured since 2012 and indicate clear interannual (25 %) and seasonal variations (14 %) (PERMOS, 2016a). Older geophysical and photogrammetrical measurements have been presented in Vonder Mühll and Schmid (1993). Volumetric ice content has been estimated from boreholes investigations at 40 %–70 % and is found to be very heterogeneous (Arenson et al., 2002). The temperatures within the rock glacier, measured since the drilling in 1999, range from −3 to 0 ∘C and are relatively close to the melting point (Vonder Mühll et al., 2003). As for the Murtèl rock glacier and consistent with other observations in the Alps, there is a rising trend of multi-annual velocities (PERMOS, 2016a).
We designed a suite of 1-D numerical models, based on finite differences, to simulate the response of viscous and plastic flow to external near-surface temperature forcing using the software MATLAB (2016). The modelling framework couples heat conduction, forced by external temperature, to a power-law creep relation for ice-rich frozen soils proposed by Arenson and Springman (2005a). The model inputs are the surface slope, the thickness and other physical properties (density, volumetric ice content and thermal diffusivity) of the creeping rock glacier. All the parameters are assumed to be homogeneous in time and space in first approximation. Note that geophysical investigations on several rock glaciers including the ones presented here (amongst others: Arenson et al., 2002, 2010; Maurer and Hauck, 2007; Buchli et al., 2018) showed high heterogeneity and spatial variability. The model is forced by permafrost temperature time series measured in boreholes below the active layer. At the lower boundary of the rock glacier a constant temperature value representative of the observed bottom temperature is prescribed. The model is applied to the four study cases described in Sect. 2 and the results are compared to observed borehole temperatures and surface flow velocities.
3.1 Data overview
Here, we provide a detailed description of the data used for model input and for comparison with the model results.
The surface slope values are calculated on the basis of the swisstopo digital cartography (Federal Office of Topography swisstopo, 2018) over a 200 m long profile along a flow line centred at the DGPS location and are representative of the average slope of the landform close to the DGPS positions. For all four study cases vertical profiles of borehole deformation are available at several time steps over few years (Arenson et al., 2002; Kenner et al., 2017). The rock glacier thickness is defined based on these profiles as the vertical distance from the surface to the lower end of the shear horizon. Volumetric ice content values between 30 % and 100 % have been noted in the literature and are mostly based on borehole drillings (Vonder Mühll, 1993; Arenson et al., 2002; Lugon and Stoffel, 2010). The densities of the rock glaciers are calculated as a weighted average between the density values of pure ice ρice and solid rock ρrock from the volumetric ice content wi. The thermal diffusivity κ is calculated similarly based on the thermal diffusivity values of pure ice (0.1 m2 day−1) and quartz (0.35 m2 day−1) as proposed by Williams and Smith (1989). Borehole temperature time series are available from the PERMOS database for the four study cases from spring 2002 to autumn 2015 with a time resolution of 6 h (the time series of Muragl terminates in autumn 2014). For our modelling, we resample these data to a daily average. For all four study cases, some data gaps occur due to sensor failure, in particular at depth. For temperatures at depth just below the active layer, which are used as forcing input for the model, the data gaps are below a few months apart from the case of Muragl, for which temperature data in the period between August 2008 and April 2009 are missing. Missing temperature data are linearly interpolated. Note that this linear interpolation does not aim to reconstruct exact real temperatures, but rather bridges the gaps in order to create a continuous temperature time series that can be used as model input. This approach is considered satisfactory due to the combination of the scarcity of data gaps in the surface temperature time series and the length of the considered seasonal to multi-annual timescales. Note that more sophisticated methods (e.g. Staub et al., 2017) could be used for interpolating the temperature time series. This means, the modelled short-term velocity variations should be analysed carefully near these gap-filled periods. Figure 2 shows the measured temperatures for all case study sites.
Several types of velocity data are available. For Murtèl and Muragl rock glacier mean annual surface velocities are available between 2009 and 2015 from terrestrial surveys with total station from the PERMOS network. For all study cases but Murtèl, daily velocities from continuous single frequency DGPS measurements are available from 2012 from the PermaSense network. For a summary of the study case sites see Table 1.
3.2 Heat conduction model
We model vertical heat conduction throughout the rock glacier unit by solving the diffusion equation for temperature evolution with depth (Williams and Smith, 1989):
where T is the permafrost temperature, z the vertical coordinate, t the time and κ the thermal diffusivity of the rock glacier material. At the upper boundary the observed temperature history just below the active layer depth is prescribed. At the bottom of the rock glacier (below the shear horizon) a constant temperature value corresponding to the time average of the observations is prescribed. The initial condition is prescribed from the measured vertical temperature profile at the first time step of the simulation. The temporal resolution of the model is 1 day, and its vertical resolution is 0.1 m. Convective and advective heat fluxes and any influence from basal heating due to frictional processes, heat dissipation from deformation and geothermal heat flux are not considered in this model.
3.3 Ice-creep model
For modelling ice creep we use the empirically derived creep relation proposed by Arenson and Springman (2005a). The samples used to derive this relation have been cored from Murtèl and Muragl rock glacier, also investigated in this study, and are described in detail in Arenson and Springman (2005b). The creep relation is a modified Glen's flow law, which relates strain rate to a stress invariant σe as proposed by Von Mises (1913), taking into account the volumetric ice content wi and the temperature T of rock glacier material:
The flow law exponent n linearly depends on volumetric ice content only,
and the creep parameter A depends on temperature and volumetric ice content by
where b(wi) is a function of the volumetric ice content,
Assuming an infinitely wide surface parallel slab, the shear stress σe at a depth z is given by
where ρr to the density of the rock glacier material, g the constant of gravity and the slope of the ice surface, which is assumed to be parallel to the rock glacier surface slope. Note that the density ρr also depends on the ice density by
where ρi and ρs are the densities of ice and sediment particles respectively. As in our case the ice thickness of the rock glacier landform is fixed, any variation in volumetric ice content wi will change the density and as consequence the shear stress σe (see Eq. 6).
Given the temperature field and assuming an inclined infinite parallel slab, the velocities are solved from Eq. (2) through vertical integration under the assumption of zero displacement at the lower boundary. This hypothesis is confirmed by the low deformation rates at the bottom of the borehole inclinometer profiles for all the studied rock glaciers. The physical properties of the material are considered constant in time and homogeneous in space. The temporal and the spacial model resolution are the same as for the heat conduction model. Despite its limitations, the proposed constitutive relation is one of the most up to date on rock glacier material and has the great advantage of being based on laboratory experiments.
3.3.1 Calibration of the model
The model is calibrated to best fit the average observed surface velocities by varying the volumetric ice content parameter within the range of literature values. Because of the mathematical formulation of the applied rheology, calibrating the model by varying the volumetric ice content gives a concave curve for the mean velocities, with a maximum corresponding to around 60 % volumetric ice content (see Fig. 3). On the one hand, an increasing volumetric ice content causes the creep relation exponent to grow, resulting in higher surface velocities. On the other hand, a higher volumetric ice content implies a lower density and thus a lower shear stress and deformation. This mathematical artefact is because the thickness of the rock glacier in the modelling is fixed. In reality, for varying volumetric ice content values, the rock glacier thickness and velocity would adjust until the shear stress at the base of the rock glacier reaches a critical value.
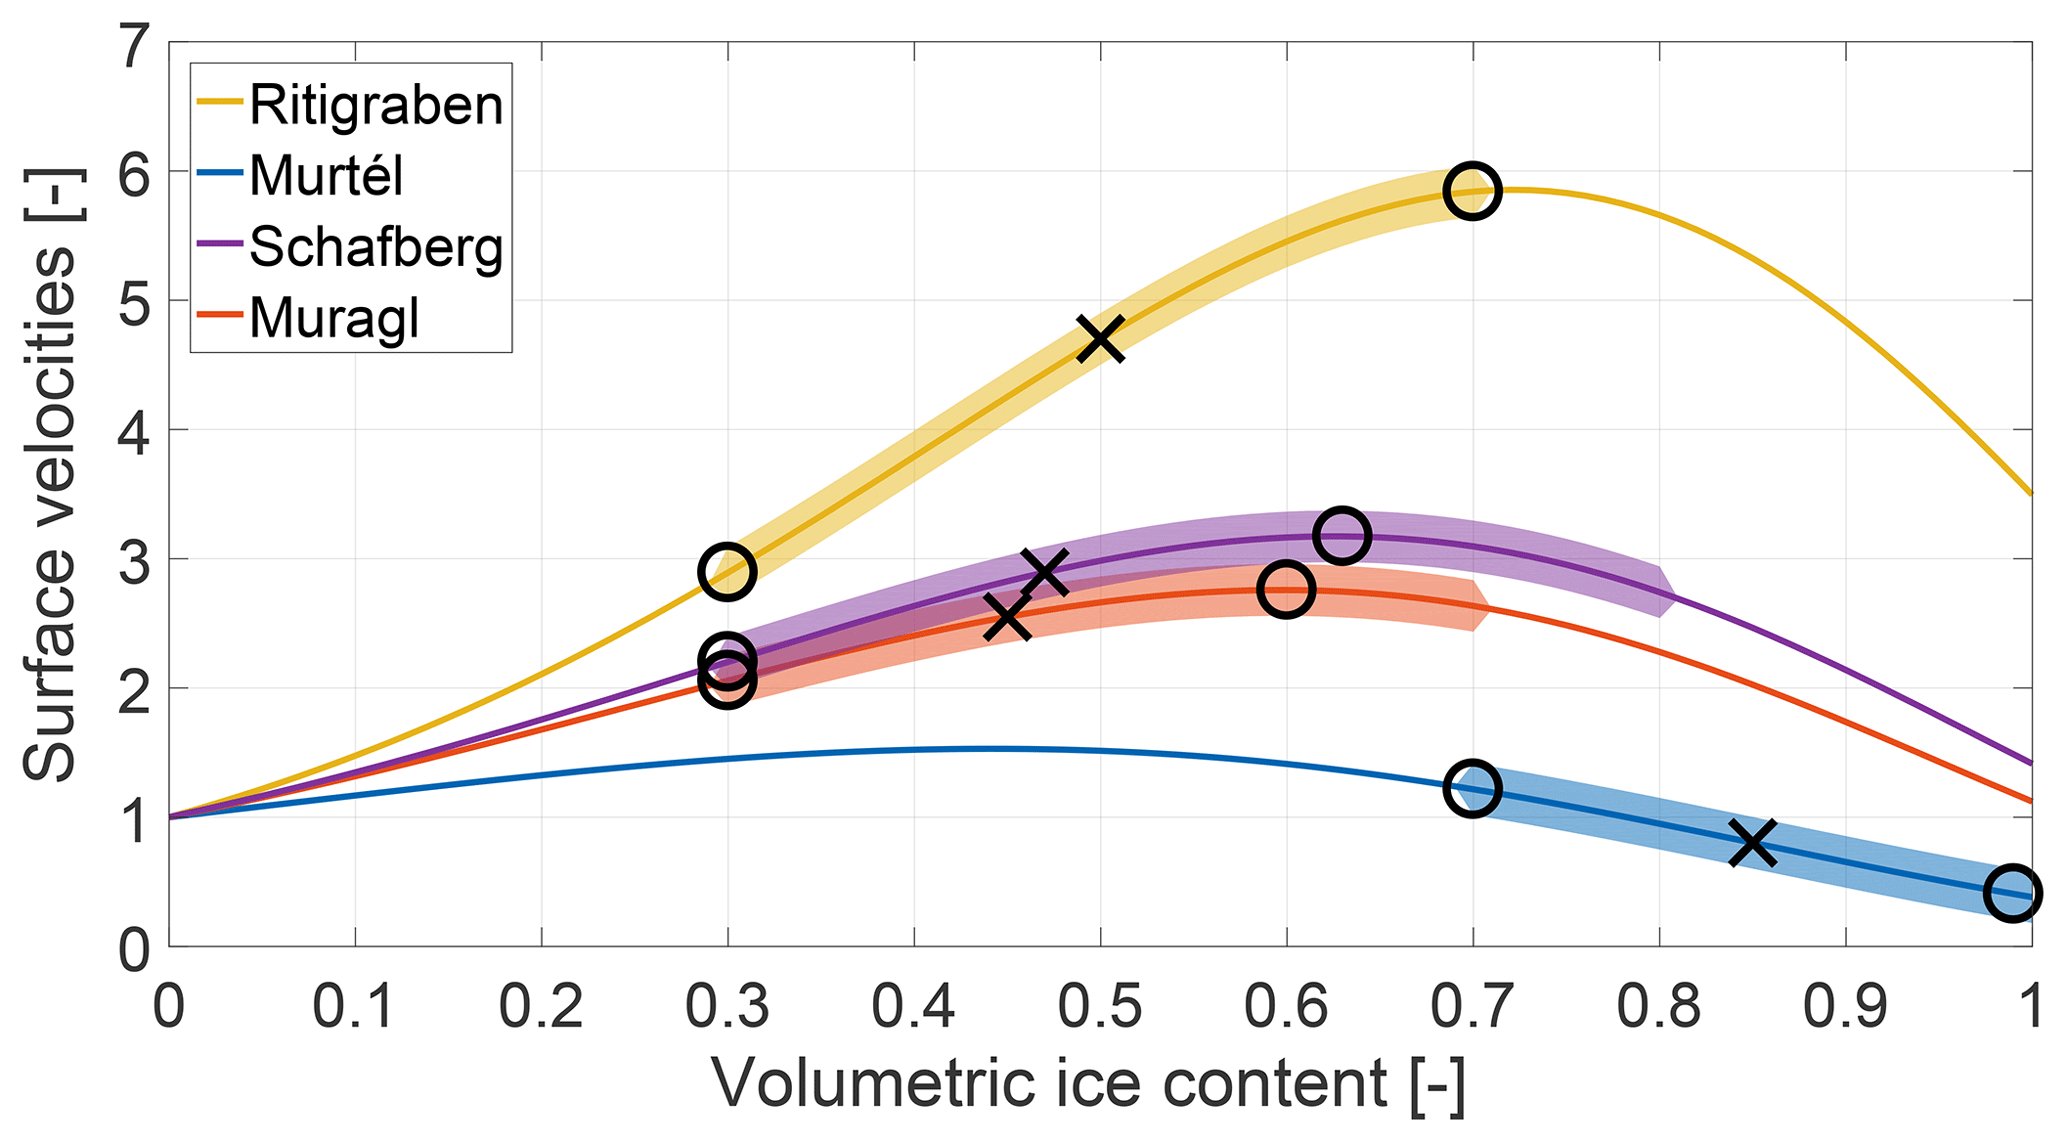
Figure 3Normalised surface velocities for the four case studies with volumetric ice content values. For each rock glacier the velocities are normalised with the velocity value corresponding to 0 % ice content. The coloured buffer around the curve shows the range proposed by the literature (Vonder Mühll, 1993; Arenson et al., 2002; Lugon and Stoffel, 2010). The black circles show for each curve the maximum and the minimum possible velocity values within this range, also representing the uncertainty range for the modelling. The black cross shows the chosen volumetric ice content value for the modelling, i.e. the middle value of the latter range.
Within the range of possible volumetric ice content values proposed in the literature (Vonder Mühll, 1993; Arenson et al., 2002; Lugon and Stoffel, 2010), we further refine the range for which the maximum and the minimum velocities are obtained (black circles in Fig. 3). We set the volumetric ice content parameter to the mean of this range and further assess the effect of the uncertainty range on the velocity results.
Table 2Summary of modelling inputs and results. Values of geometrical and physical input parameters for the modelling are listed (thickness, slope, volumetric ice content and thermal diffusivity). The mean modelled surface velocity and its relative interannual and seasonal variations are reported in the last three columns.

Table 3Parameters and results of the sensitivity experiments. The first column indicates the scenario with a label in the form of Scnα, where α refers to the value of the multiplication factor for the investigated parameter relative to the reference values. Each column represents a set of experiments for one variable parameter, with the first number in each column referring to the input parameter value. The numbers in the bracket of each column refer to seasonal variations as a percentage of the mean value on the left side and the phase shift relative to the reference scenario on the right side (with a cycle of 2π referring to 1 year).

We consider further uncertainties in input parameters: slope ±2∘, ice content (corresponding to the maximum and minimum velocity value) and thermal diffusivity ±0.02 m2 day−1.
The creep model strongly depends on the temperature input. In order to assess uncertainties related to the heat conduction model and to take into account all possible heat transfer process, we perform additional numerical experiments forcing the ice-creep relation directly with the observed temperature fields with depth.
3.3.2 Consideration of shear horizon
The above described approach for creep does not consider enhanced deformation in the shear horizon, where most of the displacement takes place. In order to investigate the sensitivity of the model to such a phenomenon, we perform additional numerical experiments. We approximate the behaviour of the shear horizon with a pseudo-plastic creep relation, by increasing the flow law exponent of Eq. (2) by a factor 4 (), similarly to Frehner et al. (2015). The creep parameter A has been reduced by a factor fA to match the time-averaged surface velocities modelled before:
In this way, we approximate the plastic behaviour of the lower layer to better represent the whole deformation profile of the studied rock glaciers.
3.4 Sensitivity experiments
We perform additional synthetic sensitivity experiments in order to explore the influence of the different input parameters on our model results. For these experiments we simulate seasonal temperature forcing by prescribing the temperature below the active layer as a sinusoidal function with a mean of 0 ∘C, which truncates positive temperatures in order to take into account the zero curtain effect. The initial vertical temperature profile is set to 0 ∘C. The model runs for 28 full annual cycles after which it converged to a quasi-steady-state periodic solution. We then analyse the results of the last two successive cycles. We study the sensitivity to seasonal temperature amplitude (corresponding to the minimum winter temperature), temperature at the lower boundary, rock glacier thickness, volumetric ice content and thermal diffusivity. We set up a reference scenario with typical values for rock glaciers taken as Scn1.0 in Table 3. Starting from the reference scenario, we perform 9 numerical experiments for each parameter, in which we vary the value of the parameter by a factor of 0.2 up to 1.8, with the other parameters kept constant. The numbers in the experiment name in Table 3 refer to the multiplication factor of the parameters relative to the reference scenario. Only for the experiments on the volumetric ice content parameter the multiplications factors are different, as shown in Table 3.
Additionally, the thickness sensitivity experiments have been repeated using the pseudo-plastic rheology (Eq. 8) in order to investigate the effect of the presence of the shear horizon in our experiment. In the case of both sets of varying thickness experiments (with and without shear horizon), the bottom temperature for the scenarios with thicknesses less than the one of the reference are always prescribed at 20 m depth. For these shallow depths, prescribing a constant temperature would unrealistically constrain the temperature field. For all the values and the results of this analysis we refer to Table 3.
4.1 Modelled temperatures
The modelled and measured temperatures are shown in Fig. 2. For Schafberg and Muragl rock glaciers (Fig. 2c and d respectively) the modelled temperatures agree very well with the measurements (temperature differences are below 0.2 ∘C). For the case of Murtèl rock glacier, given the prescribed temperatures below the active layer, the modelled temperature evolution with depth agrees well with regard to seasonal amplitude and phase with depth. However, between a depth of 5 and 20 m, temperatures are in particular during cold seasonal phases slightly underestimated, but the differences stay below 0.5 ∘C. For Ritigraben rock glacier, as shown in Fig. 2a, in a depth between 8 and 12 m and in particular in early summer, observed temperatures are substantially higher (up to 1 ∘C), which is related to the talik observed and discussed in Luethi et al. (2017). The depth of the zero annual temperature amplitude is according to the PERMOS (2016a) report, usually between 10 and 20 m depth. This depth is slightly overestimated by our model (see Fig. 2), with the seasonal temperature signal reaching slightly deeper in comparison to the borehole measurements (PERMOS, 2016a).
4.2 Modelled velocities
The observed and modelled surface flow velocities with time are shown in Fig. 4 for the modelled temperatures (solid blue line), for the observed temperature fields (red solid line), and for the pseudo-plastic rheology (yellow solid line) with modelled temperatures. The resulting maximum and minimum velocities accounting for uncertainties in the input parameter of volumetric ice content, slope and thermal diffusivity are shown with two black dashed lines.
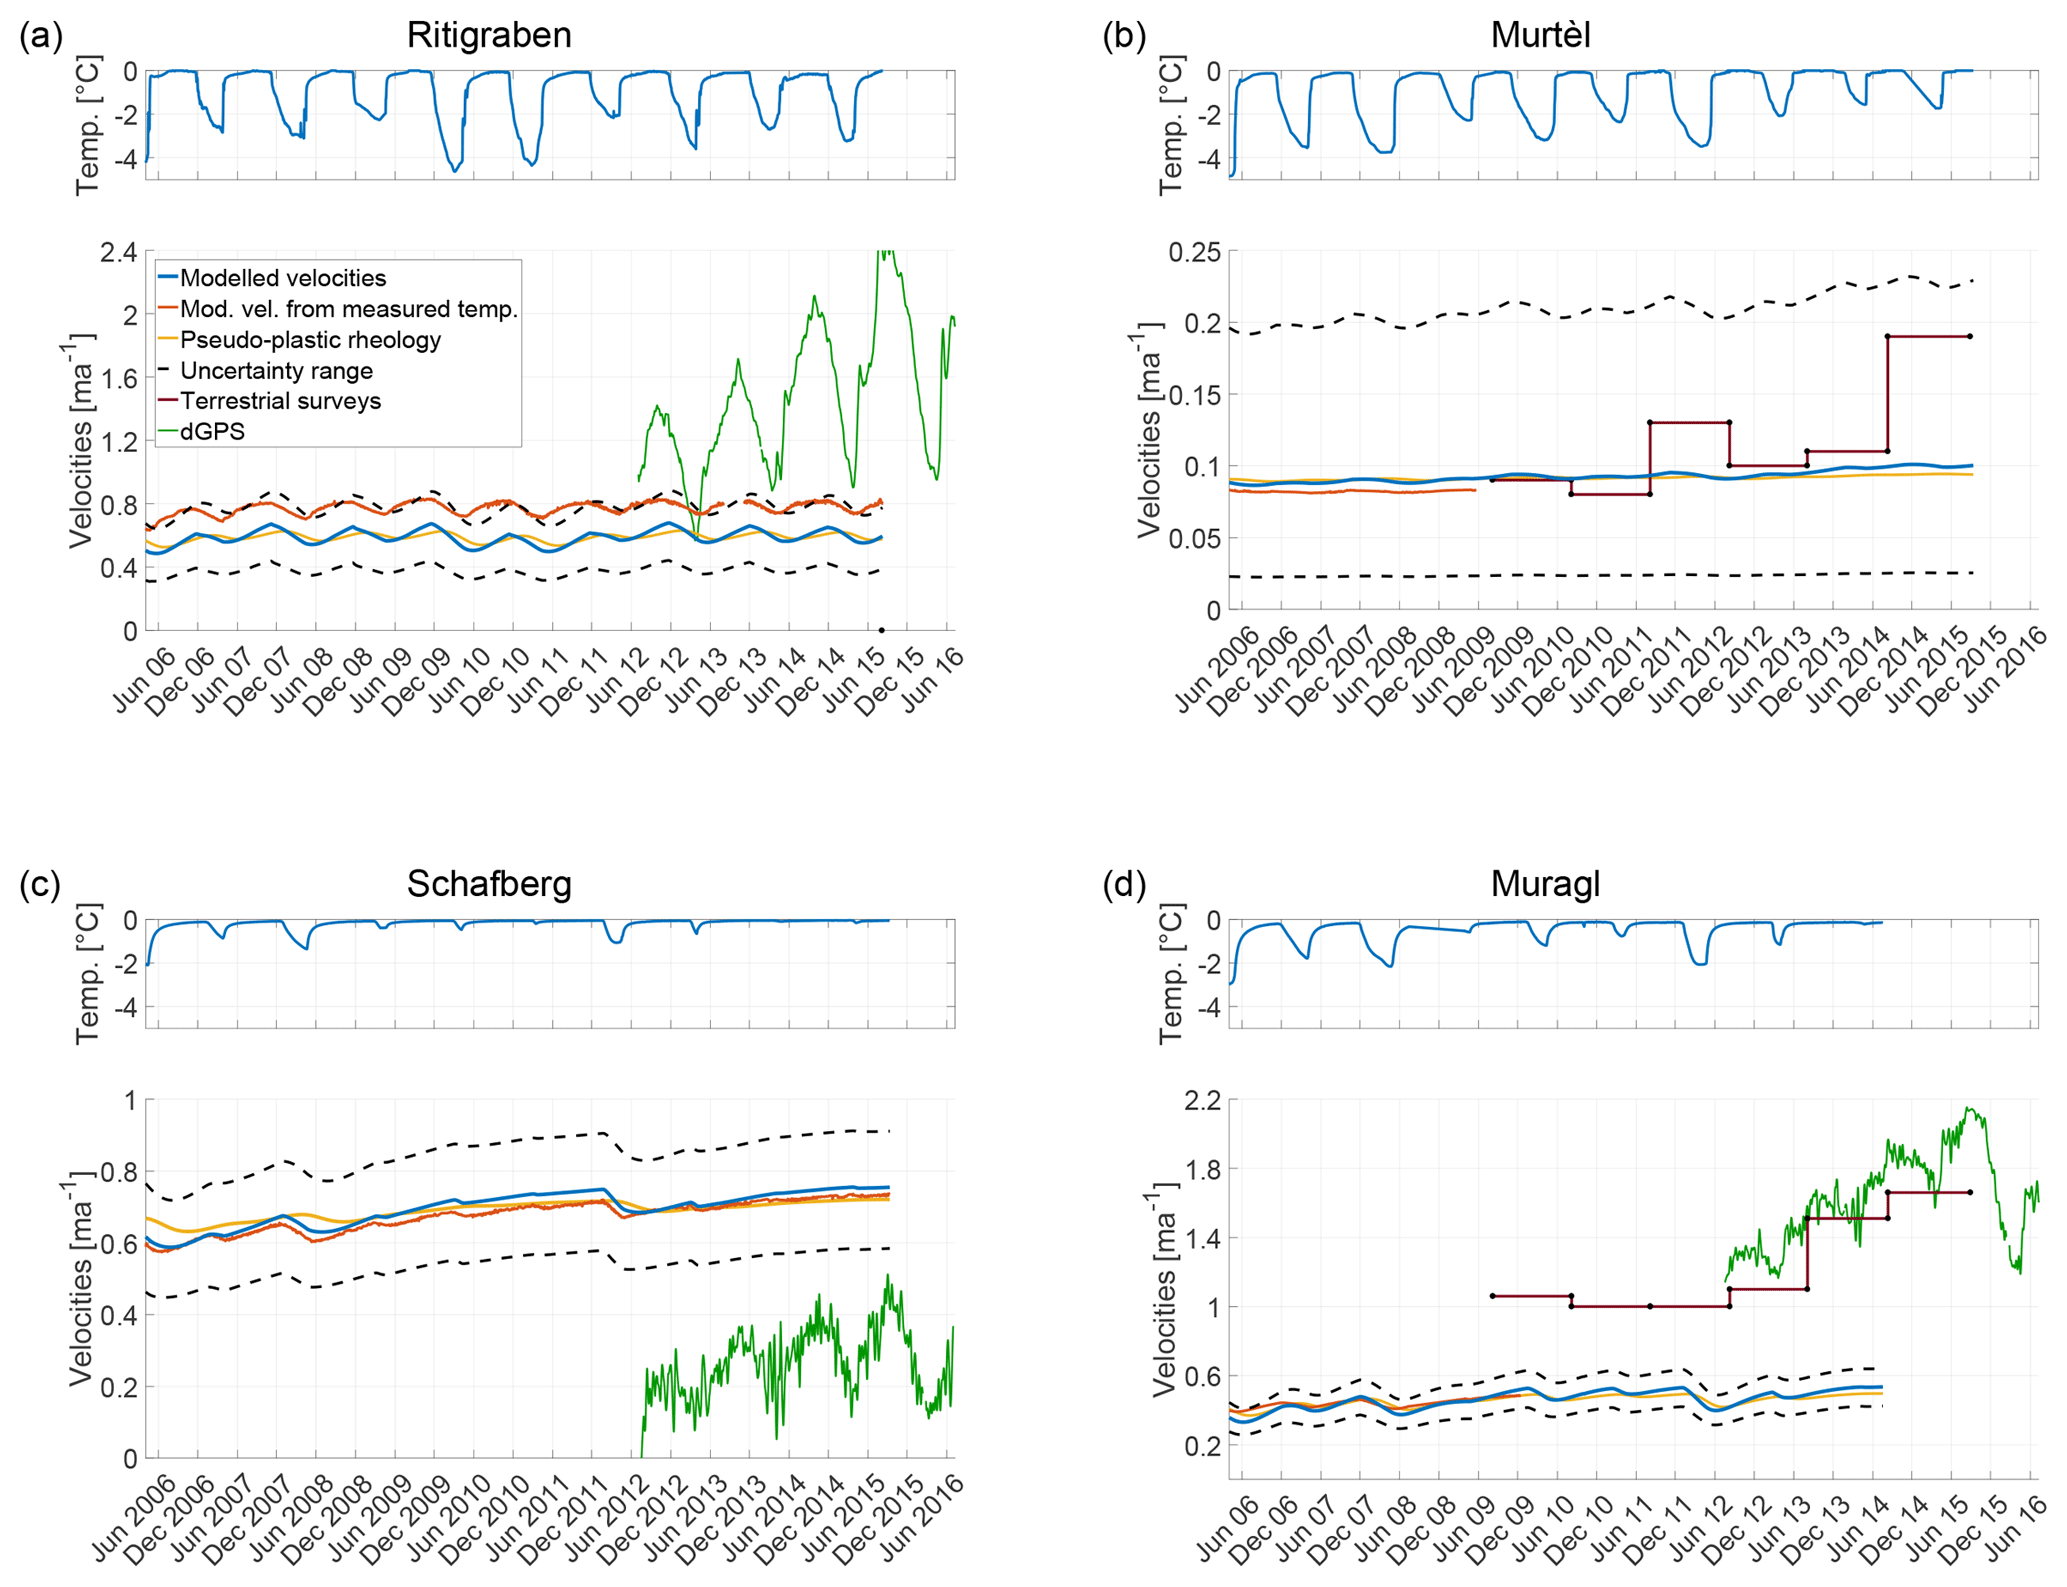
Figure 4Observed and modelled surface flow velocities for (a) Ritigraben, (b) Murtèl, (c) Schafberg and (d) Muragl rock glaciers. The upper subpanel shows the observed subsurface temperature used as model input. The lower subpanel shows the modelled and observed velocities. The modelled velocities are shown for using the modelled temperatures (solid blue line), the observed temperature fields (red solid line), and the pseudo-plastic rheology (yellow solid line). The uncertainty range resulting from variations in slope (±2∘), volumetric ice content (within the proposed range; see Fig. 3 and Table 2) and thermal diffusivity (±0.02 m2 day−1) is plotted with black dashed lines. The modelled velocities are compared with the observed velocities from terrestrial surveys (dark solid red line with black dots) and with DGPS measurements (green solid line).
For the chosen volumetric ice content values within the proposed range, we obtain the correct order of magnitude of the observed surface velocities for all four case study rock glaciers. For Ritigraben and Muragl rock glaciers the modelled velocities are smaller (by a factor 2), for Murtèl the average velocity matches the observations and for Schafberg the modelled velocities are overestimated (by a factor 3) in comparison to the observed ones.
The modelled amplitudes in seasonal and multi-annual velocity variations (values in Table 2, solid blue, yellow, and red line in Fig. 4) are in general rather low: below 10 % relative to the mean velocity. In comparison, the observed variations in flow (solid green and purple lines in Fig. 4, Table 1) are 1 order of magnitude higher. This result does not change when considering uncertainties in the input parameters (dashed black lines in the same figure).
For the three rock glaciers with continuous DGPS measurements, we are also able to compare the phase of the seasonal variations. The modelled velocity maxima occur in late winter and are substantially delayed in comparison to the observed velocity peaks in autumn. The above findings (amplitude underestimation and phase shift) do not change when the observed temperature fields are used as input for the creep model. The exception is the case of Ritigraben, where, as discussed above, substantial discrepancies between velocities obtained using modelled (blue solid line) and observed (red solid line) temperatures occur. When using the observed temperature field, the modelled and the observed seasonal velocity variations are phase synchronous (see red and green line in Fig. 4).
The discrepancies found between observed and modelled velocity variations do not improve when using the pseudo-plastic creep model for all rock glaciers. On the contrary, the seasonal velocity amplitude further reduces and the phase shift increases further (see yellow line in Fig. 4).
4.3 Sensitivity experiments
The results of the sensitivity experiments are plotted in Figs. 5 and 6 and are summarised in Table 3.
In Fig. 5, the time-averaged velocity values for the different experiments and scenarios are shown normalised to the mean values of the reference scenario. The left panel shows the results of the experiments investigating the thermal regime of the rock glacier for varying subsurface temperature-forcing amplitude, bottom and initial temperature, and thermal diffusivity. The initial condition experiment shows no differences (purple line constant at 1) and demonstrates that the model converged to a quasi-steady-state solution after the 28 annual cycles. A reduction in bottom temperature to −0.2 ∘C leads to an increase in the mean velocity of 50 % and a decrease in seasonal amplitude by a factor 0.2 leads to an increase in the mean velocity of 20 % (Fig. 5). Increasing the thermal diffusivity leads to only very slightly increased mean velocity values (less then 1 %). The modelled flow is more sensitive to the varying geometrical and physical parameters (thickness, slope and volumetric ice content; right panel in Fig. 5) than to the previous parameters. The velocities strongly vary with thickness and slope, in accordance with the governing equations (Eqs. 2 and 6), following a power law with variations of almost 400 % and 600 % respectively. When varying volumetric ice content the mean velocities show variations of up to 70 % for the used parameter range (see Sect. 3.3).
In Fig. 6, the velocities of the different sensitivity experiments normalised with their mean are presented and a summary is given in Table 3. The seasonal velocity response to different amplitudes in surface winter temperature forcing is small and stays below 7 %, even for an 80 % increase in the temperature amplitude. The sensitivities of the velocity variations to varying bottom temperature are slightly higher, but remain below 9 % in the given range. For the thickness experiment, a velocity variation of up to 80 % is obtained when considering a 4 m thick rock glacier, representing an extreme and unrealistic scenario. For a more realistic lower bound of rock glacier thickness of 16 m, the seasonal velocity variations stay below 10 %. For thickness variations with the pseudo-plastic creep relation the sensitivity is even smaller. Variations in volumetric ice content and thermal diffusivity lead to slightly increased seasonal velocity variabilities of 12 % and 16 %, respectively. Thus in general, within a reasonable range of input parameters, the modelled seasonal variations in surface velocity remain more than 1 order of magnitude below the observed seasonal variations.
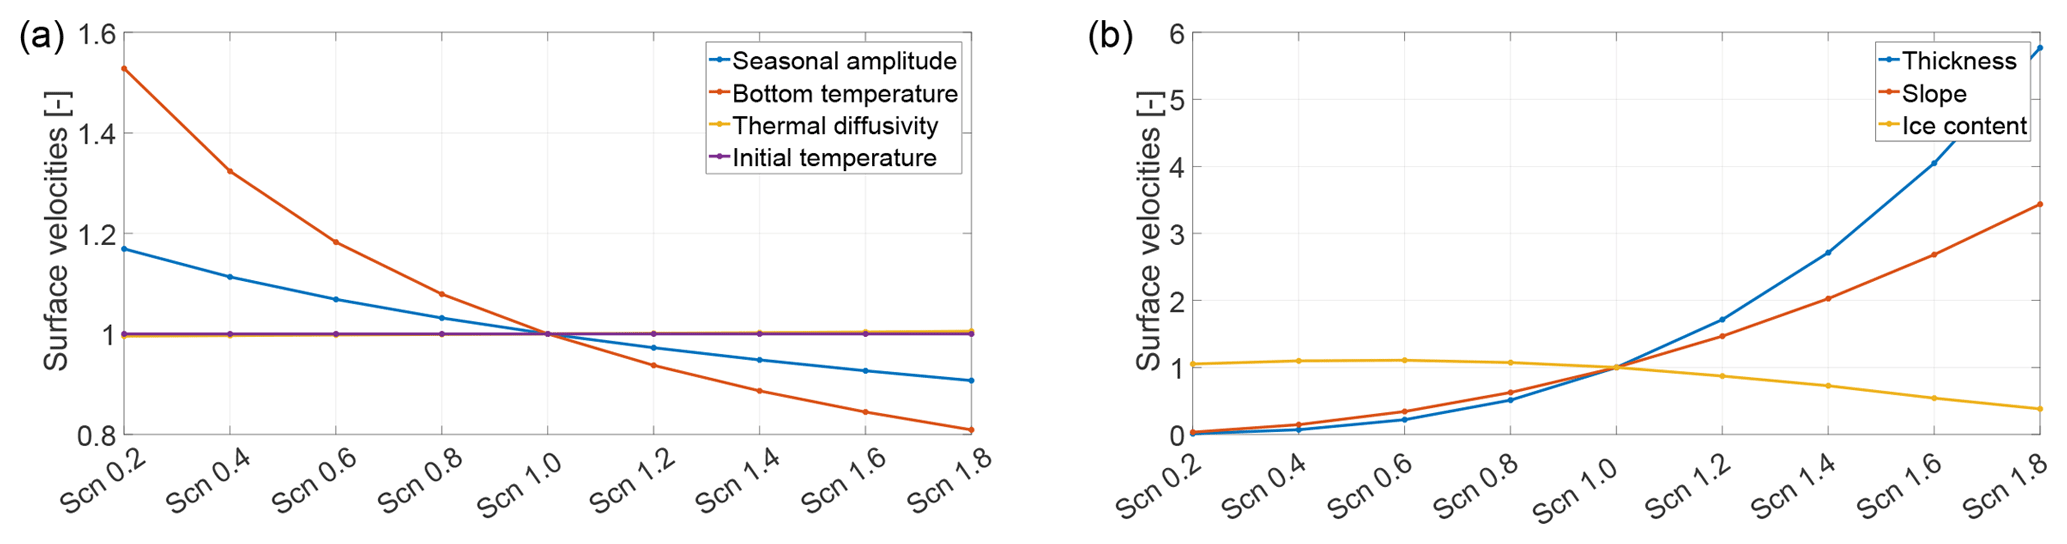
Figure 5Plots of the time-averaged values of surface velocities for the sensitivity experiments with the different parameter scenarios. The mean velocities are normalised with the mean values of the reference scenario Scn1.0. Panel (a) shows the results for varying surface temperature-forcing amplitudes (blue line), bottom temperature values (red line), thermal diffusivity parameters (yellow line) and initial condition temperature values (purple line). The yellow line is hidden behind the purple line. Panel (b) shows the results for varying thicknesses (blue line), slope angles (red line) and volumetric ice content values (yellow line).
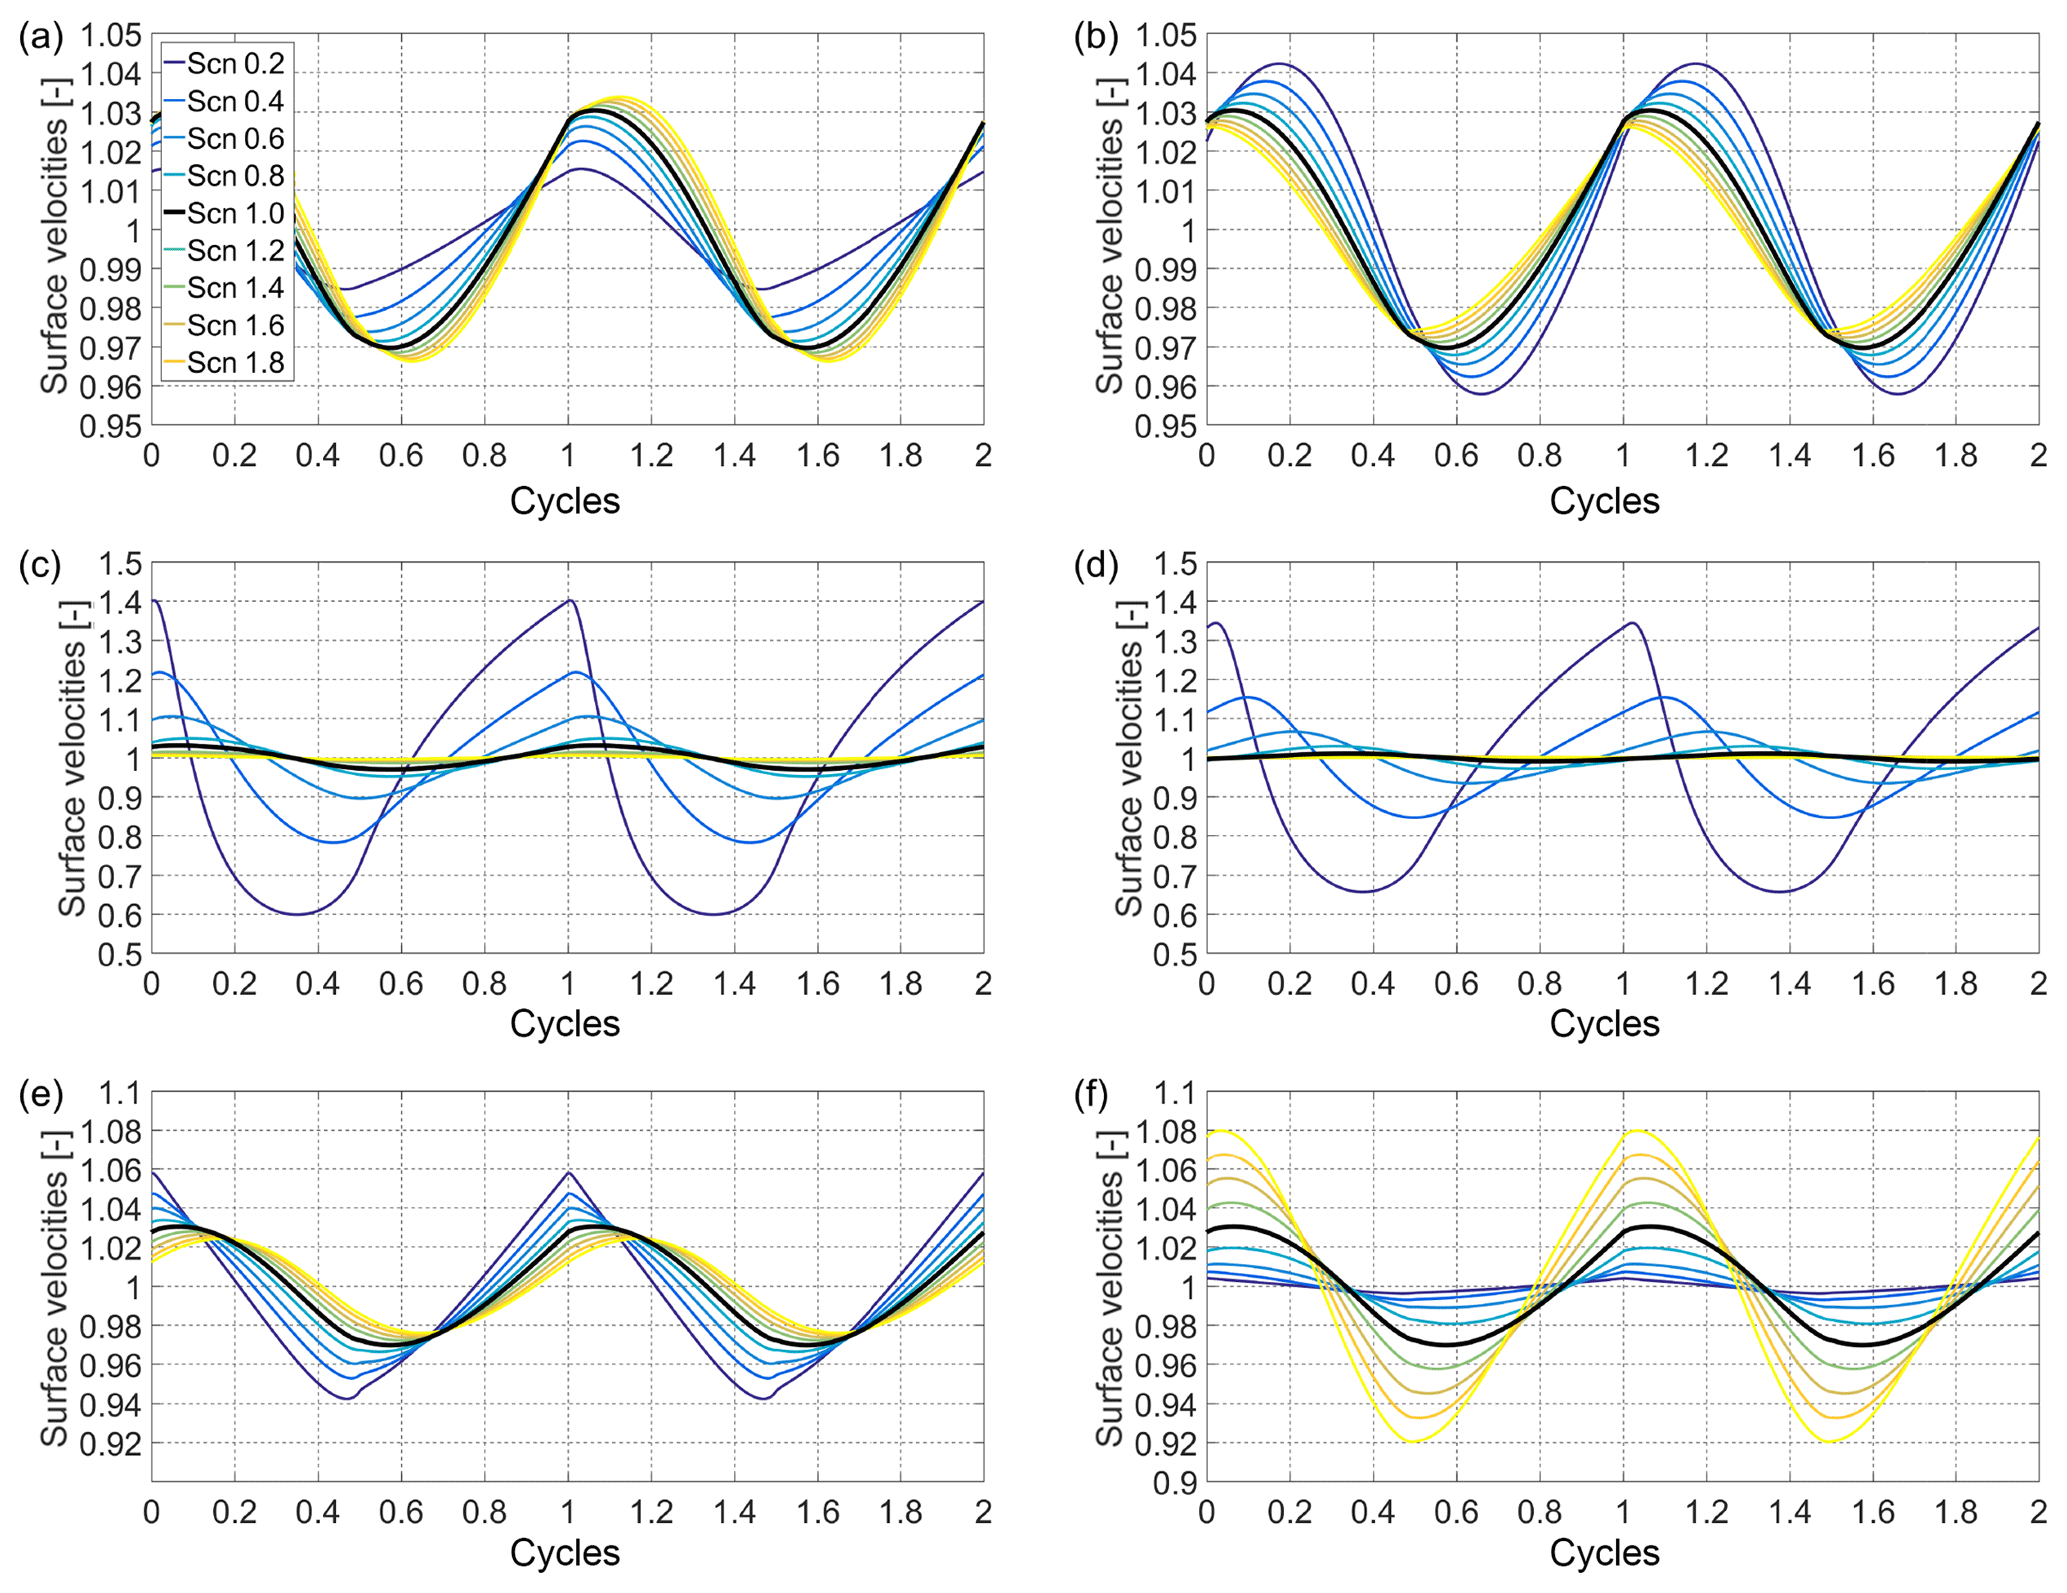
Figure 6Results of the modelling sensitivity experiments of the model to (a) seasonal amplitude (winter minimum temperature), (b) bottom temperature, (c) thickness, (d) thickness with shear horizon, (e) volumetric ice content and (f) thermal diffusivity. The surface velocities normalised with their mean are plotted for each experiment with time, given here as the number of cycles (after the 28th cycle). One cycle corresponds to 1 year. For all experiments the different scenarios are colour coded as illustrated in the legend of panel (a); the reference scenario is plotted with a thicker solid black line.
In this study, we developed a simple numerical model approach to investigate the dynamical behaviour of rock glaciers with the aim of resolving the influence of external temperature forcing through heat conduction on rock glacier surface velocities. When choosing volumetric ice contents within a physical range of values proposed in the literature (see Sects. 2 and 3.3), for all the case studies the correct order of magnitude of measured mean surface velocities is obtained. However, interannual and seasonal variations are strongly underestimated for all four cases, being at least 1 order of magnitude smaller than the observed ones.
5.1 Temperature modelling
We model rock glacier temperature evolution based on near-surface temperatures as measured below the active layer (see Sect. 3.2). In some cases, data gaps are present and linear interpolation of the data is used. The data gaps are short (below a few months) and are expected to not affect the overall modelling, but interpretation of the modelled velocities for these periods has to consider this limitation.
The assumption of constant bottom temperature agrees well with the observed borehole temperatures. This is further supported by the good agreement between the modelled velocities from prescribed observed and modelled temperatures. We assume the physical properties of the rock glacier (density, ice content and thermal diffusivity) to be constant in time and homogeneous in space, which seems justified at the considered short (seasonal to multi-annual) timescales and is supported by the good performance of the temperature evolution model.
For Schafberg (Fig. 2c) and Muragl (Fig. 2d) rock glaciers, we can reproduce the observed temperature fields very well. For Ritigraben and Murtèl (Fig. 2b and 2d) our results show some disagreement with seasonal pattern, in particular at 12–15 m depth. At Ritigraben, this disagreement can be explained by the influence of a talik caused by air and water advection (Luethi et al., 2017), which refers to processes that are not included in our modelling. For Murtèl, the cause of the discrepancy between modelled and observed temperatures is currently not clear. A possible explanation of this effect could be related to advective water fluxes or varying thermal conductivity within the rock glacier body, likely linked to the variable unfrozen water content at temperatures close to zero degree (Arenson et al., 2010). However, the results of our modelling for the four study cases, in combination with the available borehole temperature observations, allow us to confidently model and analyse rock glacier velocities.
5.2 Ice-creep modelling
Using the modelled and observed temperature fields respectively, we force the empirical creep relation for rock glacier material. Additionally, we run a separate experiment with the pseudo-plastic rheology to investigate the impact on the model from including enhanced deformation within the shear horizon.
5.2.1 Absolute velocities
When applying the creep rheology of Arenson and Springman (2005a) and using acceptable and uniform values of the model input parameters, we obtain the correct order of magnitude of the average observed surface velocities for all case studies.
For Murtèl, the mean surface velocities (averaged over the whole time series) match the observations. For Ritigraben and Muragl the modelled average velocities are between 30 % and 40 % of the observed ones. This result is consistent with the observed borehole deformation contribution from above the shear horizon, accounting for 10 % to 30 % of the total deformation (Arenson et al., 2002). This finding suggests that the rheology proposed by Arenson and Springman (2005a) may not be applicable to describe the rheology of the shear horizon of a rock glacier. On the contrary, for Schafberg the modelled velocities overestimate the observations. This mismatch can likely be explained by using an input thickness that is too high, resulting from the distance between the DGPS and borehole locations. The rock glacier thickness at the location of the observed velocities by DGPS is not known and the used thickness was taken from the borehole on the lobe further down which is less steep. The observed flow magnitude can be matched almost perfectly when using a thickness of 17 m, which was observed in a nearby borehole at the same field site (Arenson et al., 2002) and which can be expected for a steeper surface.
5.2.2 Seasonal and multi-annual variations
For all rock glaciers, we find that both seasonal and in particular interannual variations are strongly underestimated. This result is also coherent when considering relative velocity variations (see Fig. 4). In particular, the results for Murtèl and Schafberg rock glacier show very small seasonal variations of 3 % to 4 %. This result is not due to an underestimation in the seasonal temperature variations, as confirmed by the comparison between modelled and measured temperatures and further corroborated by the results of our modelling constrained with the observed temperatures. In fact, the latter forcing indirectly takes into account all non-conductive processes governing the temperature field. The lower sensitivities of rock glacier Murtèl and Schafberg compared to the other two can be explained by their greater thicknesses. For thicker rock glaciers, temperature variations at the surface reach shallower depth in relative terms and hence do not affect the near-bottom layers where most of the deformation occurs. For the thinner Muragl and Ritigraben glaciers, the modelled seasonal variations of 5% and 8% are substantially higher, but are still a factor 3 to 5 below the observations.
In general, our modelled seasonal variations for the four rock glaciers as well as for the sensitivity experiments are consistent with the obtained 3 % to 11 % by the earlier idealised modelling study of Kääb et al. (2007). The greater variations for Ritigraben and Muragl are likely a result of the higher temperature sensitivity of the rheology by Arenson and Springman (2005a) compared to the rheology based on Glen used in Kääb et al. (2007) for the case of warm permafrost (Müller et al., 2016).
Consistent with the results for similar thicknesses of Kääb et al. (2007), we also find that including a shear horizon in the modelling (by using the pseudo-plastic rheology) decreases the sensitivity of the seasonal variations in flow to temperature forcing. This result further corroborates the underestimation of seasonal and interannual variations in our modelling compared to the observations. It is unlikely that this underestimation is a result of an insufficient sensitivity of the used rheology of Arenson and Springman (2005a) to temperature. In fact, this rheology is based on laboratory deformation experiments on core material from real rock glaciers. Unfrozen water is known to have a significant influence on frozen soils creep (Arenson et al., 2006; Moore, 2014). The influence of interstitial water on creep is partially implicitly taken into account in the adopted empirical creep relation through the dependency on temperature; however, the impact on the stress regime due to pore pressure is not taken into account in the adopted rheology. Further, the discrepancy in the phase shift between modelled and observed velocity variations would not improve for a more temperature-sensitive rheology.
5.2.3 Phase shift
A phase lag of about 2–3 months between the seasonal summer peak in the observed ground surface temperatures and measured surface velocity has been detected on several rock glaciers including Ritigraben, Schafberg and Muragl (see Fig. 7) and has partly been attributed to the time it takes for the seasonal temperature signal to propagate into the rock glacier (Kääb et al., 2007; Delaloye et al., 2010; Wirz et al., 2016b). In our modelling this delay is however almost doubled, with the seasonal peak in velocity obtained in early January rather than early October. For the pseudo-plastic rheology this delay is further extended by several months.
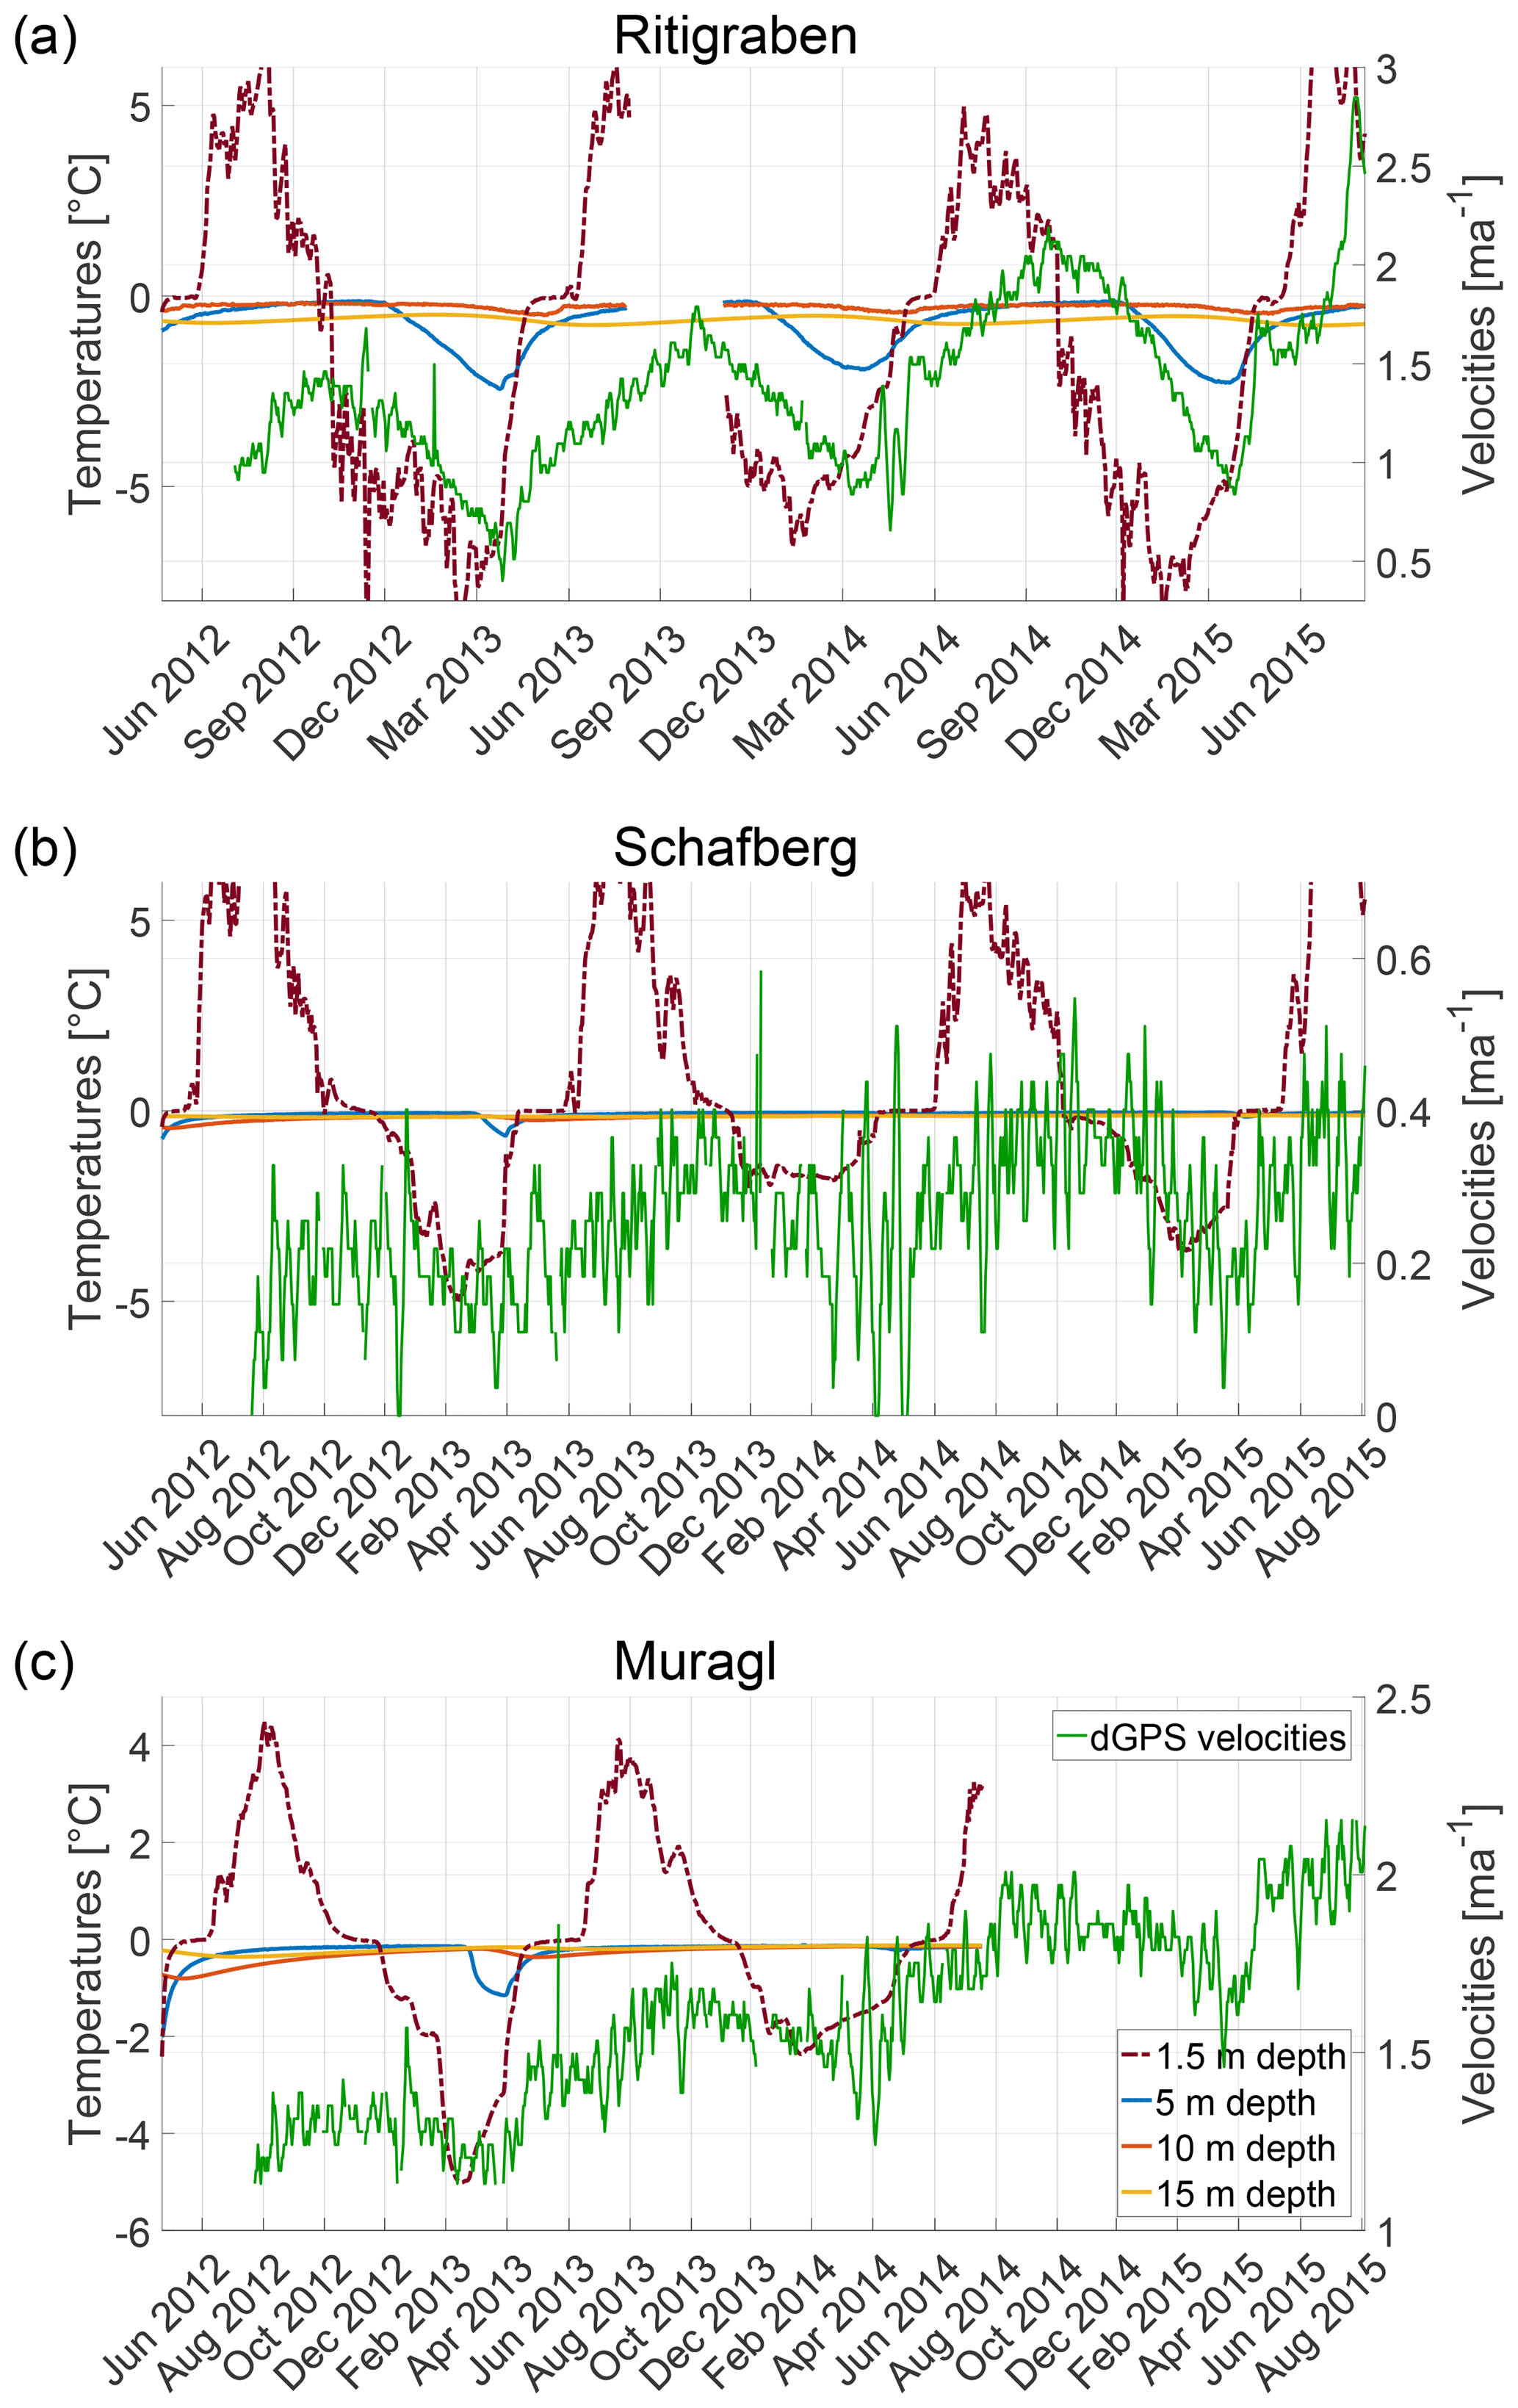
Figure 7Temperature and velocity time series in the (a) Ritigraben, (b) Schafberg and (c) Muragl rock glaciers. The left y axis shows the temperatures (borehole measurements if available, model results otherwise) at 1.5 m (within the active layer), 5, 10 and 15 m depth. The right y axis with the green line shows the surface velocities from DGPS measurements.
In contrast, the seasonal winter minima in measured temperatures below the active layer (used as model input forcing) only have a lag of 2 months from the surface temperatures and seem in phase with the observed velocity minima (Fig. 7). Due to the zero curtain effect there is no clear summer peak in the observed and prescribed near-surface temperatures (Fig. 7) and the quantification of the summer peak phase shift is therefore ambiguous.
Despite the highly asymmetric seasonal temperature pattern, the resulting modelled surface flow variations are almost symmetric (Fig. 4), which is further supported by the sensitivity experiments using a capped sinusoidal forcing function pattern (Fig. 6). This transformation of the seasonal pattern is, on the one hand, a result of the diffusion of the temperature signal and, on the other hand, a result of an integrated contribution of deformation over the entire depth. The seasonal pattern in surface velocity variation is therefore neither a direct reflection of the temperature signal at a single depth nor of the depth-averaged temperature signal. In consequence, estimating the phase lag between seasonal variations in surface temperature and surface flow from heat conduction is non-trivial and interpreting phase lags is potentially misleading.
The clear overestimation of the time lag in the modelled surface variations is a further sign that the process of heat conduction alone cannot explain the observed variations in deformation. Infiltration of surface meltwater into the permafrost in the summer season could reduce this time lag and through advection of water affect the flow in two ways. Firstly, the infiltrating water can effectively advect heat and warm up the rock glacier body at depth as observed in the case of Ritigraben, which in our modelling removed the phase lag when using the observed temperature field that includes the talik formation in summer. For the other three rock glaciers, water infiltration may also occur but it does not seem to significantly warm the temperatures at depth, as confirmed by the good agreement between observed and modelled temperatures, and we can therefore exclude this heat advection process. Secondly, with increasing water infiltration the water content and pore-water pressure within the rock glacier material are expected to increase which in turn may reduce the shear strength and thereby enhance deformation and flow. This process has been suggested in other studies (Ikeda et al., 2008; Wirz et al., 2016b; Kenner et al., 2017; Buchli et al., 2018) and has also been proposed to explain the short-term velocity peaks with timescales of days that are related to a sudden input of water at the surface, for example during the snowmelt period (Wirz et al., 2016b; Kenner et al., 2017). To what depth such water infiltration occurs is poorly known, but this process would be most effective within the shear horizon, as deformation is highest. Further, in several boreholes, pressurised water was observed when drilling into the shear horizon (Arenson et al., 2002 and Alex Blast, personal communication, November 2015 for Murtél rock glacier, and Buchli et al., 2018 for the Furggwanghorn rock glacier).
Regarding the multi-annual variations, which are well documented and synchronous for many rock glaciers in Switzerland (PERMOS, 2016a), our modelling suggests that the responsible process between the observed acceleration in flow (e.g. from 2011 to 2015) and the observed surface warming cannot be explained by heat conduction into the ground alone. It is likely an indirect effect of enhanced meltwater penetrating into the rock glacier body and thereby affecting its rheology. Phases of slowdown related to conductive cooling in cold or long winters (e.g. 2007 and 2011) are more distinct in our modelled velocities, and thus winter cooling may contribute more substantially to the longer-term slow-down of rock glacier flow (Fig. 4). The enhanced sensitivity to winter temperatures is (in contrast to summer temperatures) not surprising given that the zero curtain effect basically caps the summer temperature peak at 0 degrees and inhibits the propagation of the summer heat into the ground, which is well reflected in the observed temperatures below the active layer (Fig. 4).
Including a shear horizon with a pseudo-plastic rheology (with the same temperature dependency as for the main rock glacier body and enforcing the same mean flow velocity) does not improve our results. On the contrary, interannual and seasonal variations are even more underestimated, because at the shear horizon depth, where the main deformation occurs, the signal of seasonal temperature variations from the surface is too small, being close to one-tenth of a degree (PERMOS, 2016a).
In summary, the strong underestimations in both amplitude in seasonal and multi-annual variations, as well as the overestimation in time lag of seasonal peaks in our modelling, suggest that heat conductive processes alone cannot explain the observed variation in flow velocity, suggesting the need for other processes, such as the interaction of rock glacier rheology with surface water advecting into the rock glacier body.
5.3 Sensitivity experiments
Sensitivity experiments were carried out to explore the influence of different input geometries and parameters on the simulated surface velocity in a systematic way. In their set-up and results, the experiments are an extension of the earlier modelling study by Kääb et al. (2007), but here we use a more realistic model set-up and rheology, and explore a more extensive parameter space.
Absolute mean velocities are strongly affected by variations in geometry due to changing stress conditions (Eq. 6). However, over the timescales considered in this study (seasonal to multi-annual), the geometry of a rock glacier is not expected to change substantially. For the other parameters, mean velocities are most sensitive to the bottom temperature of the rock glacier, which is somewhat representative of the thermal state of the entire rock glacier body. Again, the general thermal state of a rock glacier should not change over the considered timescales. Nevertheless, the considerable warming of a rock glacier would lead to faster flow, as also reflected in the observational data sets presented in Kääb et al. (2007). The insensitivity of the mean velocity to thermal diffusivity reflects the fact that the average thermal state of the rock glacier is not affected by uncertainties in this parameter. For high thermal conductivity values, which would require high water content and hence degrading permafrost conditions, relative seasonal variation of 16 % are modelled, but this remains an order of magnitude below observed seasonal velocity variations.
The model used shows a dependency of the surface velocities on the volumetric ice content value (Figs. 5 and 6). The relative seasonal variations stay below 12 %, even for a reduction to 40 % of the volumetric ice content value. For high values of ice content, the velocity peak considerably shifts in time, with a delay of 2 months (π∕3 of 1-year cycle) in comparison to the reference scenario. Note that the ice content of the rock glacier material is rather static and not expected to change even over timescales of several decades.
Decreasing thicknesses lead to very different absolute mean velocities, but more interestingly, they also lead to stronger seasonal variations. Considering realistic thicknesses of 12, 20, and 28 m, we obtain seasonal velocity variations of 21.2 %, 2 % and 1.6 % respectively. We explain this sensitivity by the variable fraction of the rock glacier thickness that is affected by temperature variations. It implies that thin rock glaciers are more sensitive to the effect of heat conduction for seasonal as well as long-term temperature changes. This means that for thin rock glaciers (which are usually fast moving) heat conduction should be considered in the interpretation of short-term variations. Note that, without any borehole deformation data or detailed geophysical investigations, uncertainties in rock glacier thickness may significantly affect modelled velocities (absolute and seasonal variations).
For all other remaining parameters, except the rock glacier thickness, the modelled seasonal velocity variations do not change much and stay again below 8 % to 12 % of their mean flow and phase shifts vary below 2 months, even for extreme and relatively unrealistic end-member parameter values.
By considering the pseudo-plastic relation, the seasonal variations are coherently decreasing for all the scenarios (even for shallow rock glaciers) and the velocity peaks are considerably shifted in time, with a delay of up to 6 months (see Table 3). Thus in summary, we conclude from our sensitivity study that our modelling results for the four rock glaciers above are, apart from thickness, insensitive to uncertainties in our input parameters, and the modelled magnitudes of seasonal variations and related conclusions are robust.
We quantitatively investigated the contribution of heat conduction to seasonal and multi-annual variations in rock glacier flow velocity on the basis of numerical modelling and a multi-year time series of observed surface velocities and borehole temperatures from four different rock glaciers. The numerical model couples heat conduction to an empirically derived rheology of rock glacier creep that accounts for temperature and ice content. We find that, using standard parameters from the literature, our modelling reproduces the correct order of magnitude of mean surface velocities for all chosen rock glaciers. However, the magnitudes of seasonal and multi annual variations are strongly underestimated by our modelling, and the phase-lags of the seasonal peaks are too long. This suggests that the effect of heat conduction on the observed variations in surface flow is very limited and cannot explain more than about 25 % of the observed variations. The exception is extremely thin rock glaciers, as shown during the sensitivity study (see Sect. 4.3), where short-term temperature variations can force heat conduction to affect the whole deforming thickness of the rock glacier, thus leading to more substantial velocity variations.
Additional sensitivity experiments underpin the robustness of these conclusions within expected parameter uncertainties, also when including a shear horizon at the bottom of the rock glacier. Our idealised sensitivity experiments further indicate that, when the temperature changes over the full depth of the rock glacier (changing bottom temperature), the mean deformation maybe affected substantially, but this requires changes in climate over periods of several decades or centuries.
From our quantitative process modelling approach we can therefore exclude heat conduction as the governing process for seasonal to multi-annual variations in rock glacier flow. Considering the phase-lag information of the summer peak (e.g. the case of case of Ritigraben) and indications from earlier qualitative and statistical analysis of rock glacier velocities (Wirz et al., 2016b), we conclude that advection of surface water into the rock glacier and its interaction over pore-water pressure with the creep rheology are required to explain short- to mid-term velocity variations of rock glacier flow. However, further investigations are required for a better understanding of the advection of water within the rock glacier material as well as of the role of water and water pressure on creep rheology.
Data on rock glacier kinematics and temperature are available from the PERMOS office upon request. The reference web link is http://www.permos.ch/data.html (PERMOS, 2016b).
Andreas Vieli is an editor of The Cryosphere.
The work presented in this paper is part of the project X-Sense 2 funded by
Nano-Tera.ch (ref. no. 530659). This work could not have been possible
without the pioneering results obtained from the DGPS pilot project funded
by the Swiss Federal Office for the Environment BAFU. We thank Johann
Müller for the coherent fieldwork in Engadine, and Vanessa Wirz for her
preliminary study on this topic. We further acknowledge the editor, Christian
Hauck, and the referees, Martin Hoelzle and Lukas U. Arenson, for their
constructive and thorough comments, which helped to improve the
manuscript.
Edited by: Christian
Hauck
Reviewed by: Lukas U. Arenson and Martin Hoelzle
Arenson, L., Hoelzle, M., and Springman, S.: Borehole deformation measurements and internal structure of some rock glaciers in Switzerland, Permafrost Periglac., 13, 117–135, https://doi.org/10.1002/ppp.414, 2002. a, b, c, d, e, f, g, h, i, j, k, l, m, n
Arenson, L., Springman, S. M., and Sego, D.: The rheology of frozen soils, Appl. Rheol., 17, 12147-1, https://doi.org/10.3933/ApplRheol-17-12147, 2006. a
Arenson, L. U. and Springman, S. M.: Mathematical descriptions for the behaviour of ice-rich frozen soils at temperatures close to 0 ∘C, Can. Geotech. J., 42, 431–442, https://doi.org/10.1139/t04-109, 2005a. a, b, c, d, e, f, g, h
Arenson, L. U. and Springman, S. M.: Triaxial constant stress and constant strain rate tests on ice-rich permafrost samples, Can. Geotech. J., 42, 412–430, https://doi.org/10.1139/t04-111, 2005b. a, b
Arenson, L. U., Johansen, M. M., and Springman, S. M.: Effects of volumetric ice content and strain rate on shear strength under triaxial conditions for frozen soil samples, Permafrost Periglac., 15, 261–271, https://doi.org/10.1002/ppp.498, 2004. a
Arenson, L. U., Hauck, C., Hilbich, C., Seward, L., Yamamoto, Y., and Springman, S. M.: Sub-surface Heterogeneities in the Murtèl. Corvatsch Rock Glacier, Switzerland, in: Proceedings of the joint 63rd Canadian Geotechnical Conference and the 6th Canadian Permafrost Conference, pp. 1494–1500, Canadian Geotechnical Society, the 6th Canadian Permafrost Conference, Conference Location: Calgary, Canada, Conference Date: 12–16 September 2010, 2010. a, b, c
Barsch, D.: Permafrost creep and rockglaciers, Permafrost Periglac., 3, 175–188, https://doi.org/10.1002/ppp.3430030303, 1992. a
Barsch, D. and Hell, G.: Photogrammetrische Bewegungsmessungen am Blockgletscher Murtel I, Oberengadin, Schweizer Alpen, Zeitschrift für Gletscherkunde und Glazialgeologie, 11, 111–142, 1975. a
Berthling, I., Etzelmüller, B., Eiken, T., and Sollid, J. L.: Rock glaciers on Prins Karls Forland, Svalbard. I: internal structure, flow velocity and morphology, Permafrost Periglac., 9, 135–145, https://doi.org/10.1002/(SICI)1099-1530(199804/06)9:2<135::AID-PPP284>3.0.CO;2-R, 1998. a
Buchli, B., Sutton, F., and Beutel, J.: GPS-Equipped Wireless Senson Network Node for High-Accuracy Positioning Applications, Wireless Sensor Network, 179–195, 2012. a
Buchli, T., Kos, A., Limpach, P., Merz, K., Zhou, X., and Springman, S. M.: Kinematic investigations on the Furggwanghorn Rock Glacier, Switzerland, Permafrost Periglac., 29, 3–20, 2018. a, b, c, d, e
Chaix, A.: Les coulées de blocs du Park National suisse d'Engadine, Le Globe, 62, 1–35, 1923. a
Delaloye, R., Lambiel, C., and Gärtner-Roer, I.: Overview of rock glacier kinematics research in the Swiss Alps, Geogr. Helv., 65, 135–145, https://doi.org/10.5194/gh-65-135-2010, 2010. a, b, c
Duval, P., Ashby, M. F., and Anderman, I.: Rate-controlling processes in the creep of polycrystalline ice, J. Phys. Chem., 87, 4066–4074, 1983. a
Federal Office of Topography swisstopo: https://map.geo.admin.ch/, last access: 20 August 2018. a
Francou, B. and Reynaud, L.: 10 year surficial velocities on a rock glacier (Laurichard, French Alps), Permafrost Periglac., 3, 209–213, 1992. a
Frehner, M., Ling, A. H. M., and Gärtner-Roer, I.: Furrow-and-Ridge Morphology on Rockglaciers Explained by Gravity-Driven Buckle Folding: A Case Study From the Murtèl Rockglacier (Switzerland), Permafrost Periglac., 26, 57–66, https://doi.org/10.1002/ppp.1831, pPP-14-0032.R2, 2015. a, b
Glen, J.: The creep of polycrystalline ice, Proceedings of the Royal Society of London A: Mathematical, Physical and Engineering Sciences, 228, 519–538, https://doi.org/10.1098/rspa.1955.0066, 1955. a
Haeberli, W.: Creep of mountain permafrost, Mitteilungen der Versuchsanstalt für Wasserbau, Hydrologie und Glaziologie der ETH Zürich, vol. 77, 1985. a
Haeberli, W., Hunder, J., Keusen, H.-R., Pika, J., and Röthlisberger, H.: Core drilling through rock-glacier permafrost, Fifth International Conference on Permafrost, Trondheim, 2, 937–942, 1988. a, b
Haeberli, W., Hoelzle, M., Kääb, A., Keller, F., Vonder Mühll, D., and Wagner, S.: Ten years after drilling through the permafrost of the active rock glacier Murtél, Seventh International Conference on Permafrost, Yellowknife, 403–410, 1998. a, b, c, d
Haeberli, W., Hallet, B., Arenson, L., Elconin, R., Humlum, O., Kääb, A., Kaufmann, V., Ladanyi, B., Matsuoka, N., Springman, S., and Vonder Mühll, D.: Permafrost Creep and Rock Glacier Dynamics, Permafrost Periglac., 17, 189–214, 2006. a
Hanson, S. and Hoelzle, M.: The thermal regime of the active layer at the Murtèl rock glacier based on data from 2002, Permafrost Periglac., 15, 273–282, 2004. a
Hoelzle, M., Wagner, S., Kääb, A., and Vonder Mühll, D.: Surface movement and internal deformation of ice-rock mixtures within rock glaciers in the Upper Engadin, Switzerland, Proceedings of the 7th International Conference on Permafrost, 465–471, 1998. a, b
Ikeda, A., Matsuoka, N., and Kääb, A.: Fast deformation of perennially frozen debris in a warm rock glacier in the Swiss Alps: An effect of liquid water, J. Geophys. Res.-Earth, 113, f01021, https://doi.org/10.1029/2007JF000859, 2008. a, b
Johnson, P. G.: Rock glacier types and their drainage systems, Grizzly Creek, Yukon Territory, Can. J. Earth Sci., 15, 1496–1507, https://doi.org/10.1139/e78-155, 1978. a
Kääb, A. and Weber, M.: Development of transverse ridges on rock glaciers: Field measurements and laboratory experiments, Permafrost Periglac., 15, 379–391, https://doi.org/10.1002/ppp.506, 2004. a
Kääb, A., Gudmundsson, G., and Hoelzle, M.: Surface deformation of creeping mountain permafrost. Photogrammetric investigations on rock glacier Murtél, Swiss Alps, Proceedings of the 7th International Conference on Permafrost, 57, 531–537, 1998. a
Kääb, A., Frauenfelder, R., and Roer, I.: On the response of rockglacier creep to surface temperature increase, Global Planet. Change, 56, 172–187, https://doi.org/10.1016/j.gloplacha.2006.07.005, 2007. a, b, c, d, e, f, g, h, i, j
Kenner, R., Phillips, M., Beutel, J., Hiller, M., Limpach, P., Pointner, E., and Volken, M.: Factors Controlling Velocity Variations at Short-Term, Seasonal and Multiyear Time Scales, Ritigraben Rock Glacier, Western Swiss Alps, Permafrost Periglac., 28, 675–684, https://doi.org/10.1002/ppp.1953, pPP-16-0044.R2, 2017. a, b, c, d
Krainer, K. and He, X.: Flow velocities of active rock glaciers in the Austrian Alps, Geogr. Ann. A, 88, 267–280, https://doi.org/10.1111/j.0435-3676.2006.00300.x, 2006. a, b
Loewenherz, S. D., Lawrence, C. J., and Weaver, R. L.: On the Development of Transverse Ridges on Rock Glaciers, J. Glaciol., 35, 383–391, https://doi.org/10.1017/S002214300000931X, 1989. a
Luethi, R., Phillips, M., and Lehning, M.: Estimating Non-Conductive Heat Flow Leading to Intra-Permafrost Talik Formation at the Ritigraben Rock Glacier (Western Swiss Alps), Permafrost Periglac., 28, 183–194, https://doi.org/10.1002/ppp.1911, 2017. a, b, c, d, e
Lugon, R. and Stoffel, M.: Rock-glacier dynamics and magnitude–frequency relations of debris flows in a high-elevation watershed: Ritigraben, Swiss Alps, Global Planet. Change, 73, 202–210, https://doi.org/10.1016/j.gloplacha.2010.06.004, 2010. a, b, c, d, e
MATLAB: version 9.1.0 (R2016b), The MathWorks Inc., Natick, Massachusetts, 2016. a
Maurer, H. and Hauck, C.: Geophysical imaging of alpine rock glaciers, J. Glaciol., 53, 110–120, https://doi.org/10.3189/172756507781833893, 2007. a
Mellor, M. and Testa, R.: Effect of Temperature on the Creep of Ice, J. Glaciol., 8, 131–145, https://doi.org/10.3189/S0022143000020803, 1969. a
Moore, P. L.: Deformation of debris-ice mixtures, Rev. Geophys., 52, 435–467, https://doi.org/10.1002/2014RG000453, 2014. a
Müller, J., Gärtner-Roer, I., Kenner, R., Thee, P., and Morche, D.: Sediment storage and transfer on a periglacial mountain slope (Corvatsch, Switzerland), Geomorphology, 218, 35–44, https://doi.org/10.1016/j.geomorph.2013.12.002, 2014. a
Müller, J., Vieli, A., and Gärtner-Roer, I.: Rock glaciers on the run – understanding rock glacier landform evolution and recent changes from numerical flow modeling, The Cryosphere, 10, 2865–2886, https://doi.org/10.5194/tc-10-2865-2016, 2016. a, b
Nye, J. F.: The Mechanics of Glacier Flow, J. Glaciol., 2, 82–93, https://doi.org/10.3189/S0022143000033967, 1952. a
PERMOS: Permafrost in Switzerland 2010/2011 to 2013/2014, edited by: Noetzli, J., Luethi, R., and Staub, B., the Cryospheric Commission of the Swiss Academy of Sciences, Glaciological Report (Permafrost) No. 12–15, 85 pp., 2016a. a, b, c, d, e, f, g, h, i, j, k, l
PERMOS: PERMOS Database, Swiss Permafrost Monitoring Network, Fribourg, Switzerland, https://doi.org/10.13093/permos-2016-01, 2016b. a
Pruessner, L., Phillips, M., Farinotti, D., Hoelzle, M., and Lehning, M.: Near-surface ventilation as a key for modeling the thermal regime of coarse blocky rock glaciers, Permafrost Periglac., 29, 152–163, https://doi.org/10.1002/ppp.1978, 2018. a
Roer, I., Kääb, A., and Dikau, R.: Rockglacier acceleration in the Turtmann valley (Swiss Alps): Probable controls, Norsk Geogr. Tidsskr., 59, 157–163, https://doi.org/10.1080/00291950510020655, 2005. a
Scherler, M., Schneider, S., Hoelzle, M., and Hauck, C.: A two-sided approach to estimate heat transfer processes within the active layer of the Murtèl-Corvatsch rock glacier, Earth Surf. Dynam., 2, 141–154, https://doi.org/10.5194/esurf-2-141-2014, 2014. a
Staub, B., Hasler, A., Noetzli, J., and Delaloye, R.: Gap-Filling Algorithm for Ground Surface Temperature Data Measured in Permafrost and Periglacial Environments, Permafrost Periglac., 28, 275–285, https://doi.org/10.1002/ppp.1913, 2017. a
Vonder Mühll, D.: Geophysikalische Untersuchungen im Permafrost des Oberengadins, Mitteilungen der Versuchsanstalt für Wasserbau, Hydrologie und Glaziologie an der Eidgenössischen Technischen Hochschule Zürich, Versuchsanstalt für Wasserbau Hydrologie und Glaziologie der Eidgenössischen Technischen Hochschule Zürich, 1993. a, b, c, d
Vonder Mühll, D. and Schmid, W.: Geophysical and photogrammetrical investigations of rock glacier Muragl I, Engadin, Swiss Alps, in: Ed. 6th International Conference on Permafrost Proceedings, pp. 654–659, South China University Technology Press, Ed. 6th International Conference on Permafrost, 1993. a
Vonder Mühll, D., Arenson, L., and Springman, S.: Temperature conditions in two Alpine rock glaciers, Eight International Conference on Permafrost, pp. 1195–1200, 2003. a, b, c, d
Von Mises, R.: Mechanics of solid bodies in the plastically-deformable state, Nachrichten von der Gesellschaft der Wissenschaften zu Göttingen, Mathematisch-Physikalische Klasse, 1913. a
Wahrhaftig, C. and Cox, A.: Rock Glaciers in the Alaska Range, GSA Bulletin, 70, 383, 1959. a
Williams, P. J. and Smith, M. W.: The Frozen Earth: Fundamentals of Geocryology, Studies in Polar Research, Cambridge University Press, https://doi.org/10.1017/CBO9780511564437, 1989. a, b
Wirz, V., Geertsema, M., Gruber, S., and Purves, R. S.: Temporal variability of diverse mountain permafrost slope movements derived from multi-year daily GPS data, Mattertal, Switzerland, Landslides, 13, 67–83, https://doi.org/10.1007/s10346-014-0544-3, 2016a. a
Wirz, V., Gruber, S., Purves, R. S., Beutel, J., Gärtner-Roer, I., Gubler, S., and Vieli, A.: Short-term velocity variations at three rock glaciers and their relationship with meteorological conditions, Earth Surf. Dynam., 4, 103–123, https://doi.org/10.5194/esurf-4-103-2016, 2016b. a, b, c, d, e, f
Zenklusen Mutter, E. and Phillips, M.: Thermal Evidence of Recent Talik Formation in Ritigraben Rock Glacier, Swiss Alps, 479–483, 2012. a, b