the Creative Commons Attribution 4.0 License.
the Creative Commons Attribution 4.0 License.
 | 07 Mar 2019
Increased Greenland melt triggered by large-scale, year-round cyclonic moisture intrusions
Fiammetta Straneo
Marco Tedesco
Surface melting is a major driver of Greenland's mass loss. Yet, the mechanisms that trigger melt are still insufficiently understood because seasonally based studies blend processes initiating melt with positive feedbacks. Here, we focus on the triggers of melt by examining the synoptic atmospheric conditions associated with 313 rapid melt increases, detected in a satellite-derived melt extent product, equally distributed throughout the year over the period 1979–2012. By combining reanalysis and weather station data, we show that melt is initiated by a cyclone-driven, southerly flow of warm, moist air, which gives rise to large-scale precipitation. A decomposition of the synoptic atmospheric variability over Greenland suggests that the identified, melt-triggering weather pattern accounts for ∼40 % of the net precipitation, but increases in the frequency, duration and areal extent of the initiated melting have shifted the line between mass gain and mass loss as more melt and rainwater run off or accumulate in the snowpack. Using a regional climate model, we estimate that the initiated melting more than doubled over the investigated period, amounting to ∼28 % of the overall surface melt and revealing that, despite the involved mass gain, year-round precipitation events are participating in the ice sheet's decline.
- Article
(7371 KB) - Full-text XML
-
Supplement
(897 KB) - BibTeX
- EndNote


Between 1992 and 2011, Greenland's mass loss accounted for 7.5±1.8 mm of global mean sea level rise (Shepherd et al., 2012; Hanna et al., 2013b) and GRACE satellite gravity estimates from 2003 to 2017 indicate that the mass loss is currently occurring at a rate of ∼270 Gt yr−1 (Sasgen et al., 2012; Velicogna et al., 2014; Tedesco et al., 2017). The mass loss is attributed to both an acceleration of outlet glaciers (Rignot and Kanagaratnam, 2006; Howat et al., 2007) and enhanced surface melting (van den Broeke et al., 2009; Hanna et al., 2011), the surface melt component being the dominant driver in recent years (Enderlin et al., 2014; Andersen et al., 2015). Given Greenland's large contribution to current (van den Broeke et al., 2016) and expected future sea level rise (Cuffey and Marshall, 2000) and the potential implications of freshwater discharge in the surrounding oceans (Böning et al., 2016), it is critical to understand the underlying causes of the mass loss and its forcing.
To a large extent, studies investigating changes in surface melt have focused on summer melting and the associated interannual variability (Overland et al., 2012; Fettweis et al., 2013; Hanna et al., 2013a, 2014, 2016), pointing to linkages between enhanced melting and high-pressure anomalies centered on Greenland (Overland et al., 2012; Fettweis et al., 2013; Hanna et al., 2013a, 2016) that advect warm air over the western flank of the ice sheet and can lead to the formation of a heat dome (Hanna et al., 2014). The temporally averaged nature of summer-long analyses might not allow the mechanisms that trigger melting to be properly identified, because causes and effects are merged, hence limiting our ability to identify the relative contribution of positive feedbacks such as those due to the surface albedo (Serreze and Barry, 2011; Box et al., 2012).
Here, we focus on the precise mechanisms initiating melt by examining the synoptic atmospheric conditions associated with rapid increases in the areal melt extent from 1979 to 2012, derived from a remote-sensing-based product (Mote, 2007). After characterizing the atmospheric drivers of the identified melt events using meteorological weather station observations and reanalysis data, we consider how they vary in time and analyze the extent to which they have been contributing to the observed melt increase with a regional climate model.
Melting is investigated with a satellite-derived melt extent product from 1979 to 2012 with a 25 km horizontal resolution and a daily temporal resolution (Mote, 2007). To define melt events, we identified the times at which the increase in melt extent, integrated over the full ice sheet, is larger than 2 standard deviations above the mean annual cycle. The mean annual cycle was obtained by averaging over the 34-year-long time series of the daily melt extent changes, and the standard deviation corresponds to the interannual variability at each day. If successive days were identified only the first one counts, as the objective is to examine the triggers of melt. The associated atmospheric conditions are not sensitive to the selected threshold and remain similar if only the eastern or western parts of the ice sheet are considered.
The end of a melt event is defined as the earliest time, after the event, at which the melt extent drops below 1 standard deviation above the mean melt extent during the week before the event, which implies a net increase of the melt extent over the course of an event. To reduce the effect of seasonal variations, the mean annual cycle, 3-week low-pass filtered, is subtracted from the time series beforehand. If higher thresholds are chosen, implying an overall larger melt extent increase, the obtained durations decrease. However, trends in the duration over the investigated period are qualitatively unaffected by the exact threshold as warmer conditions generally lead to longer melt events, irrespective of the absolute magnitude of the durations. Regarding the sensitivity of the durations to the definition, only their variability will be considered.
Atmospheric conditions during melt events are obtained from the reanalysis product ERA-Interim (ERA-I) (Dee et al., 2011), developed by the European Centre for Medium-Range Weather Forecasts, and seven weather stations spread over the southern part of the ice sheet (see Fig. 2c for station locations). These stations stem from several data networks: stations South, East, West and Northwest are operated by the Danish Meteorological Institute (DMI) (Cappelen et al., 2014). Their official station numbers are 04270, 04360, 04250 and 04220, and they all cover the full 34-year period of the melt extent data, with only minor gaps in between. Thus, the composites built with these stations are based on ∼300 melt events.
Stations East, West and South are close to the stations TAS, QAS and NUUK from the Programme for Monitoring of the Greenland Ice Sheet (PROMICE) (van As et al., 2011), which started recording in August 2007. As the DMI stations have a much longer time span, we focus our analysis on them and use only albedo and radiation observations from the PROMICE stations because these parameters are not recorded by the DMI stations. Therefore, the radiation composites are based on ∼70 melt events at stations South and West (each) and at ∼45 events at Station East. Even though the PROMICE stations capture fewer events, the composites built with them are consistent with the atmospheric conditions recorded by the other stations and generally expected from the large-scale flow obtained with the reanalysis.
Stations Summit, Saddle and South Dome (SD) are operated by the Greenland Climate Network (GCNet) (Steffen et al., 1996; Steffen and Box, 2001). Station Summit started recording in 1996 and stations Saddle and SD cover the period since 1997. As Summit is located at ∼3200 m height, SD at ∼2900 m height and Saddle at ∼2460 m, the GCNet stations allow the study of the atmospheric characteristics of melt events at higher elevations. The composites built with these stations are based on ∼150 to ∼200 melt events.
To quantify the influences of the identified events on the net surface mass balance of the ice sheet, the satellite and weather station observations are complemented by the regional climate model MAR (Fettweis et al., 2017), version 3.7, with a horizontal resolution of 7.5 km, forced by ERA-I.
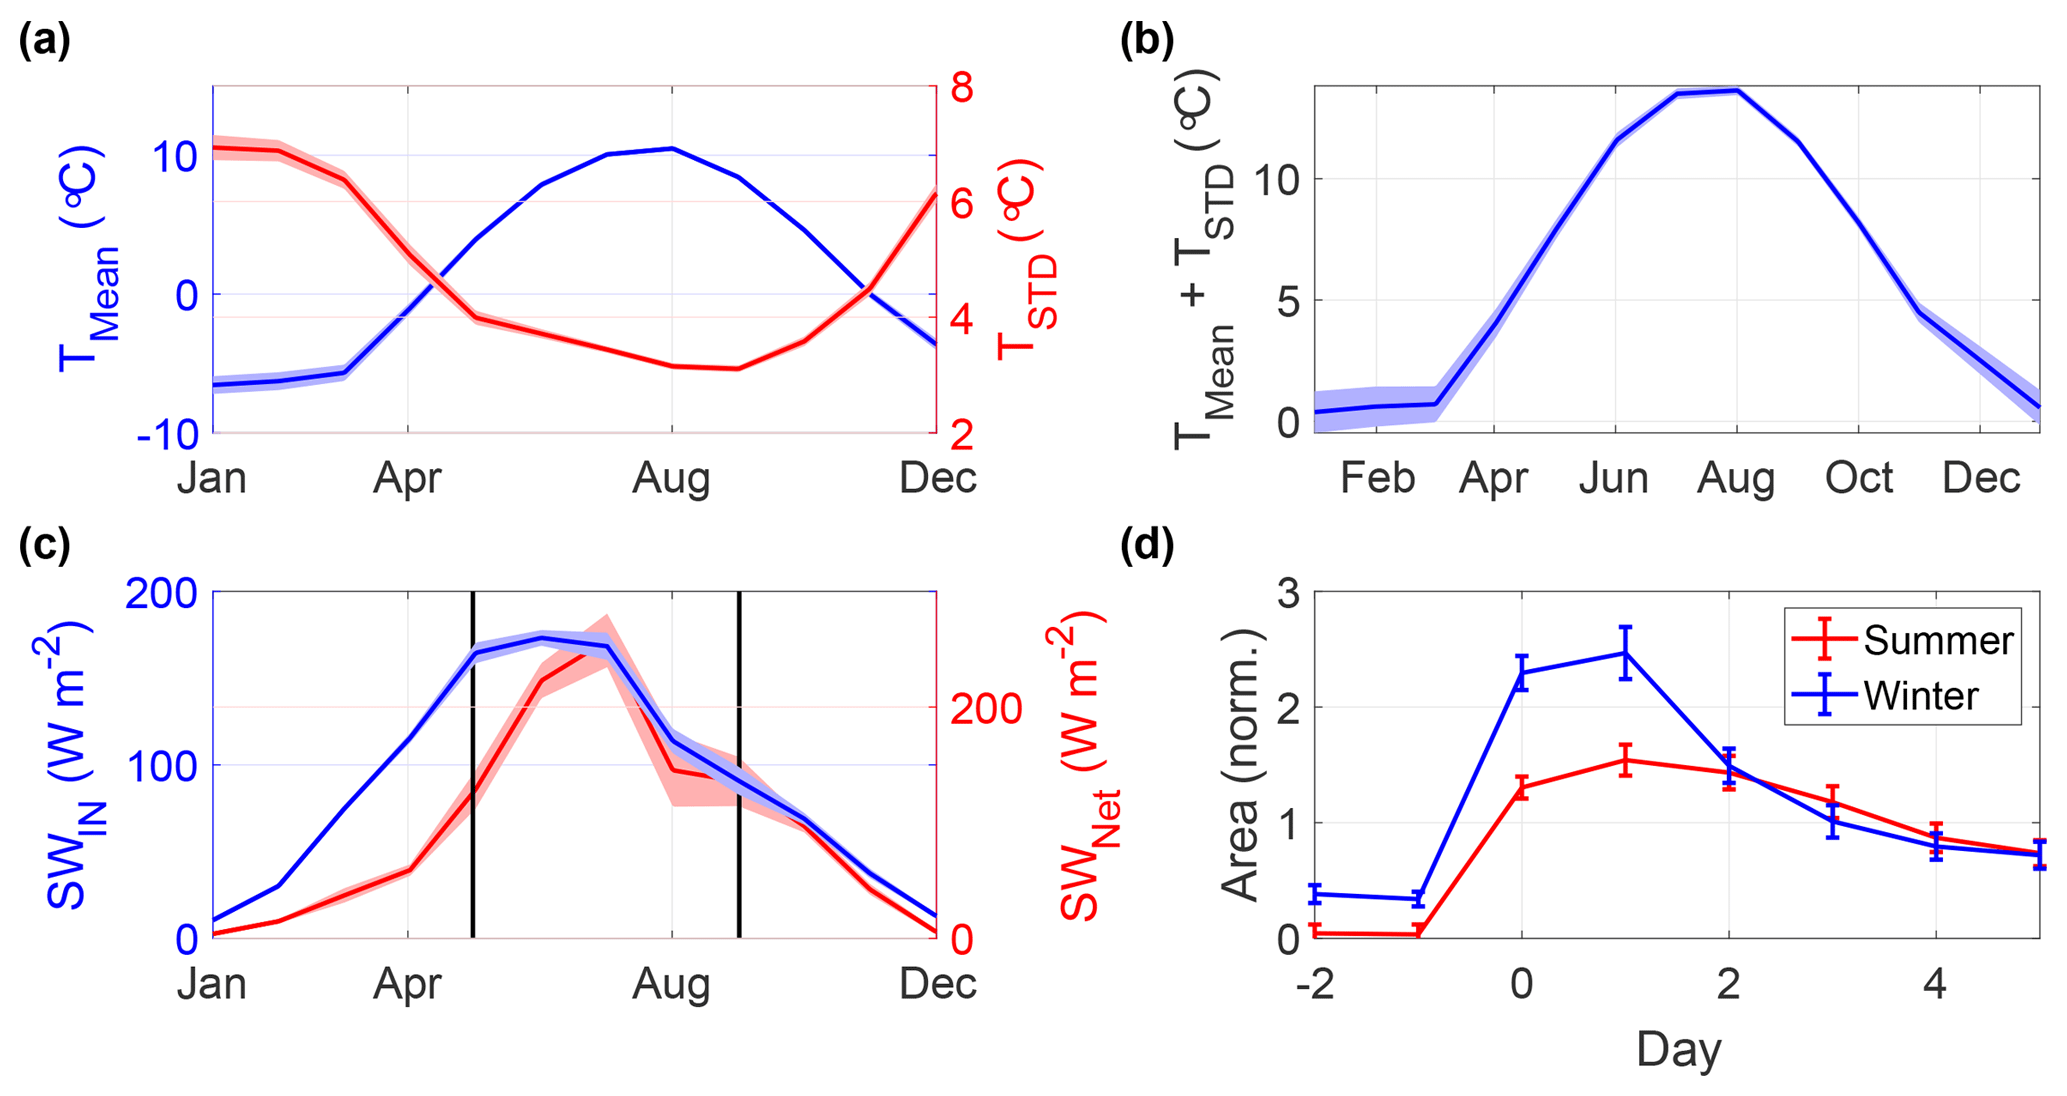
Figure 1(a) Mean annual cycle of the temperature and its submonthly variability at Station South (location shown in Fig. 2c and d), with envelopes representing the standard error of the mean. (b) Sum of the mean annual cycle of the temperature and its submonthly variability at Station South. (c) Mean annual cycle of the incoming and net (incoming minus outgoing) shortwave radiation at Station South. (d) Composite of the melt extent evolution during summer and winter melt events, normalized by the mean annual cycle and standard deviation.
3.1 Characteristics of melt events
Since surface melting is largely driven by the air temperature, we start by examining the temperature variability over Greenland. As expected, the surface air temperature is highest in summer, when the incoming solar radiation peaks (Fig. 1a). Yet, its subseasonal variability, representative of synoptic weather systems, is highest in winter, to the extent that, at times, the temperature rises above freezing (Fig. 1b). To distinguish between the time when shortwave radiation is large and the time when nonradiative fluxes dominate surface melt variability (van den Broeke et al., 2011), we separate the identified melt events into winter events, covering the months from September to April, and summer events, from May to August. Thus, summer is defined as the period in which the climatological mean of the net shortwave radiation over southern Greenland stays above its annual median, while winter corresponds to the period in which it falls beneath (Fig. 1c).
Melt events in winter are characterized by sharp increases in melt extent, whereas melt events in summer are prolonged and the melt extent increase relative to the climatological mean is reduced (Fig. 1d). Melting during winter events mostly occurs near the southern and western coasts and has an average areal extent of ∼1300 km2, while melting during summer events extends further inland and northward and spans on average ∼17 000 km2 (Fig. 2).
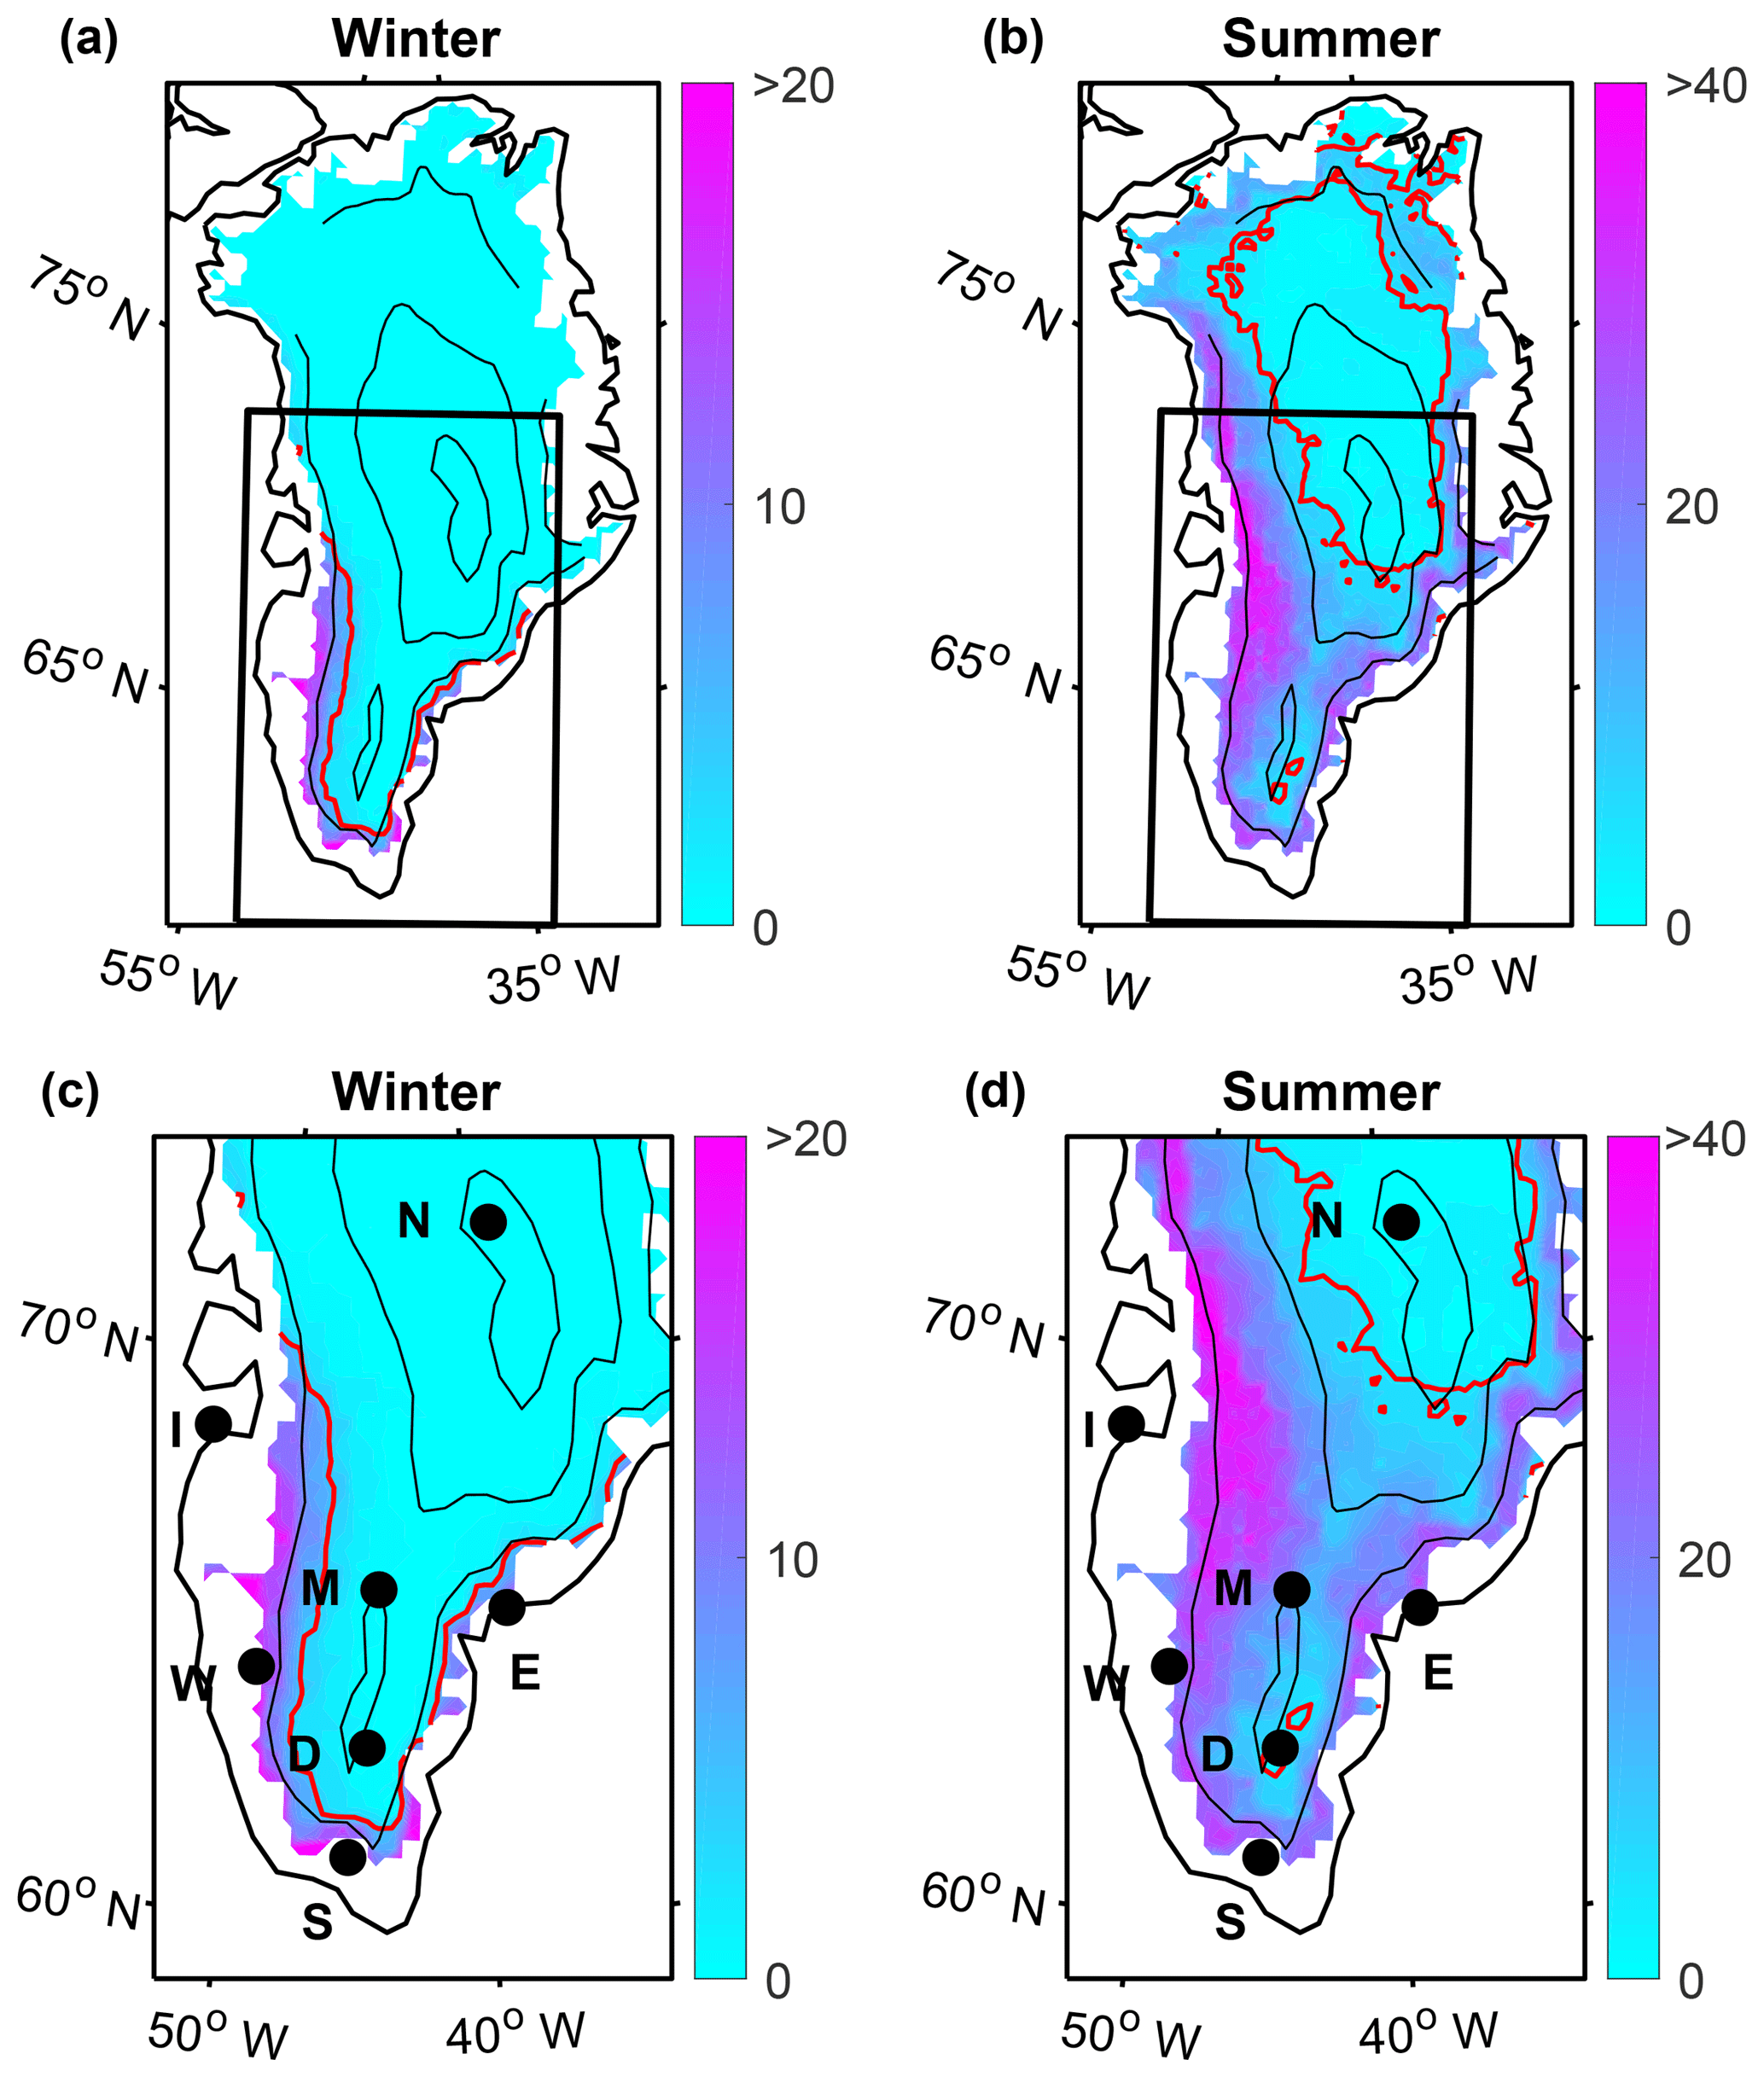
Figure 2(a, b) Percentage of the events with fresh melt on day 1 relative to day −1 (Fig. 1d). Red contours mark the 5 % threshold and black contours delineate the elevation of the ice sheet at 1600, 2600 and 3100 m height. (c, d) Same as in (a, b), focusing on southern Greenland. Black circles indicate the locations of stations Summit (N), NW (I – on a small island), South (S), East (E), West (W), SD (D) and Saddle (M).
Both winter and summer events are associated with a south–southeasterly wind over the central and western parts of the ice sheet (Fig. 3a), with peak wind speeds in winter above 10 m s−1 (Fig. 3b). In both seasons, the southerly component of the winds is enhanced by a large-scale high-pressure anomaly southeast of Greenland and a low-pressure anomaly to the southwest (Fig. 3c). This synoptic situation lasts longer for summer events (Fig. 3d) and is associated with widespread warming, especially in southwest Greenland (Fig. 3e). While the relative warming is more pronounced during winter events (Fig. 3f), the overall synoptic setting is qualitatively similar for winter and summer events (Fig. 4).
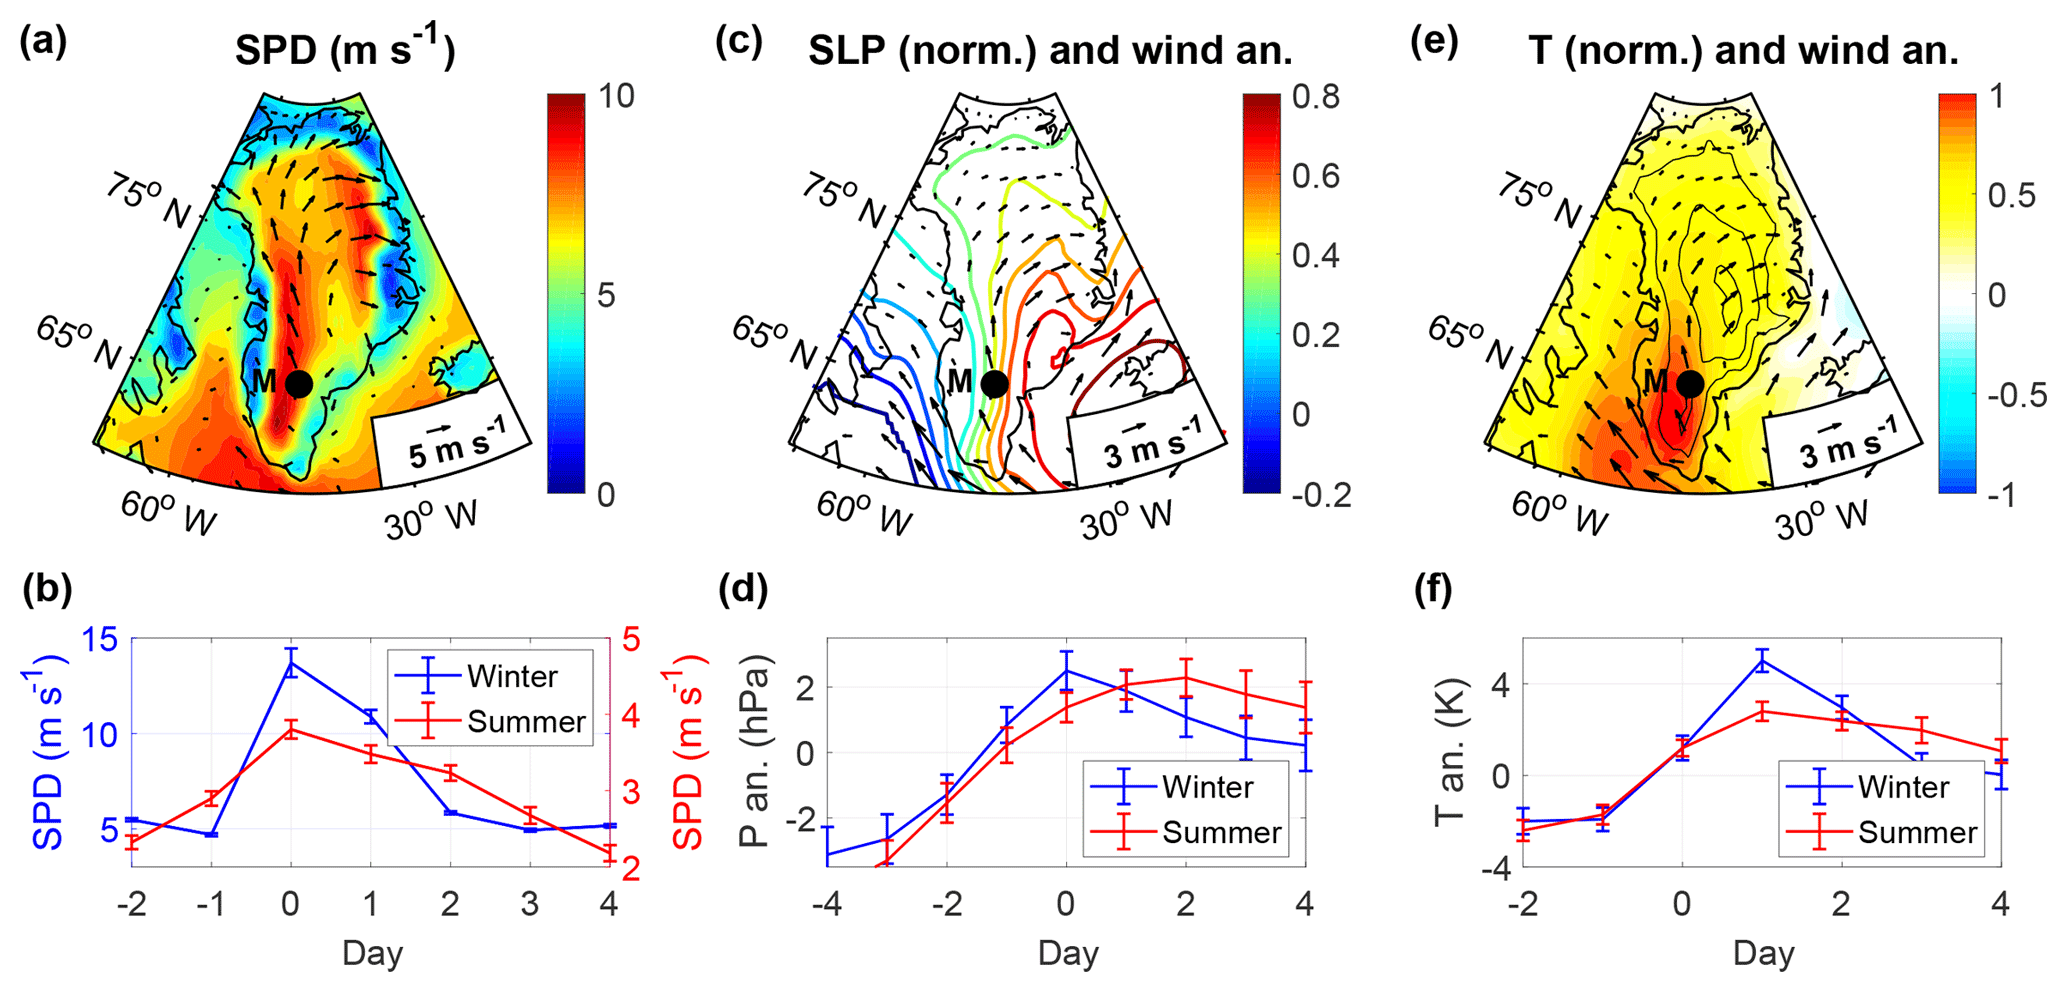
Figure 3Composites of (a) the 10 m wind speeds (SPD) and the normalized (c) sea level pressure and (e) temperature anomalies during melt events (at day 0 in Fig. 1d), obtained from ERA-I. Normalized implies that the climatological monthly means are subtracted and the result is divided by the standard deviation. Composites of (b) wind speed and (d) pressure and (f) temperature anomalies at Station Saddle (M), where the anomalies are with respect to the mean during the events. Error bars represent the standard error of the mean.
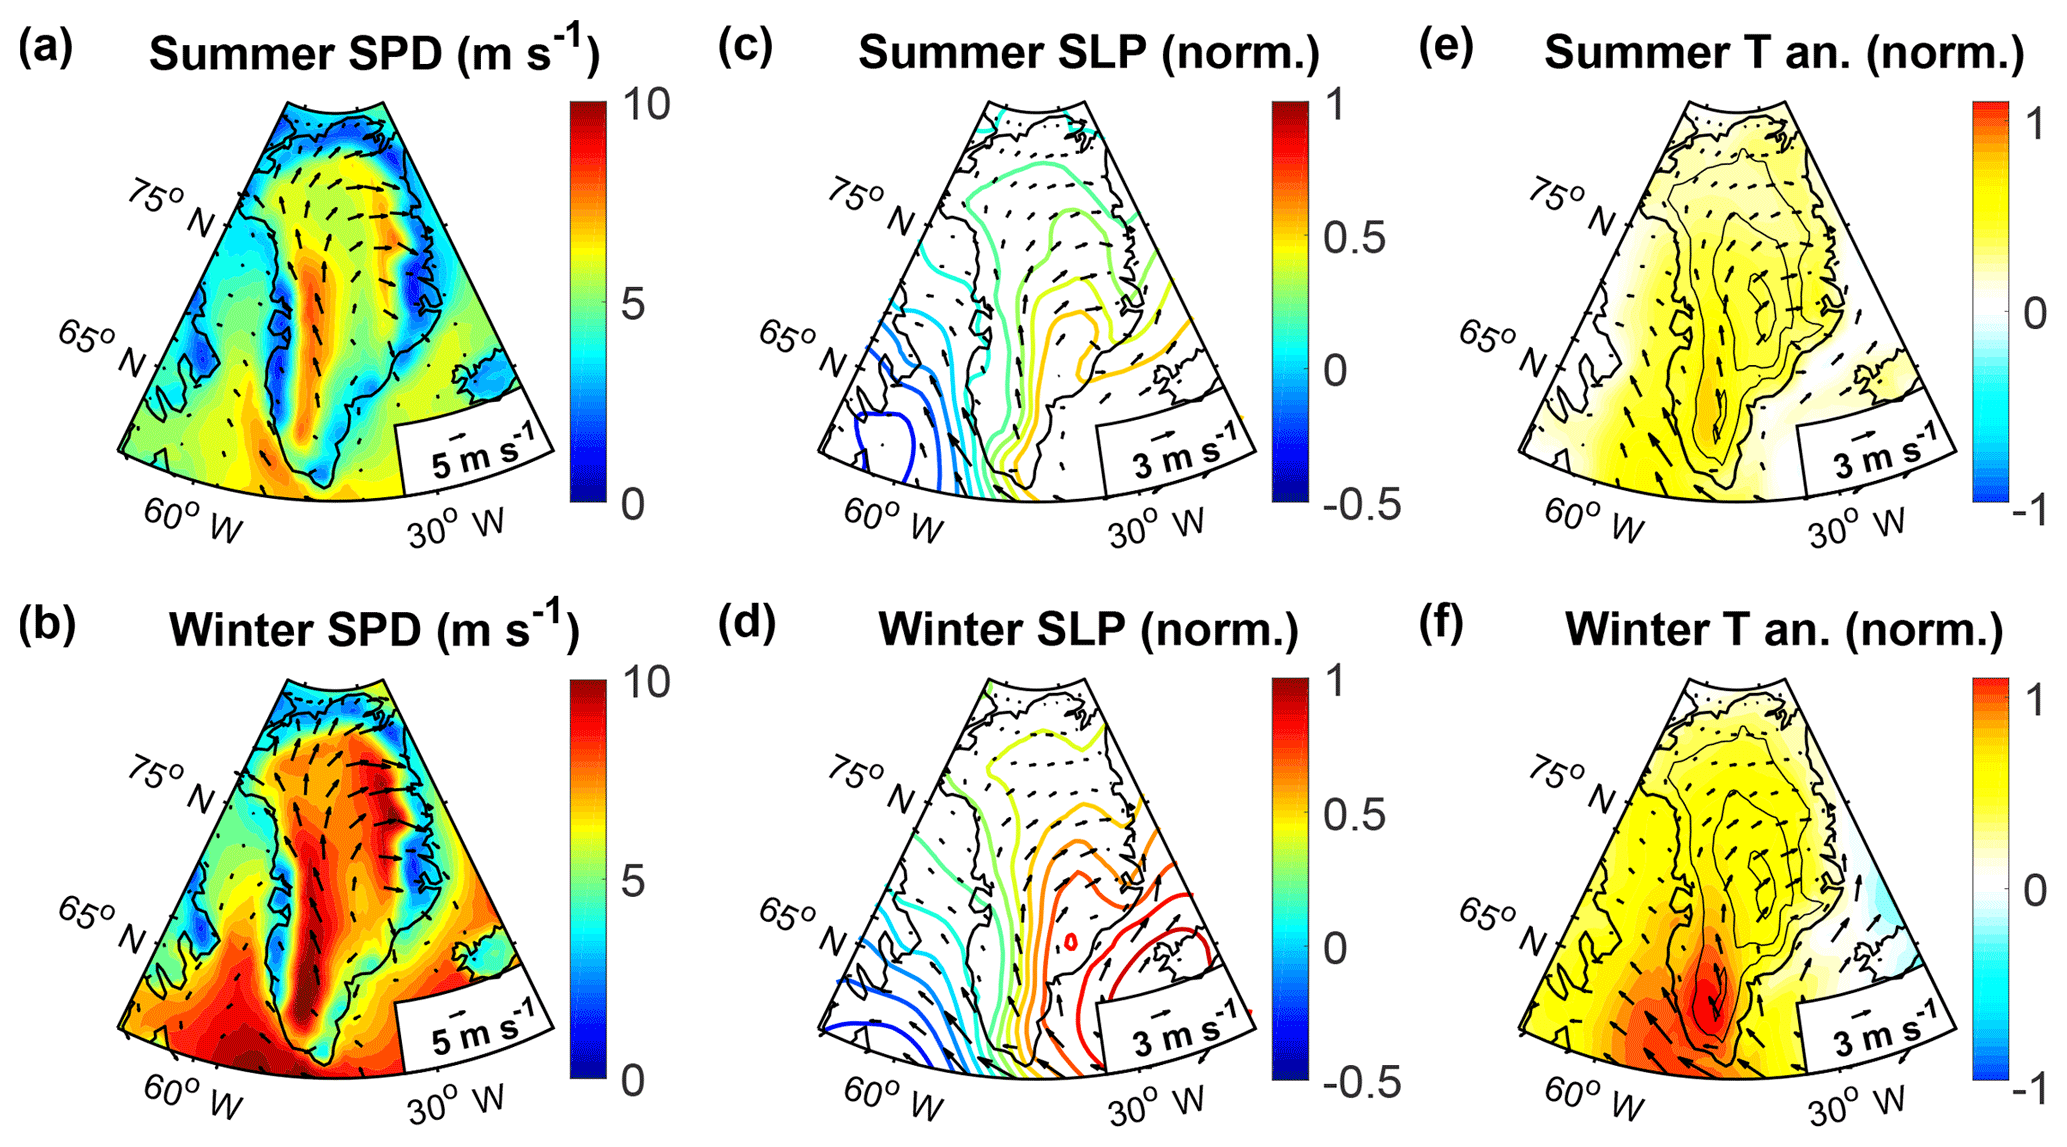
Figure 4Composites of the (a, b) mean 10 m surface winds and the normalized (c, d) sea level pressure and (e, f) temperature anomalies with the 10 m surface wind anomalies during melt events in summer and winter, obtained from ERA-I. Normalized means that for each event the climatological monthly means have been subtracted and the result has been divided by the interannual standard deviation at each month.
Data from local weather stations show that the southerly winds not only carry heat, but also moisture (and hence latent heat) over the ice sheet, resulting in increased atmospheric humidity (Fig. 5a), cloud cover (not shown) and precipitation (Fig. 5b). The precipitation is largest during winter and can last for several days, whereas it is reduced in summer, especially at the east coast. The melt extent (Fig. 2), combined with observed decreases in the albedo (Fig. 5c) and above freezing air temperatures recorded by stations East, West and South, suggests that, at lower elevation, a large part of the precipitation occurs as rainfall, even during winter. At higher elevation, however, stations SD and Summit both record a slight increase in the albedo (Fig. 5c), likely because precipitation occurs as snow.
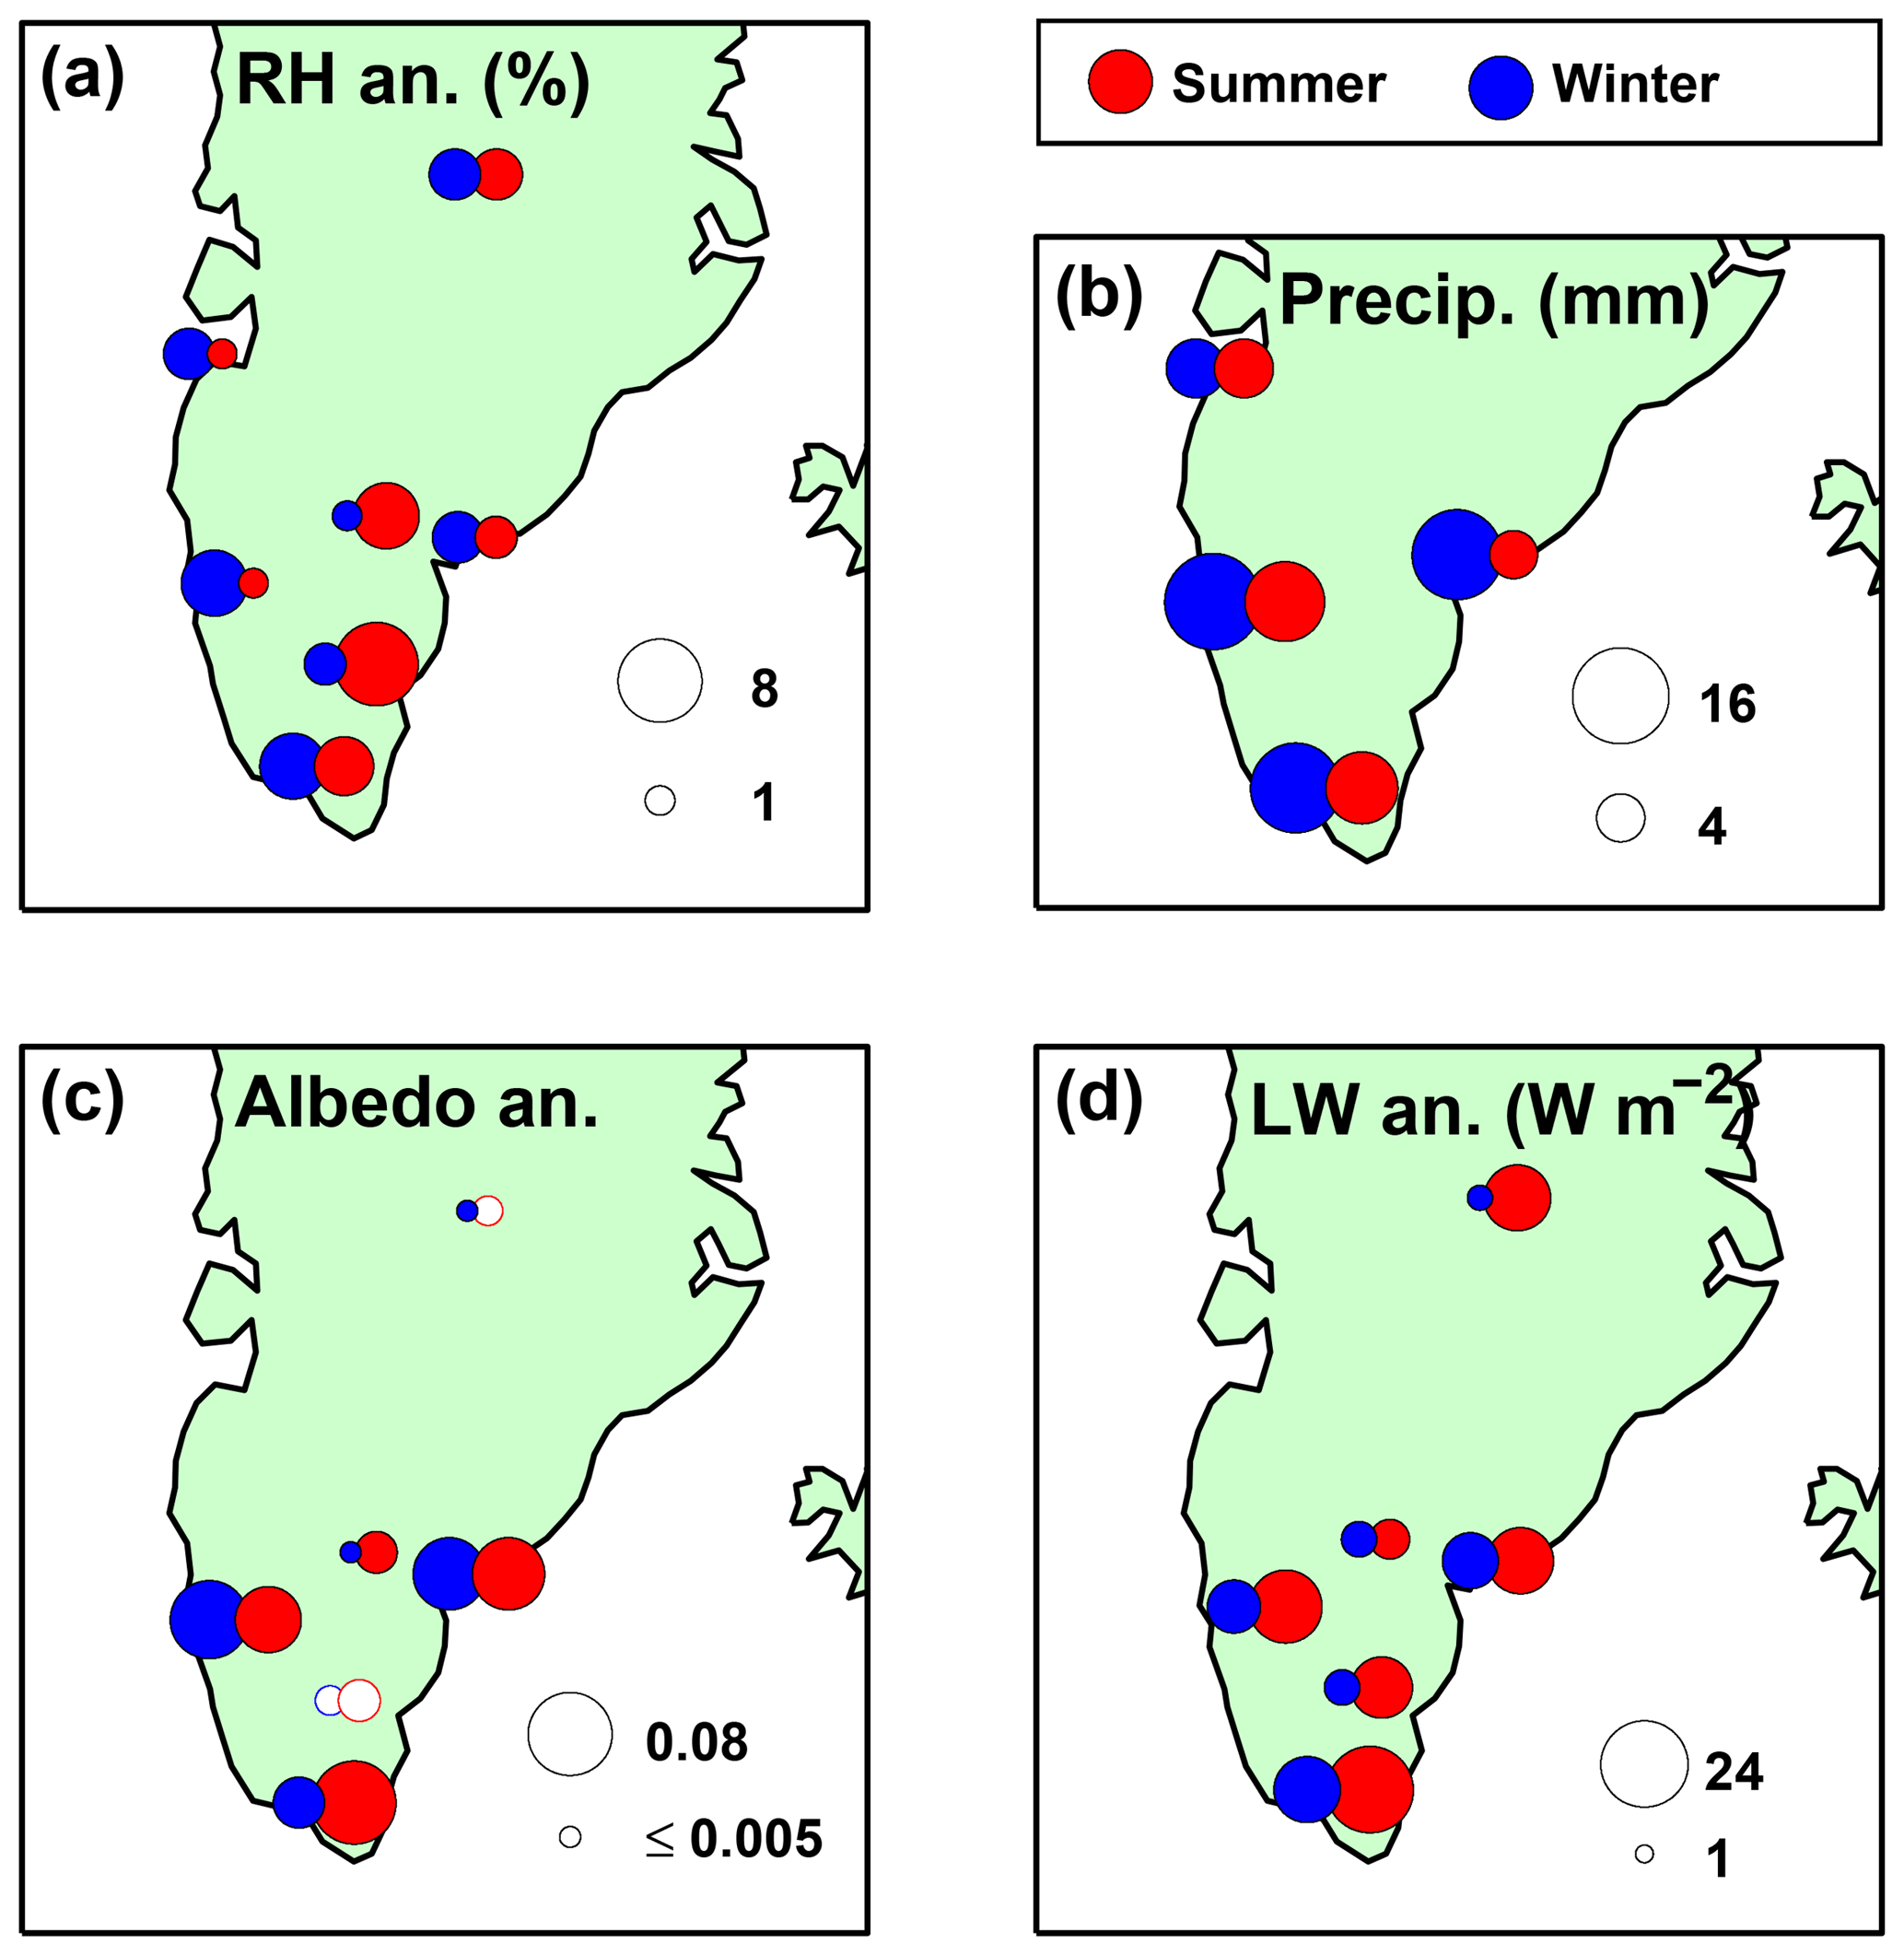
Figure 5Composites of (a) the relative humidity anomaly, (b) total precipitation (in millimeters of liquid water) and (c) the albedo and (d) longwave radiation anomalies (positive downward), obtained from weather stations. Precipitation is summed over the days 0 to 2 of the events (days 1 to 3 for Station East). Relative humidity and longwave radiation are averaged from day 0 to 2 and the albedo from day 1 to 3 (again 1 day later for Station East). All anomalies are with respect to the week before the events. Filled circles in c indicate that albedo decreases, empty ones indicate increases. Uncertainty estimates are provided in Table 1.
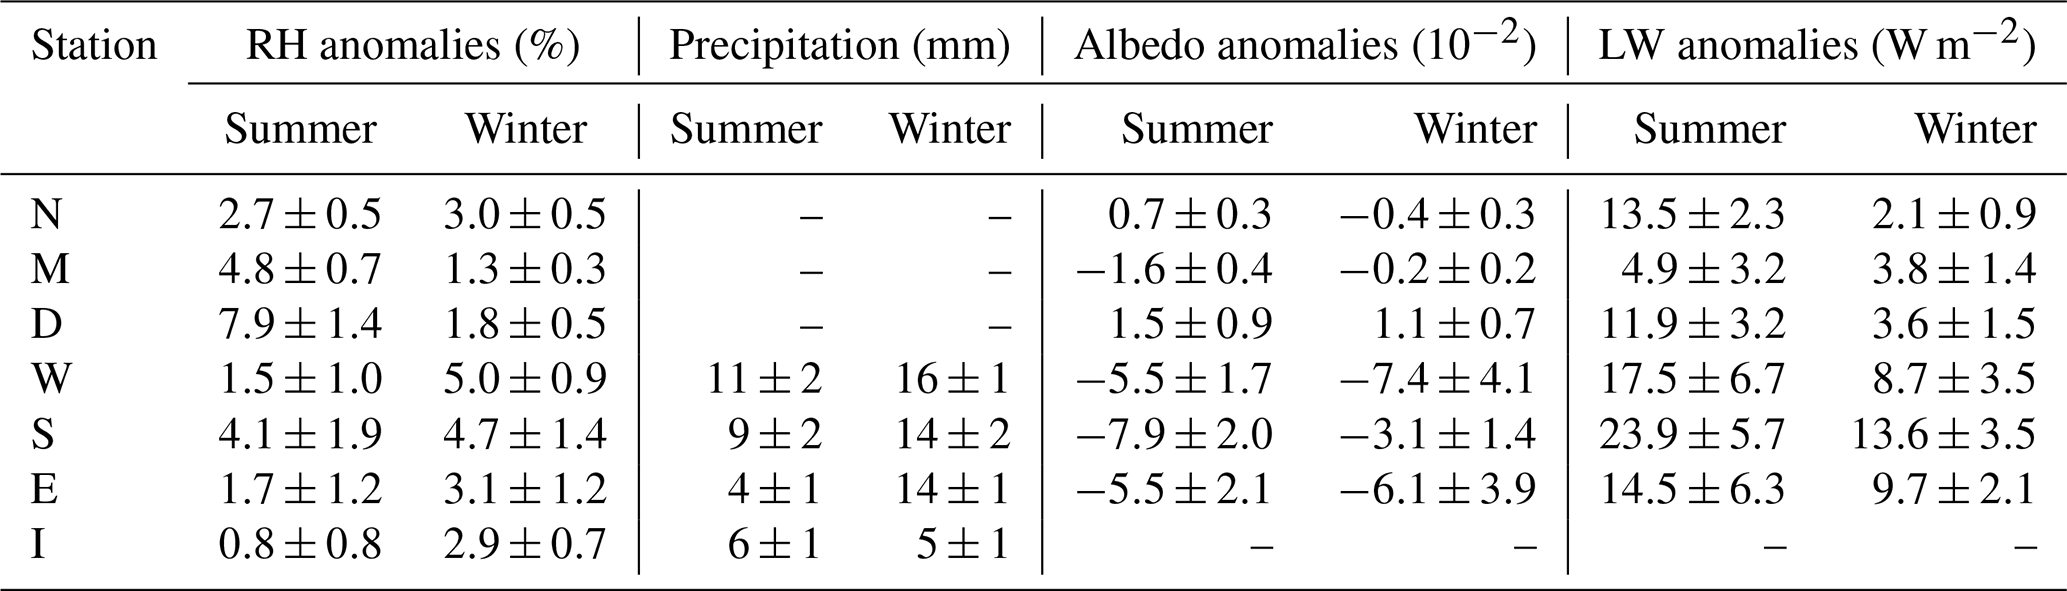
Table 1Precipitation (totals) and the relative humidity (RH), albedo and longwave (LW) radiation anomalies (positive downward) during melt events in summer and winter, obtained from weather stations (Fig. 2c). Precipitation is summed over the days 0 to 2 of the events (days 1 to 3 for Station East because there is a ∼1 day delay of the warming). If precipitation occurs as snow, it is melted before the measurement. Relative humidity and longwave radiation are averaged from day 0 to 2 and the albedo from day 1 to 3 (again one day later for Station East). All anomalies are with respect to the week before the events. Uncertainties represent the standard error of the mean.
All investigated stations record an increased absorption of longwave radiation (Fig. 5c), suggesting that the heat advected over the ice sheet during the melt events is then retained near the surface by the clouds and the high atmospheric humidity. Thus, in both seasons, melt events are reinforced by a positive feedback resulting from increased longwave radiation, a process that was considered relevant during an extreme melt episode in July 2012 (Bennartz et al., 2013; Neff et al., 2014; Bonne et al., 2015; Fausto et al., 2016). In summer, when the incoming solar radiation is large, the decrease in albedo (Fig. 5c) entails an additional positive feedback that can reinforce and prolong the melting (Box et al., 2012).
The stretching of the melting by positive feedbacks implies that the duration of the melt events is longer than that of the initial, melt-triggering atmospheric conditions. To illustrate the characteristics of these atmospheric conditions most clearly, we based the weather station composites on 3-day averages, corresponding to the peaks of the weather events (Fig. 3b). However, the initiated melting can last even after the initial cyclonic circulation anomaly has passed, in particular during summer (Fig. 1d).
3.2 Variability of melt events
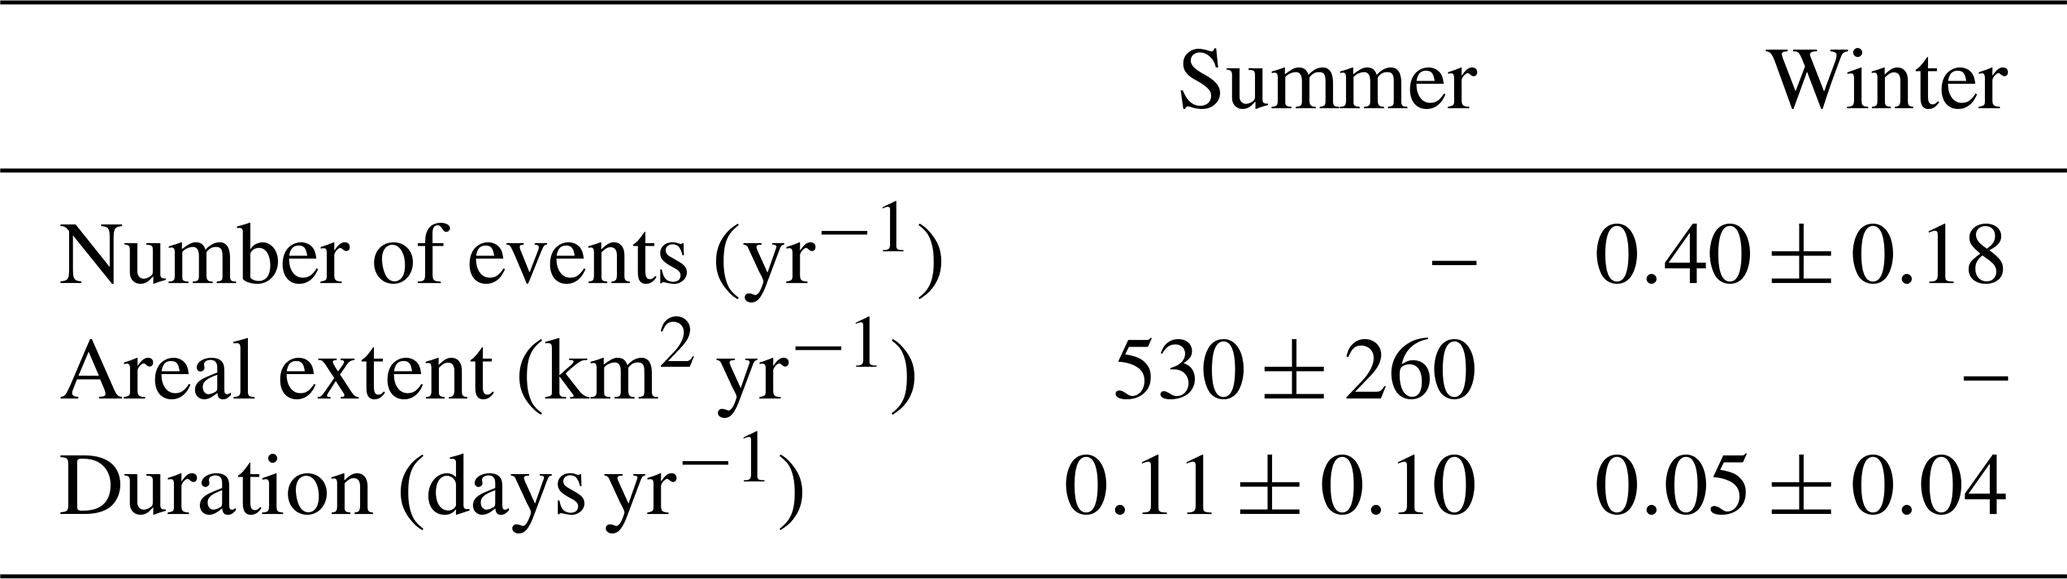
Next, we investigate the extent to which changes in the occurrence and characteristics of melt events have contributed to the observed increased surface melt. We concentrate on the period 1988–2012 to ensure that the results are not affected by data gaps in the earlier period. Based on linear regression, we find that over these 25 years, the number of winter events has risen from ∼2 to ∼12 in a single winter (Fig. 6a). In summer, there is no clear trend in the number of events but their areal extent has more than doubled (Fig. 6b). The average duration of the events, moreover, has increased from ∼2 to ∼3 days for winter events and from ∼2 to ∼5 days for summer events (Fig. 6c). All specified trends are statistically significant at the 95 % confidence level (Table 2).
Recognizing that subseasonal differences in the variability of melt events may be concealed by the broad definition of the winter period from September to April, we test the robustness of the obtained trends against alternative winter and summer definitions. If winter is defined as the period from October to March or from December to February, the trends in the number of melt events are of similar amplitude and remain significant (Fig. S1a and c in the Supplement), while the trends in the duration of the winter melt events do not. Defining summer as the period from April to September or from July to August affects the significance of neither the melt extent nor the duration trends, suggesting that they are insensitive to the exact seasonal definition (Fig. S1b and d).
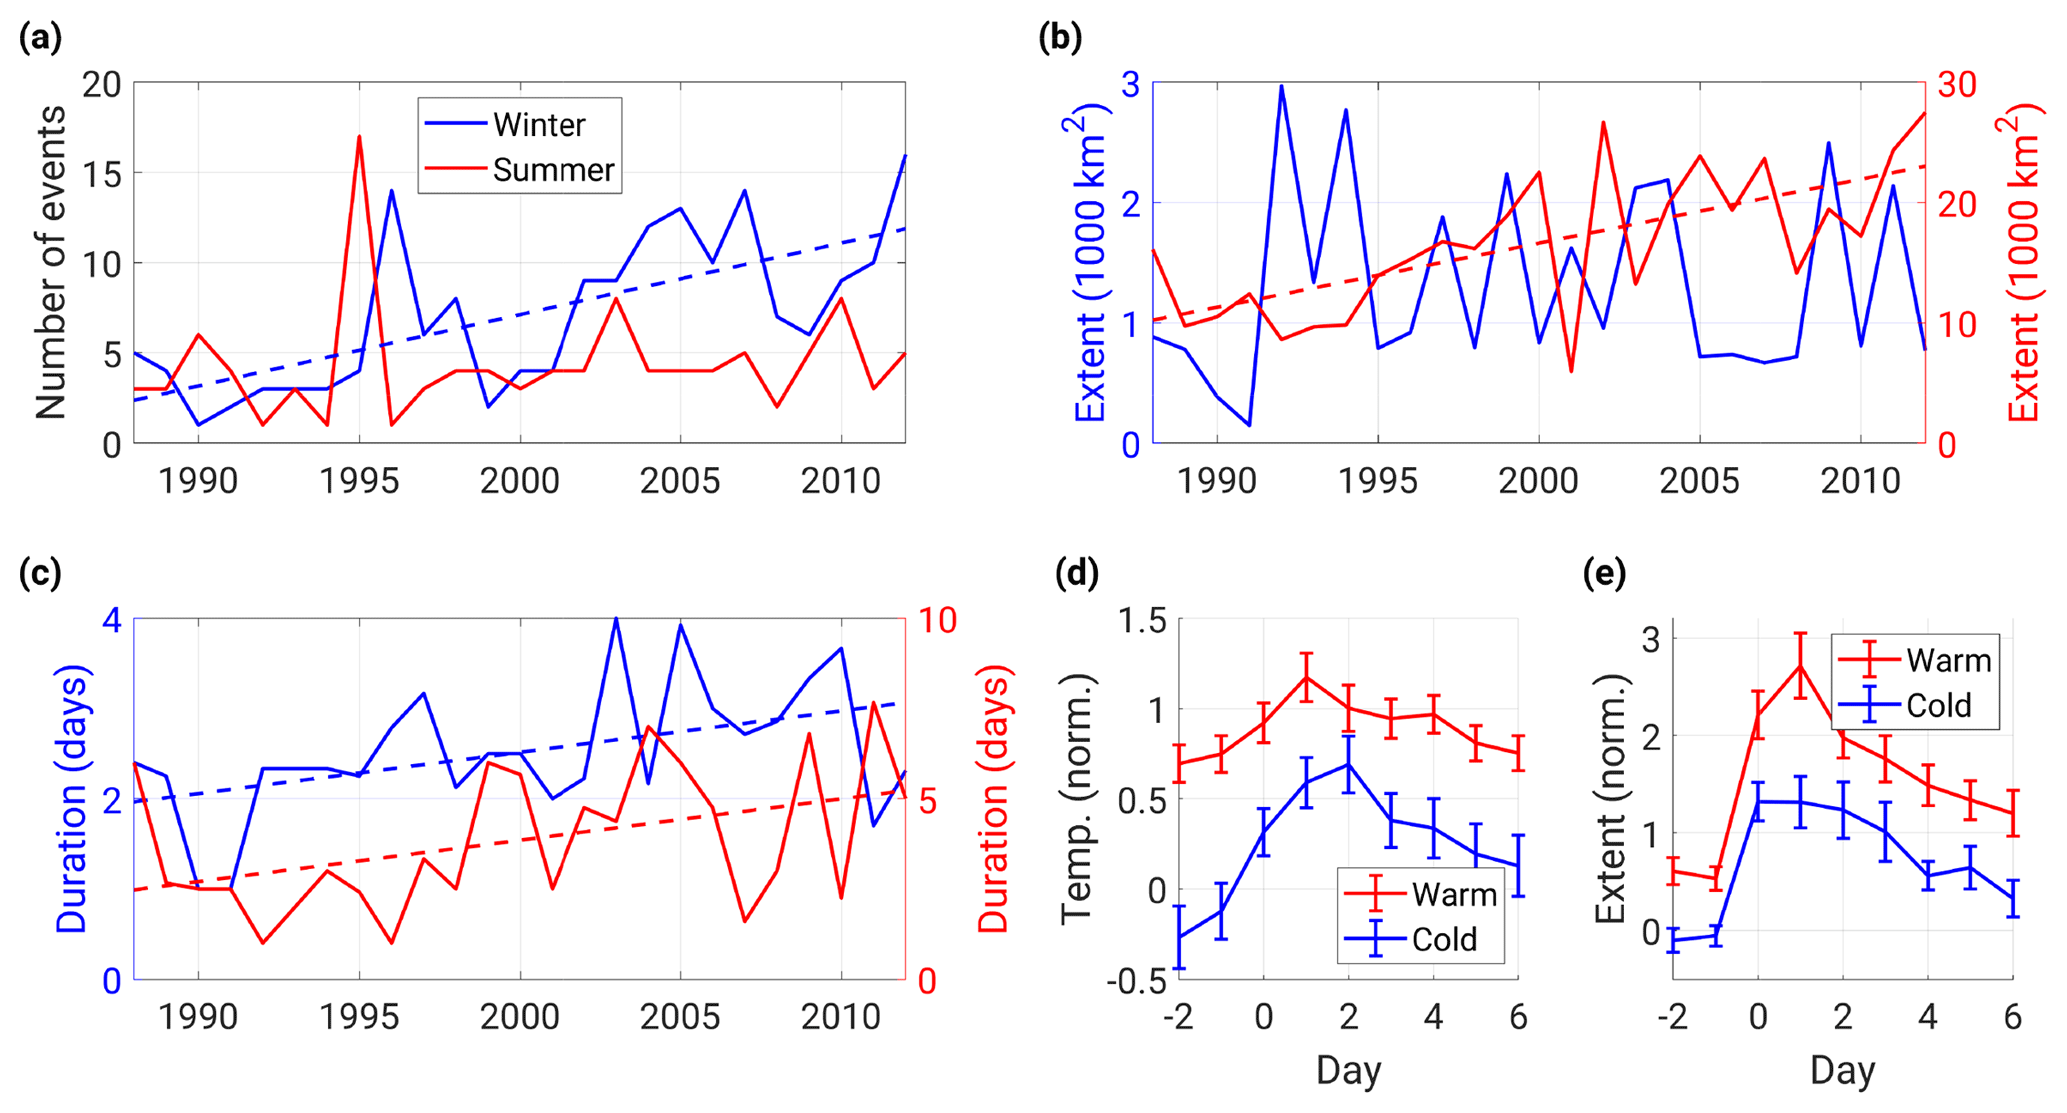
Figure 6Variability of (a) the occurrence, (b) the melt extent, averaged from day 0 to 2, and (c) the duration of melt events in winter and summer, where winters are assigned to the year in which they end. Composites of the normalized (d) temperature and (e) melt extent evolution at Station West for the melt events in the five warmest and coldest summers and winters (averaged). This results in 53 (18) events in the warm (cold) winters and 27 (15) events in the warm (cold) summers. Normalized implies that the mean annual cycle has been subtracted and the result has been divided by the standard deviation.
Table 2Trends in the number of melt events, their areal extent and their duration for the period 1990–2012. The trends are derived from linear regressions and the uncertainties represent the 95 % confidence bounds. Only trends significant at the 95 % level are included.
To diagnose causes of the increased occurrence or extent of melt events, we first consider changes in the mean air temperature. Over the period 1988–2012, the mean air temperature, averaged over the ice sheet, has increased by ∘C in winter and by ∘C in summer, obtained from ERA-I. Since in warmer summers and winters a weak forcing or temperature jump is sufficient to trigger melt, synoptic systems can initiate melt events more often even without becoming more frequent (Fig. 6d). At the same time, the comparatively weaker forcing in warmer seasons resulted in comparatively more melting (Fig. 6e).
To examine whether changes in the atmospheric circulation have contributed to an increased number of cyclone-driven moisture intrusions and, in turn, to more frequent melt events, we approximate the synoptic setting during melt events by the first two modes, obtained from an empirical orthogonal function analysis of the sea level pressure variability over Greenland. In both seasons, variations in the first mode (Mode 1) reflect an overall increase or decrease of the pressure over Greenland with a maximum amplitude over the Irminger Sea (Fig. 7a and b), while the second mode (Mode 2) constitutes an east–west dipole with an intensified zonal pressure gradient across southern Greenland (Fig. 7c and d).
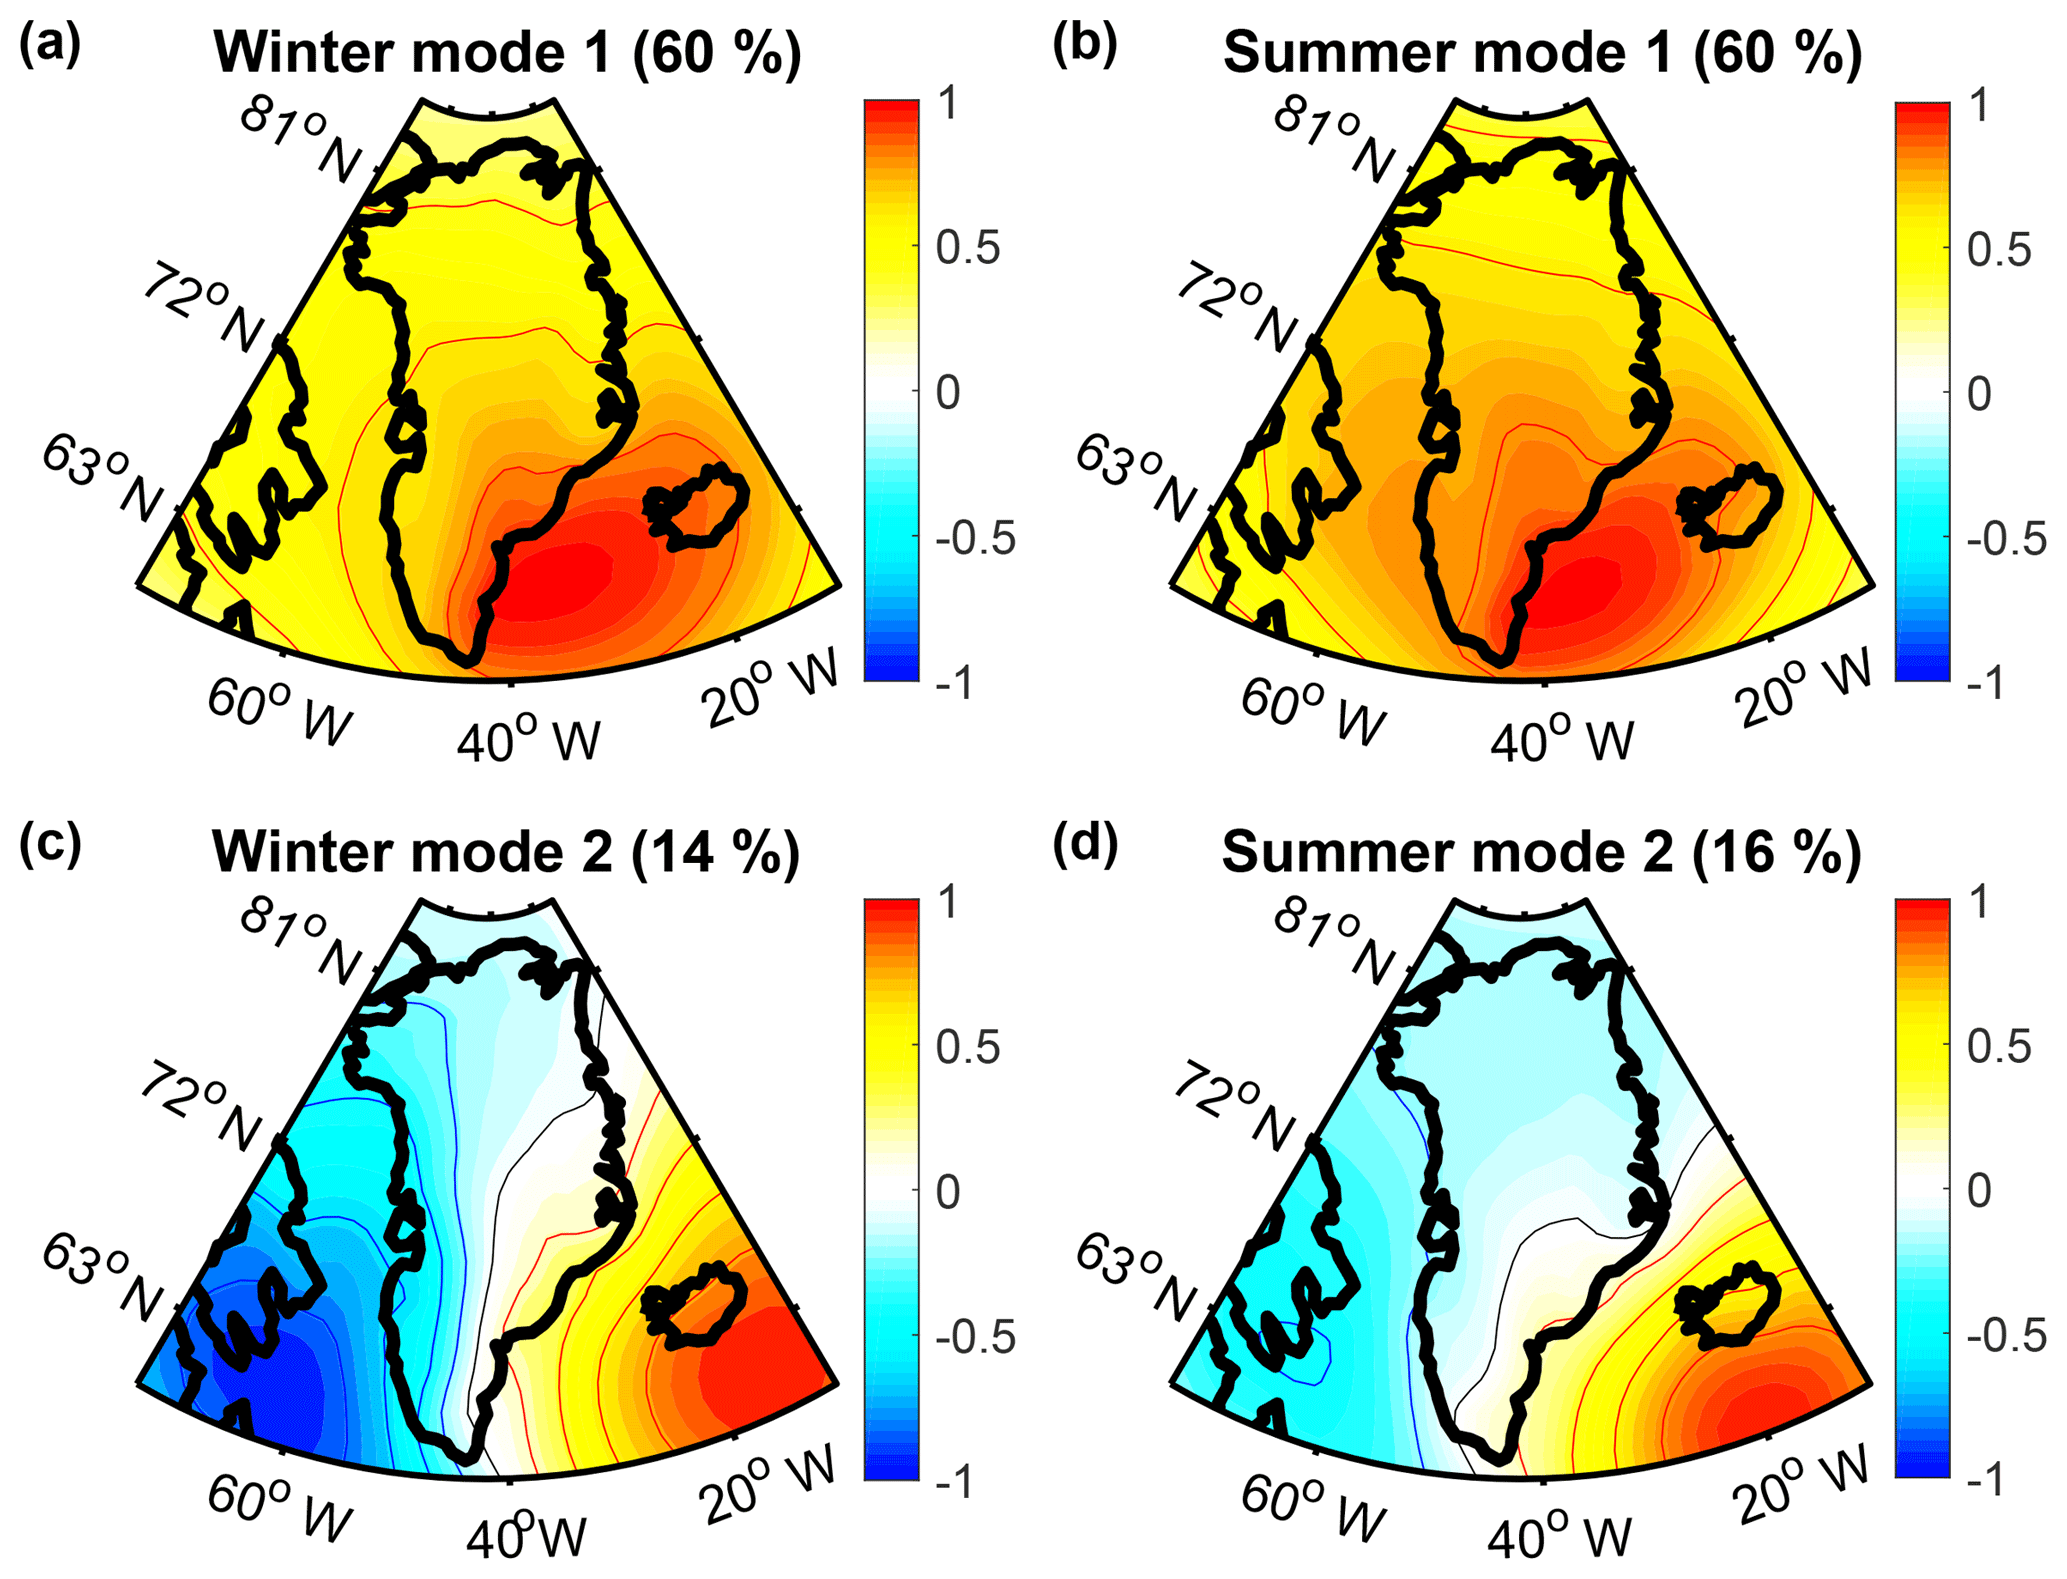
Figure 7First and second EOF modes (normalized) of the sea level pressure variability over Greenland in winter and summer for the period 1988–2012, obtained from reanalysis data. The titles indicate the explained variance of the total temporal sea level pressure variability.
Combined, modes 1 and 2 nearly fully capture the spatial variance of the sea level pressure during melt events, with Mode 2 explaining most of the variance (91 % in winter and 73 % in summer). In winter, Mode 2 is also highly correlated with the net seasonal precipitation, integrated over the ice sheet, obtained from the regional climate model MAR (), in agreement with the finding that melt events are accompanied by precipitation. However, neither Mode 2 nor precipitation show any significant increase and in summer, precipitation even decreased (Fig. 8).
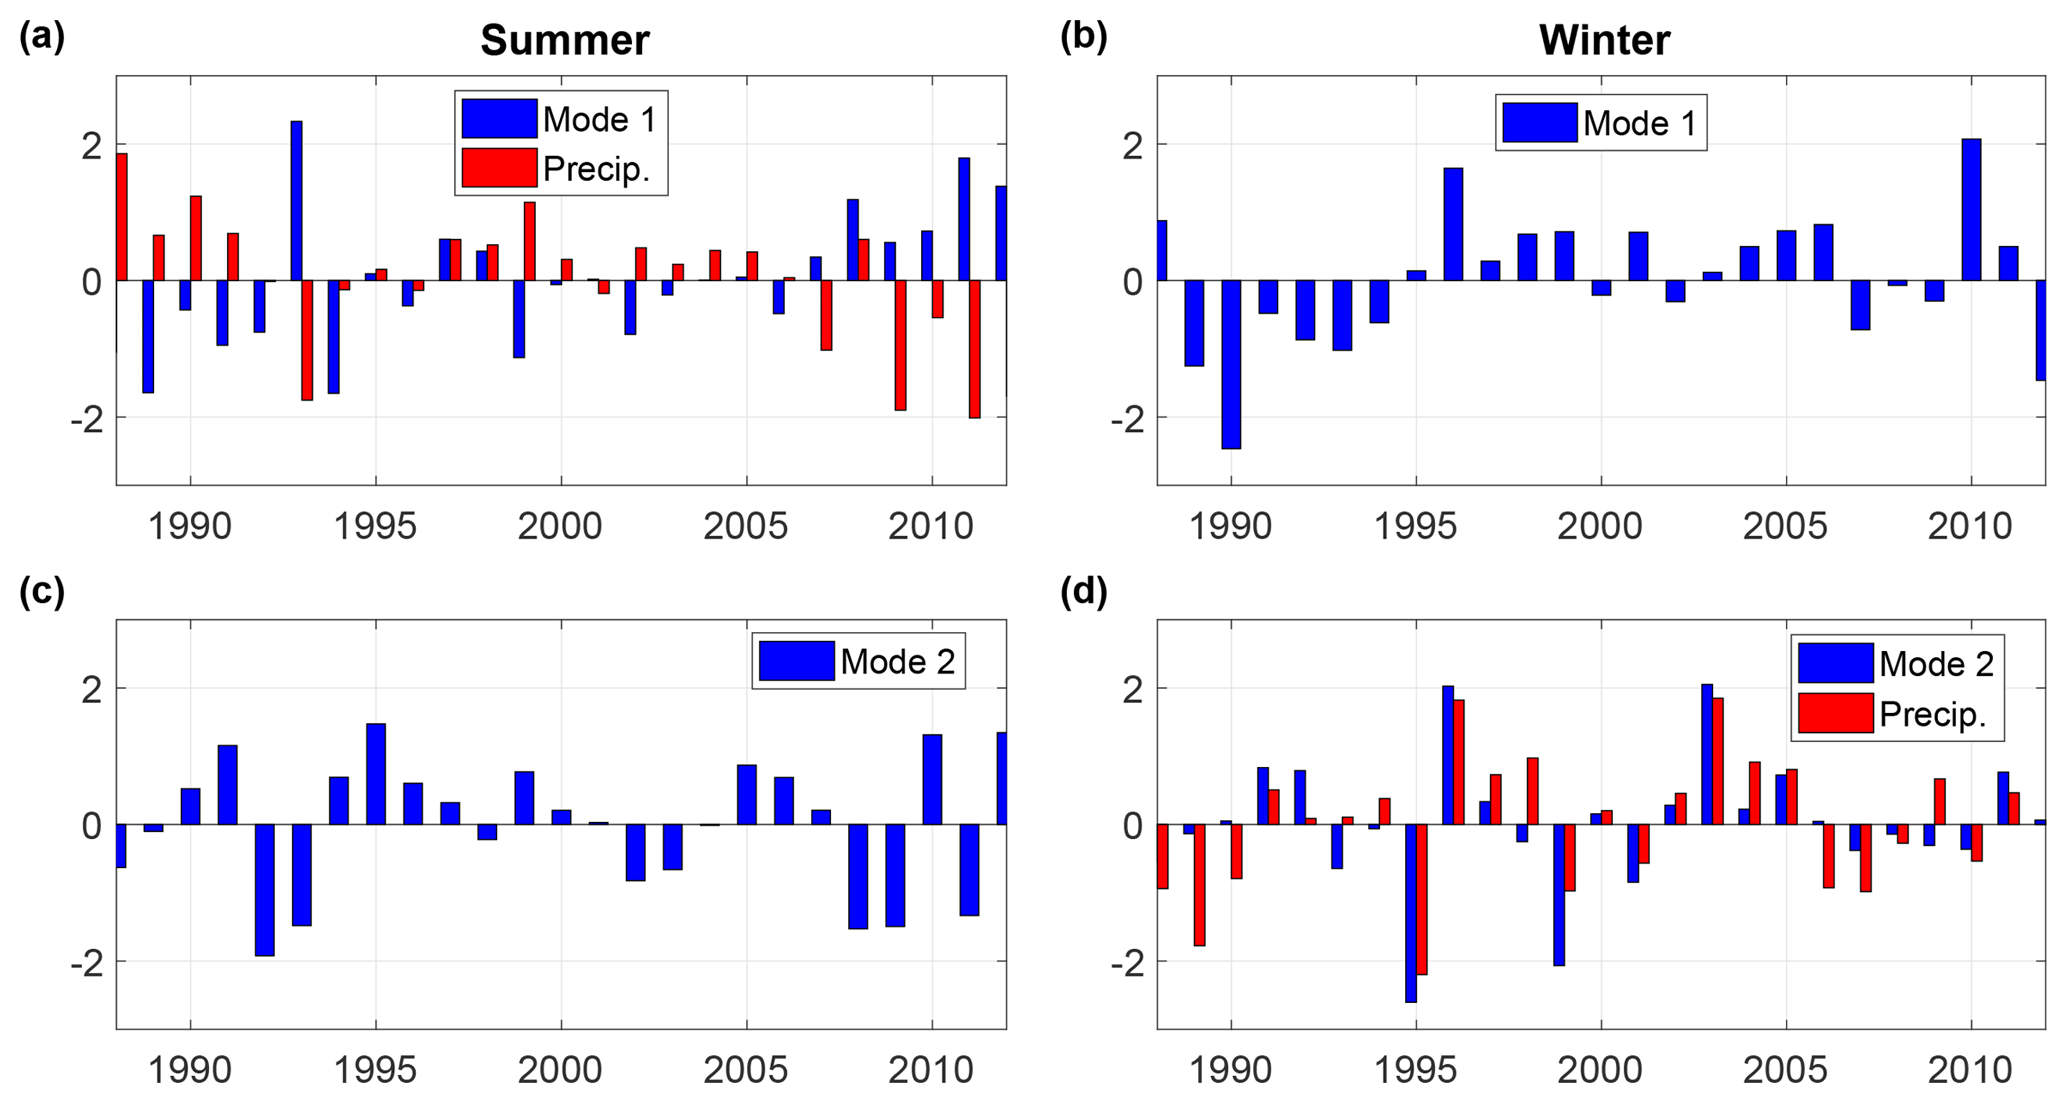
Figure 8Variability of the first and second EOF modes (Fig. 7). In (a, d), the variability of the net seasonal precipitation, integrated over the ice sheet, obtained from MAR, is also shown. For ease of comparison, all parameters were normalized by their mean and standard deviation over the investigated period.
Like Mode 2, Mode 1 is associated with the advection of warm air over the ice sheet but a large-scale zonal pressure gradient, and thus, a northward geostrophic flow are weaker compared to Mode 2. In summer, it is moreover anticorrelated with precipitation () and in both seasons but particularly summer, it describes less of the spatial sea level pressure variance during melt events (47 % in winter and 26 % in summer). Mode 1 is, however, highly correlated with the Greenland Blocking Index ( in winter and in summer), which has previously been recognized as a driver of melt (Hanna et al., 2013a, 2014). Since Mode 1 increased in summer (Fig. 8), it likely contributed to amplifying the summer melt events by superimposing generally warmer conditions on them.
3.3 Implications for the ice sheet
The simultaneity of melting and precipitation in a single weather event suggests that mass gain and mass loss are closely connected. In winter, especially, the high correlation between Mode 2 and precipitation implies that the weather pattern, responsible for the most anomalous increases in the melt extent, simultaneously accounts for ∼59 % of the total seasonal precipitation. Over the full year with the summer months included, Mode 2 still captures ∼40 % of the annual precipitation variability. Regarding the concurrence of mass gain and mass loss, we next quantify the net effects of melt events on the ice sheet's surface mass balance and their changes, with the regional climate model MAR, verifying first that the melt event composites obtained from this model are consistent with the satellite and weather station observations (Fig. 9).
In winter, the precipitation anomaly associated with melt events, relative to the current month, outbalances the melt anomaly, whereas in summer, the melt anomaly is larger (Fig. 10a and b). These seasonal differences in the surface mass balance agree with those found for atmospheric river events which are driven by similar weather patterns (Mattingly et al., 2018). Closer inspection of the surface mass balance reveals that, in both seasons, approximately half of the rain (Fig. 10c and d) and melt associated with melt events runs off and the other half refreezes (Fig. 10e and f). While in winter, most of the melting and precipitation occurs within the first 3 days of the events, in summer, melting, runoff and refreezing are still significantly amplified after 6 days.
Since the broad definitions of winter and summer may hide subseasonal variations in the surface mass balance effects of melt events, we examine the relative magnitudes of melt to precipitation, rain to snow and runoff to refreezing, each averaged over the peak of the events (days 0 to 2), separately for each month (Fig. S2). The ratio of melting to precipitation is highest in July and levels off from September to April. The ratio of rain to snow also peaks in July but appears skewed as it flattens from October to May. The runoff–refreezing ratio is delayed compared to the others, being highest in August and falling off in November. This strong seasonality shows that most of the runoff associated with summer events occurs later in the season, whereas winter melt events primarily contribute in fall. Thus, splitting the year into only a winter and summer period implies a simplification of the full annual variability.
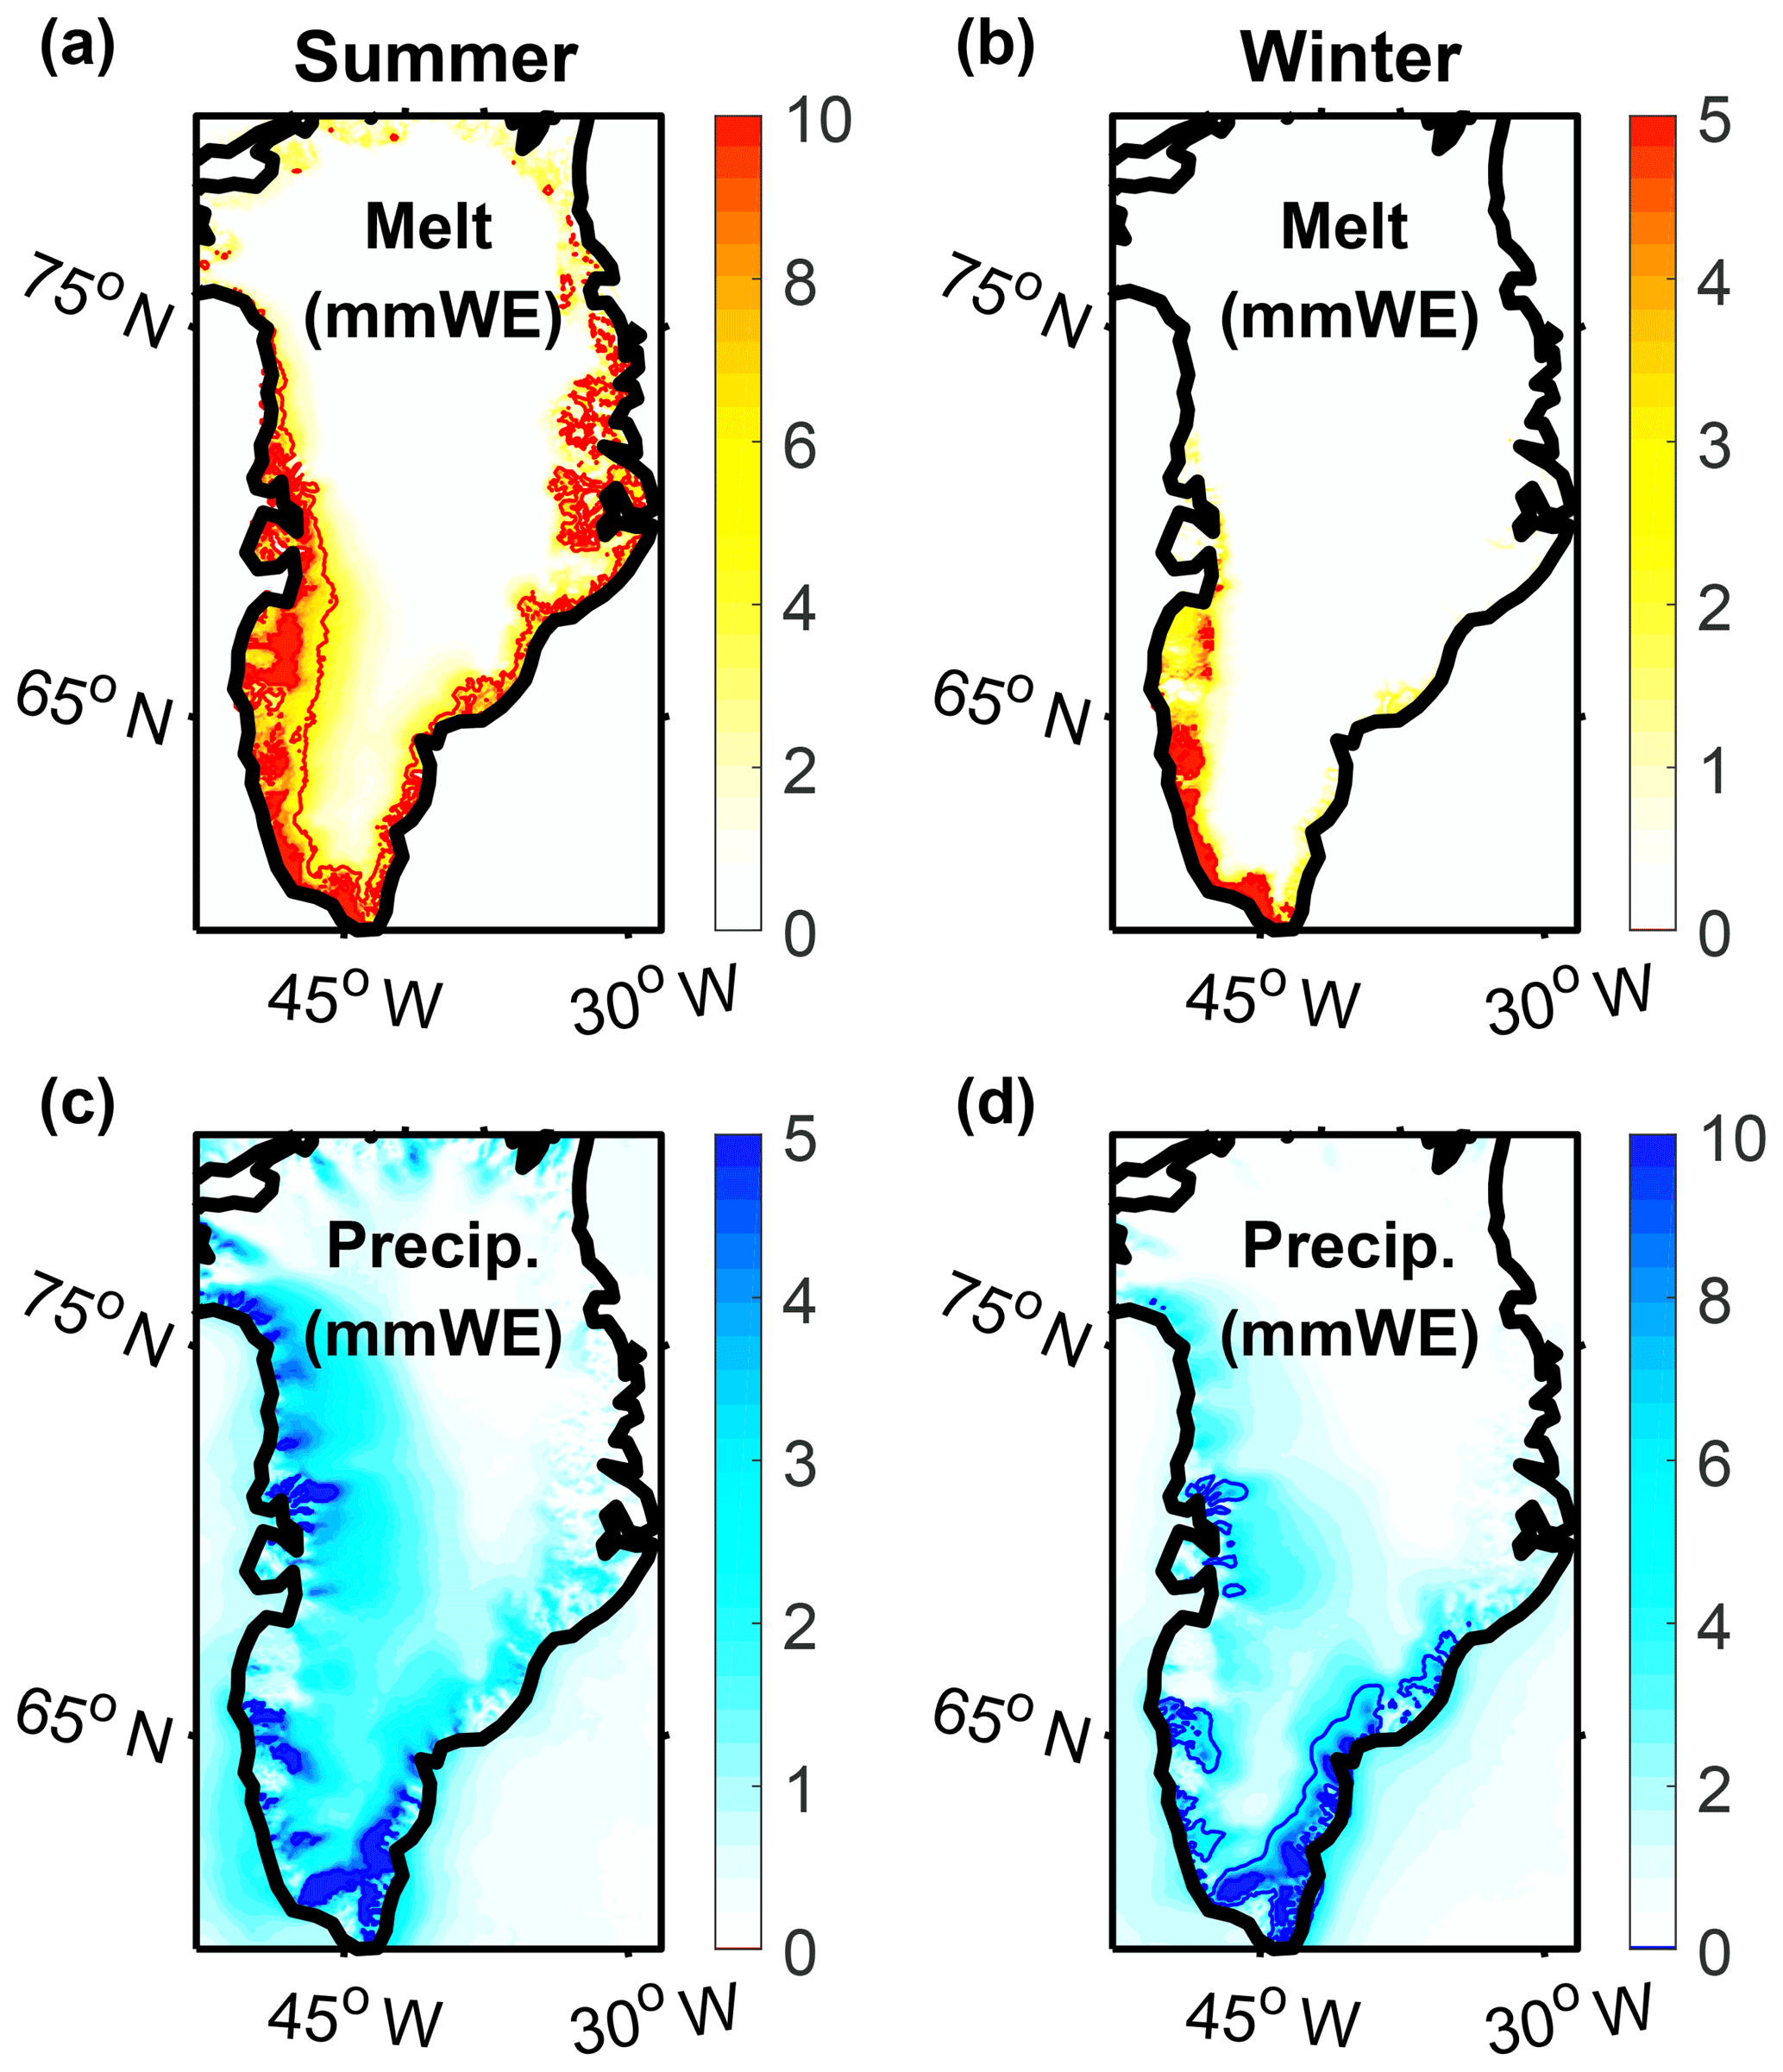
Figure 9Composites of (a, b) the surface melt anomalies, relative to the climatological monthly means, and (c, d) the total precipitation during summer and winter melt events (in millimeters of water equivalents), averaged from day 0 to day 2, obtained from the regional climate model MAR, with contours indicating the 5 mm WE isolines.
To investigate the extent to which the observed increases in the occurrence and areal extent of melt events between 1988 and 2012 (Sect. 3.2) have contributed to the overall change in Greenland's mass balance, we first observe that the model simulates significantly enhanced rainfall and melting from day −1 to day 3 (day −1 to day 6 for melting during summer events, Fig. 9a to d). Integrating the melting and rainfall over these days, we estimate that the net melting associated with melt events more than doubled in summer and more than tripled in winter (Fig. 11a and b). In winter, the rainfall also significantly increased, but not in summer (Fig. 11a and b). Again, we note that the total precipitation did not increase in winter and even decreased in summer (Fig. 8a and d).
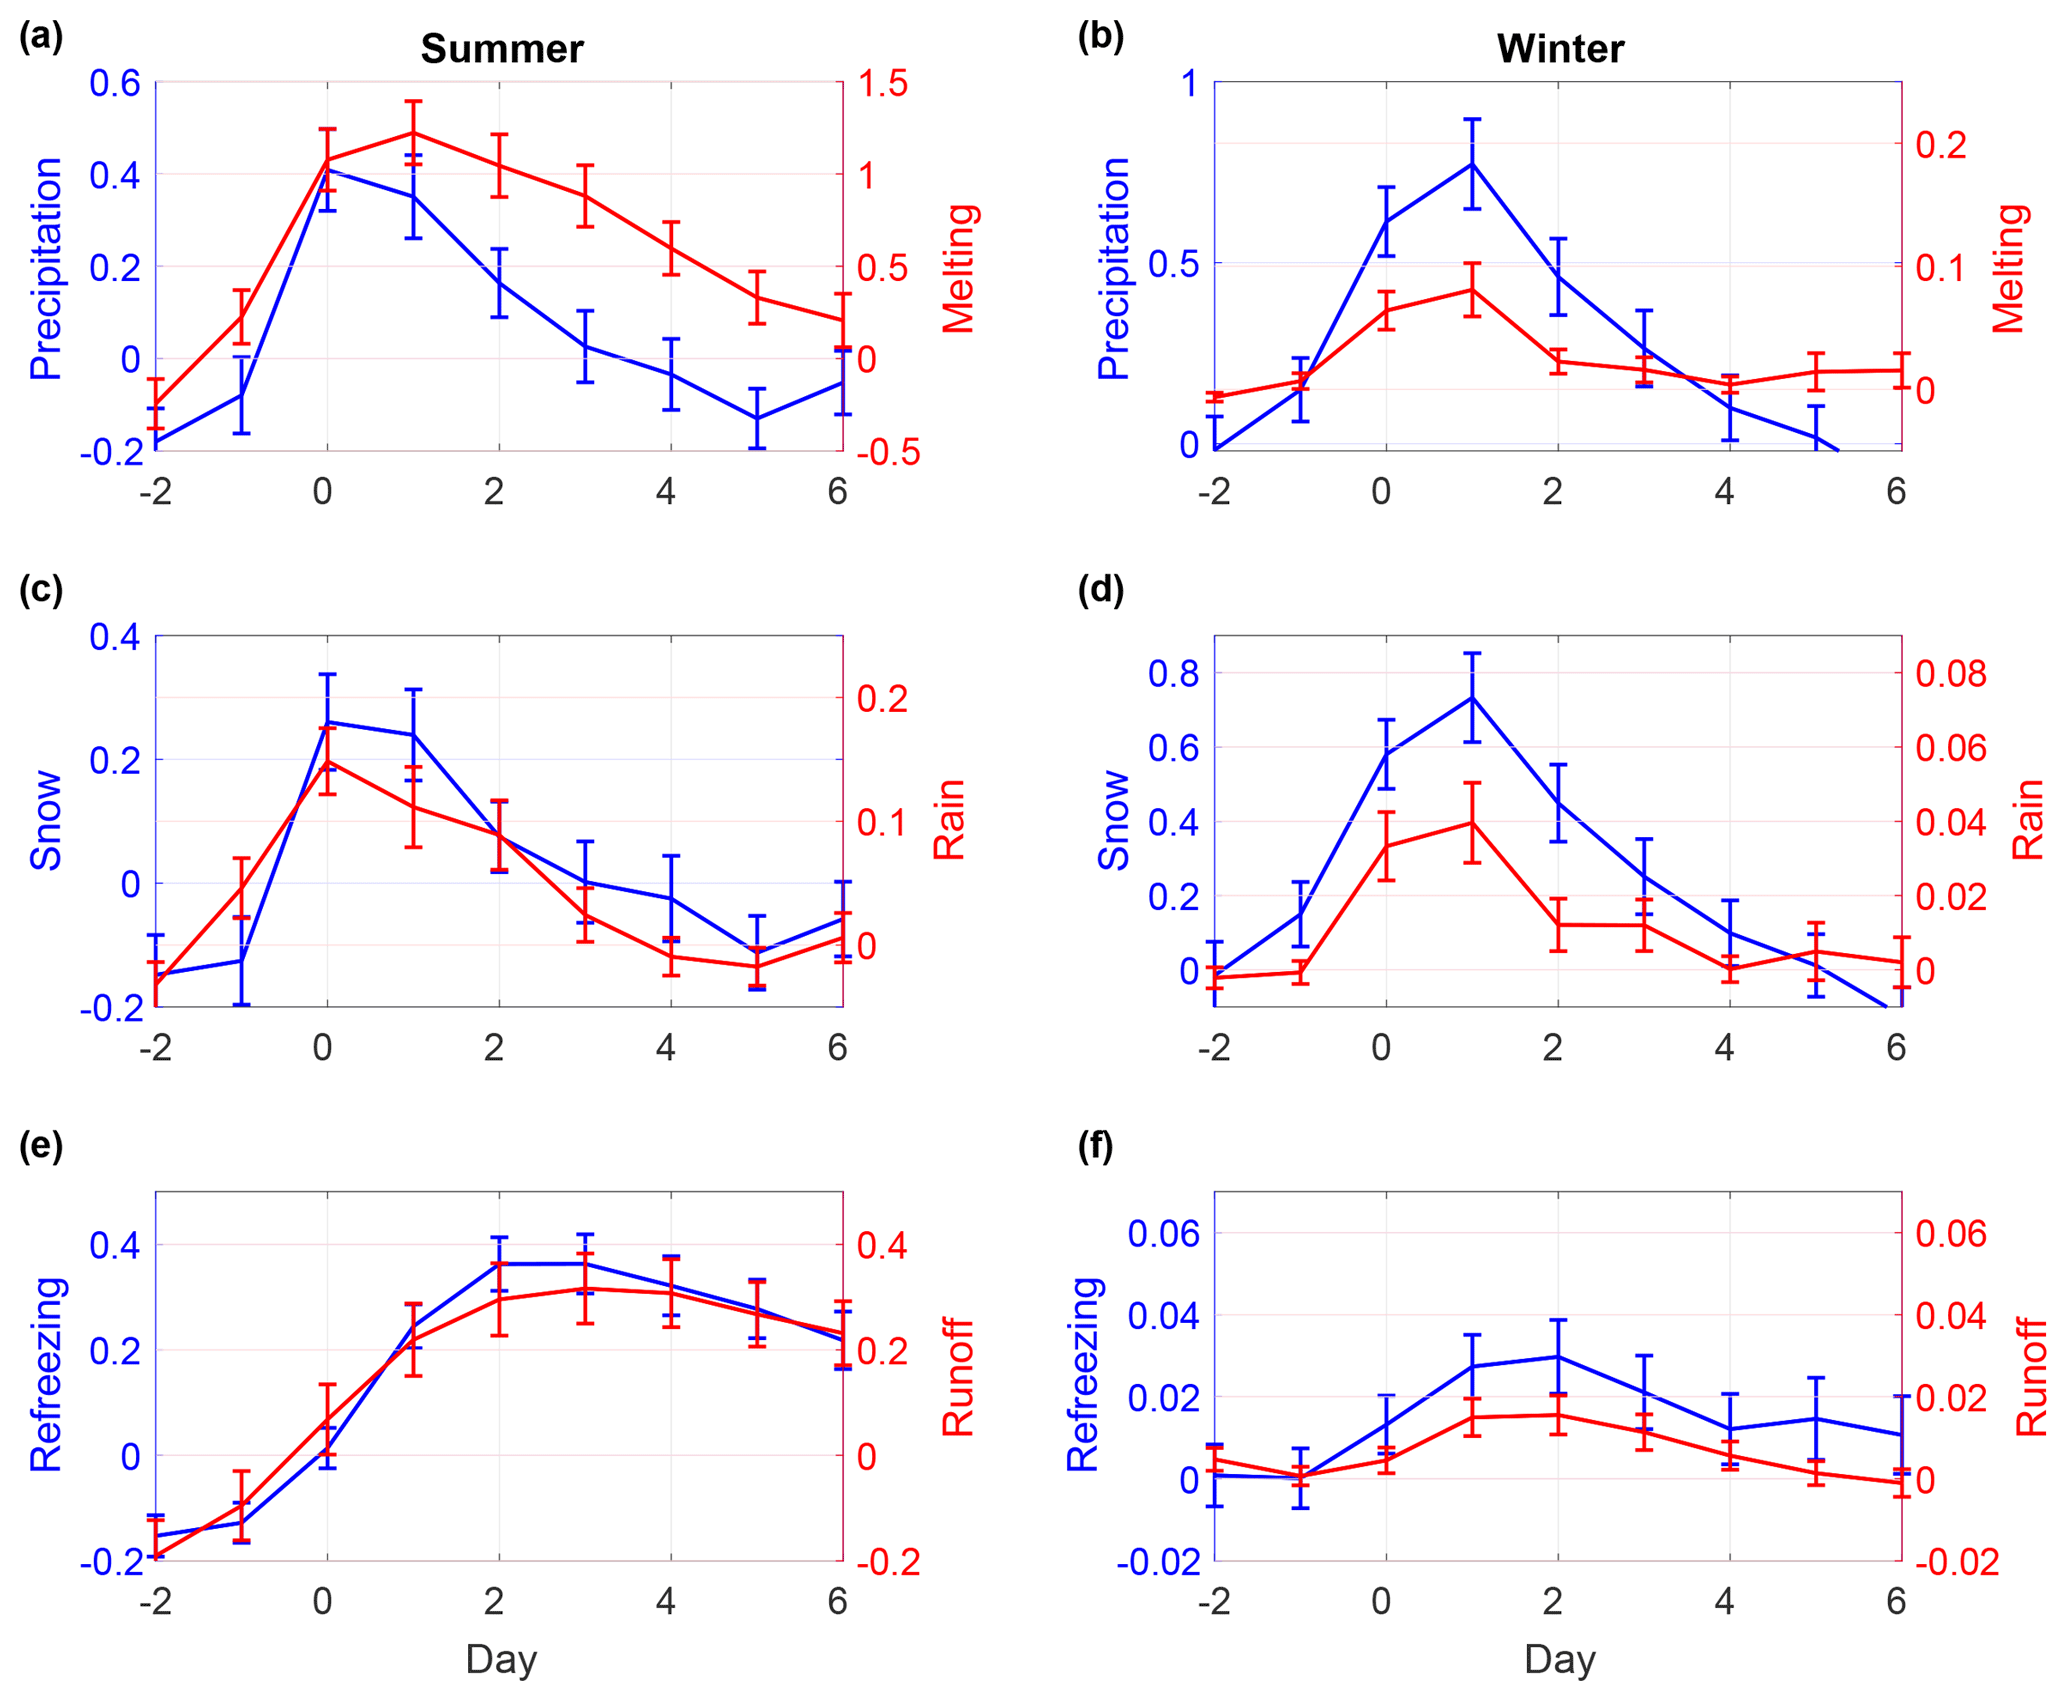
Figure 10Composite evolution of (a, b) surface melt and precipitation, (c, d) rainfall and snowfall and (e, f) runoff and refreezing during melt events in summer and winter, all in millimeters of water equivalents, averaged over the ice sheet, obtained from MAR. Shown are the anomalies (in millimeters of water equivalents per day) with respect to the mean of the current month, based on the period 1988–2012.
When integrated over the full duration of the seasons, melting and rainfall have increased at comparable rates. Thus, the relative contributions of the melt events to the net seasonal melt and rainfall have not significantly changed (Fig. 11c and d). Over the full period, winter events have accounted for ∼30 % of the melting and ∼34 % of the rainfall, while summer events have accounted for ∼28 % of the melting and ∼24 % of the rainfall. Taken together, winter and summer melt events have contributed ∼28 % to the total melting and ∼26 % to the total rainfall. The higher contribution of melt events in winter confirms that the anomalies in the melting and rainfall, relative to their seasonal mean, are larger in winter, whereas the mean melting and rainfall are larger in summer. Thus, even though winter events are stronger with regard to the underlying weather systems, their overall contribution to the net rainfall and melting is minor compared to that of summer events.
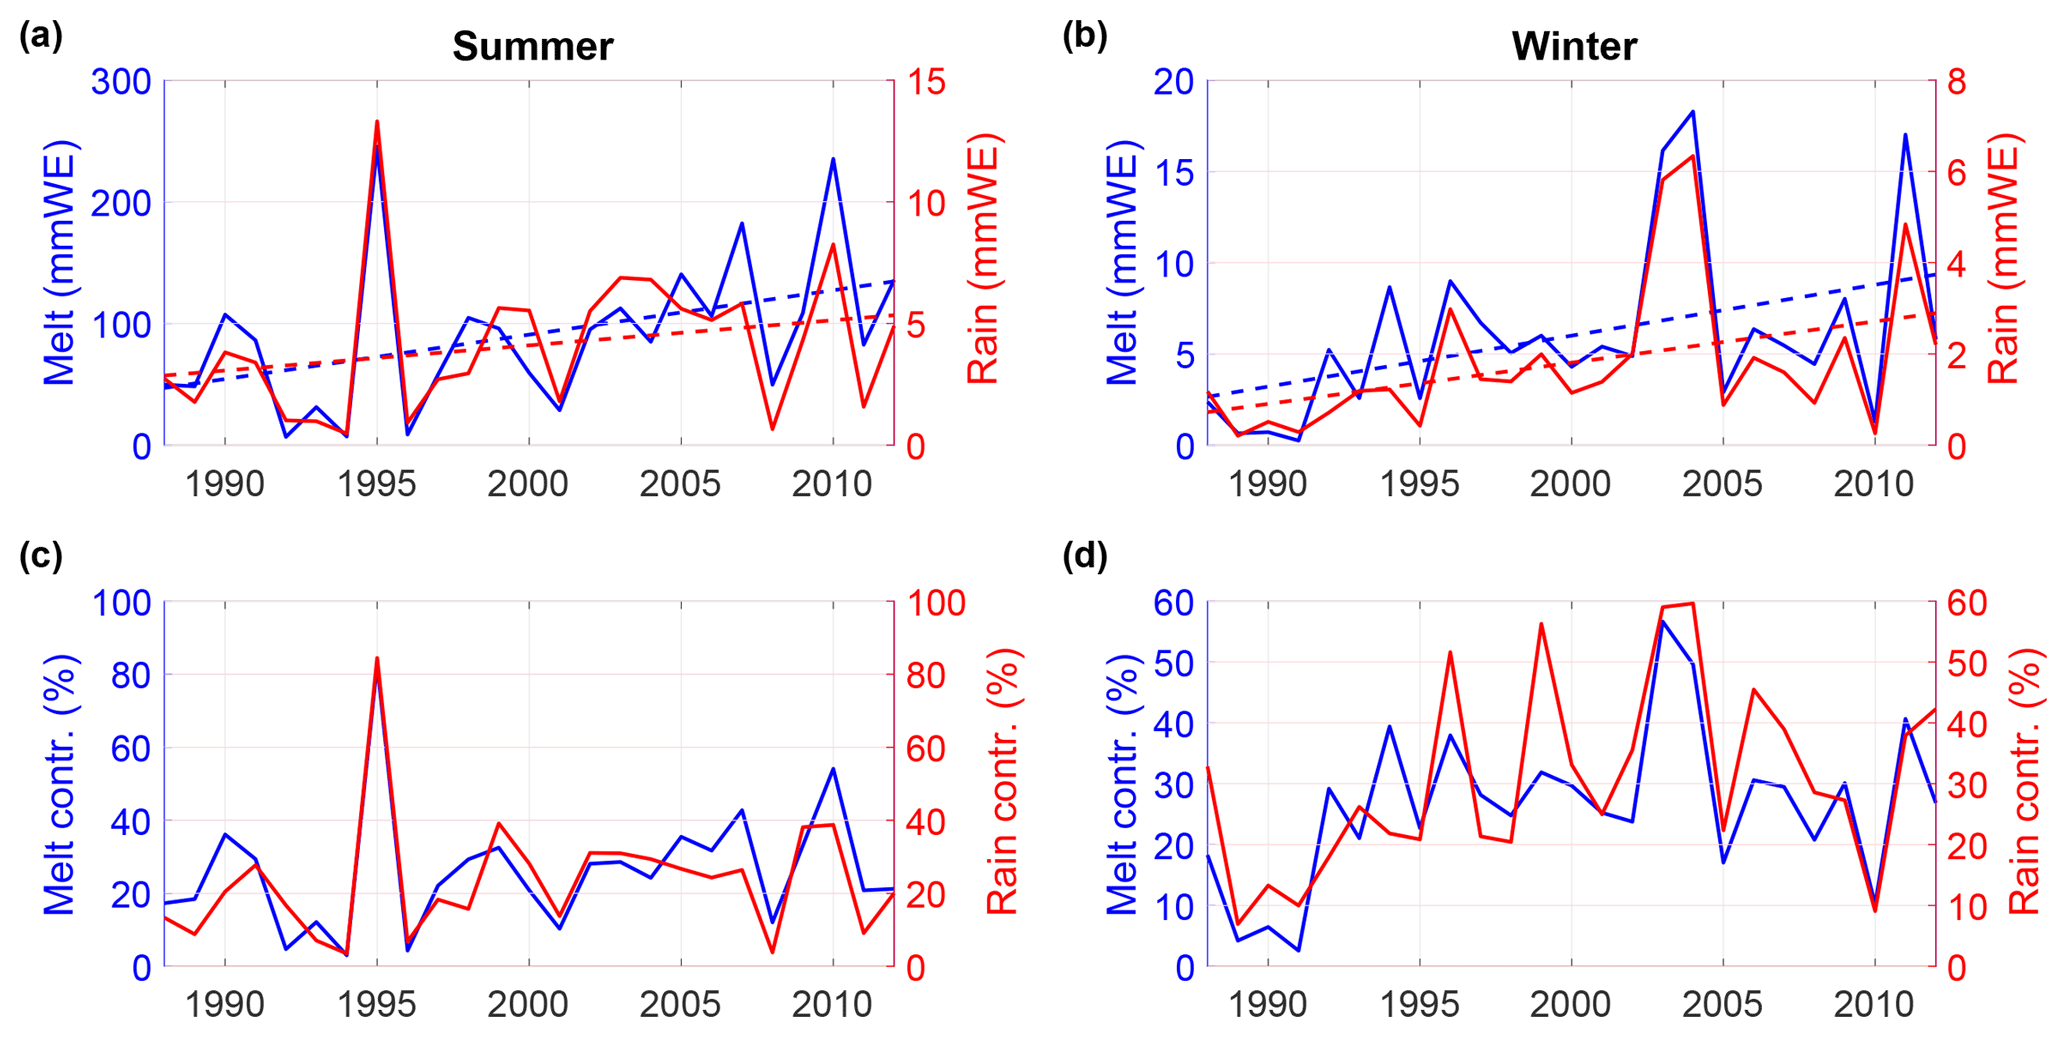
Figure 11(a, b) Net melt and rainfall associated with summer and winter events, where the melting and rainfall have been summed over days −1 to 3 (days −1 to 6 for melting during summer events, Fig. 10). (c, d) Contributions of the melting and rainfall during melt events to the total melt and rainfall in the current season.
By combining remote-sensing-based melt extent data and observations from weather stations, we have shown that surface melt is triggered by cyclonic weather events in summer and winter. Through the advection of heat and moisture over large portions of the ice sheet, these events lead to increases in cloud cover, precipitation, an enhanced absorption of longwave radiation and decreases in the albedo in the south and near the coast. Previous studies have found that cyclonic rainfall events in late summer have accelerated the glacial flow (Doyle et al., 2015), suggesting that the identified melt events can also trigger dynamic instabilities in the ice sheet. Since the efficiency of the glacial flow was critically determined by the seasonal condition of the subglacial drainage system (Doyle et al., 2015), we mostly expect melt events in late summer to have this effect.
The strong, rapid and short-lived character of the temperature increase, the high wind speeds, the precipitation and their frequent occurrence, also excluding summer, distinguish the investigated cyclonic weather events from the anticyclones, centered over Greenland, that have previously been recognized as the main driver of surface melting (Overland et al., 2012; Fettweis et al., 2013; Hanna et al., 2013a, 2016). However, regarding the extended duration of melt events in summer, we surmise that the identified melt triggers can evolve into the previously described persistent high-pressure anomalies, which is supported by studies suggesting that particularly intense and long-lasting atmospheric blocking episodes in summer have been reinforced by cyclones that preceded them (Neff et al., 2014; McLeod and Mote, 2015).
The frequency, amplitude and duration of the initiated melt events have increased over the period 1988–2012, which is mostly attributed to rising air temperatures. In summer, the albedo feedback (Box et al., 2012) and enhanced atmospheric blocking (Hanna et al., 2016) likely contributed to prolonging their duration. While we did not observe a significant increase in the occurrence of the initial melt-triggering, cyclonic moisture intrusions, model projections suggest that they will become more frequent towards the end of this century (Schuenemann and Cassano, 2010). Since the investigated period included warming related to Atlantic multidecadal variability (Straneo and Heimbach, 2013), the temperature and melt event trends were particularly steep, and thus, their slope cannot be taken to be representative of future changes. Still, continuing warming as predicted by state-of-the-art global climate models (Stocker, 2014) is expected to amplify the melting associated with melt events.
A decomposition of the synoptic atmospheric variability over Greenland suggested that the identified, melt-triggering weather pattern has accounted for ∼40 % of the total precipitation. Yet, the observed increases in the occurrence and areal extent of the initiated melting have led to a more frequent replacement of snow by rain and a northward and upslope shift of the boundary between rain/melting and snowfall, hence changing the balance between Greenland's mass gain and mass loss within a single weather event. Using a regional climate model, we estimated that the melting associated with melt events more than doubled in summer and more than tripled in winter, amounting to ∼28 % of the overall melt. Thus, we conclude that, despite the involved mass gain, year-round precipitation events are contributing to the ice sheet's decline.
All data are publicly available online or can be requested from the Danish Meteorological Institute (DMI), the Programme for Monitoring of the Greenland Ice Sheet (PROMICE), and the Greenland Climate Network (GCNet). References describing the individual datasets are provided in the method section.
The supplement related to this article is available online at: https://doi.org/10.5194/tc-13-815-2019-supplement.
MO and FS conceived the story, MO carried out the data analysis and interpreted the results. All three authors were involved in discussing, revising and writing the paper.
The authors declare that they have no conflict of interest.
The research in this study was funded by NSF OCE-1258823, PLR-1418256 and the
EU Horizon 2020 Programme under the grant agreements 727852 (Blue Action) and
633211 (AtlantOS). We thank the staff from the DMI, GCNet and PROMICE for
providing the weather station observations and, in particular, Dirk van As,
Konrad Steffen and John Capellen for readily responding to questions about
the data. We are further grateful to Xavier Fettweis for distributing the MAR
data.
Edited by: Xavier Fettweis
Reviewed by: two anonymous referees
Andersen, M. L., Stenseng, L., Skourup, H., Colgan, W., Khan, S. A., Kristensen, S. S., Andersen, S. B., Box, J. E., Ahlstrøm, A. P., Fettweis, X., and Forsberg, R.: Basin-scale partitioning of Greenland ice sheet mass balance components (2007–2011), Earth Planet. Sc. Lett., 409, 89–95, 2015. a
Bennartz, R., Shupe, M. D., Turner, D. D., Walden, V. P., Steffen, K., Cox, C. J., Kulie, M. S., Miller, N. B., and Pettersen, C.: July 2012 Greenland melt extent enhanced by low-level liquid clouds, Nature, 496, 83–86, 2013. a
Böning, C. W., Behrens, E., Biastoch, A., Getzlaff, K., and Bamber, J. L.: Emerging impact of Greenland meltwater on deepwater formation in the North Atlantic Ocean, Nat. Geosci., 9, 523–528, 2016. a
Bonne, J.-L., Steen-Larsen, H. C., Risi, C., Werner, M., Sodemann, H., Lacour, J.-L., Fettweis, X., Cesana, G., Delmotte, M., Cattani, O., Vallelonga, P., Kjaer, H. A., Clerbaux, C., Sveinbjörnsdóttir, Á. E., and Masson-Delmotte, V.: The summer 2012 Greenland heat wave: In situ and remote sensing observations of water vapor isotopic composition during an atmospheric river event, J. Geophys. Res.-Atmos., 120, 2970–2989, 2015. a
Box, J. E., Fettweis, X., Stroeve, J. C., Tedesco, M., Hall, D. K., and Steffen, K.: Greenland ice sheet albedo feedback: thermodynamics and atmospheric drivers, The Cryosphere, 6, 821–839, https://doi.org/10.5194/tc-6-821-2012, 2012. a, b, c
Cappelen, J. (Ed.), Laursen, E. V., Kern-Hansen, C., Boas, L., Riddersholm Wang, P., Jørgensen, B. V., and Carstensen, L. S.: Weather observations from Greenland 1958–2013, Technical Report Number: 14-08, 1–24, 2014. a
Cuffey, K. M. and Marshall, S. J.: Substantial contribution to sea-level rise during the last interglacial from the Greenland ice sheet, Nature, 404, 591–594, 2000. a
Dee, D. P., Dick, P., Uppala, S. M., Simmons, A. J., Berrisford, P., Poli, P., Kobayashi, S., Andrae, U., Balmaseda, M. A., Balsamo, G., Bauer, P., Bechtold, P., Beljaars, A. C. M., van de Berg, L., Bidlot, J., Bormann, N., Delsol, C., Dragani, R., Fuentes, M., Geer, A. J., Haimberger, L., Healy, S. B., Hersbach, H., Hólm, E. V., Isaksen, L., Kallberg, P., Köhler, M., Matricardi, M., McNally, A. P., Monge-Sanz, B. M., Morcrette, J.-J., Park, B.-K., Peubey, C., de Rosnay, P., Tavolato, C., Thépaut, J.-N., and Vitart, F.: The ERA-Interim reanalysis: Configuration and performance of the data assimilation system, Q. J. Roy. Meteor. Soc., 137, 553–597, 2011. a
Doyle, S. H., Hubbard, A., Van DeWal, R. S.W., van As, D., Scharrer, K., Meierbachtol, T. W., Smeets, P. C. J. P., Harper, J. T., Johansson, E., Mottram, R. H., Mikkelsen, A. B., Wilhelms, F., Patton, H., Christoffersen, P., and Hubbard, B.: Amplified melt and flow of the Greenland ice sheet driven by late-summer cyclonic rainfall, Nat. Geosci., 8, 647–653, 2015. a, b
Enderlin, E. M., Howat, I. M., Jeong, S., Noh, M.-J., Angelen, J. H., and Broeke, M. R.: An improved mass budget for the Greenland ice sheet, Geophys. Res. Lett., 41, 866–872, 2014. a
Fausto, R. S., As, D., Box, J. E., Colgan, W., Langen, P. L., and Mottram, R. H.: The implication of non-radiative energy fluxes dominating Greenland ice sheet exceptional ablation area surface melt in 2012, Geophys. Res. Lett., 43, 2649–2658, https://doi.org/10.1002/2016GL067720, 2016. a
Fettweis, X., Hanna, E., Lang, C., Belleflamme, A., Erpicum, M., and Gallée, H.: Brief communication “Important role of the mid-tropospheric atmospheric circulation in the recent surface melt increase over the Greenland ice sheet”, The Cryosphere, 7, 241–248, https://doi.org/10.5194/tc-7-241-2013, 2013. a, b, c
Fettweis, X., Box, J. E., Agosta, C., Amory, C., Kittel, C., Lang, C., van As, D., Machguth, H., and Gallée, H.: Reconstructions of the 1900–2015 Greenland ice sheet surface mass balance using the regional climate MAR model, The Cryosphere, 11, 1015–1033, https://doi.org/10.5194/tc-11-1015-2017, 2017. a
Hanna, E., Huybrechts, P., Cappelen, J., Steffen, K., Bales, R. C., Burgess, E., McConnell, J. R., Peder Steffensen, J., Van den Broeke, M., Wake, L., Bigg, G., Griffiths, M., and Savas, D.: Greenland Ice Sheet surface mass balance 1870 to 2010 based on Twentieth Century Reanalysis, and links with global climate forcing, J. Geophys. Res., 116, D24121, https://doi.org/10.1029/2011JD016387, 2011. a
Hanna, E., Jones, J. M., Cappelen, J., Mernild, S. H., Wood, L., Steffen, K., and Huybrechts, P.: The influence of North Atlantic atmospheric and oceanic forcing effects on 1900–2010 Greenland summer climate and ice melt/runoff, Int. J. Climatol., 33, 862–880, 2013a. a, b, c, d
Hanna, E., Navarro, F. J., Pattyn, F., Domingues, C. M., Fettweis, X., Ivins, E. R., Nicholls, R. J., Ritz, C., Smith, B., Tulaczyk, S., Whitehouse, P. L., and Zwally, H. J.: Ice-sheet mass balance and climate change, Nature, 498, 51–59, 2013b. a
Hanna, E., Fettweis, X., Mernild, S. H., Cappelen, J., Ribergaard, M. H., Shuman, C. A., Steffen, K., Wood, L., and Mote, T. L.: Atmospheric and oceanic climate forcing of the exceptional Greenland ice sheet surface melt in summer 2012, Int. J. Climatol., 34, 1022–1037, 2014. a, b, c
Hanna, E., Cropper, T., Hall, R., and Cappelen, J.: Greenland Blocking Index 1851–2015: a regional climate change signal, Int. J. Climatol., 36, 4847–4861, https://doi.org/10.1002/joc.4673, 2016. a, b, c, d
Howat, I. M., Joughin, I., and Scambos, T. A.: Rapid changes in ice discharge from Greenland outlet glaciers, Science, 315, 1559–1561, 2007. a
Mattingly, K., Mote, T., and Fettweis, X.: Atmospheric river impacts on Greenland Ice Sheet surface mass balance, J. Geophys. Res.-Atmos., 123, 8538–8560, 2018. a
McLeod, J. T. and Mote, T. L.: Assessing the role of precursor cyclones on the formation of extreme Greenland blocking episodes and their impact on summer melting across the Greenland ice sheet, J. Geophys. Res.-Atmos., 120, 12357–12377, 2015. a
Mote, T. L.: Greenland surface melt trends 1973–2007: Evidence of a large increase in 2007, Geophys. Res. Lett., 34, L22507, https://doi.org/10.1029/2007GL031976, 2007. a, b
Neff, W., Compo, G. P., Ralph, M. F., and Shupe, M. D.: Continental heat anomalies and the extreme melting of the Greenland ice surface in 2012 and 1889, J. Geophys. Res.-Atmos., 119, 6520–6536, 2014. a, b
Overland, J. E., Francis, J. A., Hanna, E., and Wang, M.: The recent shift in early summer Arctic atmospheric circulation, Geophys. Res. Lett., 39, L19804, https://doi.org/10.1029/2012GL053268, 2012. a, b, c
Rignot, E. and Kanagaratnam, P.: Changes in the velocity structure of the Greenland Ice Sheet, Science, 311, 986–990, 2006. a
Sasgen, I., van den Broeke, M., Bamber, J. L., Rignot, E., Sørensen, L. S., Wouters, B., Martinec, Z., Velicogna, I., and Simonsen, S. B.: Timing and origin of recent regional ice-mass loss in Greenland, Earth Planet. Sc. Lett., 333, 293–303, 2012. a
Schuenemann, K. C. and Cassano, J. J.: Changes in synoptic weather patterns and Greenland precipitation in the 20th and 21st centuries: 2. Analysis of 21st century atmospheric changes using self-organizing maps, J. Geophys. Res., 115, D05108, https://doi.org/10.1029/2009JD011706, 2010. a
Serreze, M. C. and Barry, R. G.: Processes and impacts of Arctic amplification: A research synthesis, Global Planet. Change, 77, 85–96, 2011. a
Shepherd, A., Ivins, E. R., Geruo, A., Barletta, V. R., Bentley, M. J., Bettadpur, S., Briggs, K. H., Bromwich, D. H., Forsberg, R., Galin, N., Horwath, M., Jacobs, S., Joughin, I., King, M. A., Lenaerts, J. T. M., Li, J., Ligtenberg, S. R. M., Luckman, A., Luthcke, S. B., McMillan, M., Meister, R., Milne, G., Mouginot, J., Muir, A., Nicolas, J. P. Paden, J., Payne, A. J. Pritchard, H., Rignot, E., Rott, H., Sørensen, L. S., Scambos, T. A., Scheuchl, B., Schrama, E. J. O., Smith, B., Sundal, A. V., van Angelen, J. H., van de Berg, W. J., van den Broeke, M. R., Vaughan, D. G., Velicogna, I., Wahr, J., Whitehouse, P. L., Wingham, D. J., Yi, D., Young, D., and Zwally, H. J.: A reconciled estimate of ice-sheet mass balance, Science, 338, 1183–1189, 2012. a
Steffen, K. and Box, J.: Surface climatology of the Greenland ice sheet: Greenland Climate Network 1995–1999, J. Geophys. Res., 106, 33951–33964, 2001. a
Steffen, K., Box, J. E., and Abdalati, W.: Greenland climate network: GC-Net, US Army Cold Regions Reattach and Engineering (CRREL), CRREL Special Report 96-27, 98–103, 1996. a
Stocker, T.: Climate change 2013: the physical science basis: Working Group I contribution to the Fifth assessment report of the Intergovernmental Panel on Climate Change, Cambridge University Press, New York, NY 10013-2473, USA, 2014. a
Straneo, F. and Heimbach, P.: North Atlantic warming and the retreat of Greenland's outlet glaciers, Nature, 504, 36–43, 2013. a
Tedesco, M., Box, J., Cappelen, J., Fausto, R., Fettweis, X., Hansen, K., Mote, T., Sasgen, I., Smeets, C., van As, D., van de Wal, R., and Velicogna, I.: Greenland Ice Sheet [in Arctic Report Card 2017], available at: http://www.arctic.noaa.gov/Report-Card (last access: April 2018), 2017. a
van As, D., Fausto, R. S., Ahlstrøm, A. P., Andersen, S. B., Andersen, M., Citterio, M., Edelvang, K., Gravesen, P., Machguth, H., Nick, F. M., Nielsen, S., and Wiedick, A: Programme for Monitoring of the Greenland Ice Sheet (PROMICE): first temperature and ablation record, Geol. Surv. Den. Greenl., 23, 73–76, 2011. a
van den Broeke, M., Bamber, J., Ettema, J., Rignot, E., Schrama, E., van de Berg, W. J., van Meijgaard, E., Velicogna, I., and Wouters, B.: Partitioning recent Greenland mass loss, Science, 326, 984–986, 2009. a
van den Broeke, M. R., Smeets, C. J. P. P., and van de Wal, R. S. W.: The seasonal cycle and interannual variability of surface energy balance and melt in the ablation zone of the west Greenland ice sheet, The Cryosphere, 5, 377–390, https://doi.org/10.5194/tc-5-377-2011, 2011. a
van den Broeke, M. R., Enderlin, E. M., Howat, I. M., Kuipers Munneke, P., Noël, B. P. Y., van de Berg, W. J., van Meijgaard, E., and Wouters, B.: On the recent contribution of the Greenland ice sheet to sea level change, The Cryosphere, 10, 1933–1946, https://doi.org/10.5194/tc-10-1933-2016, 2016. a
Velicogna, I., Sutterley, T., and Van Den Broeke, M.: Regional acceleration in ice mass loss from Greenland and Antarctica using GRACE time-variable gravity data, Geophys. Res. Lett., 41, 8130–8137, 2014. a