the Creative Commons Attribution 4.0 License.
the Creative Commons Attribution 4.0 License.
 | 28 Nov 2019
Geochemical signatures of pingo ice and its origin in Grøndalen, west Spitsbergen
Nikita Demidov
Sebastian Wetterich
Sergey Verkulich
Aleksey Ekaykin
Hanno Meyer
Mikhail Anisimov
Lutz Schirrmeister
Vasily Demidov
Andrew J. Hodson
Pingos are common features in permafrost regions that form by subsurface massive-ice aggradation and create hill-like landforms. Pingos on Spitsbergen have been previously studied to explore their structure, formation timing and connection to springs as well as their role in postglacial landform evolution. However, detailed hydrochemical and stable-isotope studies of massive-ice samples recovered by drilling have yet to be used to study the origin and freezing conditions in pingos. Our core record of 20.7 m thick massive pingo ice from Grøndalen is differentiated into four units: two characterised by decreasing δ18O and δD and increasing d (units I and III) and two others showing the opposite trend (units II and IV). These delineate changes between episodes of closed-system freezing with only slight recharge inversions of the water reservoir and more complicated episodes of groundwater freezing under semi-closed conditions when the reservoir was recharged. The water source for pingo formation shows similarity to spring water data from the valley with prevalent Na+ and ions. The sub-permafrost groundwater originates from subglacial meltwater that most probably followed the fault structures of Grøndalen and Bøhmdalen. The presence of permafrost below the pingo ice body suggests that the talik is frozen, and the water supply and pingo growth are terminated. The maximum thaw depth of the active layer reaching the top of the massive ice leads to its successive melt with crater development and makes the pingo extremely sensitive to further warming.
Please read the corrigendum first before continuing.
-
Notice on corrigendum
The requested paper has a corresponding corrigendum published. Please read the corrigendum first before downloading the article.
-
Article
(3797 KB)
- Corrigendum
-
Supplement
(635 KB)
-
The requested paper has a corresponding corrigendum published. Please read the corrigendum first before downloading the article.
- Article
(3797 KB) - Full-text XML
- Corrigendum
-
Supplement
(635 KB) - BibTeX
- EndNote


Pingos are widespread landforms that occur within the permafrost zone of the Earth (Grosse and Jones, 2011) and likely on Mars (Burr et al., 2009). The distribution of pingos is closely linked to permafrost history, underground hydrology and climate conditions. Two pingo types are commonly distinguished, which are (1) hydrostatic (closed) system and (2) hydraulic (open) system pingos (van Everdingen, 1998). Hydrostatic pingos form when a distinct volume of pore water in water-saturated deposits is expelled towards the freezing front and freezes. Hydraulic pingos occur where pressurised groundwater inflow from within or below permafrost freezes at the freezing front. Both processes result in a massive-ice body composed of injection (intrusive) and/or segregation ice that heaves the surface and forms conical elevations (Mackay, 1979). Pingos have a characteristic elliptical to circular planar shape reaching diameters of up to several hundred metres and heights of up to several dozen metres.
Pingos are rather well studied in Alaska and Canada in terms of formation (e.g. Mackay, 1962), structure (e.g. Yoshikawa et al., 2006) and distribution (e.g. Jones et al., 2012). Pingo growth and decay rates, pingo age, and past distribution of those landforms have been used for the reconstruction of past periglacial landscape conditions (e.g. Mackay, 1986). Pingo ice and sedimentary inventories were investigated and furthermore employed in palaeoenvironmental reconstructions in the Mackenzie Delta in Canada (Hyvärinen and Ritchie, 1975), on Seward Peninsula in Alaska (Wetterich et al., 2012; Palagushkina et al., 2017), in Siberia (Ulrich et al., 2017; Chizhova and Vasil'chuk, 2018; Wetterich et al., 2018), where they are called bulgunniakhs, and in northern Mongolia (Yoshikawa et al., 2013; Ishikawa and Yamkhin, 2016).
Pingos on Spitsbergen (76 identified pingos by Hjelle, 1993) are commonly attributed to open-system conditions (Liestøl, 1977) and have previously been studied by geophysical techniques (e.g. Ross et al., 2005; Rossi et al., 2018) and combined chemical and physical investigation of the properties of pingo ice (e.g. Yoshikawa, 1993; Yoshikawa and Harada, 1995). Unlike in other permafrost regions, stable isotope properties of the pingo ice were rarely studied on Spitsbergen (Matsuoka et al., 2004).
Yoshikawa and Harada (1995) proposed three formation mechanisms for open-system pingos on Spitsbergen. They differentiate into group I pingos fed by sub-permafrost groundwater along geologic faults, group II pingos fed by artesian flow of migrating subglacial groundwater mainly in river valley positions (in sensu Liestøl, 1977) and group III pingos (in sensu Yoshikawa and Harada, 1995). The group III pingos are found in nearshore environments of postglacial isostatic uplift and fed through small-scale discontinuities such as “groundwater dikes” or taliks in aggrading permafrost within marine deposits (Yoshikawa and Harada, 1995). Yoshikawa and Harada (1995) regard the pingos of the Grøndalen as ancient group III pingos, which formed in Holocene marine sediments quickly after sea regression. However, as Liestøl (1996) recognised,
in connection with formation of pingos there are a great many unsolved questions. Drillings and temperature measurements through the pingo mound and also through the surrounding permafrost are needed before the problems can be better understood.
This is still valid due to the scarcity of data from the inner structure of pingos because of rarely undertaken drilling. To shed light on the Grøndalen pingo formation in comparison to other pingo records from Spitsbergen, we here present the stable isotope and hydrochemical inventories of an entirely cored pingo in Grøndalen near Barentsburg (west Spitsbergen, Fig. 1). Additional data for consideration of postglacial landform evolution in the Grøndalen were obtained from neighbouring sedimentary cores. The aims of our study are (1) to capture the morphometric, cryolithologic and thermic properties of the Grøndalen pingo in comparison to other pingos on Spitsbergen and (2) to reconstruct the formation conditions of the pingo massive ice by applying stable isotope and hydrochemical approaches.
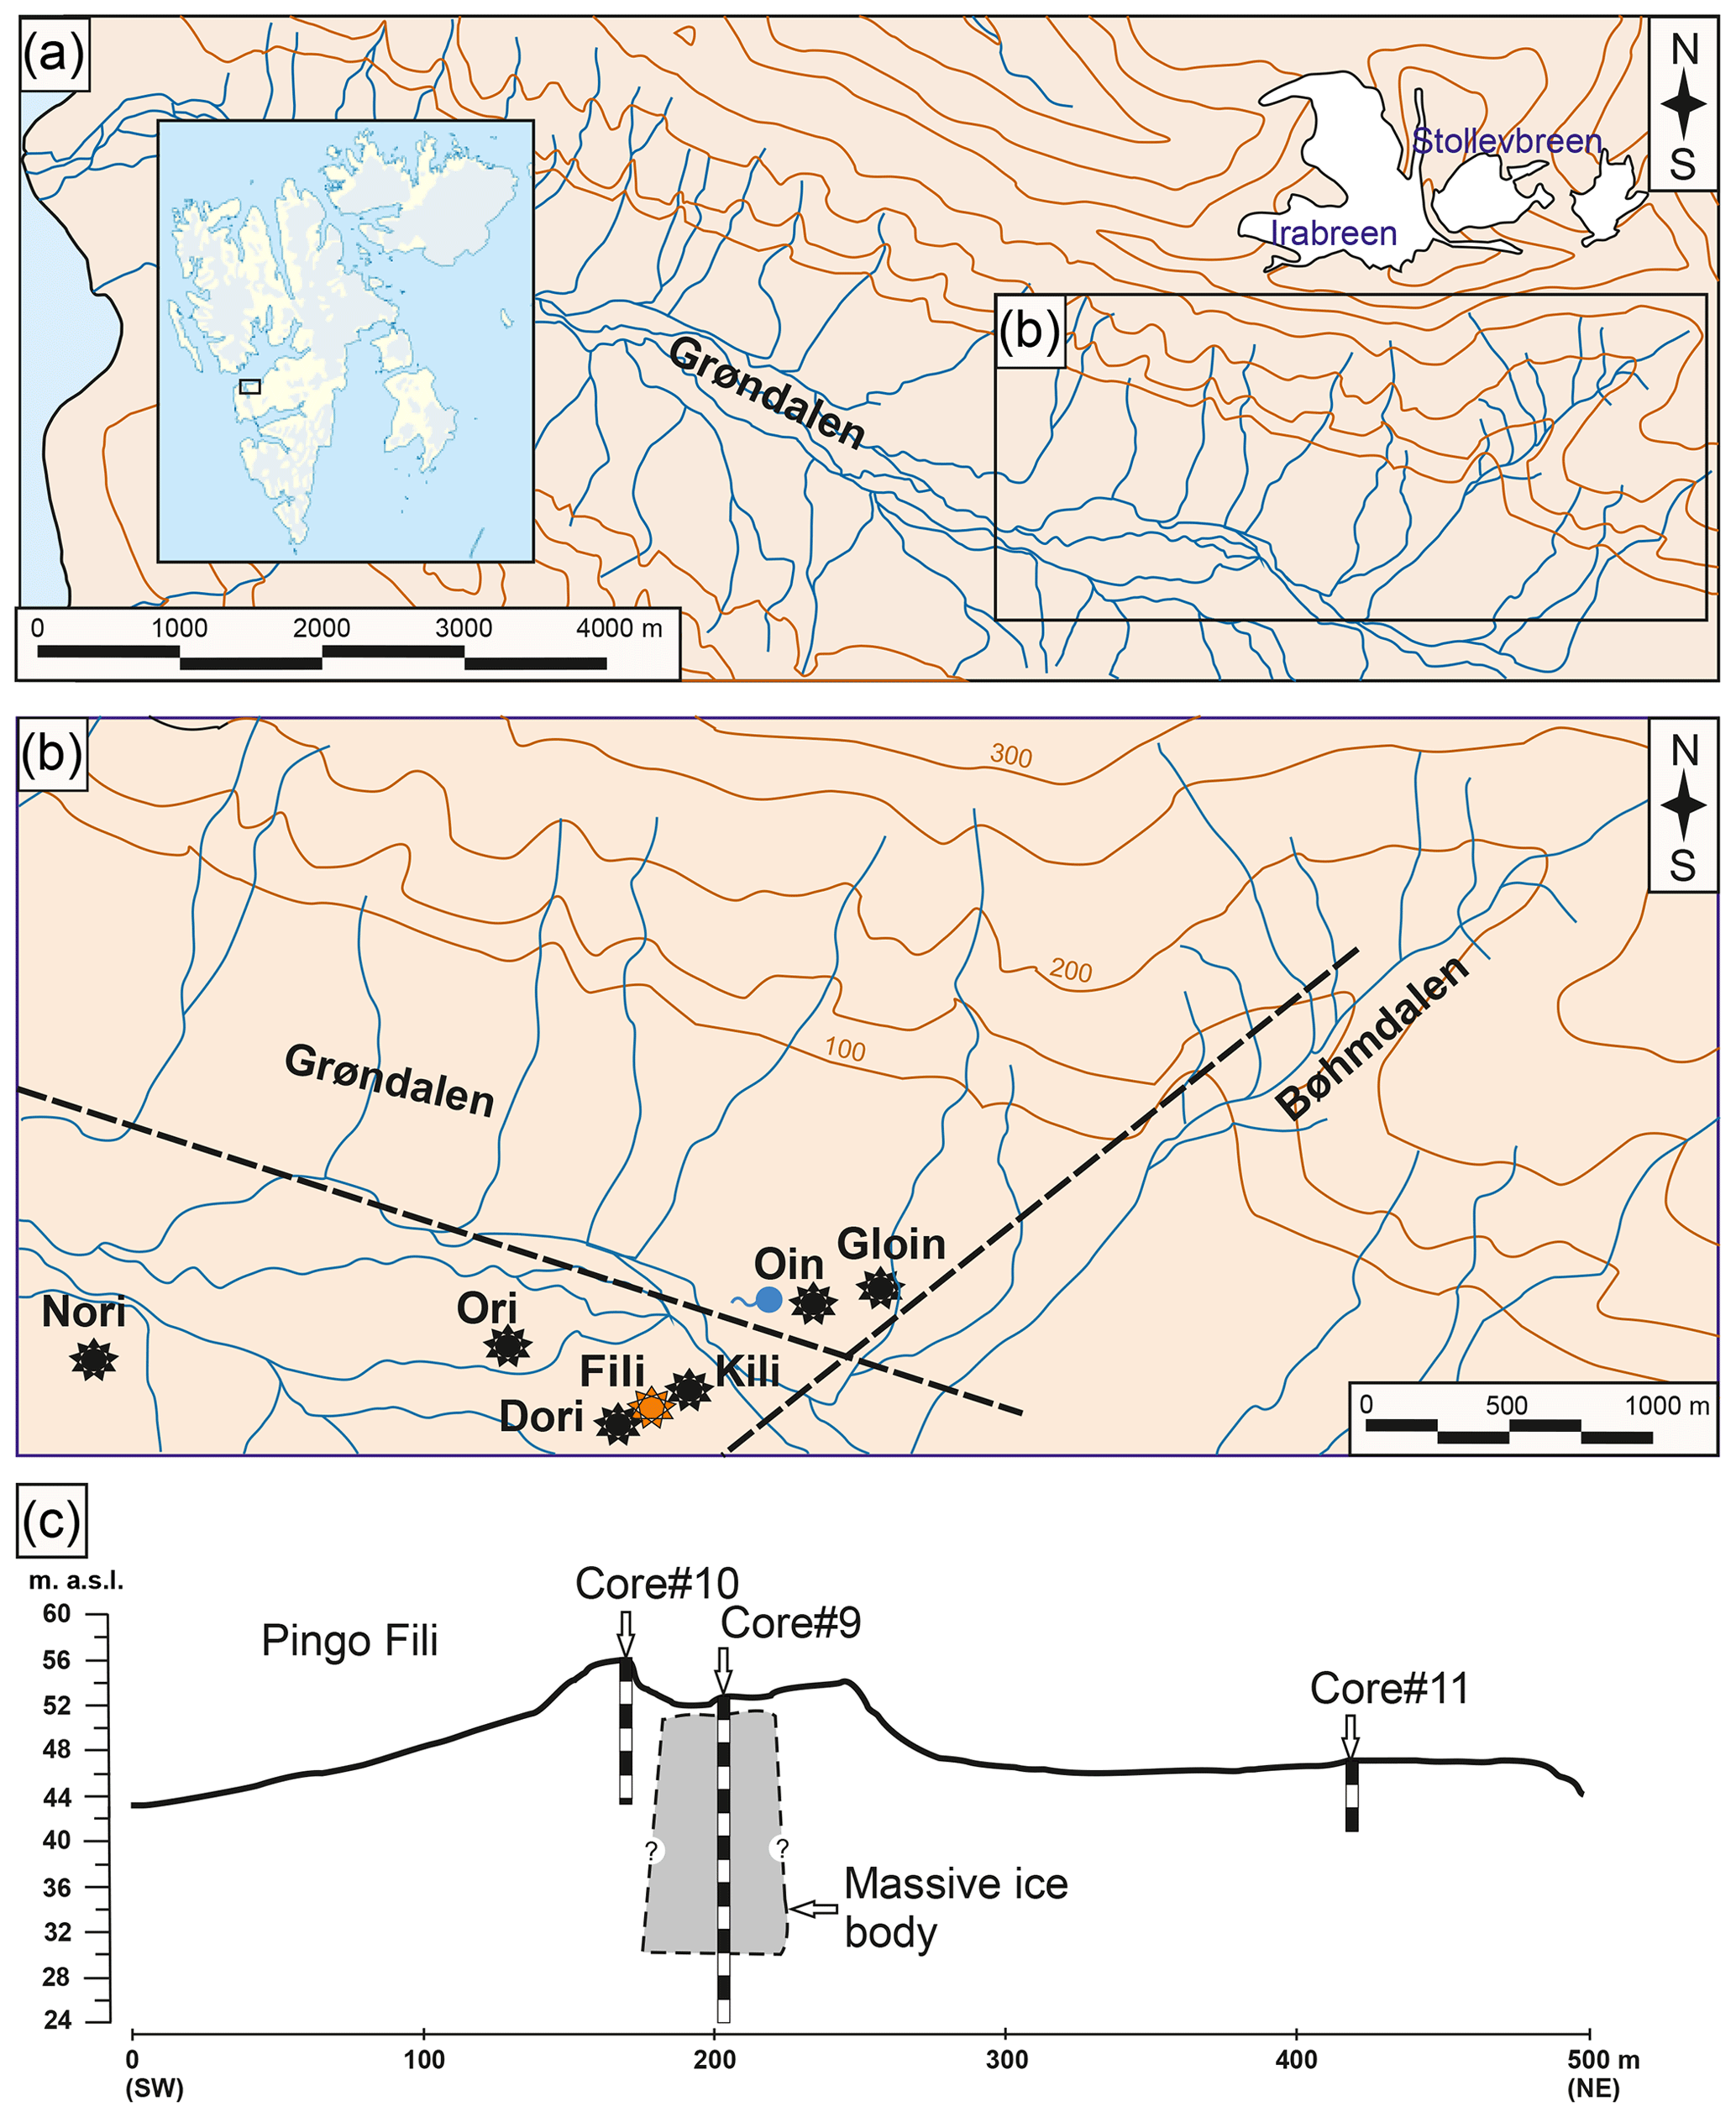
Figure 1Study region of Nordenskiöld Land on west Spitsbergen (inset), showing (a) the position of Grøndalen, (b) the position of seven pingos in Grøndalen (redrawn after https://toposvalbard.npolar.no, last access: 1 April 2019), the spring location (blue circle), and estimated fault locations (dotted lines) and (c) the drilling profile across Fili pingo (shown as an orange star in b) with locations of cores 9, 10 and 11. Please note that the actual lateral extent of the massive pingo ice body is unknown.
The Grøndalen study area on the western coast of Nordenskiöld Land (west Spitsbergen) is at about 10 km southeast of Barentsburg in whose vicinity the Russian Scientific Arctic Expedition on Spitsbergen Archipelago (RAE-S) maintains ground temperature and active-layer monitoring sites of the Global Terrestrial Network for Permafrost (GTN-P) and the Circumpolar Active Layer Monitoring (CALM) programmes (Demidov et al., 2016; Christiansen et al., 2019). Grøndalen is a trough valley in bedrock of Middle Jurassic–Palaeogene argillite and sandstone (Geological map Svalbard, 1991). Late Pleistocene and Holocene deposits in the lower part of Grøndalen reach more than 20 m thickness and likely represent sedimentation since at least the last glacial maximum (Verkulich et al., 2018). The mountains surrounding the valley reach up to 700–800 m above sea level (a.s.l.). The Grøn River is fed by many tributaries, which collect meltwater discharge from small hanging glaciers. In the upper valley two larger glaciers occur, Tavlebreen and Passfjellbreen, as well as their terminal moraines.
The meteorological station in Barentsburg (WMO station 20107) at 75 m a.s.l. recorded a mean annual air temperature of −2.2 ∘C and a mean annual precipitation of 849 mm for 2016–2017. The ground temperatures reach −2.37 ∘C at 15 m depth below surface (b.s.), and the active layer thickness at the CALM site (3 km north of Barentsburg) measured at the end of September 2016 varied from 1.15 to 2.60 m with an average of 1.56 m (Demidov et al., 2016). Permafrost thickness in the Barentsburg area varies along with morphology from 8 to 10 m near the seashore up to 300–450 m in the mountain and upland areas. According to measurements in the central part of Grøndalen the mean annual ground temperature amounts to −3.56 ∘C at a depth of 15 m (borehole 8).
In the central part of Grøndalen, a group of seven pingos occurs, reaching diameters of 150 to 300 m and heights above their surroundings from 6.5 to 12.5 m (Fig. 1b). They are informally named as follows (west to east in Fig. 1b): Nori, Ori, Dori, Fili, Kili, Oin and Gloin after John R. R. Tolkien (1954–1955). The pingo Fili of 9.5 m maximum height (56 m a.s.l.) was chosen for drilling. It shows a clearly defined uppermost water-filled degradation crater of 5.5 m depth. The maximum water depth of the lake was >1 m. At the point of drilling, the ice thickness was 0.15 m. The drilled Fili pingo is connected to Dori pingo and Kili pingo (Fig. 1b) to the northeast and the southwest and its slope shows radial dilation cracks.
3.1 Drilling and ground temperature measurements
The drilling of the Fili pingo in May 2017 started from the surface of the central crater at 52.5 m a.s.l. and reached a depth of 11.5 m b.s. (core 9, 77.99355∘ N, 14.66211∘ E). The borehole was conserved by installing a plastic tube down to 3 m b.s. to prevent meltwater flow from the active layer during thaw season and tightly closed by a lid to prevent rain or snow input. However, the first 0.5 m core of the re-drilling in spring 2018 was neglected to account for any unexpected contamination. The drilling was continued in the same borehole down to a depth of 25 m b.s. The drilling position on top of the pingo was chosen in its centre to assure that the centroid of the pingo ice body was captured in the core. The coring angle was held vertical. Additional cores were drilled on the pingo top reaching a depth of 12 m (core 10, from 56 m a.s.l., 77.99332∘ N, 14.66114∘ E) and in the pingo surroundings reaching a depth of 6 m (core 11, from 47 m a.s.l., 77.99531∘ N, 14.66538∘ E). Continuous temperature measurements in borehole 9 on Fili pingo were installed on 15 May 2018 using a 15 m long GeoPrecision logger chain (M-Log5W cable) equipped with sensors every 0.75 m. The cores were obtained with a portable gasoline-powered rotary drilling rig (UKB 12/25, Vorovskiy Machine Factory, Ekaterinburg, Russia) that allows us to perform operations without impact on the ecosystem. The device uses no drilling fluid and relies on maintaining the frozen condition of the core for stratigraphic integrity and to prevent downhole contamination of the biogenic and sedimentological characteristics of the core. Core diameters were 109 mm for the upper parts and 73 mm for the lower ones. The core pieces were lifted to the surface every 30–50 cm. After documentation and cryolithological description (French and Shur, 2010) core pieces were sealed. The ice and permafrost deposits were sampled from within intervals of about 0.5 to 1 m for hydrochemical and stable isotope analysis. Ice samples were kept frozen for transportation while sediment samples were kept unfrozen.
To obtain spring water samples at the foot of the Oin pingo near the right bank of the Grøn River, drilling was performed through ca. 1 m of ice to pressurised water beneath an ice blister that formed at the spring source on 20 April 2018. Samples were then taken of the water discharging through the 5 cm drill hole.
3.2 Mapping
The topographic mapping on 21 August 2018 covered an area of 0.25 km2 using Global Navigation Satellite System (GNSS) Sokkia GRX2 devices and an Archer 2 base station. The obtained coordinates have planar accuracy of 1.5 cm and altitude accuracy of 2.5 cm.
3.3 Stable water isotopes
The concentration of ground ice water isotopes (δD and δ18O) was measured at the Climate and Environmental Research Laboratory (CERL, AARI St. Petersburg, Russia) using a Picarro L2120-i analyser. The working standard (SPB-2), measured after every five samples, was made of the distilled St. Petersburg tap water and calibrated against the IAEA standards VSMOW-2, GISP and SLAP-2. The reproducibility of results defined by remeasurements of randomly chosen samples was 0.08 ‰ for δ18O and 0.4 ‰ for δD, which is 2 orders of magnitude less than the common natural variability of the pingo ice isotopic composition and thus satisfactory for the purposes of the study. Additional samples from surface waters (Grøn River and tributaries) and precipitation (2016–2017) were likewise analysed and are presented in detail by Skakun et al. (2020). Samples from Grøndalen spring water were collected as unfiltered 20 mL aliquots in a screw-top HDPE bottle and analysed six times using a Picarro V 1102-I and a 2.5 µL injection volume with a precision error of 0.1 ‰ for δ18O and 0.3 ‰ for δD. The δ18O and δD values are given as per mil (‰) difference from the Vienna Standard Mean Ocean Water (VSMOW). The deuterium excess (d) is calculated as (Dansgaard, 1964).
3.4 Hydrochemistry
Sedimentary permafrost samples of cores 9, 10 and 11 were dried and sieved at 1 mm at the analytical laboratory of RAE-S, Barentsburg. Afterwards about 20 g of the dry sediment was suspended in 100 mL deionised water and filtered through 0.45 µm nylon mesh within 3 min after stirring to estimate the ion content after water extraction. Electrical conductivity (EC measured in microsiemens per centimetre) and pH values were estimated with a Mettler Toledo Seven Compact S220. EC values were transformed automatically by the instrument into general ion content values given in milligrammes per litre. Major anions and cations in the water extracts were analysed by ion chromatography (Shimadzu LC-20 Prominence) equipped with the conductometric detector Shimadzu CDD-10AVp and ion exchange columns for anions (Phenomenex STAR-ION A300) and for cations (Shodex ICYS-50). Likewise melted pingo ice samples from core 9, snow and Grøn River water were analysed for pH, EC and ion composition after filtration through 0.45 µm nylon mesh (Skakun et al., 2020). Spring water analysis of anions Cl−, , and employed a Dionex ICS90 ion chromatography module calibrated in the range 0–2 mg L−1 for and and in the range 0–50 mg L−1 for Cl− and (which required dilution). Precision errors were between 0.9 % () and 1.6 % (), whilst the detection limit (3 times the standard deviation of 10 blanks) was ≤0.05 mg L−1. Alkalinity was deduced by headspace analysis of an acidified (pH 1.7) sample of 10 mL immediately after return to the laboratory using a PP Systems EGM-4 infrared gas analyser (precision errors 4.5 %). Immediately in the field, the spring water outflow was analysed using Hach HQ40D meters for electrical conductivity and pH by gel electrode. To prevent the electrodes from freezing, this water was also injected by syringe into a preheated flow cell, which maintained the water at about 7 ∘C. EC values in microsiemens per centimetre were transformed into general ion content values given as milligrammes per litre by multiplication by 0.65.
4.1 Ground temperature
The ground temperatures in borehole 9 on 12 September 2018 are shown in Fig. 2. At the lowermost sensor at 14.25 m b.s. the ground temperature reached −2.5 ∘C and varied at the same depth between −2.5 and −2.37 ∘C in the period from 15 May to 12 September 2018. The 0 ∘C point was observed at 1.5 m b.s. at the upper border of the massive pingo ice, showing that the active-layer maximum depth reached the massive ice on 12 September 2018.
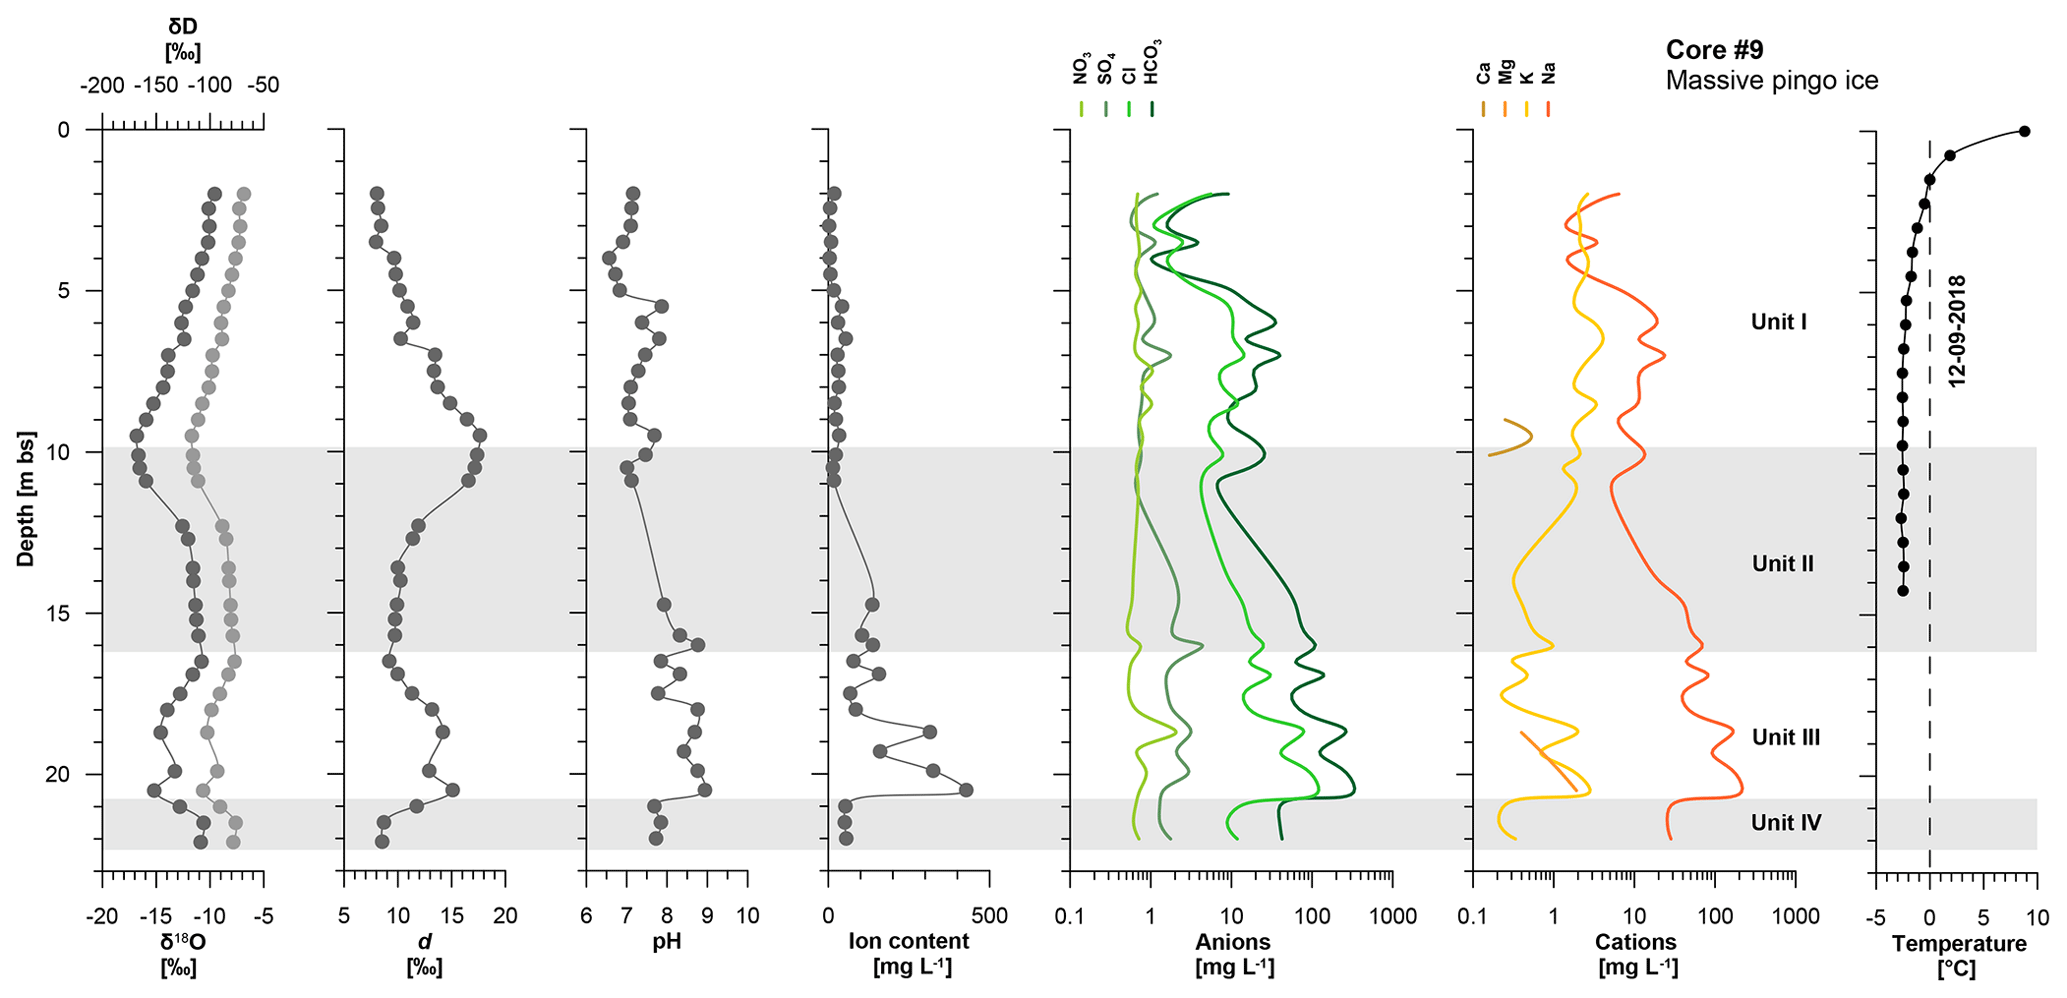
Figure 2Isotopic and hydrochemical composition of the massive ice of Fili pingo obtained from core 9 as well as thermometric data from the borehole on 12 September 2018. Light grey symbols in the first plot refer to the upper x axis (δD). Data are given in Tables 1 and 2.
Table 1Stable isotope (δ18O, δD, and d) minimum, mean, maximum values, standard deviations (SD), slopes, intercept and correlation coefficient (r2) of δ18O–δD and δD–d plots from massive pingo ice of core 9, from intrasedimental ice of core 10 and from precipitation (2016–2018). Data are shown in Fig. 3. Additional data from 2018 include spring water of Grøndalen and river and tributary water of the Grøn River (Skakun et al., 2020).
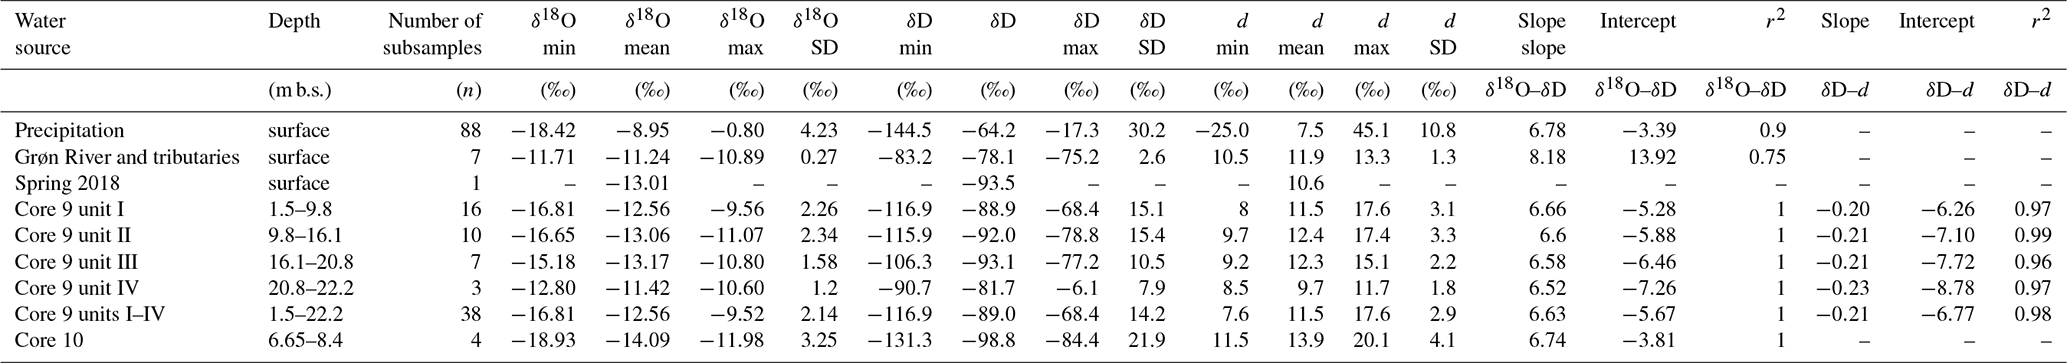
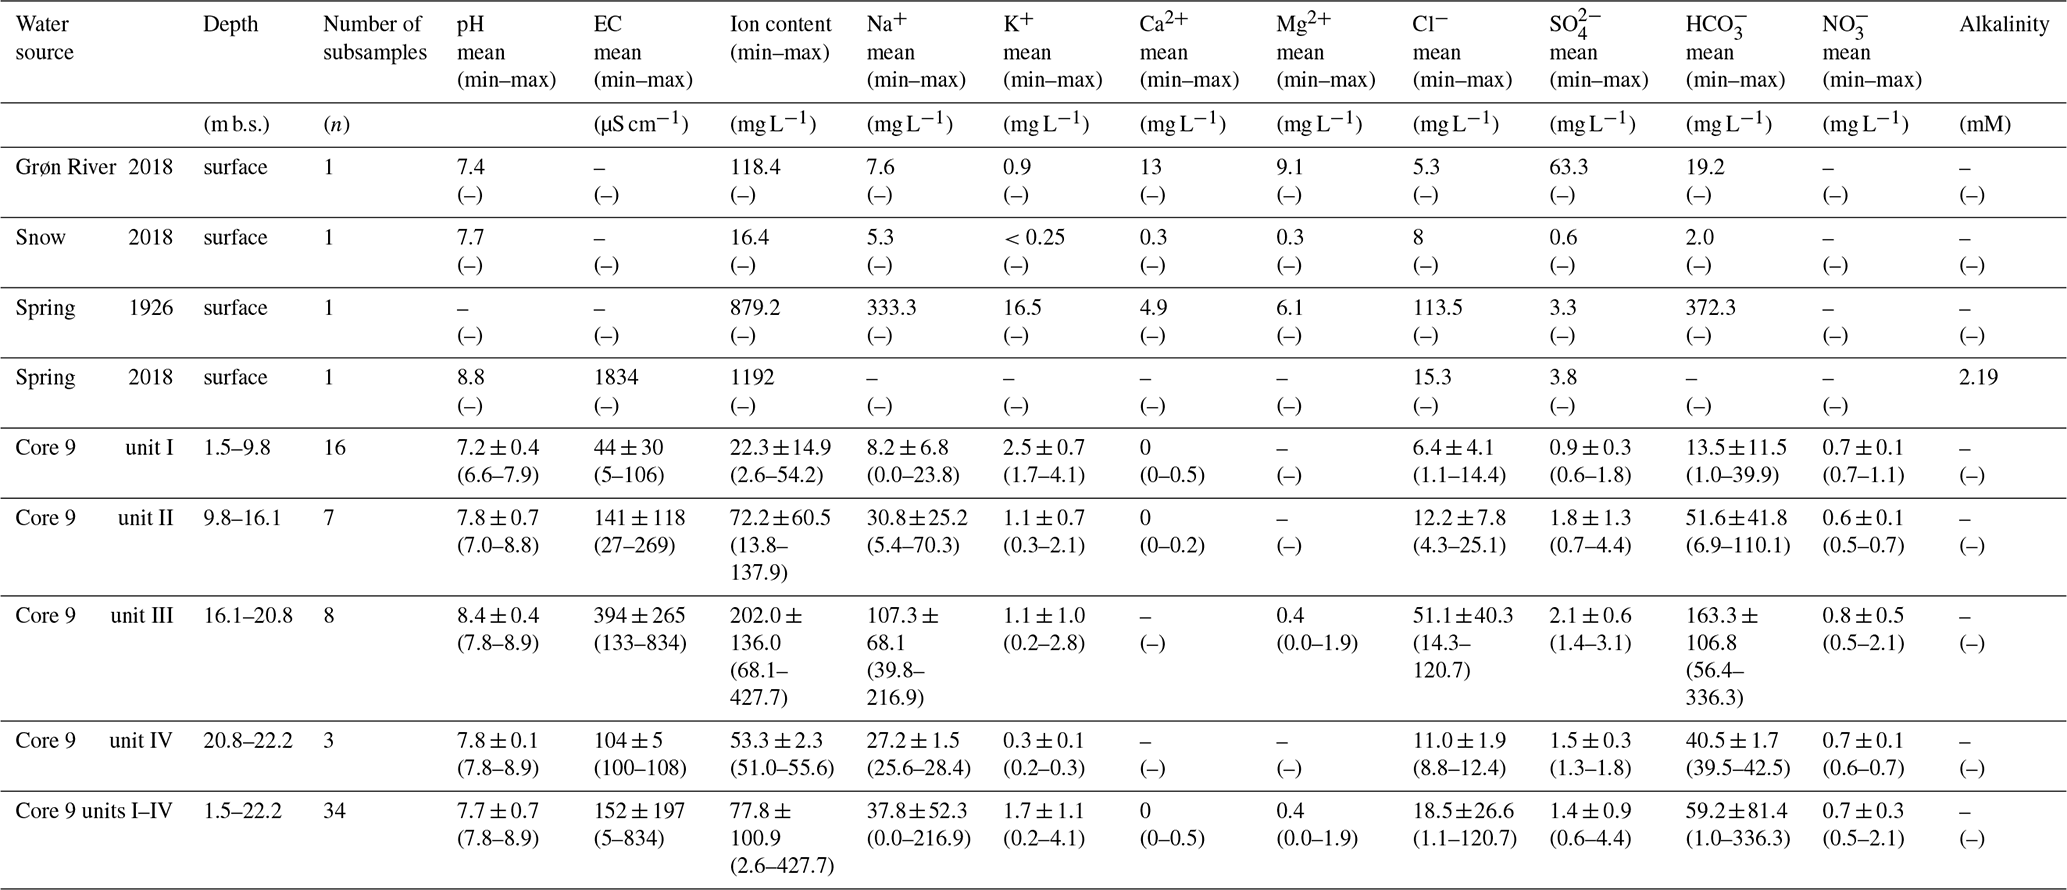
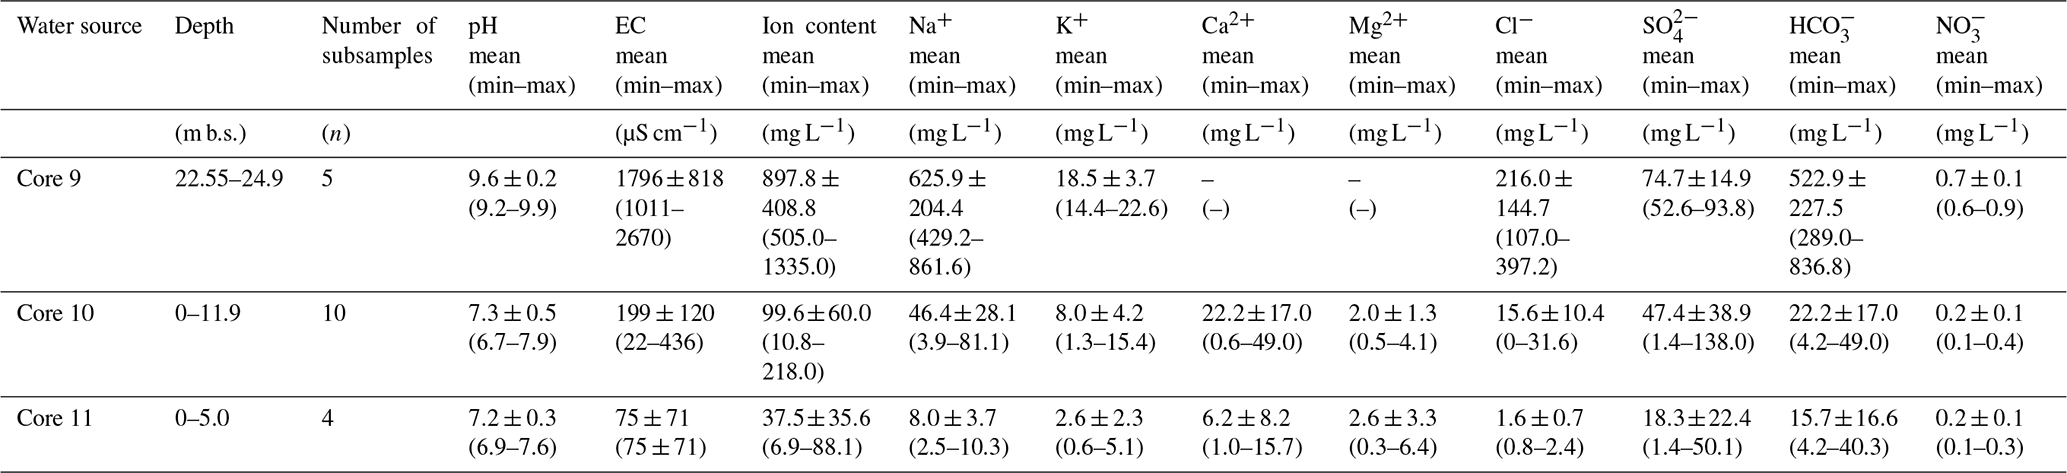
Table 2Hydrochemical composition of the massive pingo ice of core 9 given as mean (±SD), minimum and maximum values per unit. Data are shown in Fig. 2. Additional data include spring water of Grøndalen from 1926 (Orvin, 1944) and 2018 (this study), snow from 2016 to 2018, and river and tributary water of the Grøn River (Skakun et al., 2020).
4.2 Cryolithology
4.2.1 Core 9
The 25 m long core 9 drilled from the pingo top crater exposed cover and basal sedimentary horizons enclosing massive pingo ice (Fig. S1 in the Supplement). From 0 to 1.5 m b.s. gravelly loam was found, which is assumed to originate from the pingo top and moved downslope by cryoturbation and solifluction. Below this redeposited cover layer from 1.5 to 12 m b.s. transparent massive ice without any inclusions is observed. The visible air bubble content reaches up to 10 percent per volume (vol %) in single ice layers. In this particular layer and in all other layers of pingo massive ice, bubbles are spherical and irregularly distributed. Most common are bubbles with diameters near 1 mm but some bubbles reach diameters up to 5 mm. Between 12 and 22.2 m b.s. the pingo ice remains transparent but contains layers with 1–2 to 10–20 mm long large, dark silty flakes in subvertical orientation (up to 0.5 vol %). Alternating layers include rounded air bubbles (up to 10 vol %). The total thickness of the massive pingo ice amounts to 20.7 m. Its lower contact to the basal deposits is well defined in the core. Massive pingo ice near the contact was not rich in air bubbles and had a small admixture of previously mentioned dark silty flakes. The lowermost part of the massive pingo ice in core 9 was found at a depth of 22.2 m b.s. Below down to a depth of 25 m b.s. dark clay with regular reticulate and irregular reticulate cryostructures (ice lenses 2 to 20 mm thick) was found in the core. At 23.8–24.3 m b.s. ice lenses were absent but 2–4 mm long lenses of black clay material were present. At 22.3–23.5 m b.s. and at 23.7–23.8 m b.s. layers of transparent ice without inclusions and without air bubbles were found.
4.2.2 Core 10
Core 10 drilled on top of the crater rim down to 12 m b.s. exposes sedimentary horizons (Fig. S1). The uppermost part from 0 to 2.5 m b.s. includes the modern top soil at 0 to 0.1 m b.s. with living shrub material and a buried soil formation at 0.25 to 0.4 m b.s. with decomposed similar shrub material. The minerogenic material is characterised by fine sand and loam including gravel. The cryostructures are wavy lenticular with ice lenses up to 2 cm thick. Toward 2.5 m b.s. the clay content increases as the gravel content decreases. From 2.5 to 12 m b.s., the clay shows subhorizontal lenticular cryostructures up to 2 cm thick and includes ice-oversaturated deposits and ice with an admixture of clay at 4.7–5.9 m b.s., at 6.65–7.05 m b.s. and at 8.2–8.6 m b.s., although the massive ice of the pingo was not reached. This ice and ice-oversaturated deposits also contain sporadic gravel particles. In the layer 8.2–8.6 m ice contained up to 10 vol % of spherical air bubbles with a diameter close to 1 mm. At 5.9 to 6.2 m b.s. a layer of sand and gravel (up to 3 cm in diameter) with organic remains is observed.
4.2.3 Core 11
Core 11 was drilled in the surroundings of the pingo and reached a depth of 6 m b.s. and is composed of gravelly sand and loam with structureless cryostructures (Fig. S1).
4.3 Isotopic and hydrochemical properties of the massive pingo ice and spring water
According to trends in stable water isotopic composition of the massive ice obtained in core 9, four units are distinguished, which are unit I to unit IV (Fig. 2; Table 1).
Unit I (1.1–9.8 m b.s.) shows a down-core decreasing trend in δ18O and δD from −9.6 to −16.8 ‰ and from −68 to −117 ‰, respectively, while the d increases from 8 to 18 ‰. Small inversions are notable at depths of 3.5 and 6.5 m b.s. (Fig. 2). The freezing of unit I is clearly expressed by δ18O–δD and δD–d slopes of 6.7 and −0.2, respectively (Fig. 3). The ion composition of unit I is dominated by Na+ and K+ in cations and Cl− and in anions. Variations in total ion content (mean 22 mg L−1) are triggered by variations in Na+ (0–24 mg L−1), Cl− (1–14 mg L−1) and (1–40 mg L−1) concentrations (Fig. 2, Table 2) while and contents vary little around 1 mg L−1 each. Ca2+ occurs solely in the lowermost part of unit I with low concentration. The pH varies between 6.6 and 7.9.
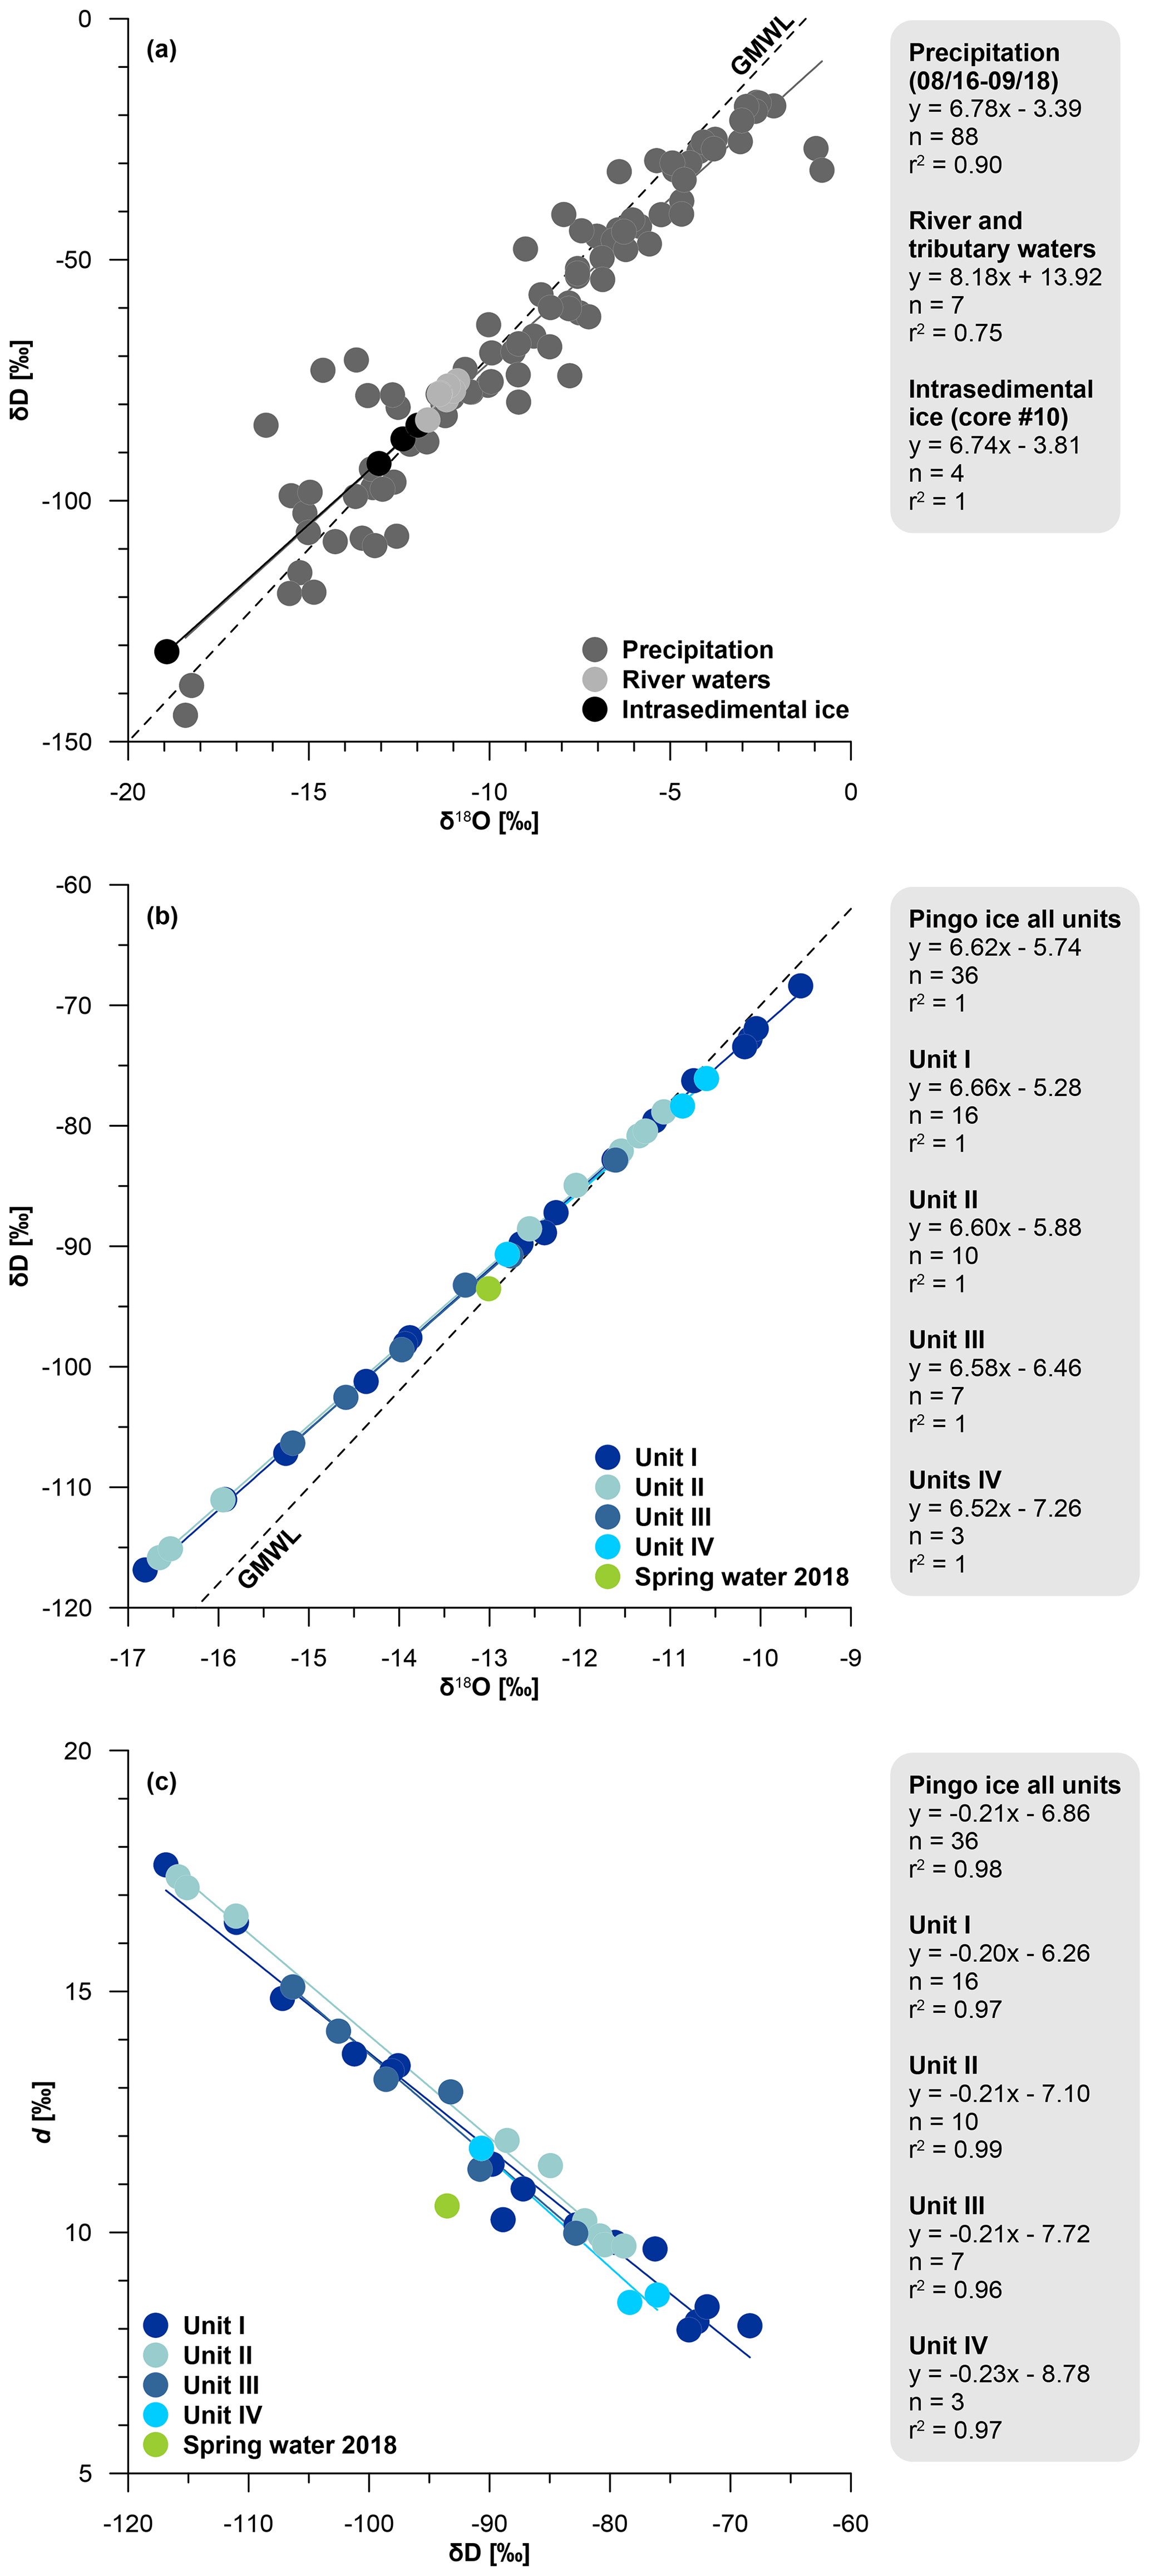
Figure 3Co-isotopic plots of (a) δ18O and δD in modern precipitation (August 2016–September 2018) and water of the Grøn River and its tributaries (Skakun et al., 2020), (b) δ18O and δD in massive ice of core 9 from pingo and from spring water sampled, and (c) δD and deuterium excess (d) data in massive ice of core 9 from pingo and from spring water. Data are given in Table 1. Note different axis scales in (a) and (b).
The isotopic composition of the pingo ice in unit II (9.8–16.1 m b.s.) exhibits the opposite pattern down-core as in unit I with an increasing trend in δ18O and δD from −16.7 ‰ to −11.1 ‰ and from −116 ‰ to −79 ‰, respectively, while the d decreases from 17 ‰ to 10 ‰, reaching almost the isotopic composition of the upper part of unit I (Fig. 2). The δ18O–δD slope of 6.6 is slightly lower than in unit I while the δD–d slope of −0.2 is very close to that of unit I (Fig. 3). The pH increases down-core from 7 to 8.8 as the ion content increases from 14 to 138 mg L−1 (mean 72 mg L−1, Table 2). The latter correlates to increasing concentrations of Na+, Cl−, and , while remains almost stable and K+ decreases (Fig. 2).
The stable isotope composition of unit III (16.1–20.8 m b.s.) resembles that of unit I with δ18O and δD decreasing down-core from −10.8 ‰ to −15.2 ‰ and from −77 ‰ to −106 ‰, respectively. The d increases from 9 ‰ to 15 ‰. An inversion occurs at a depth of 19.9 m b.s. (Fig. 2). The δ18O–δD and δD–d slopes are almost the same as in unit II with values of 6.6 and −0.2, respectively (Fig. 3). The ion content reaches the highest values up to 428 mg L−1 (mean of 202 mg L−1, Table 2) in the lower part of unit III due to increased Na+, Cl− and concentrations, where Mg also occurs (Fig. 2). The pH varies between 7.8 and 8.9.
The lowermost unit IV (20.8–22.2 m b.s.) shows a similar down-core increase in δ18O and δD and decrease in d (Fig. 2) as unit II. The slopes of δ18O–δD (−7.26) and δD–d (−0.23) are the lowest all-pingo ice units (Fig. 3). The mean ion content of 53 mg L−1 is low (Table 2) due to largely reduced Na+, K+, and Cl− concentration (Fig. 2). The mean pH amounts to 7.8.
The overall pattern of the down-core isotopic composition of the pingo ice differentiates into two modes of decreasing δ18O and δD and increasing d in units I and III and the opposite trends in units II and IV. The contents of Na+, Cl− and ions increase from units I to III, while K+ decreases from units I to II and increases again in unit III. and show rather low variation, and Mg2+ and Ca2+ occur only occasionally with concentrations above 0.25 mg L−1.
The spring water sampled in the vicinity of the Oin pingo in 2018 is characterised by δ18O of −13.01 ‰, δD of −93.5 ‰ and d of 10.6 ‰ (Table 1). The ion content amounts to 1192 mg L−1, with predominance of in anions (as indicated by the high alkalinity 2.2 mM L−1), while Cl− and are found in concentrations of 15.3 and 3.8 mg L−1, respectively. The pH in the spring amounts to 8.8 (Table 2).
4.4 Hydrochemical properties of sedimentary water extracts
4.4.1 Core 9
The hydrochemical signature of deposits underlying the massive ice of the pingo at 22.2 to 25 m b.s. is notable for high ion content reaching up to 1335 mg L−1 and the prevalence of Na+ and ions (Fig. 4a, Table 3). Distinct ion content variations are driven by Na+ and K+ cations and and Cl− anions. Ca2+ and Mg2+ have not been found and the anion composition resembles that of unit III. The pH is alkaline and varies between 9.2 and 9.9.
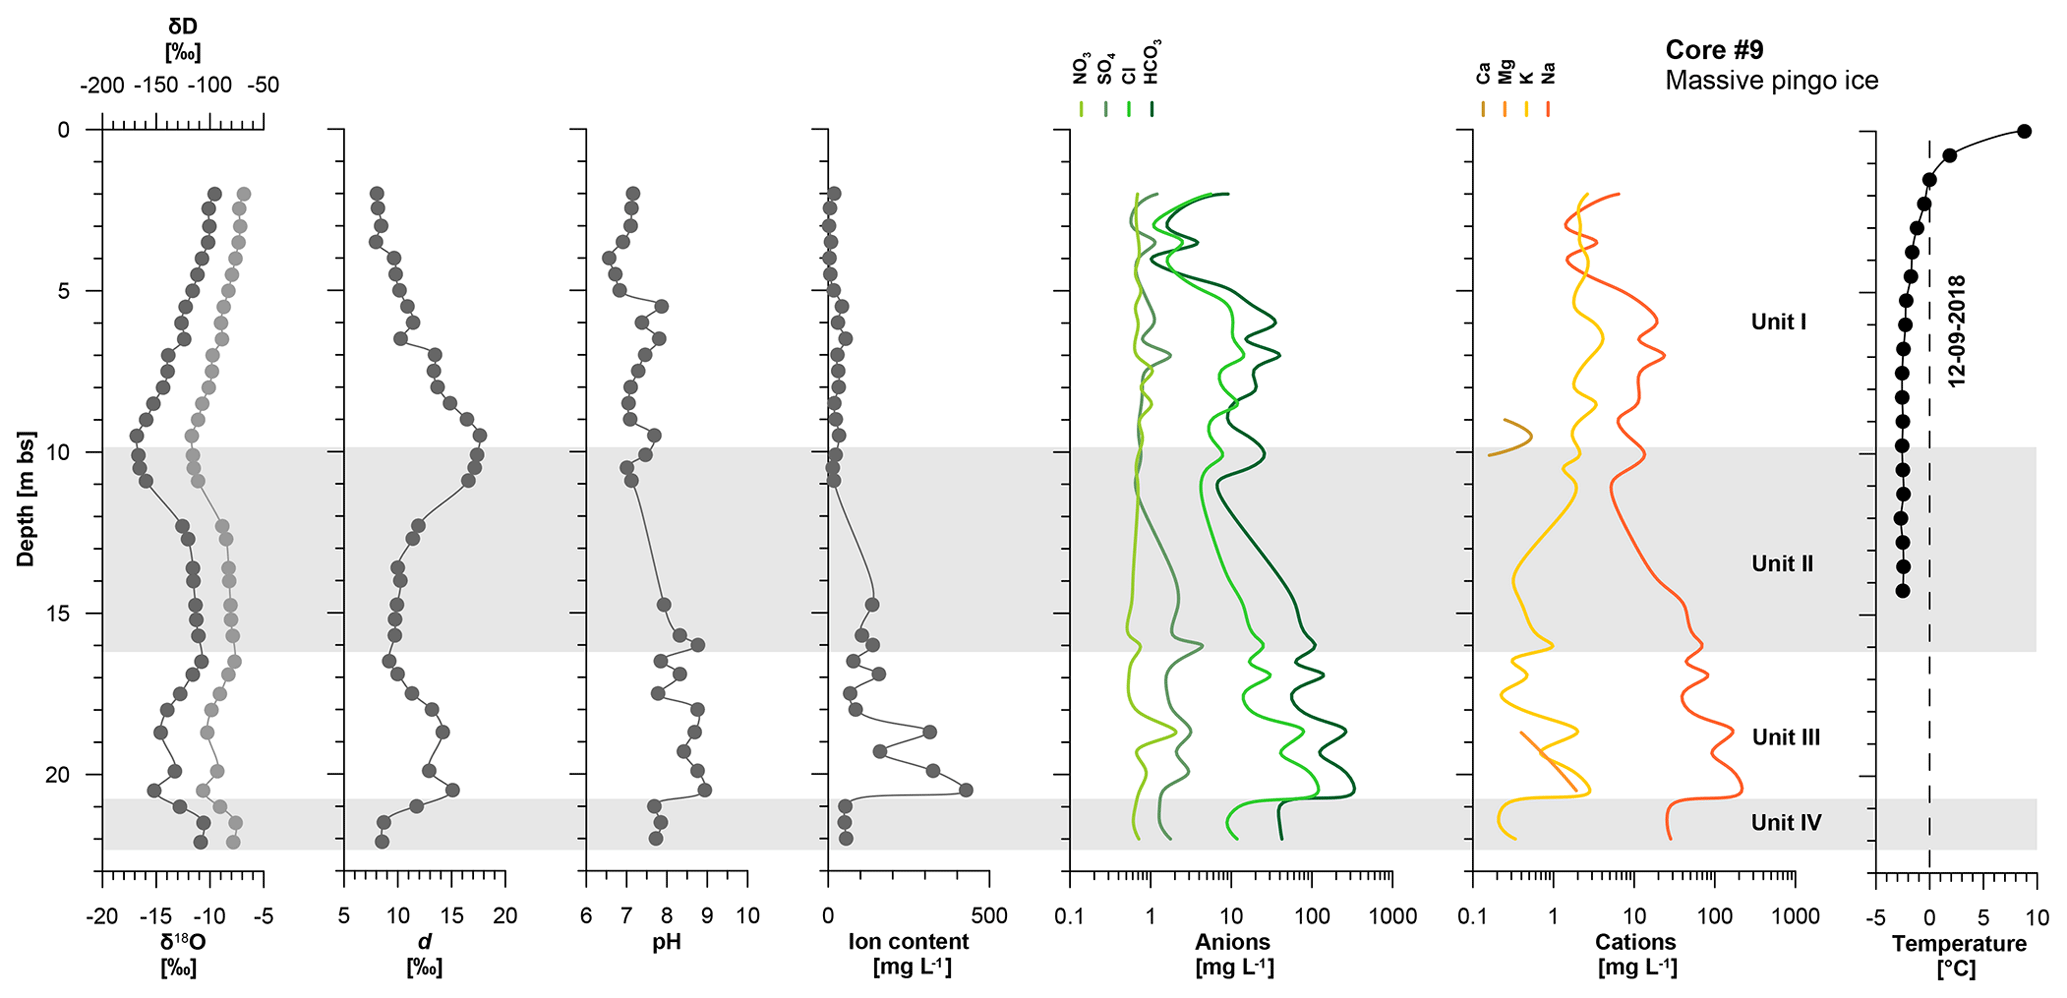
Figure 4Hydrochemical composition of water extracts from the sedimentary cores 9, 10 and 11. Data are given in Table 3. Note different axis scale for ion content in (a) reaching up to 1335 mg L−1.
Table 3Hydrochemical composition of water extracts of the sedimentary cores 9, 10 and 11 given as, mean (±SD), minimum and maximum values per core. Data are shown in Fig. 4.
4.4.2 Core 10
Core 10 drilled at the uppermost position of the pingo shows a different hydrochemical composition compared to the sedimentary water extracts than the bottom sediments of core 9 drilled nearby. The ion content is about 9 times lower with mean values of about 99.6 mg L−1 in core 10 and of about 1335 mg L−1 in core 9 (Fig. 4a, b). The composition of major ions is also different, with predominantly and for anions while the prevalent cations are still Na+ and K+. It is notable that Ca2+ and Mg2+ reach mean values of about 22 and 2 mg L−1, respectively (Table 3). The mean pH is neutral with 7.3±0.5.
4.4.3 Core 11
The hydrochemical composition of major ions in core 11 generally resembles that of core 10 (Fig. 4b, c), although the ion content is much lower with a mean value of 38 mg L−1 driven by more than 2 times lower , 10 times lower Cl−, 6 times lower Na+ and 7 times lower Ca2+ (Table 3). The pH is similar to that of core 10 with a mean of 7.2±0.3.
5.1 Water sources of the massive pingo ice in Grøndalen
Following the current hypotheses on pingo growth on Spitsbergen, there are three possible main water sources for pingo massive-ice formation, which are deep sub-permafrost groundwater for group I pingos connected to geologic fault structures, sub-permafrost groundwater fed by subglacial melt for group II pingos and marine-originated groundwater for group III pingos (Matsuoka et al., 2004). Marine sources are assumed for hydraulic connections between groundwater of uplifted valleys after deglaciation and the sea (Yoshikawa and Harada, 1995). Sea ice, which is a result of seawater freezing, is known to be dominated by sodium chloride and shows ion contents between 2000 and 20 000 mg L−1 (Shokr and Sinha, 1995; Nazintsev and Panov, 2000) depending on freezing velocity, temperature and age. The massive ice of the pingo in Grøndalen shows prevalent Na+ and contents and ion content with maximum values of 428 mg L−1 (mean of 78±101 mg L−1, Table 2). Thus, marine sources for the pingo massive ice are excluded and the previous assignment of the Grøndalen pingos to ancient group III pingos by Yoshikawa and Harada (1995) seems unlikely. Precipitation and surface waters in Grøndalen have lower ion contents and different composition if compared to the pingo massive ice (Table 2), which also excludes these sources as the main ones for the pingos of Grøndalen. The role of artesian flow resulting from the migration of subglacial groundwater for pingo formation on Spitsbergen has been previously studied by Liestøl (1977, 1996) and Yoshikawa and Harada (1995). The original hydrochemical signature of water released from glacial melt is certainly altered by subsurface migration through various deposits. Pressurised spring water from beneath an ice blister sampled in 2018 shows predominance of in anions and ion content of 1192 mg L−1 (Table 2). Furthermore, in 1921 the Norwegian geologist Anders K. Orvin described a spring in Grøndalen and sampled spring water in 1926 (Orvin, 1944), approximately at the northern side of today's Gloin pingo (Fig. 1). These data from spring found in 2018 and 1926 seem meaningful to explore the potential water source for the pingo formations. The spring water analysed by Orvin was characterised by prevalent Na+ and ions, which is typical for freshwater hydrogeological structures below permafrost (Romanovskiy, 1983), and an ion content of 879 mg L−1 (Table 2). The sedimentary water-extract data from deposits underlying the massive ice show likewise prevalent Na+ and ions (Table 3). The similarity of the ion compositions of the spring water and the water extract of deposits underlying the massive ice to those of the Fili pingo ice is striking, although the absolute concentrations are much higher in the spring (1192 mg L−1 in 2018 and 879.2 mg L−1 in 1926) than in the massive ice (mean of all core 9 units 79.0±102.4). This difference between the ion concentrations in the spring water and in the pingo ice is most likely explained by salt expulsion during freezing, which is typical for ice formation from fresh groundwater (Romanovskiy, 1983). We therefore conclude that the groundwater feeding the springs observed by Orvin (1944) and later within this study represents the main source water for the massive pingo ice. This interpretation is further supported by the chain-like distribution of spring and pingos from east to west across Grøndalen (Fig. 1b), which might delineate connectivity for sub-permafrost groundwater by the fault zone further protruding towards the Bøhmdalen.
It was suggested that groundwater recharge in Spitsbergen is related to the warm-based glaciers as there are no other potential taliks where groundwater recharge can occur (Orvin, 1944; Liestøl, 1976). Glaciers on the mounts surrounding the valley occur just several kilometres to the north from the Grøndalen pingos (Fig. 1), namely Irabreen and Stolleybreen. The water temperature is close to 0 ∘C when it is recharged below the glacier. Taking into account the geothermal gradient of ∼2 ∘C per 100 m in the coal survey wells in Barentsburg closest to the studied pingo (Ershov, 1998) and the fact that the base of surrounding glaciers is approximately at 500 m a.s.l. and pingos and the spring are located between 100 and 50 m a.s.l., geothermal heat will increase water temperature melted on the glacier base during its transit through the aquifer to the spring location directly to 9 ∘C as was observed by Orvin in 1921 (Orvin, 1944). Together with low salt content of the spring water, this observation allows the suggestion that the source of sub-permafrost water discharged by the spring (and responsible for pingo formation) was subglacial melt heated and slightly salted during its rather fast transport through the aquifer to the discharge area.
5.2 Stable water isotope composition of the pingo massive ice in Grøndalen
Assuming a conical geometry of the pingo ice body that grew equally to all sides, the chosen central drilling position on top of the pingo and the strictly vertical drilling allowed us to capture the freezing stages of the massive ice. Variations in the isotopic composition of the four massive pingo ice units and between them might be explained by three main controls. Firstly, isotopic variations in the pingo ice might correspond to differing water sources migrating towards the freezing front during different periods of ice formation. Secondly, the source water of the pingo ice was constant but had distinctly differing isotopic signatures over time. And thirdly, the isotopic variations in the pingo ice represent changes in closed, semi-closed and open system conditions, i.e. freezing of a fixed or a (partly) renewed water volume. Estimations of pingo growth rate in Siberia and North America may reach values on the order of decimetres per year (Mackay, 1979; Chizhova and Vasil'chuk, 2018). Assuming the Fili pingo has a similarly fast growth and rather short period of formation, it is likely that there were little to no changes in isotopic composition of the water source. Thus, we assume the second controls on isotopic composition of the Fili pingo massive ice to be of less importance. The isotopic composition of spring water sampled in Grøndalen in 2018 shows −13.01 ‰ in δ18O, −93.5 ‰ in δD and d of 10.6 ‰, which is very close to the respective mean values of the massive pingo ice (all units) of ‰ in δ18O, ‰ in δD and a d of 11.5±4.1 ‰ (Table 1, Fig. 3b, c). This observation makes it likely that the sub-permafrost groundwater feeding the spring also maintained the massive pingo ice formation. Thus, the most probable explanation for the observed isotopic composition of the massive pingo ice relates to subsurface hydrologic conditions, i.e. the system state of closed or open conditions, which are further controlled by local groundwater pressure and the position of the permafrost table. Concurrent changes in the system character from closed to open as deduced from the isotopic and chemical compositions of the pingo ice units are outlined and discussed below.
The isotopic stratification of the massive pingo ice is differentiated into four stages of pingo growth. The earliest stage of massive-ice formation is represented in unit I (1.5–9.8 m b.s.). The down-core strong decline within unit I by about 7 ‰ δ18O and 49 ‰ in δD accompanied by a strong rise of 10 ‰ in d (Fig. 2) indicates a high near-surface temperature gradient, fast freezing and fast formation of the about 8 m thick unit I. If compared to a closed-system freezing model of Ekaykin et al. (2016), the down-core isotopic depletion in unit I is close to the modelled one (Fig. 5a) if an initial isotopic composition of −12.6 ‰ in δ18O and −88 ‰ in δD is assumed. This is much lower than the modern mean annual precipitation values in the Barentsburg region with ‰ in δ18O and ‰ in δD and closer to mean values of the Grøn River and its tributaries with about ‰ in δ18O and ‰ in δD (Table 1). Thus, if precipitation was the main source of the massive ice, its onset took place during a colder period than today. More likely, the underground water source feeding the spring near the pingo was the same source for the massive pingo ice. According to the model, the lowermost (last formed) ice of unit I at a depth of 9.6 m b.s. corresponds to 85 % frozen water of the initial volume. If so the remaining unfrozen water would have had a highly depleted composition of about −19.0 ‰ in δ18O and −130 ‰ in δD (Fig. 5b). However, the modelled data do not entirely catch the real distribution of unit I isotopic composition where the δ18O values are slightly below and the d values slightly above the respective modelled lines (Fig. 5b). Because the model uses the maximum fractionation coefficient (Souchez and Jouzel, 1984), higher fractionation during freezing than modelled is impossible. Therefore, the system during freezing of unit I was likely not completely closed and new source water entered the system when about 50 % of the water was already frozen and changed the isotopic composition of the remaining unfrozen water. This is supported by the slight reversal in δ18O and δD, a more distinct reversal in d, and higher ion concentrations at depth of 6.5 m b.s. (Fig. 2). In Fig. 5a is shown that the last six most depleted δ18O data points after about 50 % of the water is frozen (corresponding to the lowermost data points of unit I in Fig. 2) increasingly deviate from the modelled data. Freezing of large parts of the unit I massive ice at least in only two stages under closed-system conditions is deduced.
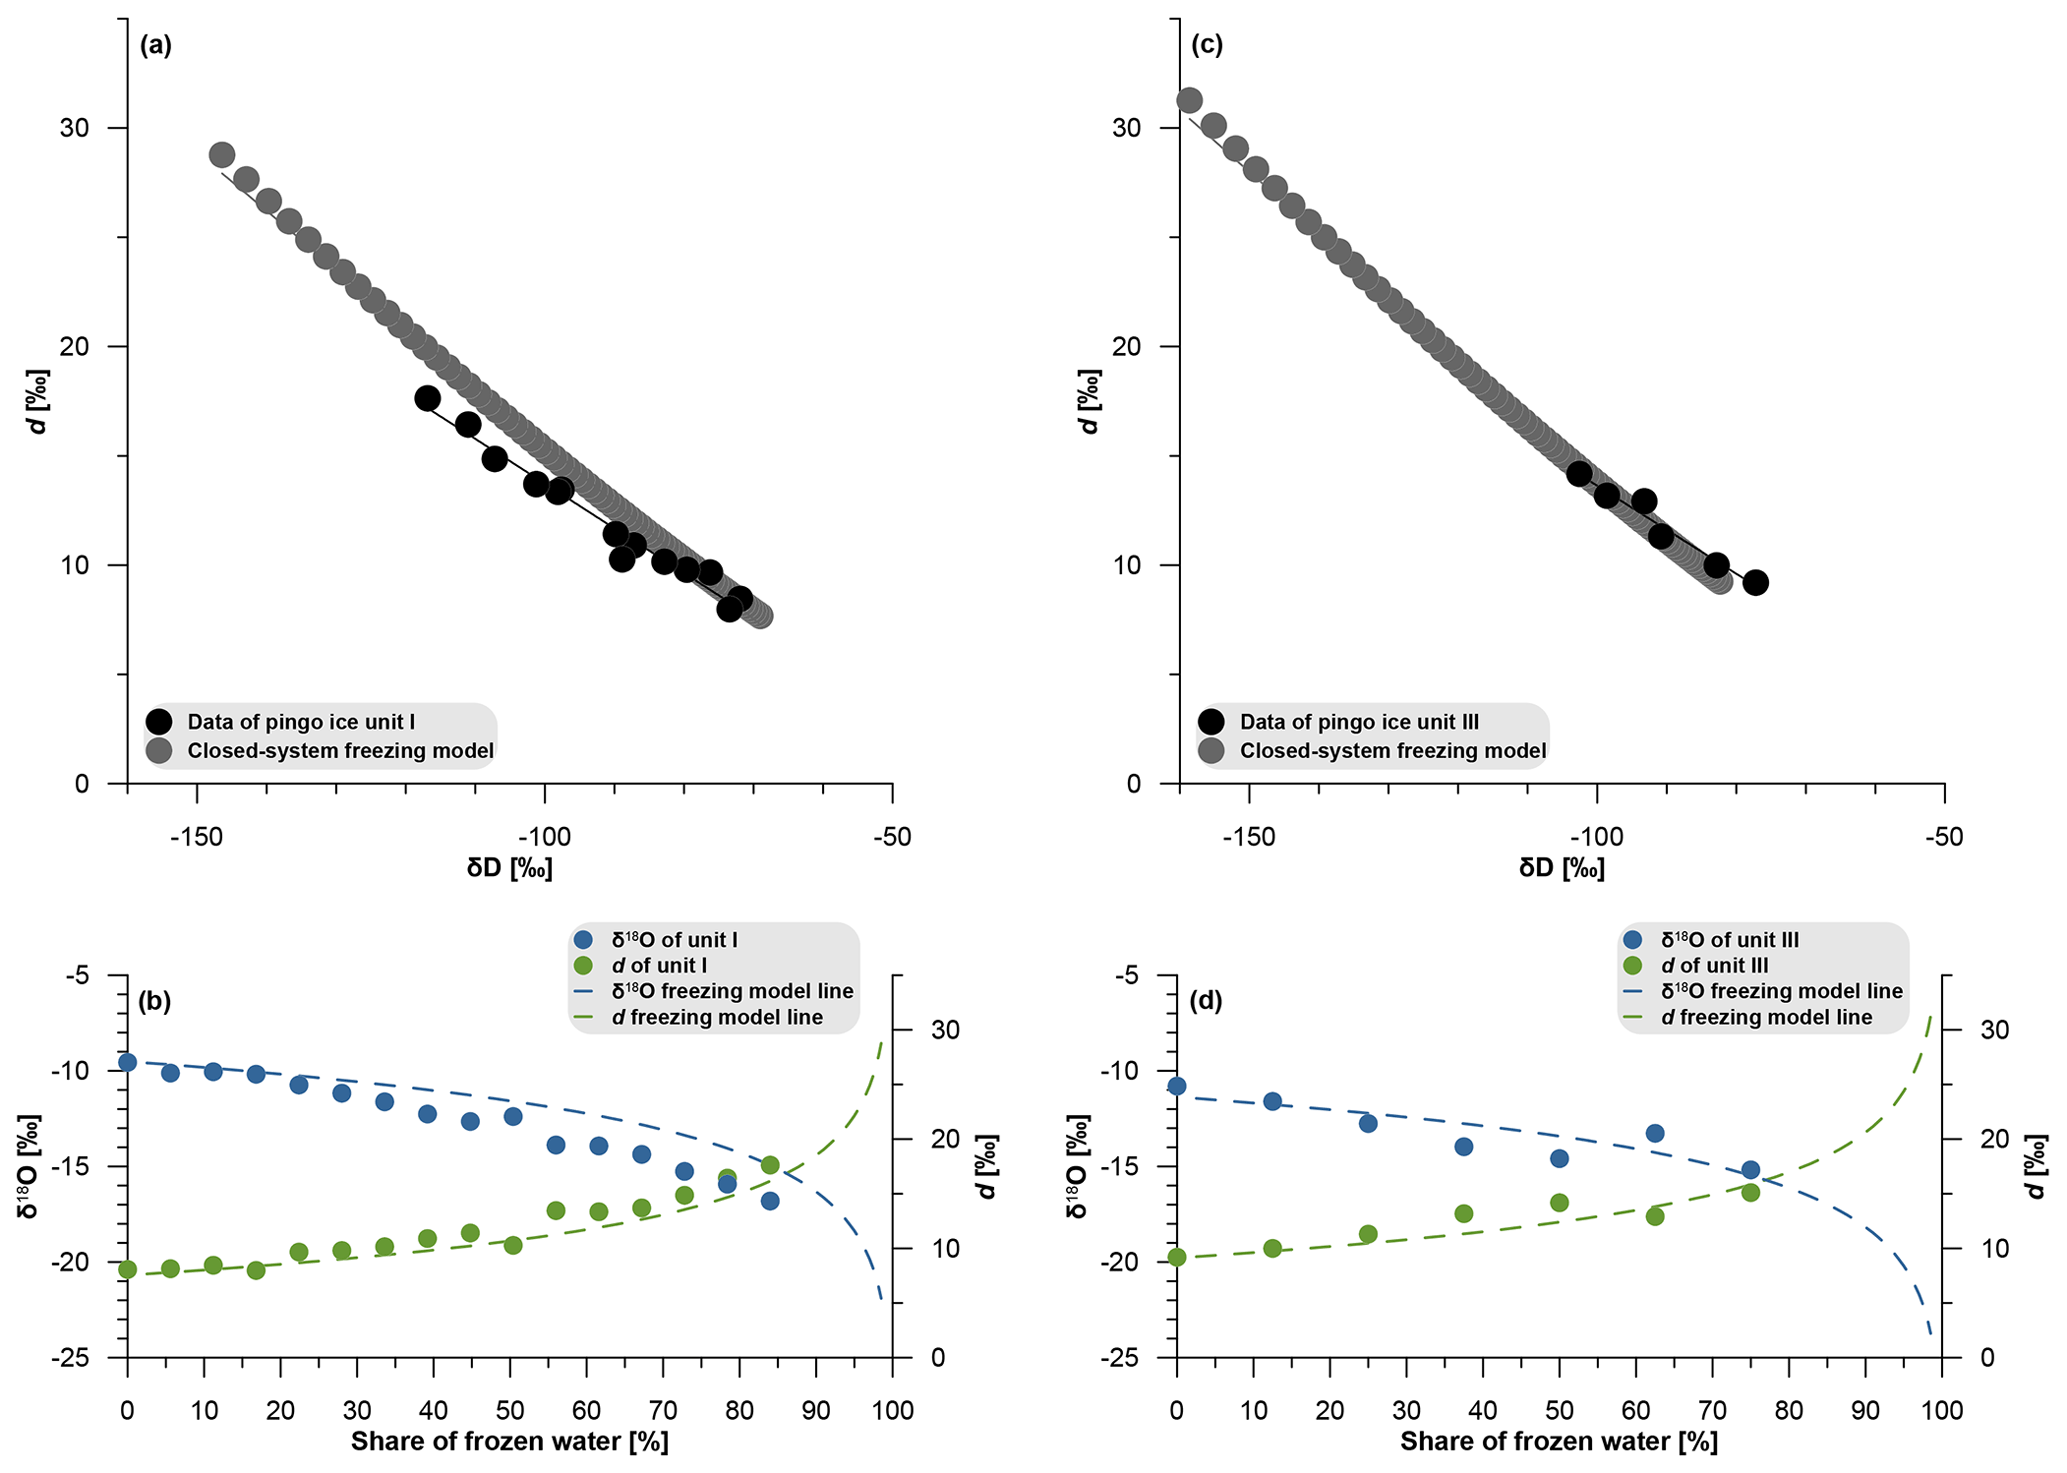
Figure 5Isotopic composition of unit I (a, b) and unit III (c, d) of the massive pingo ice of core 9 in comparison to freezing model data under closed-system conditions (Ekaykin et al., 2016).
The massive ice of unit II (9.8–16.1 m b.s.) is characterised by down-core increasing δ18O and δD by about 5.6 ‰ and 37 ‰, respectively. The d decreases by about 8 ‰ (Fig. 2). Such a down-core pattern might be explained by freezing under semi-closed-system conditions when the water reservoir was episodically renewed with isotopically less depleted subsurface water. The observed down-core increase in solute concentrations of the unit II ice (Fig. 2) further indicates ion enrichment in the source water during ongoing freezing and therefore questions the occurrence of a completely open system fed by constant water supply.
The down-core isotopic composition of unit III (16.1–20.8 m b.s.) resembles that of unit I with δ18O declining by about 4.4 ‰ and δD by about 29 ‰ concurrent with d rising by about 6 ‰ (Fig. 2). Reversals in δ18O and δD and corresponding d are observed at depth of 19.9 m b.s. (Fig. 2), pointing to similar changes of the recharge reservoir as described for unit I. If compared to the freezing model under closed-system conditions (Fig. 5c) the water forming the ice of unit III would have had an initial composition of −14.4 ‰ in δ18O and −101 ‰ in δD. The more depleted isotopic values if compared to unit I are likely explained by fractionation of the available water volume due to previous freezing and formation of the older massive-ice units. The lowermost ice of unit II (−11.1 ‰ δ18O, −79 ‰ δD) is isotopically very close to the uppermost ice of unit III (−10.8 ‰ δ18O, −77 ‰ δD), pointing to freezing of the same source water. The lowermost (last formed) ice of unit III at a depth of 20.5 m b.s. represents about 75 % frozen water of the initial reservoir (Fig. 5d) and points, like the record of unit I, again to freezing of a substantial part of the massive pingo ice (4.7 m thickness) under prevailing closed-system conditions. The down-core increase in solute concentrations with the highest values in the lowermost part of unit III supports closed-system freezing conditions of a fixed water volume.
The lowermost unit IV (20.8–22.2 m b.s.) exhibits down-core δ18O increasing by about 2 ‰ and δD by about 15 ‰ while d decreases by about 3 ‰ similarly to unit II but in a smaller ranges. A drop in solute concentrations is striking (Fig. 2). Both hydrochemical and isotopic composition of unit IV point to freezing conditions of a semi-closed system.
In summary, the pingo ice record obtained in core 9 delineates two closed-system freezing episodes (units I and III) with only slight recharge inversions of the water reservoir and two episodes (units II and IV) with more complicated freezing of subsurface water under semi-closed conditions when the reservoir got renewed from the same source.
Today, the pingo has already accomplished its active growth as seen by the degradation crater on top of the pingo and the occurrence of frozen deposits underlying the massive pingo ice. The latter indicates that the freezing front where the pingo ice formed disappeared when the ground became deeply frozen. The relatively warm ground temperature of only −2.5 ∘C at 14.25 m b.s. in borehole 9 and the active layer reaching the top of the massive ice lead to its successive melt and intensified solifluction further lowering the thickness of the protective layer above the massive ice. As a further consequence of ongoing degradation of the pingo, the crater lake (20×30 m) might develop into a larger thermokarst lake as the massive-ice melt proceeds. Such solifluction and thermokarst degradation processes are common for Spitsbergen pingos (Liestøl, 1996).
5.3 Some aspects of pingo formation in the context of Grøndalen valley history
The elongated outer shape of the Fili pingo cone is also observed for other pingos on Spitsbergen (Liestøl, 1996) while the revealed information on the internal structure of Fili pingo is unique in the sense that it is the only pingo completely drilled in its centre. The Riverbed pingo in Adventdalen, as referred to in Matsuoka et al. (2004), was unfortunately studied for other purposes, and a distal exposure of its frozen core does not allow it to be compared directly with the Fili pingo in Grøndalen, where the borehole is in the centre of mound.
The shape of the massive pingo ice can be deduced in vertical extension from its upper and lower boundaries observed in core 9 between 1.5 and 22.2 m b.s. In lateral extension, the core 10 drilled from the crater top down to 12 m b.s. about 35 m from the core 9 position did not reach the massive ice and suggests a rather steep slope of the massive-ice body. The assumed shape of the pingo and its massive ice is shown in Fig. 1c. The thickness of the massive ice (20.7 m) exceeds the height of the pingo of 9.5 m, which is explained by massive-ice growth when the ongoing subsurface freezing pushed the previously formed ice and cover deposits upward. The latter moved subsequently from the pingo top down-slope by solifluction. Thus, the 9.5 m amplitude of surface uplift seen in the modern stage of pingo evolution became less than the 20.7 m thickness of the massive ice. Solifluction further explains the presence of the buried soil observed at 0.25–0.4 m b.s. in core 10. If these assumptions are reliable, the massive-ice formation started at the freezing front at a depth of about 15 m b.s.
Because the ongoing freezing of new ice below the previously formed massive ice is only possible at the contact between ice and unfrozen waterlogged deposits, it seems likely that the advance of the freezing front was compensated for by the growth of the massive ice and the pingo heave as well as by geothermal heat transported by groundwater. Consequently, the ground temperature at the base of the massive ice remained at the freezing point during the pingo growth. Even if the advance of the freezing front was somewhat slowed down by massive-ice formation, pingo growth and geothermal heat from groundwater, the geothermal heat did not slow down the freezing of the cover deposits along the shape of the aggrading hill, which likely promoted lateral freezing from the slopes and terminated pingo growth.
Because information on the origin and ages of the deposits surrounding the pingos of Grøndalen is still lacking, such aspects will be addressed in future work. Nevertheless, tentative assumptions of the pingo formation stages in context of the valley evolution can already be drawn. Yoshikawa and Harada (1995) conclude from the position of the Grøndalen pingos at about 50 m a.s.l. that their formation started quickly after retreat of the sea (Fig. 6).
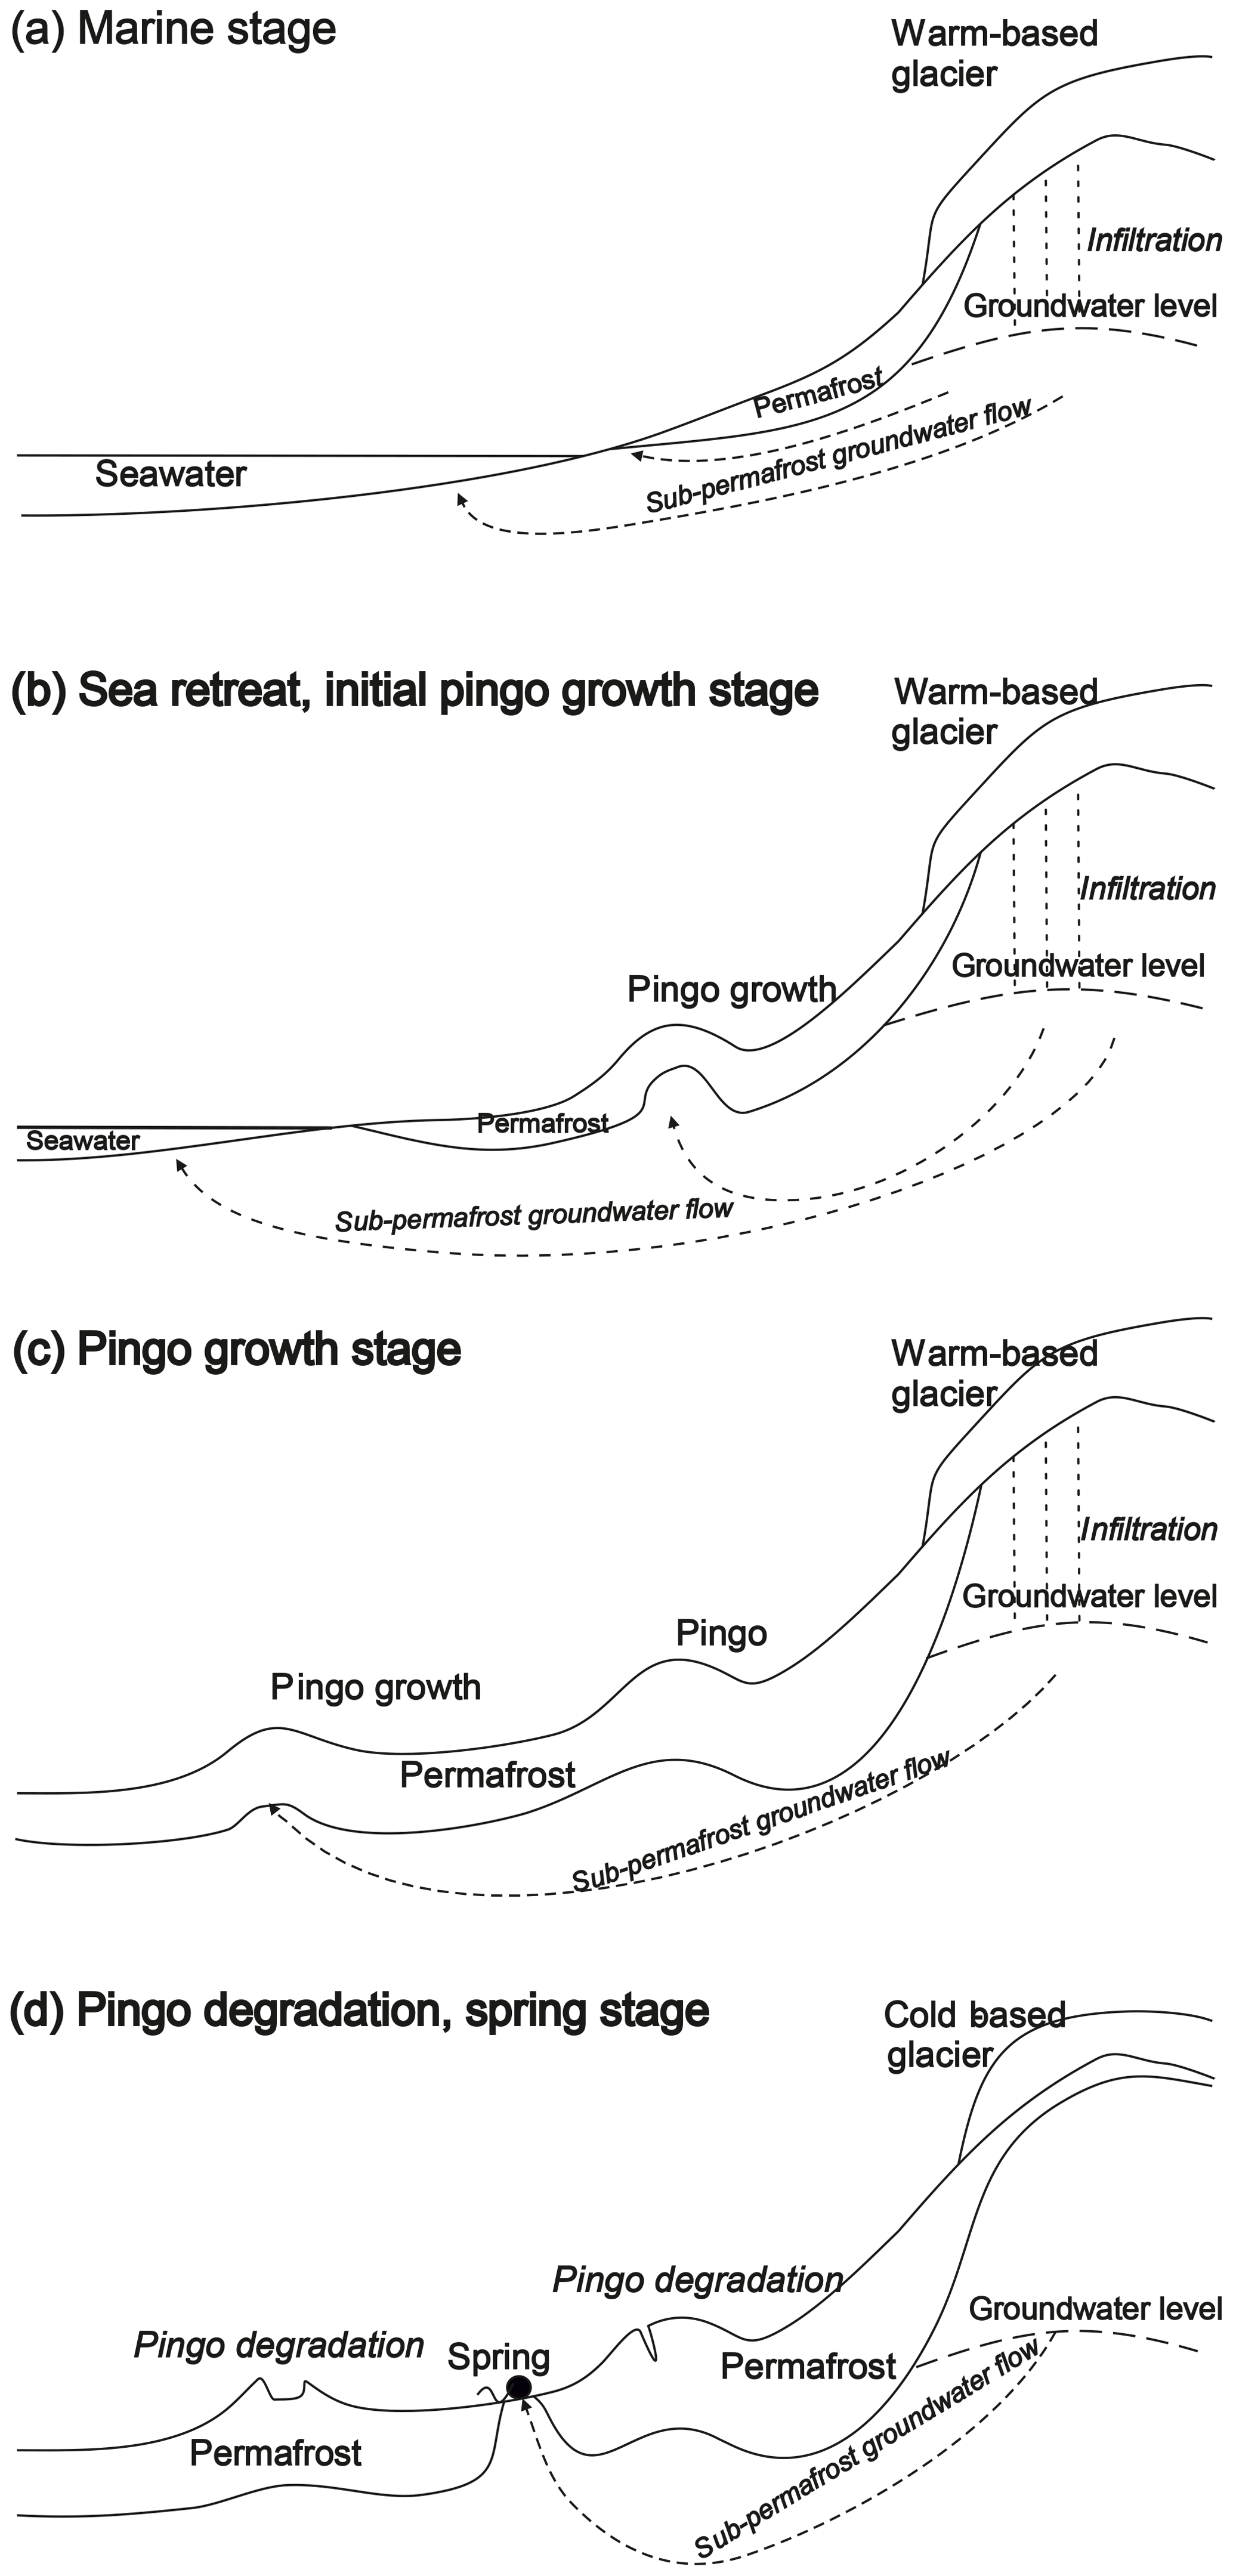
Figure 6Schematic sketch of Grøndalen evolution and pingo formation differentiating into (a) marine stage, (b) initial pingo growth after sea retreat and establishment of the valley's hydrological system, (c) continuing pingo growth along the topographic gradient, and (d) current pingo degradation and occurrence of springs.
After retreat of the sea and establishment of the Grøn River system, we assume a sedimentation period of non-marine gravelly sand and loam deposits observed in core 11. These deposits also cover the top and the slopes of the Fili pingo (core 10) and therefore represent the non-marine ground in which the Grøndalen pingos formed, contradicting the interpretation of Yoshikawa and Harada (1995), who proposed pingo growth within refreezing marine sediments after sea regression. Based on the finding of a lower ice body boundary at the depth of 15 m under the surrounding surface (Fig. 1c), the position of the freezing front is assumed to have reached this depth before start of pingo growth. To reach such a depth, we further assume a certain period of time that was also needed to disconnect the groundwater hydrology of the valley from the sea since seawater is unlikely to have been the source of the pingo massive ice as discussed above. The aggrading permafrost in Grøndalen likely restructured the groundwater hydrogeology of the valley and created groundwater flow in the fault zone connected to Bøhmdalen and Grøndalen that fed the pingos and explains their chain-like occurrence (Fig. 1b). This is comparable to the pingo formation in Adventdalen, where the oldest pingos developed at higher positions (Fig. 6b), more distant from the sea (Yoshikawa and Nakamura, 1996). If this assumption is correct for Grøndalen, Nori pingo is the youngest and Gloin pingo is the oldest in the pingo chain of Grøndalen (Fig. 1b). While the taliks feeding the oldest pingos (above 50 m a.s.l.) subsequently froze, the next connectivity at lower topography became the place for new pingo formation and thus created a chain of pingos following the fault zone and the downslope topographic gradient and hence the availability of groundwater (Fig. 6c). The activity of groundwater springs related to warm-based glaciers might reflect their shrinking by less discharge or even disappearance of the springs (Haldorsen et al., 2011). This is because glacier size decrease and surface lowering induce shrinking accumulation area and further decrease warm-based area, terminating the recharge of springs. In this context, in the study of Chernov and Muraviev (2018) it was shown that the loss in glacier area in Nordenskiöld Land (west Spitsbergen) between 1936 and 2017 reached 49.5 %. Water discharge by the spring in Grøndalen does not necessarily mean that surrounding glaciers are warm-based at the current time. They are probably cold-based today because of their current small size, but meltwater from the stage when they were warm-based may still be discharged by Grøndalen springs due to low discharge rates. Pingos in Grøndalen accomplished their growth not because of the end of groundwater flow but because of freezing of sediments below the massive ice inhabiting the water supply. Today Grøndalen pingos exhibit clear degradation features such as the crater lake on top of Fili pingo (Fig. 6d).
For the first time a pingo on Spitsbergen was completely drilled to obtain records of the massive ice and the deposits above and the permafrost below. The massive pingo ice is almost clear and reaches a thickness of 20.7 m while the pingo reaches a height above the surrounding surface of 9.5 m at present. Both pingo ice thickness and pingo height were reduced by degradation. The lowermost measured ground temperature at 14.25 m b.s. close to the zero-amplitude temperature showed only little variation between −2.5 and −2.37 ∘C from May to September 2018. The maximum thaw depth of 1.5 m in September 2018 reached the uppermost massive ice, which indicates the ongoing fast degradation of the pingo. This is further seen in the crater lake on top of the pingo and strong solifluction that removes cover deposits downslope.
The stable water isotope record of the massive ice shows two episodes of closed-system freezing and two episodes of semi-closed freezing when the source water feeding the massive-ice formation recharged. The hydrochemical composition of the massive ice and the permafrost below is dominated by Na+ and ions, thus of terrestrial origin and similar to those of historical and modern observations of spring water in Grøndalen.
Our current understanding of pingo-related processes and conditions in Grøndalen makes it difficult to align them with the pingo categories for Spitsbergen proposed by Yoshikawa and Harada (1995). In the Fili pingo record of Grøndalen we concurrently identified pingo formation characteristics such as fault-related groundwater discharge (typical for group I pingos) and groundwater origin from warm-based glaciers (typical for group II pingos). The proposed pingo formation in Grøndalen is connected to epigenetic refreezing of marine deposits (typical for group III pingos) but not immediately after sea regression due to the reworking of marine sediments seen in deposits surrounding the Grøndalen pingos.
The origin and distribution of pingos in Grøndalen depends on the complex interaction of hydrogeological conditions and sea level, glaciers, and permafrost dynamics superimposed by climate variability over time. The permafrost dynamics may be typical for a vast archipelago and make investigation of pingos important for understanding key stages of cryosphere evolution of Spitsbergen.
Original data are available at https://doi.pangaea.de/10.1594/PANGAEA.907530 (Wetterich et al., 2019).
The supplement related to this article is available online at: https://doi.org/10.5194/tc-13-3155-2019-supplement.
ND and SV initiated and designed the present study. They further drilled and documented the cores together with VD. AE carried out stable isotope analyses. AE and AJH contributed hydrochemical and stable isotope data of the modern environment, such as from precipitation, surface waters and sources. MA, LS and HM supported the overall data analysis and interpretation. ND and SW wrote the paper with input from the other co-authors, who contributed equally to the final discussion of the results and interpretations.
The authors declare that they have no conflict of interest.
We acknowledge support for field logistics and lab analytics from the Russian Scientific Arctic Expedition on Spitsbergen Archipelago (RAE-S), Barentsburg. Ekaterina Poliakova (Arctic and Antarctic Research Institute, St. Petersburg, Russia) provided useful translations of Norwegian original literature. We thank our referees Trevor Porter and Go Iwahana as well as the handling editor, Peter Morse, for critical and helpful comments to improve the final version of the paper.
This research has been supported by the Russian Science Foundation (grant no. 19-77-10066), Deutsche Forschungsgemeinschaft (grant no. WE4390/7-1) and JPI-Climate Topic 2: Russian Arctic and Boreal Systems (grant no. 71126).
This paper was edited by Peter Morse and reviewed by Go Iwahana and Trevor Porter.
Burr, D. M., Tanaka, K. L., and Yoshikawa, K.: Pingos on Earth and Mars, Planet. Space Sci., 57, 541–555, https://doi.org/10.1016/j.pss.2008.11.003, 2009.
Chernov, R. A. and Muraviev, A. Ya.: Contemporary changes in the area of glaciers in the western part of the Nordenskjold Land (Svalbard), Ice and Snow, 58, 462–472, https://doi.org/10.15356/2076-6734-2018-4-462-472, 2018 (in Russian).
Chizhova, Ju. N. and Vasil'chuk, Yu. K.: Use of stable water isotopes to identify stages of the pingo ice core formation, Ice and Snow, 58, 507–523, https://doi.org/10.15356/2076-6734-2018-4-507-523, 2018 (in Russian).
Christiansen, H. H., Gilbert, G. L., Demidov, N., Guglielmin, M., Isaksen, K., Osuch, M., and Boike, J.: Permafrost thermal snapshot and active-layer thickness in Svalbard 2016–2017, in: SESS report 2018, The State of Environmental Science in Svalbard – an annual report, edited by: Orr, E., Hansen, G., Lappalainen, H., Hübner, C., and Lihavainen, H., SIOS, Longyearbyen, Svalbard, 26–47, available at: https://www.sios-svalbard.org/sites/sios-svalbard.org/files/common/SESSreport_2018_FullReport.pdf, last access: 1 April 2019.
Dansgaard, W.: Stable isotopes in precipitation, Tellus, 16, 436–468, https://doi.org/10.3402/tellusa.v16i4.8993, 1964.
Demidov, N. E., Verkulich, S. R., Karaevska, E. S., Nikulina, A. L., and Savatyugin, L. M.: First results of permafrost observations at the monitoring site of the Russian Scientific Centre on Spitsbergen, Problems of the Arctic and Antarctic, 4, 67–79, 2016 (in Russian).
Ekaykin, A. A., Lipenkov, V. Ya., Kozachek, A. V., and Vladimirova, D. O.: Stable water isotopic composition of the Antarctic subglacial Lake Vostok: implications for understanding the lake's hydrology, Isot. Environ. Healt. S., 52, 468–476, https://doi.org/10.1080/10256016.2015.1129327, 2016.
Ershov, E. D. (Ed.): Fundamentals of Geocryology, Volume III, Regional and historical geocryology of the world, Moscow University Publishing House, Moscow, 575 pp., 1998 (in Russian).
French, H. and Shur, Y.: The principles of cryostratigraphy, Earth-Sci. Rev., 101, 190–206, https://doi.org/10.1016/j.earscirev.2010.04.002, 2010.
Geological map Svalbard: 1:100 000, Spitsbergen Norsk Polarinstitutt Temakart nr. 16, 1991.
Grosse, G. and Jones, B. M.: Spatial distribution of pingos in northern Asia, The Cryosphere, 5, 13–33, https://doi.org/10.5194/tc-5-13-2011, 2011.
Haldorsen, S., Heim, M., and van der Ploeg, M. J.: Impacts of climate change on groundwater in permafrost areas: case study from Svalbard, Norway, in: Climate change effects on groundwater resources: A global synthesis of findings and recommendations, edited by: Treidel, H., Martin-Bordes, J. L., and Gurdak, J. J., CRC Press, Boca Raton, FL, USA, 323–338, 2011.
Hjelle, A.: Geology of Svalbard, Polar håndbok No. 7, Norsk Polarinstitutt, Oslo, Norway, 1993.
Hyvärinen, H. and Ritchie, J. C.: Pollen stratigraphy of Mackenzie pingo sediments, N.W.T., Canada, Arctic Alpine Res., 7, 261–272, 1975.
Ishikawa, M. and Jambaljav, Ya.: Formation chronology of Arsain pingo, Darhad Basin, Northern Mongolia, Permafrost Periglac., 27, 297–306, https://doi.org/10.1002/ppp.1877, 2016.
Jones, B. M., Grosse, G., Hinkel, K. M., Arp, C. D., Walker, S., Beck, R. A., and Galloway, J. P.: Assessment of pingo distribution and morphometry using an IfSAR derived DSM, western Arctic Coastal Plain, northern Alaska, Geomorphology, 138, 1–14, https://doi.org/10.1016/j.geomorph.2011.08.007, 2012.
Liestøl, O.: Pingos, springs, and permafrost in Spitsbergen, Norsk Polarinstitutt Årbok 1975, 7–29, 1977.
Liestøl, O.: Open-system pingos in Spitsbergen, Norsk Geogr. Tidsskr., 50, 81–84, https://doi.org/10.1080/00291959608552355, 1996.
Mackay, J. R.: Pingos of the Pleistocene Mackenzie Delta area, Geographical Bulletin, 18, 21–63, 1962.
Mackay, J. R.: Pingos of the Tuktoyaktuk Peninsula Area, Northwest Territories, Géogr. Phys. Quatern., 33, 3–61, https://doi.org/10.7202/1000322ar, 1979.
Mackay, J. R.: Growth of Ibyuk Pingo, western Arctic coast, Canada, and some implications for environmental reconstructions, Quaternary Res., 26, 68–80, https://doi.org/10.1016/0033-5894(86)90084-0, 1986.
Matsuoka, N., Sawaguchi, S., and Yoshikawa, K.: Present-day periglacial environments in Central Spitsbergen, Svalbard, Geographical Review of Japan, 77, 276–300, https://doi.org/10.4157/grj.77.276, 2004.
Nazintsev, U. L. and Panov, V. V.: Phase composition and thermophysical properties of sea ice, Gidrometeoizdat, St. Petersburg, Russia, 83 pp., 2000 (in Russian).
Orvin, A. K.: Litt om Kilder pa Svalbard, Norsk Geografisk Tidsskrift, 1, 16–38, 1944 (in Norwegian).
Palagushkina, O., Biskaborn, B., Wetterich, S., Schirrmeister, L., Nazarova, L., and Grosse, G.: Modern and fossil freshwater diatoms (Bacillariophyceae) in periglacial environments of the Seward Peninsula (northwestern Alaska), Paleogeogr. Paleoclimatol. Paleoecol., 479, 1–15, https://doi.org/10.1016/j.palaeo.2017.04.006, 2017.
Romanovskiy, N. N.: Underground waters of the permafrost zone, Moscow State University Press, Moscow, Russia, 232 pp., 1983 (in Russian).
Ross, N., Harris, C., Christiansen, H. H., and Brabham, P. J.: Ground penetrating radar investigations of open system pingos, Adventdalen, Svalbard, Norsk Geogr. Tidsskr., 59, 129–138, https://doi.org/10.1080/00291950510020600, 2005.
Rossi, G., Accaino, F., Boaga, J., Petronio, L., Romeo, R., and Wheeler, W.: Seismic survey on an open pingo system in Adventdalen Valley, Spitsbergen, Svalbard, Near Surf. Geophys., 16, 1–15, https://doi.org/10.3997/1873-0604.2017037, 2018.
Shokr, M. and Sinha, N.: Sea ice: physics and remote sensing, John Wiley and Sons, Chichester, UK, 2015.
Skakun, A. A., Chikhachev, K. B., Ekaykin, A. A., Kozachek, A. V., Vladimirova, D. O., Veres, A. N., Verkulich, S. R., Sidorova, O. R., and Demidov, N. E.: Stable isotopic content of atmospheric precipitation and natural waters in the vicinity of Barentsburg (Svalbard), Ice and Snow, 60, accepted, 2020 (in Russian).
Souchez, R. and Jouzel, J.: On the isotopic composition in δD and δ18O of water and ice during freezing, J. Glaciol., 30, 369–372, https://doi.org/10.3189/S0022143000006249, 1984.
Tolkien, J. R. R.: The Lord of the Rings, Allen and Unwin, Norwich, UK, 1954–1955.
Ulrich, M., Wetterich, S., Rudaya, N., Frolova, L., Schmidt, J., Siegert, C., Fedorov, A. N., and Zielhofer, C.: Rapid thermokarst evolution during the mid-Holocene in Central Yakutia, Russia, Holocene, 27, 1899–1913, https://doi.org/10.1177/0959683617708454, 2017.
van Everdingen, R. E.: Multi-language glossary of permafrost and related ground-ice terms (revised 2005), Boulder, USA, National Snow and Ice Data Center/World Data Center for Glaciology, 1998.
Verkulich, S., Zazovskaya, E., Pushina, Z., Savelieva, L., Soloveva, D., Demidov, N., Shishkov, V., and Dercon, G.: The postglacial environmental changes in vicinity of the Barentsburg settlement (West Spitsbergen), EGU General Assembly, Vienna, Austria, 8–13 April 2018, EGU 2018-7729, 2018.
Wetterich, S., Grosse, G., Schirrmeister, L., Andreev, A. A., Bobrov, A. A., Kienast, F., Bigelow, N. H., and Edwards, M. E.: Late Quaternary environmental and landscape dynamics revealed by a pingo sequence on the northern Seward Peninsula, Alaska, Quaternary Sci. Rev., 39, 26–44, https://doi.org/10.1016/j.quascirev.2012.01.027, 2012.
Wetterich, S., Schirrmeister, L., Nazarova, L., Palagushkina, O., Bobrov, A., Pogosyan, L., Savelieva, L., Syrykh, L., Matthes, H., Fritz, M., Günther, F., Opel, T., and Meyer, H.: Holocene thermokarst and pingo development in the Kolyma Lowland (NE Siberia), Permafrost Periglac., 29, 182–198, https://doi.org/10.1002/ppp.1979, 2018.
Wetterich, S., Demidov, N., and Ekaykin, A.: Geochemical signatures of pingo and ground ice in Grøndalen, West Spitsbergen, PANGAEA, https://doi.pangaea.de/10.1594/PANGAEA.907530, 2019.
Yoshikawa, K.: Notes on Open-System Pingo Ice, Adventdalen, Spitsbergen, Permafrost Periglac., 4, 327–334, https://doi.org/10.1002/ppp.3430040405, 1993.
Yoshikawa, K. and Harada, K.: Observations on nearshore pingo growth, Adventdalen, Spitsbergen, Permafrost Periglac., 6, 361–372, https://doi.org/10.1002/ppp.3430060407, 1995.
Yoshikawa, K. and Nakamura, T.: Pingo growth ages in the delta area, Adventdalen, Spitsbergen, Polar Rec., 32, 347–352, https://doi.org/10.1017/S0032247400067565, 1996.
Yoshikawa, K., Leuschen, C., Ikeda, A., Harada, K., Gogineni, P., Hoekstra, P., Hinzman, L., Sawada, Y., and Matsuoka, N.: Comparison of geophysical investigations for detection of massive ground ice (pingo ice), J. Geophys. Res., 111, E06S19, https://doi.org/10.1029/2005JE002573, 2006.
Yoshikawa, K., Natsagdorj, S., and Sharkhuu, A.: Groundwater hydrology and stable isotope analysis of an open-system pingo in northwestern Mongolia, Permafrost Periglac., 24, 175–183, https://doi.org/10.1002/ppp.1773, 2013.
The requested paper has a corresponding corrigendum published. Please read the corrigendum first before downloading the article.
- Article
(3797 KB) - Full-text XML
- Corrigendum
-
Supplement
(635 KB) - BibTeX
- EndNote
in connection with formation of pingos there are a great many unsolved questions. Drillings and temperature measurements through the pingo mound and also through the surrounding permafrost are needed before the problems can be better understood. To shed light on pingo formation here we present the results of first drilling of pingo on Spitsbergen together with results of detailed hydrochemical and stable-isotope studies of massive-ice samples.
in connection with formation of pingos there...