the Creative Commons Attribution 4.0 License.
the Creative Commons Attribution 4.0 License.
 | 15 Oct 2019
Regional influence of ocean–atmosphere teleconnections on the timing and duration of MODIS-derived snow cover in British Columbia, Canada
Alexandre R. Bevington
Hunter E. Gleason
Vanessa N. Foord
William C. Floyd
Hardy P. Griesbauer
We use the twice-daily Moderate Resolution Imaging Spectroradiometer (MODIS) snow cover product to study the regional influence of the Oceanic Niño Index (ONI) and Pacific Decadal Oscillation (PDO) on snow cover in British Columbia (BC). We apply a locally weighted regression (LOWESS) interpolation to the MODIS normalized difference snow index (NDSI) time series to detect the timing and duration of snow. We confirm the general consensus from many previous in situ studies that both ONI and PDO have significant impacts on snow cover in BC. We add to this knowledge by performing seasonal and regional analysis using established hydrozones and explore variation in our results by elevation bins of 500 m. We calibrated our method with in situ snow water equivalent (SWE) data and found an optimal NDSI threshold of 30 for detecting continuous snow cover. We separate automatic snow weather station data into calibration (75 %) and validation (25 %) subsets and obtain mean absolute errors between the MODIS and in situ observations for the start, end, and duration of 8.7, 8.9, and 13.1 d for the calibration data and 12.7, 12.6, and 16.6 d for the validation data, respectively. In general, the start date of snow is poorly correlated with both ONI and PDO, whereas the end date and duration are strongly negatively correlated. Regional patterns emerge wherein northern and southern BC are most correlated with the PDO and the ONI, respectively. These relationships are generally stronger at lower elevations and vary spatially. This study demonstrates that the suitability of ocean–atmosphere teleconnections as predictors of the timing and duration of snow varies throughout BC.
- Article
(11282 KB) - Full-text XML
-
Supplement
(420 KB) - BibTeX
- EndNote


The timing and duration of seasonal snow cover have been shown to influence a number of landscape processes, namely soil moisture and drought (e.g., Fang and Pomeroy, 2008), wildfire activity and intensity (e.g., Westerling et al., 2006), freshwater availability (e.g., Barnett et al., 2005), flooding (e.g., Barnett et al., 2005), plant ecology (e.g., Jonas et al., 2008), and wildlife behavior (e.g., Boelman et al., 2019). The western Canadian province of British Columbia (BC) is roughly 1 million km2 in size, has multiple mountain chains, and shares its border with one province, two territories, and four states (Fig. 1). Generally mild and dry winters in BC have been identified as important factors in forest insect outbreaks (Stahl et al., 2006b), wildfire activity (Crowley et al., 2019), glacier change (e.g., Menounos et al., 2018), and overall drought conditions (Trishchenko et al., 2016). The winter snowpack differs in timing and duration throughout the province and is influenced by, among other processes, climate change (e.g., Allchin and Déry, 2017; Foord, 2016; Najafi et al., 2017), local geography (e.g., Moore and McKendry, 1996; Schnorbus et al., 2014; Stahl et al., 2006a), land cover change (e.g., Boon, 2012), and ocean–atmosphere teleconnections (e.g., Fleming and Whitfield, 2010; Hsieh and Tang, 2001; Shabbar, 2006; Winkler and Moore, 2006).
Observed snow water equivalent (SWE) in southern BC significantly decreased by up to −10 % per decade between 1950 and 2014 (e.g., White et al., 2016). Looking further back, Foord (2016) studied the historical instrumented climate record (∼100 years) in northern BC and found significant increases in winter air temperatures and decreases in winter precipitation as snow. Similarly, 90 % of snow monitoring sites across the western US have recently shown declines (Mote et al., 2018). These studies rely on in situ observations with important limitations, e.g., the under representation of alpine environments, the sparse network of snow observations in western North America, and the challenges of interpreting in situ observations across broad heterogeneous mountainous landscapes.
The Moderate Resolution Imaging Spectroradiometer (MODIS) optical imaging sensors aboard the Terra (launched in 1999) and Aqua (launched in 2002) satellite platforms provide a nearly continuous record of twice-daily global daytime 500 m resolution satellite images. MODIS has been used to study different aspects of snow cover in, for example, the Andes (Saavedra et al., 2018), Alaska (Lindsay et al., 2015), Asia (Li et al., 2018; Tang et al., 2017), British Columbia (Trubilowicz et al., 2016), Canada (Trishchenko et al., 2016), and more recently for global studies (e.g., Hammond et al., 2018; Bormann et al., 2018). Although the spatial extent and duration of snow cover are well studied, there have been relatively few studies that have utilized MODIS to detect the start (SDON) and end (SDOFF) dates of snow cover (e.g., Li et al., 2018; Lindsay et al., 2015).
Lindsay et al. (2015) were able to demonstrate using MODIS that nearly half of Alaska and the surrounding areas experienced intermittent snow-covered periods with field-validated accuracies between −12.2 and +33.9 d. Saavedra et al. (2018) used similar methods in the Andes Mountains and found negligible trends in snow persistence (SP) over time; however, SP was significantly correlated with temperature (negative correlation) and precipitation (positive correlation). In British Columbia, basin-scale investigations of MODIS-derived snow characteristics were used as a predictor of river streamflow (Tong et al., 2009). It was found that the 50 % snow cover fraction value was highly correlated with the timing of 50 % normalized accumulated runoff (rS=0.82; p<0.001) in the Quesnel River basin, a subboreal mountainous watershed. Finally, Trishchenko et al. (2016) computed the minimum snow and ice cover extents over Canada and found significant discrepancies with global land cover products. This growing body of research demonstrates the wide variety of applications of the MODIS snow cover product.
The El Niño–Southern Oscillation (ENSO) and the Pacific Decadal Oscillation (PDO) have been identified as the two most influential ocean–atmosphere teleconnections on snow cover in BC (Moore and McKendry, 1996). This paper investigates the regional effects of ENSO and PDO on the MODIS-derived SDON and SDOFF and the total duration of snow cover (SDDUR) in BC. To do this, we leverage daily MODIS snow cover data (Riggs and Hall, 2015) using Google Earth Engine (Gorelick et al., 2017). We then apply a locally weighted scatterplot smoothing (LOWESS) interpolation to the time series and detect SDON, SDOFF, and SDDUR for each hydrological year (1 September–1 September) between 2002 and 2018. We calibrate and validate our workflow to a province-wide snow observation network (Fig. 1). We acknowledge that this is a short time period (16 years) and suggest caution in the implementation of our results beyond the period of study. Furthermore, a thorough explanation of the climatology and physical processes that control ocean–atmosphere teleconnections and their regional influence on snow is outside the scope of this paper.
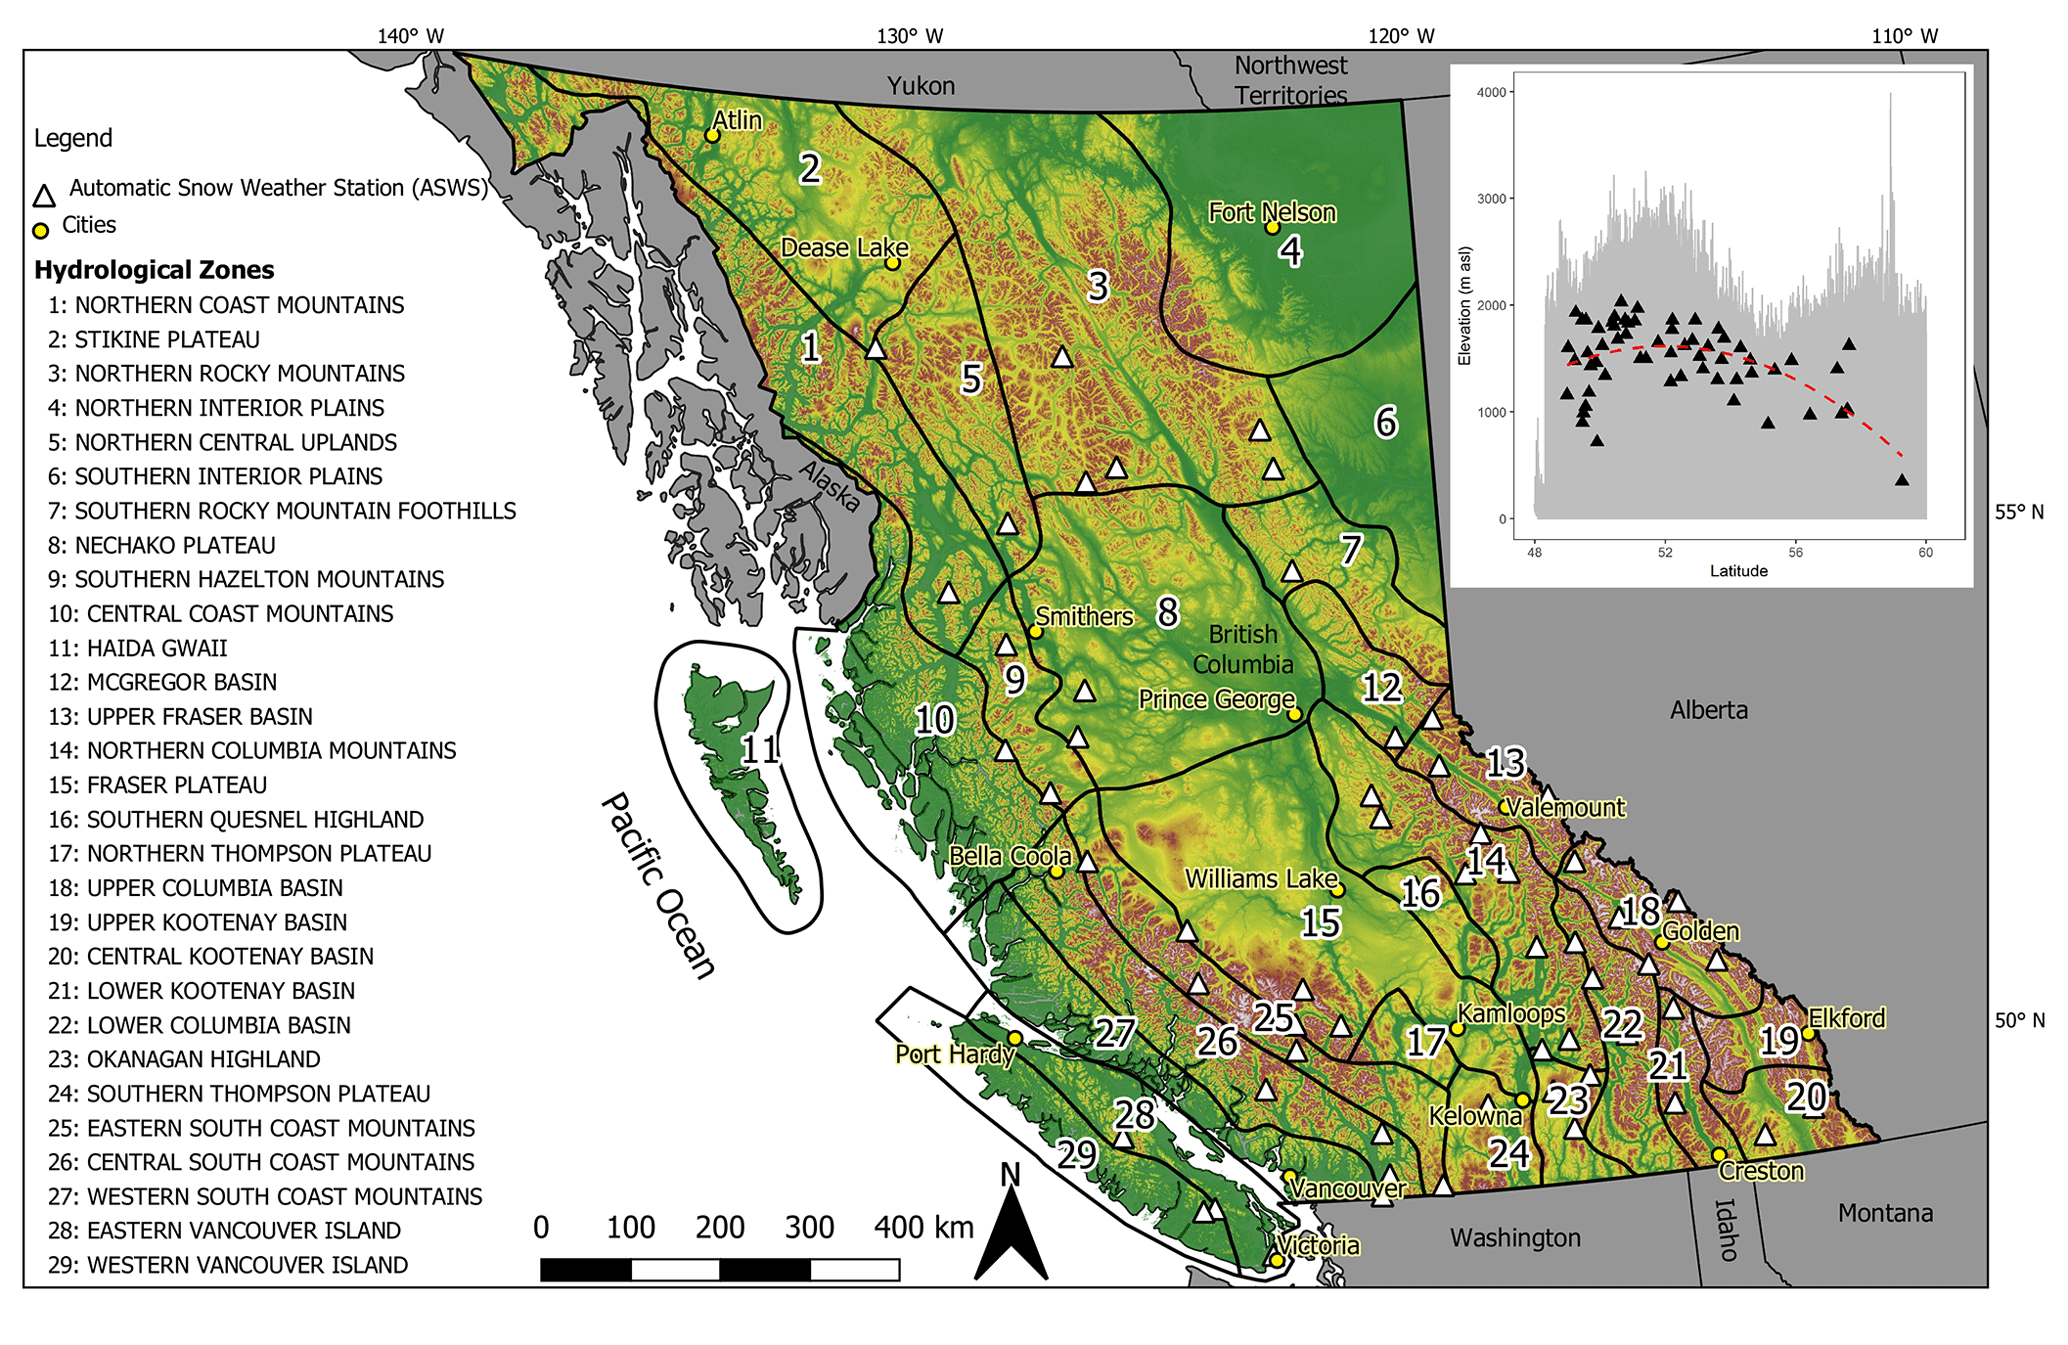
Figure 1Map of British Columbia, Canada, shown with hydrozones, automated snow weather stations (ASWSs), and selected cities. The inset shows the distribution of ASWS locations by latitude (x axis) and elevation (y axis) plotted against terrain elevation (grey line) with a polynomial fit to the data (dashed red line), indicating gaps in the in situ observations in northern BC, particularly at high elevation.
Hemispheric-scale circulation patterns, or ocean–atmosphere teleconnections, are known to influence the climatology of western Canada; the most influential patterns include the PDO (Stahl et al., 2006a; Whitfield et al., 2010), ENSO (Moore and McKendry, 1996; Shabbar, 2006), Pacific North American pattern (PNA; Bonsal and Shabbar, 2008; Stahl et al., 2006a), and Arctic Oscillation (AO; Burn, 2008; Fleming et al., 2016). Anthropogenic climate change is also an important influence on snow cover in BC (e.g., White et al., 2016; Foord, 2016; Islam et al., 2017; Najafi et al., 2017; Schnorbus et al., 2014); however, climate change studies require long time series and are complex due to the potential influence of climate change on the ocean–atmosphere teleconnections themselves (e.g., Cai et al., 2018).
Over western Canada, the PDO and ENSO influence the frequency of major synoptic circulation types associated with storms generated from the North Pacific Ocean (Stahl et al., 2006a). This also affects the western United States, where Svoma (2011) found that the warm phase of ENSO (El Niño) years had higher snow lines, with the strongest response near the Pacific coast. Bonsal and Shabbar (2008) provide a thorough review of relationships between large-scale teleconnections and low water flows over Canada, with a section dedicated to western Canada.
3.1 Ocean–atmosphere teleconnections
The ENSO is measured as anomalous sea surface temperatures (SSTs) over the eastern equatorial Pacific Ocean with corresponding changes in the atmospheric sea level pressure in the tropical Pacific (Shabbar, 2006). The diabatic heating over the tropical Pacific in response to El Niño initiates Rossby waves that enhance PNA circulation over North America; the most pronounced cell of the PNA lies over western Canada (Wallace and Gutzler, 1981). In this study, we test the correlation of SDON, SDOFF, and SDDUR in BC with the Oceanic Niño Index (ONI; Fig. 2), a measurement of ENSO strength (Huang et al., 2017). The ONI index is calculated as the 3-month running mean of Extended Reconstructed Version 5 SST anomalies in the Niño 3.4 (5∘ N–5∘ S, 120∘ E–170∘ W) region (Huang et al., 2017). ONI events are defined as periods during which the index exceeds 0.5 ∘C (El Niño) or is below −0.5 ∘C (La Niña) for more than 5 consecutive months (Trenberth, 1997).
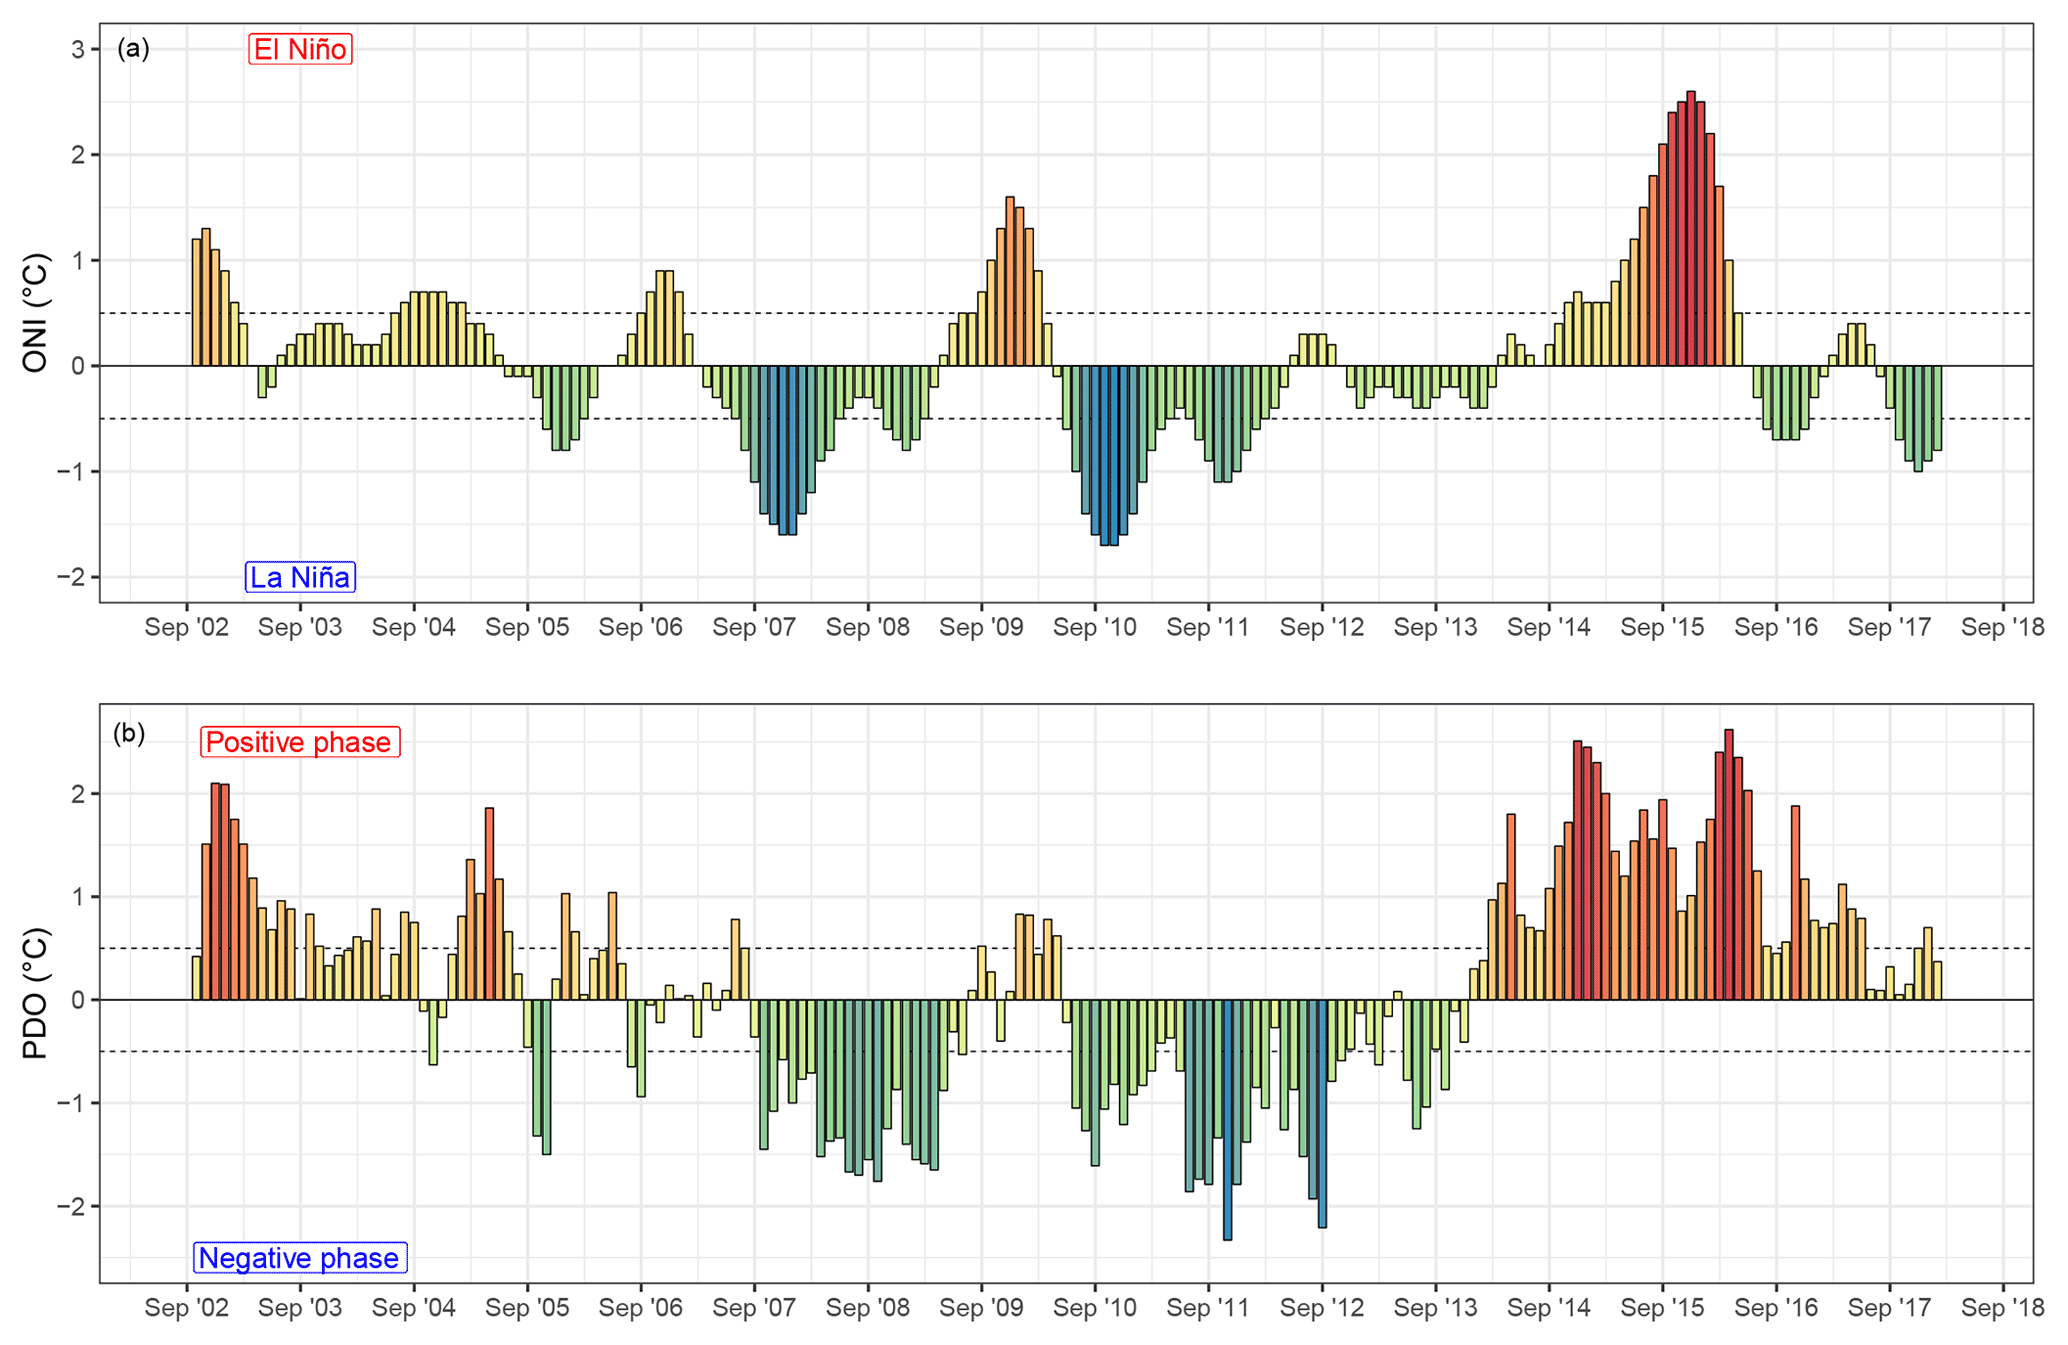
Figure 2Monthly values of the Oceanic Niño Index (ONI; a; National Oceanic and Atmospheric Adminsitration, 2019) and Pacific Decadal Oscillation (PDO; b; Joint Institute for the Study of the Atmosphere and Ocean, 2019) over time (2002–2018). ONI and PDO phases are generally considered in phase when anomalies are over 0.5 ∘C or under −0.5 ∘C (dashed grey lines) for 5 consecutive months; the ±0.5 ∘C line is marked as a dashed grey line.
A longer-lived mode of climate variability known to influence the hydroclimatology of western Canada is the PDO (Fig. 2). Like ENSO, the PDO is an organized mode of low-frequency ocean–atmosphere circulation; unlike ENSO, the PDO manifests as more of a regime shift, occurring at roughly decadal intervals (Whitfield et al., 2010). The origins and patterns of the PDO are poorly understood in comparison to the mechanisms of ENSO (Whitfield et al., 2010). An index defining the PDO was first proposed by Mantua et al. (1997); it is calculated as the leading principal component from an un-rotated empirical orthogonal function analysis of monthly SST anomalies poleward of 20∘ N for the period 1900–1993 (Whitfield et al., 2010). The PDO index has been shown to have strong links with sea level pressure and surface wind stress (Mantua et al., 1997). Stronger more coherent events may occur when the PDO phase and ENSO phase coincide (Gershunov and Barnett, 1998). Similarly to the ONI, we define PDO events of 5 consecutive months with values greater than 0.5 ∘C as positive (warm) and below −0.5 ∘C as negative (cool) phases (Kiem et al., 2003).
In this study, we summarize the seasonal teleconnection values of the ONI and PDO (Fig. 2). We define the seasons as spring (March–May), summer (June–August), fall (September–November), and winter (December–February). For example, the teleconnection indices used in this study for a given year are from March of one year until February of the following year. Over our short period of interest, the ONI and PDO are well correlated (Spearman correlation 0.56, p<0.001) and the ONI serves as a better predictor of PDO (0.74 ∘C ∘C−1, r2=0.91) than the PDO of ONI (0.42 ∘C ∘C−1, r2=0.69).
3.2 MODIS snow cover product
We combine the daily daytime 500 m MODIS C6 snow cover product from MODIS Aqua (MYD10A1) and MODIS Terra (MOD10A1) in BC, termed M*D10A1 (Hall et al., 2002; Riggs and Hall, 2015). We only use imagery acquired after 1 September 2002 as this is the first hydrological year in which both platforms are fully operational. Other studies begin their analysis of the MODIS snow cover product in 2000 (Saavedra et al., 2018), 2001 (Hammond et al., 2018), 2002 (Dariane et al., 2017), and 2003 (Pan et al., 2018). M*D10A1 measures the presence of snow cover using the normalized difference snow index (NDSI; Hall and Riggs, 2011) according to Eq. (1):
where G (green) represents MODIS band 4 (0.545–0.565 µm) and SWIR (shortwave infrared) represents MODIS band 6 (1.628–1652 µm). Fresh snow on land is highly reflective in the visible wavelengths and poorly reflective in the shortwave infrared wavelengths. The magnitude of this difference is exploited by the NDSI and normalized between −1 and 1, where pixels with NDSI >0 have snow present and those ≤0 are snow free (Riggs and Hall, 2015). The Aqua MODIS band 6 suffered failures shortly after launch, and as such MYD10A1 uses a reconstructed band 6 by applying a quantitative image restoration (QIR) algorithm (Gladkova et al., 2012). Additionally, a series of data screens are applied to allow for the quality control of the NDSI results; these include data flags stored in the product as a quality assurance band (Riggs and Hall, 2015). The resulting NDSI snow cover product is scaled between 0 % and 100 %, where 100 % represents full snow coverage. We removed water and lakes from the study area using the MOD44W V6 250 m Terra Land Water Mask (Carroll et al., 2017). Mean elevation was calculated for every MODIS pixel from the higher-resolution 30 m Shuttle Radar Topography Mission (SRTM; Farr et al., 2007). An increasing amount of studies are using M*D10A1 to study snow cover as the dataset is approaching 20 years. Most, however, use an 8 or 16 d aggregated product in order to temporally filter the influence of clouds.
3.3 Hydrozones
We use BC government hydrozone boundaries to divide our study area into 29 units (Fig. 1). These data were accessed through the “bcmaps” R-language package (Teucher et al., 2018). The hydrozones define areas that are hydrologically and geomorphologically unique based on precipitation patterns, low flows, peak flows, and underlying surficial geology (Coulson and Obedkoff, 1998). The inherent link of the hydrozones with regional hydrology makes them a logical spatial unit by which to investigate regional variation in snow duration and timing in BC.
3.4 Observation network
Automatic snow and weather station (ASWS; Fig. 1) daily observations (BCMOE, 2019) were used to calibrate the remotely sensed NDSI time series to the ASWS SWE time series. These stations are generally located near the treeline and are primarily used for river forecasting. The SWE time series was used to determine annual snow duration at each station for years with valid data between 2002 and 2018. Of the 99 available stations, only 60 had data that corresponded to the MODIS period of record. The 60 stations are located between 350 and 2030 m above sea level (a.s.l.) with an average elevation of 1485 m.
We define SDDUR as the difference between SDOFF and SDON. Our workflow consists of (1) MODIS preprocessing, (2) snow season extraction, and (3) data output. Additionally, we calibrate and validate our workflow with ASWS data (Fig. 3).
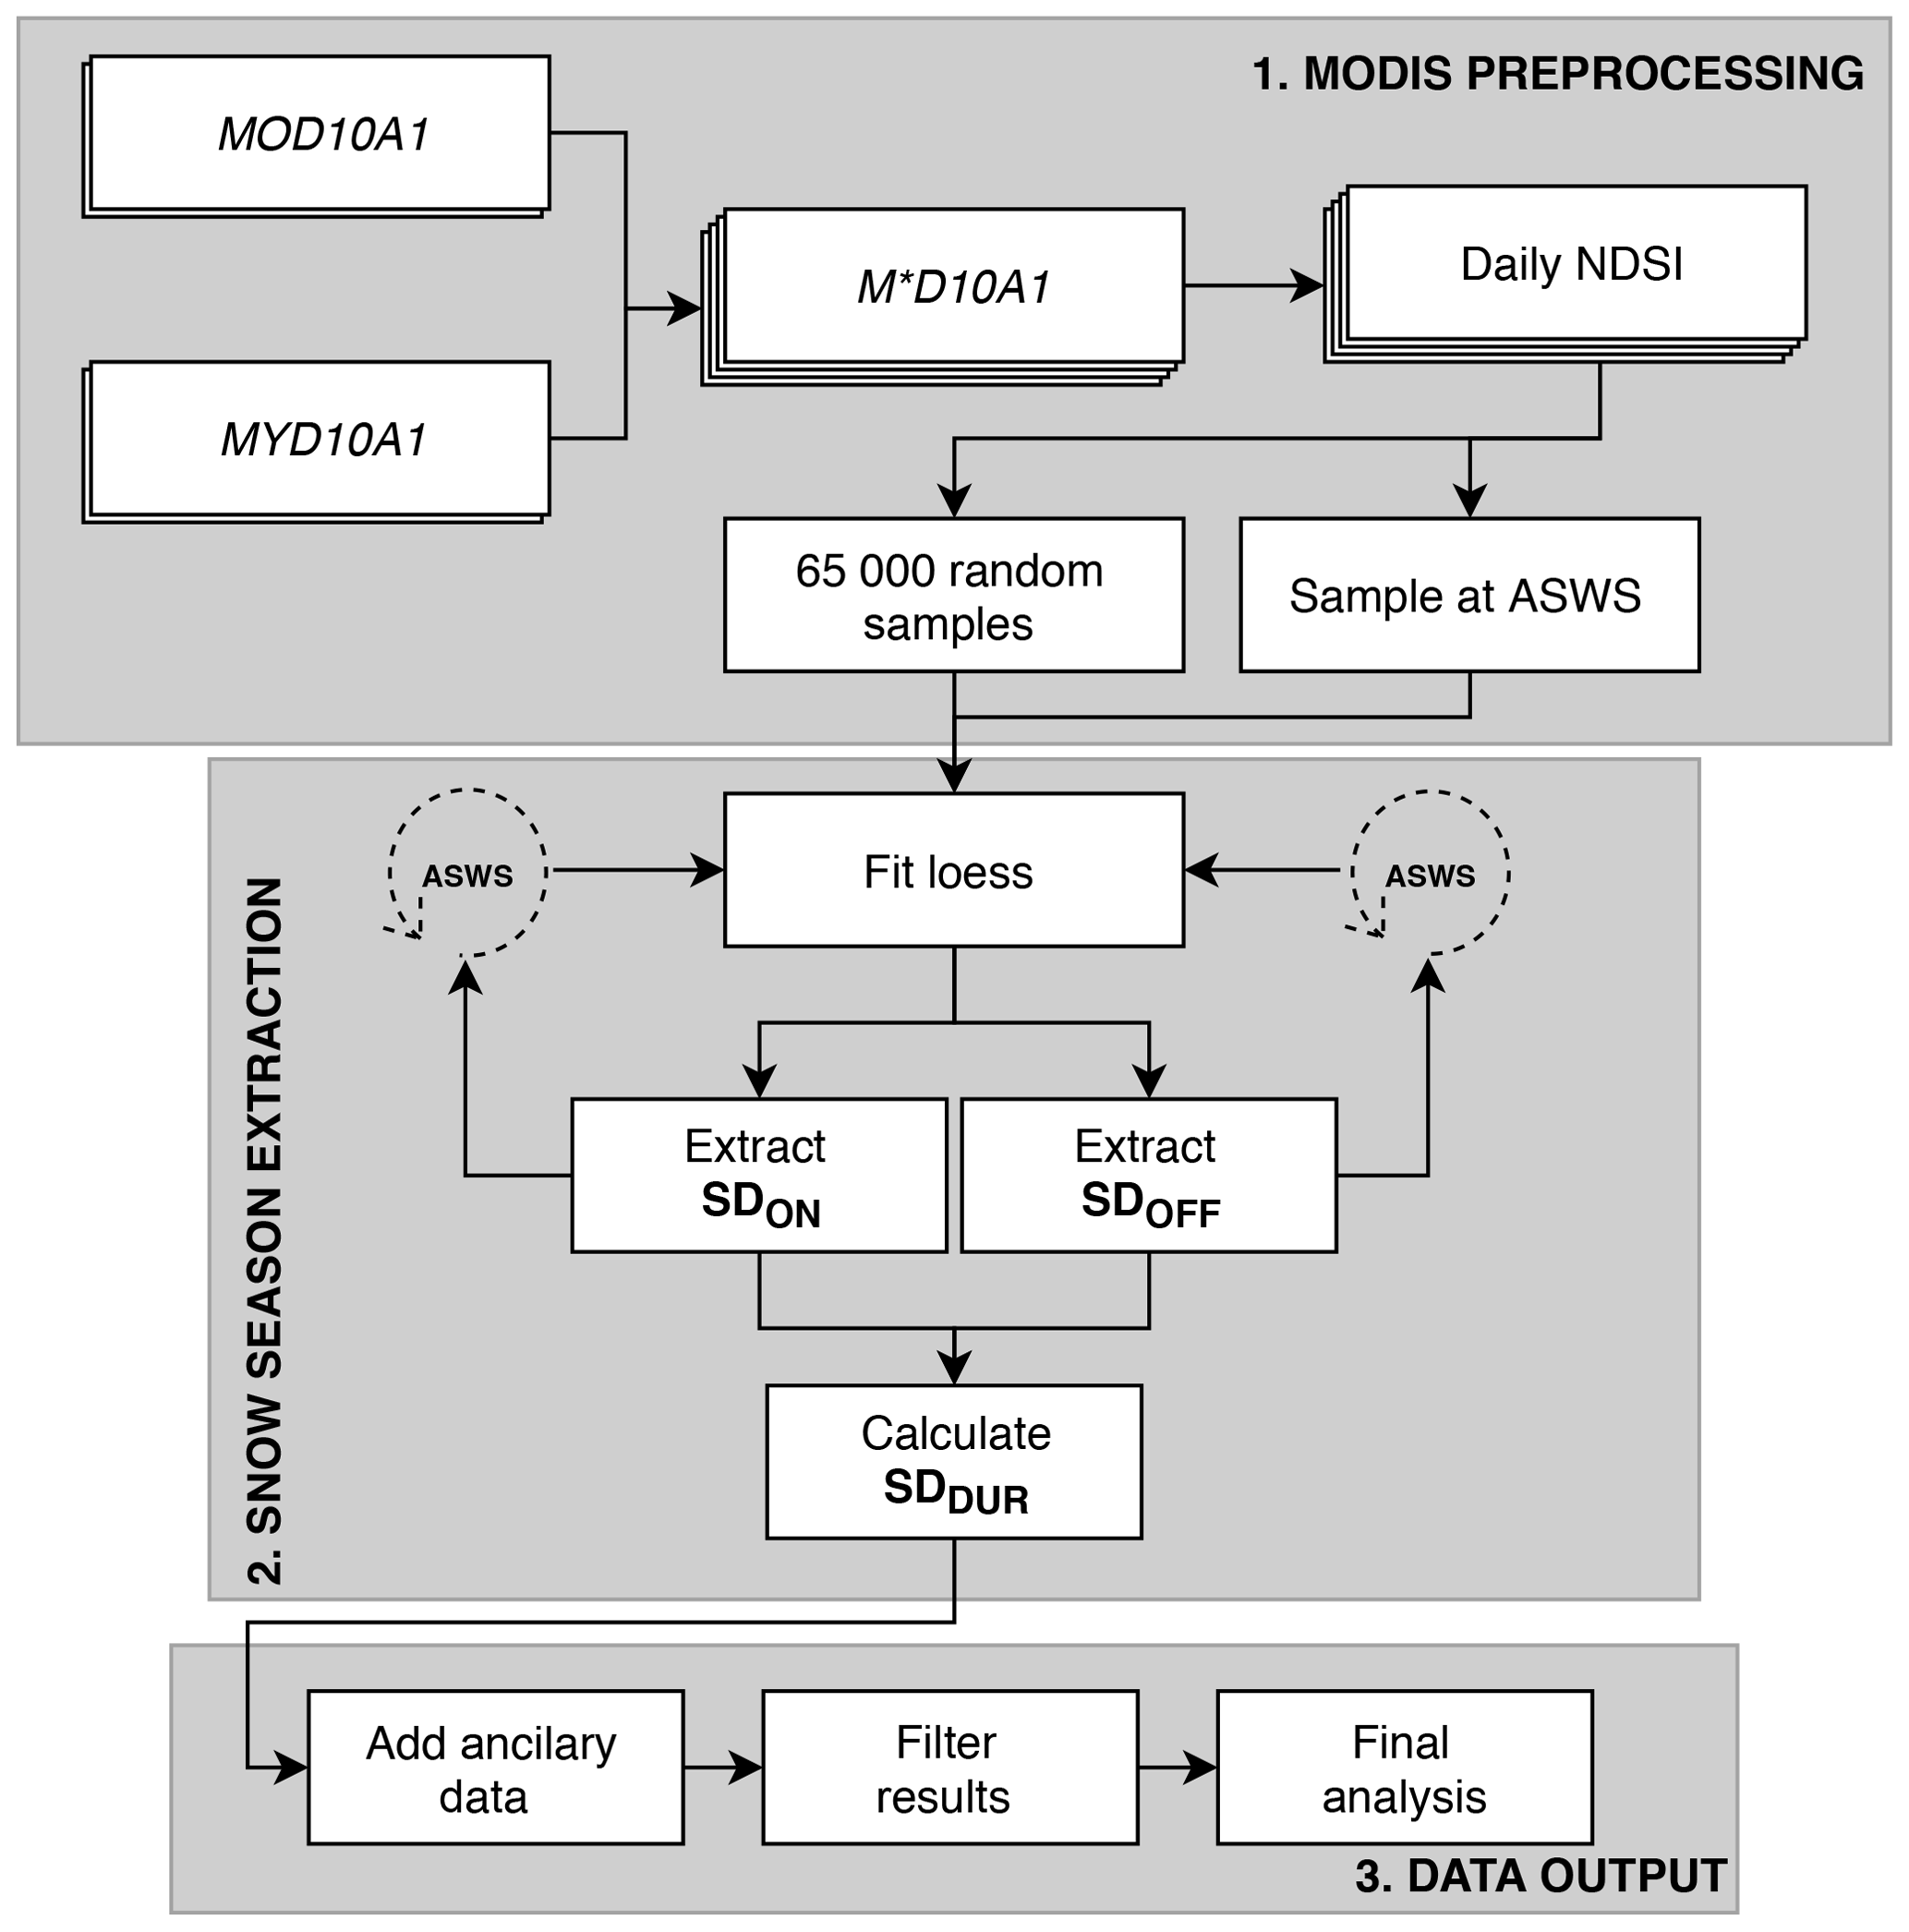
Figure 3Flowchart of methods used in this study: (1) MODIS preprocessing; (2) snow season extraction; and (3) data output.
4.1 MODIS preprocessing
Google Earth Engine (GEE) was used to combine daily 500 m MODIS snow cover products from MOD10A1 and MYD10A1, termed M*D10A1. For each day, the maximum NDSI between MOD10A1 and MYD10A1 was calculated per pixel. The daily time series (2002–2018) was then extracted at every ASWS location and at 65 000 random locations. Cloudy pixels are removed from the time series, creating gaps of missing NDSI data. Our method, explained in the following sections, interpolates the missing data in the time series. We apply a minimum threshold of 50 valid MODIS observations.
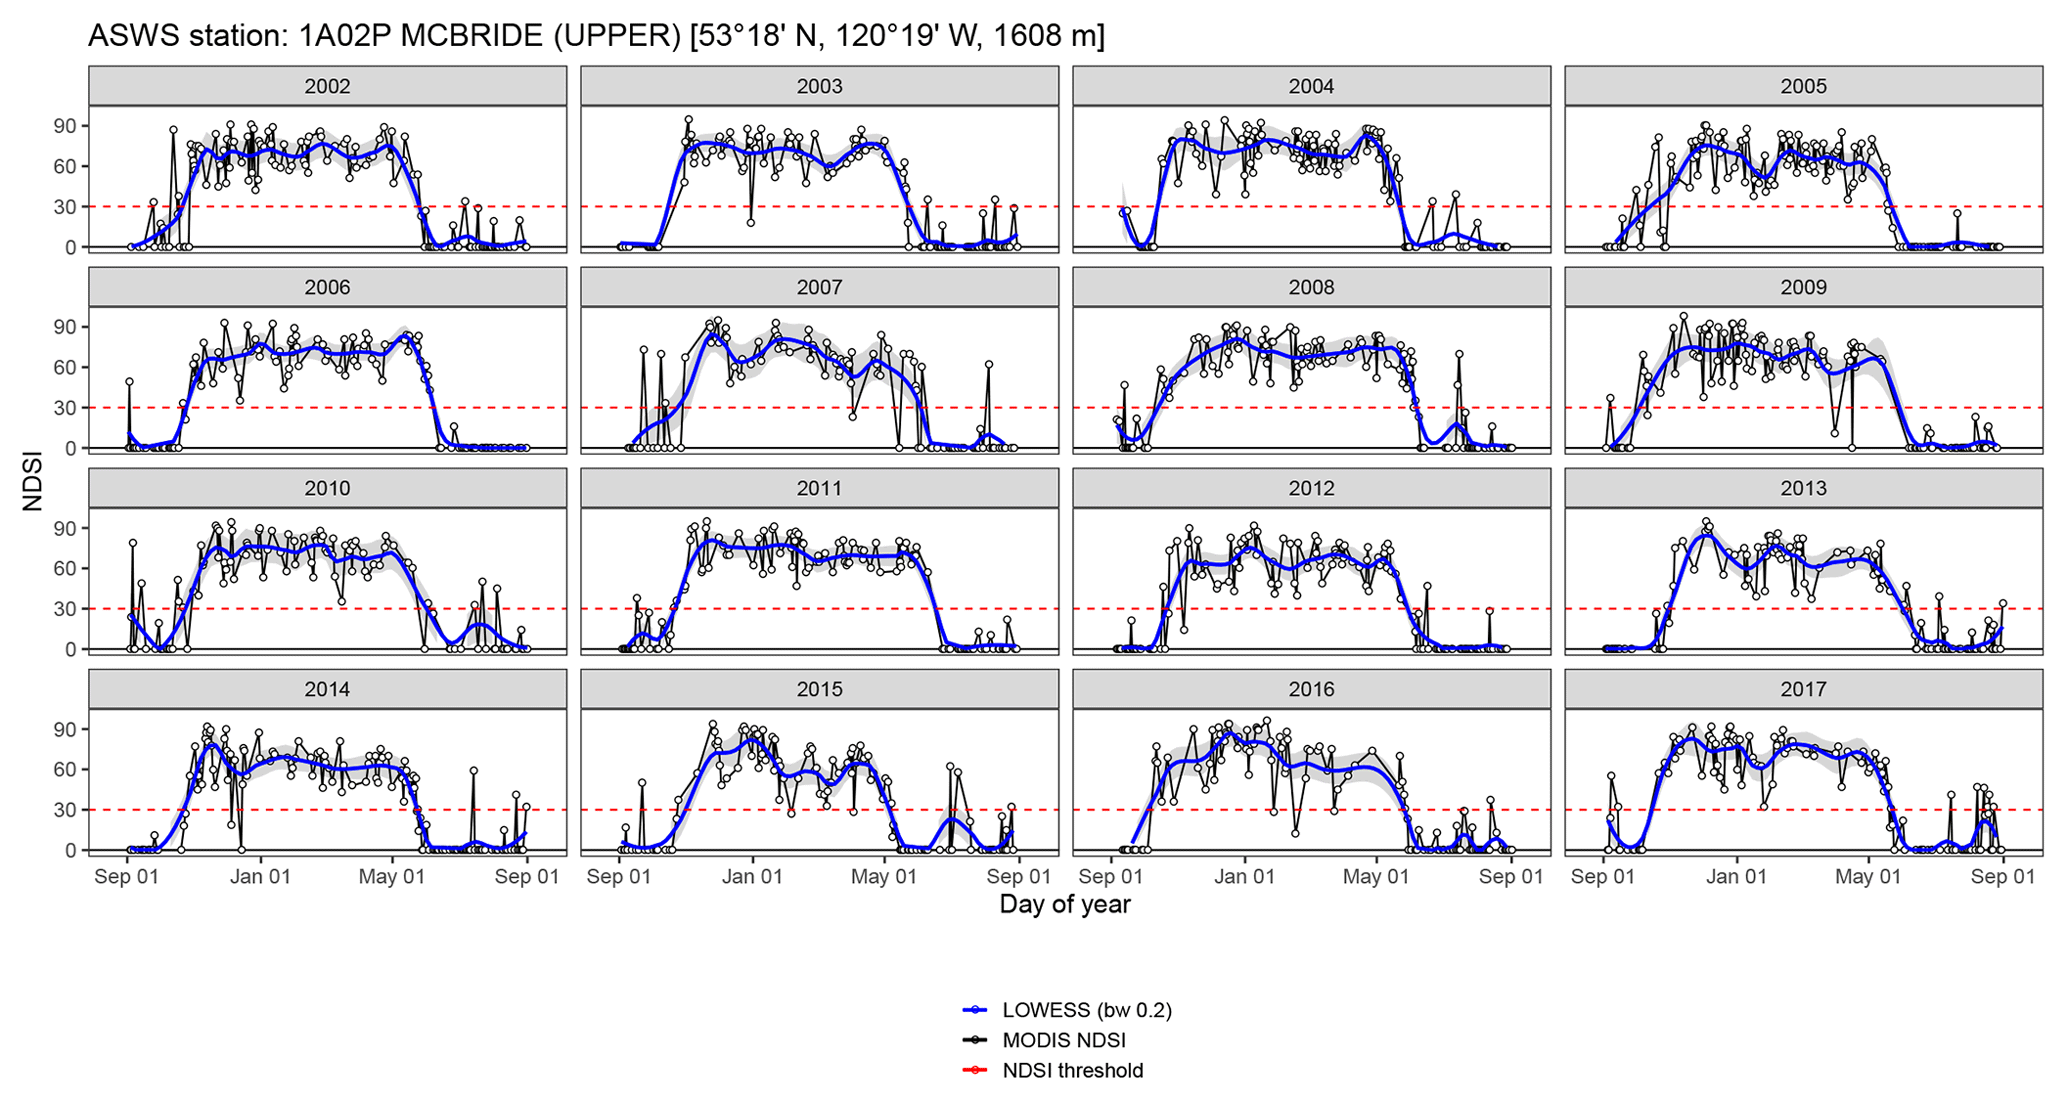
Figure 4An example of the LOWESS time series interpolation of MODIS NDSI data at the ASWS 1A02P McBride (upper) for the hydrological years 2002–2017. The dashed red line highlights the NDSI threshold of 30.
4.2 Snow season extraction
This study relies on a novel LOWESS temporal interpolation of the daily maximum NDSI to determine SDON, SDOFF, and therefore SDDUR of the longest snow cover period during the hydrological year (Fig. 4). A LOWESS interpolation is a locally weighted regression technique that permits the interpolation of missing data without over-smoothing, which would result from fitting a global function. The LOWESS proceeds by estimating a smoothed value () by taking a specified bandwidth, or search window, between 0 and 1 that represents a fraction of the total values of x to define the N closest observations and estimate using a weighted (tricube in this case) linear regression (Cleveland, 1979). In order to determine the dates of SDON and SDOFF at a location, the smoothed time series yS was used by implementing an NDSI threshold to classify a given pixel as snow covered. The LOWESS was fit using the Python open Statsmodels package. For a given hydrological year, if there were intermittent snow-covered periods, the longest continuous snow-covered period was used to define SDDUR for that season. LOWESS time series interpolation has been shown to be more resistent to gaps and outliers than other similar methods in a study of the MODIS fAPAR (fraction of absorbed photosynthetically active radiation) product (Moreno et al., 2014). Other studies have proposed methods of removing clouds from MODIS snow cover data. Spatiotemporal filtering that uses the temporal probability of snow and a digital elevation model (DEM) (Li et al., 2017), as well as a spatial k-means interpolation with dynamic time warping (Khoramian and Dariane, 2017) are some of the innovative methods being developed in the rapidly evolving field. Our focus was to find a method that easily detects SDON and SDOFF, and the LOWESS does that quickly, efficiently, and accurately.
4.3 Data output
A 500 m gridded raster of BC represents ∼3.8 million MODIS pixels. Our 65 000 samples represent a density of ∼1.7 samples per 10 km2. We only used samples identified as land that had more than 50 observations (days) per year, which reduced our sample size to 51 276 samples. Additionally, we used SRTM to assign the elevation of each sampled location.
4.4 Workflow calibration
We iterated the NDSI threshold and LOWESS bandwidth values to minimize the mean absolute error (MAE) between 75 % of the ASWSs and the corresponding MODIS values for SDON and SDOFF. We used NDSI thresholds of 10–50 at intervals of 5 for both SDON and SDOFF and LOWESS bandwidth values of 0.1–0.4 at increments of 0.05; all combinations were iterated over all of the ASWSs. The MAE was calculated for SDON and SDOFF and added to provide a combined MAE metric. Due to the discrepancy in the scale of the two SD observations (i.e., in situ vs. M*D10A1) there is often a systematic measurement bias between the MODIS and ASWS datasets. For each parameter combination, the median difference was determined per ASWS and used to correct the data for bias present in SDON and SDOFF at each of the stations. The median of the bias-corrected data was used to calculate the final combined MAE. The combination of parameters that minimized the bias-corrected combined MAE was implemented in determining the final SDDUR from the M*D10A1 data. If parameter sets were very close in combined MAE, the standard deviation of the residual distributions was also considered for SDON and SDOFF. Then we validate the optimal thresholds against the remaining 25 % of the ASWSs to assess the transferability of our findings. Future work could include a “per station” analysis of slope, aspect, land cover, and other location attributes.
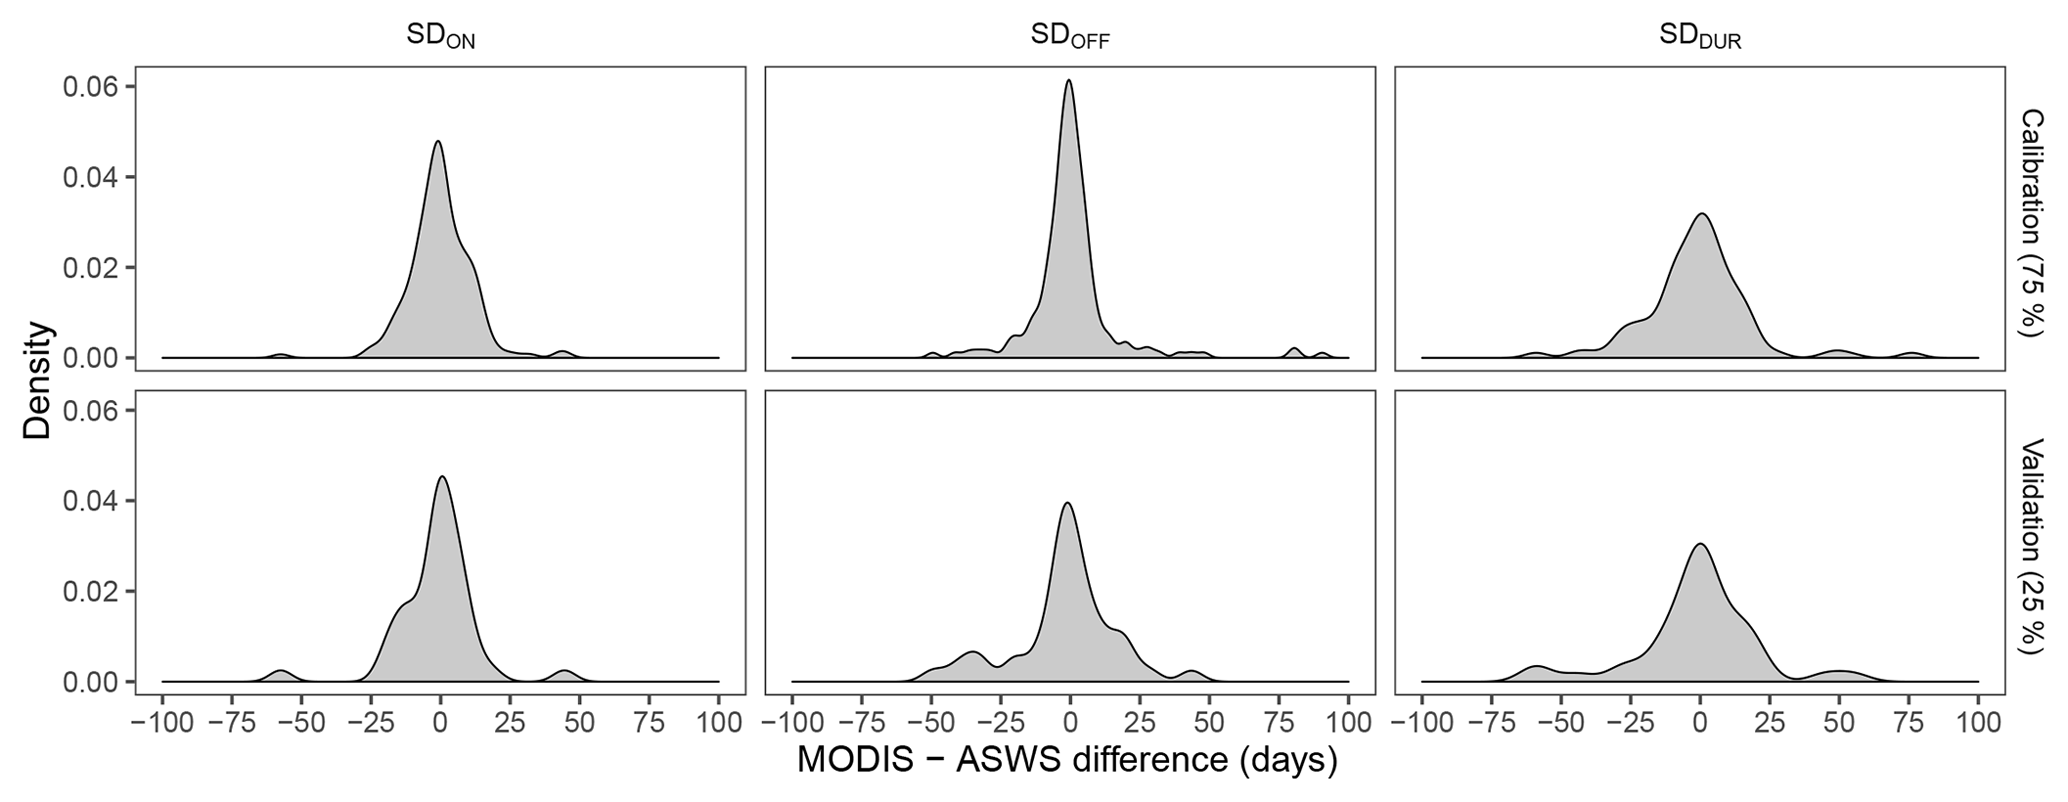
Figure 5Distribution of errors calculated from the difference between MODIS and ASWS values for each snow measurement. Using the calibration dataset (75 % of the ASWS data) for SDON, SDOFF, and SDDUR, respectively, the mean error is 0.82, 0.62, and −1.64 d; the mean absolute error (MAE) is 8.7, 8.9, and 13.1 d. Using the validation dataset (25 % of the ASWS data) for SDON, SDOFF, and SDDUR, respectively, the mean error is 2.5, −2.1, and −4.0 d; the MAE is 12.7, 12.6, and 16.6 d.
4.5 Statistical analysis and error estimation
In this study, we use linear least squares (LLS) regression to test the effect of our explanatory variables (ONI, PDO, time, and elevation) on the response variables (SDON, SDOFF, and SDDUR). In addition, we apply the nonparametric Spearman rank-order correlation (rS) to determine the relative strength of these relationships. We intentionally imply causation between the ONI and PDO on the measurements of SDON, SDOFF, and SDDUR and seek to test that relationship. We support our assumption of causation with a corresponding theoretical framework throughout our discussion. The rS was used because it does not require any distributional assumptions. We chose to use both of these statistical tests (LLS and rS) as they each have advantages and disadvantages. LLS provides a tangible unit of days per degree Celsius anomaly (d ∘C−1) that is easily interpreted and useful in hydroclimatological applications; however, the LLS results are influenced by the magnitude of the explanatory variable. The rS is a well-suited metric to determine correlations with the multiple explanatory variables, but it cannot easily be applied to predict hydroclimatology.
Using 10 000 iterations of our workflow, we adjust the values of SDON, SDOFF, and SDDUR with randomly selected values from the actual difference between the MODIS and ASWS data for each measurement to assess the impact of the inherent measurement uncertainty on our results. The error bars presented throughout this study were determined from the interquartile range of the resulting distribution of the iterated statistic.
5.1 Workflow validation
Comparisons of the M*D10A1-derived SDDUR and SDDUR-ASWS were made over the study period (Fig. 5). The spatially corresponding M*D10A1 pixel was compared for each ASWS and for each hydrological year, and we calibrated our workflow using 75 % of the ASWS data. The parameter values that minimized the combined MAE were a LOWESS bandwidth of 0.2 and an NDSI threshold of 30 for SDON and SDOFF. The error distributions for SDON, SDOFF, and SDDUR are summarized in Fig. 5. The bias-corrected MAE of 8.7, 8.9, and 13.1 d was observed for SDON, SDOFF, and SDDUR, respectively. We acknowledge that other bandwidth and NDSI threshold combinations may improve results in other geographic regions or within subregions of BC and are dependent on the training data used in this study. However, we caution against the over-optimization of parameters due to the inherent difference in scale between the MODIS pixels and the ASWS snow pillows. Using the remaining 25 % of the ASWSs, which we use as a validation dataset, we find bias-corrected MAE of 12.7, 12.6, and 16.6 d for SDON, SDOFF, and SDDUR, respectively (Fig. 5).
5.2 Snow water equivalent
We define the presence of snow from SWE measurements using a threshold of 20 mm. We chose a threshold of 20 mm by visually inspecting a subset of ASWSs; other work has applied a threshold of 0 mm (e.g., Lindsay et al., 2015) and 5 mm (e.g., Marks et al., 2013). We then identified the longest continuous duration of SWE over the hydrological year (1 September–1 September) and record the start (SDON-ASWS), end (SDOFF-ASWS), and duration (SDDUR-ASWS) of snow cover on a station-by-station basis. Although M*D10A1 does not directly provide an indication of SWE, using the ASWS SWE time series we see SDDUR-ASWS exhibits a significant exponential relationship with corresponding peak SWE (Fig. 6). The observed relationship between peak SWE and SDDUR-ASWS suggests that the findings of this study are relevant to water managers and seasonal forecasters.
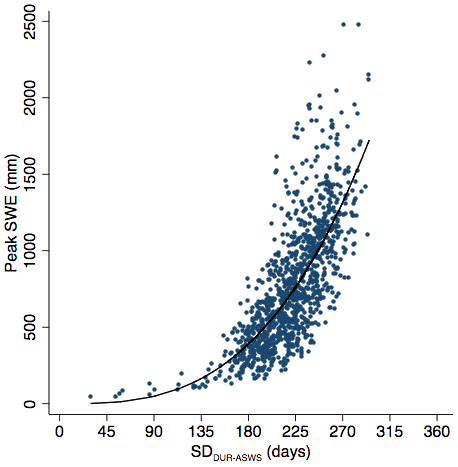
Figure 6Scatterplot of SDDUR-ASWS and the corresponding peak snow water equivalent (SWE) for all automatic snow weather stations (ASWSs) with valid data for a given year. The general relationship between SDDUR-ASWS and peak SWE appears to be nonlinear and is described best by a power function.
5.3 Snow season results
We summarize MODIS-derived snow season results in Fig. 7 as deviations from the zonal mean for each hydrozone and for all BC. These values are not for the entire zones; rather, they are only for areas that meet the minimum observation criteria. The hydrozone with the longest mean annual SDDUR is the northern Coast Mountains (252 d), likely because of their relatively high elevation, latitude, and proximity to the Pacific Ocean, leading to ample snow accumulation and glaciation. The hydrozone with the shortest SDDUR is Haida Gwaii (70 d), likely because of relatively low elevation and a substantial maritime influence causing moderate winter temperatures and winter precipitation as rain. When comparing interannual variability, the following patterns emerge: SDDUR is anonymously short over the 2002, 2004, 2014, and 2015 hydrological years with mean provincial SDDUR anomalies of −13, −9, −13, and −19 d, respectively. Conversely, anonymously long SDDUR years include the 2006, 2007, 2010, and 2011 hydrological years with mean provincial SDDUR anomalies of +10, +16, +12, and +13 d, respectively (Fig. 7). However, there is much inter-zonal variability in SD for any given year. Interestingly, some short snow seasons are caused by positive SDON anomalies (e.g., 2002), and others are caused by earlier SDOFF anomalies (e.g., 2004, 2014, 2015). Using Fig. 2, we do not interpret the positive difference from the zonal mean in 2002 as an error; this event is likely the result of a combined strong ONI and PDO.
In addition to summarizing the snow cover by hydrozone, we investigate the influence of latitude, longitude, and elevation on the values of SDON, SDOFF, and SDDUR (Fig. 8). Overall, they are all important controls on snow cover in British Columbia. Elevation is the most important terrain variable and influences SDON, SDOFF, and SDDUR by −30.1, 66.9, and 97.0 d per vertical kilometer, respectively, while the influence of latitude is −3.2, 3.9, and 7.2 d per degree of latitude, respectively; longitude has the least important influence of 1.9, −2.4, and −4.3 d per degree of longitude, respectively (Fig. 8).

Figure 7Difference from the mean of SDON, SDOFF, and SDDUR (in days) for each hydrozone and for all BC over time. Mean zonal values (in days after 1 September for SDON and SDOFF; in days for SDDUR) are found at the right-hand side of each plot. The x axis is in hydrological years starting on 1 September for each year; for example, the label 2002–2003 represents 1 September 2002–1 September 2003.
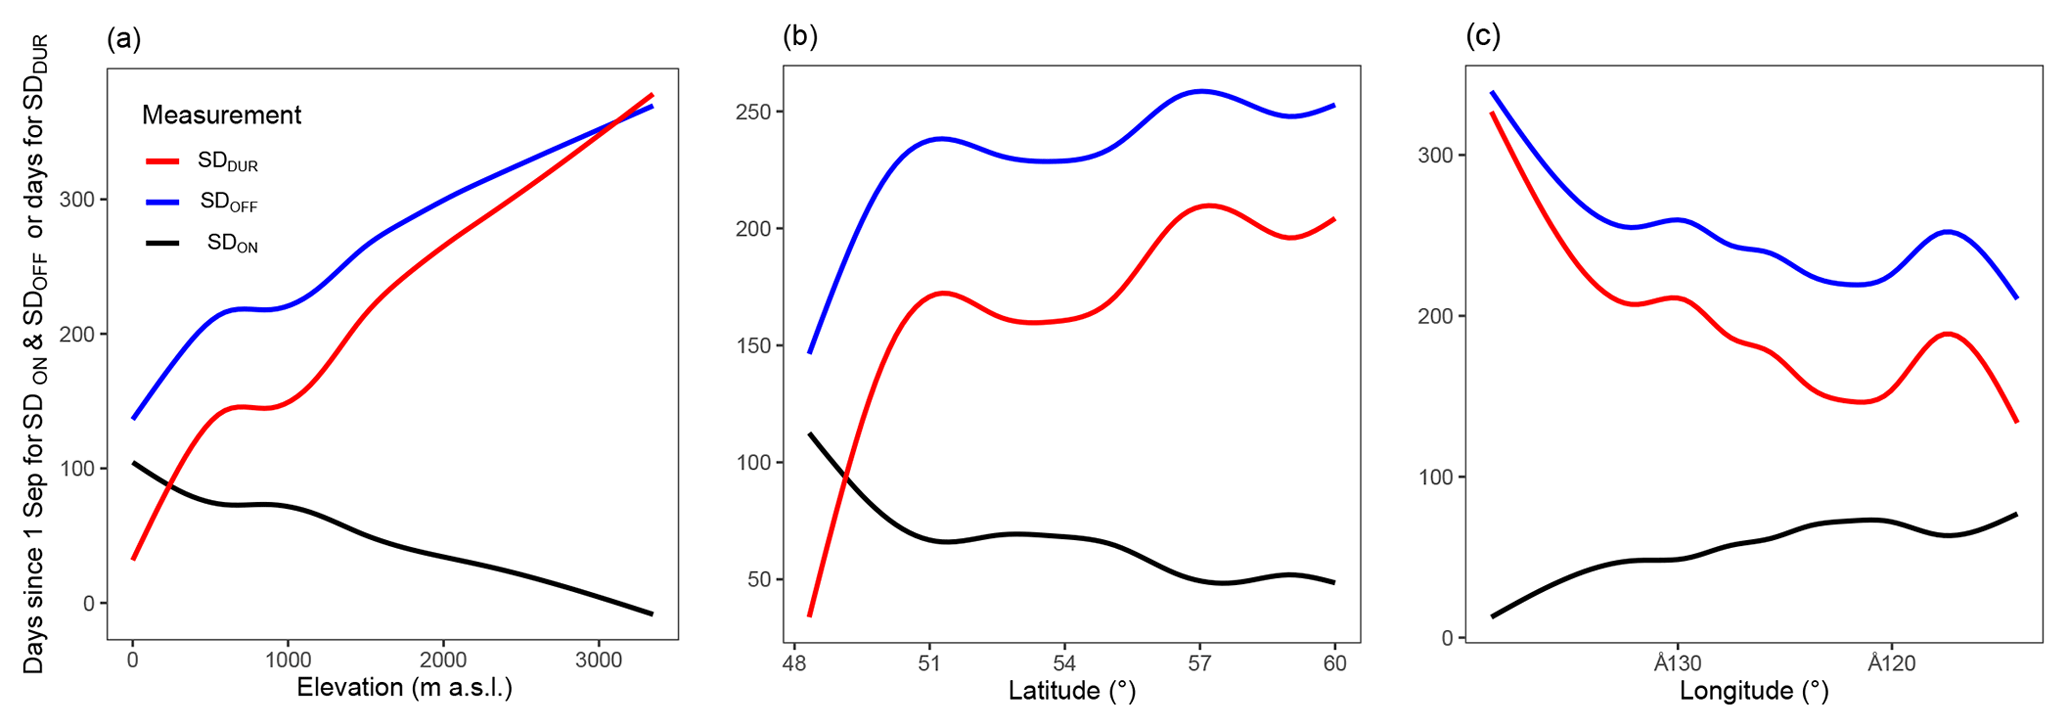
Figure 8Three-panel plot of the influence of elevation (a), latitude (b), and longitude (c) on the mean MODIS-derived value at each random sample point of SDON (black line, in days since 1 September), SDOFF (black blue, in days since 1 September), and SDDUR (red line, in days).
5.4 Ocean–atmosphere teleconnections
5.4.1 Provincial results
Provincially, LLS and rS for both ONI and PDO have significant negative relationships with SDOFF and SDDUR, and no significant relationships were found with SDON (Table 1). ONI has a larger-magnitude LLS coefficient than PDO for both SDOFF and SDDUR; however, the rS results are roughly the same, indicating a similar degree of correlation. The largest-magnitude effect is between the ONI and SDDUR, with a coefficient of d ∘C−1 (p<0.001). The strongest negative correlation is between ONI and SDDUR (, p<0.001). We conclude that, similar to previous studies (e.g., Fleming and Whitfield, 2010; Moore and McKendry, 1996; Whitfield et al., 2010), El Niño (La Niña) events and positive (negative) PDO events result in earlier (later) melt and shorter (longer) snow duration in BC.
Table 1Provincial summary of a linear least squares (LLS) regression in days per teleconnection degree Celsius anomaly (d ∘C−1) and Spearman rank-order correlations (rS) for SDON, SDOFF, and SDDUR with ONI and PDO. Coefficient significance is given by the number of stars next to a value. Teleconnection values are the annual mean of the four seasonal values (Fig. 2).
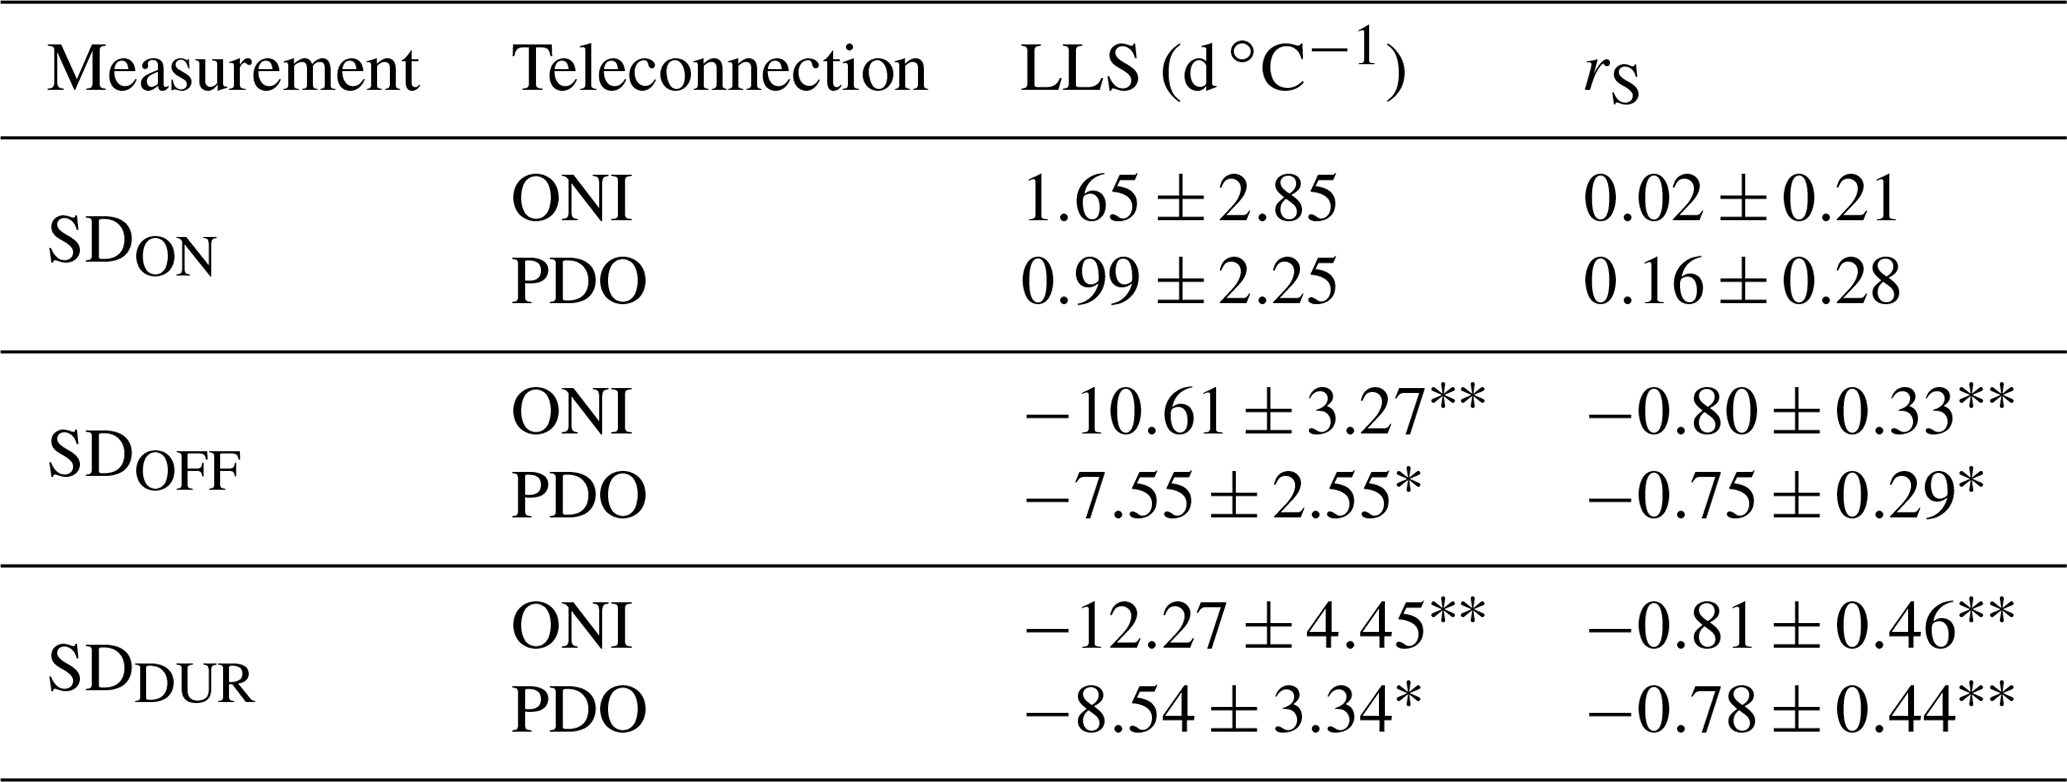
Significance level: * p<0.01, p<0.001.
When we compare seasonal ONI and PDO values to provincial snow measurements (SDON, SDOFF, and SDDUR), we see seasonal variation in the response (Fig. 9). The two largest-magnitude LLS relationships exist between SDDUR ( d ∘C−1, p<0.005) and SDOFF ( d ∘C−1, p<0.005) with the summer ONI (Fig. 9). During the period of study, moderate to strong ENSO phases crossed the ∘C SST threshold during the summer and in some cases persisted through the following summer, whereas weaker events did not follow this pattern. Although the results are similar between the LLS and the rS methods, the rS is most appropriate for comparing between the two teleconnections. The two strongest rS coefficients exist between the winter PDO for both SDDUR (, p<0.001) and SDOFF (, p<0.001). In general, we find that the fall is the second highest correlated season after the winter. There are no significant rS correlations between SDON and any of the seasons, nor are there any significant rS correlations between the spring teleconnections and any of the snow measurements (Fig. 9).
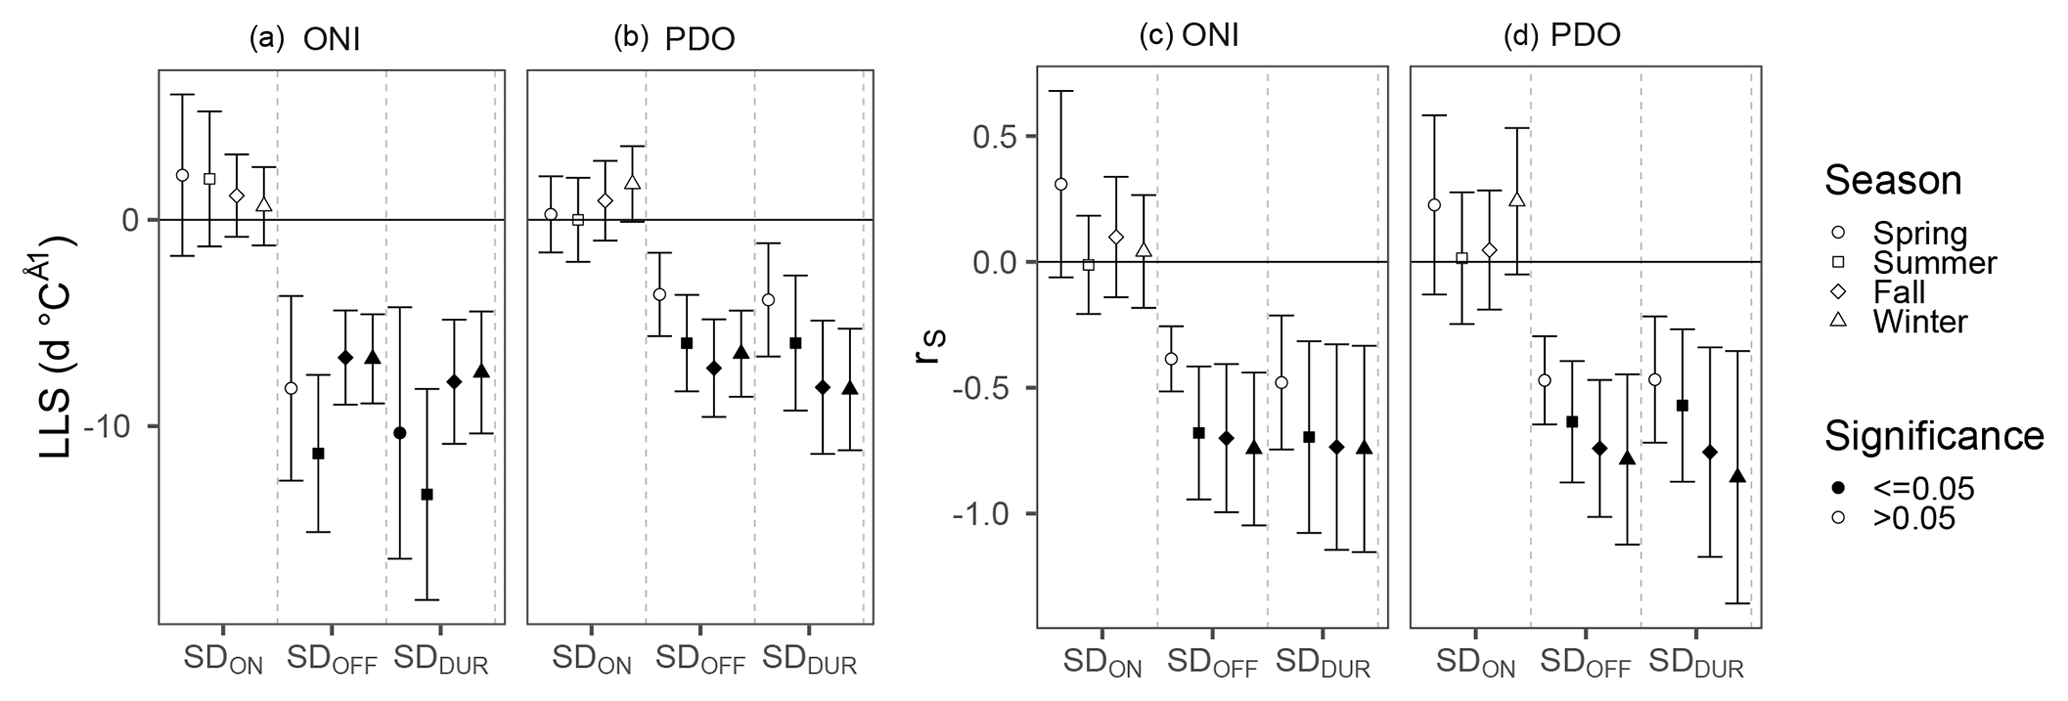
Figure 9Summary of the linear least squares (LLS; a, b) and Spearman correlation coefficients (rS; c, d) for each of the three measurements (SDON SDOFF, and SDDUR) by teleconnection (ONI and PDO) and season. The y axis shows the rate of change in days per degree Celsius teleconnection anomaly (d ∘C−1) and the Spearman correlation coefficient (rS). The point fill denotes insignificant relationships (p>0.05) as white and significant ones (p≤0.05) as black. Error bars represent the 25th and 75th percentiles of the 10 000 iterations during which the snow measurements are adjusted using a random sample of the difference between the MODIS data and the ASWS data. See the Supplement for all plotted values.
5.4.2 Regional patterns
Important regional patterns emerge when we aggregate the data by hydrozone. These patterns broadly reflect the continentality, latitude, and elevation of the hydrozones. Very few hydrozones outside northwest BC have significant LLS relationships between any of the seasonal teleconnections and SDON (Fig. 10). Of those that are significant, the three greatest-magnitude LLS values for SDON are all with the spring ONI; they are Stikine Plateau (6.08±4.01 d ∘C−1, p<0.05), the northern Coast Mountains (5.24±3.85 d ∘C−1, p<0.05), and northern–central Uplands (4.57±3.89 d ∘C−1, p<0.05). For SDOFF, most of the province has significantly negative LLS with the summer, fall, and winter ONI values (Fig. 10). The three strongest relationships with SDOFF are found in eastern Vancouver Island ( d ∘C−1, p<0.005), the central Coast Mountains ( d ∘C−1, p<0.005), and western Vancouver Island ( d ∘C−1, p<0.05), all with summer ONI. For SDDUR, we find the greatest-magnitude trends and a spatial distribution that closely resembles SDOFF. The three strongest relationships with SDDUR are found in western Vancouver Island ( d ∘C−1, p<0.01), eastern Vancouver Island ( d ∘C−1, p<0.01), and the central Coast Mountains ( d ∘C−1, p<0.01) with the summer ONI. All values for all regions are reported in Table S7 in the Supplement.
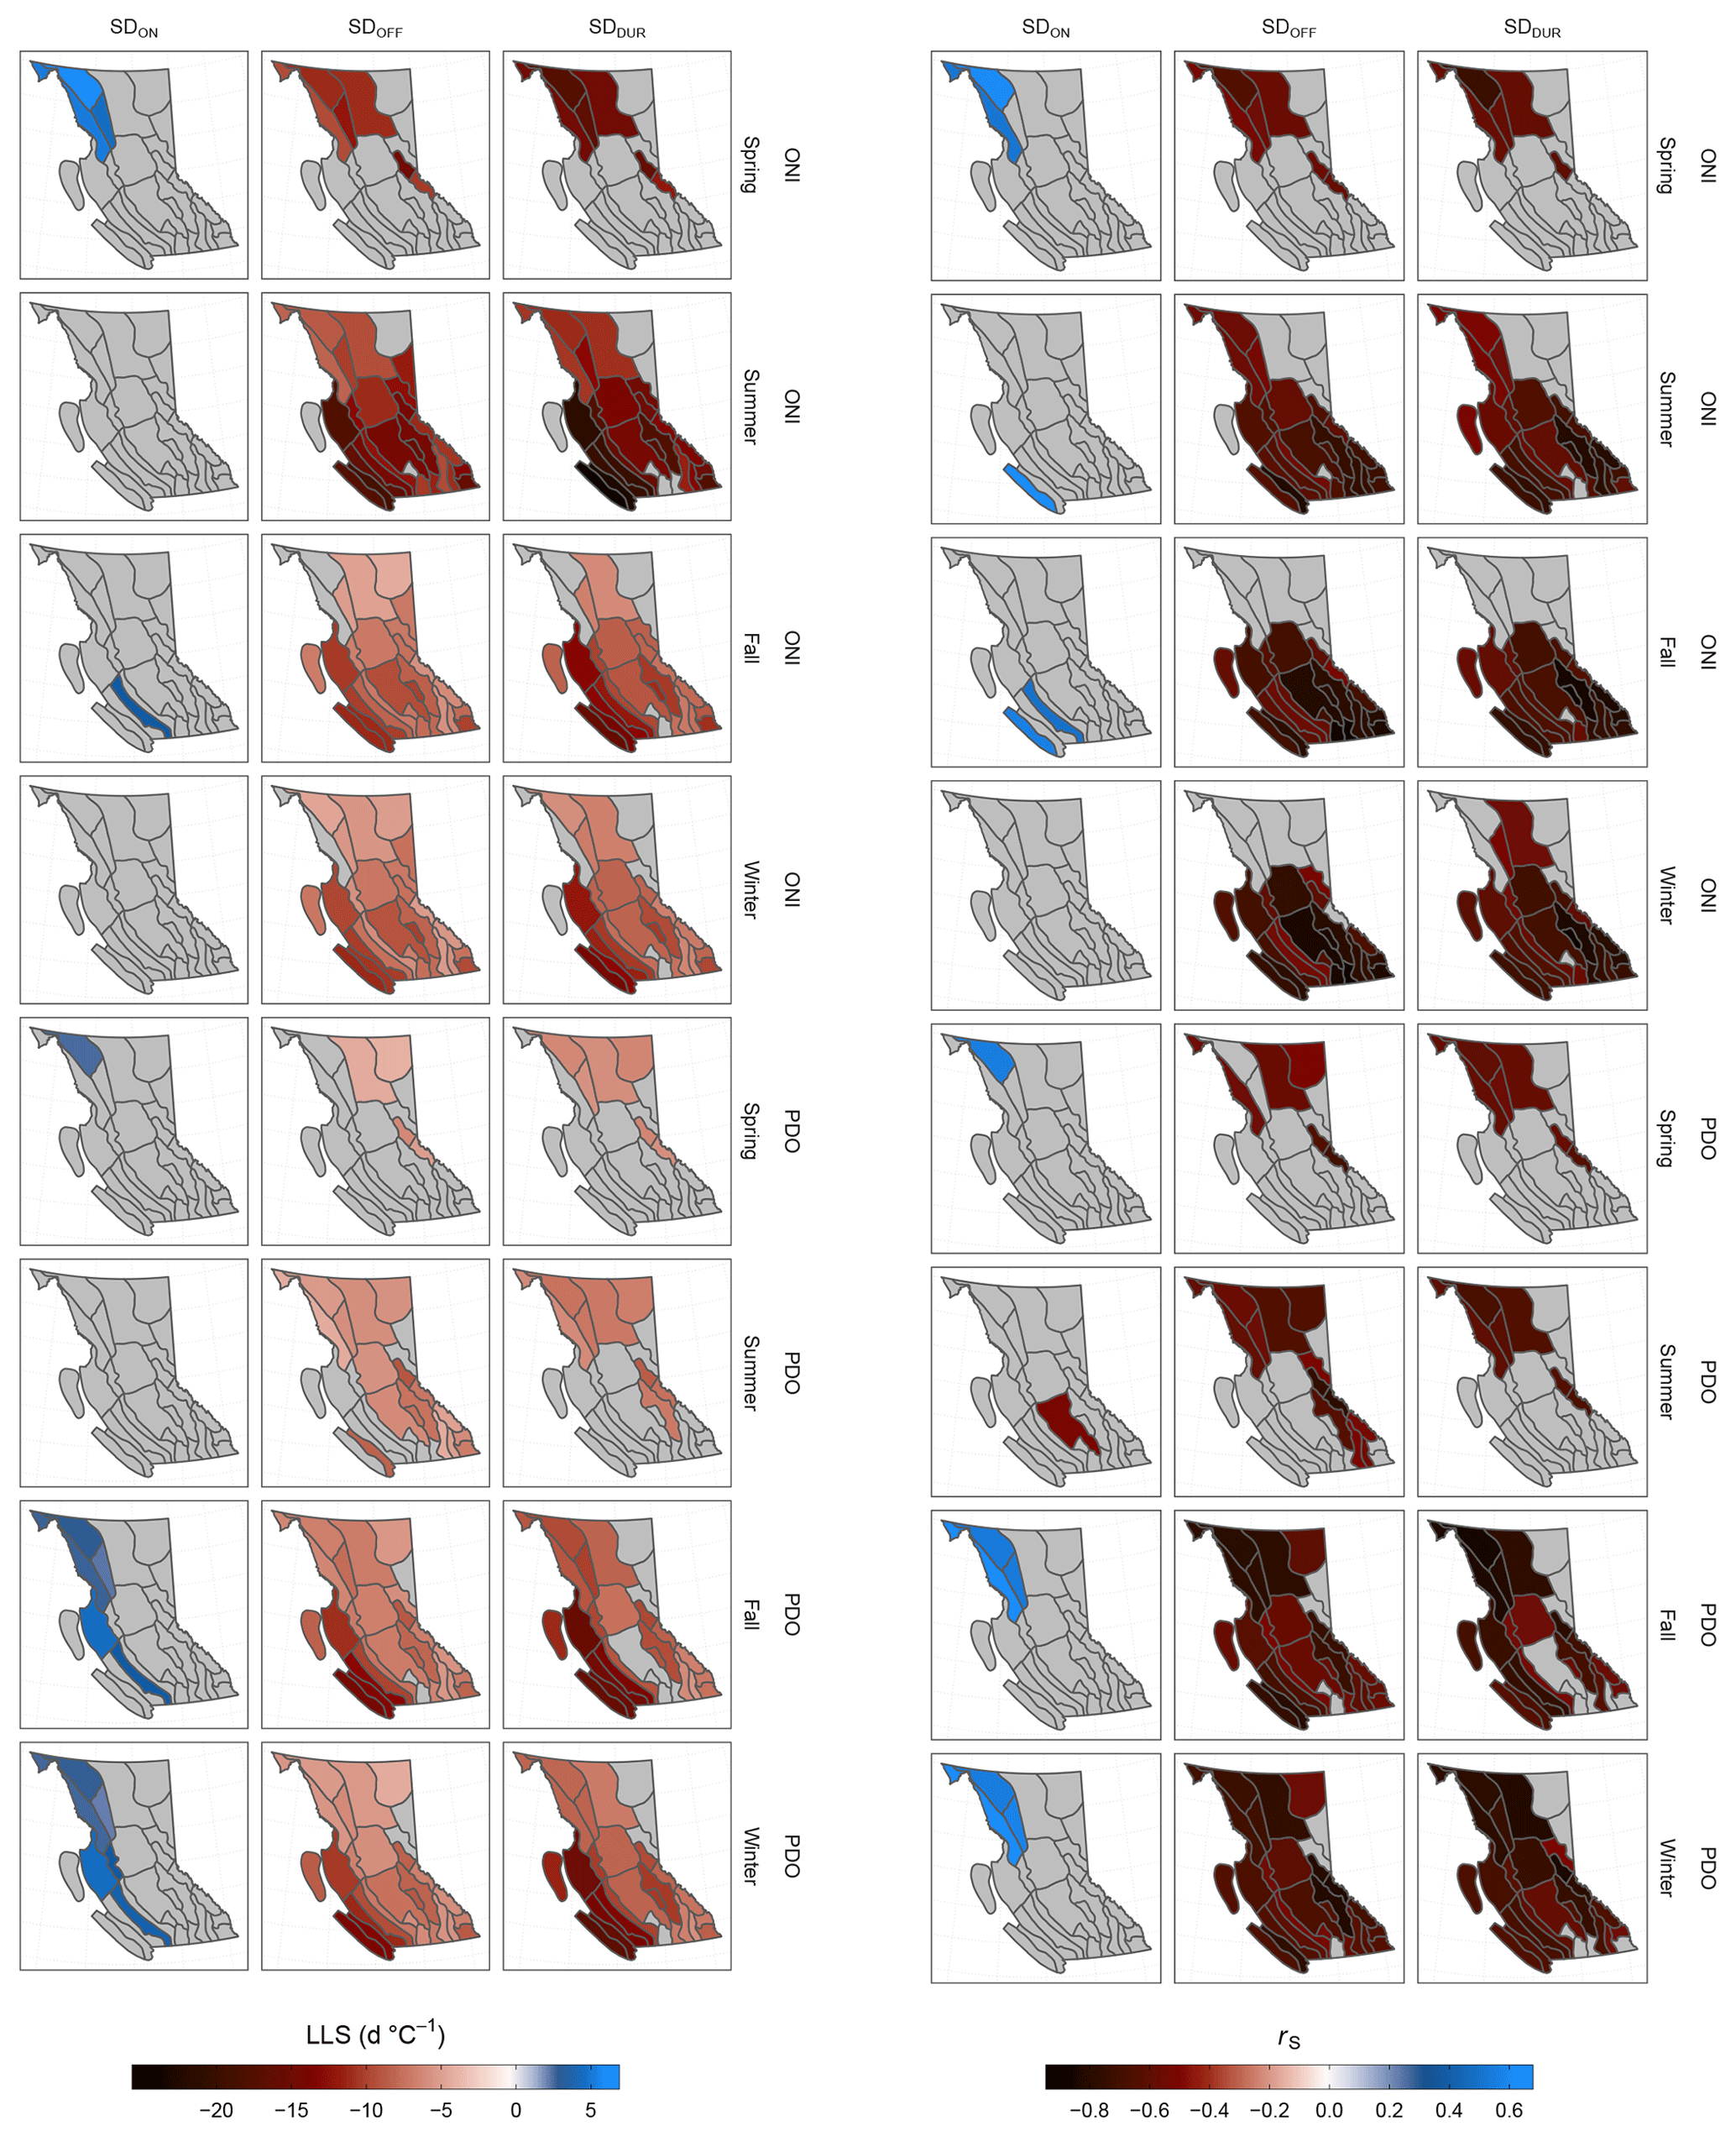
Figure 10Map of BC showing the linear least squares (LLS) rate of change in days per degree Celsius anomaly (d ∘C−1; left) and Spearman correlation coefficients (right) for SDON, SDOFF, and SDDUR (per column) with seasonal (spring, summer, fall, winter) ONI and PDO values (per group of four rows) by hydrozone. Grey zones have insignificant trends (p>0.05). Use Fig. 1 for spatial reference. See the Supplement for raw values and error bars.
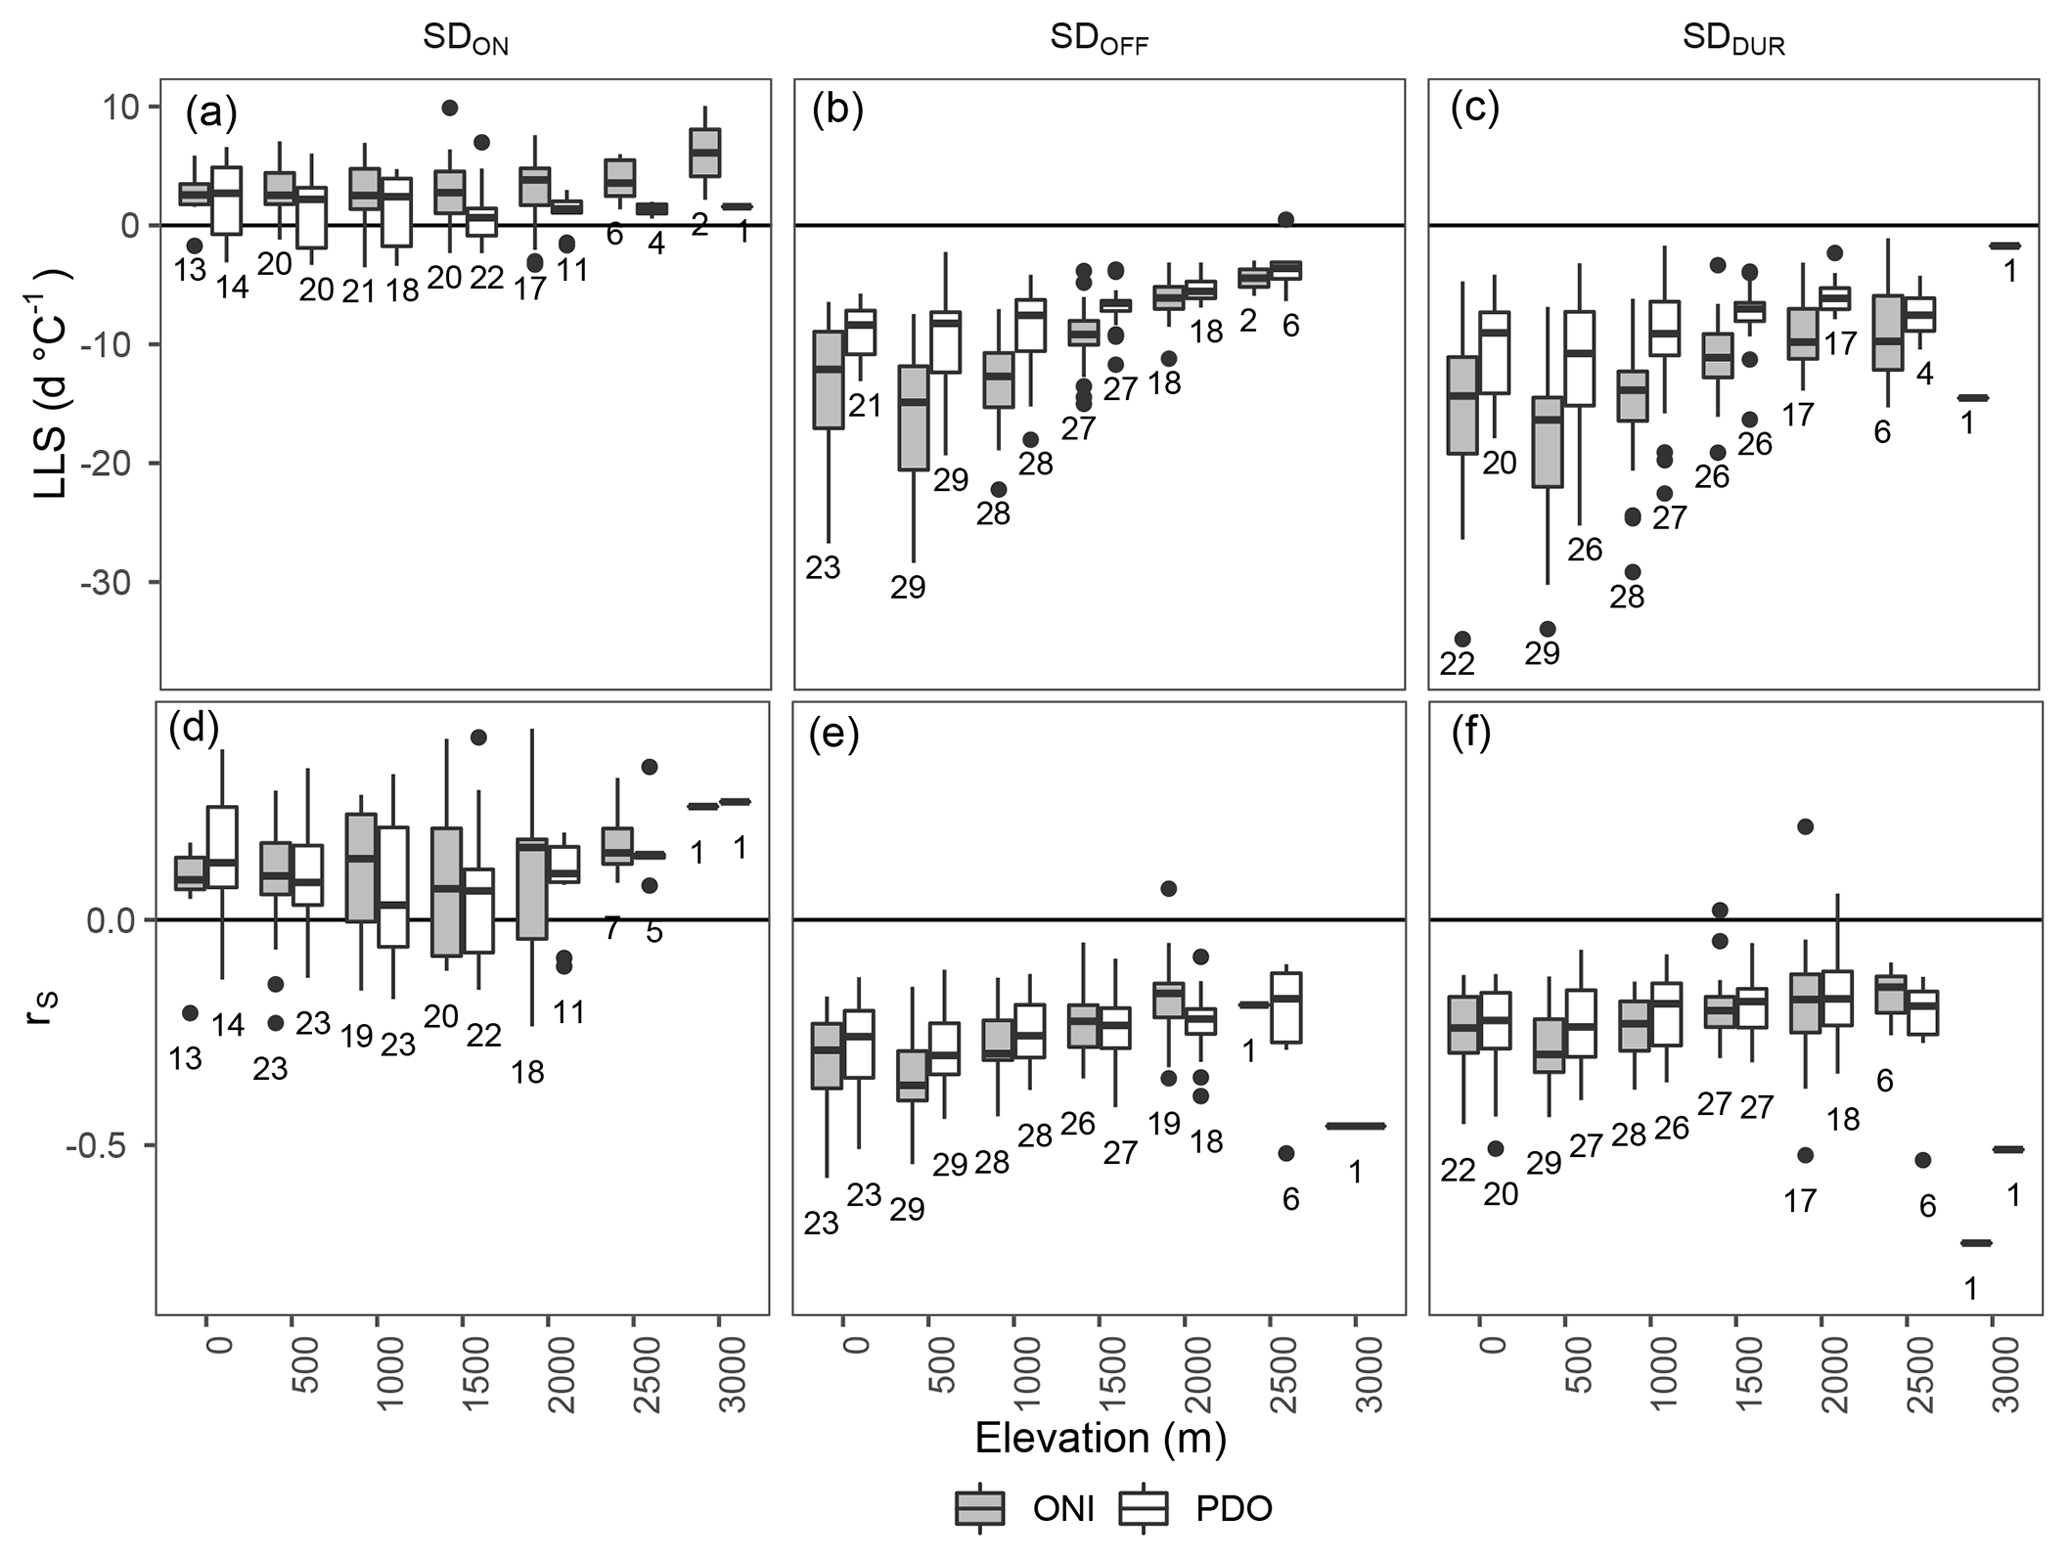
Figure 11Linear least squares (LLS; a, b, c) and Spearman correlation coefficients (rS; d, e, f) per hydrozone for SDON, SDOFF, and SDDUR with ONI and PDO in 500 m elevation bins. Only correlations with p values ≤0.05 are shown. Box plots represent the median (black horizontal line in box), the 25th and 75th percentile ranges (box limits), and the 5th and 95th percentile ranges (whiskers), with outliers shown as black points. The sample size of each box is shown below it with a maximum of 29 values (one per hydrozone).
Using rS coefficients we compare spatial patterns in the relationship of the teleconnections with SD. Similar to the LLS results, the rS correlations for SDON are only significant for a few hydrozones. Positive correlations occur in northwest BC during the spring ONI and the fall and winter PDO (Fig. 10). The three strongest correlations with SDON are the northern Coast Mountains with the winter PDO (0.64±0.65, p<0.01), western Vancouver Island with the summer ONI (0.63±0.40, p<0.01), and the northern Coast Mountains with the fall PDO (0.61±0.62, p<0.05). For SDOFF, we find similar significance patterns as those found for LLS. Namely, the effect of spring teleconnections on SDOFF in the southern half of the province is generally not significant, and when there is a significant effect, it is always negative. All significant SDOFF correlations fall between −0.5 and −0.91. The strongest correlations are found in the Okanagan Highland with the winter ONI (, p<0.001) and the fall ONI (, p<0.001) and in southern Thompson Plateau with fall ONI (, p<0.001). As for the SDDUR, we again find good agreement with LLS. Few regions display significance in the northeast, and the results are negative throughout the province. There are few regions that have significant correlations in southern BC with either the spring teleconnections or with the summer PDO (Fig. 10). The strongest relationships are found in the southern Quesnel Highland with the winter ONI (, p<0.001) and the fall ONI (, p<0.001) and the northern Columbia Mountains with the fall ONI (, p<0.001).
5.5 Elevation dependency
Using rS and LLS (Fig. 11) we find that, for SDON, all significant results (p<0.05) have a positive median rS and LLS (Fig. 11), indicating that when the ONI and/or PDO are in their warm phase, SDON increases (becomes later) to a similar degree at all elevations. The range of values per elevation bin is smaller for the ONI than the PDO at low elevations. However, the number of significant relationships diminishes above 2000 m a.s.l. Nearly all SDOFF rS and LLS values are negative for all elevations and trend towards zero at 2500 m a.s.l. Below 2500 m a.s.l., values decrease until 500 m a.s.l. and increase again at 0. This suggests that lower elevations are more sensitive to changes in ONI and PDO. SDDUR has a very similar distribution by elevation as SDOFF. These results provide evidence that there are significant interactions between elevation and the ONI and PDO influence on SDOFF and SDDUR regionally over BC, with the largest-magnitude and most highly correlated relationships occurring at lower elevations. The influence of elevation on the response of snow cover to the ocean–atmosphere teleconnections is consistent with McClung (2013), who found that the influence of El Niño on avalanche frequency and moisture content was less important at higher elevations.
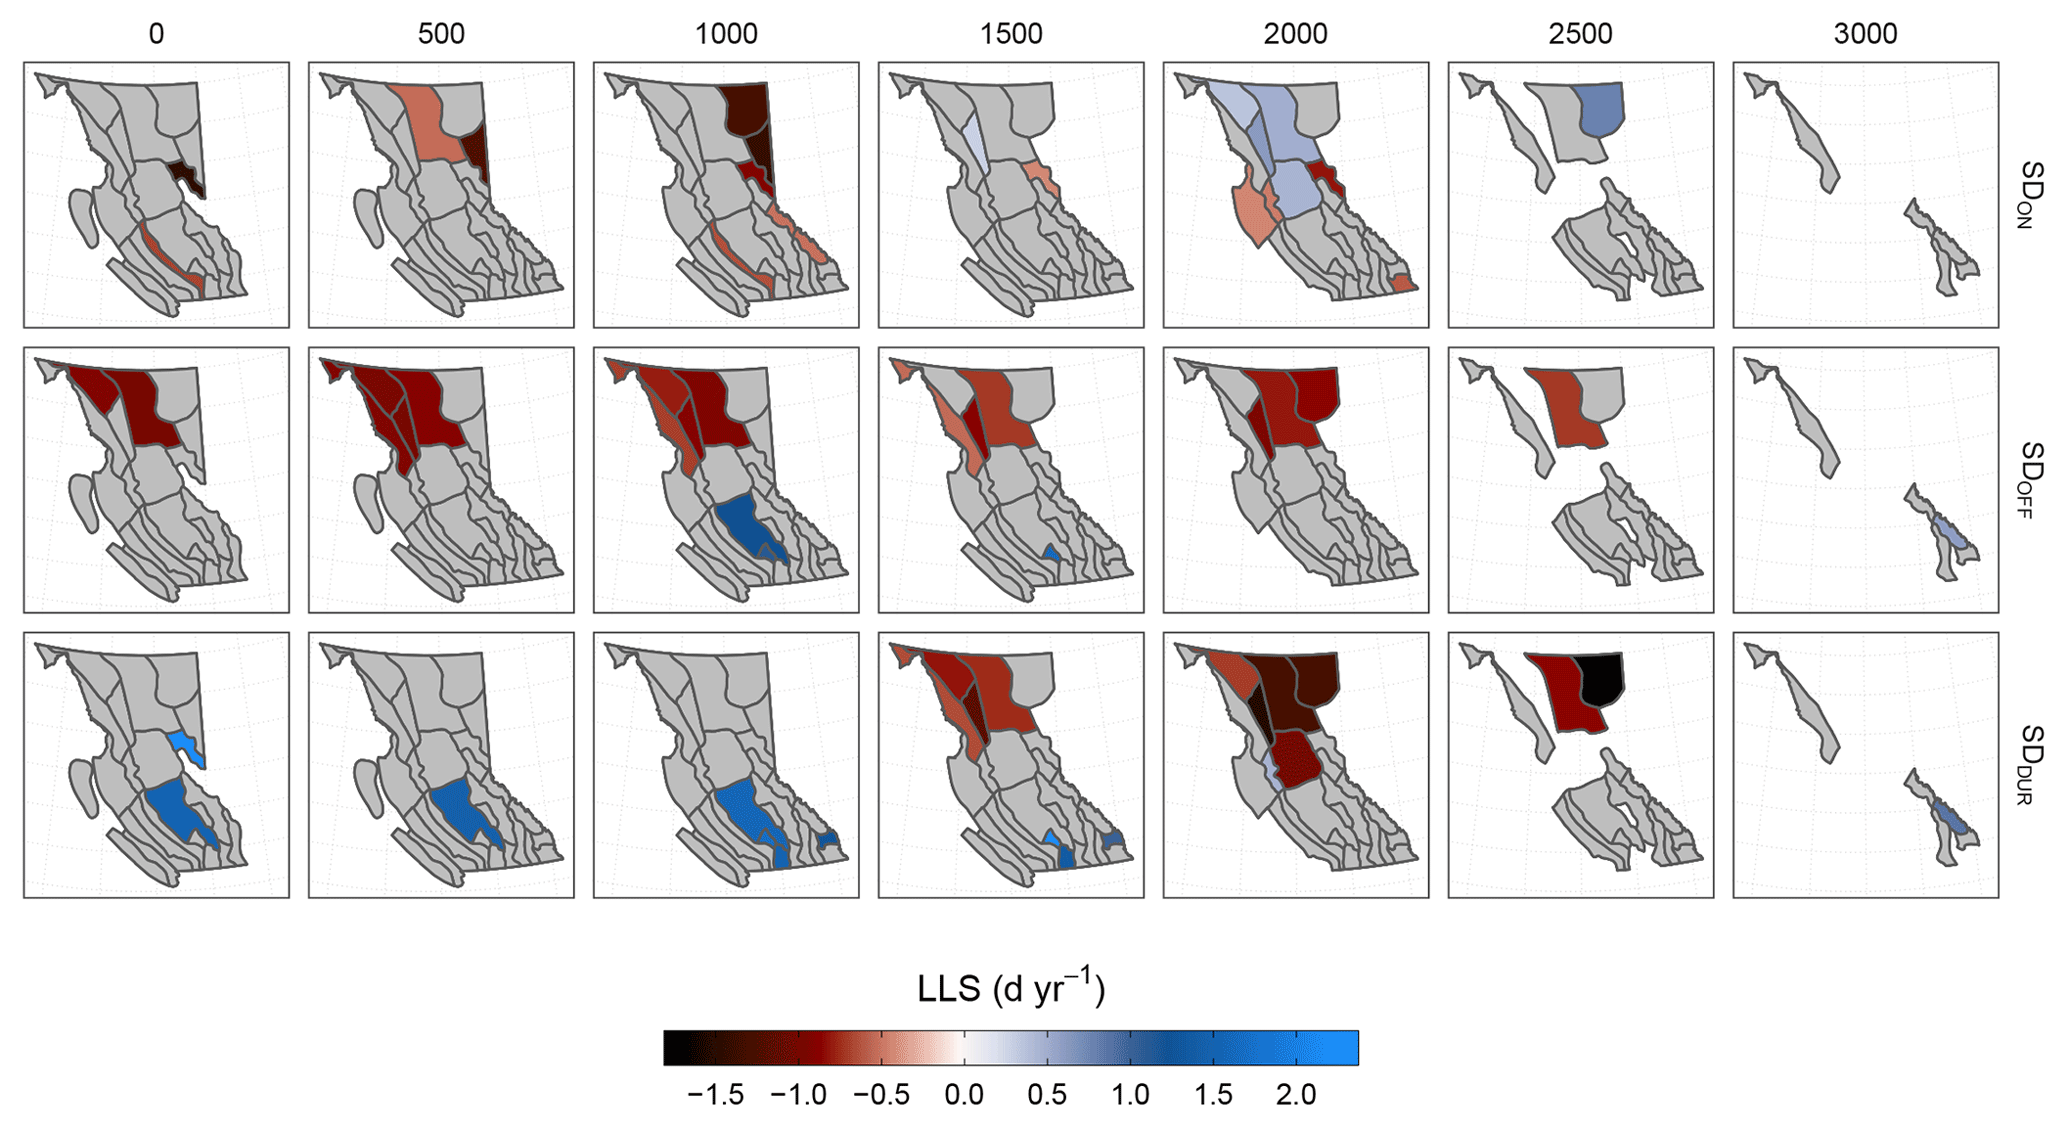
Figure 12Map of BC showing the rate of change in days per year (d yr−1) of the MODIS-derived SDON, SDOFF, and SDDUR (vertical groups) by hydrozone and by elevation group of 500 m (horizontal groups). Grey zones have insignificant trends (p value >0.05); missing zones have no terrain in the given elevation bin.
5.6 Change over time
Provincially, the annual MODIS snow cover metrics have insignificant negative trends over time. SDON has the largest-magnitude LLS result of d yr−1 (p>0.1), with a very low r2 value of 0.08. SDOFF also has statistically insignificant negative LLS results of d yr−1 (r2=0.01, p=0.53), and SDDUR has a positive LLS result of 0.07±0.40 d yr−1 (r2=0.0009, p=0.87). When we detrend the time series using the annual linear relationships with ONI and PDO found earlier, the three measurements still show insignificant trends over time (see Table S13). Further province-wide analysis by season indicates the same result of insignificant trends over time for both the original and the detrended data (see Table S14).
We look at change over time for each elevation band by hydrozone (Fig. 12). For SDON, a few regions throughout the province display negative trends over time; for example, SDON in the southern Rocky Mountain Foothills in the 0–500 m group has LLS results of d yr−1 (p<0.05), indicating a change towards earlier start dates. The northwest of the province over elevations 1500–2000 m, however, has strong positive trends (later start dates) of SDON over time that are coherent between adjacent regions (Fig. 12). For SDOFF, most regions in northern BC have significantly negative SDOFF at nearly all elevations. The northern Thompson Plateau has a strong positive trend of 1.61±0.54 d yr−1 (p<0.01) in SDOFF in the 1000–1500 m group (Fig. 12). For SDDUR, we find similar patterns to SDOFF; a large portion of northern BC has significant negative trends over time and these trends are stronger towards 2000 and 2500 m, and portions of the southern interior of BC below 1500 m have positive trends (Fig. 12). The southern interior has experienced substantial land cover change caused by forestry (e.g., Hansen et al., 2013) and has experienced extensive forest health outbreaks (Boon, 2012) and wildfires (BCWS, 2018) over the MODIS time period. The Fraser Plateau, for example, experienced a total of 26 869 km2 of forest fire between 1917 and 2017 (inclusive), and of that nearly 40 % (10 253 km2) occurred in 2017 (BCWS, 2018).
When we detrend the snow measurements for each of the elevation bands in each hydrozone using a combination of the ONI and PDO relationships, we find two strong regional signals. They are both in the north and northwest of BC in the 2000 m group. SDON has significant positive values for many adjacent hydrozones for each of the seasonal indices of ONI and PDO, the strongest of which is found in the north–central Uplands (0.62±0.24 d yr−1, p<0.05) and SDDUR has significantly negative values in northern BC with the strongest signal again in the north–central Uplands ( d yr−1, p<0.05). All results are available in Table S17.
There are a number of uncertainties associated with this study. These uncertainties relate to the following: (1) short time period of the MODIS record; (2) missing data due to cloud cover and shadows; (3) using ASWSs to calibrate and validate our method; (4) land cover changes; (5) hydrozone bias; and (6) a limited number of ONI and PDO events occurring during the study period.
- 1.
The short time period of the MODIS record is commonly used to study incremental change such as greening (e.g., Zhang et al., 2017). However, using M*D10A1 to detect change over time is perhaps overstepping the dataset due to the high interannual variability of snow cover. Nevertheless, many have shown that snow cover has in fact significantly changed over the MODIS period of record (e.g., Li et al., 2018; Lindsay et al., 2015; Saavedra et al., 2018).
- 2.
Overcoming missing data due to clouds and shadows in the MODIS record is difficult and many have demonstrated methods to overcome this shortcoming (e.g., Krajčí et al., 2014; Marchane et al., 2015); we have demonstrated a LOWESS to interpolate missing daily NDSI data.
- 3.
Our validation dataset of 60 ASWSs throughout BC is very strong in that we can have a large sample of validation points. However, these snow pillows are typically near the treeline and are concentrated in southern BC. This limitation implies that our calibration and validation steps are biased to work best at the treeline in southern BC (Fig. 1). The lack of systematic snow cover data elsewhere that cover a suitable range of elevations limits us from constraining this uncertainty further.
- 4.
BC has undergone significant landscape changes over the last 20 years. These include widespread forest insect outbreaks (e.g., Stahl et al., 2006b), severe wildfire seasons (e.g., Crowley et al., 2019), summer drought (e.g., Barnett et al., 2005), and extensive harvesting of forests (e.g., Hansen et al., 2013). All of these land cover changes have important effects on snow hydrology (Parajka et al., 2012) and may act to either enhance or reduce the observed interannual SD response to both the ONI and PDO. Forest canopies are known to impede the detection of snow on the ground from satellite remote sensing (e.g., Boon, 2012; Rittger et al., 2013); however, the effect of land cover type on the optimal parameter values in this study is unknown.
- 5.
We summarize our results using hydrozones in order to capture much of the variability in SD over BC (Coulson and Obedkoff, 1998). There are, however, other logical ways to group the province (e.g., 1∘ latitude and longitude groups, ecoprovinces, ecozones, etc.). The effect of using hydrozones instead of another zonal dataset on our results is unknown.
- 6.
The PDO index is likely influenced by moderate to strong ENSO events enhancing SSTs in the North Pacific Ocean. Examining the effect of the combined PDO and ONI indices on the results was beyond the scope of this paper. The PDO index during the period of study was also influenced by a marine heat wave commonly referred to as “the blob” (Walsh et al., 2018). This unique event occurred in 2013–2015 and led to warm and dry conditions over much of the study area, which may have influenced results during that time.
7.1 Snow season extraction
The LOWESS time series interpolation (Fig. 4) proved to be robust for determining SDON, SDOFF, and SDDUR of the longest continuous snow-covered period from the daily M*D10A1 data (Fig. 5). Combining the daily data from both the Terra and Aqua platforms helped to maximize the temporal resolution of our estimation of SDON and SDOFF. Calibrating our workflow to a subset of the ASWSs resulted in MAE values slightly lower than those reported in other studies (e.g., Lindsay et al., 2015).
Figure 7 summarizes the snow cover results per hydrozone and for all BC. We urge caution with their interpretation, as there are a number of limitations to our methodology; for example, Haida Gwaii as a whole does not experience a snow season of 70 d; however, we have found that for the areas with seasonal snow cover, that is the average duration of snow. Multiple spatiotemporal patterns can be observed in Fig. 7; however, this study focuses primarily on the regional patterns in the influence of ocean–atmosphere teleconnections on the timing and duration of snow cover.
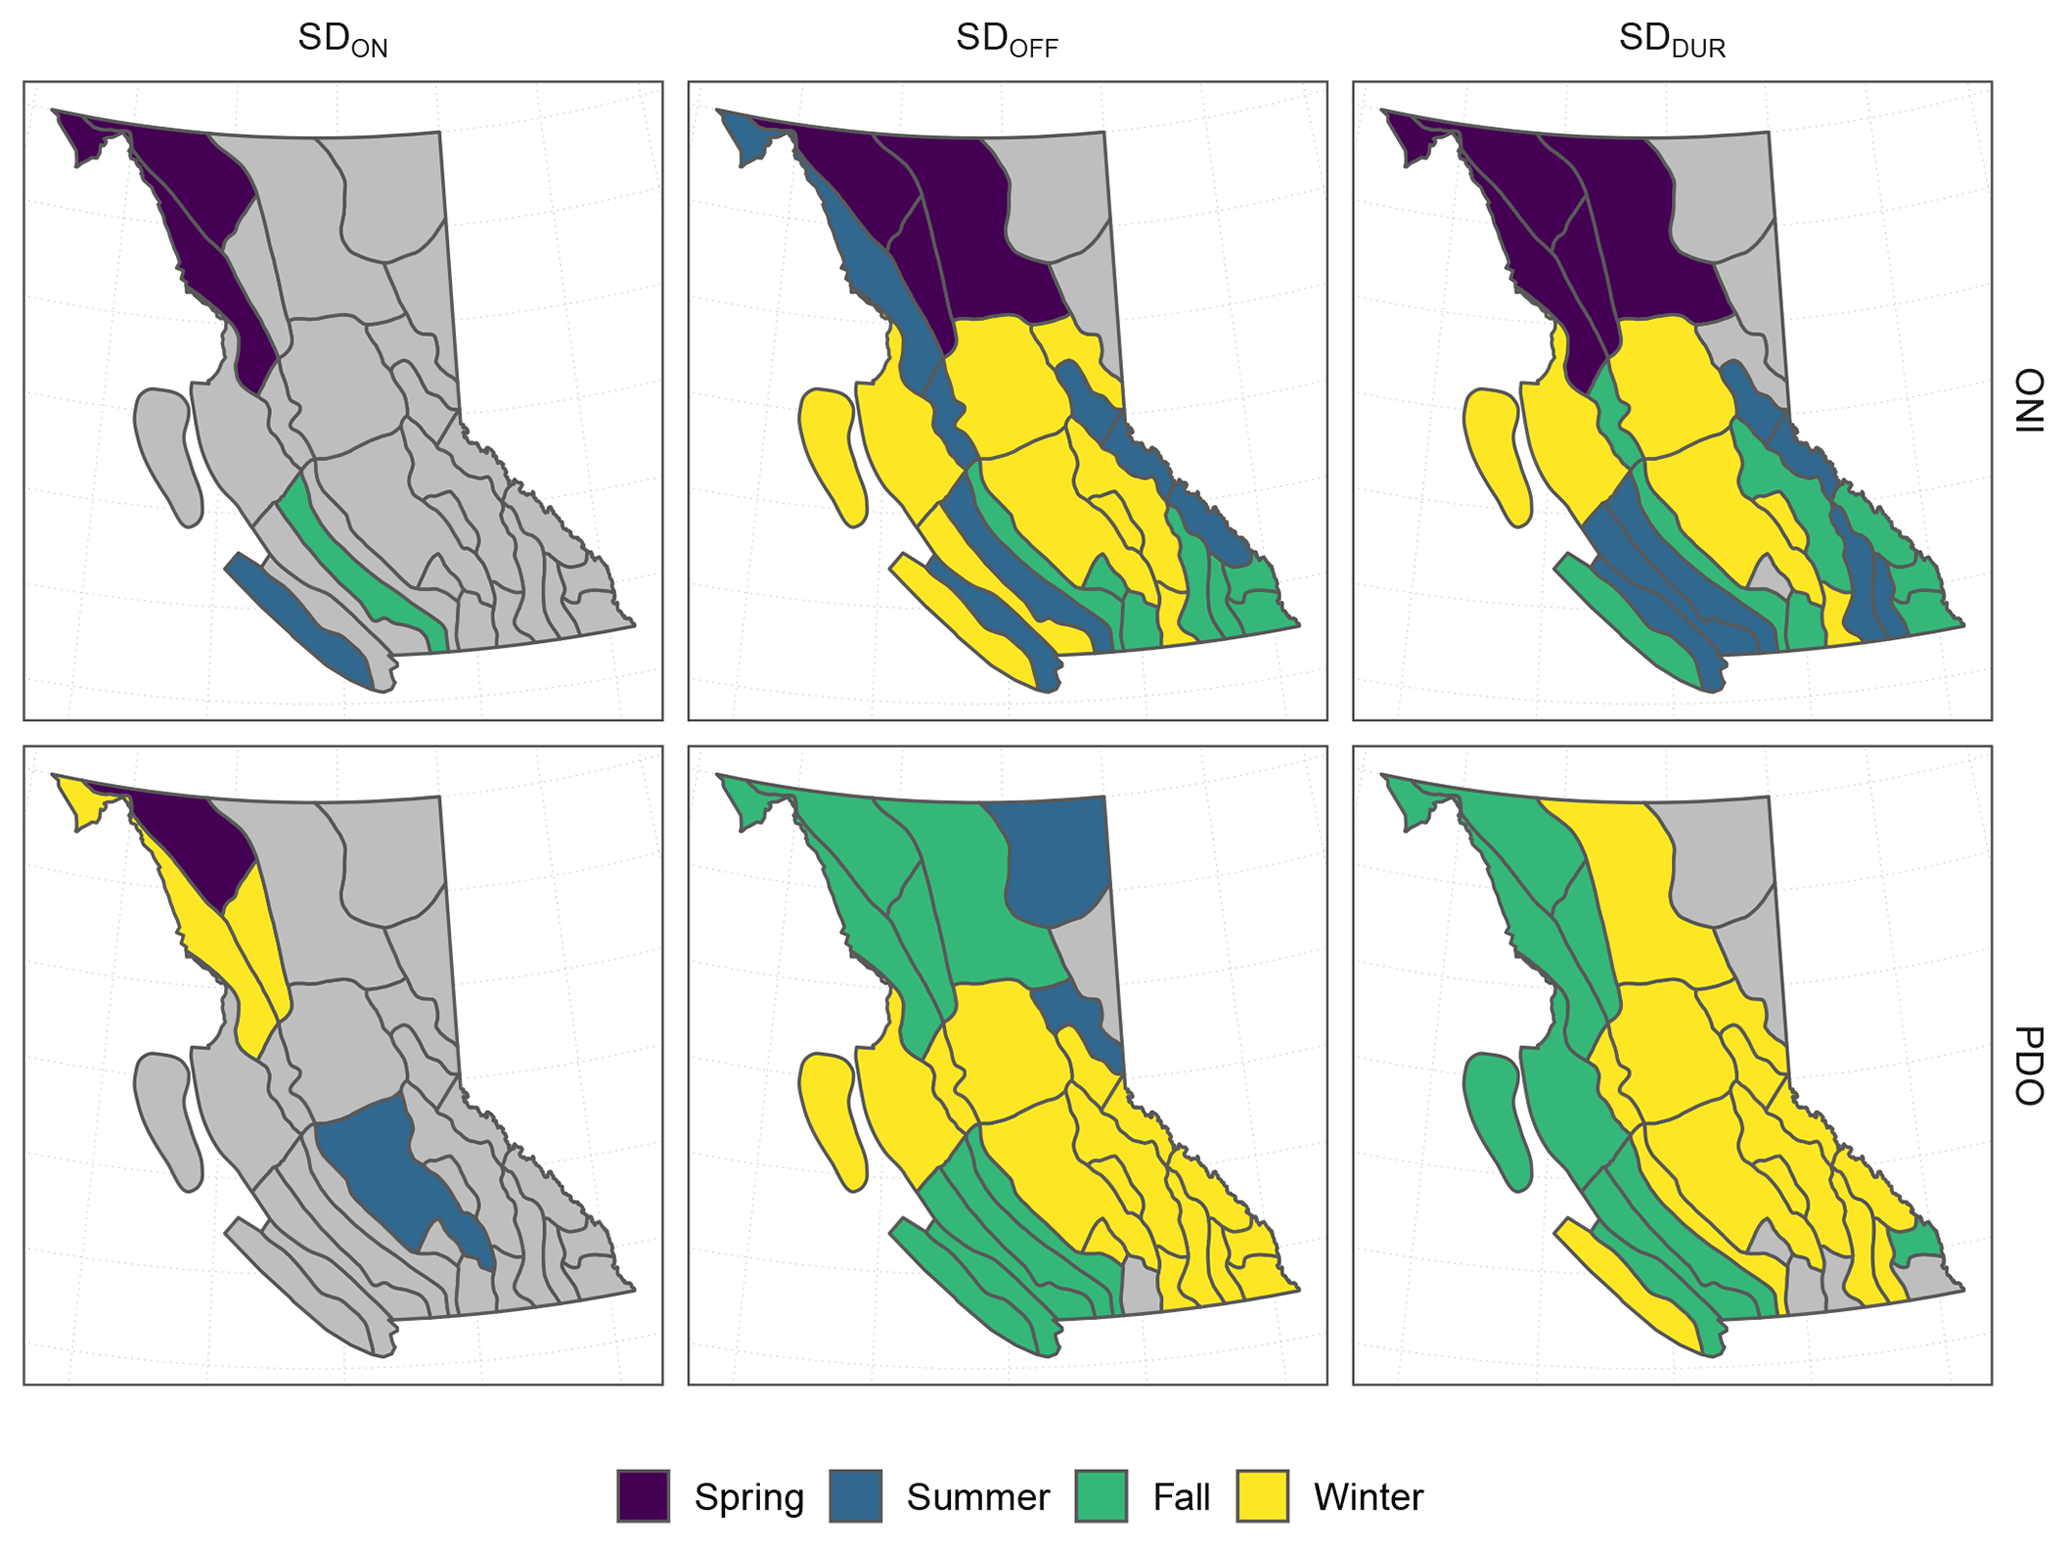
Figure 13Map of BC showing the seasonal teleconnection index with the strongest Spearman correlation per hydrozone for each of the three snow measurements: SDON, SDOFF, and SDDUR.
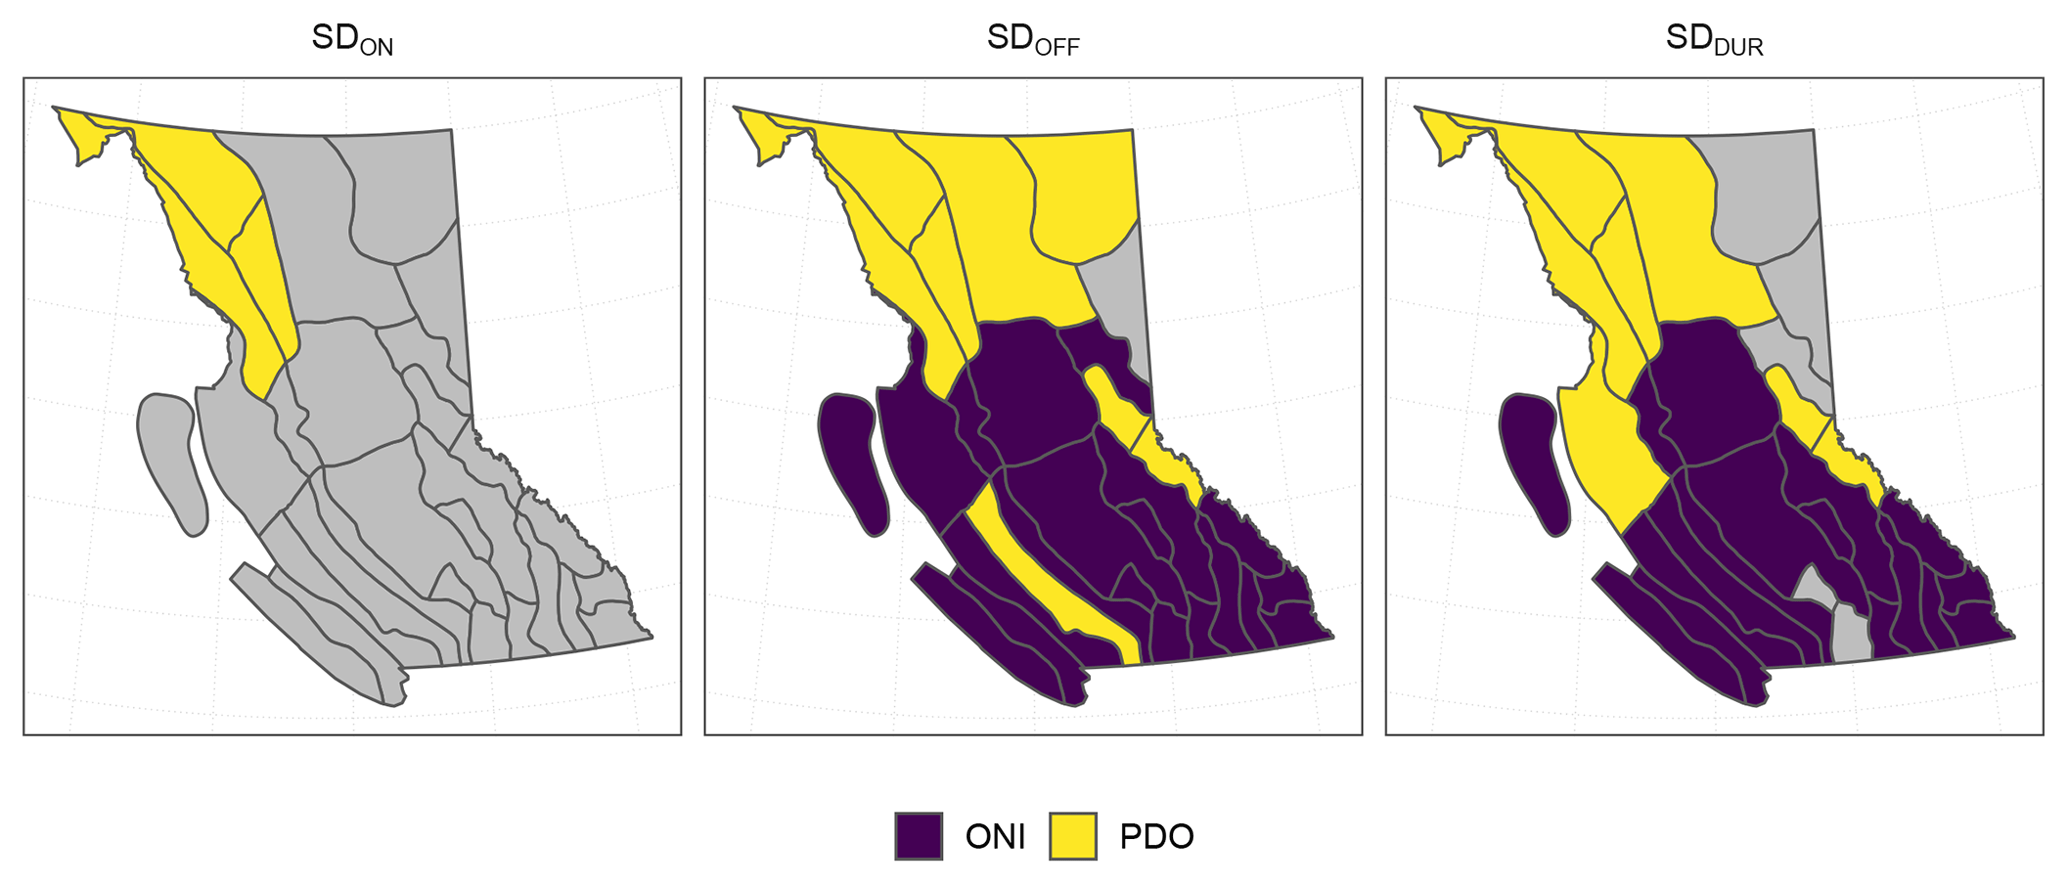
Figure 14Map of BC showing the annual teleconnection index with the strongest significant Spearman correlation per hydrozone for each of the three snow measurements: SDON, SDOFF, and SDDUR. Insignificant correlations (p>0.05) are shown in grey.
7.2 Regional patterns
We summarize rS results to identify the strongest significant correlation between the SDON, SDOFF, and SDDUR and the teleconnections by season (Fig. 13) and annually (Fig. 14). Observing SDON, we see that regions with significant results are located in northwest BC and sporadically in the southwest (Fig. 13). SDOFF has important regional patterns when we highlight the strongest Spearman correlations; notably, southern BC has a matrix of fall and winter for both ONI and PDO, with some exceptions in the higher-elevation hydrozones being sensitive to the summer ONI. Differences include northeastern BC, which has no significant relationships with ONI and yet has a coherent signal with the summer PDO. Northwestern BC overall is more sensitive to the spring and summer ONI and to the fall PDO. SDDUR closely resembles the SDOFF with some differences. The southern half of BC reveals a matrix of ONI influences from the summer, fall, and winter ONI; the northwest is sensitive to the spring ONI. As for PDO, a longitudinal transect exists with the fall PDO dominating the coastal hydrozones and the winter dominating inland. Northeastern BC is once again not well correlated with the teleconnections.
We compare mean annual correlations to determine which teleconnection explains more variation in SD regionally (Fig. 14). We find that SDON is largely not well correlated with teleconnections; however, in the northwest, the PDO is most important. For SDOFF we see strong regional patterns wherein northern and southern BC are the most highly correlated with the PDO and ONI, respectively. As for SDDUR, the pattern is almost identical to SDOFF with a few exceptions.
The ONI and PDO are more correlated with SDOFF than SDON regardless of season (Figs. 10, 13, 14). This is likely because precipitation and temperature anomalies associated with ONI and PDO are poorly established early in the snow season (Shabbar and Khandekar, 1996). Bonsal et al. (2001) demonstrate that the center of winter temperature anomalies in response to ENSO moves from southwest Yukon into northern and central Alberta and then to a center over Alberta during the PDO neutral phase; there is a shift to neutral or even negative temperature anomalies when the PDO is in its cool phase, partially explaining the north–south gradient in the amount of SD variation over BC (Fig. 14).
SDOFF is highly correlated with either the fall or winter ONI in southern BC; however, in the Stikine Plateau and northern Rocky Mountains spring ONI explains more variation in SDOFF, and summer ONI explains more variation in the northern Coast Mountains and northern–central Uplands. We hypothesize that these correlations between SDOFF and the spring and summer ONI may be present in northwest BC because they occur near the regional origin (northwest BC) of the temperature anomalies that manifest in response to an El Niño event. The strong correlations between SDOFF over most of southern BC and the fall and winter ONI are consistent with the corresponding winter temperature and precipitation anomalies over western Canada observed in other studies (e.g., Bonsal et al., 2001; Shabbar, 2006; Stahl et al., 2006a). The results indicate that SDOFF within both the McGregor Basin and the upper Fraser Basin are more highly correlated with the PDO than the ONI, despite being located in the center of the documented winter temperature and precipitation anomalies that occur in response to El Niño (Shabbar, 2006); this may indicate a likely interaction between the ONI and PDO in these hydrozones.
Elevation bins of 500 m for each hydrozone dramatically increase the number of regions with significant results, particularly for SDON (Fig. 11). Changes in LLS and rS with elevation are not particularly apparent with SDON; however, important differences exist for SDOFF and SDDUR. High-elevation snow cover timing and duration appear more resilient to ONI and PDO (values trend towards 0 at the treeline).
Ocean–atmosphere teleconnections may be influenced by anthropogenic climate change (Cai et al., 2018; Wittenberg, 2009). The interplay between naturally present variability in snow duration and timing and the variability introduced by anthropogenic forces is difficult to untangle with such a short period of record. This is exacerbated by the generally poorly understood mechanisms of longer-lived climate modes such as the PDO (Rodenhuis et al., 2007). One study suggests that increases in equatorial Pacific El Niño SST variance are related to stratification of the upper equatorial Pacific Ocean under greenhouse warming, leading to enhanced wind–ocean coupling conducive to SST anomalies (Cai et al., 2018). Other studies suggest that there is an insufficient period of record to determine the effects of climate change on ENSO given the strong interdecadal and inter-centennial modulation of its ENSO behavior in controlled simulations (e.g., Wittenberg, 2009).
7.3 Significance of results
We are not the first to use LOWESS time series interpolation on MODIS data (Moreno et al., 2014); however, to our knowledge this is the first study to use LOWESS on the MODIS snow cover product (Fig. 4). This allowed us to not only detect SDDUR from the time series, but also SDON and SDOFF. To extend this work further back in time, one could use lower-spatial-resolution Advanced Very High Resolution Radiometer (AVHRR) data (Allchin and Déry, 2017) or investigate in situ measurements (McClung, 2013; Barton, 2017). Our methods could be used anywhere that the MODIS snow cover product is present; however, the definition of the hydrological year, the LOWESS bandwidth, and the NDSI thresholds may need to be optimized. Also, our method detects the longest period of continuous snow cover and will not be as useful for areas of sporadic snow cover.
The 500 m resolution annual SDON, SDOFF, and SDDUR rasters produced as intermediate data in this study fill an important gap in our understanding of the regional influence of ocean–atmosphere teleconnections on snow cover in British Columbia. These rasters may be useful for a number of other climatological and environmental processes in the fields of hydrology, ecology, and more. Operationally, our findings can be used to constrain seasonal forecasts of snow in British Columbia. For elevation bins of 500 m by hydrozone, we have LLS and rS values for the relationships between snow cover and seasonal ocean–atmosphere teleconnections.
The main objective of this study was to evaluate the suitability of using daily M*D10A1 imagery to understand the regional influence of ocean–atmosphere teleconnections on SDON, SDOFF, and SDDUR in BC, a region of nearly 1 million km2 with a low density of snow observations. We have used a new method of fitting a LOWESS interpolation to the daily M*D10A1 NDSI time series. This method helps account for clouds and missing data while maximizing the temporal resolution when compared to 8 or 16 d snow products that are frequently used. We confirm the general consensus from many previous studies that both ENSO and PDO have significant impacts on the timing and duration of seasonal snow cover in BC. We add to this knowledge with seasonal and regional analysis using the hydrozones of BC and elevation bins of 500 m.
We found that the optimal NDSI threshold value in our study region was 30 when compared with ASWS SWE data. We separate automatic snow weather station data into calibration (75 %) and validation (25 %) subsets and obtain mean absolute errors between the MODIS and in situ observations for the start, end, and duration of 8.7, 8.9, and 13.1 d for the calibration data and 12.7, 12.6, and 16.6 d for the validation data, respectively.
SDON generally has insignificant or weak correlations with ONI and PDO in BC, with the exception of northwest BC, which has a generally positive linear relationship with PDO, and the Fraser Plateau, which is significantly negatively correlated with PDO (Fig. 10). SDOFF has significantly negative correlations with both teleconnections throughout BC; however, the winter and fall PDO values are the most highly correlated seasonal components. By hydrozone, the effects of both PDO and ONI are greatest in the southwest and dissipate towards northeastern BC (Fig. 10). The strongest seasonal ONI correlation varies throughout the province with the winter dominating the interior, whereas the strongest seasonal PDO correlation is the winter in southern BC, and the north is split by the summer and fall in northeastern and northwestern BC, respectively (Fig. 10). Overall, ONI is more highly correlated in southern BC and PDO in northern BC (Fig. 14). The greatest-magnitude effects are at lower elevations, and they trend towards neutral effects at higher elevations. SDDUR, similarly to SDOFF, has significantly negative relationships with both teleconnections throughout BC.
We observe two strong signals of change over time: generally declining snow cover at higher elevations in northwest BC and generally increasing snow seasons at lower elevations in the southern interior of BC. These patterns, however, change when we detrend our data using linear relationships with ONI and PDO. Once detrended, only two regions in northwest BC show a significantly declining snow cover over time. The most important rate of change over time in the detrended SDDUR is found in the north–central Uplands ( d yr−1, p<0.05), accounting for nearly a month of change over the MODIS period of record. The non-detrended positive change over time in the southern interior is likely due to important land cover change over that time. Forestry, forest health, and wildfires have all been very influential on the landscape. We interpret this as one of the challenges of using a 16-year time series to understand snow cover change over time.
Future directions for this research could include the creation of new snow zones for BC, the investigation of seasonal snow predictions, stream runoff, peak SWE, and otherwise getting closer to a solid approximation of SWE from historical remote sensing datasets. Also, a robust investigation of the influence of land cover change and the influence of terrain (slope, aspect, and curvature) on MODIS-derived snow cover would be helpful. The Visible Infrared Imaging Radiometer Suite (VIIRS) sensors aboard the Suomi NPP (launched 2011) and the NOAA-20 (launched 2017) satellite platforms provide excellent future opportunities to continue snow monitoring using similar temporal and spatial resolution imagery. Other avenues of investigation include the high-temporal-frequency and high-spatial-resolution PlanetScope Dove constellation with ∼1–2 d repeat at ∼3 m resolution (Planet Team, 2017). Although NDSI cannot be calculated from PlanetScope data as there is no SWIR band, other indices, such as the normalized difference vegetation index (NDVI), may be used to approximate snow cover.
The SDON, SDOFF, and SDDUR annual raster data and the scripts used for this analysis are currently available at https://github.com/bcgov/snow-dur-analysis (last access: 10 October 2019).
The supplement related to this article is available online at: https://doi.org/10.5194/tc-13-2693-2019-supplement.
ARB and HEG conducted the majority of the analysis and drafted the paper. VNF contributed mainly to interpretation of the results. WCF and HPG contributed to the high-level direction and interpretation of the project as a whole.
The authors declare that they have no conflict of interest.
The authors are very grateful to Stephen Déry, Michael Allchin, Yuexian Wang, John Rex, and William MacKenzie for conversations that helped inform the early direction of this work. Both anonymous reviewers and the editorial team provided very helpful guidance to increase the quality of this research article. Also, we acknowledge the open data science community, specifically free access to MODIS, Google Earth Engine, R, Python, and QGIS. Finally, we acknowledge the support of the Natural Sciences and Engineering Research Council of Canada (NSERC).
This research has been supported by the British Columbia Ministry of Forests, Lands, Natural Resource Operations and Rural Development (grant no. R&S-28) and by the Natural Sciences and Engineering Research Council of Canada (funding reference number 518294).
This paper was edited by Marie Dumont and reviewed by two anonymous referees.
Allchin, M. I. and Déry, S. J.: A spatio-temporal analysis of trends in Northern Hemisphere snow-dominated area and duration, 1971–2014, Ann. Glaciol., 58, 21–35, https://doi.org/10.1017/aog.2017.47, 2017. a, b
Barnett, T. P., Adam, J. C., and Lettenmaier, D. P.: Potential impacts of a warming climate on water availability in snow-dominated regions, Nature, 438, 303–309, https://doi.org/10.1038/nature04141, 2005. a, b, c
Barton, M.: Twenty-Seven years of manual fresh snowfall density measurements on Whistler Mountain, British Columbia, Atmos. Ocean, 55, 144–154, 2017. a
BCMOE: Automated Snow Weather Station Data, available at: https://www2.gov.bc.ca/gov/content/environment/air-land-water/water/water-science-data/water-data-tools/snow-survey-data/automated-snow-weather-station-data, last access: 10 Ocotber, 2019. a
BCWS: Wildfire Season Summary, available at: https://www2.gov.bc.ca/gov/content/safety/wildfire-status/about-bcws/wildfire-history/wildfire-season-summary (last access: 1 January 2019), 2018. a, b
Boelman, N. T., Liston, G. E., Gurarie, E., Meddens, A. J. H., Mahoney, P. J., Kirchner, P. B., Bohrer, G., Brinkman, T. J., Cosgrove, C. L., Eitel, J. U. H., Hebblewhite, M., Kimball, J. S., LaPoint, S., Nolin, A. W., Pedersen, S. H., Prugh, L. R., Reinking, A. K., and Vierling, L. A.: Integrating snow science and wildlife ecology in Arctic-boreal North America, Environ. Res. Lett., 14, 010401, https://doi.org/10.1088/1748-9326/aaeec1, 2019. a
Bonsal, B. and Shabbar, A.: Impacts of large-scale circulation variability on Low streamflows over Canada: A review, Can. Water Resourc. J., 33, 137–154, https://doi.org/10.4296/cwrj3302137, 2008. a, b
Bonsal, B. R., Shabbar, A., and Higuchi, K.: Impacts of low frequency variability modes on Canadian winter temperature, Int. J. Climatol., 21, 95–108, https://doi.org/10.1002/joc.590, 2001. a, b
Boon, S.: Snow accumulation following forest disturbance, Ecohydrology, 5, 279–285, https://doi.org/10.1002/eco.212, 2012. a, b, c
Bormann, K. J., Brown, R. D., Derksen, C., and Painter, T. H.: Estimating snow-cover trends from space, Nat. Clim. Change, 8, 924–928, 2018. a
Burn, D. H.: Climatic influences on streamflow timing in the headwaters of the Mackenzie River Basin, J. Hydrol., 352, 225–238, https://doi.org/10.1016/j.jhydrol.2008.01.019, 2008. a
Cai, W., Wang, G., Dewitte, B., Wu, L., Santoso, A., Takahashi, K., Yang, Y., Carréric, A., and McPhaden, M. J.: Increased variability of eastern Pacific El Niño under greenhouse warming, Nature, 564, 201–206, https://doi.org/10.1038/s41586-018-0776-9, 2018. a, b, c
Carroll, M., DiMiceli, C., Wooten, M., Hubbard, A., Sohlberg, R., and Townshend, J.: MOD44W MODIS/Terra Land Water Mask Derived from MODIS and SRTM L3 Global 250 m SIN Grid V006, NASA EOSDIS Land Processes, https://doi.org/10.5067/MODIS/MOD44W.006, 2017. a
Cleveland, W. S.: Robust locally weighted regression and smoothing scatterplots, J. Am. Stat. Assoc., 74, 829–836, https://doi.org/10.1080/01621459.1979.10481038, 1979. a
Coulson, C. H. and Obedkoff, W.: British Columbia Streamflow Inventory, Province of British Columbia Ministry of Environment, Lands and Parks, Tech. rep., 2227, 1998. a, b
Crowley, M. A., Cardille, J. A., White, J. C., and Wulder, M. A.: Multi-sensor, multi-scale, Bayesian data synthesis for mapping within-year wildfire progression, Remote Sens. Lett., 10, 302–311, https://doi.org/10.1080/2150704X.2018.1536300, 2019. a, b
Dariane, A. B., Khoramian, A., and Santi, E.: Investigating spatiotemporal snow cover variability via cloud-free MODIS snow cover product in Central Alborz Region, Remote Sens. Environ., 202, 152–165, 2017. a
Fang, X. and Pomeroy, J. W.: Drought impacts on Canadian prairie wetland snow hydrology, Hydrol. Process., 22, 2858–2873, https://doi.org/10.1002/hyp.7074, 2008. a
Farr, T. G., Rosen, P. A., Caro, E., Crippen, R., Duren, R., Hensley, S., Kobrick, M., Paller, M., Rodriguez, E., Roth, L., Seal, D., Shaffer, S., Shimada, J., Umland, J., Werner, M., Oskin, M., Burbank, D., and Alsdorf, D.: The shuttle radar topography mission, Rev. Geophys., 45, RG2004, https://doi.org/10.1029/2005RG000183, 2007. a
Fleming, S. W. and Whitfield, P. H.: Spatiotemporal mapping of ENSO and PDO surface meteorological signals in British Columbia, Yukon, and southeast Alaska, Atmos. Ocean, 48, 122–131, https://doi.org/10.3137/AO1107.2010, 2010. a, b
Fleming, S. W., Hood, E., Dahlke, H. E., and O'Neel, S.: Seasonal flows of international British Columbia-Alaska rivers: The nonlinear influence of ocean-atmosphere circulation patterns, Adv. Water Resour., 87, 42–55, https://doi.org/10.1016/j.advwatres.2015.10.007, 2016. a
Foord, V.: Climate Patterns, Trends, and Projections for the Omineca, Skeena, and Northeast Natural Resource Regions, British Columbia, Tech. Rep. 97, 17 pp., Forests, Lands, and NR Operations, Victoria, B.C., available at: https://www.for.gov.bc.ca/hfd/pubs/Docs/Tr/Tr097.htm (last access: 10 October 2019), 2016. a, b, c
Gershunov, A. and Barnett, T. P.: Interdecadal modulation of ENSO teleconnections, B. Am. Meteorol. Soc., 79, 2715–2725, https://doi.org/10.1175/1520-0477(1998)079<2715:IMOET>2.0.CO;2, 1998. a
Gladkova, I., Grossberg, M., Bonev, G., Romanov, P., and Shahriar, F.: Increasing the accuracy of MODIS/Aqua snow product using quantitative image restoration technique, IEEE Geosci. Remote S., 9, 740–743, 2012. a
Gorelick, N., Hancher, M., Dixon, M., Ilyushchenko, S., Thau, D., and Moore, R.: Google Earth Engine: Planetary-scale geospatial analysis for everyone, Remote Sens. Environ., 202, 18–27, https://doi.org/10.1016/j.rse.2017.06.031, 2017. a
Hall, D. K. and Riggs, G. A.:: Normalized-Difference Snow Index (NDSI), in: Encyclopedia of Snow, Ice and Glaciers. Encyclopedia of Earth Sciences Series, edited by: Singh, V. P., Singh, P., and Haritashya, U. K., Springer, Dordrecht, Netherlands, 779–780, https://doi.org/10.1007/978-90-481-2642-2_376, 2011. a
Hall, D. K., Riggs, G. A., Salomonson, V. V., DiGirolamo, N. E., and Bayr, K. J.: MODIS snow-cover products, Remote Sens. Environ., 83, 181–194, https://doi.org/10.1016/S0034-4257(02)00095-0, 2002. a
Hammond, J. C., Saavedra, F. A., and Kampf, S. K.: Global snow zone maps and trends in snow persistence 2001–2016, Int. J. Climatol., 38, 4369–4383, https://doi.org/10.1002/joc.5674, 2018. a, b
Hansen, M. C., Potapov, P. V., Moore, R., Hancher, M., Turubanova, S. A., Tyukavina, A., Thau, D., Stehman, S. V., Goetz, S. J., Loveland, T. R., Kommareddy, A., Egorov, A., Chini, L., Justice, C. O., and Townshend, J. R. G.: High-resolution global maps of 21st-century forest cover change, Science, 342, 850–853, https://doi.org/10.1126/science.1244693, 2013. a, b
Hsieh, W. W. and Tang, B.: Interannual variability of accumulated snow in the Columbia Basin, British Columbia, Water Resour. Res., 37, 1753–1759, https://doi.org/10.1029/2000WR900410, 2001. a
Huang, B., Thorne, P. W., Banzon, V. F., Boyer, T., Chepurin, G., Lawrimore, J. H., Menne, M. J., Smith, T. M., Vose, R. S., and Zhang, H.-M.: Extended reconstructed sea surface temperature, Version 5 (ERSSTv5): Upgrades, validations, and intercomparisons, J. Climate, 30, 8179–8205, https://doi.org/10.1175/JCLI-D-16-0836.1, 2017. a, b
Islam, S. U., Déry, S. J., and Werner, A. T.: Future climate change impacts on snow and water resources of the Fraser River Basin, British Columbia, J. Hydrometeorol., 18, 473–496, https://doi.org/10.1175/JHM-D-16-0012.1, 2017. a
Joint Institute for the Study of the Atmosphere and Ocean: The Pacific Decadal Oscillation (PDO), available at: http://research.jisao.washington.edu/pdo/, last access: 10 October, 2019. a
Jonas, T., Rixen, C., Sturm, M., and Stoeckli, V.: How alpine plant growth is linked to snow cover and climate variability, J. Geophys. Res., 113, G03013, https://doi.org/10.1029/2007JG000680, 2008. a
Khoramian, A. and Dariane, A. B.: Developing a Cloud-Reduced MODIS surface reflectance product for snow cover mapping in mountainous regions, Geosci. J., 7, 29, https://doi.org/10.3390/geosciences7020029, 2017. a
Kiem, A. S., Franks, S. W., and Kuczera, G.: Multi-decadal variability of flood risk, Geophys. Res. Lett., 30, 1035, https://doi.org/10.1029/2002GL015992, 2003. a
Krajčí, P., Holko, L., Perdigão, R. A. P., and Parajka, J.: Estimation of regional snowline elevation (RSLE) from MODIS images for seasonally snow covered mountain basins, J. Hydrol., 519, 1769–1778, https://doi.org/10.1016/j.jhydrol.2014.08.064, 2014. a
Li, C., Su, F., Yang, D., Tong, K., Meng, F., and Kan, B.: Spatiotemporal variation of snow cover over the Tibetan Plateau based on MODIS snow product, 2001–2014, Int. J. Climatol., 38, 708–728, https://doi.org/10.1002/joc.5204, 2018. a, b, c
Li, X., Fu, W., Shen, H., Huang, C., and Zhang, L.: Monitoring snow cover variability (2000–2014) in the Hengduan Mountains based on cloud-removed MODIS products with an adaptive spatio-temporal weighted method, J. Hydrol., 551, 314–327, 2017. a
Lindsay, C., Zhu, J., Miller, A. E., Kirchner, P., and Wilson, T. L.: Deriving snow cover metrics for Alaska from MODIS, Remote Sensing, 7, 12961–12985, https://doi.org/10.3390/rs71012961, 2015. a, b, c, d, e, f
Mantua, N. J., Hare, S. R., Zhang, Y., Wallace, J. M., and Francis, R. C.: A Pacific interdecadal climate oscillation with impacts on salmon production, B. Am. Meteorol. Soc., 78, 1069–1079, https://doi.org/10.1175/1520-0477(1997)078<1069:APICOW>2.0.CO;2, 1997. a, b
Marchane, A., Jarlan, L., Hanich, L., Boudhar, A., Gascoin, S., Tavernier, A., Filali, N., Le Page, M., Hagolle, O., and Berjamy, B.: Assessment of daily MODIS snow cover products to monitor snow cover dynamics over the Moroccan Atlas mountain range, Remote Sens. Environ., 160, 72–86, https://doi.org/10.1016/j.rse.2015.01.002, 2015. a
Marks, D., Winstral, A., Reba, M., Pomeroy, J., and Kumar, M.: An evaluation of methods for determining during-storm precipitation phase and the rain/snow transition elevation at the surface in a mountain basin, Adv. Water Resour., 55, 98–110, https://doi.org/10.1016/j.advwatres.2012.11.012, 2013. a
McClung, D. M.: The effects of El Niño and La Niña on snow and avalanche patterns in British Columbia, Canada, and central Chile, J. Glaciol., 59, 783–792, 2013. a, b
Menounos, B., Hugonnet, R., Shean, D., Gardner, A., Howat, I., Berthier, E., Pelto, B., Tennant, C., Shea, J., Noh, M., Brun, F., and Dehecq, A.: Heterogeneous changes in western North American glaciers linked to decadal variability in zonal wind strength, Geophys. Res. Lett., 46, 200–209, https://doi.org/10.1029/2018GL080942, 2018. a
Moore, R. D. and McKendry, I. G.: Spring snowpack anomaly patterns and winter climatic variability, British Columbia, Canada, Water Resour. Res., 32, 623–632, https://doi.org/10.1029/95WR03640, 1996. a, b, c, d
Moreno, Á., García-Haro, F. J., Martínez, B., and Gilabert, M. A.: Noise reduction and gap filling of fAPAR time series using an adapted local regression filter, Remote Sensing, 6, 8238–8260, 2014. a, b
Mote, P. W., Li, S., Lettenmaier, D. P., Xiao, M., and Engel, R.: Dramatic declines in snowpack in the western US, Climate and Atmospheric Science, 1, 2, https://doi.org/10.1038/s41612-018-0012-1, 2018. a
Najafi, M. R., Zwiers, F., and Gillett, N.: Attribution of the observed spring snowpack decline in British Columbia to anthropogenic climate change, J. Climate, 30, 4113–4130, https://doi.org/10.1175/JCLI-D-16-0189.1, 2017. a, b
National Oceanic and Atmospheric Adminsitration: El Niño/Southern Oscillation (ENSO), avalable at: https://origin.cpc.ncep.noaa.gov/products/analysis_monitoring/ensostuff/ONI_v5.php, last access: 10 October, 2019. a
Pan, C. G., Kirchner, P. B., Kimball, J. S., Kim, Y., and Du, J.: ABoVE: Rain-on-Snow frequency and distribution during cold seasons, Alaska, 2003–2016, ORNL DAAC, Oak Ridge, Tennessee, USA, https://doi.org/10.3334/ORNLDAAC/1611, 2018. a
Parajka, J., Holko, L., Kostka, Z., and Blöschl, G.: MODIS snow cover mapping accuracy in a small mountain catchment – comparison between open and forest sites, Hydrol. Earth Syst. Sci., 16, 2365–2377, https://doi.org/10.5194/hess-16-2365-2012, 2012. a
Planet Team: Planet Application Program Interface: In Space for Life on Earth, available at: https://api.planet.com (last access: 10 October 2019), 2017. a
Riggs, G. A. and Hall, D. K.: MODIS Snow Products Collection 6 User Guide, available at: https://modis-snow-ice.gsfc.nasa.gov/uploads/C6_MODIS_Snow_User_Guide.pdf (last access: 10 October 2019), 2015. a, b, c, d
Rittger, K., Painter, T. H., and Dozier, J.: Assessment of methods for mapping snow cover from MODIS, Adv. Water Resour., 51, 367–380, https://doi.org/10.1016/j.advwatres.2012.03.002, 2013. a
Rodenhuis, D., Bennett, K., Werner, A., Murdock, T., and Bronaugh, D.: Hydro-climatology and future climate impacts in British Columbia, Pacific Climate Impacts Consortium, University of Victoria, Report, available at: https://www.pacificclimate.org/sites/default/files/publications/Rodenhuis.ClimateOverview.Mar2009.pdf (last access: 10 October 2019), 2007. a
Saavedra, F. A., Kampf, S. K., Fassnacht, S. R., and Sibold, J. S.: Changes in Andes snow cover from MODIS data, 2000–2016, The Cryosphere, 12, 1027–1046, https://doi.org/10.5194/tc-12-1027-2018, 2018. a, b, c, d
Schnorbus, M., Werner, A., and Bennett, K.: Impacts of climate change in three hydrologic regimes in British Columbia, Canada, Hydrol. Proces., 28, 1170–1189, https://doi.org/10.1002/hyp.9661, 2014. a, b
Shabbar, A.: The impact of El Niño-Southern Oscillation on the Canadian climate, Adv. Geosci., 6, 149–153, https://doi.org/10.5194/adgeo-6-149-2006, 2006. a, b, c, d, e
Shabbar, A. and Khandekar, M.: The impact of el Niño‐Southern oscillation on the temperature field over Canada: Research note, Atmos. Ocean, 34, 401–416, https://doi.org/10.1080/07055900.1996.9649570, 1996. a
Stahl, K., Dan Moore, R., and Mckendry, I. G.: The role of synoptic-scale circulation in the linkage between large-scale ocean–atmosphere indices and winter surface climate in British Columbia, Canada, Int. J. Climatol., 26, 541–560, https://doi.org/10.1002/joc.1268, 2006a. a, b, c, d, e
Stahl, K., Moore, R. D., and McKendry, I. G.: Climatology of winter cold spells in relation to mountain pine beetle mortality in British Columbia, Canada, Clim. Res., 32, 13–23, https://doi.org/10.3354/cr032013, 2006b. a, b
Svoma, B. M.: El Niño–Southern Oscillation and snow level in the western United States, J. Geophys. Res., 116, D24117, https://doi.org/10.1029/2011JD016287, 2011. a
Tang, Z., Wang, X., Wang, J., Wang, X., Li, H., and Jiang, Z.: Spatiotemporal variation of snow cover in Tianshan Mountains, Central Asia, based on Cloud-Free MODIS Fractional Snow Cover product, 2001–2015, Remote Sensing, 9, 1045, https://doi.org/10.3390/rs9101045, 2017. a
Teucher, A., Hazlitt, S., and Albers, S.: bcmaps: Map Layers and Spatial Utilities for British Columbia, available at: https://github.com/bcgov/bcmaps (last access: 10 October 2019), 2018. a
Tong, J., Déry, S. J., and Jackson, P. L.: Interrelationships between MODIS/Terra remotely sensed snow cover and the hydrometeorology of the Quesnel River Basin, British Columbia, Canada, Hydrol. Earth Syst. Sci., 13, 1439–1452, https://doi.org/10.5194/hess-13-1439-2009, 2009. a
Trenberth, K. E.: The definition of El Niño, B. Am. Meteorol. Soc., 78, 2771–2777, https://doi.org/10.1175/1520-0477(1997)078<2771:TDOENO>2.0.CO;2, 1997. a
Trishchenko, A. P., Leblanc, S. G., Wang, S., Li, J., Ungureanu, C., Luo, Y., Khlopenkov, K. V., and Fontana, F.: Variations of annual minimum snow and ice extent over Canada and neighboring landmass derived from MODIS 250-m imagery for 2000–2014, Can. J. Remote Sens., 42, 214–242, https://doi.org/10.1080/07038992.2016.1166043, 2016. a, b, c
Trubilowicz, J. W., Floyd, W. J., D'Amore, D. V., and Bidlack, A. L.: Satellite-monitored snow cover in western North America: A comparison of water year 2015 to median conditions, in: Snow Drought and Hydrologic Impacts, 84th Annual Western Snow Conference, Seattle, Washington, 18–21 April, 2016. a
Wallace, J. M. and Gutzler, D. S.: Teleconnections in the geopotential height field during the Northern Hemisphere winter, Mon. Weather Rev., 109, 784–812, https://doi.org/10.1175/1520-0493(1981)109<0784:TITGHF>2.0.CO;2, 1981. a
Walsh, J. E., Thoman, R. L., Bhatt, U. S., Bieniek, P. A., Brettschneider, B., Brubaker, M., Danielson, S., Lader, R., Fetterer, F., Holderied, K., Iken, K., Mahoney, A., McCammon, M., and Partain, J.: The high latitude marine heat wave of 2016 and its impacts on Alaska, B. Am. Meteorol. Soc., 99, S39–S43, https://doi.org/10.1175/BAMS-D-17-0105.1, 2018. a
Westerling, A. L., Hidalgo, H. G., Cayan, D. R., and Swetnam, T. W.: Warming and earlier spring increase Western U.S. forest wildfire activity, Science, 313, 940–943, https://doi.org/10.1126/science.1128834, 2006. a
White, T., Wolf, J., Anslow, F., and Werner, A. (Eds.): Indicators of Climate Change for British Columbia: Update 2016, British Columbia Ministry of Environment, Victoria, British Columbia, 2016. a, b
Whitfield, P. H., Moore, R. D., Fleming, S. W., and Zawadzki, A.: Pacific Decadal Oscillation and the hydroclimatology of Western Canada – Review and prospects, Can. Water Resour. J., 35, 1–28, https://doi.org/10.4296/cwrj3501001, 2010. a, b, c, d, e
Winkler, R. D. and Moore, R. D.: Variability in snow accumulation patterns within forest stands on the interior plateau of British Columbia, Canada, Hydrol. Process., 20, 3683–3695, https://doi.org/10.1002/hyp.6382, 2006. a
Wittenberg, A. T.: Are historical records sufficient to constrain ENSO simulations?, Geophys. Res. Lett., 36, L12702, https://doi.org/10.1029/2009GL038710, 2009. a, b
Zhang, Y., Song, C., Band, L. E., Sun, G., and Li, J.: Reanalysis of global terrestrial vegetation trends from MODIS products: Browning or greening?, Remote Sens. Environ., 191, 145–155, https://doi.org/10.1016/j.rse.2016.12.018, 2017. a