the Creative Commons Attribution 4.0 License.
the Creative Commons Attribution 4.0 License.
 | 16 Apr 2019
The evolution of snow bedforms in the Colorado Front Range and the processes that shape them
Kelly Kochanski
Robert S. Anderson
Gregory E. Tucker
When wind blows over dry snow, the snow surface self-organizes into bedforms such as dunes, ripples, snow waves, and sastrugi. These bedforms govern the interaction between wind, heat, and the snowpack, but thus far they have attracted few scientific studies. We present the first time-lapse documentation of snow bedform movement and evolution, as part of a series of detailed observations of snow bedform movement in the Colorado Front Range. We show examples of the movement of snow ripples, snow waves, barchan dunes, snow steps, and sastrugi. We also introduce a previously undocumented bedform: the stealth dune. These observations show that (1) snow dunes accelerate minute-by-minute in response to gusts, (2) sastrugi and snow steps present steep edges to the wind and migrate downwind as those edges erode, (3) snow waves and dunes deposit layers of cohesive snow in their wake, and (4) bedforms evolve along complex cyclic trajectories. These observations provide the basis for new conceptual models of bedform evolution, based on the relative fluxes of snowfall, aeolian transport, erosion, and snow sintering across and into the surface. We find that many snow bedforms are generated by complex interactions between these processes. The prototypical example is the snow wave, in which deposition, sintering, and erosion occur in transverse stripes across the snowscape.
- Article
(8198 KB) - Full-text XML
-
Supplement
(123 KB) - BibTeX
- EndNote


Windblown snow self-organizes into bedforms, such as dunes, waves, and ripples, the most common of which are anvil-shaped sastrugi. These bedforms cover sea ice, tundra, alpine ridges, and almost all of Antarctica (Filhol and Sturm, 2015). They are formed by the interaction of wind, heat, and snow. After they form, bedforms govern the interactions between the snow surface and the atmosphere.
Snow bedforms increase the variability of snow depth on short (0.1–5 m) length scales. This variability increases the uncertainty of paleoclimate measurements of snow accumulation from ice cores (Leonard, 2009; Sect. 2.5.3) and decreases the average thermal conductivity of the snow (Liston et al., 2018) while focusing heat flux in areas of thin snow (Petrich et al., 2012). Bedforms also increase the aerodynamic drag of the surface (Inoue, 1989a, b; Jackson and Carroll, 1978; Amory et al., 2017) and change the distribution of windblown aerosols (Harder et al., 2000). Finally, they increase the surface area of the snow, which decreases its reflectivity (Leroux and Fily, 1998; Warren et al., 1998; Corbett and Su, 2015). All of these effects are difficult to measure remotely.
Snow bedforms are commonly 0.1–5 m long. They are generally sub-pixel-scale for satellite imagery, and definitively sub-grid-scale for global and regional climate models. Moreover, bedforms align with the direction of the prevailing and/or most recent wind (Amory et al., 2016). Their effects on aerodynamic roughness and reflectivity are therefore anisotropic (Leroux and Fily, 1998; Corbett and Su, 2015) and cannot be conclusively measured by single satellites. Because of these difficulties, our understanding of the growth of snow bedforms and their thermal effects must begin on the ground.
Systematic field studies of snow bedform shapes and movement have, however, been separated by dozens of years and by thousands of miles. Cornish (1902) sketched snow bedforms, measured snow wave wavelengths, and estimated the tensile strength of snow-mushrooms during a 5000 km trip across Canada. Doumani (1967) photographed snow drifts, sastrugi, and barchanoids during 2 years worth of traverses out of Byrd Station, Antarctica. Kobayashi (1980) used under-lit tables, photography, and meteorological stations to document the formation and advection of snow ripples and snow waves near their home institute of Sapporo, Japan. Finally, Filhol and Sturm (2015) collected photographs and descriptions of diverse snow bedforms, as well as lidar scans of dune fields near the University of Alaska, Fairbanks.
The past few years have seen a burst of new snow bedform research as several groups have deployed modern tools to document specific bedform behaviors. Kochanski et al. (2018) employed time-lapse imagery to detect bedform and sastrugi presence in the Colorado Front Range and used this to predict the occurrence of snow bedforms as a function of weather. Amory et al. (2016) recorded the shift in sastrugi angle, and the resulting change in wind drag, during a storm in Adélie Land, Antarctica. Filhol et al. (2017) used a terrestrial lidar to capture 15 images of an evolving field of snow dunes over the course of a 7.5 h wind event in Finse, Norway. Bellot et al. (2014) and Naiim-Bouvet et al. (2017) noted that bedform evolution is rapid and difficult to capture with manual measurements and have set up a terrestrial laser scanning system to automate the monitoring of sastrugi motion in the French Alps. These opportunistic observations have answered several basic questions about snow bedform evolution. For example, they have conclusively demonstrated that shifts in snow bedforms change surface wind drag (Amory et al., 2016) and that snow dunes merge and grow as they travel (Filhol et al., 2017).
None of the studies above, however, track the evolution of snow bedforms from one form to another. This makes it difficult to determine whether the observations represent rare events or recurring patterns. Here, we aim to identify the overarching patterns of bedform evolution to guide future monitoring studies. In particular, we seek to provide insight into the relationship between weather conditions and bedform evolution, so that, for example, future lidar studies can be deployed at the right times and places to capture the quantitative details of the most important events.
In this paper, we present the results of the longest-term observational study of snow bedforms that has been carried out to date: a 3-year study on Niwot Ridge in the Colorado Front Range. Our observations are available in Kochanski (2018c). In this paper, we present detailed examples of the movement and formation of snow ripples, barchan dunes, snow steps, snow waves, and sastrugi. We analyze these observations in terms of the geomorphological processes that produce them (these processes are introduced in Sect. S3 in the Supplement). Finally, we outline a theoretical framework that describes the various evolutionary trajectories of snow bedforms in terms of the processes that drive their formation and growth.
Names and natures of snow bedforms
The study of bedforms is still very new, and the names used to describe bedforms are occasionally controversial. Here we define the names that we use to organize our results. Example images are provided in Sect. 3.1. We only discuss bedforms that we observed in Colorado.
Plane beds (Sect. 3.1.1), or flat snow surfaces, occur when snow falls during periods of light wind (Kochanski et al., 2018). These beds are smoother than the underlying surface and may sparkle. This surface type is rare at our field site.
Snow ripples (Sect. 3.1.3) are small transverse features (perpendicular to the mean wind) with wavelengths on the order of 15 cm. They are described in detail by Kobayashi (1980) and Kosugi et al. (1992). Filhol and Sturm (2015) refer to these features as “ripple marks”.
Barchan dunes (Sect. 3.1.2) are crescent-shaped, or two-horned, dunes. They have well-defined crests, with a gentle upwind slope and a steep downwind slope that curves into two forward-pointing arms (Filhol and Sturm, 2015; Petrich et al., 2012; Doumani, 1967; Kobayashi, 1980; Goodwin, 1986). In this paper, “barchan dune” (or “isolated dune”) refers specifically to crescent dunes that do not cover the surface completely but expose inter-dune areas of older snow, bare ground, or ice.
Close-packed dunes (also Sect. 3.1.2) have defined crests. Unlike isolated barchans, they cover the surface completely. We distinguish close-packed dunes from isolated barchans because they have different thermal properties, and we expect them to follow different evolutionary trajectories. First, fresh snow is more reflective and less thermally conductive than old snow, ice, or bare ground. Even small gaps in the snow cover create a positive feedback cycle that leads to rapid snowmelt in warm or sunny weather (Petrich et al., 2012). Second, fresh snow is usually less dense and more erodible than old snow, ice, or dirt. Thus, exposed inter-dune areas make the snow surface inhomogeneous, which makes the dynamics of bedform evolution considerably more complex. We discuss this in Sects. 4 and 4.6.
Snow waves (Sect. 3.1.6) are large transverse features with 5–15 m wavelengths (Filhol and Sturm, 2015). They propagate parallel to the wind (Cornish, 1902; Kobayashi, 1980) but extend from tens to hundreds of meters in a perpendicular or oblique direction. They may or may not have visible crests.
Loose patches (Sect. 3.1.7) is a catch-all term. We found that, when a surface was mostly hardened, any remaining loose snow frequently traveled in patches 1–5 m long. Unlike dunes and waves, these patches lack crests, and they tend to fill depressions in the existing snow surface rather than organizing into persistent structures.
Sastrugi (Sect. 3.1.4) are the most widespread and well-developed erosional bedforms. Sastrugi are elongate features that present steep points into the wind (Filhol and Sturm, 2015; Amory et al., 2016). The points are regularly spaced, and the point of each feature is aligned with the gap between two neighboring sastrugi immediately upstream. The word “sastrugi” has been previously used to describe a wide range of snow features (Leonard, 2009), but its usage has become more focused in recent years.
Snow steps (Sect. 3.1.5) are smaller, less regular erosional features (Kochanski et al., 2018). They present low (<2 cm) vertical faces to the wind but lack the upwind-facing points that characterize sastrugi. Doumani (1967) called these features “proto-sastrugi”, but we avoid using this name because it implies a pattern of evolution, from steps to sastrugi, that we did not observe (see Sect. 3.2).
Finally, we introduce the stealth dune (Sect. 3.1.8). These are boomerang-shaped bedforms that resemble barchan dunes from afar, but their windward edges are vertical.
2.1 Field site
We surveyed bedforms on snow-crowned ridges and frozen reservoirs throughout the Front Range (Sect. S2). Among the sites we visited, one stood out for its well-developed and undisturbed bedforms: the Niwot Ridge saddle site (Fig. 1, 40.054∘ N, 105.589∘ W). The site lies on the downwind end of a broad, treeless 3 km long ridge, 5 km east of the Continental Divide, at an elevation of 3528 m. The ridge receives deep, dry snowfall. Snow falls from October through June, with the heaviest blizzards between January and March. Most blizzards bury the existing snow or ground surface. They deposit blank canvases on which bedforms evolve for a few days or weeks until they are buried by the next storm. The Colorado Front Range is a semiarid region with low humidity and famously dry snow. In winter the wind on Niwot Ridge blows almost without exception from the west-northwest, driven by temperature gradients over the Continental Divide. The ridge also runs east-southeast to west-northwest, parallel to the prevailing wind. The saddle site is downwind of a gentle bump in the ridge and collects deep snow throughout the winter, even while other parts of the ridge are occasionally scoured free of snow. We draw all but one of the observations in the main body of the text from the saddle site on Niwot Ridge.

Figure 1Field site on Niwot Ridge. (a) Location of the field site within the state of Colorado. (b) Installation of a time-lapse camera. (c) Weather station. (d) Close-up map of the field site with arrows showing prevailing wind direction (blue) and the locations of the camera and weather station (black).
We also present one set of observations made on the frozen surface of Barker Reservoir, Colorado, where we observed a type of bedform that did not appear on Niwot Ridge (Sect. 3.1.8). Barker Reservoir sits at the bottom of an elevated (2483 m) postglacial valley and, in winter, it becomes a 1800 m long stretch of ice. The valley funnels the wind west-southwest across the long axis of the lake. Much of the incoming snow is blocked by the town of Nederland, which occupies the upwind edge of the reservoir.
2.2 Data collection
We observed bedforms on Niwot Ridge in person and through Day 6 PlotWatcher Pro time-lapse cameras powered by cold-resistant Energizer Ultimate Lithium batteries. The cameras were angled downwind or perpendicular to the prevailing wind to prevent snow from covering the lens; we indicate the wind direction for each image. The cameras were mounted on 2 m tripods. The distance between the cameras and the surface decreased as snow accumulated; we reset them on the surface once a month. The uncertainty in the camera elevation makes it difficult for us to estimate distance directly from the images.
We therefore measured both bedform sizes and velocities in person, using meter sticks and with reference to poles with 10 cm stripes placed in front of the cameras. Where measurements are missing, for example because the poles blew away, we convey sizes, speeds and intensities in nondimensional units.
We used Tracker video analysis software (Brown, 2018) to extract high-resolution position–velocity data from several of our images. In one analysis we used the video to make a frame-by-frame visual estimate of the variations in the flux of blowing snow. We only attempted these analyses when the features moved perpendicular to the camera view to avoid distortion by distance. The cameras were active from February to March 2016, from October 2016 to March 2017, and from November 2017 to March 2018. They captured a total of 1082 h of good-visibility footage, with photos taken every 10 s. Footage is missing at night, during whiteouts, on days when clouds enveloped the ridges, when cameras were buried, and during equipment failures. Sample time-lapse videos are shown in video S1 and all videos are archived in Kochanski (2018b). All times were reported in Mountain Standard Time (MST).
Weather and precipitation data are available from the Niwot Ridge Long-Term Ecological Research Program station 200 m downwind of our cameras (Losleben, 2018a, b). Temperature measurements were collected with a Campbell Scientific CS500 mounted on a Stevenson Screen 1.5 m above the ground, and wind speed was measured with an RM Young 501D mounted 7.5 m above the ground. The recorded wind speeds from November through March average 10.5 m s−1. The gusts average 14.4 m s−1 and reach as high as 29.7 m s−1. The highest winds that we have seen that were sustained for an hour or more were 23.0 m s−1. Winter temperatures are −7.5 ∘C on average and vary from −28 to 11 ∘C. Melting temperatures occur in every month.
We analyzed the resulting data with Matplotlib (Hunter, 2007) and NumPy (Oliphant, 2007). We previously presented a statistical analysis of the relationship between snow bedforms and weather conditions on Niwot Ridge in Kochanski et al. (2018). In this paper we focus on bedform dynamics.
3.1 Bedform movement
Here, we illustrate the movement of each bedform with examples from time-lapse footage: planar snow surfaces (Sect. 3.1.1), barchan dunes and close-packed dunes (Sect. 3.1.2), ripples (Sect. 3.1.3), snow waves (Sect. 3.1.6), sastrugi (Sect. 3.1.4), snow steps (Sect. 3.1.5), and stealth dunes (Sect. 3.1.7). For each example, we include still frames in the text. These still frames have been selected for their clarity. The frames are taken from the videos provided in the 5 min long supplementary video S1 (Kochanski, 2018a). As this paper focuses on the motion of snow bedforms, video S1 is the most important figure.
3.1.1 Plane beds
The falling snow that we observed often fell in still air and settled into plane beds. These snow surfaces were smoother than the ground or older snow that they covered and were unmarked by corners, edges, or organized bedforms. They are also the only surface type made from fresh snowflakes that have not saltated or broken during saltation and, therefore, the only surfaces that sparkle in the sun. These surfaces did not persist once any perceptible amount of snow began to blow. Kochanski et al. (2018) determined that the snow on Niwot Ridge was likely to be flat only if the wind speed was less than 6.4±2.2 m s−1 and the snow was fresher than 1.4±3.3 d.
3.1.2 Snow dunes
The biggest dune that we saw was 54 cm tall (Fig. 2a, in a field of 30–50 cm dunes). The smallest dune (Fig. 2c) was no more than 7 cm tall and 40 cm long.

Figure 2Snow dunes on Niwot Ridge, Colorado. (a) The 30–40 cm tall stationary barchan dunes on 3 March 2018. Temperatures are near freezing. The snow between the dunes, which has been marked by erosional bedforms, is now unmarked by the author's weight. (b) Time lapse of close-packed dunes traveling downwind on 22 January 2018 from 13:29 to 13:34 (video S1 at 0:08). No hard or eroded snow is visible between the dunes. (c) The smallest barchan dune observed on Niwot Ridge, seen moving downwind at 11:25 on 9 November 2017 at 1–2 cm min−1. The <1–5 mm wide snow grains creep across the crest (video S1 at 0:57). (d) Time lapse of isolated barchan dunes from 07:20 to 08:20 on 17 January 2017 (video S1 at 0:39). Lines track the positions of the dune crests.
Figure 2b shows a field of close-packed dunes. These advected downwind, but they also interacted with one another. They rapidly merged, calved, and changed height. We tracked the heights, widths (measured horizontally from the dune crest to the downwind foot of the dune), and velocities (measured at the crest) of the dunes in Fig. 2b; the results are shown in Fig. 3. The dune heights and widths scale linearly. Their velocities, unlike the velocities of sand dunes (see Sect. 4.2), were not correlated with their sizes.
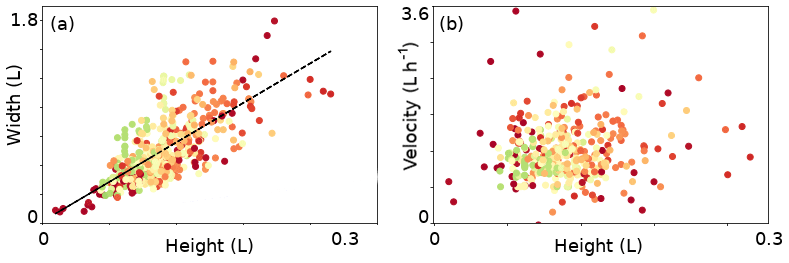
Figure 3Scaling relationships for dunes observed on 22 October 2018. Length is measured in an arbitrary unit m. Colors indicate the distance of the dune from the camera (dark red is close, pale green is far), which should be independent of the measured quantities.
Figure 2d shows the motion of a field of barchan snow dunes. These dunes are not close packed and do not interact with one another. They maintain their shapes as they move downwind (see video S1 at 1:07).
We tracked the position of the barchan dunes in Fig. 4 through time. The tracked points on the dunes moved an average of 0.63 m in the first 15 min of observation, for an average velocity of 2.52 m h−1, after which they decelerated until sunset. The dunes lost about a third of their height during this period.

Figure 4Movement of two barchan dunes on Niwot Ridge, Colorado, from 16:03 to 16:28 on 19 January 2018, and analysis of the effect of pulses of blowing snow on dune movement. See video S1 at 1:07. (a) Dunes at 16:03. Colored lines show the crest position through time, taken from time-lapse imagery. Poles have 10 cm stripes. Horizontal pole is held 2 m in front of vertical poles, which are 2 m apart. (b) Horizontal (left to right) positions of the dune crests at points C1, A1, C2, and A2 at 10 s intervals. The background is shaded when blowing snow is visible in the footage. (c) Cross-correlation of the presence of blowing snow with the instantaneous velocities of the dunes.
Neither the weather that drove the dunes nor their speeds were constant. The dunes were subject to frequent gusts. The instantaneous velocities of the dunes, observed over 10 s intervals, varied from 0 to 15 m h−1. The dune arms (A1 and A2) accelerated and decelerated at the same time as the peaks (C1 and C2), which indicates that the dunes moved as a whole in response to changes in the wind. Although our wind data measurements were not of sufficient resolution to resolve these gusts, the gusts were associated with pulses of blowing snow. We evaluated the blowing snow flux visually in our camera footage at 10 s intervals and indicate them with gray shading in Fig. 4b. The shading varies from white (no visible snow – though in our experience, the flux of blowing snow can be quite intense before it is opaque enough to appear on camera) to dark gray (whiteout). The dune was clearly visible through the snow in all but a handful of frames (see video S1 at 1:07).
We cross-correlated the intensity of blowing snow (on a normalized scale from 0 – white, no blowing snow – to 1 – dark grey, whiteout – with the instantaneous velocities of the dunes (Fig. 4c). This revealed that the velocities of C1, C2, and A2 lagged the pulses of blowing snow by 30±5 s, though the velocity of A1 did not correlate with the blowing snow. If we apply this 30 s offset, the velocities of C1, C2, A1, and A2 correlate with one another. This positive correlation and positive lag is evidence of causation: high incoming fluxes of blowing snow drive high dune velocities. Moreover, the dune movement must have contributed to the flux of blowing snow because the dunes lost height during the observation. These blowing snow events appear to have created a positive feedback that turned snow dunes into windblown snow.
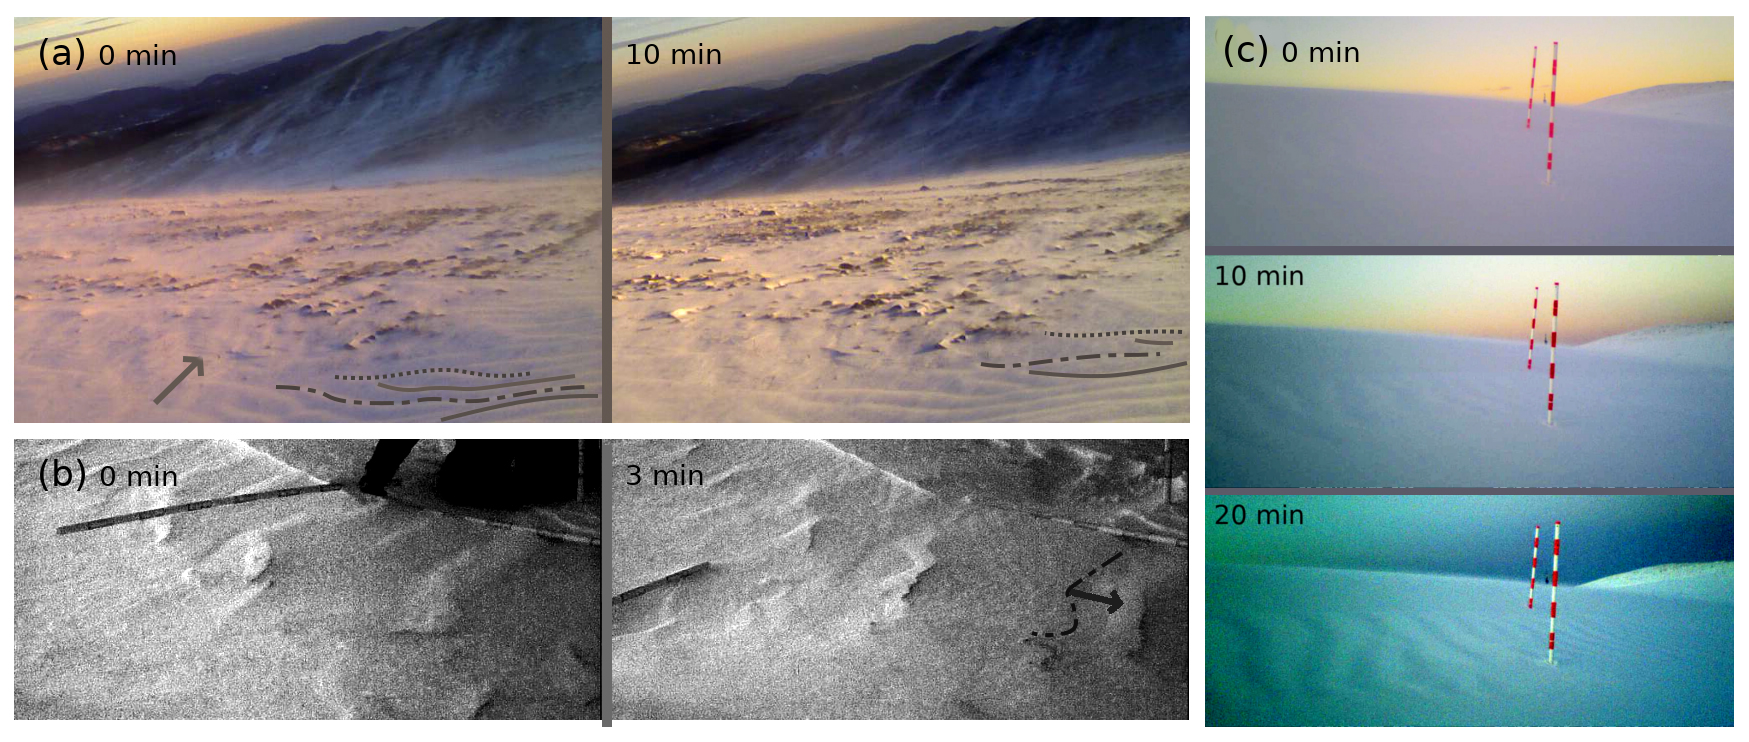
Figure 5Time-lapse images of snow ripples on Niwot Ridge, Colorado. (a) Ripples advect from 07:28 to 07:38 on 19 November 2016 (video S1 at 1:32). (b) Sand covers the crests of advecting ripples from 17:23:33 to 17:26:33 on 18 January 2018 (video S1 at 2:06). Pole has 10 cm stripes. (c) Ripples emerge from a previously flat snow-covered surface on Niwot Ridge between 18:05 and 18:25 on 27 March 2018 (video S1 at 2:23). Poles are 2 m apart and have 10 cm stripes. Ripples travel many wavelengths between photos.
The snow on the moving dunes that we observed demonstrated all three major types of aeolian snow movement. Saltating snow is clearly visible in the time-lapse footage used for Fig. 2b. Snow grains crept, with halting movements, across the crest of the dune in Fig. 2c. Finally, the images used to make Fig. 2a were often obscured by blowing snow that was suspended to at least the height of the 2 m camera. Although blowing snow is not always visible on the cameras, in person we observed moving snow dunes, ripples, and waves only during ground blizzards and never on days without blowing snow.
3.1.3 Snow ripples
Ripples appeared at our study site both as a primary features, covering wide swaths of ground (Fig. 5c), and as a secondary feature that adorned dunes and snow waves (Sect. 3.1.3). The ripples that we observed were 0.5–2 cm tall with wavelengths of 10–25 cm.
Figure 5a shows ripples covering the snowy portion of partially snow-covered ground in the early part of the snow season. The ripples advected downwind. Dislocations propagated across the bed, leading individual ripples to merge and separate from one another. The velocity of the ripples was consistent throughout the observation. The crests advanced by one wavelength every 33±3 s. Although scale bars were missing from this image, this allows us to estimate that snow ripples with typical 10–25 cm wavelengths move at 11–27 m h−1. These high speeds are consistent with our observations of ripples in Sect. 3.1.6. The movement of the ripples did not advance the snow over the rocky part of the ground, implying that the mass transported by the ripples was either buried or lost to suspension at the edge of the rocks.
The photos in Fig. 5b were also taken on a day when both snow and bare ground were exposed on the ridge. They formed from a mix of windblown snow and sand. The sand (dark) was concentrated on the crests of some of the ripples. Over the course of this 3 min observation, the ripples without sandy crests faded away, leaving mostly sand-covered ripples. The sand-covered ripples traveled at 4±1 m h−1, which is slower than snow ripples alone.
Figure 5c shows snow ripples emerge from a flat snow surface. They advected downwind by many wavelengths between photos, and their amplitudes grew gradually over time.
3.1.4 Sastrugi
Our study site, Niwot Ridge, frequently held sastrugi that were 14–40 cm deep and spanned 45–90 cm between points. The largest observed sastrugi (at the downwind end of Niwot Ridge) were 90–120 cm deep and spanned 120–180 cm. The troughs between those sastrugi resembled meandering slot canyons.
Figure 6 shows two erosion events in which sastrugi traveled downwind. We tracked the shapes of the 20 best-defined points in Fig. 6a for 2 h and found that 5 became more overhung, 7 became less overhung, and 8 migrated downwind without changes to their profile. The majority of the sastrugi in Fig. 6b maintain straight vertical edges, but two became more gently sloped and one became steeper during the 30 min observation.
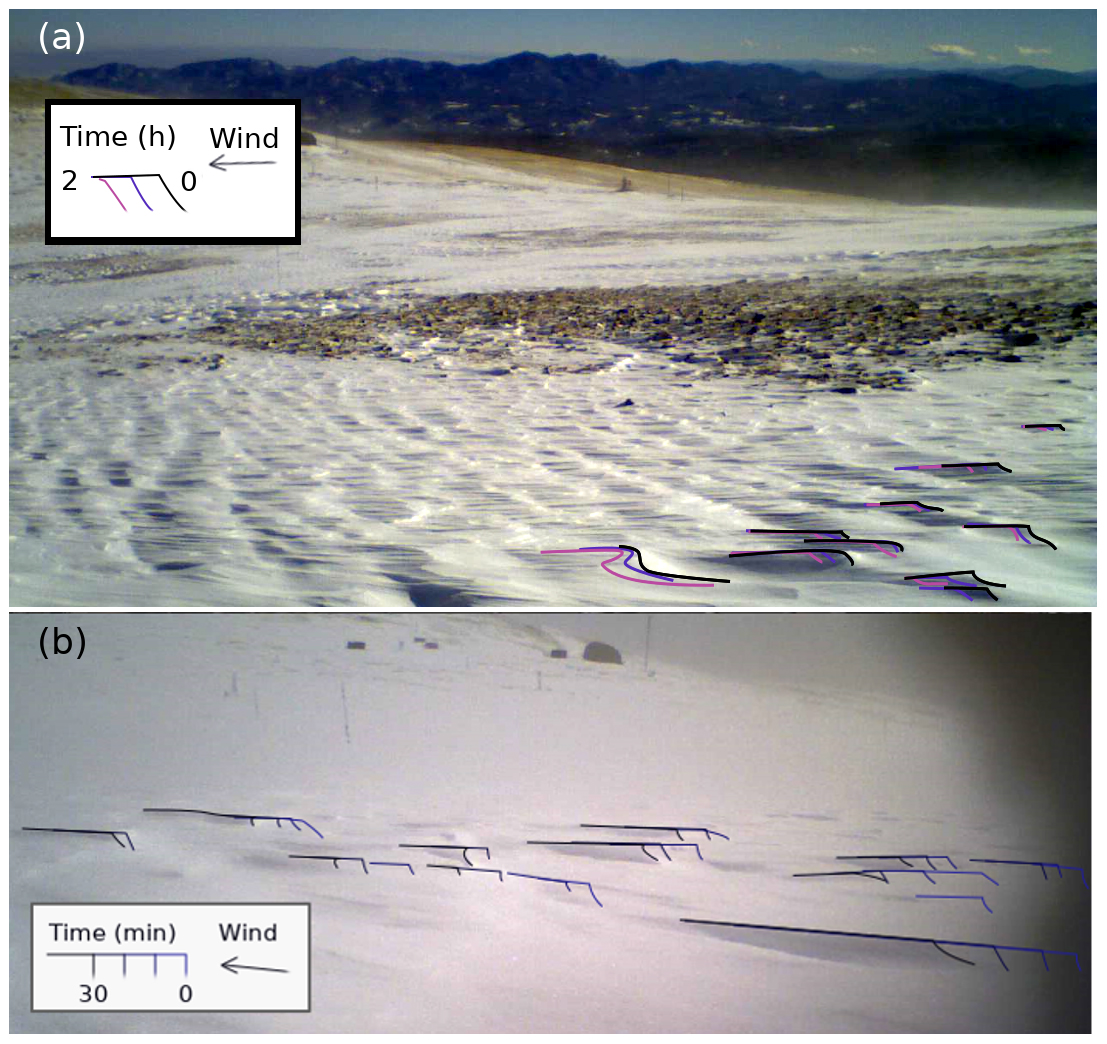
Figure 6Time lapse of sastrugi crests (a) from 15:30 (pictured) to 17:30 on 18 November 2016 (video S1 at 2:51) and (b) from 10:23 to 10:53 (pictured) on 25 March 2016 (video S1 at 3:05).
When we observed sastrugi in person, during high-wind events, loose snow collected at the bottoms of their points. These loose snow grains moved continuously, such that the loose snow sparkled with motion while the sastrugi themselves appeared dull. Up close, we saw that large grains collected at the base of the sastrugi, then crept downwind along both sides of the point. This creep moved the grains in an oblique downwind direction, without moving them vertically over the sastrugi. These patches of loose snow disappeared momentarily in strong gusts.
We did not observe sastrugi formation. Our video observations therefore provide evidence that sastrugi are stable enough to migrate horizontally across distances several times their height without significant changes of form, but they do not show direct evidence of the mechanisms of sastrugi formation.
3.1.5 Snow steps
Figure 7a shows a row of slowly moving snow steps left in the wake of a traveling snow wave (snow step formation behind waves is discussed in Sect. 3.1.6). The steps migrate downwind over the observation period. When they first form, at the beginning of the observation, they are relatively straight and soft-looking. Over the following 2 h, they become more crenulated and sinuous in plan view. The density of the snow steps on the surface also increases; Fig. 7a shows all of the steps visible at the start of the observation (dashed blue lines), which is not all of the steps visible at the end (photo, select steps traced in black).
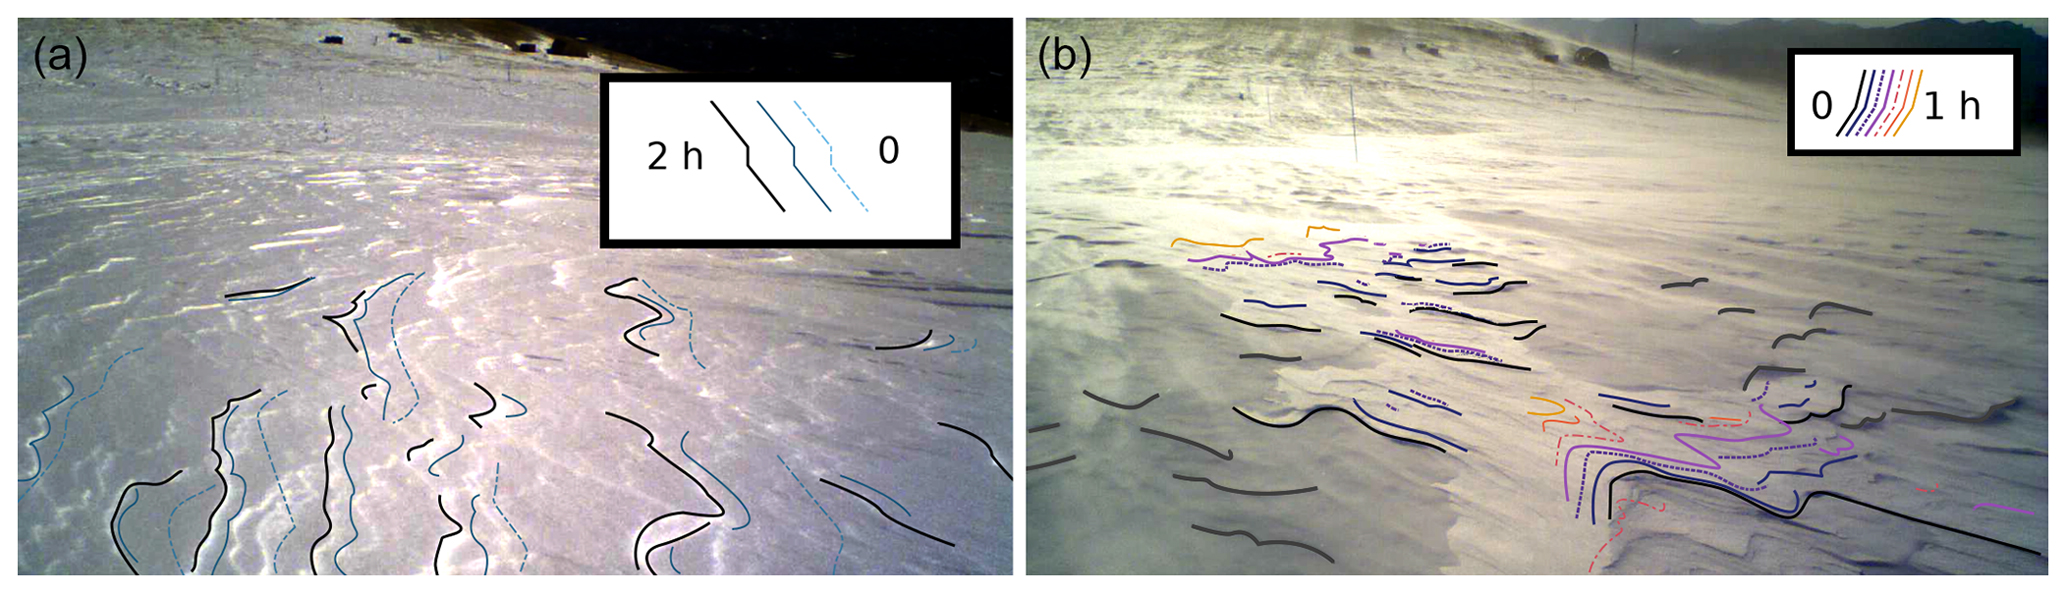
Figure 7The movement of snow steps on Niwot Ridge, Colorado, (a) 21 March 2016 12:06–14:06 (video S1 at 3:35, photo at end of observation) and (b) 13 March 2016 07:09–08:09 (video S1 at 3:57, photo at beginning of observation).
Figure 7b shows differential step motion in a case where an old, hardened snow layer (duller white) lies under a relatively new and soft layer (brighter white). The newer steps eroded during the day, but the older steps did not move visibly. At the end of the day the newer steps were entirely removed. Their removal revealed a subtle landscape of older snow steps that had apparently been buried and persisted under the snow.
3.1.6 Snow waves
Snow waves appeared frequently on Niwot Ridge. The waves we observed were 1–3 m long parallel to the wind, with crests separated at wavelengths of 10–20 m. Figure 8a shows a field of snow waves extending for tens of meters in a direction oblique or perpendicular to the wind.
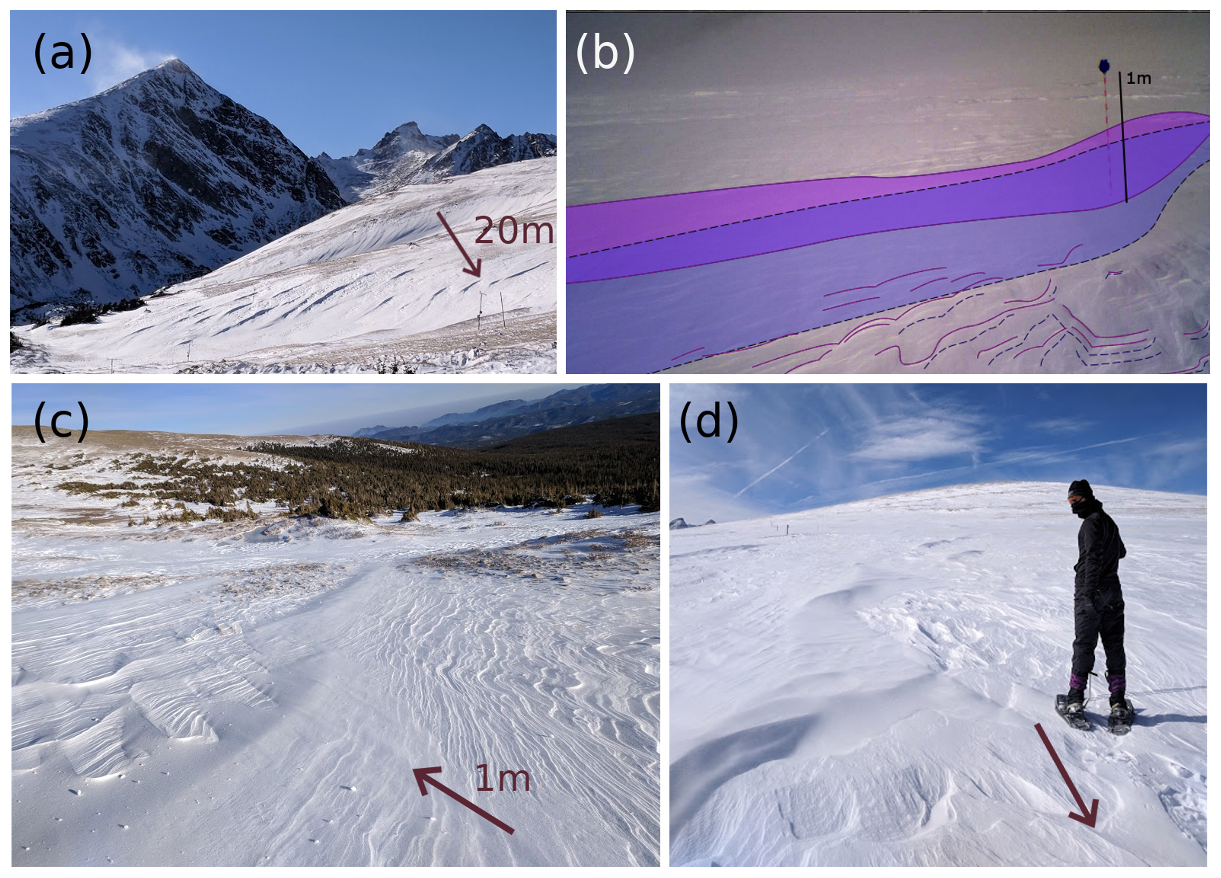
Figure 8Snow waves on Niwot Ridge, Colorado. (a) Long-distance view on 9 November 2017 with estimated wind direction and scale, (b) time-lapse image showing motion of wave (shaded) and small erosional features (lines) away from the camera from 12:20 (dashed blue area) to 13:00 (purple, solid) on 24 February 2017, video S1 at 4:19, (c) parallel snow steps in the wake of a wave on 9 November 2017, and (d) alternating wave crests and ripples on 12 November 2017.
Figure 8d shows a section of a wave. The wave has several separated crests, joined by low, rippled sections of the wave. The crests point directly downwind, but the overall orientation of the wave is oblique.
Snow waves move by advecting downwind, but they also interact with the snow surface beneath them. We document this interaction in Figs. 8b, c and 9. Figure 8b shows time-lapse imagery of the movement of a snow wave and nearby snow steps. As the video progressed, the visible steps migrated downwind, and new steps appeared behind the wave.

Figure 9A rippled wave travels across Niwot Ridge from 06:40 to 08:40 on 19 January 2017, video S1 at 4:40. The wave is covered by ripples, which eventually collapse into a single crest, and deposits fresh snow as it passes. This in turn develops snow steps. Distance is measured in arbitrary unit m.
Figure 8c shows this process close-up. The traveling wave in this photo buried the snow steps to its left. It also generated the snow steps to its right. The right-hand steps are parallel to the wave crest, and the steps further from the crest are slightly more crenulated than the steps at the top. The snow surface behind the wave was several centimeters higher than the snow in front, implying that the new steps formed in newly deposited snow.
Figure 9 further illustrates the interaction between snow waves and the underlying snow surface. The wave started as a low rippled section. The ripples occasionally appeared, disappeared, and merged, which was consistent with a side view of ripple dislocation (e.g., Fig. 5a). The ripples traveled about 10 times as fast as the bulk of the wave. After about 60 min, the last ripple caught up to and merged with the previous ripples, forming a single crest. The velocity of the wave did not appear to change as it shifted from a rippled section to a crest. The crest deposited a layer of new snow, which was noticeably higher and fresher-looking than the previous snow surface. Several snow steps formed in this freshly deposited snow. They migrated downwind and decelerated over time. Figure 9b tracks the peaks of the ripples, crest, and snow steps at 5–10 min intervals.
3.1.7 Loose snow patches
Small quantities of loose snow on deeply eroded surfaces collected into longitudinal “patches” a few centimeters thick. They flowed between underlying sastrugi and do not have persistent forms. The patches that we observed were 25–300 cm wide and 0.5–10 m long. On one occasion, a set of otherwise stationary snow steps began to migrate downwind when a patch of snow passed by.
3.1.8 Stealth dunes
Finally, we observed an extreme erosional bedform that we propose calling the stealth dune for its low profile and its rarity (Fig. 10). These dart-shaped dunes sit on ice and resemble barchans from afar, but their slopes are inverted: the upwind edges of the dunes are hard and vertical, while their lee sides are nearly flush with the ice. Figure 10a–c show three dunes from a field of mixed size. The wing spans of the stealth dunes in that field ranged from 0.15–3 m, and their heights ranged from imperceptible thinness (likely due to scouring by wind after the dune formed) to a maximum of 10 cm. Figure 10d shows an idealized stealth dune, emphasizing the vertical upwind slope. We observed stealth dunes only on the frozen mile-long surface of Barker Reservoir, and we did not see them move.
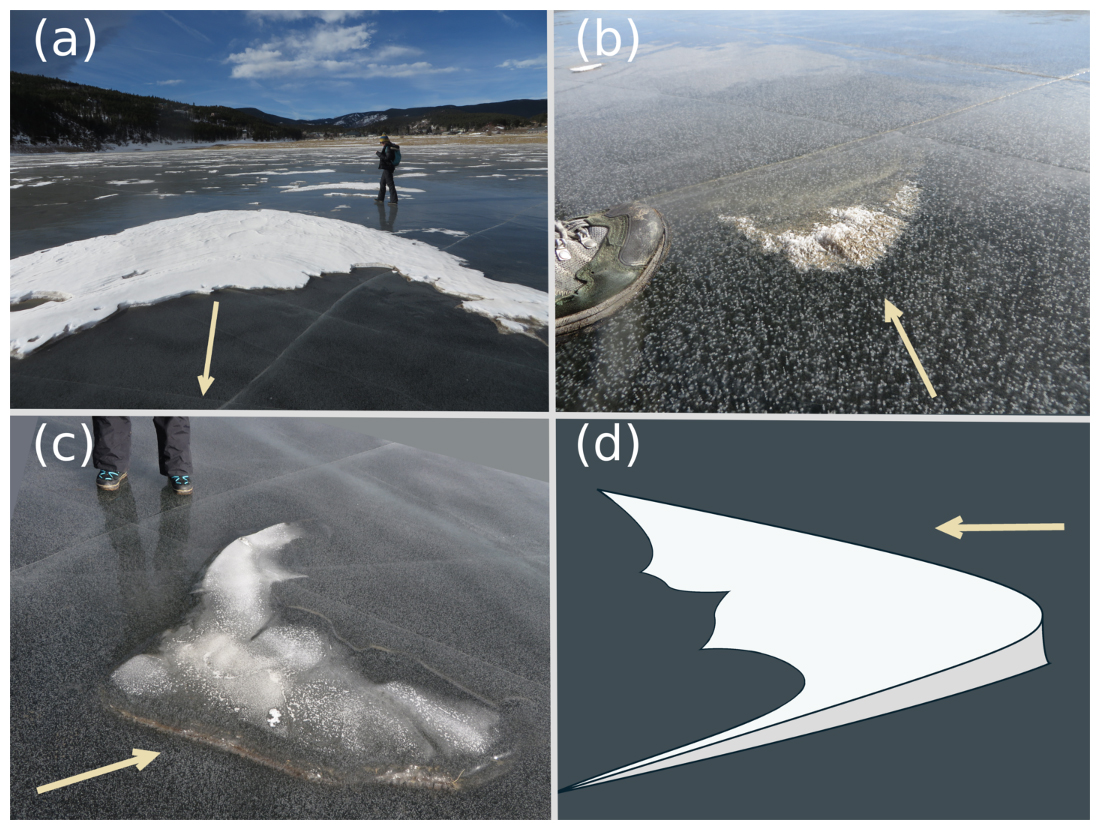
Figure 10Stealth dunes viewed from several angles on Barker Reservoir, Colorado, on 16 January 2016. (a) Large stealth dune. (b) Remnant of small stealth dune. (c) Marks left on ice beneath a dune; surface is raised by 1.5 cm. (d) Schematic of stealth dune.
3.1.9 Bedforms in spring
We observed snow bedforms from first snowfall through late March. When week-long periods passed without snowfall, suncups appeared on the snow surface. These surfaces were consistently covered by sastrugi. The suncups appeared to be symmetric around the sastrugi, including the underhung sides of lanceolate sastrugi: they were neither visibly larger on the sunny south sides, nor eroded on the upwind sides.
From April or May through July, the surface of the snow on Niwot Ridge deflates due to melting and sublimation. We are missing observations in April and May, but in June 2016 and 2017 the surface of the snow was soft, wet, and marked by suncups without other bedforms.
The rate of sublimation on the ridge is slow compared to bedform formation. We observed the snowpack on Niwot Ridge shrink in above-freezing temperatures from 19 June to 1 July 2017. The snow depth decreased by 1.1 m during this 12 d period (0.092 m d−1). As many bedforms that we observed grew in periods of hours, it seems unreasonable that they are erased by sublimation in spring. We therefore infer that spring conditions prevent bedforms from forming in the first place. This agrees with other authors' observations that bedforms grow best in dry snow.
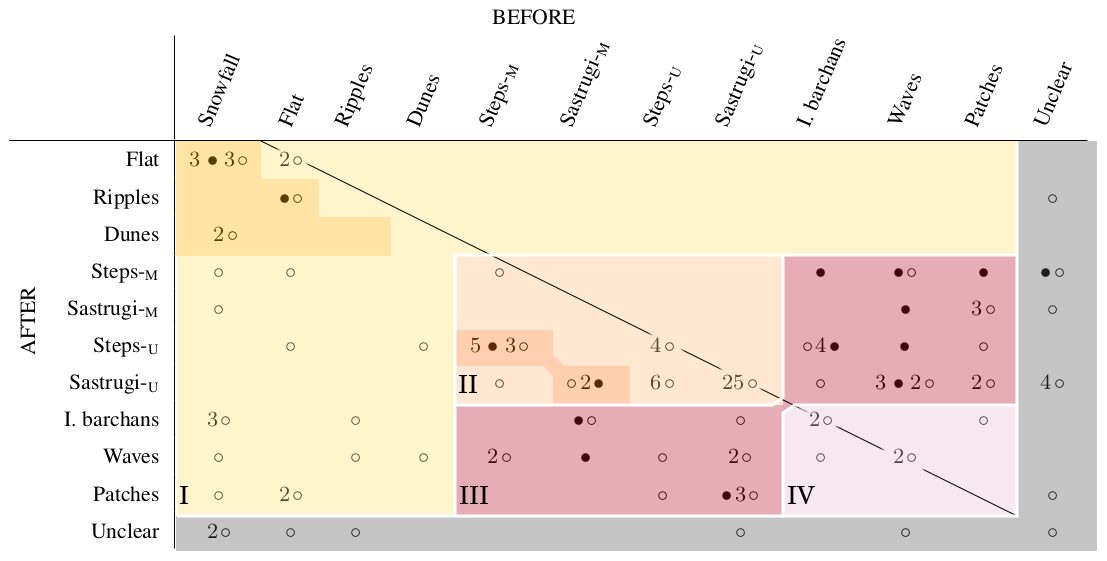
Figure 11Transitions from one type of bedform to another, either observed directly (•) or implied during a <12 h gap in footage (∘, e.g., overnight). Snow steps and sastrugi may be moving (M) or unmoving (U) when observed. “Dunes” are close-packed (as in Fig. 2b), and “I barchans” are separated (as in Fig. 2d).
3.2 Bedform evolution
In Sect. 3.1 we showed three examples of transitions from one type of bedform to another. In Sect. 3.1.1 we discussed the deposition of flat snow surfaces during heavy snowfall events with gentle winds. In Fig. 5c, we showed ripples emerging from a flat snow surface. Finally, Figs. 8b–d and 9 showed snow waves burying existing snow steps and leaving new snow steps in their wake. The sum of all the transitions that we observed are presented in Fig. 11. These include transitions that we observed directly (•), as in the example cases above, plus changes in the surface that happened overnight or during other <12 h gaps in our observations (∘). We have grouped together transitions that share similar characteristics. Transitions that involve a surface made of entirely loose snow are in Region I (yellow). Transitions from one type of hardened, erosional surface to another are in Region II (orange). Transitions between surfaces that expose a mix of loose snow and hardened snow, such as waves, are in Region IV (pink), and transitions in which hardened surfaces turn into mixed surfaces, or vice versa, are in Region III (red). These groups of bedforms are discussed further in Sect. 4.
The transitions in regions I and II appear to be irreversible. For example, we saw planar surfaces turn into ripples (Fig. 9), but rippled surfaces never became planar, and we saw snow steps and sastrugi decelerate (Fig. 9) and stop moving but did not see them restart. In contrast, the transitions in region III appear to drive cyclic evolution trajectories. We saw snow waves, snow patches, and barchan dunes bury snow steps (such as in Fig. 8c) and sastrugi. Sometimes, the snow waves or loose patches moved on without changing the surface and revealed the buried bedforms apparently unchanged. On one occasion, existing snow steps were remobilized by a passing loose patch. Barchan snow dunes always deposited a new snow layer in their wake, and snow waves sometimes did as well. These new layers eroded into either sastrugi or snow steps. These transitions are shown graphically in Fig. 12. This graph contains the same information that is represented in tabular or matrix form in regions II, III, and IV. If bedform evolution were unidirectional, we would be able to arrange Fig. 11 such that all transitions lay on one side of the 1 : 1 line or arrange Fig. 12 without any loops or repetition. Finally, we did not directly observe any transitions in region IV. We suspect that these transitions only occur by way of the transitions in region III; for example, we have seen a surface covered by isolated barchans, then snow steps, then snow waves.
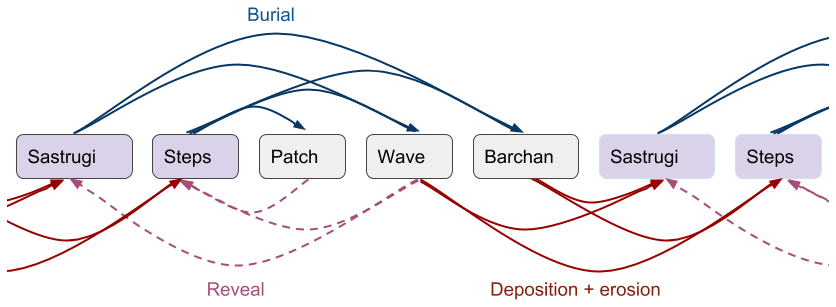
Figure 12Observed interactions between erosional bedforms and bedforms made of loose snow. Left-to-right interactions result in the net deposition of new snow on the surface. “Burial” (blue): a wave, dune, or patch advects onto an eroded surface and covers the existing bedforms. “Reveal” (dashed): the wave, dune, or patch continues traveling and leaves the observed area without modifying the surface. “Deposition + erosion” (red): a wave, dune or patch deposits a layer of freshly accreted snow onto the surface. Erosional bedforms are carved immediately in the fresh snow.
Many snow bedforms are analogous to other self-organized aeolian features. Barchan snow dunes, close-packed dunes, and snow ripples resemble sand dunes and ripples. Snow steps and sastrugi find their analogues in scoured bedrock: the scalloped edges of snow steps loosely resemble bedrock fluting, and the aerodynamic points of sastrugi resemble yardangs. Other snow bedforms, such as snow waves, are not obviously analogous to other aeolian features but mediate the transitions between the sand-like and bedrock-like bedforms.
We use these observations to place snow bedforms into three categories that we use in the remainder of this discussion.
-
Loose-surface bedforms consist entirely of granular snow, which creeps or saltates downwind and slips when oversteepened. The bedforms on these surfaces resemble aeolian sand features. These include close-packed dunes and ripples.
-
Hardened-surface bedforms are cohesive, solid, and shaped by erosion. These include snow steps and sastrugi.
-
Mixed-surface bedforms consist of loose snow traveling over a hardened-snow surface. Loose-surface and hardened-surface bedforms alternate in patches or stripes. These include isolated barchan dunes and snow waves.
4.1 The processes that shape snow surfaces
Figure 13 illustrates the major snow processes that shape bedforms: snowfall, aeolian transport, erosion, and sintering. Here, we analyze the relative importance of these fluxes as a function of snow grain size and wind speed. These processes are described in more detail in Sect. S3.
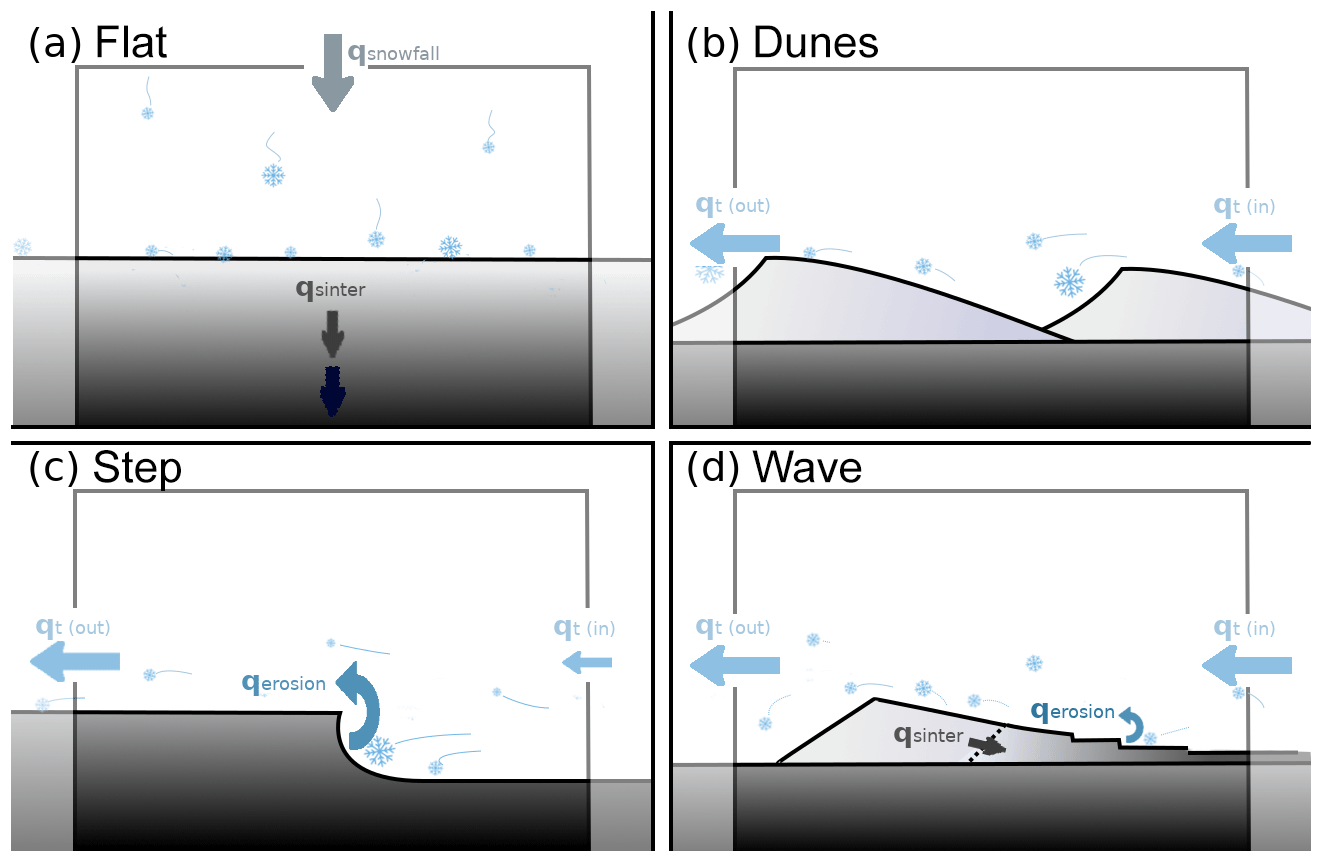
Figure 13Expected self-organization of snow in environments dominated by (a) snowfall; (b) aeolian transport; (c) erosion, or transport on a cohesive surface; and (d) a mix of processes. Here, q refers to the total flux of snow, and qt refers to aeolian transport by creep or saltation.
Figure 13a shows a wind too weak to move any snow grains. This occurs when the force that the wind exerts on the surface is insufficient to overcome gravity and friction and lift any grains.
Figure 13b shows loose-snow bedforms created by horizontal snow transport. We expect these bedforms to be created when the wind friction velocity is high enough to mobilize snow but not so high that all the snow is lifted away from the surface and into suspension. Li and Pomeroy (1997) found that dry snow is mobilized by winds higher than 7–14 m s−1, measured at 10 m elevation. Clifton et al. (2006) found slightly higher thresholds that increased with particle density and size. Snow transport shapes all bedforms except planar surfaces.
Figure 13 shows a hardened snow surface being eroded. The erosion rate of a solid surface is proportional to the energy of the impacting particles, minus a threshold energy that depends on the material hardness (Anderson, 1986). Thus, erosion requires a supply of loose, high-speed snow particles. The threshold erosional energy of snow is not well documented in the literature, as most snow gets harder over time. This process, known as sintering, is accelerated slightly by humidity, warmth (Colbeck, 1998), small grain sizes, and wind action (Colbeck, 1991) and accelerated by orders of magnitude by the presence of liquid water (Blackford, 2007). This process occurs for hardened and mixed-surface bedforms.
Finally, Fig. 13d shows a surface in which sintering, transport, and erosion happen at comparable rates. This forms mixed-surface bedforms, as discussed in Sect. 4.6.
4.2 Snow dune dynamics
Loose-snow bedforms bear many similarities to sand dunes and ripples. Here, we focus on snow dunes. For a thorough and quantitative analysis of snow ripples, see Sect. 3.3 of Kobayashi (1980). Our observations show that sand dune motion provides a moderately useful analogue for snow dune dynamics. Many of the processes that shape sand dunes appeared around the snow dunes that we observed, including saltation, suspension, creep (Sect. 3.1.2), and grain sorting (Fig. 5b). In the following paragraphs we discuss three major differences between sand dunes and snow dunes and present conceptual models to explain these differences.
First, snow dunes are small. The dunes we observed varied from approximately 7–55 cm in height (see examples in Fig. 2). We saw at least one well-formed dune barely longer than my snowshoes (about 40 cm; see Fig. 2c). Other reports from Antarctica (Doumani, 1967) and Alaska (Filhol and Sturm, 2015) have also documented snow dunes only tens of centimeters high, even in snowy, cold environments where dunes should have considerable time to grow. Some, but not all, of the size differences may be attributed to known scaling laws. The fundamental length scale for sand saltation and sand dune growth is , where d is the grain size, ρf is the fluid air density, and ρs is the solid grain density (Elbelrhiti et al., 2005). We estimate that saltating snow grains on Niwot Ridge have an effective density of perhaps half the density of ice, or 450 kg m−3, occur at low air density due to altitude (0.860 kg m−3 at −5 ∘C), and are perhaps 0.2 mm in diameter, leading to a value of λmax≈5.2 m. For contrast, a typical value of λmax for Sahara sand is 20.4 m (Elbelrhiti et al., 2005). The snow dunes that we observed, however, were not even a quarter the size of Sahara sand dunes. We therefore infer that at least one process that is present in snow but not in sand limits the size of dunes.
Second, sand dunes have downwind slip, or avalanche, faces but not all of the snow dunes that we saw were steep enough to slip. The dunes in Fig. 2a and c clearly have steep slip faces, but the dunes in Fig. 2d appeared to be nearly flush with the snow. The dunes in Figs. 2b and 4 are indeterminate.
Third, the speeds of sand dunes are inversely proportional to their heights (Bagnold, 1937; Vermeesch and Drake, 2017). We do not observe this relationship in snow dunes. Although Fig. 9 clearly shows small ripples moving faster than the larger bedform that they cover, when we explicitly tracked the velocities and heights of a field of dunes (Fig. 3), we did not find a systematic dispersion relationship.
These three features – dispersion, size, and avalanching – are all manifestations of the pattern of mass flow around a dune. The dispersion relationship for sand dunes is a direct function of the conservation of sand flux (Bagnold, 1941; Vermeesch and Drake, 2017). If all dunes in a field are exposed to the same flux of blowing sand, and all of them trap this same flux on their lee slopes, then their velocity will be inversely proportional to their height. Thus, as we document that snow dune velocities are not inversely related to the dune heights, we infer that snow flux is not conserved within individual snow dunes. Lack of snow conservation within a dune might occur when (1) a dune loses mass to sublimation or (2) gains mass from snowfall, (3) the driving wind speed varies rapidly, or (4) a dune exchanges mass with its neighbors.
Our observations indicate that sintering is the primary limit on dune size on Niwot Ridge, although we cannot discount the removal of particles into suspension. Snow dune size could plausibly be limited by three processes: sublimation, suspension, and sintering. We have considerable evidence that snow sinters in dunes. We saw several hardened barchan dunes; the dunes in Fig. 2a were hard enough to support the author's weight. We also saw hints of a snow stratigraphy and cohesive snow steps in the wakes of the mobile dunes in Fig. 2c and d. In contrast, we did not find evidence that sublimation limits the size of snow dunes. The sublimation rates on Niwot Ridge are very slow relative to the speed of snow dunes (Sect. 3.1.9), and we know that dunes do not grow larger even in very cold locations, such as Antarctica (Doumani, 1967) and Alaska (Filhol and Sturm, 2015), where sublimation rates are yet lower than on Niwot Ridge.
We hypothesize that low-lying, non-avalanching, non-flux-conserving dunes could be formed by rapid changes in the wind speed. In order for a dune to have a downwind avalanche face, many windblown grains must fall out of the air onto the avalanche face. In sand dunes, grains fall out of the air in the recirculation zone downwind of the dune and land on the avalanche face (as in Fig. 14a). If the wind rises, however, the hop lengths of saltating grains will lengthen. Saltating grains may then miss the slip face entirely and collect in a drift downwind of the dune (Fig. 14b). This is only possible in small dunes whose slip faces are similar in length to the saltation hop length. Small, non-avalanching dunes are likely transient features because if too many grains miss the slip face the dune will lose mass and dwindle away. The final shape of a snow surface, however, is usually set within 1 or 2 d of snowfall (Filhol and Sturm, 2015), so even short-lived features may play important roles in the surface evolution.

Figure 14Conceptual model of grain transport over a dune in (a) slow-moving air and (b) fast-moving air. Solid blue lines are time-averaged streamlines, with boundary-layer fluctuations omitted for clarity. Dashed black line shows a grain trajectory. The arrow in panel (a) shows an avalanche path.
4.3 Snow step erosion
All of the hardened-snow bedforms that we have observed are characterized by steep windward edges. We hypothesize that these steep edges hold the key to a general understanding of snow surface erosion. Our observations have shown that snow steps and sastrugi migrate downwind, which indicates that erosion is concentrated on the vertical steps. In Fig. 15, we present a conceptual model that demonstrates how this erosional pattern could be generated around a snow step.
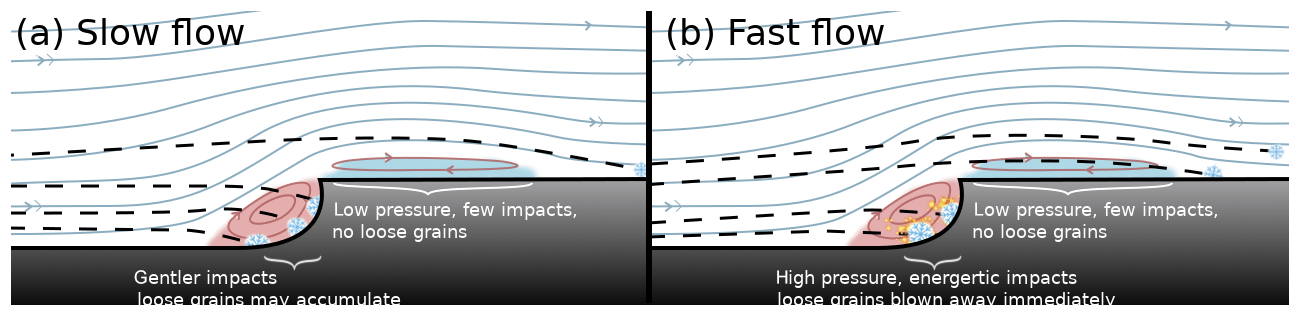
Figure 15Conceptual model for air and particle flow over a snow step in (a) slow-moving and (b) fast-moving air. Solid lines show idealized streamlines over the step, including two regions of detached flow (shaded in panel a). Dashed black lines show snowflake trajectories.
The flow pattern around our conceptual step is modeled after the flow around an upwind-facing step in steady laminar flow. Steps create two recirculation zones: one on the upwind side of the step, where flow stagnates, and one on the top of the step (shaded in Fig. 15).
This flow pattern offers several opportunities for particles to detach from the flow and strike the area around the step. When the flow encounters the step, it reaches an equilibrium state in which the pressure in the upwind recirculation zone is just high enough to deflect the flow past the step. Snow grains, however, are 200–1000 times denser than air, and thus will be accelerated 200–1000 times more slowly by a given force; the pressure gradient that lifts the air flow will barely deflect the grains. Thus, if the incoming angle of a particle is sufficiently low, that particle strikes the step. This process has been modeled in detail for flow around cylinders, spheres, and disks (Langmuir and Blodgett, 1946; May and Clifford, 1967). Around the forward-facing step, we expect that the highest impact rates will occur before the step and on its vertical face, where gravity assists inertia in detaching particles from the flow. We expect that the lowest impact rates will occur on the top of the step, as particles that successfully cross the step must have upward momentum that will delay their fall.
Only the most energetic of the detached particles will strike the vertical face of the step. Particles that detach from the flow lose energy to air resistance. Any particle that loses too much energy will fall out of the flow without striking the step. These particles are unlikely to carry enough energy to cause erosion. We therefore expect particles to reach the step at greater rates in high winds, when the particles have higher initial energies than during periods of low wind (compare Fig. 15a and b). We also expect fewer particles to strike taller steps, which create longer stagnation zones, than shorter steps. This could place an upper limit on the heights of snow steps.
Finally, as described above, the erosion rate of solid materials is proportional to the energy of the impacting particles minus a threshold energy (Anderson, 1986). In Fig. 7b, we showed an example of differential erosion on two layers of snow steps. As these steps were subject to the same fluxes of wind and snow, we assume that the older, non-eroding layer had a higher erosion threshold. Based on our current observations, however, we do not expect snow step erosion rates to be determined by the average properties of the snow pack. Figure 9c shows five snow steps moving at different velocities, despite being mere meters apart. Those snow steps decelerated over time. We infer from this that snow step erosion rates are a function of the age of the step but that this age differs from step to step across the shifting landscapes of bedform-covered snow.
4.4 Stealth dunes
We presented one previously undocumented erosional bedform: the stealth dune. Like other erosional bedforms, they have vertical windward edges, and like sastrugi they present points to the wind. Unlike sastrugi, however, they have distinct crescent shapes and are not arranged in a regular pattern. We saw stealth dunes only on the surface of Barker Reservoir and have only found one record of them in the prior literature: Cornish (1902) sketched an “erosion form analogous to a barchan” from land in British Columbia. Cornish hypothesized that these dunes are the eroded remnants of transverse waves. We concur. We occasionally see complete waves downwind of the stealth dunes on Barker Reservoir. Our observations allow three reasons why these dunes are rarely reported: (1) they are formed from snow waves, and little previous literature has documented snow waves; (2) Barker Reservoir, with its narrow valley and upwind town, provides a rare combination of high, unidirectional winds and low snow supply; or (3) stealth dunes are visible only in contrast to a dark surface, like lake ice.
4.5 Sastrugi formation
Sastrugi are the most widespread snow bedform (Filhol and Sturm, 2015) and can be the largest (Mather, 1962). They are therefore more interesting, from a broad view of the polar sciences, than other bedforms. We fear, however, that they are also more complex.
To develop a model of sastrugi evolution, we will need to overcome major field and computational challenges. First, stationary sastrugi geometries have not yet been characterized in detail. This problem may be solved by ongoing lidar studies. Second, sastrugi evolution is not easy to observe. Kochanski et al. (2018) found that sastrugi are formed during winds of at least 20 m s−1 (45 mph); in our study, we captured many hours of data without observing an instance of sastrugi formation. Third, sastrugi, unlike snow steps, are fully three-dimensional features, and windblown snow follows winding three-dimensional paths between their points. Moreover, we have shown that even a simpler bedform, the snow step, is stabilized by complex flow structures and flow detachments. We therefore suspect that a successful model of sastrugi must resolve the three-dimensional flow structures around sastrugi points. We are, however, optimistic that grain sorting and wind-pumping are secondary effects that could be excluded from a useful model. Such a model, especially if it included the motion of blowing snow grains, would still require considerable computational expense.
4.6 Cycles of deposition and erosion
In Fig. 13d, we presented a conceptual model of a bedform in which aeolian transport, snow accretion, and erosion coexist. This is a mixed-surface bedform, in which loose snow and hardened snow alternate on the ground. The preeminent examples of mixed-surface bedforms are snow waves. In the field, we saw wave crests made of loose, granular snow, with snow steps forming in cohesive snow on their upwind sides (e.g., Fig. 8c). From these observations, we infer that loose snow is deposited on the downwind lee of the wave, that the snow becomes cohesive in the time it takes for the wave to move past, and that some but not all of the newly deposited snow is eroded into steps. At least some snow grains are thus accreted onto the surface during the passage of the wave, some of which are then eroded back out of it with every passing wave (Fig. 12). If this conceptual model is correct, then the nature of hardened-surface bedforms – and the presence or absence of accreted snow – is determined by the frequency of passing snow dunes and waves.
This pattern invites us to consider cycles of erosion and deposition on longer length scales and timescales. When a region of snow erodes, it releases snow particles into the wind. Thus, the erosion of upwind bedforms may provide a snow flux that drives the evolution of downwind bedforms. The effect of this snow flux will depend on the wind speed and the nature of the downwind bedforms. If the wind speed decreases, we expect blowing snow to be deposited in dunes, waves, or smooth drifts. In windswept conditions, we have seen blowing snow grains erode snow steps and remove mass from snow dunes.
Here we have presented numerous examples of snow bedform movement to illustrate the modes of bedform growth and evolution. These examples are drawn from a library of over 1000 h of time-lapse footage of snow bedform evolution, available in Kochanski (2018b), and from detailed field observations in the Colorado Front Range. The data include a large number of observations of snow waves (examples in Sect. 3.1.6) and the first description of an erosive feature we term the “stealth dune” (Fig. 10).
We have used the observations published here to develop conceptual models of the evolution of snow barchans, snow steps, and snow waves. We propose that snow bedforms should be characterized in terms of the primary processes that form them: snowfall, aeolian transport, erosion of cohesive substrates, and sintering.
These processes are all well-known to snow scientists and Earth surface scientists, but their interactions have not yet been studied. We hypothesize that future studies of snow bedforms will reveal new regimes of self-organization in nature and lead us towards a quantitative understanding of the snow features that cover the alpine and polar regions of Earth.
Time-lapse observations from March 2016 to April 2017 are archived at https://doi.org/10.5281/zenodo.1253725 (Kochanski, 2018b). These processes are described in more detail in Sect. S3. Weather (Losleben, 2018a) and precipitation (Losleben, 2018b) data for the Niwot Ridge field site are available from the Niwot Ridge Long-Term Ecological Research program at http://niwot.colorado.edu (last access: 13 April 2019). Selected example observations are available in the supplemental video (Kochanski, 2018a), and described in Sect. S1.
The supplement related to this article is available online at: https://doi.org/10.5194/tc-13-1267-2019-supplement.
KK acquired funding for field equipment, carried out the field campaign, analyzed the data and wrote the manuscript. GET and RSA supervised the project. All authors provided critical feedback and helped shape the research, analysis, and manuscript.
The authors declare that they have no conflict of interest.
This research was supported by a Department of Energy Computational Science Graduate Fellowship (DE-FG02-97ER25308) and by a University of Colorado Chancellor's Fellowship. Field equipment was funded by the American Alpine Club, the Memorial Research Fund of the Colorado Scientific Society, and a Patterson Award from the University of Colorado Department of Geological Sciences. Field assistants were supported by the University of Colorado Undergraduate Research Opportunities Program. Logistical support and climate data were provided by the Niwot Ridge Long-Term Ecological Research Project and the University of Colorado Mountain Research Station through NSF cooperative agreement DEB-1637686. We thank Irina Overeem, Clea Bertholet, Chelsea Herbertson, Madonna Yoder, and Richard Barnes for their help in the field. We extend additional thanks to Madonna Yoder and Chelsea Herbertson for data analysis leading to the construction of Fig. 3; to Aaron Hurst for validating the flow field in Fig. 15; and to two anonymous reviewers for constructive comments that improved the overall quality of the paper.
This paper was edited by Martin Schneebeli and reviewed by two anonymous referees.
Amory, C., Naaim-Bouvet, F., Gallée, H., and Vignon, E.: Brief communication: Two well-marked cases of aerodynamic adjustment of sastrugi, The Cryosphere, 10, 743–750, https://doi.org/10.5194/tc-10-743-2016, 2016. a, b, c, d
Amory, C., Gallée, H., Vincent, F. N.-B., Vignon, E., Picard, G., Trouvilliez, A., Piard, L., Genthon, C., and Bellot, H.: Seasonal variations in drag coefficient over a sastrugi-covered Snowfield in coastal East Antarctica, Bound.-Lay. Meteorol., 164, 107–133, https://doi.org/10.1007/s10546-017-0242-5, 2017. a
Anderson, R. S.: Erosion profiles due to particles entrained by wind: application of an eolian sediment-transport model, Geol. Soc. Am. Bull., 97, 1270–1278, 1986. a, b
Bagnold, R. A.: The transport of sand by wind, Geogr. J., 89, 409–438, 1937. a
Bagnold, R. A.: The Physics of Blown Sand and Desert Dunes, Methuen, London, UK, 1941. a
Bellot, H., Naiim-Bouvet, F., Ito, Y., Deschatres, M., and Amory, C.: Characterization of sastrugi fields with TLS (Terrestrial laser scan) and simple digital photos, in: EGU General Assembly, 27 April–2 May 2014, Vienna, Austria, 12145, 2014. a
Blackford, J. R.: Sintering and microstructure of ice: a review, J. Phys. D, 40, R355–R385, https://doi.org/10.1088/0022-3727/40/21/R02, 2007. a
Brown, D.: Tracker: Video analysis and modeling tool, available at: https://physlets.org/tracker/, last access: 14 February 2018. a
Clifton, A., R uedi, J.-D., and Lehning, M.: Snow saltation threshold measurements in a drifting-snow wind tunnel, J. Glaciol., 52, 585–596, https://doi.org/10.3189/172756506781828430, 2006. a
Colbeck, S. C.: The layered character of snow, Rev. Geophys., 29, 81–96, 1991. a
Colbeck, S. C.: Sintering in a dry snow cover, J. Appl. Phys., 84, 4585–4589, https://doi.org/10.1063/1.368684, 1998. a
Corbett, J. and Su, W.: Accounting for the effects of sastrugi in the CERES clear-sky Antarctic shortwave angular distribution models, Atmos. Meas. Tech., 8, 3163–3175, https://doi.org/10.5194/amt-8-3163-2015, 2015. a, b
Cornish, V.: On snow-waves and snow-drifts in Canada, with notes on the “snow-mushrooms” of the Selkirk Mountains, Geogr. J., 85, 342–365, https://doi.org/10.2307/1774538, 1902. a, b, c
Doumani, G. A.: Surface structures in snow, in: International Conference on Low Temperature Science: Physics of Snow and Ice, 1119–1136, Hokkaido University, Hokkaido, Japan, 1967. a, b, c, d, e
Elbelrhiti, H., Claudin, P., and Andreotti, B.: Field evidence for surface-wave-induced instability of sand dunes, Nature, 437, 720–723, https://doi.org/10.1038/nature04058, 2005. a, b
Filhol, S. and Sturm, M.: Snow bedforms: A review, new data, and a formation model, J. Geophys. Res.-Earth, 120, 1645–1669, https://doi.org/10.1002/2015JF003529, 2015. a, b, c, d, e, f, g, h, i, j
Filhol, S., Pirk, N., Schuler, T., and Burkhart, J. F.: The evolution of a snow dune field, in: American Geophysical Union, Fall Meeting, 11–15 December 2017, New Orleans, LA, USA, C51E–01, 2017. a, b
Goodwin, I. D.: Snow accumulation and surface topography in the katabatic zone of Eastern Wilkes Land, Antarctica, Antarct. Sci., 2, 235–242, https://doi.org/10.1017/S0954102090000323, 1986. a
Harder, S., Warren, G., and Charlson, R. J.: Sulfate in air and snow at the South Pole: Implications for transport and deposition at sites with low snow accumulation, J. Geophys. Res., 105, 22825–22832, https://doi.org/10.1029/2000JD900351, 2000. a
Hunter, J. D.: Matplotlib: A 2D graphics environment, Comput. Sci. Eng., 9, 90–95, 2007. a
Inoue, J.: Surface drag over the snow surface of the Antarctic Plateau 1. Factors controlling surface drag over the katabatic wind region, J. Geophys. Res., 94, 2207–2217, https://doi.org/10.1017/CBO9781107415324.004, 1989a. a
Inoue, J.: Surface drag over the snow surface of the Antarctic Plateau 2. Seasonal change of surface drag in the katabatic wind region, J. Geophys. Res., 94, 2219–2224, https://doi.org/10.1017/CBO9781107415324.004, 1989b. a
Jackson, B. S. and Carroll, J. J.: Aerodynamic roughness as a function of wind direction over asymmetric surface elements, Bound.-Lay. Meteorol., 14, 323–330, 1978. a
Kobayashi, S.: Studies on interaction between wind and dry snow surface, Contributions from the Institute of Low Temperature Science, A29, 1–64, 1980. a, b, c, d, e
Kochanski, K.: The movement of snow bedforms in the Colorado Front Range, https://doi.org/10.5446/38612, available at: https://av.tib.eu/media/38612 (last access: 13 April 2019), 2018a. a, b
Kochanski, K.: Time-lapse observations of snow bedforms in the Colorado Front Range, 2016–2017 [Data set], https://doi.org/10.5281/zenodo.1253725, 2018b. a, b, c
Kochanski, K.: Time-lapses of snow bedforms in the Colorado Front Range, available at: http://www.kochanski.org/kelly/snow-bedforms-in-the-colorado-front-range/ (last access: 13 April 2019), 2018c. a
Kochanski, K., Tucker, G., and Anderson, R. S.: Statistical classification of self-organized snow surfaces, Geophys. Res. Lett., 45, 6532–6541, https://doi.org/10.1029/2018GL077616, 2018. a, b, c, d, e, f
Kosugi, K., Nishimura, K., and Maeno, N.: Snow ripples and their contribution to the mass transport in drifting snow, Bound.-Lay. Meteorol., 59, 59–66, https://doi.org/10.1007/BF00120686, 1992. a
Langmuir, I. and Blodgett, K.: A mathematical investigation of water droplet trajectories, U.S. Army Air Force Technical Report 5418, Army Air Forces Headquarters, Air Technical Service Command, Washington, D.C., USA, 1946. a
Leonard, K. C.: Antarctic Snow Drift Processes, PhD thesis, Columbia University, ProQuest LLC, Ann Arbor, USA, 2009. a, b
Leroux, C. and Fily, M.: Modeling the effect of sastrugi on snow reflectance, J. Geophys. Res., 103, 25779–25788, https://doi.org/10.1029/98JE00558, 1998. a, b
Li, L. and Pomeroy, J. W.: Estimates of threshold wind speeds for snow transport using meteorological data, J. Appl. Meteorol., 36, 205–213, https://doi.org/10.1175/1520-0450(1997)036<0205:EOTWSF>2.0.CO;2, 1997. a
Liston, G. E., Polashenski, C. M., Rosel, A., Itkin, P., King, J., Merkouriadi, I., and Haapala, J.: A Distributed Snow-Evolution Model for Sea-Ice Applications (SnowModel), J. Geophys. Res.-Oceans, 123, 3786–3810, https://doi.org/10.1002/2017JC013706, 2018. a
Losleben, M.: Precipitation data for Saddle chart recorder from 1981-7-31 to ongoing, daily, available at: http://niwot.colorado.edu (last access: 13 April 2019), 2018a. a, b
Losleben, M.: Climate data for Saddle data loggers (CR23X and CR1000) from 2000-6-24 to ongoing, daily, available at: http://niwot.colorado.edu (last access: 13 April 2019), 2018b. a, b
Mather, K. B.: Further observations on sastrugi, snow dunes and the pattern of surface winds in Antarctica, Polar Rec., 11, 158–171, https://doi.org/10.1017/S0032247400052888, 1962. a
May, K. and Clifford, R.: The impaction of aerosol particles on cylinders, spheres, ribbons and discs, Ann. Occup. Hyg., 10, 83–95, https://doi.org/10.1093/annhyg/10.2.83, 1967. a
Naiim-Bouvet, F., Picard, G., Hervé, B., Arnaud, L., and Vionnet, V.: Sastrugi geometrical properties and morphometry over two winter seasons at col du Lac Blanc (French Alps, 2700 m a.s.l), in: 19th EGU General Assembly, 23–28 April 2018, Vienna, Austria, 13225, 2017. a
Oliphant, T. E.: Guide to NumPy, CreateSpace Independent Publishing Platform, Trelgol Publishing, USA, 2007. a
Petrich, C., Eicken, H., Polashenski, C. M., Sturm, M., Harbeck, J. P., Perovich, D. K., and Finnegan, D. C.: Snow dunes: a controlling factor of melt pond distribution on Arctic sea ice, J. Geophys. Res.-Oceans, 117, C09029, https://doi.org/10.1029/2012JC008192, 2012. a, b, c
Vermeesch, P. and Drake, N.: Remotely sensed dune celerity and sand flux measurements of the world's fastest barchans, Geophys. Res. Lett., 35, L24404, https://doi.org/10.1029/2008GL035921, 2017. a, b
Warren, S. G., Brandt, R. E., and O'Rawe Hinton, P.: Effect of surface roughness on bidirectional reflectance of Antarctic snow, J. Geophys. Res., 103, 25789, https://doi.org/10.1029/98JE01898, 1998. a