the Creative Commons Attribution 4.0 License.
the Creative Commons Attribution 4.0 License.
 | 13 Dec 2018
Glacial and geomorphic effects of a supraglacial lake drainage and outburst event, Everest region, Nepal Himalaya
C. Scott Watson
Fanny Brun
Etienne Berthier
Michel Esteves
Duncan J. Quincey
Katie E. Miles
Bryn Hubbard
Patrick Wagnon
A set of supraglacial ponds filled rapidly between April and July 2017 on Changri Shar Glacier in the Everest region of Nepal, coalescing into a ∼180 000 m2 lake before sudden and complete drainage through Changri Shar and Khumbu glaciers (15–17 July). We use PlanetScope and Pléiades satellite orthoimagery to document the system's evolution over its very short filling period and to assess the glacial and proglacial effects of the outburst flood. We also use high-resolution stereo digital elevation models (DEMs) to complete a detailed analysis of the event's glacial and geomorphic effects. Finally, we use discharge records at a stream gauge 4 km downstream to refine our interpretation of the chronology and magnitude of the outburst. We infer largely subsurface drainage through both of the glaciers located on its flow path, and efficient drainage through the lower portion of Khumbu Glacier. The drainage and subsequent outburst of m3 of impounded water had a clear geomorphic impact on glacial and proglacial topography, including deep incision and landsliding along the Changri Nup proglacial stream, the collapse of shallow englacial conduits near the Khumbu terminus and extensive, enhanced bank erosion at least as far as 11 km downstream below Khumbu Glacier. These sudden changes destroyed major trails in three locations, demonstrating the potential hazard that short-lived, relatively small glacial lakes pose.
- Article
(24674 KB) - Full-text XML
-
Supplement
(678 KB) - BibTeX
- EndNote


Outburst floods occur due to the sudden release of water from glaciers. This water can be stored within topographic lows at the glacier surface (Benn et al., 2012; Chu, 2014); internally along englacial conduits, crevasses, and voids (Fountain and Walder, 1998); or at the glacier's bed (Jansson et al., 2003). Water can also be impounded by the glacier or its moraines to form ice-marginal or proglacial lakes. Outburst floods from such lakes can lead to catastrophic geomorphic change and subsequent societal impacts reaching far downstream, and have been a topic of focused study in High Mountain Asia (Benn et al., 2012; Narama et al., 2018; Nie et al., 2018; Rounce et al., 2016; Veh et al., 2018; Westoby et al., 2014) and globally (Carrivick and Tweed, 2016; Cook et al., 2016; Harrison et al., 2018). Outburst floods from water within the glacier system are generally smaller in magnitude, but they can occur repeatedly due to seasonal and interannual variations in storage within a glacier's hydrological system, whether water is impounded supraglacially (Miles et al., 2017a; Narama et al., 2017; Watson et al., 2017), englacially (Benn et al., 2017; Rounce et al., 2017), subglacially (Garambois et al., 2016; Wadham et al., 2001; Walder and Driedger, 1995), or adjacent to ice margins (Huss et al., 2007; Steiner et al., 2018). These storage components are interlinked: water retained at the surface can reach englacial and subglacial systems through hydrofracture or exploitation of zones of permeability (Gulley et al., 2009b), while water impounded within or beneath the glacier can drain surficially if subglacial water pressures rise sufficiently (Roberts et al., 2002). All of these can also drain into ice-marginal water bodies.
Despite their smaller magnitude, glacier outburst floods that emanate from supraglacial and englacial sources can be severely damaging to infrastructure, yet they have not received focused study in the Himalaya (Richardson and Quincey, 2009; Rounce et al., 2017). The low density of hydrologic gauging stations limits hydrograph observation, while aerial and satellite observations of supraglacial water storage are hampered by the South Asian Monsoon, obscuring the glacier surfaces with clouds when supraglacial ponding is most prevalent (Miles et al., 2017a; Watson et al., 2016). Nonetheless, recent observations have indicated that these smaller floods can occur with regularity and have the potential to be hazardous (Narama et al., 2018; Rounce et al., 2017).
Changri Shar Glacier is a valley glacier in the Everest region of Nepal (Fig. 1). The glacier is characterised by a 4.0 km2 debris-covered tongue extending from an elevation of ∼5500 m a.s.l. to its terminus at ∼5070 m a.s.l. The thick surface debris of the glacier tongue greatly retards surface ablation and leads to hummocky surface topography. Changri Shar and the neighbouring Changri Nup Glacier (Sherpa et al., 2017; Vincent et al., 2016) discharge water into a proglacial gorge, which funnels water into the true-right side of Khumbu Glacier. The stream has cut into the lateral margin of Khumbu Glacier, leading to development of a large bare ice cliff. From this position, water initially flows into a low, wide passage along the ice-bed interface (Doug Benn, personal communication, 23 August 2018). Changri Shar, Khumbu, and other debris-covered glaciers in the area are generally responding to local climate warming through surface lowering and stagnation, rather than recession (King et al., 2017; Rowan et al., 2015). These factors combine to create very low surface gradients for the lower ablation area and increase the likelihood of formation of large proglacial or supraglacial lakes in this zone (King et al., 2018; Miles et al., 2017a; Quincey et al., 2007).

Figure 1The study area and interpreted flow path through Changri Shar and Khumbu glaciers (a). The expansion and drainage of the Changri Shar supraglacial lake in 2017, denoting maximum observed lake area with an outline (b–i). The debris-covered glacier area was delineated manually with respect to the March Pléiades imagery and modified from the RGI 6.0 (Pfeffer et al., 2014). The background hillshade is derived from the High Mountain Asia DEM mosaic (Shean, 2017).
In the pre-monsoon period of 2017, a large supraglacial lake developed over a period of 3 months on the Changri Shar Glacier and drained suddenly within a short window in the monsoon. Here, we combine PlanetScope, RapidEye, and Pléiades optical satellite imagery with field observations and a discharge record to document the expansion and drainage of this supraglacial lake system and to describe its impacts on Khumbu Glacier, through which the flood travelled. Finally, we highlight the impact of the flood on the downstream river system by quantifying rates of bank erosion and channel migration.
2.1 Supraglacial lake area
To document the supraglacial lake expansion, we analysed 25 Level 3B tiles collected by the PlanetScope Dove satellite constellation between 27 March and 26 October 2017 (Table S1 in the Supplement). These 4-band data have a ground sampling distance of 3.7 m but are resampled to 3 m during orthorectification, and digital numbers (DNs) contain scaled at-sensor radiance values for the blue (B: 455–515 nm), green (G: 500–590 nm), red (R: 590–670 nm), and near-infrared (NIR: 780–860 nm) spectral ranges. We also used several RapidEye level 3B tiles for pond coverages and geomorphic interpretations. These are 5-band data (B: 440–510 nm; G: 520–590 nm; R: 630–685 nm; red edge: 690–730 nm; NIR: 760–850 nm) with a ground sampling distance of 6.5 m, resampled to 5 m during orthorectification (Planet Team, 2017). Due to the high density of clouds during the monsoon, few scenes are cloud-free over the whole study area. We therefore masked clouds and cloud shadows manually in the region of the supraglacial lake before mapping ponded water (Fig. 1b–i). For each scene, we calculated the Normalised Difference Water Index (NDWI) based on DNs for the G and NIR bands (McFeeters, 1996) and used an Otsu adaptive histogram-based approach to select an optimised NDWI threshold (Cooley et al., 2017; Otsu, 1979), identifying ponded water as those pixels exceeding this threshold. Finally, the pond cover products were again inspected manually to remove terrain and cloud shadows before determination of multi-temporal lake area, and we used a ±1 pixel buffer for lake area uncertainty (Gardelle et al., 2011).
2.2 DEM generation and surface elevation changes
We analysed two along-track Pléiades triplets (Berthier et al., 2014) with acquisition dates of 23 March and 14 December 2017, bounding the lake's filling and drainage. The two scenes had maximum base-to-height ratios of 0.55 and 0.32, respectively. Their panchromatic bands (480–830 nm, ground sampling distance of 0.7 m) were processed using the Ames Stereo Pipeline (Shean et al., 2016) to generate DEMs and orthoimages at 2 and 0.5 m resolution, respectively. The two Pléiades DEMs were 3-D-coregistered using off-glacier terrain (Berthier et al., 2007), then differenced to produce a map of surface elevation change (dH) spanning the 2017 monsoon period.
This geodetic difference encompassed the majority of the ablation season, so for the glaciers we focused on zones of enhanced surface lowering not solely attributable to ice cliffs and supraglacial ponds, which are known hotspots of melt for Himalayan debris covered glaciers (Sakai et al., 2002). Ice cliffs tend to have curvilinear forms, with their planimetric length much greater than their width (e.g. Brun et al., 2016; Kraaijenbrink et al., 2016). For our study area, we are able to neglect advection and emergence of these features due to glacier dynamics (Brun et al., 2018), as the lowest 5 km of Khumbu Glacier is stagnant (Rounce et al., 2018). Over a short interval, melt along the inclined cliff surface was thus expressed as a thin arc of surface lowering (Immerzeel et al., 2014), clearly identifiable in Fig. 2. We ignored these cliff areas and areas of elevation change within ponds. We thus identified 11 zones of prominent elevation change that were clearly associated with the lake drainage according to the PlanetScope and RapidEye imagery (Table 1, Fig. 2). Field visits in May 2017, October 2017, and May 2018 enabled direct observation of many of the most prominent zones of change.
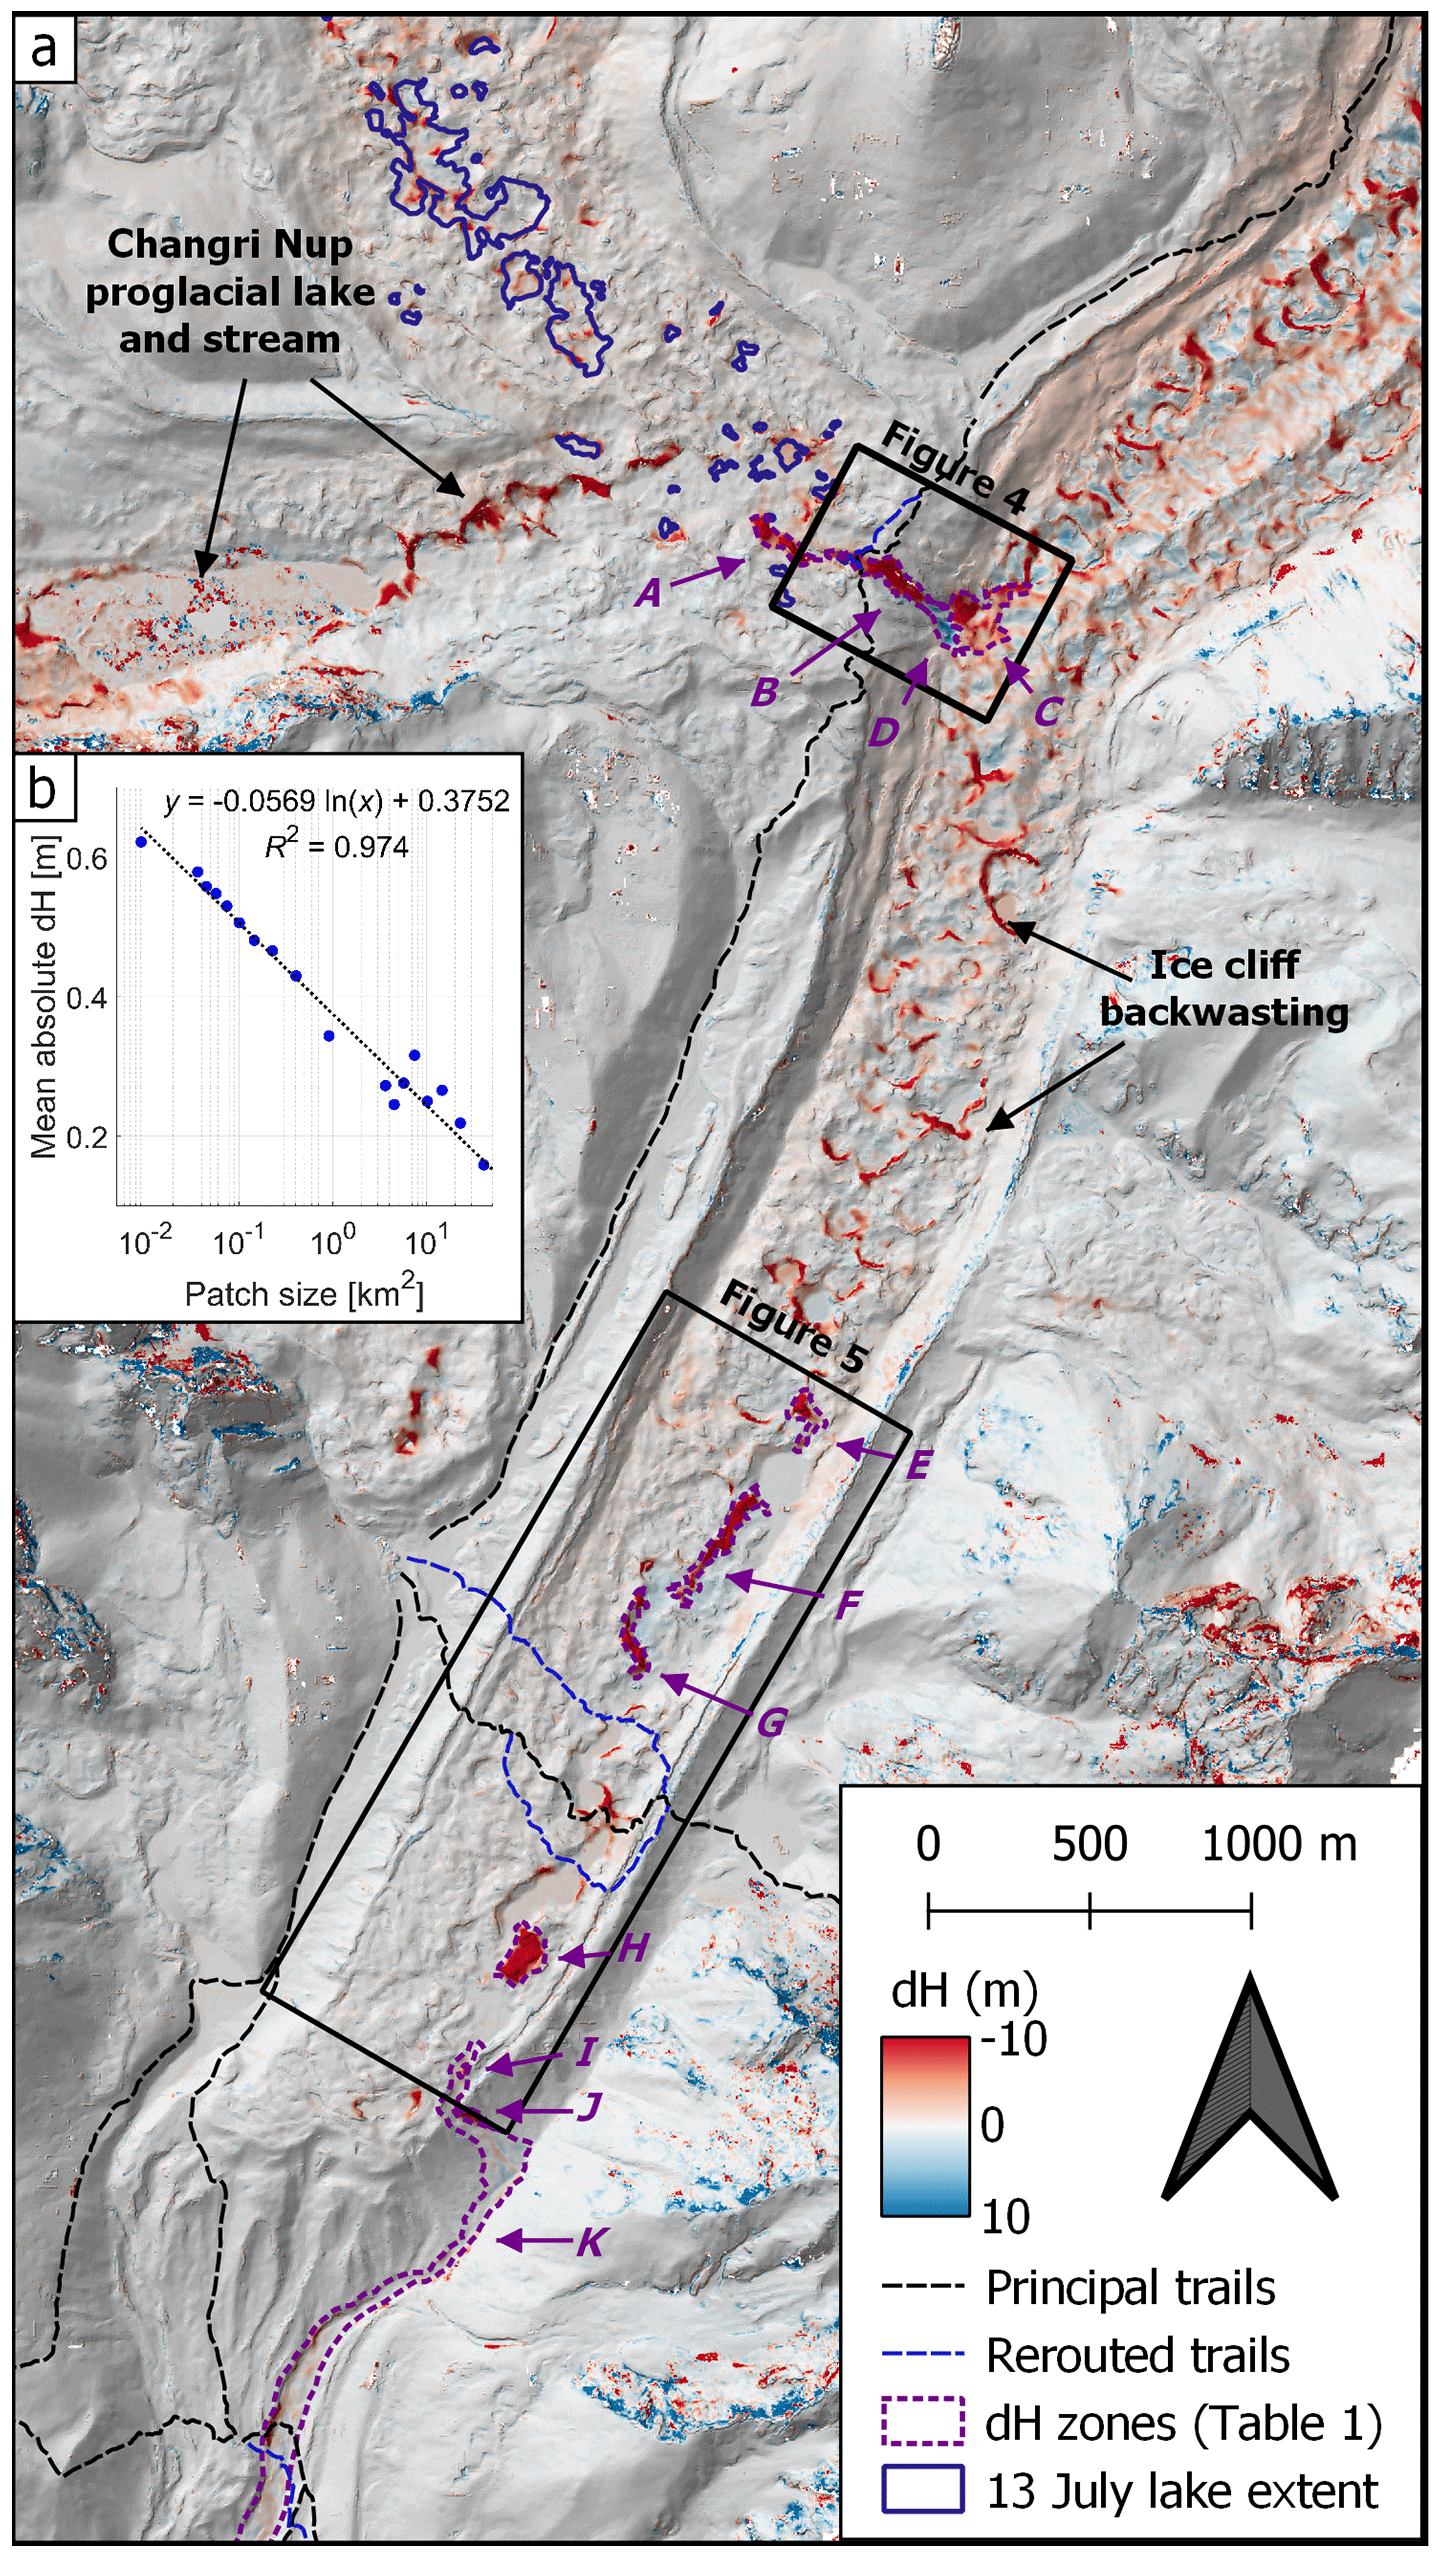
To assess the error on the elevation difference obtained by differencing of two Pléiades DEMs, we follow the tile method of Berthier et al. (2016) and split the stable terrain dH maps into n×n tiles, with n varying from 2 to 200. The corresponding individual tile area thus varies from 91.2 km2 (n=2) to 0.01 km2 (n=200). For each tile, we compute the absolute value of the median dH. We then calculate our dH error (σdH) as the average of these n2 absolute values, and σdH ranges from 0.12 m (n=2) to 0.64 m (n=200). In Fig. 2b, dH is plotted as a function of the individual tile area. The relationship is well represented by a logarithmic fit which we use as our error model. Consequently, for all our zones of change we estimate an error based on the zone area and only analyse elevation changes of magnitude greater than this error.
2.3 Lake volume estimation
Using the pre-lake March 2017 Pléiades DEM, we identified 142 closed surface depressions and determined depth–area–volume relationships for each by progressively filling them with an increment of 0.1 m depth (Watson et al., 2017). We then calculated stored water volumes in the supraglacial lake area for each PlanetScope scene by estimating the volume of each individual pond in the area of the supraglacial lake, then summed these to estimate the total ponded volume in the study area (Fig. 3). On 16 July the lake was partially obscured by clouds, so for this scene we instead estimated the water level and volume from a partial shoreline data set (Figs. S1 and S2 in the Supplement). This approach assumes negligible topographic changes in the proximity of the supraglacial lake during the study period, but many studies have noted the local ablation associated with supraglacial ponds (Benn et al., 2001; Miles et al., 2016; Röhl, 2008; Salerno et al., 2017). Thus, the resulting volume estimates carry considerable uncertainty (in this case calculated using the ±1 pixel areal uncertainties), but are nonetheless useful for providing minimum values of supraglacial water storage during this period.
Table 1Measured elevation changes associated with the lake drainage and outburst within key zones identified with the Pléiades stereo-imagery. CS and Kh denote Changri Shar and Khumbu glaciers, respectively. Zones are identified in Fig. 2. ΔV expresses the total volumetric change in each zone, and the full uncertainty based on σdH for the zone area. “V added” and “V removed” are based on the elevation changes exceeding σdH. is the mean change in elevation within the zone, with uncertainty σdH.
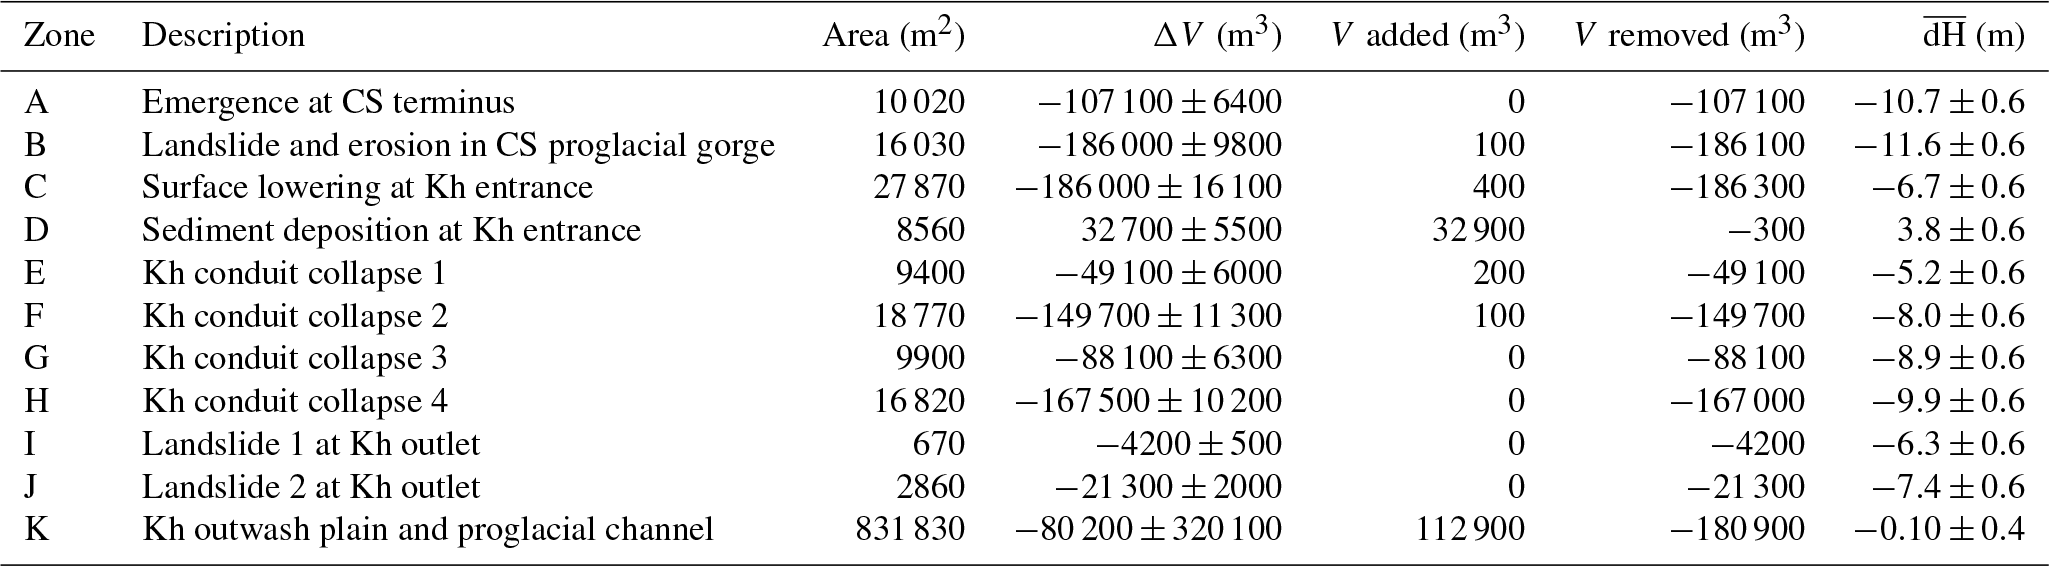
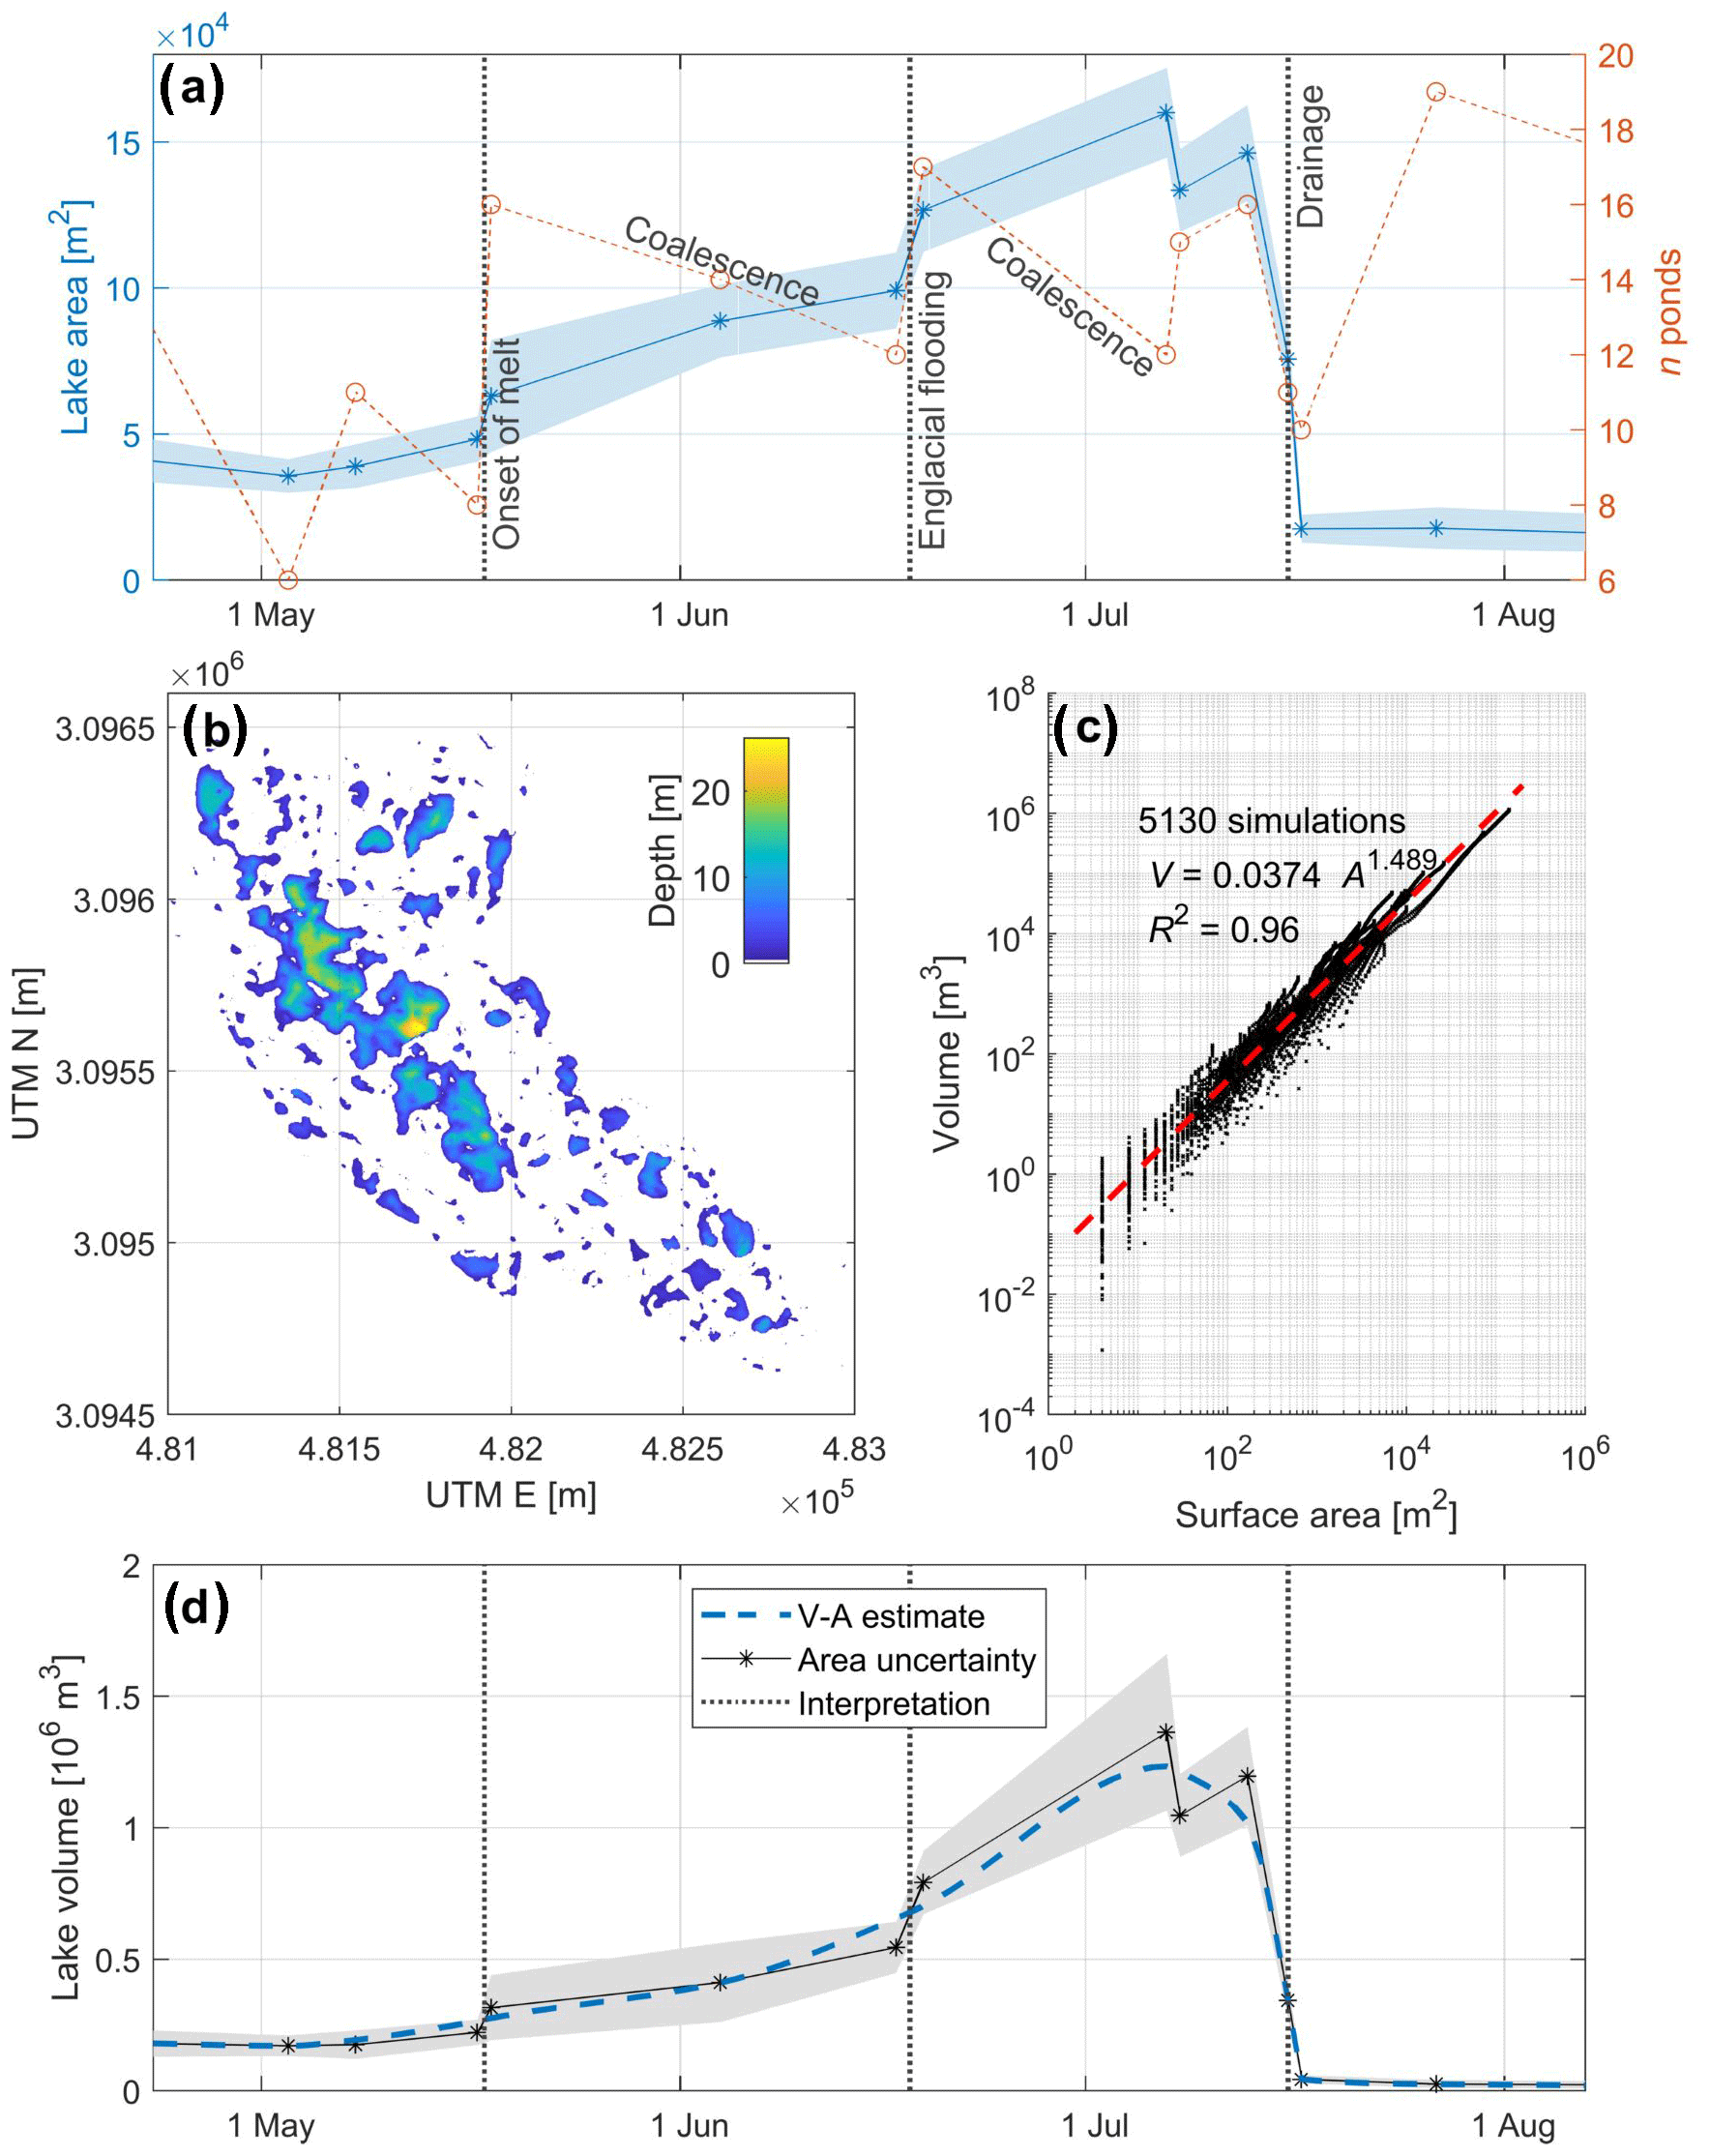
Figure 3Total lake area and number of individual water bodies during the supraglacial lake's expansion and drainage (within the area shown in Fig. 1b–i). Area uncertainty is represented by a ±1 pixel buffer (a). The depth of closed surface depressions on Changri Shar Glacier derived from the March 2017 Pléiades DEM (b) and their volume–area relationship (c). We used this relationship to reconstruct the lake system's volume prior to drainage (d).
2.4 Proglacial bank erosion and channel migration
We also measured areal changes associated with active channel migration and bank erosion along the Khumbu proglacial stream as far as Pheriche using RapidEye level 3B imagery from November 2012, 2015, 2016, and 2017. The images were coregistered in ENVI (RMSE <1 m), then we calculated changes in the NDWI and Normalised Difference Vegetation Index () for 2012–2015 and 2016–2017, enabling us to resolve periods preceding and spanning the 2017 Changri Shar outburst. Outburst floods from Imja Khola during 2015 and 2016 (Rounce et al., 2017) may have affected bank erosion and channel migration change over the period of analysis, but this tributary joins the Khumbu proglacial stream below Pheriche.
We considered the major NDVI changes (all decreases) to indicate bank erosion and reactivation, while marked spatial changes in NDWI indicated stream migration. We calculated a 3×3 focal mean to reduce noise, then eliminated low-magnitude changes in the indices based on a visual inspection of the histogram (thresholds in Table 2). We manually trimmed the results to zones within the channel, also eliminating areas severely affected by shadows. Finally, we aggregated areas of bank erosion and stream migration in 1 km bins along the main Khumbu River to compare rates of change preceding and bounding the event (Table 2).
2.5 Proglacial discharge
The study period coincided with automated water level measurements collected every 30 min in the proglacial stream near Pheriche village (Fig. 1). A rating curve has been developed for this position based on 34 field-calibrated fluorescein discharge measurements collected since November 2010 and was used to calculate discharge for the period of analysis. Based on the analyses of Di Baldassarre and Montanari (2009) and McMillan et al. (2012), we estimated a discharge uncertainty of 15 % for stage values within the calibrated range and 20 % for stage values above the maximum stage-discharge measurement. From this record, we estimate background discharge (hereafter, base flow) from 17:00 on 15 July to 09:00 on 17 July (all times given in Nepal Time, NPT; UTC + 05:45) using a half-hourly cubic spline interpolant fitted to measurements for 10–15 and 17–20 July (i.e. interpolating between preceding and subsequent 09:30 measurements to estimate discharge at 09:30 on 16 July) and determine the flood discharge as the difference between observed discharge and estimated base flow.
Prior to 2017, the area of the Changri Shar supraglacial lake was characterised by occasional ponds filling and draining, both seasonally and interannually. Surface depressions in the study area began to accumulate water in March 2017 (Fig. 3), likely due to the seasonal blockage of shallow subsurface englacial pathways (Benn et al., 2017; Irvine-Fynn et al., 2017; Miles et al., 2017b). The isolated ponds grew and coalesced rapidly to encompass an area of 160 000 ± 15 400 m2 during 7–13 July (26 % of the area inset in Fig. 1); based on our topographic analyses, we calculate a lake volume of m3 for this date. Drainage began by 16 July, when we calculate that the lake system's area and volume had reduced to 75 600 ± 11 100 m2 and m3 (estimated with limited shoreline data; see Supplement). The lake's area had stabilised by 17 July, leaving several isolated ponds containing 44 000 ± 15 000 m3, which changed little thereafter in 2017 (Fig. 1h–i).
Visual inspection of the Planet optical imagery and Pléiades DEMs reveals little change in the area immediately down-glacier of the lake following drainage. Near the terminus of Changri Shar, pronounced surface lowering was concentrated along the proglacial–supraglacial stream (Zone A; Fig. 2 and Table 1). When this stream left the glacier system, it destabilised the northern side of Changri Shar's proglacial gorge (Fig. 4), leading to a m3 landslide by 16 July (Zone B; Fig. 4). The erosion in this area forced re-establishment of a major trail between Lobuche and Gorak Shep settlements on the route to Everest Base Camp.
Figure 4Flood-related geomorphic evidence at the base of the Changri Shar proglacial gorge. Surface elevation changes and locations of selected field photos, with hillshade of March Pléiades DEM as background (a). Time series of satellite images documenting the blockage and incision of the stream inlet to Khumbu Glacier, with date and source specified in the text box (b–e). A photograph taken in May 2018 of a fresh landslide scarp near the top of the proglacial gorge, the likely source for much of the debris (f). A photograph of the deposit and incised channel, taken in October 2017 from the Khumbu Glacier surface (g). A photograph of the deposit and concentric crevassing taken from the Khumbu moraine in October 2017 (h). All photographs taken by the authors.
On 16 July, the Changri Shar proglacial stream entry point into Khumbu Glacier was buried by the water and debris slurry from the initial outburst flood and the Zone B landslide. Based on the area of the inundated zone (32 700 m2) and the March Pléiades DEM, we estimate a total volume of 2.56×10⁵ m3 impounded at the Khumbu entry on 16 July (Fig. 4). By 17 July, the Changri Shar stream had incised through the newly deposited debris, and large concentric crevasses had opened in Khumbu Glacier surrounding this point; field observations confirmed that these features were still apparent in 2018. This area experienced a mean surface lowering of 6 m for the March–November period, totalling a volume loss of 1.86×10⁵ m3 despite the significant debris deposition, of which at least 32 900 m3 remained in December (zones C and D in Table 1).
There is little evidence of flood-induced surface change on Khumbu Glacier until 2.8 km down-glacier from the stream entry point. Here, some 2.3 km upstream of the Khumbu terminus, large zones of pronounced surface lowering and supraglacial channel migration are apparent in the dH map and 16–17 July orthoimages (Fig. 5), and cannot be accounted for by pre-existing ice cliffs. We interpret these to be collapse features along the route of shallow englacial channels which were exploited by the floodwaters (zones E–H; Fig. 5). These zones of enhanced surface change continued to the Khumbu Glacier terminus and account for at least 4.53×10⁵ m3 of volume loss (Table 1). Field observations of the lower ablation area in April 2018 suggested that additional conduits collapsed and became exposed at the surface in this area through winter (>9 months after the event), beyond the observation period of the March–November DEM difference.
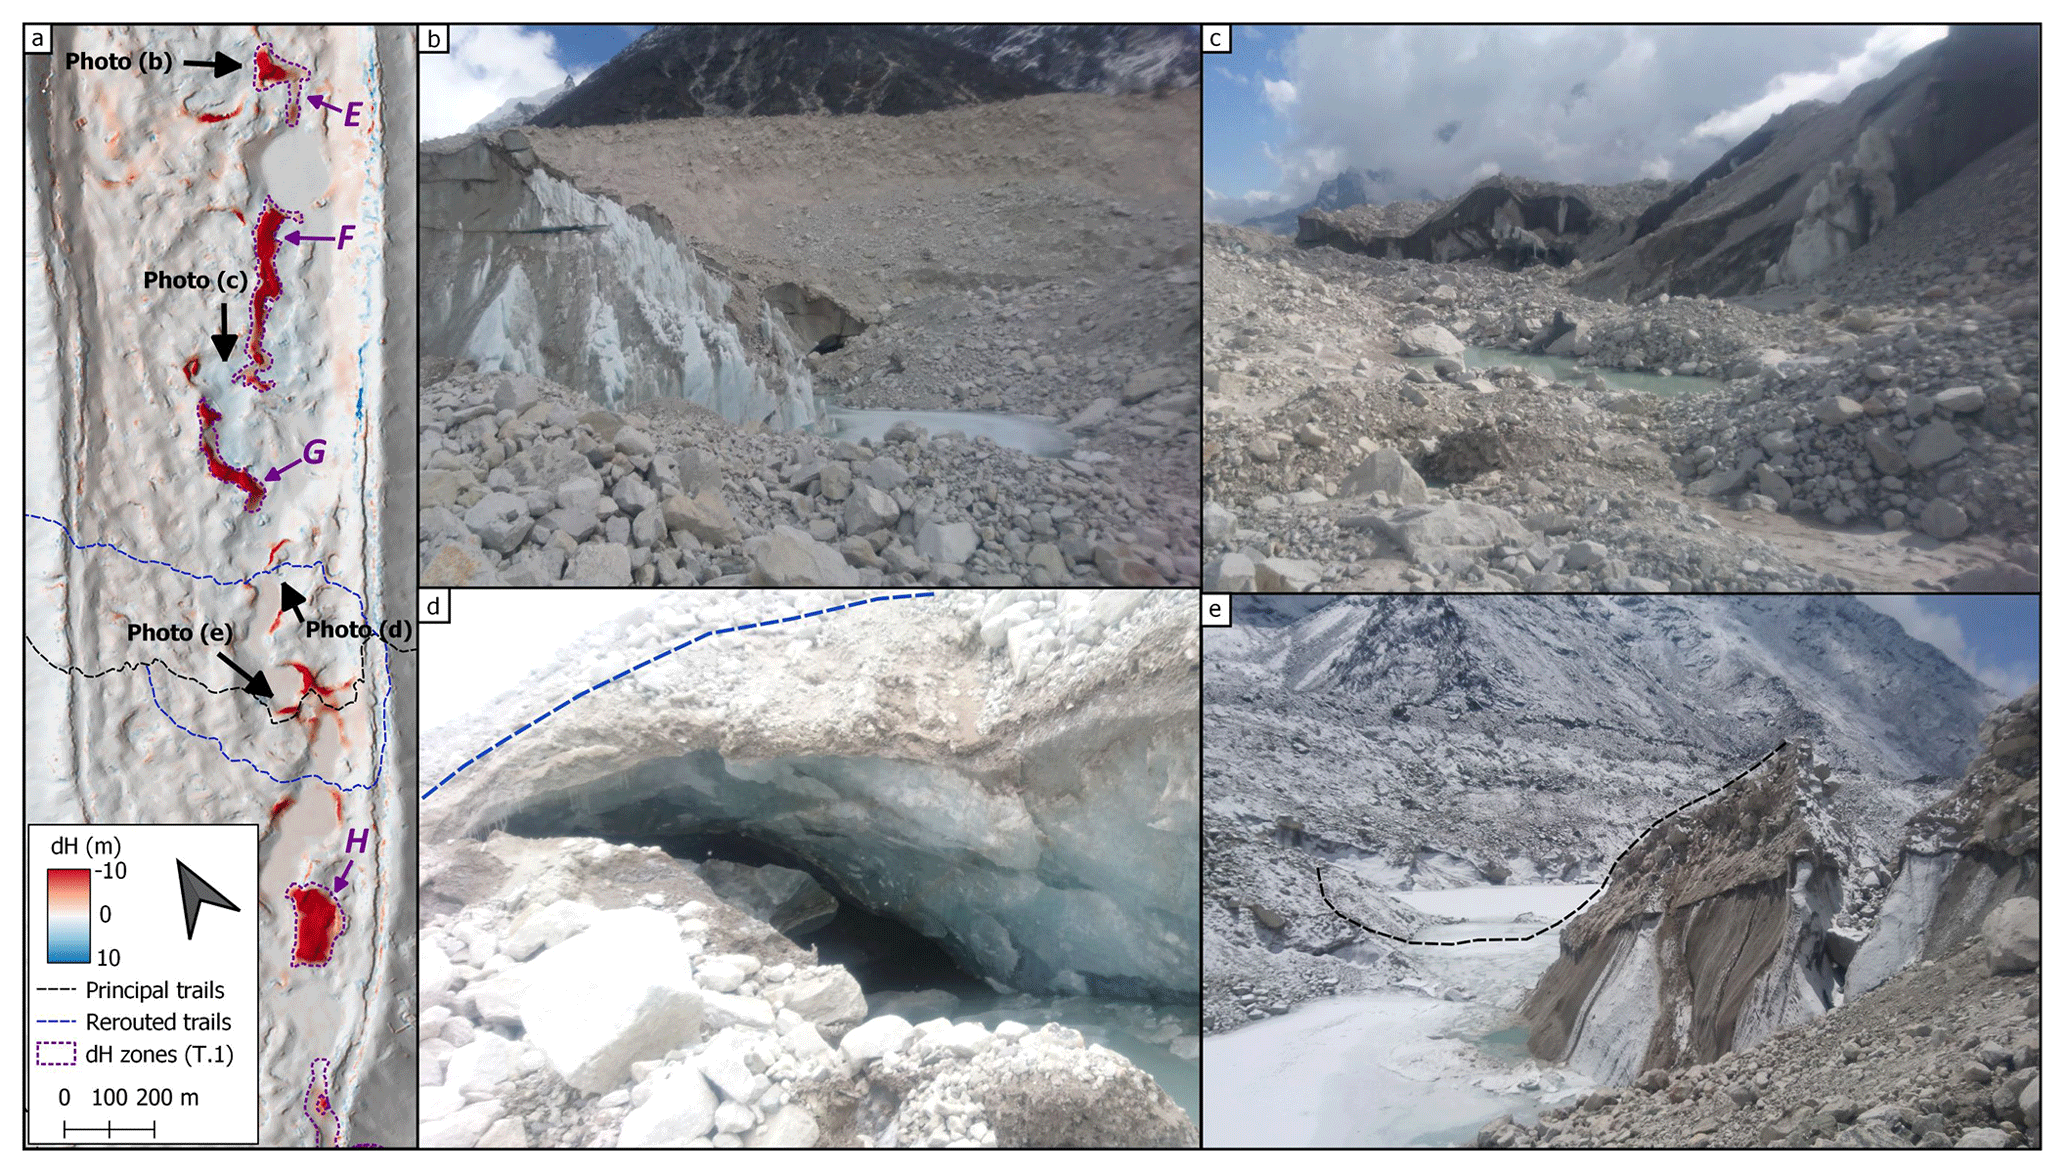
Figure 5Flood-related geomorphic evidence on Khumbu Glacier. Surface lowering, rerouting of the Kongma La trail, zones of analysis (Table 1), and positions of selected photos of enhanced change over the lowermost 3 km of Khumbu Glacier, with hillshade of March Pléiades DEM as background (a). The area of a conduit collapse (Zone E), with visible water flowing towards the exposed conduit entrance (b). A zone of fluvially reworked debris directly located down-glacier from the conduit collapse in Zone F, leading to exposed shallow conduits in the background (c). A cavernous englacial conduit exposure directly beneath the rerouted Kongma La trail (d). The route of the pre-event Kongma La trail, now cut off by a fresh conduit collapse (e, at right) and coalescing ponds. All photographs taken by the authors in May 2018.
Khumbu Glacier's proglacial stream also changed extensively during 2016–2017, including widespread stream migration and bank erosion (Fig. 6). During this period, the stream destabilised the moraine outlet, leading to small landslides (zones I and J; Fig. 6). Directly below the Khumbu outlet the proglacial stream overflowed its banks, leading to areas of considerable erosion and deposition (>3 m dH) across the outwash plain (Zone K; Fig. 6). Below the outwash plain, the proglacial channel showed patterns of active channel migration and bank erosion between 16 and 17 July at least as far as Pangboche, 11 km downstream (analysis further down-valley was inhibited by deep terrain shadows). The total area affected by channel migration (52 700 m2) for the 2016–2017 period is similar to total channel migration over 2012–2015 (Table 2), but the 2016–2017 period exhibits a much larger area of bank erosion (117 200 m2 compared to 6125 m2).
The proglacial river stage record near Pheriche documented seasonal and diurnal variations in discharge (Fig. 7). Discharge was <2 m3 s−1 prior to June 2017, then stabilised at ∼3 m3 s−1 until the beginning of July (Fig. 7b). Early July was characterised by greater variation in discharge, with daily peaks up to 10 m3 s−1 decreasing into the middle of July. On 15 July, the discharge record departed from this general decrease in peak daily flow, and discharge progressively increased to peak at 56±11 m3 s−1 at 12:30 on 16 July (Fig. 7a). Discharge decreased rapidly after 13:00 to a low value of 5.9 m3 s−1 at 17:30, then again increased to 12.4 m3 s−1 at 20:30. Measured discharge then decreased gradually to 2.9 m3 s−1 at 10:00 on 17 July and resumed a regular diurnal pattern with discharge varying between 3 and 7 m3 s−1. Based on our estimated base flow, we calculated a total flood discharge of m3 between 20:00 on 15 July and 10:00 on 17 July.
4.1 Interpretation
The dynamics of the lake system formation are relatively straightforward to interpret. A significant obstruction to the coupled supraglacial and englacial drainage system must have formed during winter 2016–2017, as occurs seasonally for other debris-covered glaciers (Benn et al., 2017; Miles et al., 2017b). This may have been the consequence of a significant conduit collapse or freeze-on of accumulated englacial debris, as has been observed through glaciospeleology (Gulley and Benn, 2007; Gulley et al., 2009b). However, the impediment to drainage appears to have been unusually effective in early 2017, preventing the development of preferential flow paths which would lead to increasingly efficient drainage. Thus, as winter snow in the ablation area melted due to the onset of pre-monsoon conditions, this water accumulated in a large surface depression that opened over recent years by heightened ablation along supraglacial ponds and ice cliffs. The accumulated water would have had a positive surface energy balance through the pre-monsoon, leading to peripheral ablation and further increasing the depression capacity and lake volume (Benn et al., 2001; Miles et al., 2016; Sakai et al., 2000).
The supraglacial ponds initially grew in isolation, then coalesced between 18 May and 17 June as the water levels rose (Fig. 3). By 19 June, new peripheral ponds began to fill, suggesting the flooding of englacial conduits up to 300 m away from the main water body. These secondary ponds mostly coalesced with the main surface water body before its eventual drainage. Based on the pond shorelines and Pléiades DEM, we estimate a steady water supply rate of 0.14 m3 s−1 for 17 June to 13 July.
The process of pond drainage is slightly less clear due to the lack of observations during 14–15 July. The available PlanetScope imagery indicates that the lake began to drain between 13 and 15 July, and was still underway on 16 July. Given the total duration of the flood at Pheriche (∼36 h) and the landslide deposit identified on 16 July, we expect that drainage began around midday on 15 July. Based on the lack of down-glacier surface change on Changri Shar, we infer that the lake drained englacially or subglacially, rather than along the surface. Hydrofracture is an unlikely scenario as the ice is nearly stagnant in this area; rather, this could have been accomplished by penetrating the internal blockage or establishing a new connection to relict conduits. In either case the water re-emerged at the surface ∼700 m away, just prior to the Changri Shar terminus.
Table 2Areal changes along the Khumbu proglacial stream preceding (2012–2015) and encompassing (2016–2017) the lake outburst. Channel migration refers to the change in wetted area determined by NDWI thresholding, and bank erosion corresponds to the removal of vegetation in the channel area, identified by large NDVI differences.
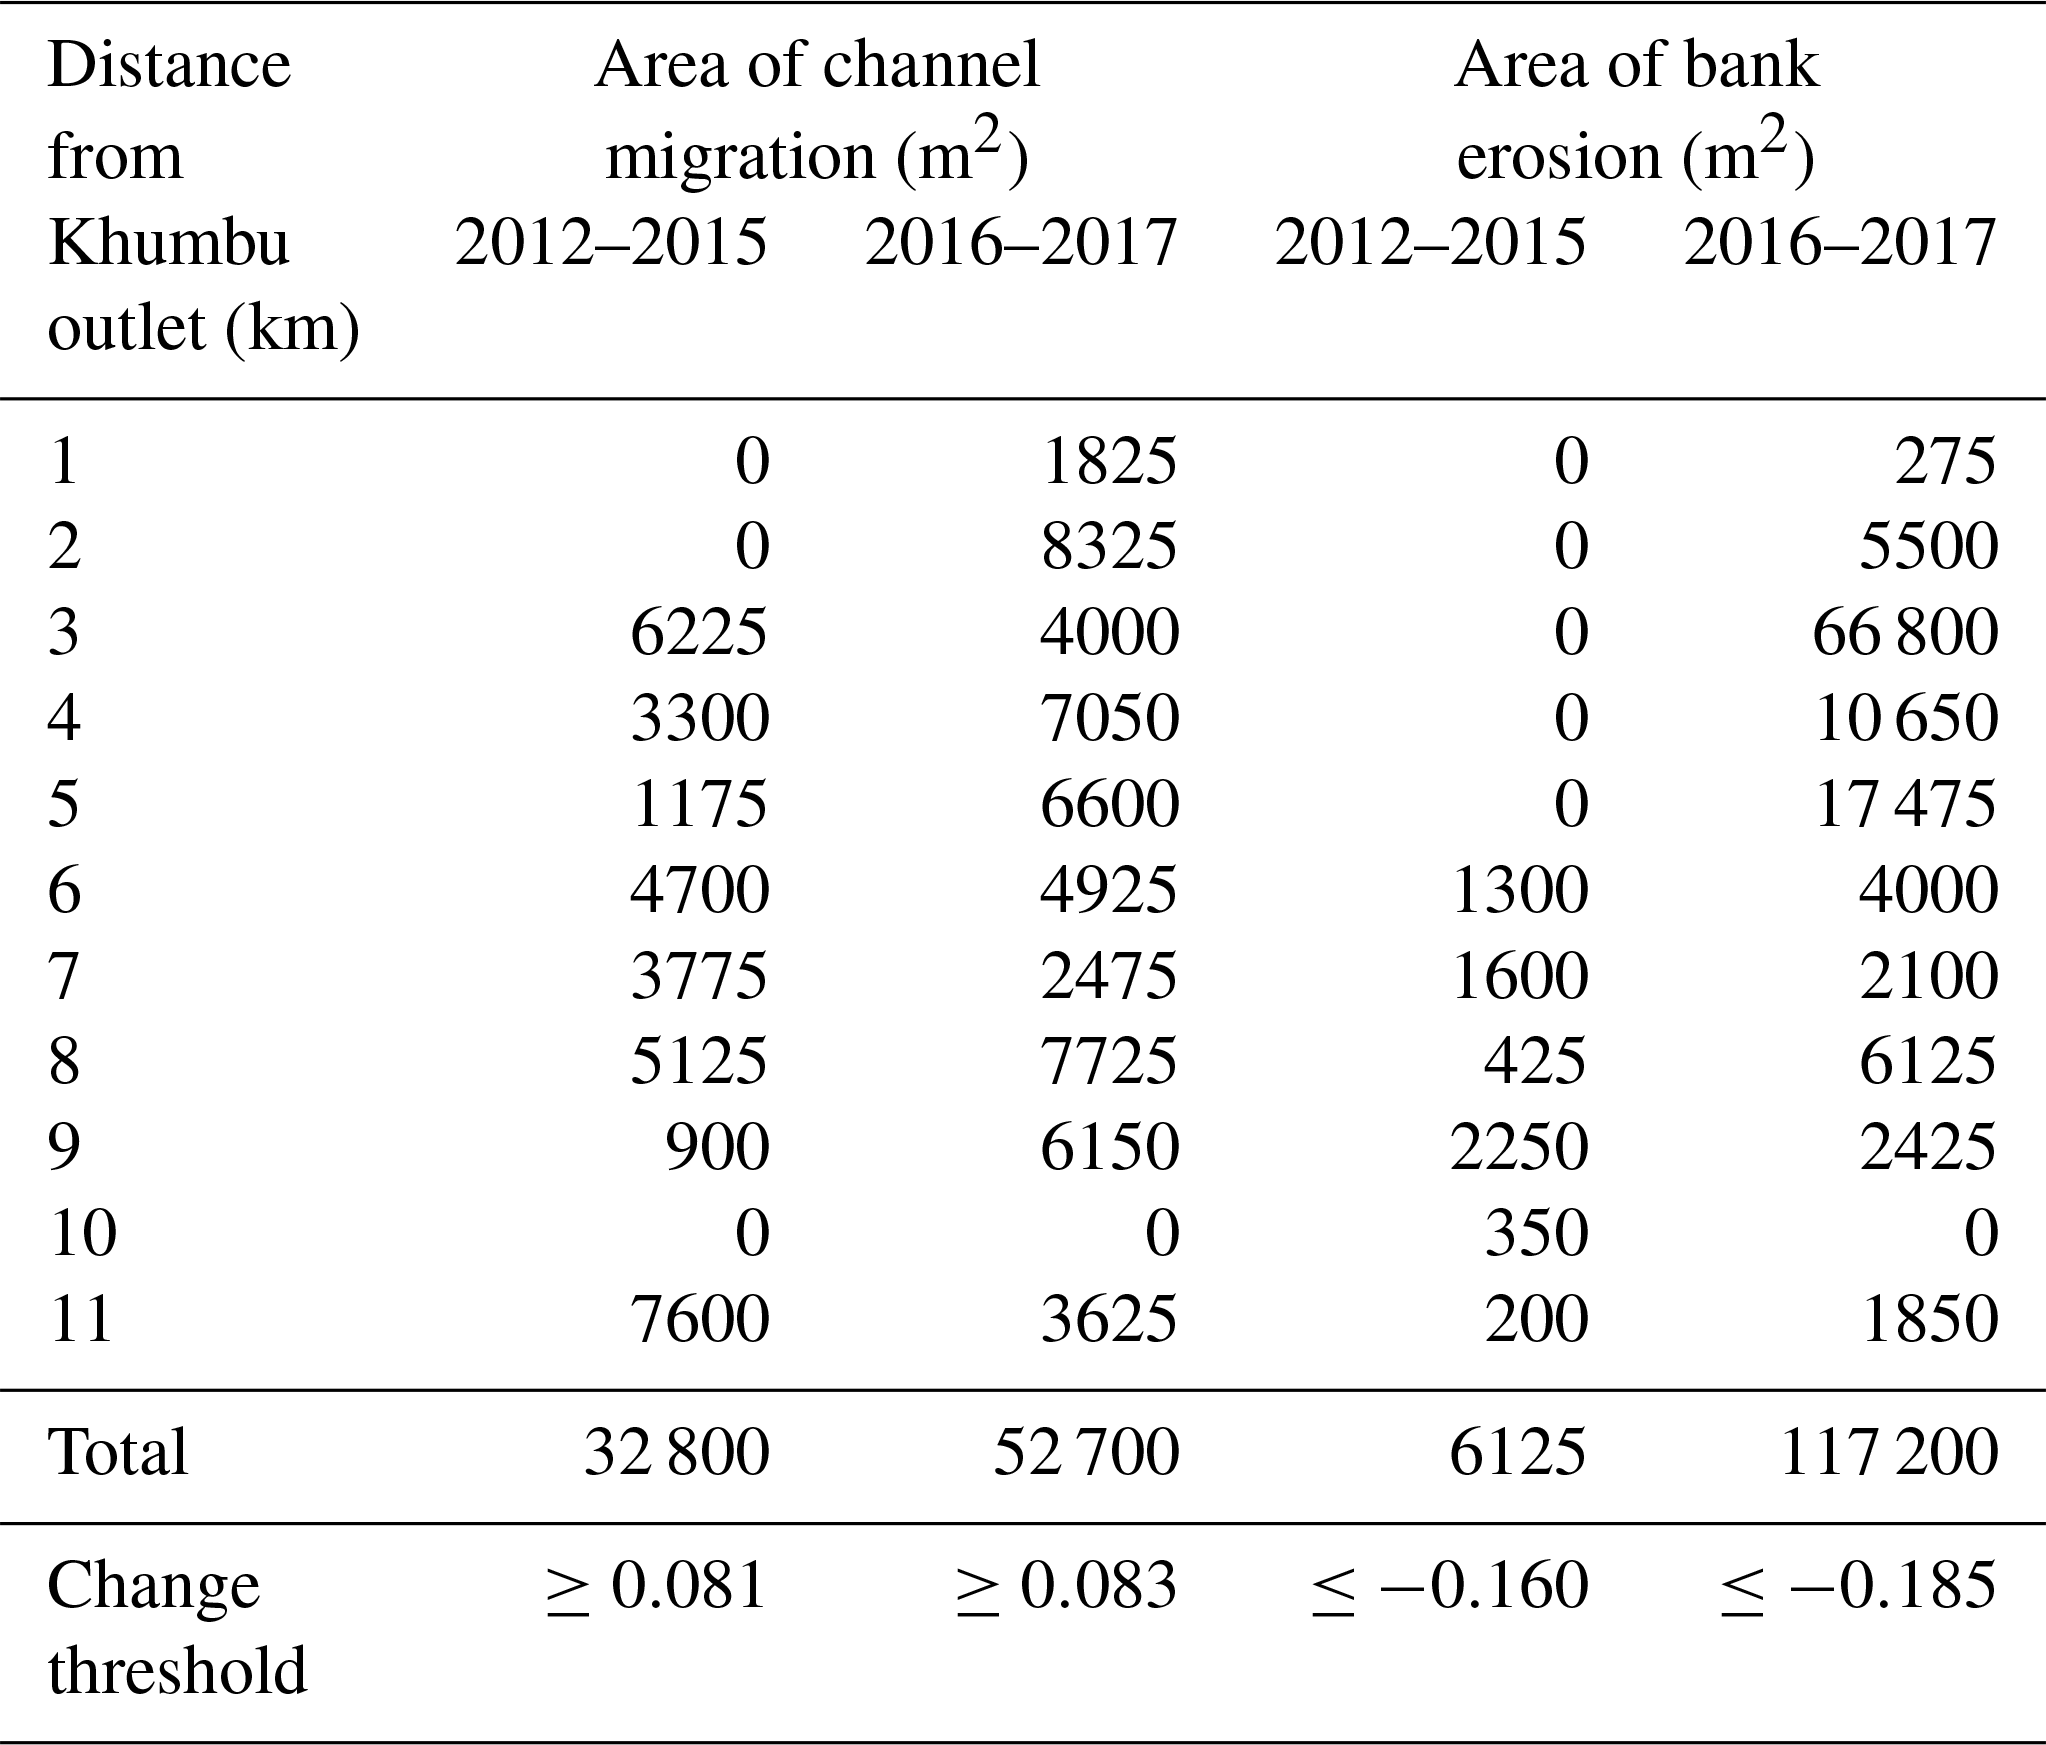
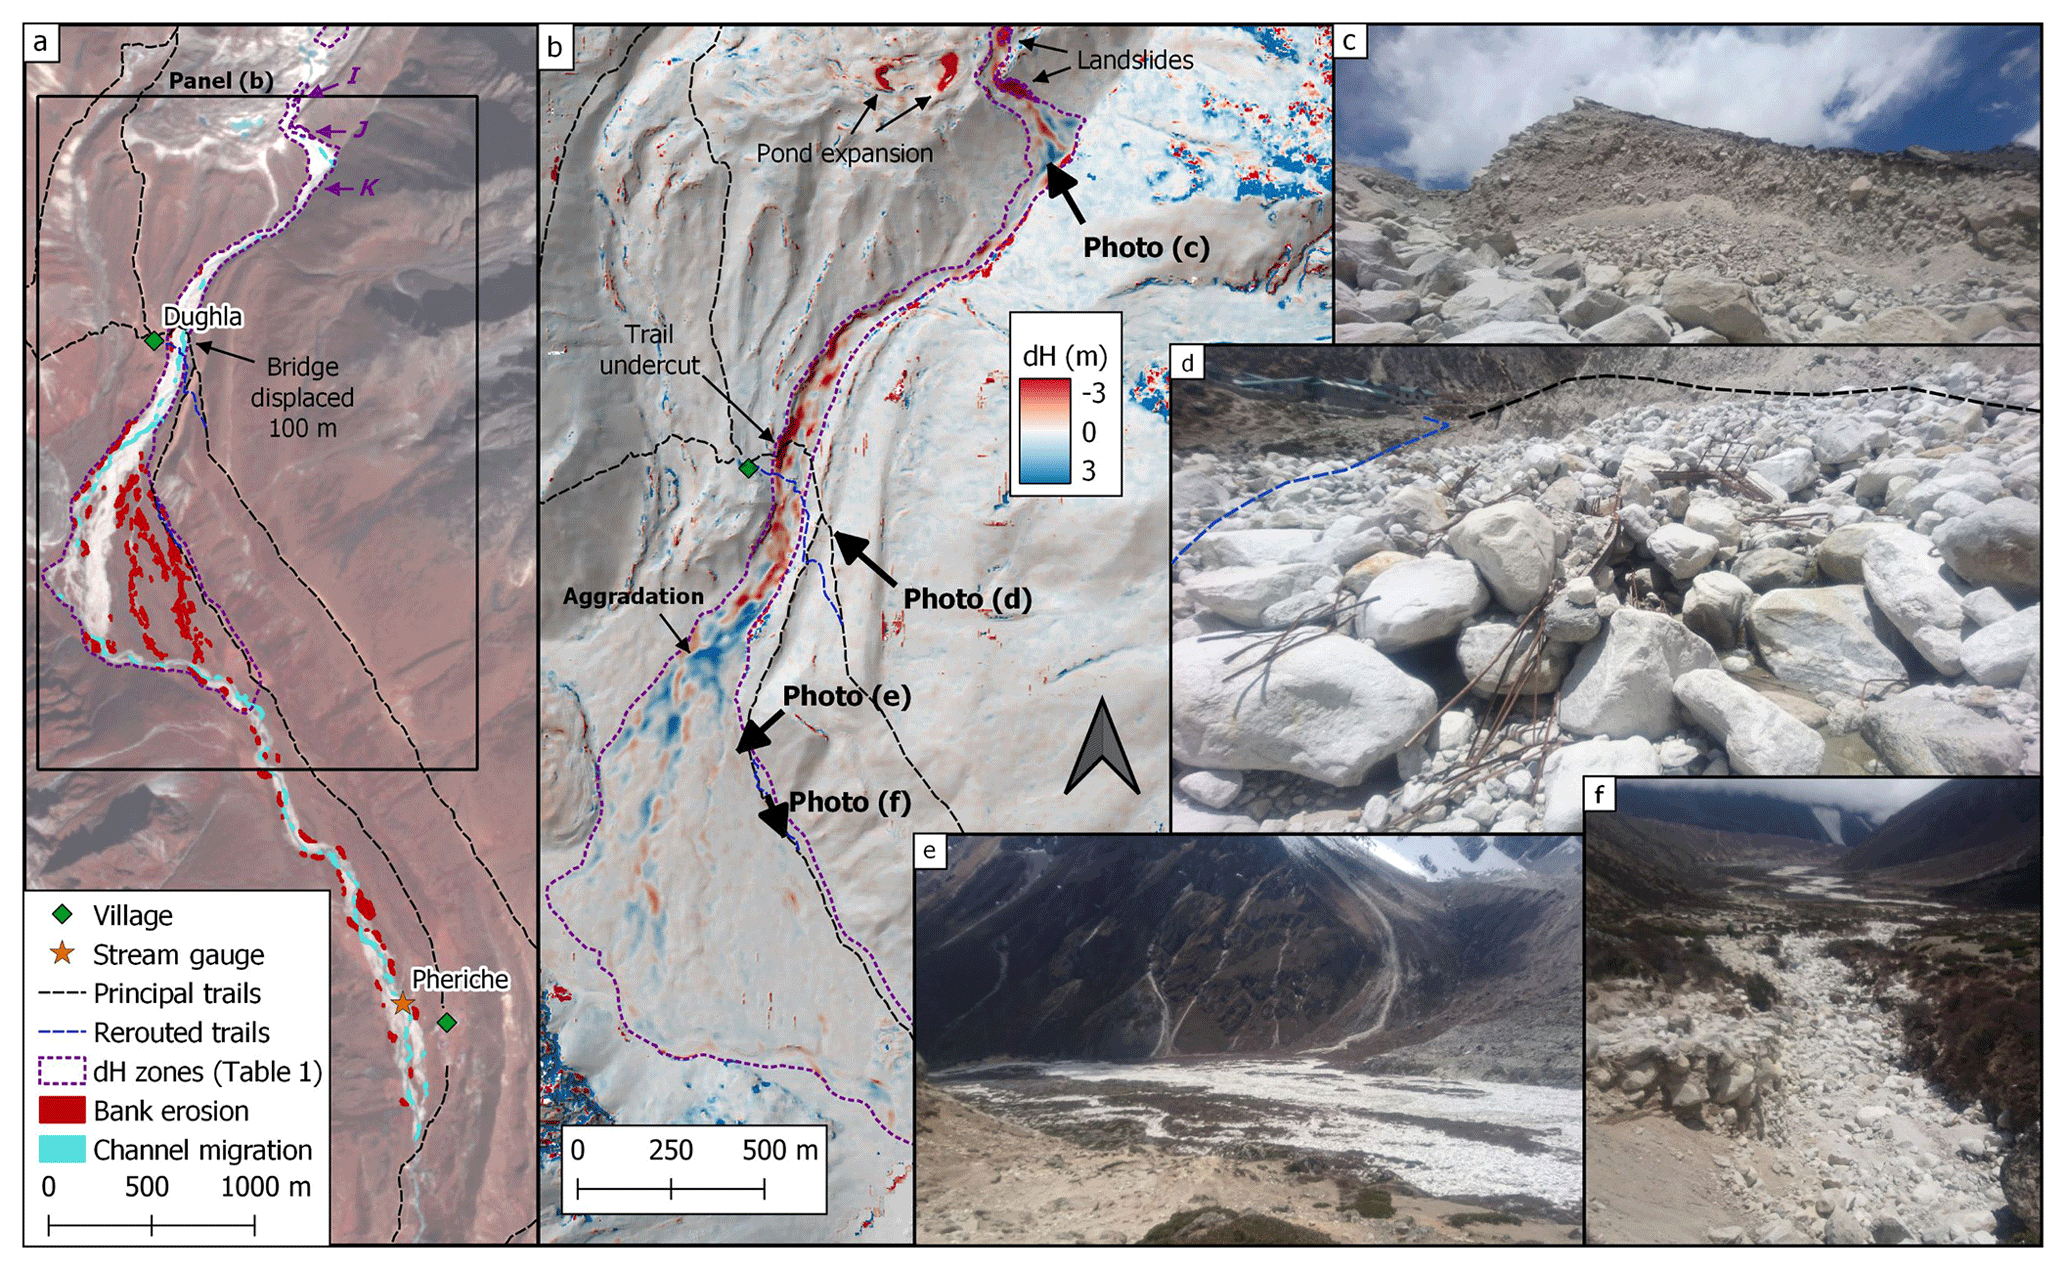
Figure 6Flood-related geomorphic evidence down-valley of Khumbu Glacier. Extensive changes in vegetation cover due to bank erosion and migration of the stream channel 4 km downstream to Pheriche (a). Surface lowering associated with fluvial erosion and aggradation in the Khumbu proglacial system, and locations of selected photos (b). A fresh landslide scarp (Zone J) directly below the Khumbu outlet (c). Remnants of a pedestrian bridge destroyed, carried 100 m downstream, and buried by the outburst, also indicating the route of the trail before and after the outburst, with Dughla in the background (d). The Khumbu outwash plain in May 2018, showing widespread fluvially reworked debris (e). A secondary channel used by the outburst flood, leading to >1 m incision (f). Background in (a) is a RapidEye false-colour composite from November 2016 and in (b) is the hillshade derived from the March 2017 Pleiades DEM.
The textureless appearance of the flooded entrance to Khumbu Glacier imaged on 16 July (Fig. 4c) suggests that the water had only recently reached this position. This assessment is supported by the rapid subsequent drainage of the flooded water and incision of the debris deposit, which had occurred by 17 July. As this subsurface conduit would have closed at least partially since the prior monsoon, the sudden input of water and debris likely overwhelmed the conduit's capacity. Using an empirical relation for peak tunnel discharge (Walder and Costa, 1996), we estimate a peak discharge of 59 m3 s−1. Some water may have been retained in both glaciers' drainage network, and the flood at Pheriche is likely to have incorporated additional meltwater and debris along its glacial and proglacial flowpath, but this discharge estimate is very close to the maximum discharge of 56±11 m3 s−1 measured by the Pheriche gauge.
As with Changri Shar, the lack of surface change on Khumbu Glacier suggests a subsurface flow path for much of the glacier's length. However, the floodwaters appear to have reached the glacier surface 2.3 km from the terminus, where several segments of conduit collapse are evident. We interpret this as due, at least in part, to the elevated hydrological base level of Khumbu Glacier (Gulley et al., 2009a), the terminus area of which has experienced extensive ponding in recent years (Watson et al., 2016).
There is a notable contrast in the magnitudes of proglacial stream migration and bank erosion between the 2012–2015 and 2016–2017 periods (Table 2). During the 2012–2015 period, channel migration was a continuous background process that predominantly remained within the stream banks. This period encompassed the Gorkha earthquake (Kargel et al., 2016), which would have increased debris supply and stream migration. The 2016–2017 NDWI and NDVI changes show a greater magnitude of channel migration than 2012–2015, despite the shorter time interval. The area of bank erosion is also greatly enhanced during 2016–2017. The magnitude of geomorphic change associated with the flood appears to be uncommon, since we were unable to find similar areas of bank erosion in any of the historic satellite image archives.
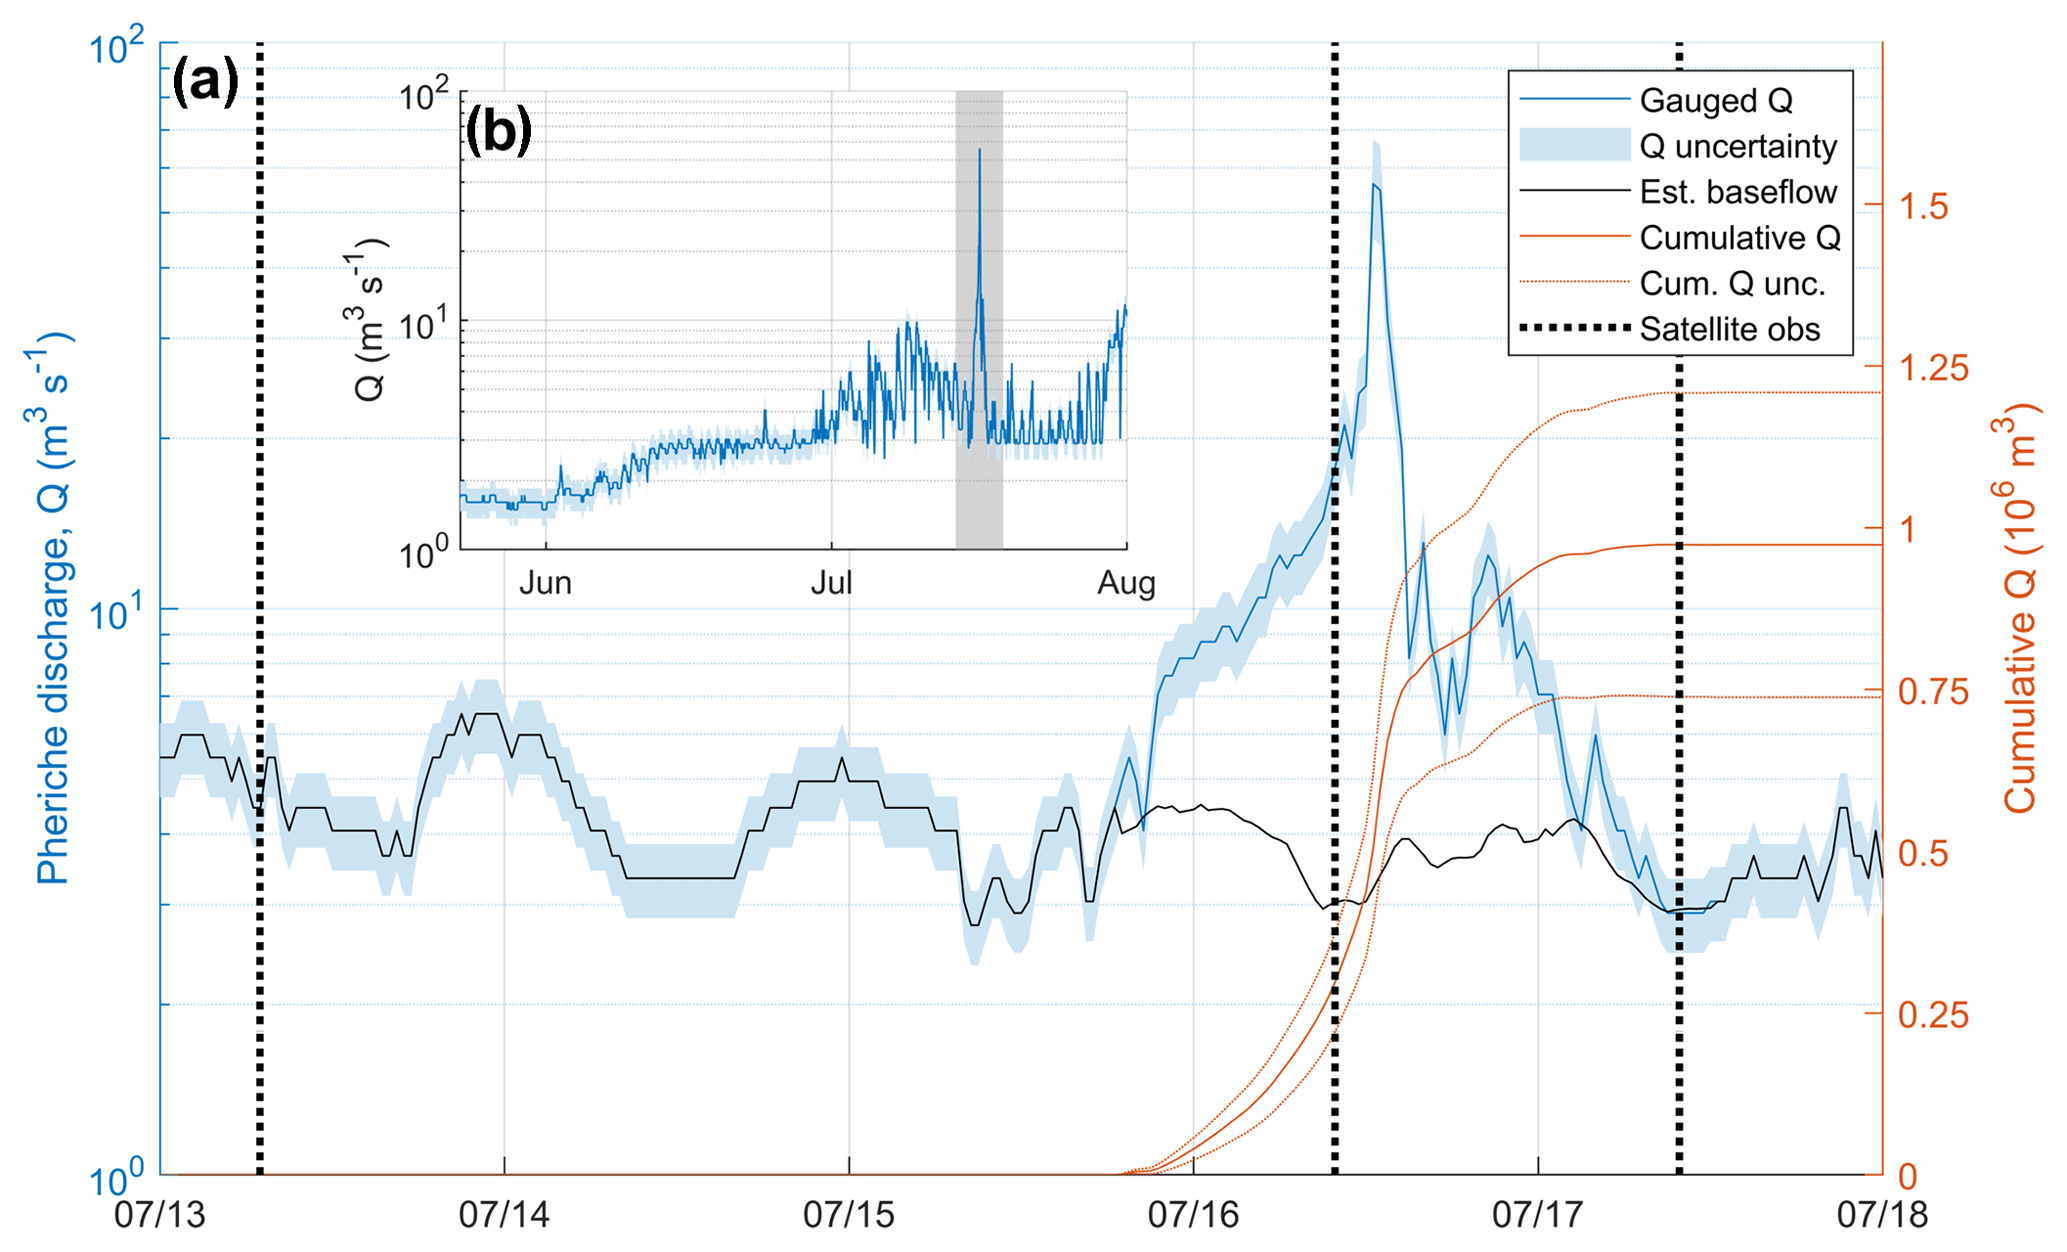
Figure 7Pheriche discharge record during the outburst flood and cumulative flood volume, also indicating the timing of PlanetScope observations (a). The discharge record throughout the 2017 monsoon (b). Note the log scale for discharge in both panels.
The double peak of discharge observed at Pheriche (Fig. 7) is unusual for outburst floods. A possible cause is the blockage of the Khumbu stream inlet by the landslide in the Changri Shar proglacial gorge (Fig. 4). This is likely to have initiated around peak flow through the gorge and could have led to a substantial decline in discharge, followed by a later, sudden increase as preferential flow paths developed through the debris (Gulley et al., 2009b). A second explanation is the possibility of multiple flow paths for the flood through the lower part of Khumbu Glacier. As Khumbu Glacier exhibits a low terminus slope and high hydraulic base level, the flood may have temporarily overwhelmed the subsurface drainage network and, exploiting fractures and secondary pathways common for these glaciers, partially emerged at the glacier surface. This would result in two or more flow paths of differing efficiency, possibly leading to distinct discharge peaks on the Pheriche hydrograph. This possibility is supported by the appearance of highly turbid water in the ponds between zones E and G (Fig. 2) during drainage. A third possibility is that the increased discharge late on 16 July corresponds to a delivery of water stored elsewhere within the glacier system. This stored water might connect to the drainage system more efficiently by the opening of conduits and channels during the flood. Regardless, it is clear that the increase in discharge at Pheriche only lasts until 10:00 on 17 July, so the flood's direct contribution to discharge was short-lived.
4.2 Implications
The use of novel satellite platforms for observing and interpreting this event enabled the development of a detailed chronology of surface changes rarely available for such events. Our observations of the drainage and outburst of the Changri Shar supraglacial lake have several implications for cryospheric hazards and debris-covered glacier hydrology. First, this is a short-lived event, with a lake system of 1.36×10⁶ m3 filling and draining within one ablation season. This is important because, despite the lake's short duration and relatively small volume, the event led to considerable glacial, fluvial, and geomorphic change. These changes disrupted major trails, which are the primary corridor for local trade and tourism, in at least three locations (Watson and King, 2018). As suggested by Komori et al. (2012) and Narama et al. (2018), the hazard posed by such features is significant, yet traditional glacial lake monitoring approaches, which rely on repeat optical imagery such as Landsat and Sentinel-2, would have had difficulty observing the lake's formation due to the timing of repeat passes and cloud cover. Considering all Landsat 8 or Sentinel-2 scenes over the period of our analyses, we find only two that are mostly cloud-free over the supraglacial lake in the 2 months leading up to lake drainage. Pond observations during the monsoon are intermittent at best (Miles et al., 2017a; Watson et al., 2016) and thus we recommend the adoption of high-frequency repeat optical imagery (as in this study) and synthetic aperture radar data products (Strozzi et al., 2012) for improved monsoon monitoring of glacier hydrology.
Furthermore, the scarcity of seasonal observations of glacier hydrology (limited to a few closely monitored glaciers) suggests that short-lived or seasonal outburst floods may be a regular feature of debris-covered glaciers in the region. This is important because both Rounce et al. (2017) and this study indicate that outburst floods from sources other than large proglacial lakes have had downstream effects on transportation networks and the livelihoods of local communities. The few observations of outburst floods from high-elevation debris-covered glaciers suggest a distinct seasonal cycle of hydrological development that contrasts with clean ice glaciers (Fyffe et al., 2015; Miles et al., 2017a; Narama et al., 2017). Rather than a gradual up-glacier progression of an efficient, connected drainage network (Nienow et al., 1998), debris-covered glaciers may impound significant volumes of water internally and at the surface before establishing efficient drainage through the lowest portion of the glacier (Miles et al., 2017c). This key difference is likely related to the melt-inhibiting thick debris near the terminus on such glaciers, which reduces the terminus area's sensitivity to seasonal warming. Instead, the zone of maximum melt (and seasonal sensitivity) is usually in the middle of the ablation area, leading to significant meltwater generation before efficient drainage pathways have been established for the lower glacier (Benn et al., 2017).
The geomorphic evidence from this study suggests that supraglacial lake outburst floods of this magnitude are not particularly common in the Khumbu catchment (indeed, no large supraglacial lake formed on Changri Shar in 2018, and past years show no evidence of such a lake). Still, supraglacial water storage is increasing for many Himalayan glaciers (Thompson et al., 2012; Watson et al., 2016). This is expected as climate warms and debris-covered glaciers stagnate, which are precursors to proglacial lake formation (Benn et al., 2012). In the case of Changri Shar, a very large closed surface depression had been opened by ice cliffs and supraglacial ponds prior to this event, creating the capacity to store 1.36×10⁶ m3 of water. Consequently, as the excavation and pitting of near-stagnant debris-covered glacier termini by ice cliffs and supraglacial ponds becomes more prevalent with a warming climate, other glaciers in the region are likely to develop large supraglacial water bodies. While the coalescence of ponds forming a large supraglacial lake represents an early stage of base-level lake development (Benn et al., 2012; Watanabe et al., 2009), these supraglacial lakes also represent an outburst risk (as evidenced here). Thus, the expected increase in moraine-dammed glacial lake outburst floods due to a lagged response to climate warming (Harrison et al., 2018) may also apply to the outburst of supraglacial water bodies, and events similar to the Changri Shar outburst are likely to increase in frequency.
Finally, the rapid transit time we observe for the flood's passage of the lower Khumbu Glacier suggests that the glacier's subsurface drainage system has, or can develop, an efficient configuration in response to sufficient water supply. We base this assessment on the sudden interruption of peak discharge observed at Pheriche, which most likely corresponds to the blockage of the Changri Shar stream portal as observed in the PlanetScope image on 16 July (Fig. 4c). This image was captured at 09:50, implying a transport time of 3–5.5 h for water to travel a (straight-line) distance of 4.9 km through Khumbu Glacier. Consequently, we estimate a mean travel velocity of at least 0.25–0.45 m s−1; the water also passed 4 km from the glacier to Pheriche during this time but we cannot determine its transit time. Prior dye-tracing studies have considered flow velocities >0.2 m s−1 to indicate hydraulically efficient drainage through a system of major channelised conduits (Hubbard and Glasser, 2005), which we thus interpret for drainage through Khumbu Glacier during this event. The subsurface drainage initially exploited a pre-existing marginal flow path maintained by normal discharge from Changri Shar and Changri Nup glaciers, similar to that inferred for Ngozumpa Glacier by Benn et al. (2017), thus enabling the system's rapid accommodation of the surplus water. It appears that subglacial or deep englacial flow paths were utilised by the flood for Changri Shar Glacier (∼700 m subsurface transit) and much of Khumbu (2.8 km subsurface transit) Glacier. The outburst seems to have bypassed the coupled supraglacial and shallow englacial drainage networks inferred by Irvine-Fynn et al. (2017) and Miles et al. (2017b) until the lowermost portion of Khumbu Glacier, where at least some water emerged at the surface and routed through the terminal chain of ponds. Our interpretations of hydraulically efficient subsurface drainage and subsurface-to-surface routing reflect the response of the drainage system to flood conditions, so additional observation is needed to understand the structure of the drainage system with normal meltwater inputs.
We analysed high-resolution satellite imagery to document and interpret the rapid formation, drainage, and outburst of a supraglacial lake system on Changri Shar Glacier in the Everest region of Nepal. The lake filled between April and July 2017 to an area of 180 000 m2 and volume of 1.36×10⁶ m3 prior to drainage, likely beginning on 15 July. The flood passed primarily through the subsurface of both Changri Shar and Khumbu glaciers. With a peak discharge of 56±11 m3 s−1 observed 4 km downstream and minimum glacier transport velocities of 0.25–0.45 m s−1, the event suggests an efficient subsurface drainage of the flood for most of its flow path. Where routed to the surface on the lowermost portion of Khumbu Glacier, the floodwaters led to the collapse of shallow englacial conduits between supraglacial ponds. In addition, the outburst flood led to substantial geomorphic change of both the Changri Shar and Khumbu proglacial systems and forced rerouting of major trails in the area. We expect that outburst floods of this type and magnitude are not common, but will increase due to climate warming and glacier recession.
Our observations of lake dynamics were only possible through the use of rapid-repeat high-resolution imagery, and similar approaches should be used to document monsoon-season hydrology of debris-covered glaciers, which is largely unobservable by optical satellite sensors. There is evidence of dynamic changes to these glaciers' drainage systems during the monsoon and the occurrence of seasonal outbursts of lower magnitude. Nonetheless, there remains a considerable need for systematic, robust observations of debris-covered glacier hydrology, as these glacier systems exhibit distinct storage components and seasonal drainage development patterns relative to clean ice glaciers. This is a crucial observational gap, as the hydrological storage and discharge of debris-covered glaciers have significant consequences for glacial hazards, surface ablation, glacier dynamics, proglacial sediment dynamics, and water supply with direct impacts on downstream populations.
All derivative data used in this study (e.g. lake coverages, dH zones) are available upon request. Please contact Evan Miles for this purpose (evan.miles@wsl.ch). PlanetScope and RapidEye data are freely available in reasonable quantities for research and education; see https://www.planet.com/markets/education-and-research/ (Planet Team, 2017).
The supplement related to this article is available online at: https://doi.org/10.5194/tc-12-3891-2018-supplement.
ESM and DJQ planned the study. ESM analysed the supraglacial lake area time series, analysed glacial and proglacial elevation changes, and led the manuscript writing. CSW analysed proglacial stream migration and bank erosion. FB and EB processed the Pléiades tri-stereo imagery and coregistered DEMs and orthoimagery. ME installed, calibrated and collected data from the Pheriche stream gauge. ESM, KEM, and DJQ conducted fieldwork to assess and interpret geomorphic changes. All authors contributed to the interpretation of changes and manuscript preparation.
The authors declare that they have no conflict of interest.
The authors gratefully acknowledge Planet for provision of PlanetScope and
RapidEye imagery. This research was supported by the “EverDrill” Natural
Environment Research Council Grant awarded to the University of Leeds
(NE/P00265X) and Aberystwyth University (NE/P002021). C. Scott Watson
acknowledges support from the NASA High Mountain Asia grant NNX16AQ62G.
Etienne Berthier acknowledges support from the French Space Agency (CNES)
through the TOSCA programme. The discharge data were collected as part of two
projects funded by the French National Research Agency (ANR), France
(references ANR-09-CEP-0005-04/PAPRIKA and ANR-13-SENV-0005-04/05-PRESHINE).
KEM is funded by an AberDoc PhD Studentship. Evan S. Miles, Katie E. Miles,
and Duncan J. Quincey acknowledge Himalayan Research Expeditions and
Mahesh Magar in particular for field logistical support. We are thankful for
discussions in the field with Martin Kirkbride. We also thank reviewers
Doug Benn and David Rounce for their input, which helped to improve the
manuscript.
Edited by: Daniel
Farinotti
Reviewed by: David Rounce and Doug Benn
Benn, D., Bolch, T., Hands, K., Gulley, J., Luckman, a., Nicholson, L., Quincey, D., Thompson, S., Toumi, R., and Wiseman, S.: Response of debris-covered glaciers in the Mount Everest region to recent warming, and implications for outburst flood hazards, Earth-Sci. Rev., 114, 156–174, https://doi.org/10.1016/j.earscirev.2012.03.008, 2012. a, b, c, d
Benn, D. I., Wiseman, S., and Hands, K. A.: Growth and drainage of supraglacial lakes on debris-mantled Ngozumpa Glacier, Khumbu Himal, Nepal, J. Glaciol., 47, 626–638, https://doi.org/10.3189/172756501781831729, 2001. a, b
Benn, D. I., Thompson, S., Gulley, J., Mertes, J., Luckman, A., and Nicholson, L.: Structure and evolution of the drainage system of a Himalayan debris-covered glacier, and its relationship with patterns of mass loss, The Cryosphere, 11, 2247–2264, https://doi.org/10.5194/tc-11-2247-2017, 2017. a, b, c, d, e
Berthier, E., Arnaud, Y., Kumar, R., Ahmad, S., Wagnon, P., and Chevallier, P.: Remote sensing estimates of glacier mass balances in the Himachal Pradesh (Western Himalaya, India), Remote Sens. Environ., 108, 327–338, https://doi.org/10.1016/j.rse.2006.11.017, 2007. a
Berthier, E., Vincent, C., Magnússon, E., Gunnlaugsson, Á. Þ., Pitte, P., Le Meur, E., Masiokas, M., Ruiz, L., Pálsson, F., Belart, J. M. C., and Wagnon, P.: Glacier topography and elevation changes derived from Pléiades sub-meter stereo images, The Cryosphere, 8, 2275–2291, https://doi.org/10.5194/tc-8-2275-2014, 2014. a
Berthier, E., Cabot, V., Vincent, C., and Six, D.: Decadal Region-Wide and Glacier-Wide Mass Balances Derived from Multi-Temporal ASTER Satellite Digital Elevation Models. Validation over the Mont-Blanc Area, Front. Earth Sci., 4, 1–16, https://doi.org/10.3389/feart.2016.00063, 2016. a
Brun, F., Buri, P., Miles, E. S., Wagnon, P., Steiner, J. F., Berthier, E., Ragettli, S., Kraaijenbrink, P., Immerzeel, W. W., Pellicciotti, F., Miles, E. S., Steiner, J. F., Berthier, E., Ragettli, S., and Immerzeel, W. W.: Quantifying volume loss from ice cliffs on debris-covered glaciers using high resolution terrestrial and aerial photogrammetry, J. Glaciol., 62, 684–695, https://doi.org/10.1017/jog.2016.54, 2016. a
Brun, F., Wagnon, P., Berthier, E., Shea, J. M., Immerzeel, W. W., Kraaijenbrink, P. D. A., Vincent, C., Reverchon, C., Shrestha, D., and Arnaud, Y.: Ice cliff contribution to the tongue-wide ablation of Changri Nup Glacier, Nepal, central Himalaya, The Cryosphere, 12, 3439–3457, https://doi.org/10.5194/tc-12-3439-2018, 2018. a
Carrivick, J. L. and Tweed, F. S.: A global assessment of the societal impacts of glacier outburst floods, Global Planet. Change, 144, 1–16, https://doi.org/10.1016/j.gloplacha.2016.07.001, 2016. a
Chu, V. W.: Greenland ice sheet hydrology: A review, Prog. Phys. Geogr., 38, 19–54, https://doi.org/10.1177/0309133313507075, 2014. a
Cook, S. J., Kougkoulos, I., Edwards, L. A., Dortch, J., and Hoffmann, D.: Glacier change and glacial lake outburst flood risk in the Bolivian Andes, The Cryosphere, 10, 2399–2413, https://doi.org/10.5194/tc-10-2399-2016, 2016. a
Cooley, S. W., Smith, L. C., Stepan, L., and Mascaro, J.: Tracking dynamic northern surface water changes with high-frequency planet CubeSat imagery, Remote Sensing, 9, 1–21, https://doi.org/10.3390/rs9121306, 2017. a
Di Baldassarre, G. and Montanari, A.: Uncertainty in river discharge observations: a quantitative analysis, Hydrol. Earth Syst. Sci., 13, 913–921, https://doi.org/10.5194/hess-13-913-2009, 2009. a
Fountain, A. G. and Walder, J. S.: Water flow through temperate glaciers, Rev. Geophys., 36, 299, https://doi.org/10.1029/97RG03579, 1998. a
Fyffe, C. L., Brock, B. W., Kirkbride, M. P., Mair, D. W. F., Arnold, N. S., Smiraglia, C., Diolaiuti, G., and Diotri, F.: An investigation of the influence of supraglacial debris on glacier-hydrology, The Cryosphere Discuss., 9, 5373–5411, https://doi.org/10.5194/tcd-9-5373-2015, 2015. a
Garambois, S., Legchenko, A., Vincent, C., and Thibert, E.: Ground-penetrating radar and surface nuclear magnetic resonance monitoring of an englacial water-filled cavity in the polythermal glacier of Tête Rousse, Geophysics, 81, WA131–WA146, https://doi.org/10.1190/GEO2015-0125.1, 2016. a
Gardelle, J., Arnaud, Y., and Berthier, E.: Contrasted evolution of glacial lakes along the Hindu Kush Himalaya mountain range between 1990 and 2009, Global Planet. Change, 75, 47–55, https://doi.org/10.1016/j.gloplacha.2010.10.003, 2011. a
Gulley, J. and Benn, D.: Structural control of englacial drainage systems in Himalayan debris-covered glaciers, J. Glaciol., 53, 399–412, https://doi.org/10.3189/002214307783258378, 2007. a
Gulley, J. D., Benn, D. I., Müller, D., and Luckman, A.: A cut-and-closure origin for englacial conduits in uncrevassed regions of polythermal glaciers, J. Glaciol., 55, 66–80, https://doi.org/10.3189/002214309788608930, 2009a. a
Gulley, J. D., Benn, D. I., Screaton, E., and Martin, J.: Mechanisms of englacial conduit formation and their implications for subglacial recharge, Quaternary Sci. Rev., 28, 1984–1999, https://doi.org/10.1016/j.quascirev.2009.04.002, 2009b. a, b, c
Harrison, S., Kargel, J. S., Huggel, C., Reynolds, J., Shugar, D. H., Betts, R. A., Emmer, A., Glasser, N., Haritashya, U. K., Klimeš, J., Reinhardt, L., Schaub, Y., Wiltshire, A., Regmi, D., and Vilímek, V.: Climate change and the global pattern of moraine-dammed glacial lake outburst floods, The Cryosphere, 12, 1195–1209, https://doi.org/10.5194/tc-12-1195-2018, 2018. a, b
Hubbard, B. and Glasser, N.: Field Techniques in Glaciology and Glacial Geomorphology, John Wiley & Sons, Ltd, Chichester, West Sussex, UK, https://doi.org/10.1017/CBO9781107415324.004, 2005. a
Huss, M., Bauder, A., Werder, M., Funk, M., and Hock, R.: Glacier-dammed lake outburst events of Gornersee, Switzerland, J. Glaciol., 53, 189–200, https://doi.org/10.3189/172756507782202784, 2007. a
Immerzeel, W., Kraaijenbrink, P., Shea, J., Shrestha, A., Pellicciotti, F., Bierkens, M., and de Jong, S.: High-resolution monitoring of Himalayan glacier dynamics using unmanned aerial vehicles, Remote Sens. Environ., 150, 93–103, https://doi.org/10.1016/j.rse.2014.04.025, 2014. a
Irvine-Fynn, T. D., Porter, P. R., Rowan, A. V., Quincey, D. J., Gibson, M. J., Bridge, J. W., Watson, C. S., Hubbard, A., and Glasser, N. F.: Supraglacial Ponds Regulate Runoff From Himalayan Debris-Covered Glaciers, Geophys. Res. Lett., 44, 11894–11904, https://doi.org/10.1002/2017GL075398, 2017. a, b
Jansson, P., Hock, R., and Schneider, T.: The concept of glacier storage: a review, J. Hydrol., 282, 116–129, https://doi.org/10.1016/S0022-1694(03)00258-0, 2003. a
Kargel, J. S., Leonard, G. J., Shugar, D. H., Haritashya, U. K., Bevington, A., Fielding, E. J., Fujita, K., Geertsema, M., Miles, E. S., Steiner, J., Anderson, E., Bajracharya, S., Bawden, G. W., Breashears, D. F., Byers, A., Collins, B., Dhital, M. R., Donnellan, A., Evans, T. L., Geai, M. L., Glasscoe, M. T., Green, D., Gurung, D. R., Heijenk, R., Hilborn, A., Hudnut, K., Huyck, C., Immerzeel, W. W., Jiang, L., Jibson, R., Kääb, A., Khanal, N. R., Kirschbaum, D., Kraaijenbrink, P. D. A., Lamsal, D., Liu, S., Lv, M., McKinney, D., Nahirnick, N. K., Nan, Z., Ojha, S., Olsenholler, J., Painter, T. H., Pleasants, M., Kc, P., Yuan, Q. I., Raup, B. H., Regmi, D., Rounce, D. R., Sakai, A., Shangguan, D., Shea, J. M., Shrestha, A. B., Shukla, A., Stumm, D., van der Kooij, M., Voss, K., Wang, X., Weihs, B., Wolfe, D., Wu, L., Yao, X., Yoder, M. R., and Young, N.: Geomorphic and geologic controls of geohazards induced by Nepal's 2015 Gorkha earthquake, Science, 351, 8353, https://doi.org/10.1126/science.aac8353, 2016. a
King, O., Quincey, D. J., Carrivick, J. L., and Rowan, A. V.: Spatial variability in mass loss of glaciers in the Everest region, central Himalayas, between 2000 and 2015, The Cryosphere, 11, 407–426, https://doi.org/10.5194/tc-11-407-2017, 2017. a
King, O., Dehecq, A., Quincey, D., and Carrivick, J.: Contrasting geometric and dynamic evolution of lake and land-terminating glaciers in the central Himalaya, Global Planet. Change, 167, 46–60, https://doi.org/10.1016/j.gloplacha.2018.05.006, 2018. a
Komori, J., Koike, T., Yamanokuchi, T., and Tshering, P.: Glacial Lake Outburst Events in the Bhutan Himalayas, Global Environ. Res., 16, 59–70, 2012. a
Kraaijenbrink, P. D. A., Shea, J. M., Pellicciotti, F., Jong, S. M. D., and Immerzeel, W. W.: Object-based analysis of unmanned aerial vehicle imagery to map and characterise surface features on a debris-covered glacier, Remote Sens. Environ., 186, 581–595, 2016. a
McFeeters, S. K.: The use of the Normalized Difference Water Index (NDWI) in the delineation of open water features, Int. J. Remote Sens., 17, 1425–1432, https://doi.org/10.1080/01431169608948714, 1996. a
Mcmillan, H., Krueger, T., and Freer, J.: Benchmarking observational uncertainties for hydrology: Rainfall, river discharge and water quality, Hydrol. Process., 26, 4078–4111, https://doi.org/10.1002/hyp.9384, 2012. a
Miles, E. S., Pellicciotti, F., Willis, I. C., Steiner, J. F., Buri, P., and Arnold, N. S.: Refined energy-balance modelling of a supraglacial pond, Langtang Khola, Nepal, Ann. Glaciol., 57, 29–40, https://doi.org/10.3189/2016AoG71A421, 2016. a, b
Miles, E. S., Willis, I. C., Arnold, N. S., Steiner, J. F., and Pellicciotti, F.: Spatial, seasonal, and interannual variability of supraglacial ponds in the Langtang Valley of Nepal, 1999 to 2013, J. Glaciol., 63, 88–105, https://doi.org/10.1017/jog.2016.120, 2017a. a, b, c, d, e
Miles, E. S. E., Steiner, J., Willis, I. C., Buri, P., Immerzeel, W. W. W., Chesnokova, A., and Pellicciotti, F.: Pond dynamics and supraglacial-englacial connectivity on debris-covered Lirung Glacier, Nepal, Front. Earth Sci., 5, 1–19, https://doi.org/10.3389/FEART.2017.00069, 2017b. a, b, c
Miles, K. E., Hubbard, B., Irvine-Fynn, T. D. L., Miles, E. S., Quincey, D. J., and Rowan, A. V.: Review article: The hydrology of debris-covered glaciers – state of the science and future research directions, The Cryosphere Discuss., https://doi.org/10.5194/tc-2017-210, 2017c. a
Narama, C., Daiyrov, M., Tadono, T., Yamamoto, M., Kääb, A., Morita, R., Ukita, J., and Jinro, U.: Seasonal drainage of supraglacial lakes on debris-covered glaciers in the Tien Shan Mountains, Central Asia, Geomorphology, 286, 133–142, https://doi.org/10.1016/j.geomorph.2017.03.002, 2017. a, b
Narama, C., Daiyrov, M., Duishonakunov, M., Tadono, T., Sato, H., Kääb, A., Ukita, J., and Abdrakhmatov, K.: Large drainages from short-lived glacial lakes in the Teskey Range, Tien Shan Mountains, Central Asia, Nat. Hazards Earth Syst. Sci., 18, 983–995, https://doi.org/10.5194/nhess-18-983-2018, 2018. a, b, c
Nie, Y., Liu, Q., Wang, J., Zhang, Y., Sheng, Y., and Liu, S.: An inventory of historical glacial lake outburst floods in the Himalayas based on remote sensing observations and geomorphological analysis, Geomorphology, 308, 91–106, https://doi.org/10.1016/j.geomorph.2018.02.002, 2018. a
Nienow, P., Sharp, M., and Willis, I.: Seasonal changes in the morphology of the subglacial drainage system, Haut Glacier d'Arolla, Switzerland, Earth Surf. Proc. Land., 23, 825–843, https://doi.org/10.1002/(SICI)1096-9837(199809)23:9<825::AID-ESP893>3.0.CO;2-2, 1998. a
Otsu, N.: A Threshold Selection Method from Gray-Level Histograms, IEEE T. Syst. Man Cyb., 9, 62–66, https://doi.org/10.1109/TSMC.1979.4310076, 1979. a
Pfeffer, W. T., Arendt, A. A., Bliss, A., Bolch, T., Cogley, J. G., Gardner, A. S., Hagen, J.-O., Hock, R., Kaser, G., Kienholz, C., Miles, E. S., Moholdt, G., Mölg, N., Paul, F., Radić, V., Rastner, P., Raup, B. H., Rich, J., Sharp, M. J., and The Randolph Consortium: The Randolph Glacier Inventory: a globally complete inventory of glaciers, J. Glaciol., 60, 537–552, https://doi.org/10.3189/2014JoG13J176, 2014. a
Planet Team: Planet Application Program Interface: In Space for Life on Earth, available at: https://api.planet.com (last access: 18 January 2018), 2017. a, b
Quincey, D., Richardson, S., Luckman, a., Lucas, R., Reynolds, J., Hambrey, M., and Glasser, N.: Early recognition of glacial lake hazards in the Himalaya using remote sensing datasets, Global Planet. Change, 56, 137–152, https://doi.org/10.1016/j.gloplacha.2006.07.013, 2007. a
Richardson, S. J. and Quincey, D. J.: The 2008 outburst floods from Ghulkin Glacier, Karakoram, Pakistan, Geophys. Res. Abstr., EGU2009-12871, EGU General Assembly 2009, Vienna, Austria, 2009. a
Roberts, M. J., Russel, A. J., Tweed, F., and Knudsen, O.: Controls on the development of supraglacial flood water outlets during jôkulhlaups, in: The Extremes of the Extremes: Extraordinary Floods, IAHS Publ. 271, 71–76, 2002. a
Röhl, K.: Characteristics and evolution of supraglacial ponds on debris-covered Tasman Glacier, New Zealand, J. Glaciol., 54, 867–880, https://doi.org/10.3189/002214308787779861, 2008. a
Rounce, D. R., McKinney, D. C., Lala, J. M., Byers, A. C., and Watson, C. S.: A new remote hazard and risk assessment framework for glacial lakes in the Nepal Himalaya, Hydrol. Earth Syst. Sci., 20, 3455–3475, https://doi.org/10.5194/hess-20-3455-2016, 2016. a
Rounce, D. R., Byers, A. C., Byers, E. A., and McKinney, D. C.: Brief communication: Observations of a glacier outburst flood from Lhotse Glacier, Everest area, Nepal, The Cryosphere, 11, 443–449, https://doi.org/10.5194/tc-11-443-2017, 2017. a, b, c, d, e
Rounce, D. R., King, O., McCarthy, M., Shean, D. E., and Salerno, F.: Quantifying Debris Thickness of Debris-Covered Glaciers in the Everest Region of Nepal Through Inversion of a Subdebris Melt Model, J. Geophys. Res.-Earth, 123, 1094–1115, https://doi.org/10.1029/2017JF004395, 2018. a
Rowan, A. V., Egholm, D. L., Quincey, D. J., and Glasser, N. F.: Modelling the feedbacks between mass balance, ice flow and debris transport to predict the response to climate change of debris-covered glaciers in the Himalaya, Earth Planet. Sc. Lett., 430, 427–438, https://doi.org/10.1016/j.epsl.2015.09.004, 2015. a
Sakai, A., Takeuchi, N., Fujita, K., and Nakawo, M.: Role of supraglacial ponds in the ablation process of a debris-covered glacier in the Nepal Himalayas, IAHS-AISH P., 264, 119–130, 2000. a
Sakai, A., Nakawo, M., and Fujita, K.: Distribution Characteristics and Energy Balance of Ice Cliffs on Debris-Covered Glaciers, Nepal Himalaya, Arct. Antarct. Alp. Res., 34, 12–19, https://doi.org/10.2307/1552503, 2002. a
Salerno, F., Thakuri, S., Fujita, K., and Nuimura, T.: Debris-covered glacier anomaly? Morphological factors controlling changes in mass balance, surface area, terminus position, and snow line altitude of Himalayan glaciers, Earth Planet. Sc. Lett., 471, 19–31, https://doi.org/10.1016/j.epsl.2017.04.039, 2017. a
Shean, D.: High Mountain Asia 8-meter DEM Mosaics Derived from Optical Imagery, Version 1, Boulder, Colorado USA, NASA National Snow and Ice Data Center Distributed Active Archive Center, https://doi.org/10.5067/KXOVQ9L172S2, 2017. a
Shean, D. E., Alexandrov, O., Moratto, Z. M., Smith, B. E., Joughin, I. R., Porter, C., and Morin, P.: An automated, open-source pipeline for mass production of digital elevation models (DEMs) from very-high-resolution commercial stereo satellite imagery, ISPRS Journal of Photogramm., 116, 101–117, https://doi.org/10.1016/j.isprsjprs.2016.03.012, 2016. a
Sherpa, S. F., Wagnon, P., Brun, F., Berthier, E., Vincent, C., Lejeune, Y., Arnaud, Y., Kayastha, R. B., and Sinisalo, A.: Contrasted surface mass balances of debris-free glaciers observed between the southern and the inner parts of the Everest region (2007–15), J. Glaciol., 63, 637–651, https://doi.org/10.1017/jog.2017.30, 2017. a
Steiner, J. F., Kraaijenbrink, P. D. A., Jiduc, S. G., and Immerzeel, W. W.: Brief communication: The Khurdopin glacier surge revisited – extreme flow velocities and formation of a dammed lake in 2017, The Cryosphere, 12, 95–101, https://doi.org/10.5194/tc-12-95-2018, 2018. a
Strozzi, T., Wiesmann, A., Kääb, A., Joshi, S., and Mool, P.: Glacial lake mapping with very high resolution satellite SAR data, Nat. Hazards Earth Syst. Sci., 12, 2487–2498, https://doi.org/10.5194/nhess-12-2487-2012, 2012. a
Thompson, S. S., Benn, D. I., Dennis, K., and Luckman, A.: A rapidly growing moraine-dammed glacial lake on Ngozumpa Glacier, Nepal, Geomorphology, 145–146, 1–11, https://doi.org/10.1016/j.geomorph.2011.08.015, 2012. a
Veh, G., Korup, O., Roessner, S., and Walz, A.: Detecting Himalayan glacial lake outburst floods from Landsat time series, Remote Sens. Environ., 207, 84–97, https://doi.org/10.1016/j.rse.2017.12.025, 2018. a
Vincent, C., Wagnon, P., Shea, J. M., Immerzeel, W. W., Kraaijenbrink, P., Shrestha, D., Soruco, A., Arnaud, Y., Brun, F., Berthier, E., and Sherpa, S. F.: Reduced melt on debris-covered glaciers: investigations from Changri Nup Glacier, Nepal, The Cryosphere, 10, 1845–1858, https://doi.org/10.5194/tc-10-1845-2016, 2016. a
Wadham, J. L., Hodgkins, R., Cooper, R. J., and Tranter, M.: Evidence for seasonal subglacial outburst events at a polythermal glacier, Finsterwalderbreen, Svalbard, Hydrol. Process., 15, 2259–2280, https://doi.org/10.1002/hyp.178, 2001. a
Walder, J. S. and Costa, J. E.: Outburst Floods From Glacier-Dammed Lakes: the Effect of Mode of Lake Drainage on Flood Magnitude, Earth Surf. Proc. Land., 21, 701–723, https://doi.org/10.1002/(SICI)1096-9837(199608)21:8<701::AID-ESP615>3.0.CO;2-2, 1996. a
Walder, J. S. and Driedger, C. L.: Frequent outburst floods from South Tahoma Glacier, Mount Rainier, USA: relation to debris flows, meteorological origin, and implications for subglacial hydrology, J. Glaciol., 41, 1–10, https://doi.org/10.1017/S0022143000017718, 1995. a
Watanabe, T., Lamsal, D., and Ives, J. D.: Evaluating the growth characteristics of a glacial lake and its degree of danger of outburst flooding: Imja Glacier, Khumbu Himal, Nepal, Norsk. Geogr. Tidsskr., 63, 255–267, https://doi.org/10.1080/00291950903368367, 2009. a
Watson, C., Quincey, D., Carrivick, J., and Smith, M.: The dynamics of supraglacial ponds in the Everest region, central Himalaya, Global Planet. Change, 142, 14–27, https://doi.org/10.1016/j.gloplacha.2016.04.008, 2016. a, b, c, d
Watson, C. S. and King, O.: Everest's thinning glaciers: implications for tourism and mountaineering, Geology Today, 34, 18–25, https://doi.org/10.1111/gto.12215, 2018. a
Watson, C. S., Quincey, D. J., Carrivick, J. L., Smith, M. W., Rowan, A. V., and Richardson, R.: Heterogeneous water storage and thermal regime of supraglacial ponds on debris-covered glaciers, Earth Surf. Proc. Land., 43, 229–241, https://doi.org/10.1002/esp.4236, 2017. a, b
Westoby, M. J., Glasser, N. F., Brasington, J., Hambrey, M. J., Quincey, D. J., and Reynolds, J. M.: Modelling outburst floods from moraine-dammed glacial lakes, Earth-Sci. Rev., 134, 137–159, https://doi.org/10.1016/j.earscirev.2014.03.009, 2014. a