the Creative Commons Attribution 4.0 License.
the Creative Commons Attribution 4.0 License.
 | 16 Aug 2018
Characteristics and fate of isolated permafrost patches in coastal Labrador, Canada
Robert G. Way
Antoni G. Lewkowicz
Bodies of peatland permafrost were examined at five sites along a 300 km transect spanning the isolated patches permafrost zone in the coastal barrens of southeastern Labrador. Mean annual air temperatures ranged from +1 ∘C in the south (latitude 51.4∘ N) to −1.1 ∘C in the north (53.7∘ N) while mean ground temperatures at the top of the permafrost varied respectively from −0.7 to −2.3 ∘C with shallow active layers (40–60 cm) throughout. Small surface offsets due to wind scouring of snow from the crests of palsas and peat plateaux, and large thermal offsets due to thick peat are critical to permafrost, which is absent in wetland and forested and forest–tundra areas inland, notwithstanding average air temperatures much lower than near the coast. Most permafrost peatland bodies are less than 5 m thick, with a maximum of 10 m, with steep geothermal gradients. One-dimensional thermal modelling for two sites showed that they are in equilibrium with the current climate, but the permafrost mounds are generally relict and could not form today without the low snow depths that result from a heaved peat surface. Despite the warm permafrost, model predictions using downscaled global warming scenarios (RCP2.6, RCP4.5, and RCP8.5) indicate that perennially frozen ground will thaw from the base up and may persist at the southern site until the middle of the 21st century. At the northern site, permafrost is more resilient, persisting to the 2060s under RCP8.5, the 2090s under RCP4.5, or beyond the 21st century under RCP2.6. Despite evidence of peatland permafrost degradation in the study region, the local-scale modelling suggests that the southern boundary of permafrost may not move north as quickly as previously hypothesized.
- Article
(9739 KB) - Full-text XML
-
Supplement
(1082 KB) - BibTeX
- EndNote


Global and regional models project that the southern boundary of permafrost will shift northwards over the next century as the climate warms (e.g. Koven et al., 2013; Zhang et al., 2008a, b). In the zone of isolated patches, permafrost underlies less than 10 % of the landscape and is mainly present in frozen peatlands (Smith and Riseborough, 2002). Peatland permafrost is considered to be vulnerable to thaw in response to projected regional warming, which may modify ecosystem properties and change landscape development processes (Tarnocai, 2006, 2009). Projected loss of peatland permafrost is also expected to result in an increase in atmospheric carbon (Schuur et al., 2015) although possibly less than previously anticipated (Cooper et al., 2017; Turetsky et al., 2007). To date, most field-based studies of changes in peatland permafrost have focused on the sporadic and extensive discontinuous zones (e.g. Halsey et al., 1995; James et al., 2013; Kwong and Gan, 1994; Sjöberg et al., 2015; Swindles et al., 2016; Thibault and Payette, 2009). A better understanding of the current distribution and characteristics of bodies of permafrost located in the zone of isolated patches is needed to assess the likelihood of their persistence or degradation in the face of climate warming.
Peatland permafrost features include palsas and peat plateaux, both resulting from ice segregation processes (Gurney, 2001; Seppälä, 1982, 2011). Palsas form in an otherwise unfrozen peatland due to localized snow redistribution caused by wind-scouring of microtopographic highs, which allows greater ground heat loss in winter, deeper frost penetration, and surface heaving due to segregated ice formation (Seppälä, 1982, 2011). The elevated ground surface promotes drying of near-surface peat in the summer, reducing its thermal conductivity and diminishing summer heat transfer into the ground (Allard and Rousseau, 1999; An and Allard, 1995; Seppälä, 2011). Peat plateaux form due to similar processes operating where extensive areas of peatlands are well drained, allowing for larger areas of frost heave, wind-scouring in the winter, and less heat penetration in the summer (Zoltai, 1972; Zoltai and Tarnocai, 1975).
Peatland permafrost bodies have partially or completely thawed at many locations within the circumpolar north over the past few decades, including Scandinavia (Borge et al., 2017), eastern Canada (Thibault and Payette, 2009), and western Canada (e.g. Halsey et al., 1995; Quinton et al., 2011). Despite this apparent trend towards degradation, permafrost bodies, first described 35–75 years ago (Brown, 1979, 1975; Dionne, 1984; Hustich, 1939), have persisted at some coastal locations in the isolated patches permafrost zone in eastern Canada (Dionne, 1984; Dionne and Richard, 2006). However, regional-scale modelling suggests that considerable permafrost thaw could have occurred in this region over the past 50 years (Way and Lewkowicz, 2016), coinciding with a period of rapidly increasing regional air temperatures (Way and Viau, 2015).
Here we assess the state of peatland permafrost at five locations across the isolated patches zone of southeastern Labrador and easternmost Quebec. Permafrost-cored mounds in these wetlands have cultural significance as locations for storing komatiks (towing sleds), berry picking (cloudberries), and cooling meat beneath the surface peat layers (Patricia Way, personal communication, 2013). The elevated surfaces have also been regularly used by indigenous and settler trappers as locations to establish fox traps (Gary Bird, personal communication, 2013). We describe field measurements of air temperature, ground temperature and the spatial extent of permafrost patches using frost probing and electrical resistivity tomography (ERT), and the results of numerical modelling to assess the fate of these isolated bodies of perennially frozen ground as the climate warms.
The study area comprises the coastal barrens ecozone in Labrador, from near Rigolet (54.2∘ N) southwards and extending across the Quebec border as far as Blanc-Sablon (51.4∘ N) (Fig. 1a). Regional vegetation cover in this ecozone is sparse forest-and-shrub tundra on exposed outer coasts but includes dense black spruce, tamarack, and white spruce forests in sheltered areas and farther inland (Roberts et al., 2006). Peat deposits and wetlands are present throughout the region with plateau string bogs clustered in the interior and raised bogs in the coastal zone (Foster et al., 1988; Foster and Glaser, 1986; Glaser, 1992). Surficial materials consist primarily of exposed rock and bedrock covered by glacial tills on outer coasts and glacial till with scattered glaciofluvial deposits farther inland (Fig. 1b) (Fulton, 1995). Marine and glaciomarine sediments, deposited during Holocene high stands, are present near Blanc-Sablon and in areas north of Cartwright.
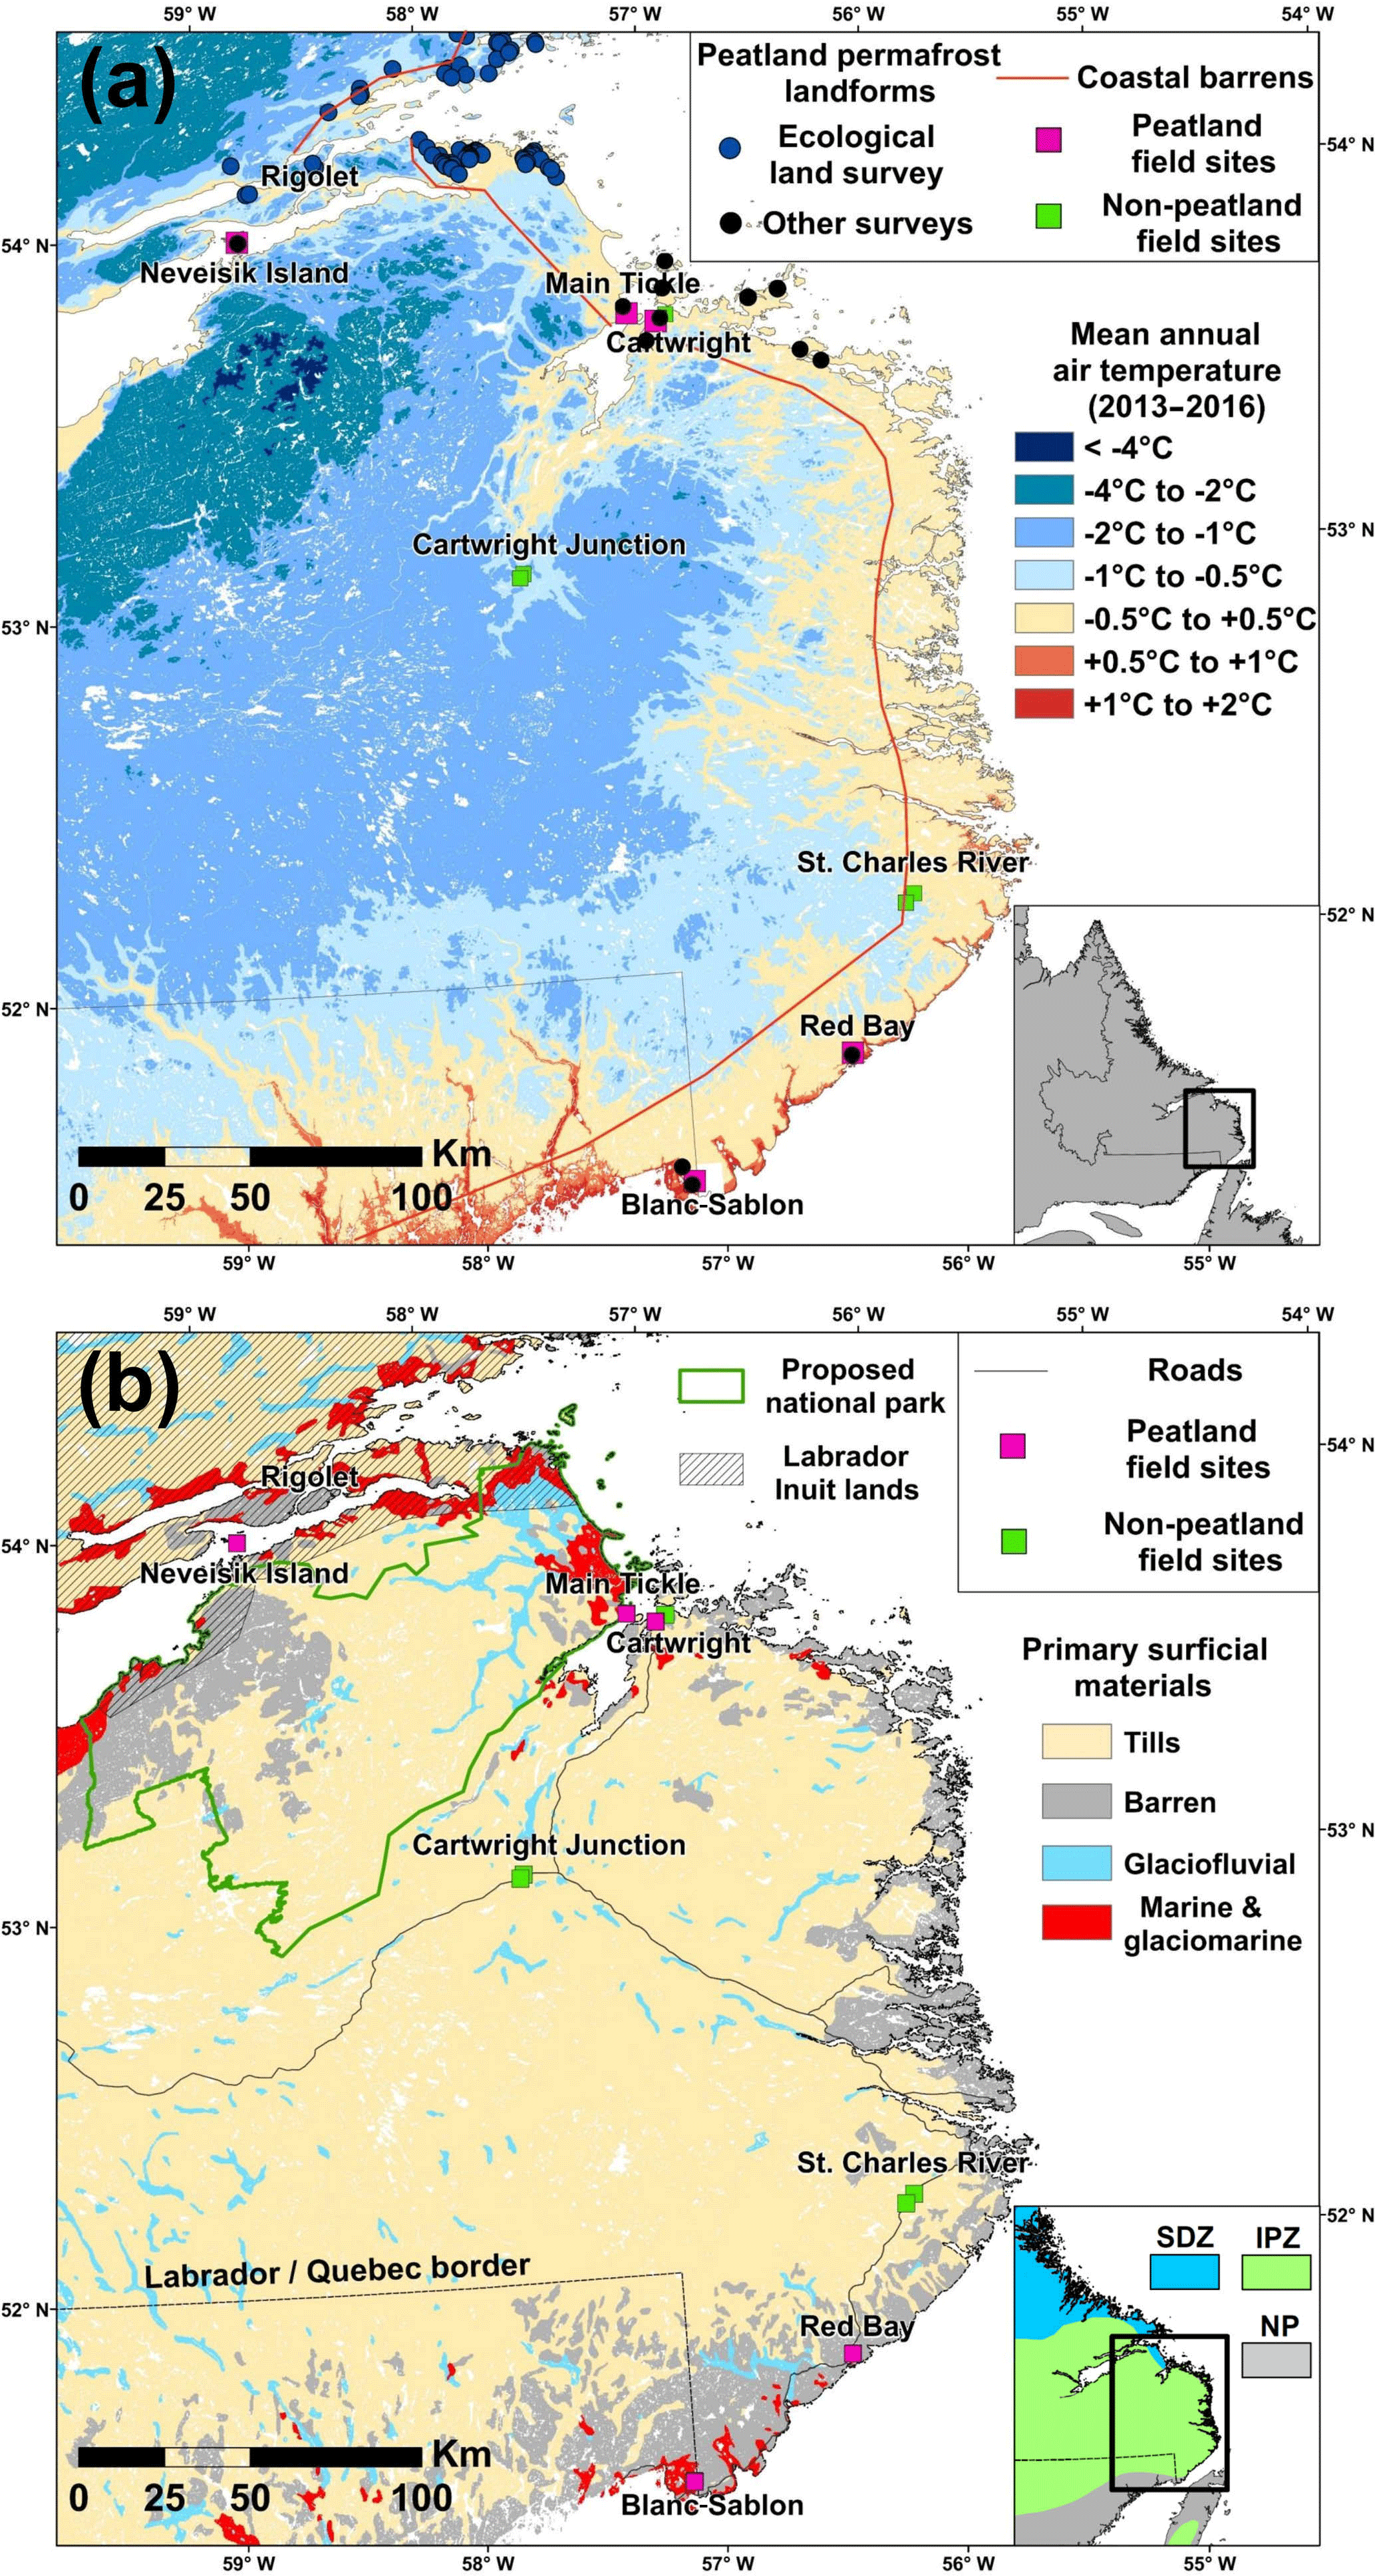
Figure 1Location of peatland and non-peatland study sites in southeastern Labrador in relation to (a) gridded (100 m resolution) mean annual air temperatures (2013–2016) (Way et al., 2017) and peatland landforms mapped in various studies, and (b) surficial materials (Fulton, 1995). The inset map in (a) shows the study location in eastern Canada, and the boundary of the coastal barrens ecozone (Roberts et al., 2006) is shown as an orange line. Labrador Inuit lands and the proposed Mealy Mountains National Park are outlined in (b). The inset in (b) shows the boundaries of permafrost zones (after Heginbottom et al., 1995) where SDZ is the sporadic discontinuous zone, IPZ the isolated patches zone, and NP no permafrost.
Mean annual air temperature (2013–2016) along the coast declines northwards from +1.0 ∘C near Blanc-Sablon to −0.5 ∘C north of Cartwright (Fig. 1a) (Way et al., 2017). Lower temperatures occur inland in high-elevation plateaus and mountainous zones, including the Akami-UapishkU-KakKasuak-Mealy Mountains National Park reserve. Air temperatures in the region increased by 1.8 ∘C between 1917 and 2016 (Way and Viau, 2015); however, annual temperatures were within ±0.1 ∘C of the long-term means (1948–2016) during the period of field observations (2013–2017), suggesting a cooler period relative to the prior decade (2003–2012) (see Fig. S1 in Way and Lewkowicz, 2018). Mean cold-season (December to April 1981–2010) snow depth averages 109 cm at Cartwright but only 24 cm at Blanc-Sablon, and total annual precipitation for Cartwright is 1073 and 1022 mm for Blanc-Sablon (Environment and Climate Change Canada, 2017).
The Permafrost Map of Canada (Heginbottom et al., 1995) shows most of the study transect as isolated patches of permafrost, with the extreme southern boundary of the zone just north of Blanc-Sablon and small areas at the northeast end of the transect within the sporadic discontinuous zone (Fig. 1b). Palsas and other periglacial features have been described at a reconnaissance level in early work and more recently (e.g. Brown, 1979, 1975; Dionne, 1984; Dionne and Gérardin, 1988; Dionne and Richard, 2006; Hustich, 1939; Roberts et al., 2006), but systematic measurement or analysis of peatland permafrost has been undertaken only near Blanc-Sablon (Dionne, 1984; Dionne and Richard, 2006).
3.1 Climate data and boreholes
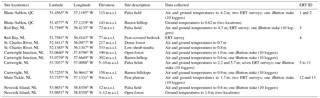
Climate monitoring stations were established at five peatland permafrost sites (Fig. 1a; Table 1). Additional climate information is available from several non-peatland monitoring stations in the coastal barrens ecozone and farther inland (Fig. 1a). Shielded air temperature at 190–235 cm (because of deep regional snow cover), ground surface temperature (∼2–3 cm beneath the surface), and shallow ground temperature (50–120 cm of depth) were measured bi-hourly using Onset HOBO Pro v2 (accuracy ±0.2 ∘C) and/or Maxim Integrated high-resolution iButton loggers (accuracy ±0.5 ∘C). Corrections for differing sensor types are described in Way and Lewkowicz (2018). The deepest ground temperature measurement was at the depth of probe penetration in middle to late summer and was considered to approximate the temperature at the base of the annual freeze–thaw layer (e.g. TTOP; Way and Lewkowicz, 2018). Snow depth was measured using vertically arranged low-resolution iButton loggers (e.g. Lewkowicz, 2008) installed at various heights (typically 10, 20, 30, 40, 50, 60, 80, 100, 140, and 180 cm). The iButton data were used to calculate daily snow heights using an empirical threshold established from correlations among the daily temperature ranges at various heights (see Way and Lewkowicz, 2018).
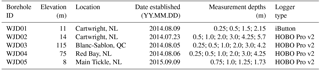
Five shallow boreholes (Table 2) were drilled by pumping surface water through a steel pipe into the ground, creating a borehole in the frozen sediments. Boreholes were cased with 25 mm diameter PVC pipe immediately after drilling. The base of the permafrost was not reached at two locations (WJD01 and WJD05) due to limited water supply. Ground temperatures at four to six depths within each borehole were recorded bi-hourly with Onset HOBO v2 loggers equipped with external thermistors. Temperatures at WJD01 were measured with four high-resolution iButton loggers. Ground temperatures for four of the five boreholes are reported for the second and third full years of the record to eliminate any thermal influence of water-jet drilling. At WJD05, data are provided only for the second year because this borehole was drilled 1 year after the others. Short data gaps in the borehole temperature records were infilled using cross-correlation between borehole depths and/or adjacent climate monitoring stations established at each location.
3.2 DC electrical resistivity tomography
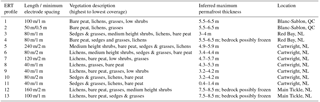
ERT surveys at the study sites (Table 1) were undertaken with an ABEM Terrameter LS profiling system with electrodes arranged in a Wenner configuration. ERT has been widely used for detecting permafrost bodies and estimating permafrost thickness in Canada (Briggs et al., 2016; Douglas et al., 2016; Lewkowicz et al., 2011; Minsley et al., 2016; Way and Lewkowicz, 2015), Scandinavia (Kasprzak, 2015; Sjöberg et al., 2015), the European Alps (Hauck, 2013), and the Tibetan Plateau (You et al., 2013). Minimum electrode spacing was 0.5, 1, or 2 m over standard profile lengths of 40–160 m, or longer where roll-along surveys were performed, giving maximum penetration depths of approximately 6, 12, or 25 m, respectively. RES2DINV software was used to invert the measured resistivities (Loke et al., 2003; Loke and Barker, 1996) with the robust inversion method. Inversion proceeded until the fifth iteration or until the RMS error dropped below 5 %, whichever came first. Prior to inversion, ERT profiles were topographically corrected using a handheld GPS (Garmin Oregon 450t) to obtain start point elevations and a Brunton compass to obtain relative elevations. Surface vegetation cover was also described in the field, and aerial images were acquired using a DJI Phantom 3 Professional quadracopter. Tomograms are presented as model blocks with less sensitive model blocks (sensitivity values were calculated in RES2DINV per Loke et al., 2003) faded to show that these are less reliable in the resultant modelled profile. A sensitivity threshold of less than or equal to 0.1 was selected for fading of tomograms after interpretation of the profiles. Model blocks are larger near the ends of a profile than beneath its centre, reducing the detail in these portions. Due to inherent uncertainties in using ERT for near-surface permafrost detection, frost table probing was conducted at 1 or 2 m intervals along each ERT transect using a 120 cm titanium probe. Permafrost thicknesses were estimated directly from the ERT data where ground temperatures were not available, but these data were informed by frost probing, measured near-surface resistivity values, and ground temperatures from nearby sites to determine appropriate apparent resistivity boundaries for each site. Permafrost thickness estimates were assumed to have an error of ±0.5 m or approximately one model block (depending on survey resolution) in the near surface (Supplement Sect. S1).
3.3 Thermal modelling
We modelled the thermal dynamics for borehole WJD02 at Cartwright and borehole WJD03 at Blanc-Sablon using the Northern Ecosystem Soil Temperature (NEST) model (Zhang et al., 2003). NEST is a one-dimensional process-based model that considers the effects of climate, vegetation, snow, soil composition, and water conditions on ground thermal dynamics. The soil and ground profile was divided into layers of 0.1 m thickness within the uppermost metre and the layer thickness gradually increased to 4.8 m at the base of the modelled profile (120 m of depth). The upper boundary condition was determined based on the surface energy balance, and an input parameter of geothermal heat flux was used for the lower boundary. NEST has been used to model change in peatland permafrost features in northern Manitoba (Zhang, 2013) and northern Ontario (Ou et al., 2016a, b). Climate inputs include daily minimum and maximum air temperatures, precipitation, vapour pressure, solar radiation, and wind speed. We compiled the input data based on climate station observations (Vincent et al., 2012) and gridded datasets (Hutchinson et al., 2009) for 1900–2016 and from ensemble climate model outputs for 2017–2100 under three Representative Concentration Pathways (RCP2.6, RCP4.5, and RCP8.5) (van Vuuren et al., 2011) (see details in Supplement Sect. S2). Under the scenarios of RCP2.6, RCP4.5, and RCP8.5, air temperature was projected to increase 1.0, 2.3, and 5.5 ∘C from the 2010s to the 2090s. Soil profile properties (e.g. peat thickness) were estimated from observations during water-jet drilling and depth to bedrock was based on the ERT survey results (Table S1 in the Supplement). The model was initialized by running the model iteratively using the climate data in 1900 until the modelled deep ground temperature was stable.
Two input parameters of the model were calibrated using daily borehole temperatures for 2014–2016. A snow wind-scouring factor (fraction of snowfall blown away from the site) was adjusted until modelled near-surface soil layer temperatures were comparable to observations (Table S1). The geothermal heat flux was tuned by comparing modelled and observed permafrost thickness and deep ground temperatures (Table S1). The parameters were kept constant during all the simulation years, including the spin-up runs for model initialization. To examine the major controls on ground temperatures, the model was also run for the Blanc-Sablon borehole assuming no snow scouring and no peat cover.
4.1 Field observations
Field results are presented from south to north for the five peatland permafrost sites and are summarized in Tables 3 and S2.
4.1.1 Blanc-Sablon, QC
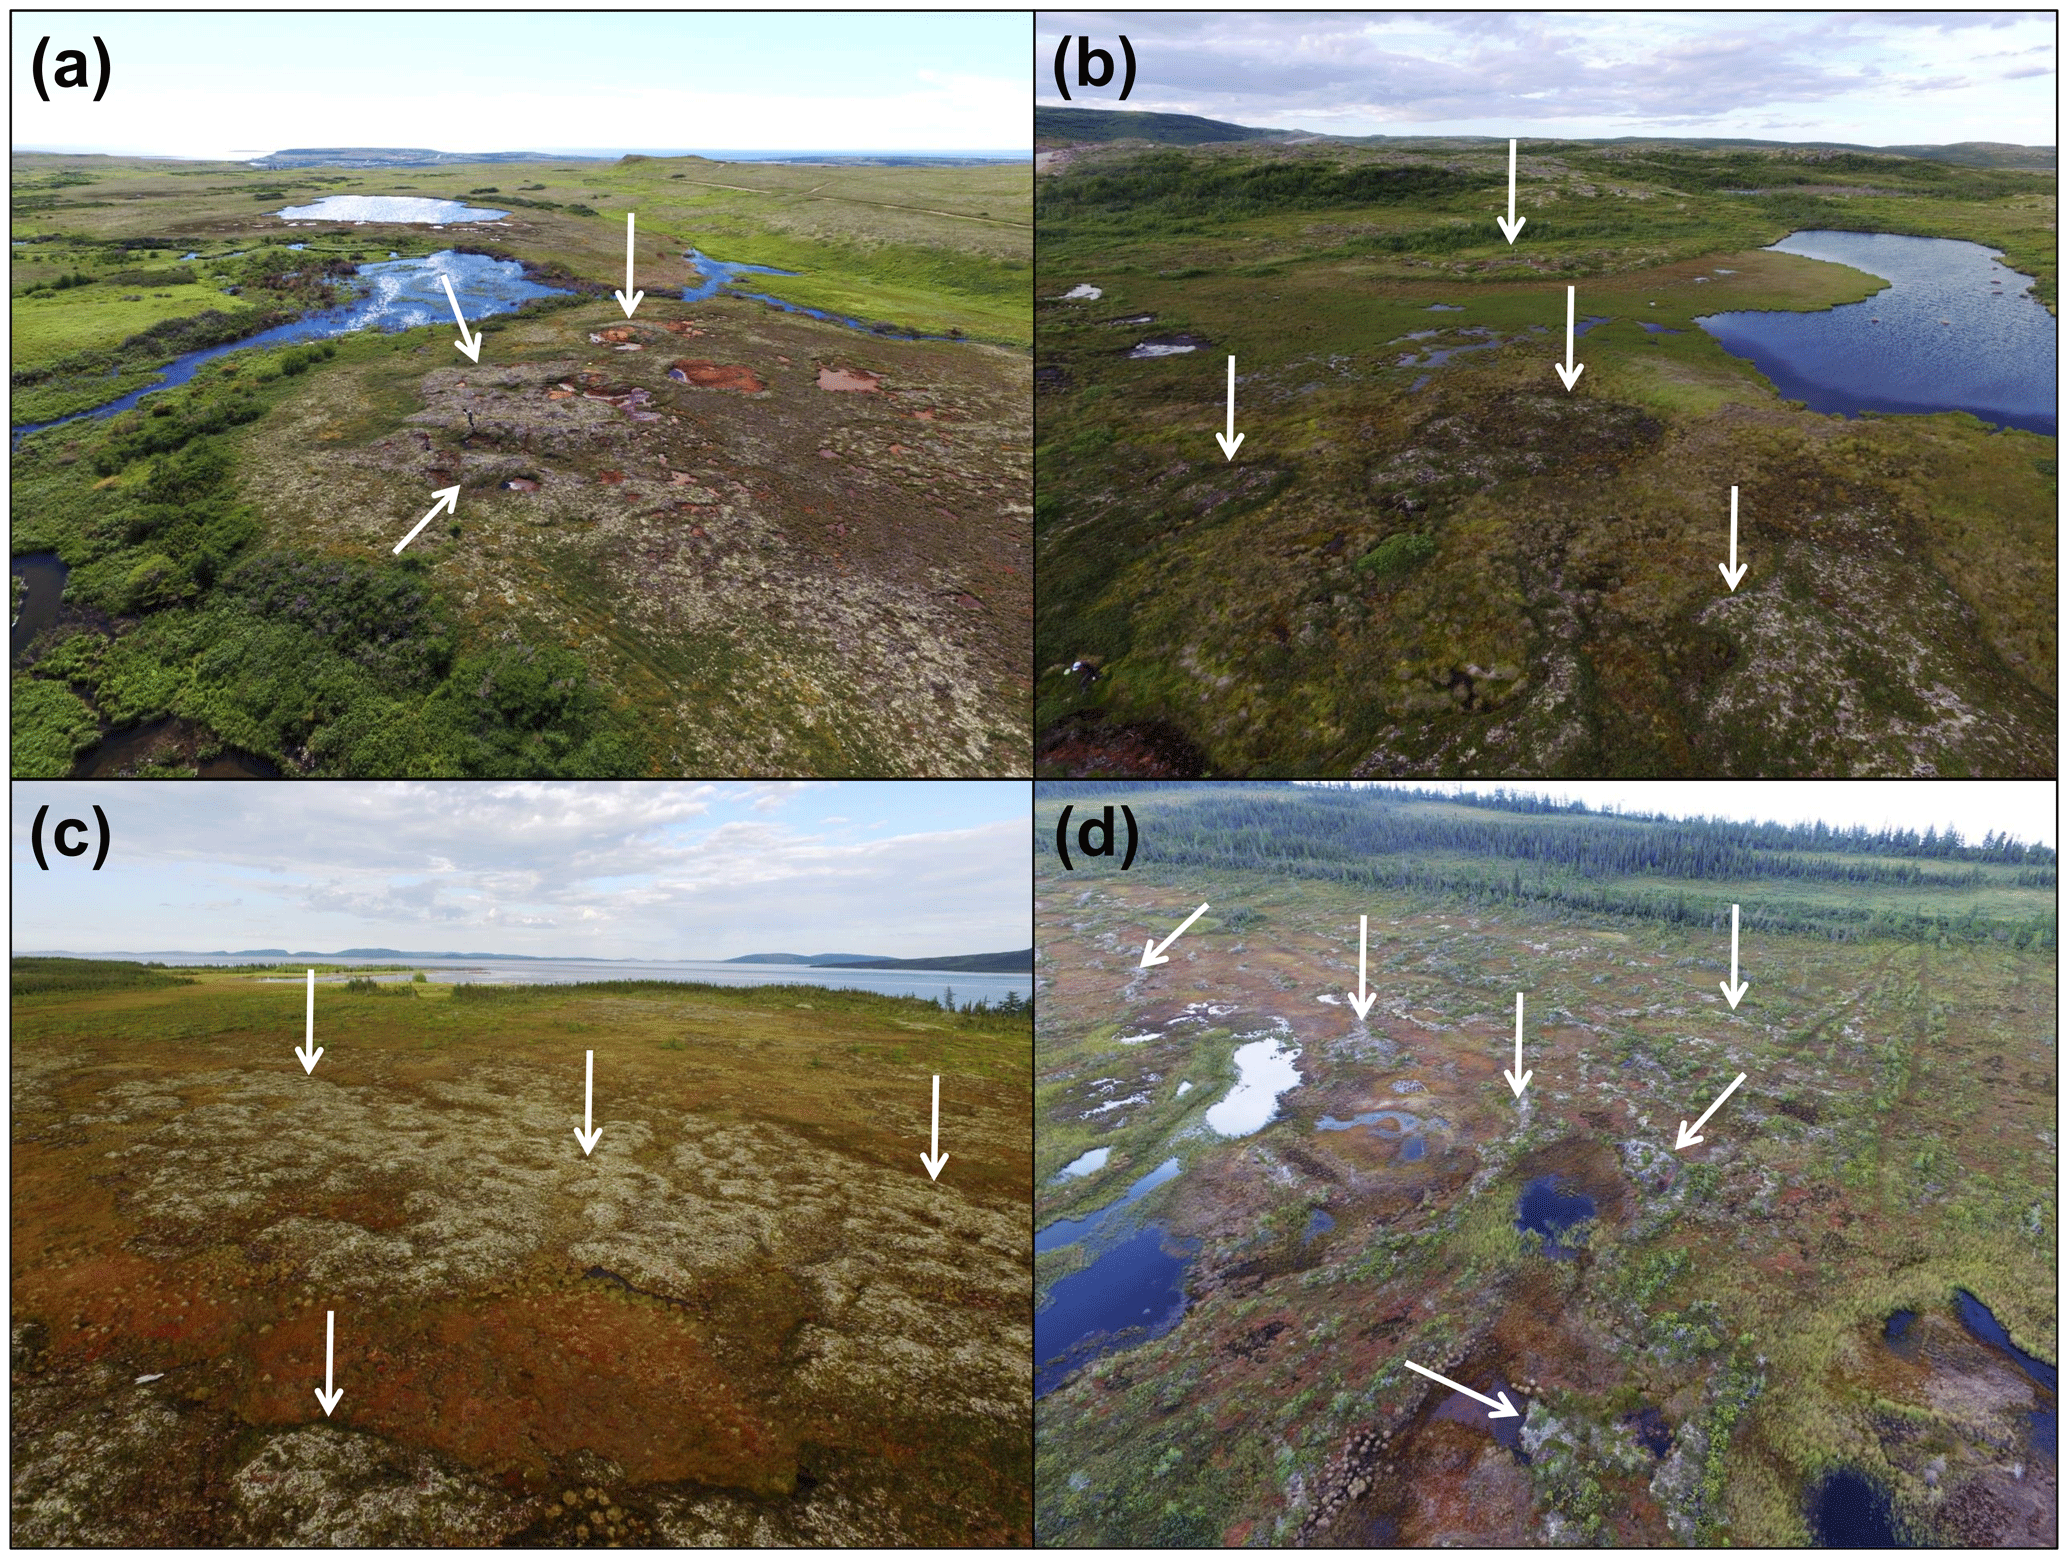
Figure 2Low-altitude unmanned aerial vehicle (UAV) imagery of peatland permafrost sites at (a) Blanc-Sablon, QC; (b) Red Bay, NL; (c) Main Tickle, NL; and (d) Neveisik Island, NL. White arrows point to examples of permafrost-cored mounds.
A group of five mounds, 0.4–1.4 m high and up to ∼16 m in diameter, were investigated at a wetland site located 3.5 km north of Blanc-Sablon (Fig. 2a). The mounds were mostly lichen-covered with a few herbs, but some had bare peat surfaces and evidence of wind abrasion and surface cracking. Grasses and sedges were the dominant ground cover in depressions in between the mounds and shallow standing water was present at some locations. Shrubs 10–20 cm high, including blueberry and Labrador tea, were present on the sides of the mounds and in the adjacent terrain. Average air temperature (2015–2017) was +0.5 ∘C and snow depths on top of the mound reached 15 cm in late winter. Ground temperature at the borehole averaged +1.5 ∘C at the surface and −0.7 ∘C at 1 m of depth (Fig. 3c). Temperatures were positive at the bottom of the borehole and the permafrost base was estimated to be at a depth of between 3.5 and 4.2 m. The median frost table depth on the elevated mounds was 63 cm (11 September 2015) while full frost probe penetration (120 cm) was possible in depressions and on all portions of the ERT transects without mounds (Fig. 3). At several of these locations, however, probing detected 15–30 cm of frozen ground approximately 40 cm below the surface that could be penetrated with effort, and which was underlain by unfrozen soil to 120 cm of depth.
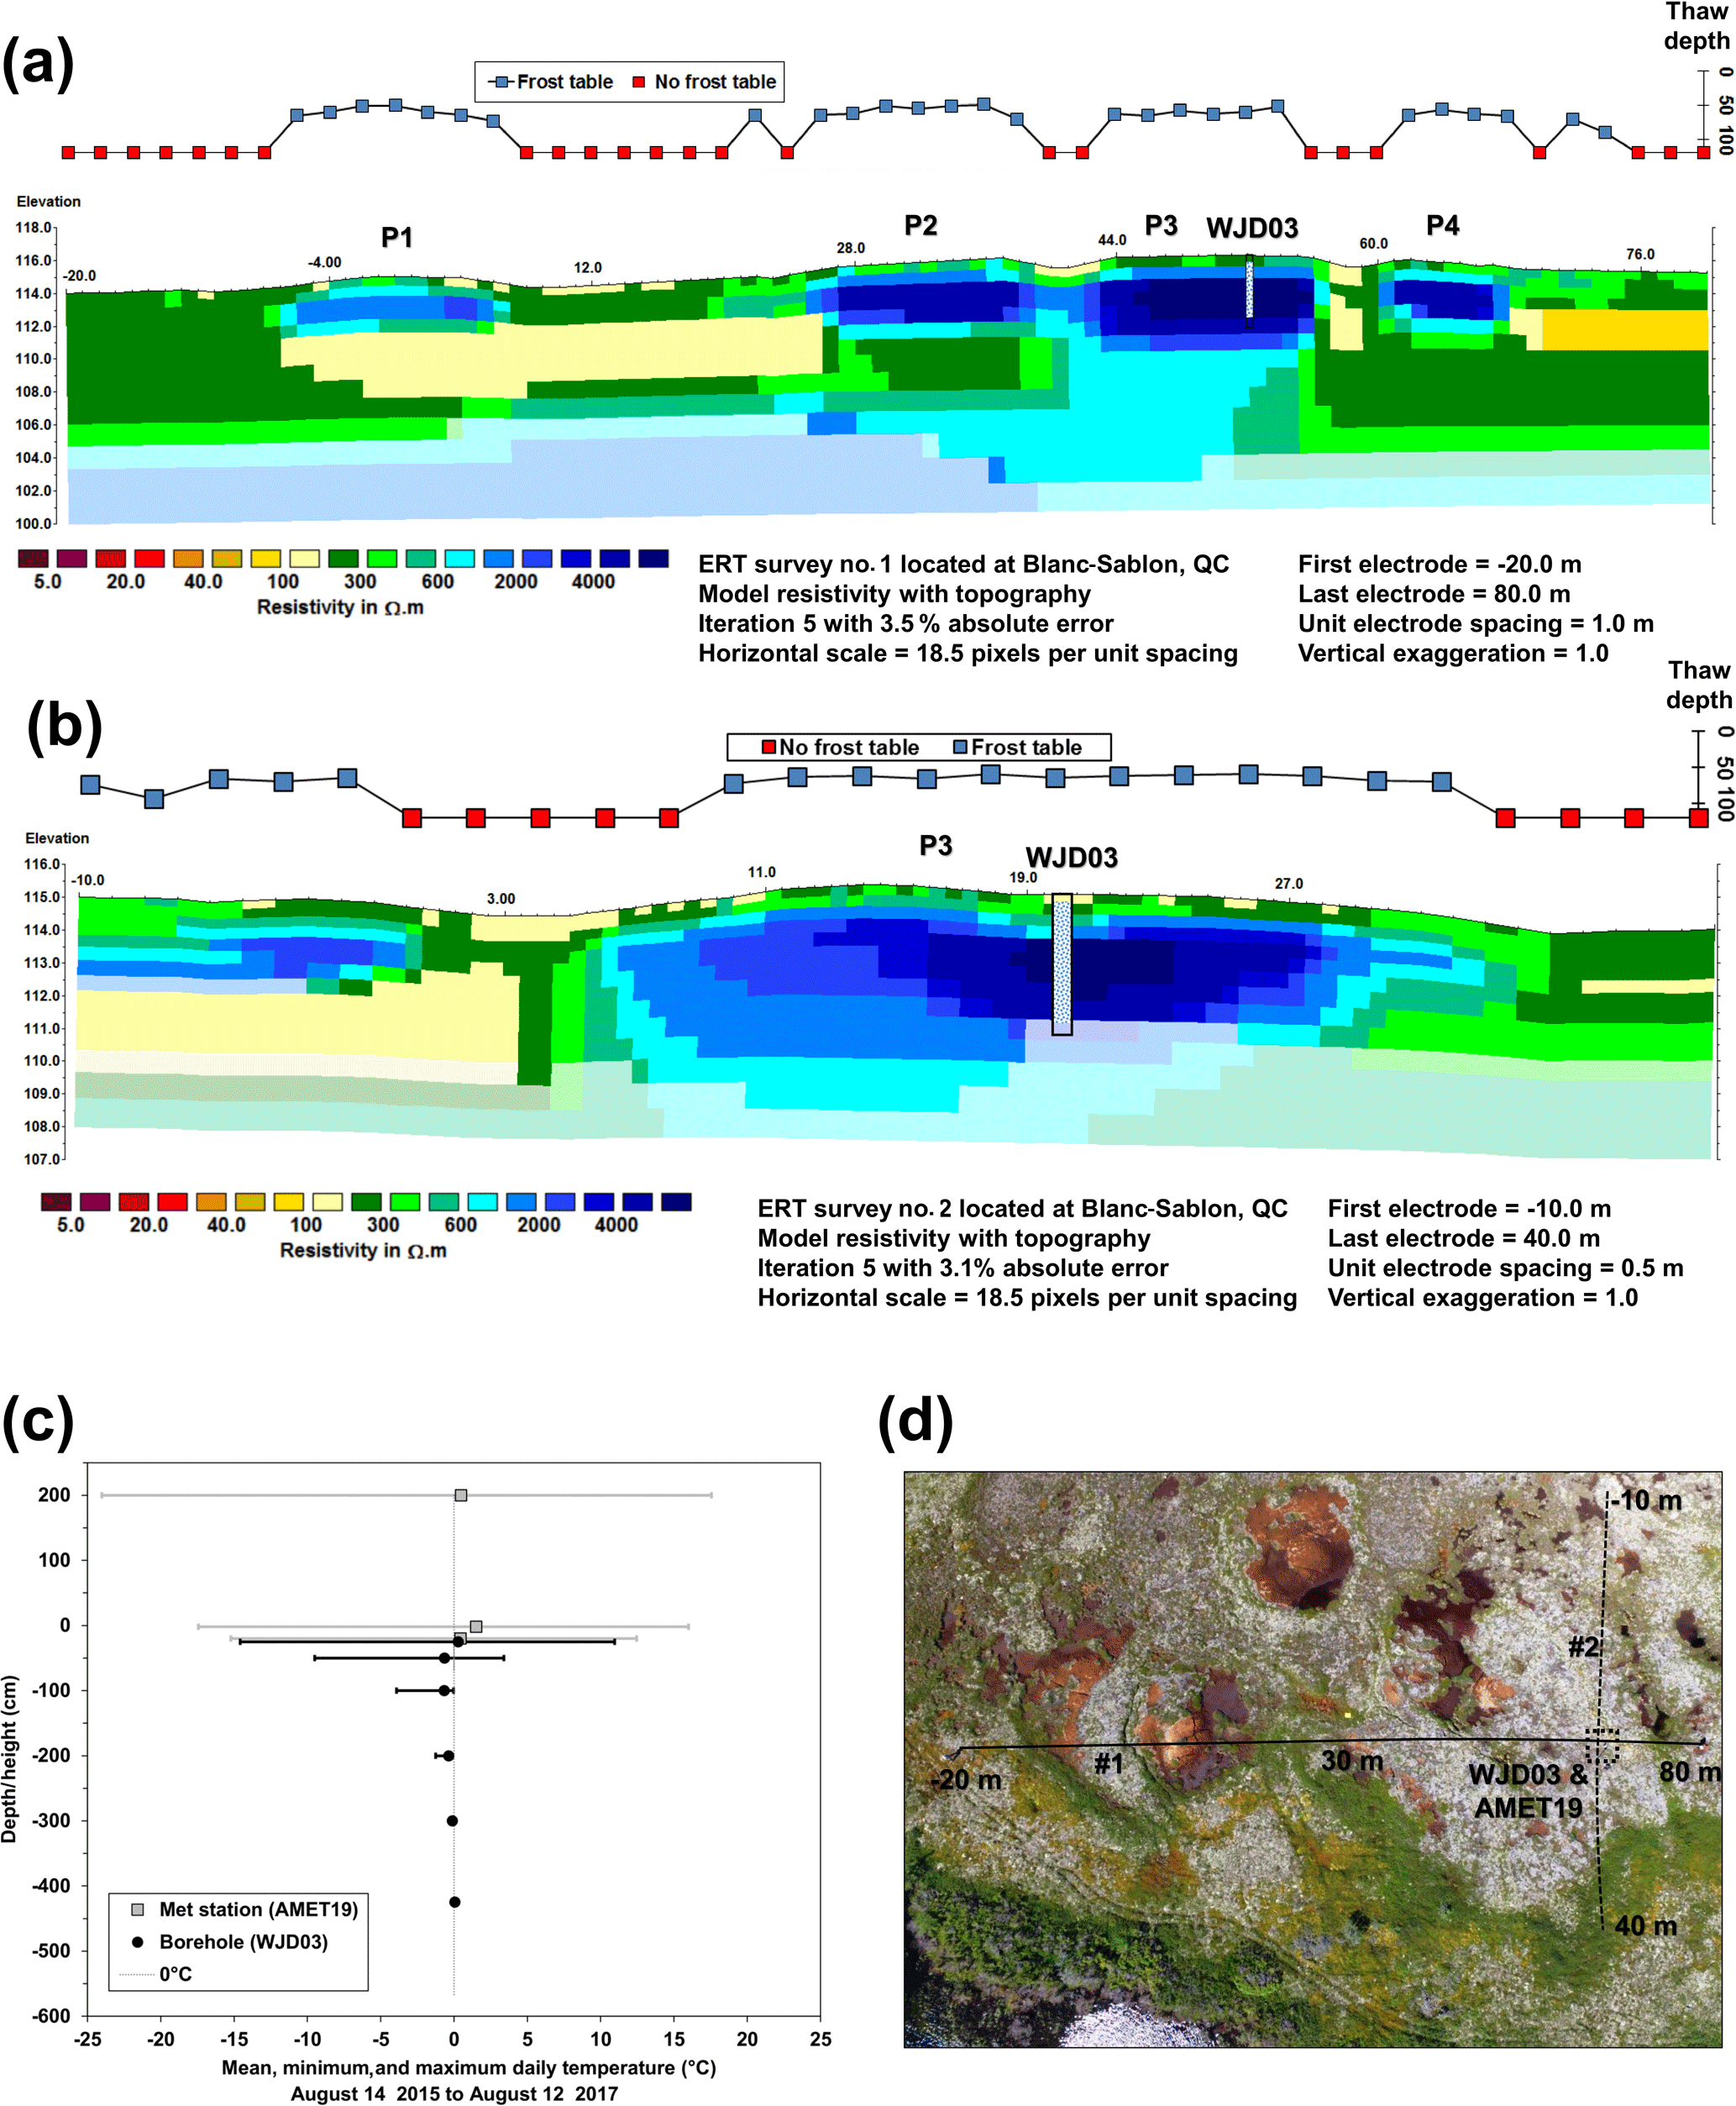
Figure 3Peatland permafrost at Blanc-Sablon. Frost tables and modelled resistivities on (a) ERT profile 1 and (b) ERT profile 2. Depths with permafrost in the borehole are denoted by hatching. (c) Air and ground temperature envelopes (2015–2017). (d) UAV vertical image of the site. Black lines delimit the approximate location of the ERT survey lines and text shows the start and end points.
ERT profile 1 crossed four mound crests while profile 2 ran perpendicularly across a mound complex that included the climate monitoring station and the borehole (Figs. 2a, 3d). Both ERT surveys showed positive resistivity anomalies beneath mounds that end at the edges of the adjacent depressions (Fig. 3a, b). Resistivities >600 Ωm extended to depths of 3.4 m (P1), 4.5 m (P2), and 4.3 m (P4) on profile 1, and to the base of the survey below P3 on both profiles 1 and 2. Resistivities <400 Ωm were typical for the near-surface layer and in depressions among the mounds as well as at a depth beneath P1 and P4.
The field observations and the borehole temperatures lead to the conclusion that the mounds are palsas. The resistivity boundary between frozen and unfrozen ground was inferred to be between 500 and 600 Ωm, giving permafrost thicknesses of 2.3–3.3 m (P1), 3.4–4.4 m (P2), and 3.2–4.2 m (P4) (Table 3). Permafrost thickness beneath P3 was more challenging to interpret as profile 1 indicated high resistivity values extending to the base of the profile whereas co-located ground temperatures showed unfrozen ground at 4.25 m. The higher-resolution profile 2 showed low sensitivity values (Fig. 3b) beneath the borehole but high resistivity values nearby that suggest frozen ground may be deeper away from the borehole. Considering the accuracy of the ground temperature loggers (±0.2 ∘C) and uncertainty inherent in the ERT, the permafrost thickness beneath P3 was estimated to be between 4 and 8 m with our best estimate being approximately 6 m.
The thin layer of frozen ground found at some locations without mounds was interpreted to be a remnant of seasonal frost, but given the September survey date and colder climate during the monitoring period (relative to the prior decade), it may have persisted throughout the thaw season, thereby potentially becoming permafrost. Ground temperatures averaged 1.0 ∘C (35 cm of depth) and 0.6 ∘C (60 cm of depth) at two upland tundra locations 250 m northwest of WJD03 and AMET13 (Table 1). Despite signs of surface wind abrasion, suggesting low snow cover in winter, and the presence of patterned ground in mineral soil (sorted circles and steps), these data indicate that permafrost was absent.
4.1.2 Red Bay, NL
A wetland with low mounds, about 2 km north of Red Bay and adjacent to the Trans-Labrador Highway, was instrumented with a climate monitoring station and borehole. The mean air temperature was +0.8 ∘C (2015–2017), late-winter snow depth was 25 cm, and ground temperatures averaged +1.7 ∘C (near-surface), −0.7 ∘C at 1 m, −0.01 ∘C at 3 m, and +0.3 ∘C at 4.2 m of depth (Fig. 4b). Permafrost was therefore present at the borehole between depths of ∼0.5 and 3.5 m.
Two ERT profiles were undertaken. Profile 3 traversed four mounds, 0.3–1 m high, with lichen and herb cover, shrubs up to 25 cm high on the sides of the mounds, and some exposed peat on the crests, terminating in an adjacent wetland (Figs. 2b, 4). Sedges and grasses were present in wetter portions at the beginning and end of the profile. Frost tables were encountered continuously beneath the elevated surface of the mounds (median thaw depth: 54 cm on 12 September 2015) whereas full probe penetration was possible in most other areas (Fig. 4a). Exceptions to this occurred from 1 to 14 m and from 68 to 80 m along the profile where a frozen soil layer (median depth: 60 cm) up to 40 cm thick and overlying unfrozen ground were present. Surprisingly, this thin frozen layer was encountered even in vegetated areas covered by shallow standing water.
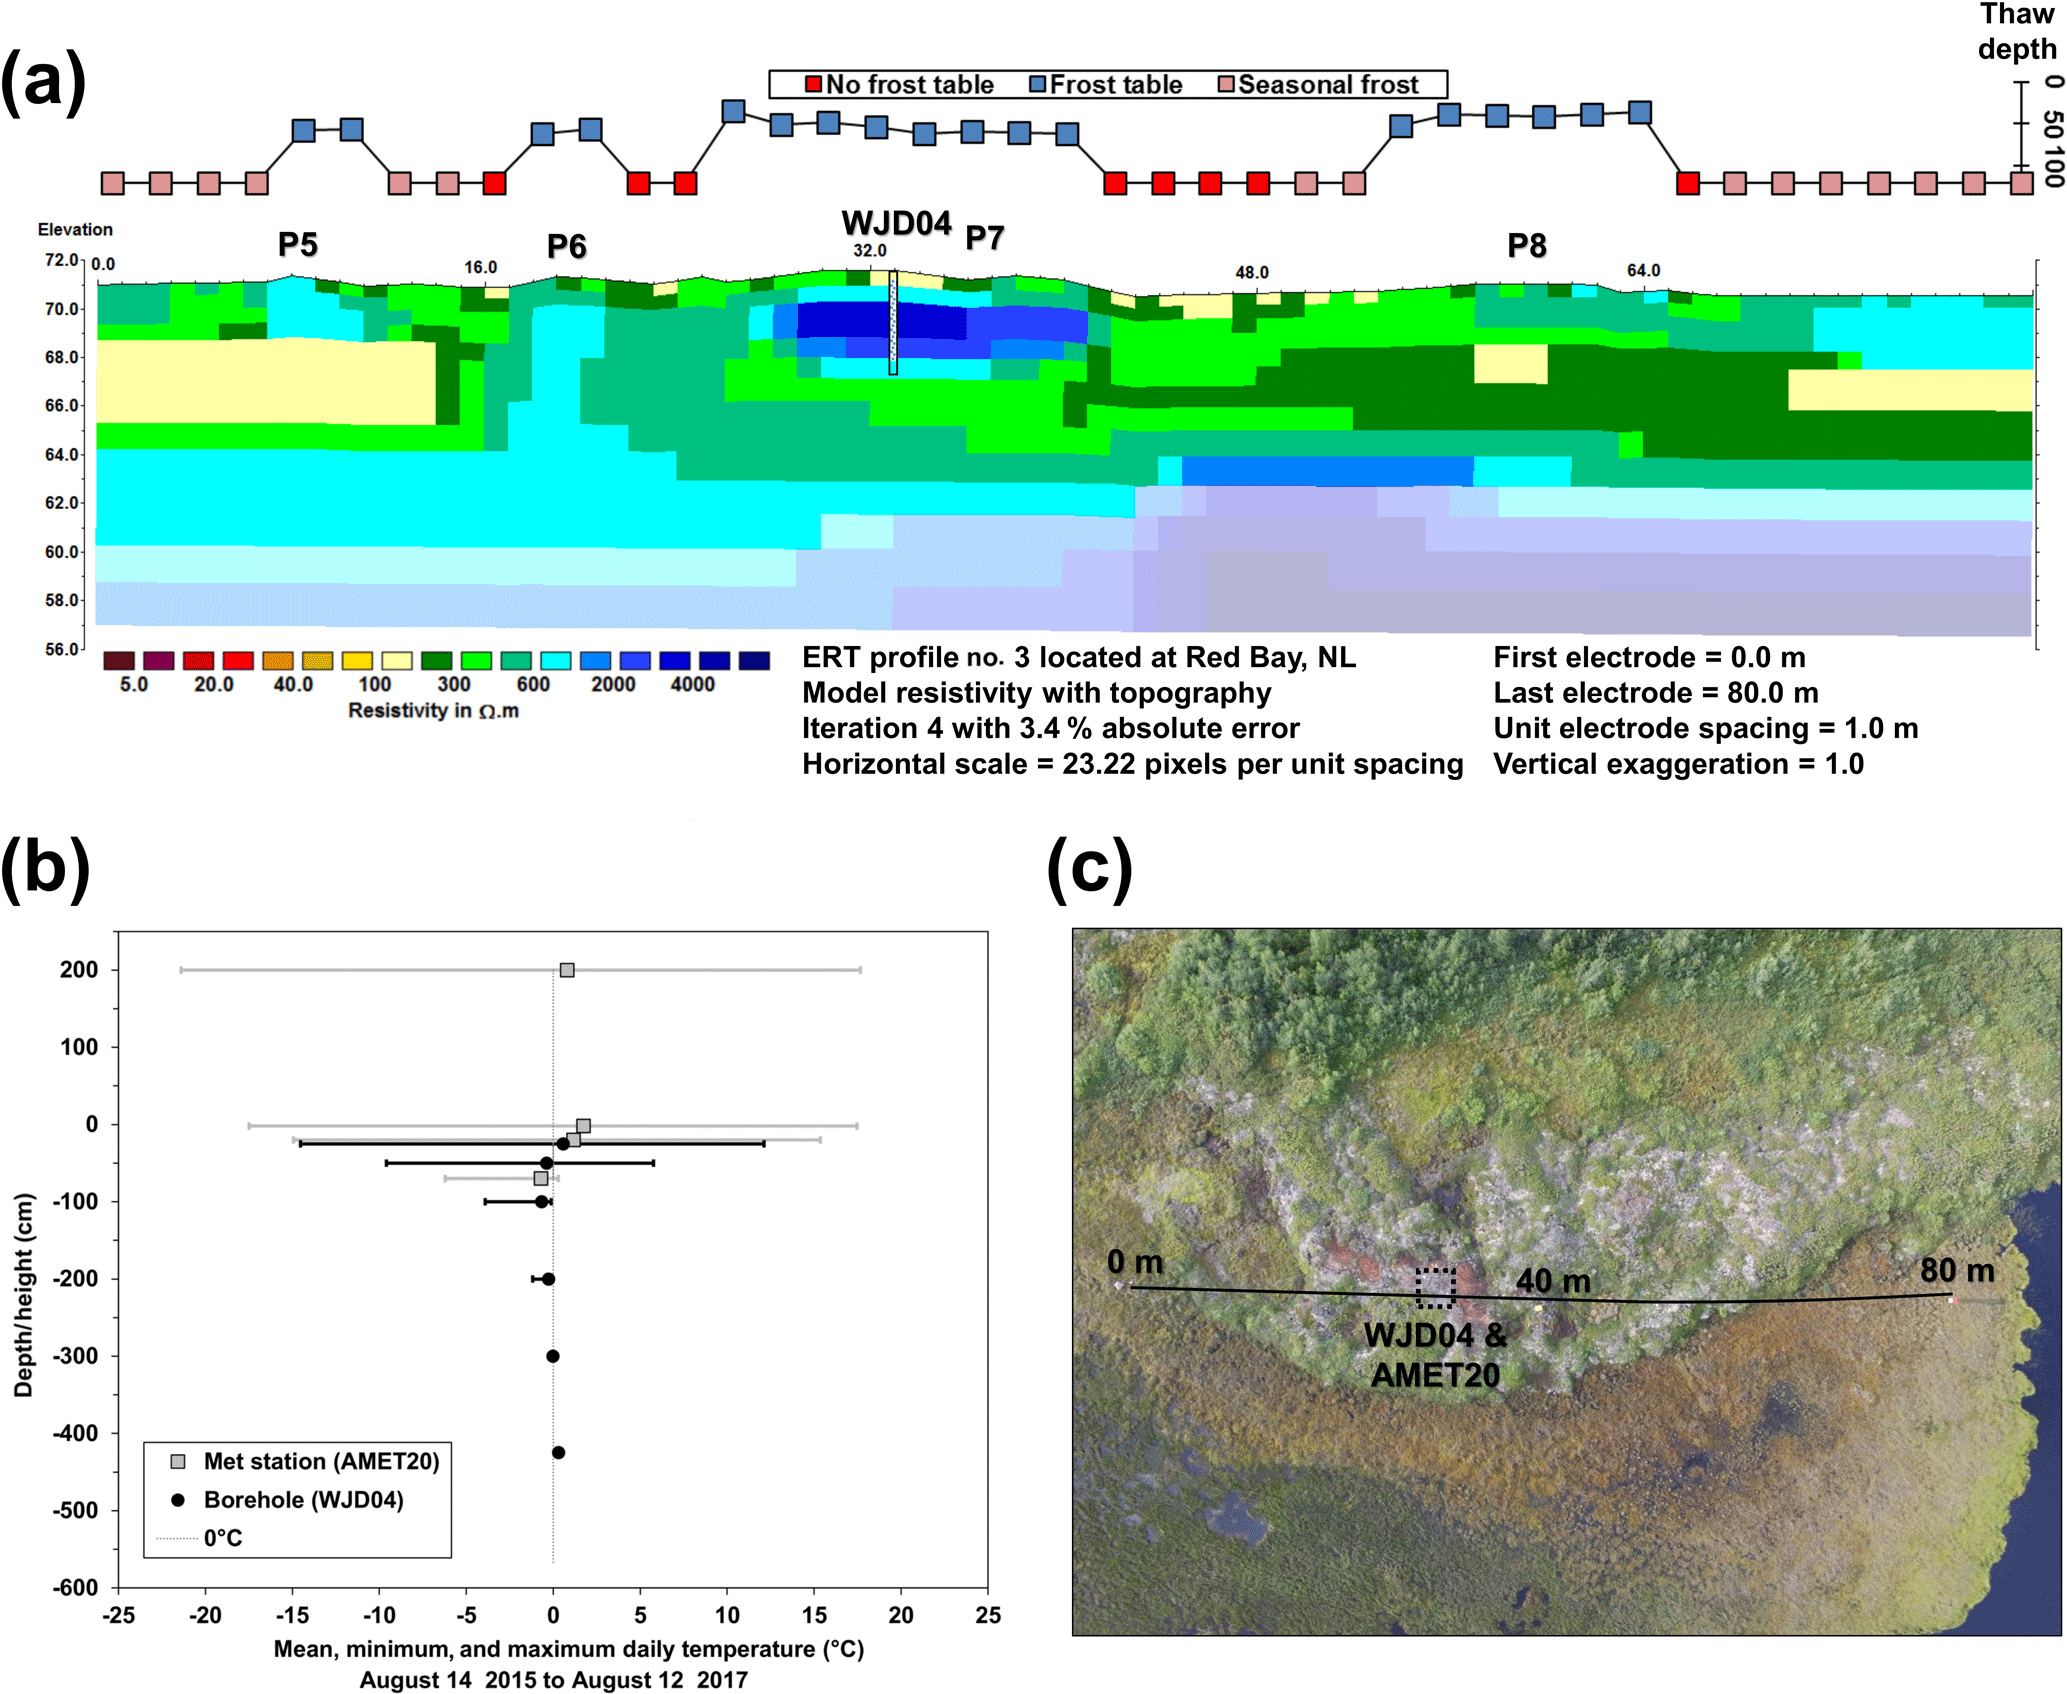
Figure 4Peatland permafrost at Red Bay. (a) Frost tables and modelled resistivities on ERT profile 3. Depths with permafrost in borehole WJD04 are denoted by hatching. (b) Air and ground temperature envelopes (2015–2017). (c) UAV vertical image of the site. Black line delimits the approximate location of the ERT survey line and text shows the start and end points.
Profile 4 was perpendicular to profile 3 on the opposite side of the main wetland depression, beginning among mounds in the depressed wetland and ending upslope in drier peat-covered terrain (Fig. 5). Peat and lichen cover dominated on the mounds, and there were low grasses and sedges with some low shrubs in the wetland. Probing revealed frozen ground beneath the mounds (median thaw depth: 63 cm) but not in the areas in between (Fig. 5a). Frost tables were also encountered continuously along the gently sloping peat-covered area (median thaw depth of 64 cm).
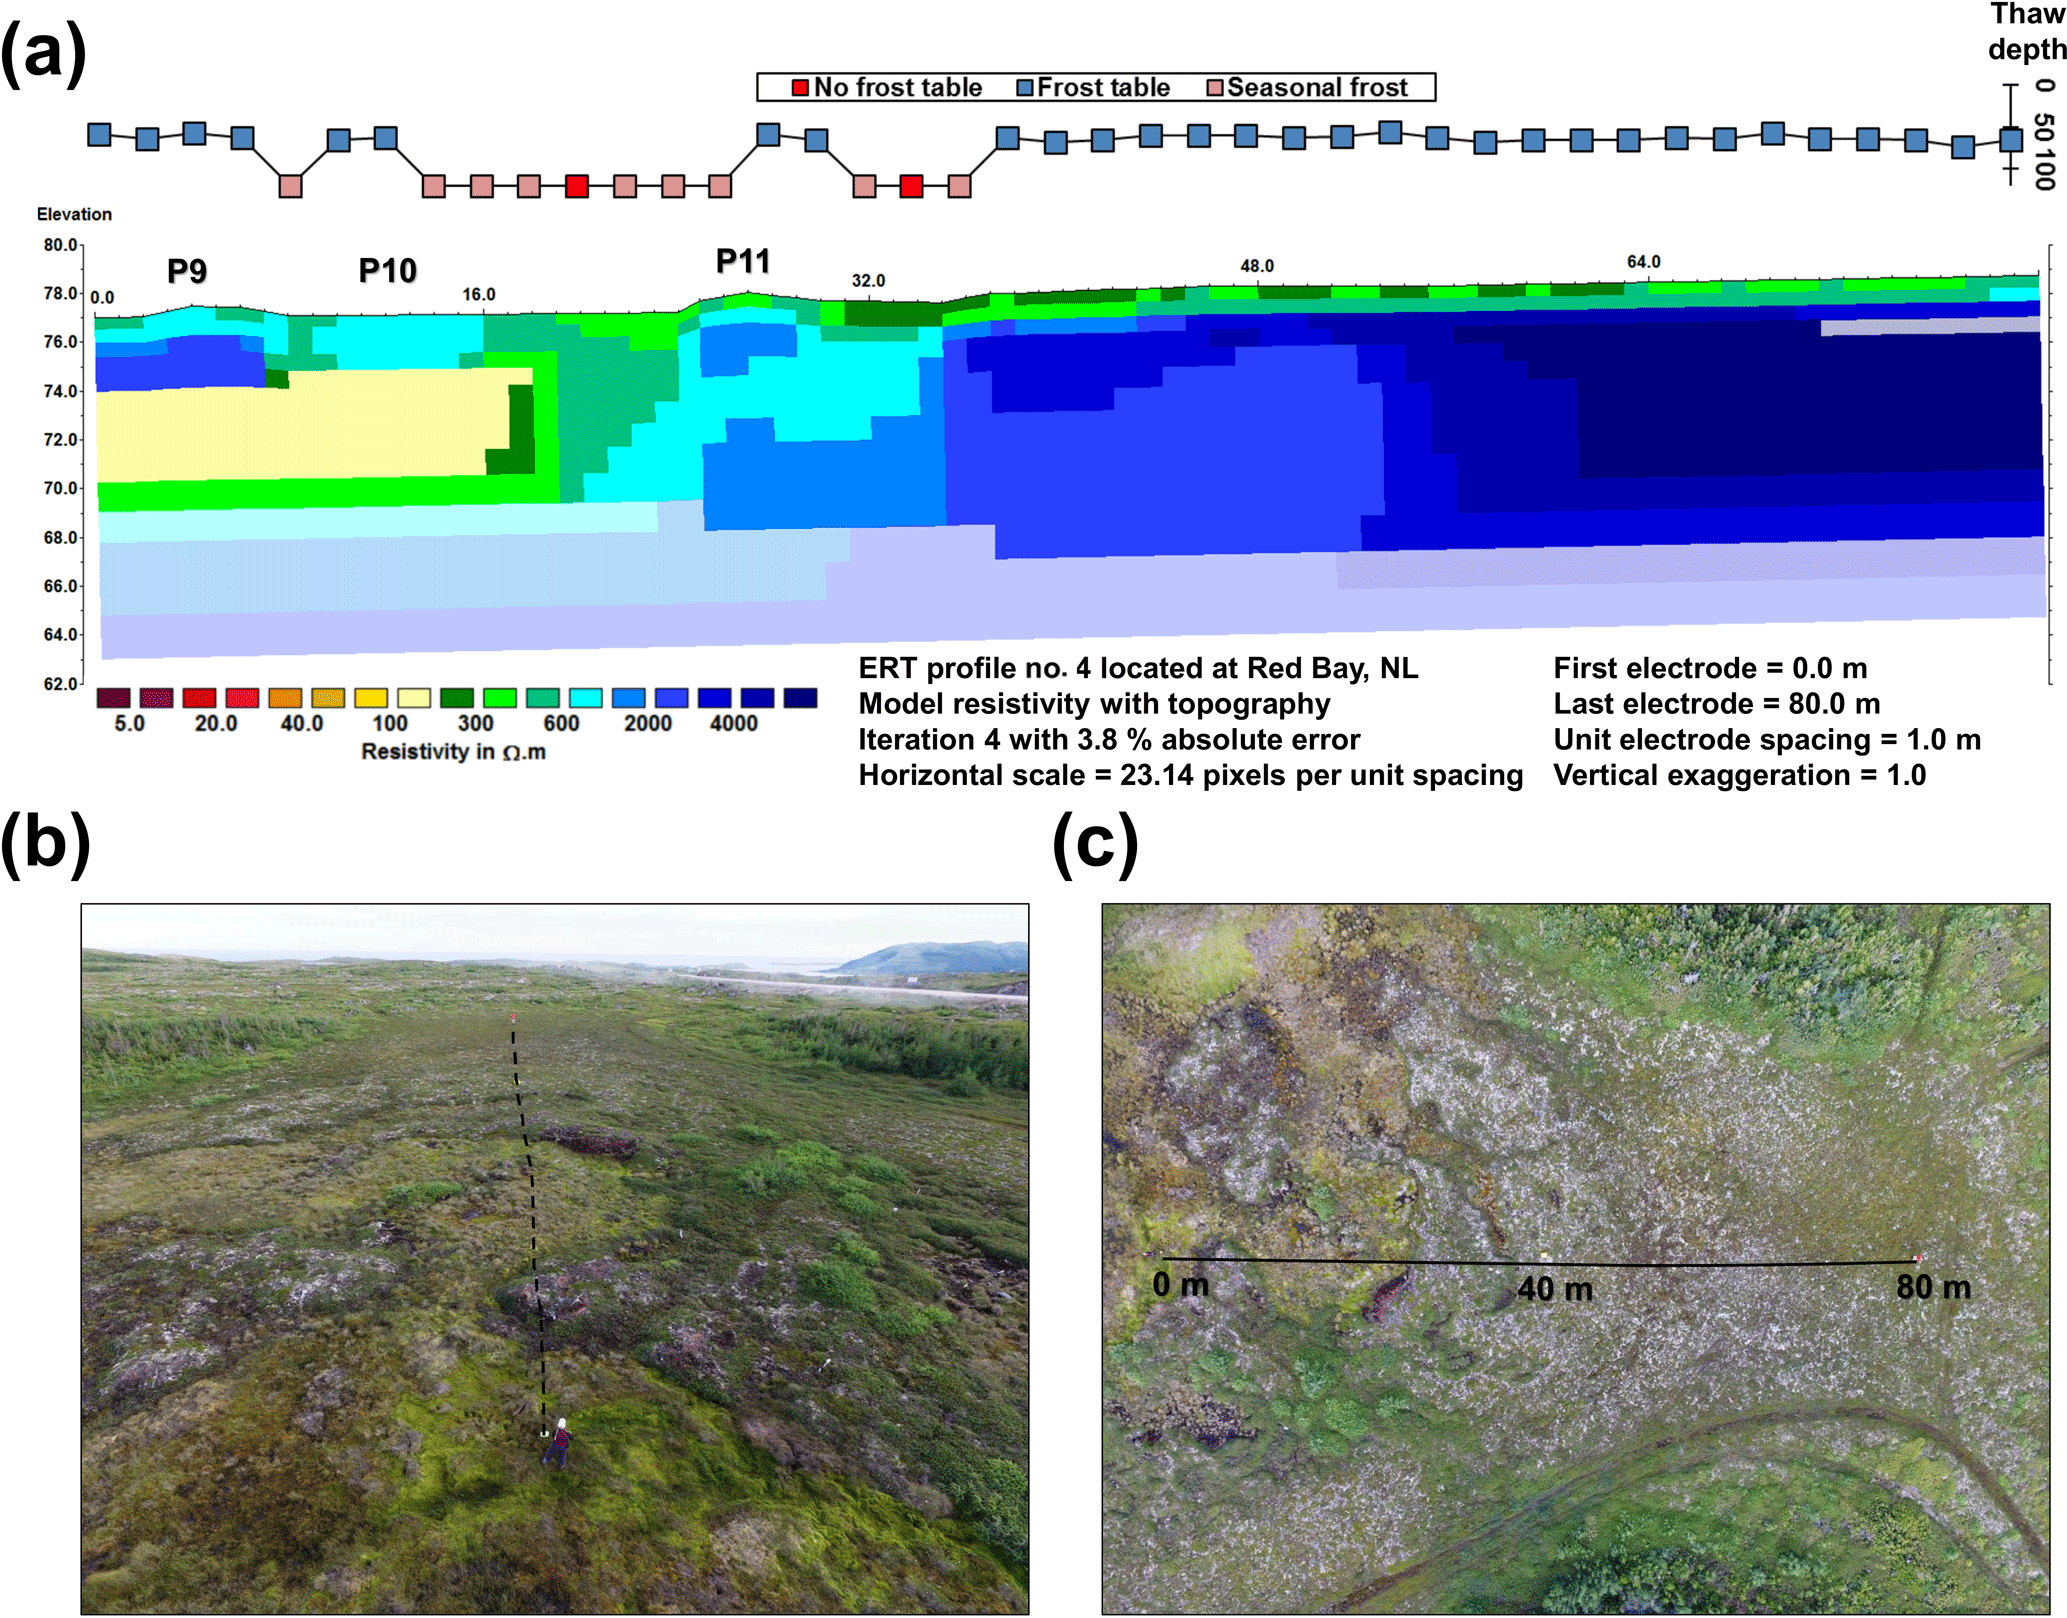
Figure 5Peatland permafrost at Red Bay. (a) Frost tables and modelled resistivities on ERT profile 4. (b) Oblique aerial photo upslope along ERT profile 4 from the survey start point. Dotted black line delimits location of ERT survey line. (c) UAV vertical image of the site. Black line delimits the approximate location of the ERT survey line and text shows the start and end points.

Figure 6Peatland permafrost at Cartwright. Frost tables and modelled resistivities on (a) ERT profile 5 and (b) ERT profile 7. UAV vertical images of (c) ERT profile 5 and (d) ERT profile 7, with black lines delimiting the approximate location of the ERT survey lines and text showing the start and end points.
Profile 3 exhibited high-resistivity anomalies (>600 Ωm) centred beneath four mound crests, with the highest values (>4000 Ωm) beneath P7 (Fig. 4a). The positive anomalies extended to depths of 2–4 m (Fig. 4a) (Tables 3, S2) and were generally underlain by resistivities of less than 200 Ωm. However, higher resistivities extended to the base of the profile beneath P6 and there was a continuous high-resistivity layer at the base of the profile, albeit with low sensitivity in the model. Profile 4 also showed positive resistivity anomalies beneath three low mounds, to depths of 2–4 m beneath P9 and P10, and to the base of the profile at P11, at locations where a frost table was encountered. A high-resistivity body (>1000 Ωm) overlain by lower surface values was also evident beneath the second half of the profile and extended to the base where it joined a layer with high apparent resistivities but low sensitivity in the model.
The field observations and temperature data demonstrate the presence of patchy peatland permafrost at the Red Bay site. The mounds are palsas and the boundary resistivity between frozen and unfrozen ground was between 500 and 600 Ωm, giving inferred permafrost thicknesses of 0.3–5.1 m on the two profiles (Tables 3, S2). The base of permafrost could not be identified beneath P6, nor beneath the peat-covered slope at 38–80 m on profile 4. However, given the distinctly lower resistivities in the unfrozen surface layer, the measured frost table depths, the peaty soil, and the presence of a surface bedrock exposure upslope of the end of the profile, it is inferred that permafrost was present and that it extended to the bedrock in this part of profile 4.
4.1.3 Cartwright, NL
Three raised bogs containing low peat mounds were investigated in and around the community of Cartwright (Tables 3, S2). The average air temperature was −0.2 ∘C (2015–2017), the near-surface temperature on top of one mound was +1.2 ∘C ,and late-winter snow depths on the mound crest were 25 cm. Ground temperatures in borehole WJD02 on top of a mound about 100 m from the climate station averaged −1.7 ∘C at 0.5 m, and then warmed with depth to −1.4 ∘C at 1.0 m and +0.3 ∘C at 4.25 m, indicating a permafrost base at approximately 3.6 m, as also observed during water-jet drilling. Temperatures in a shallower borehole (WJD01) about 70 m to the southeast were similar down to its base at 2.15 m. A total of seven ERT profiles were undertaken in the three bogs (Table 3, profiles 5–11). We present results for two long surveys (profiles 5 and 7) (Fig. 6) and a third shorter survey (profile 9) that traverses borehole WJD02 (Fig. 7).
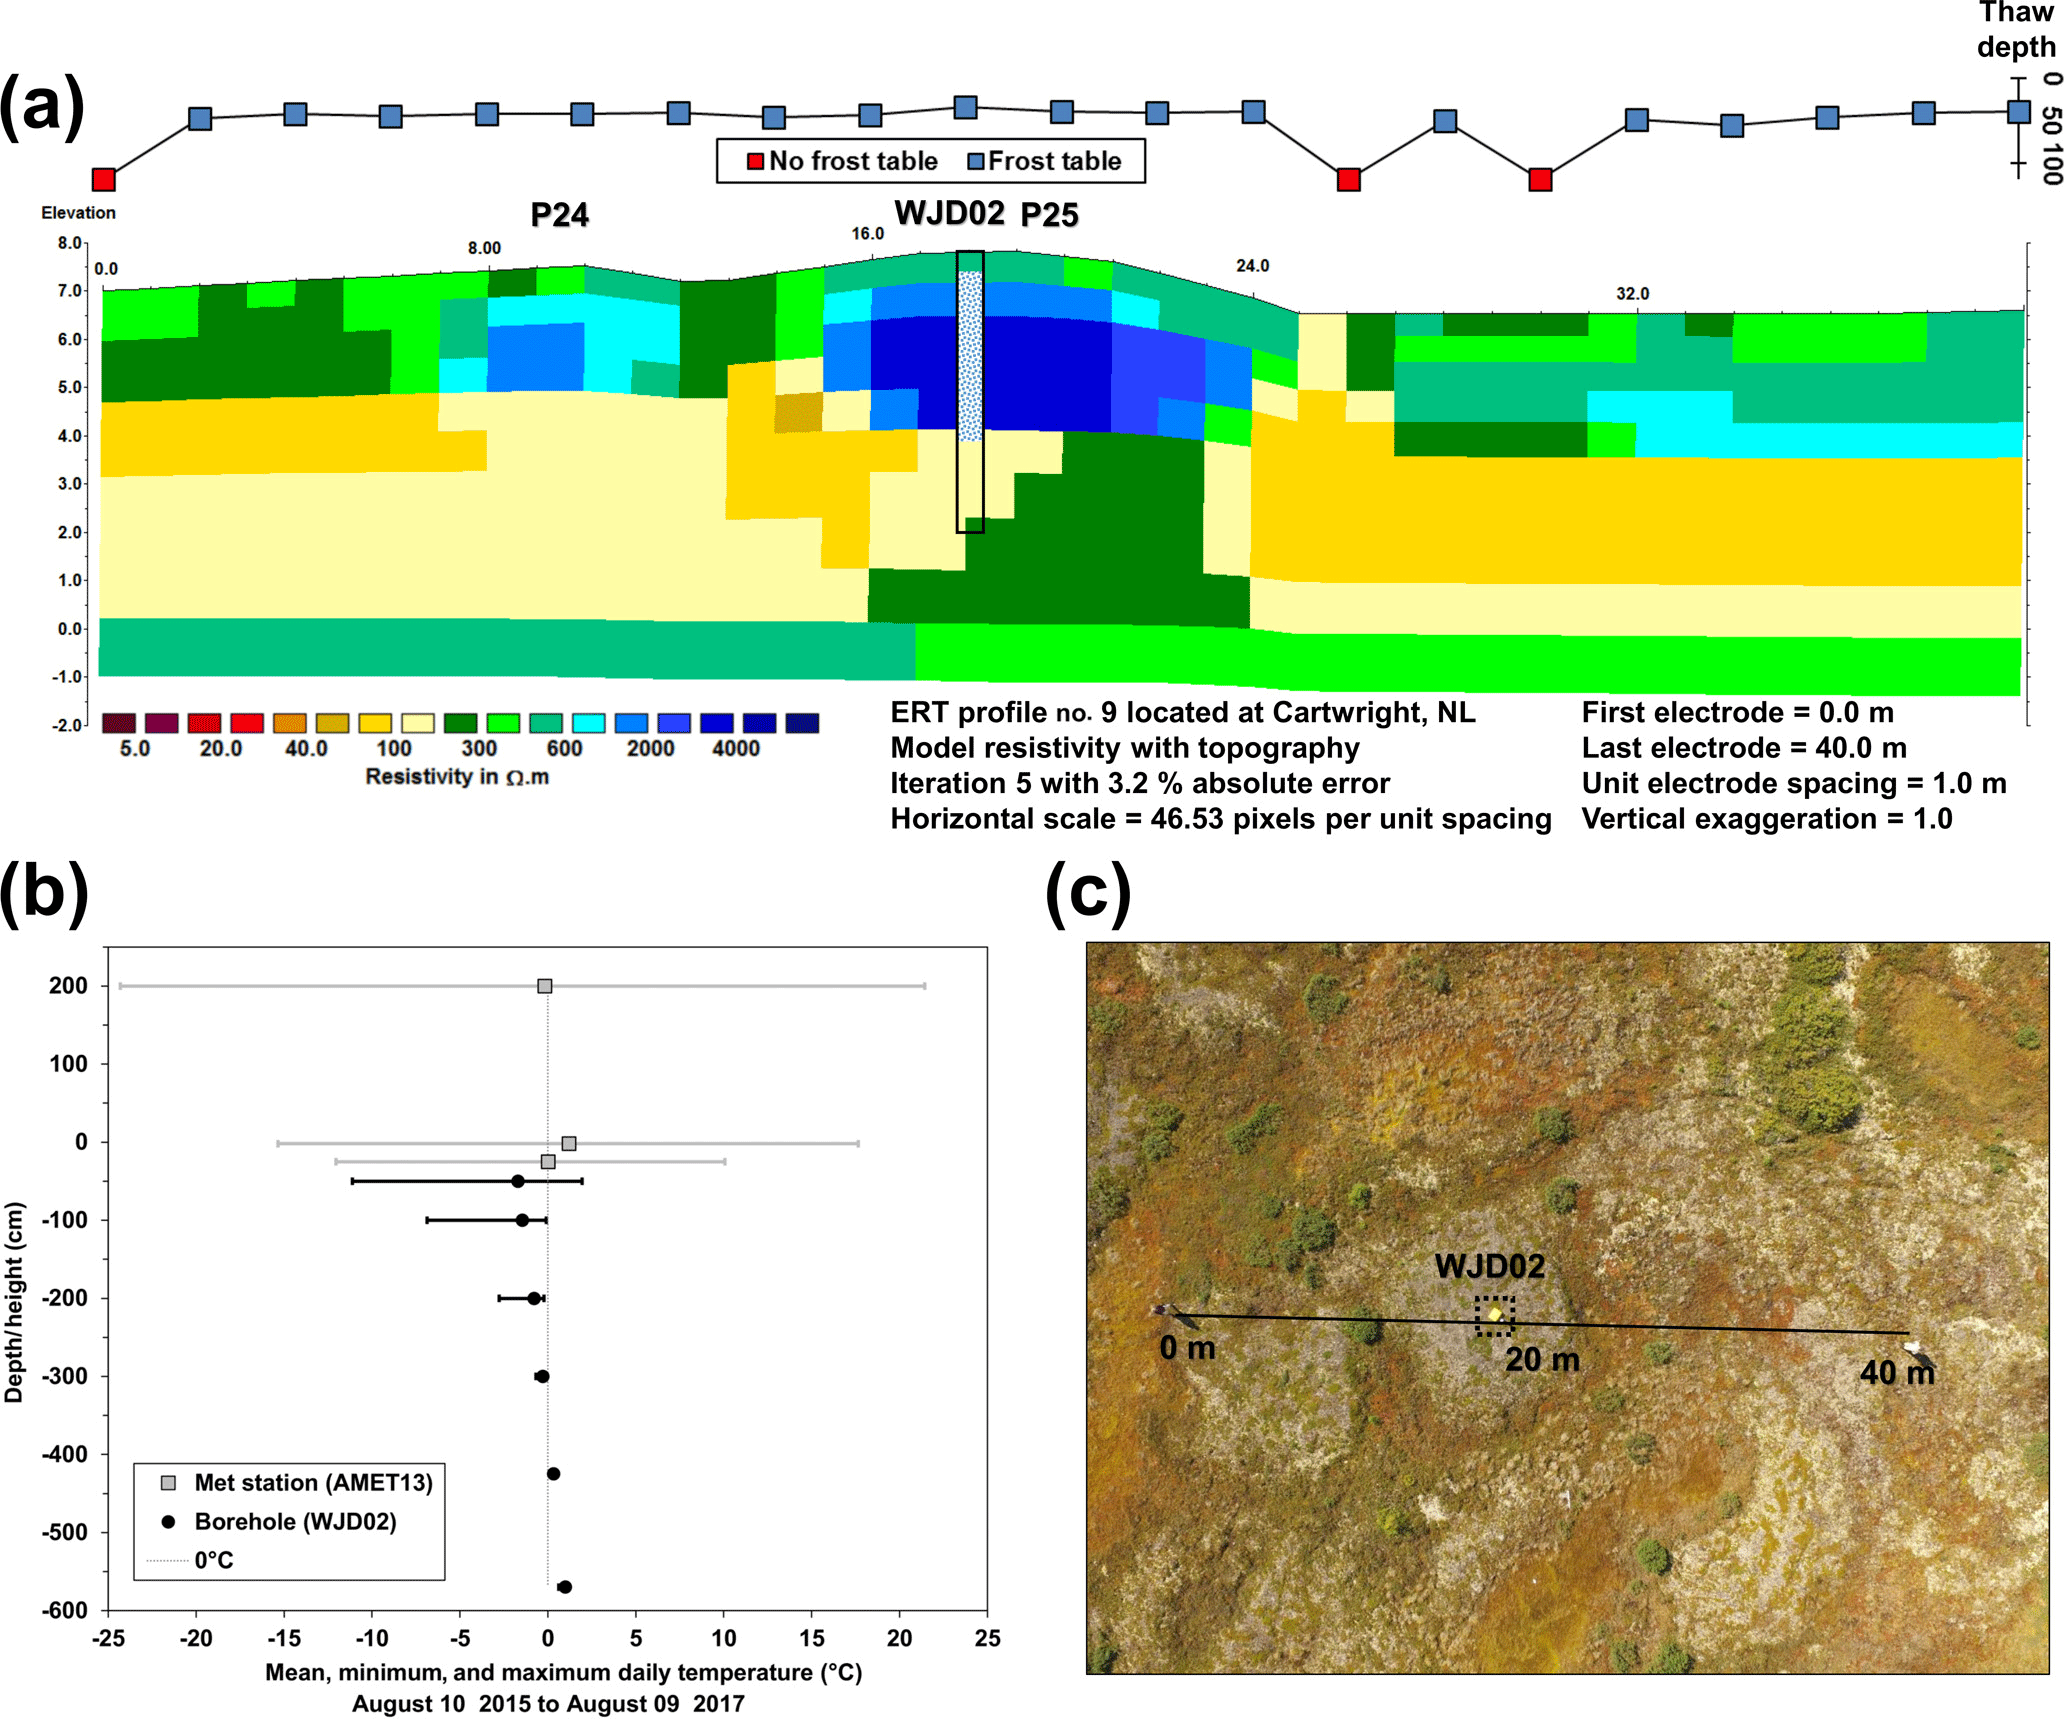
Figure 7Peatland permafrost at Cartwright. (a) Frost tables and modelled resistivities on ERT profile 9. Depths with permafrost in borehole WJD02 are denoted by hatching. (b) Air temperature (from nearby station AMET13) and ground temperature envelopes (2015–2017). (c) UAV vertical image of the site. Black line delimits the approximate location of the ERT survey line and text shows the start and end points.
Profile 5 traversed numerous small elevated peaty areas and six larger peat mounds ranging in height from 0.3 to 1.3 m (Fig. 6c). The surface cover was primarily lichens and exposed peat in drier areas and low-to-medium-height shrubs in wetter zones. Shrubs were taller towards the end of the 240 m long survey and transitioned to white spruce forest at the edge of the bog. Frost tables were measurable beneath elevated peat mounds and at some locations with slightly elevated dry peat, and the median thaw depth in these areas was 45 cm (22 July 2014) (Fig. 6a). Full probe penetration occurred wherever the peat was moist or standing water was present. Modelled resistivities ranged from less than 10 Ωm in the near-surface at the start of the profile to greater than 6000 Ωm at depths below 10–12 m (although most of these values were in low-sensitivity parts of the model). Positive resistivity anomalies were evident beneath six peat mounds (P12–P17) with values between 600 and 4000 Ωm (Fig. 6a). Resistivities of 200 Ωm or less were present at greater depths beneath the mounds and in adjacent areas across all but the last 50 m of the profile. Resistivities >4000 Ωm extending from the near-surface to the base of the profile between 222 and 240 m and across almost the whole profile at a depth of 8–10 m were interpreted as bedrock based on the local geomorphology (Fig. 6a).
Profile 9 was a detailed survey of two mounds, 0.3–0.6 m high, across borehole WJD02 in the same bog as profile 5. Ground cover was similar, with exposed peat and lichens on the mound and low shrubs and mosses in the wet depressions. Frost tables were measurable at all but three spots along the profile with a median depth of 43 cm (24 July 2014) (Fig. 7a). Modelled resistivities exceeded 1000 Ωm to depths of 2 m beneath P24 and 3.5 m beneath P25, with a continuous lower-resistivity layer at the ground surface. A sharp decline in resistivities to values of 100–300 Ωm occurred at depths of 2.5–3.5 m with a slight increase at the base of the profile. This drop corresponded to the depth of the base of permafrost in the borehole.
Profile 7 was taken in a raised bog on the south side of Cartwright, 100 m from an ocean inlet (Fig. 6d). The profile started in medium-to-high shrubs and scattered white spruce trees and then traversed an elevated zone of dry peat for 80 m, which included four 0.6–1.0 m high rounded mounds separated by shallow depressions. The surface cover was similar to that in profiles 5 and 9, comprised primarily of lichens and exposed peat in the drier areas and low shrubs in the wetter areas. Frost tables were encountered continuously from −22 m to the end of the profile and these corresponded to the drier peat. The median thaw depth was 40 cm (25 July 2014). Positive resistivity anomalies (>1000 Ωm) were present from the surface to a maximum depth of 5.5 m directly beneath the mounds (Fig. 6b) while a layer of low resistivities (<100 Ωm) was present at greater depths. An increase in the modelled values occurred at the base of the profile but in an area of low sensitivity in the model.
The evidence from the field observations is that the mounds in the raised bogs at Cartwright are patches of peatland permafrost and best classified as palsas. The resistivity boundary between frozen and unfrozen soils was inferred to be between 300 and 400 Ωm. Based on this value, the greatest thickness of permafrost (4.9–5.9 m) was beneath the tallest mound on profile 5 (P14: 1.3 m high) (Fig. 6a, Tables 3 and S2), with the maximum value almost the same beneath P21 on profile 7 (4.7–5.7 m). It is not clear whether there were four separate mounds along profile 7 or local high points on one larger feature because thin permafrost or deep late-lying seasonal frost was present continuously in the elevated peat (Fig. 6b).
Frozen ground was detected only beneath the palsa surfaces and adjacent elevated (dry) peaty terrain, although late-lying seasonal frost was widespread on some profiles. Given the timing of the fieldwork in late July and the relatively cool period of monitoring, it is possible that some of this persisted through the thaw season. Annual ground temperatures measured at or close to the base of the annual freeze–thaw layer (e.g. TTOP; see Way and Lewkowicz, 2018) at a coastal tundra site and two wetland sites without surface peat near Cartwright ranged from 0.7 ∘C (125 cm of depth) to 2.3 ∘C (70 cm of depth), showing that permafrost was absent.
4.1.4 Main Tickle, NL

Figure 8Peatland permafrost at Main Tickle. (a) Frost tables and modelled resistivities on ERT profile 12. Depths with permafrost in borehole WJD05 are denoted by hatching. Note that the colour scale differs from that in Figs. 3–7 to differentiate among zones of high resistivity. Consequently, some green zones on this modified scale are inferred to be frozen. (b) Air and ground temperature envelopes (2016–2017). (c) UAV vertical image of the site. Black line delimits the approximate location of the ERT survey line and text shows the start and end points.
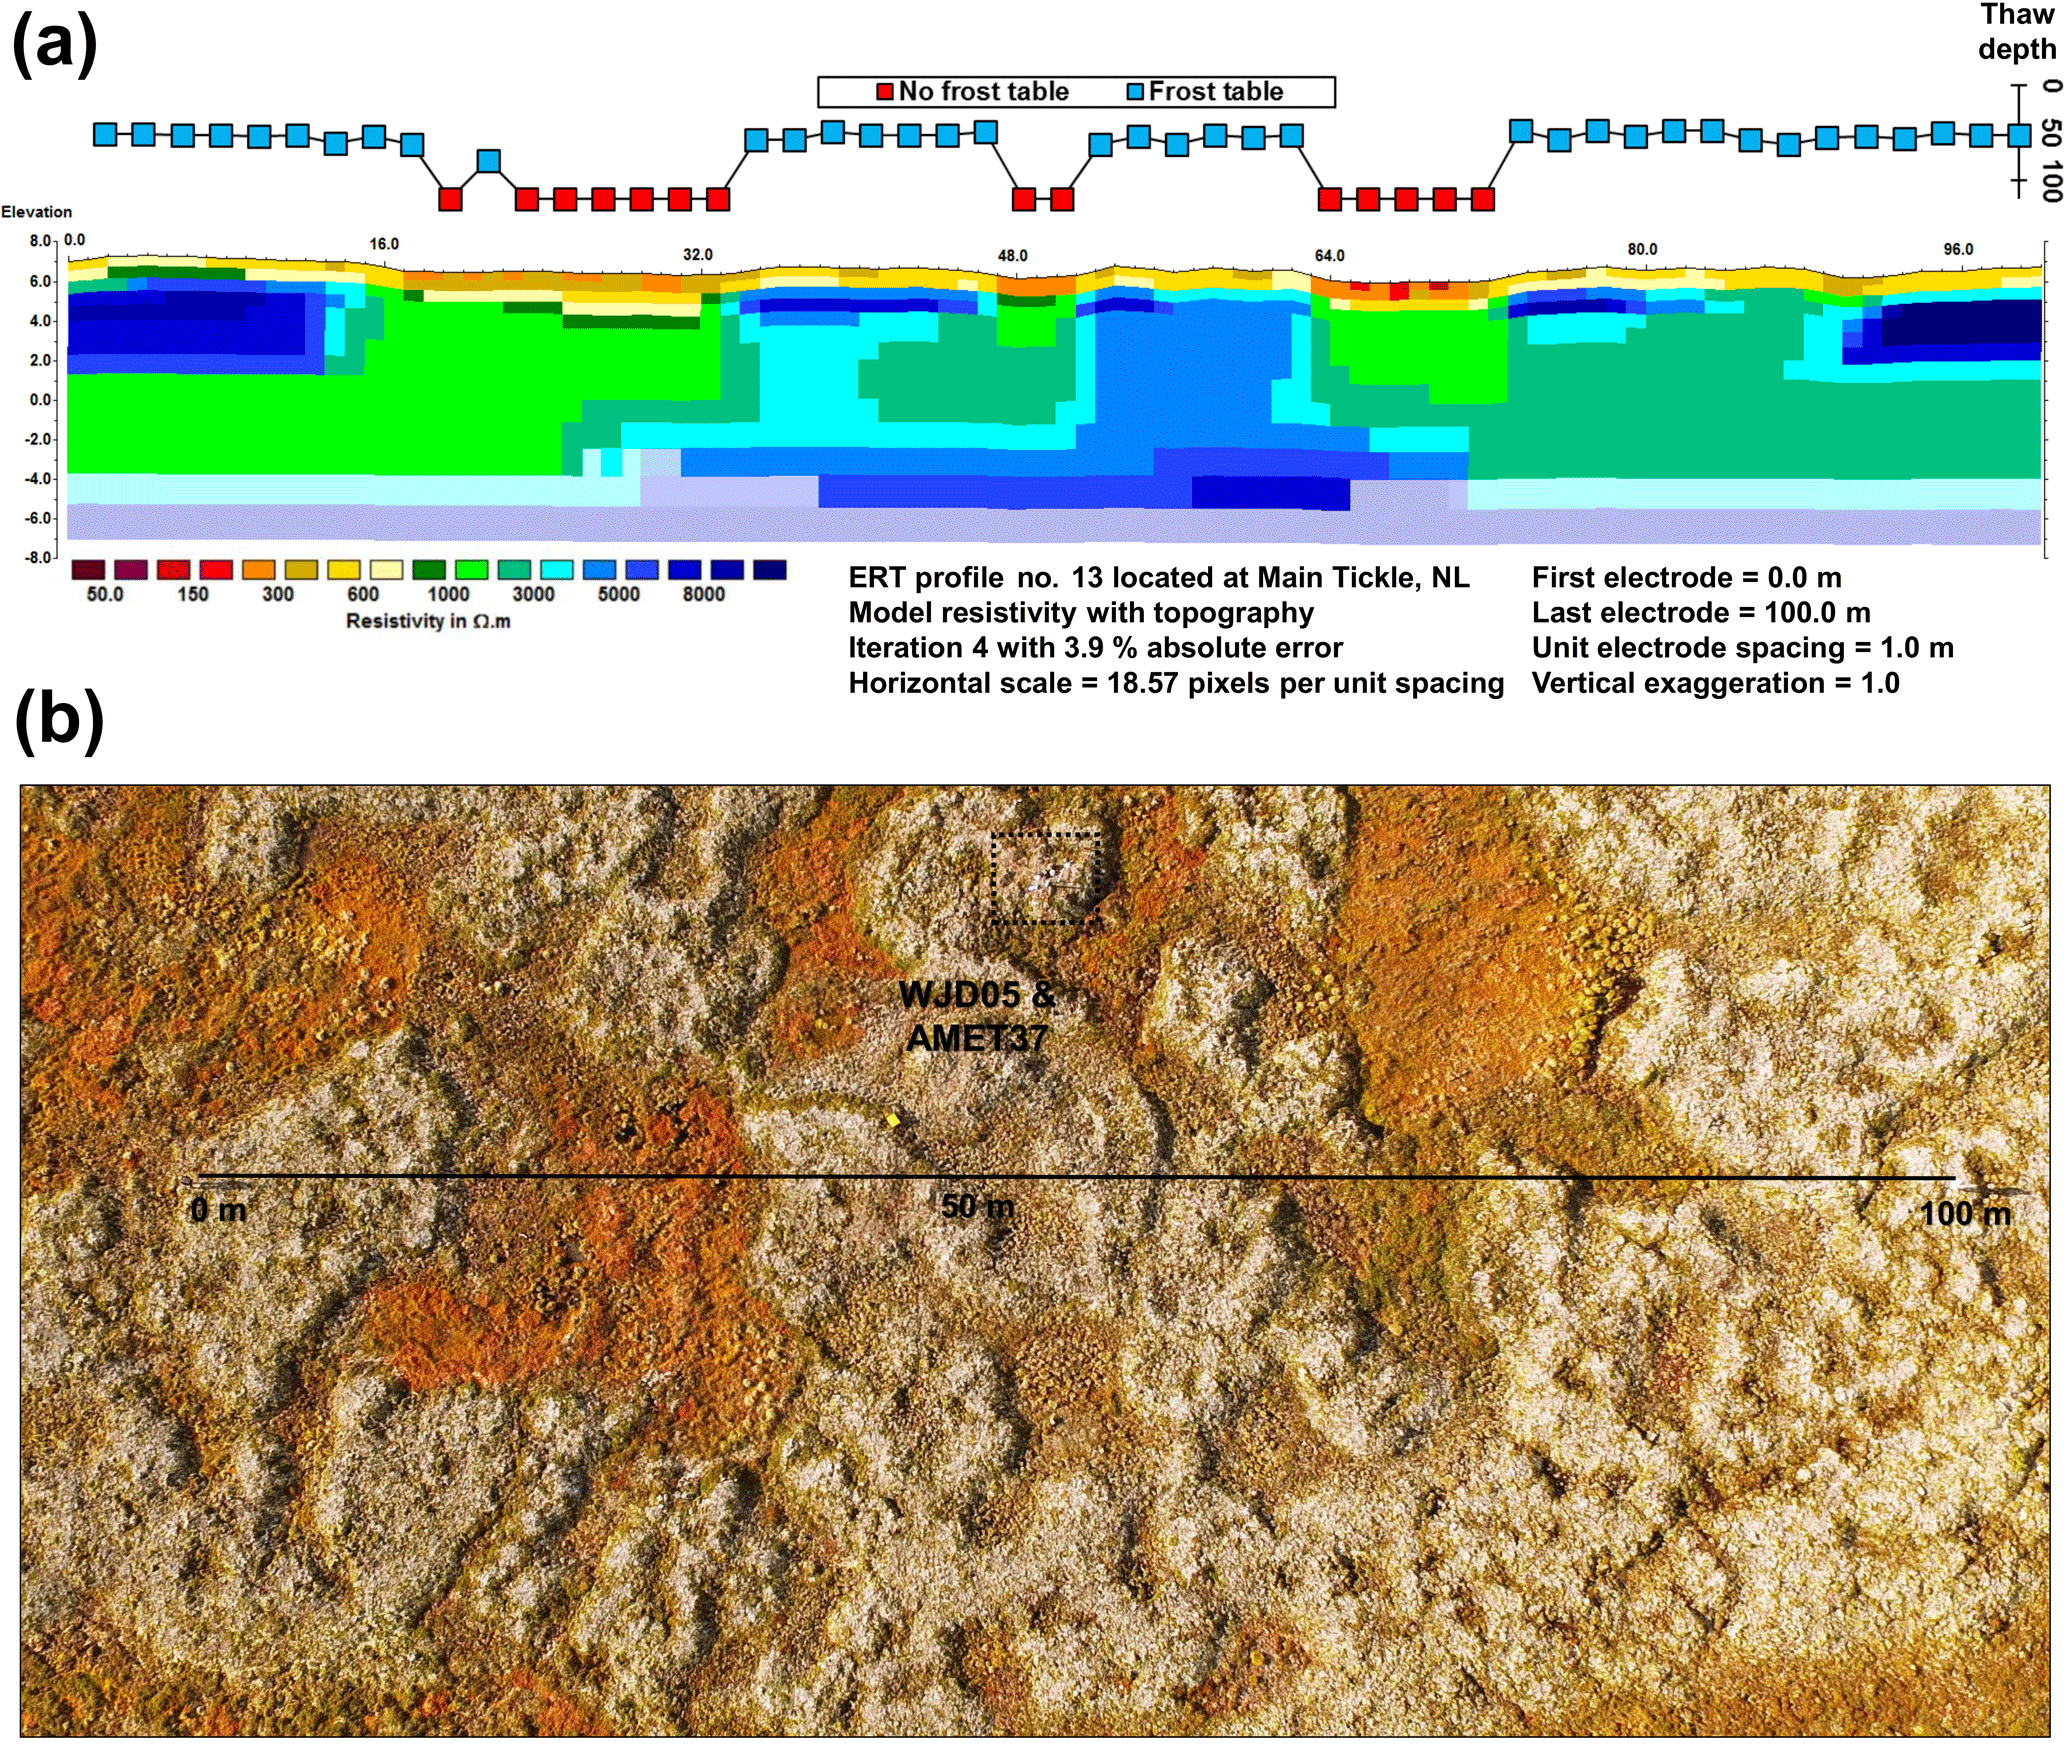
Figure 9Peatland permafrost at Main Tickle. (a) Frost tables and modelled resistivities on ERT profile 13. Note that the colour scale differs from that in Figs. 3–7 to differentiate among zones of high resistivity. Consequently, some green zones on this modified scale are inferred to be frozen. (b) UAV vertical image of the site. Black line delimits the approximate location of the ERT survey line and text shows the start and end points.
The Main Tickle site is a dissected peat plateau complex (0.5–1.0 m high), located 8 km northwest of Cartwright on the northern shore of Sandwich Bay, an inlet of the Atlantic Ocean (Figs. 2c, 8, 9). The plateau (Figs. 8c, 9b) consists of an irregular hummocky surface covering approximately 4 ha within a raised bog that also contains smaller peat mounds 0.5–1 m high. Surface cover comprised lichens, grasses, other herbs, and exposed peat on elevated surfaces while depressions were dominated by sedges and mosses with standing water in some spots. The mean air temperature at the monitoring site on a high point was −1.1 ∘C (2016–2017) while near-surface ground temperatures averaged +0.2 ∘C, both about 1 ∘C lower than at Cartwright. The late-winter snow depth was only 5 cm. The stratigraphy at the borehole, observed during water-jet drilling, was 1.4–1.5 m of peat overlying grey fine sand to coarse silt. Ground temperatures averaged −1.3 ∘C at 1 m and −0.7 ∘C at 1.73 m of depth, while the permafrost table was around 0.7 m (Fig. 8b). These temperatures are lower than at the other borehole locations but should be regarded with caution as they were measured over only 1 year.
ERT profile 12 ran from a shrub-dominated area at the edge of the raised bog across the dissected peat plateau and terminated in a wetland with shallow surface water (Fig. 8c). A detectable frost table (median depth of 58 cm on 9 September 2015) was present across the profile, except at the start and in some isolated depressions (Fig. 8a). Thaw depths increased towards the end of the profile in an area of shallow surface water, but frozen ground was still present. The ERT profile was interpreted as a two- or three-layer system. Resistivities were lowest at the surface of the profile but still exceeded 500 Ωm throughout and exceeded 1000 Ωm in some model blocks. Beneath the surface layer from 32 m to the end of the profile, a layer with resistivities between 800 and 3000 Ωm was present that is interpreted as permafrost. The basal layer, varying in depth from 5 to 20 m and with resistivities exceeding 3000 Ωm, was interpreted as bedrock (which was exposed near the start of the profile) in an unknown thermal state. Based on these interpretations, permafrost was about 7.5–8.5 m thick at the borehole site, extending well below the base of the borehole whose depth was limited by water supply at the time of drilling.
Profile 13 ran perpendicular to profile 12, traversing most of the peat plateau (Figs. 8c, 9b). A 1 m electrode spacing was used to provide greater detail in the near-surface. The median frost table depth in elevated parts of the profile was 53 cm on 9 September 2015 (Fig. 9a). A continuous low-resistivity surface layer was present with values below 300 Ωm (and as low as 20 Ωm) in depressions where there was no detectable frost table. Five discrete positive resistivity anomalies were present beneath this layer in parts of the profile where the surface was elevated, reaching values of 5000 Ωm or more. Values beneath depressions were lower, but still exceeded 1000 Ωm. A high-resistivity layer was present across the profile at a depth of approximately 10 m, but most of this constituted an area of low sensitivity in the inversion model.
Permafrost was interpreted to be widespread beneath the peat plateau at Main Tickle. The resistivity boundary for delineating between frozen and unfrozen ground was 400–800 Ωm but interpretation was complicated by the likely presence of high-resistivity bedrock in an unknown thermal state. Permafrost may have been absent between 0 and 28 m of profile 12 given the lack of a frost table and the probable presence of near-surface bedrock (Fig. 8a). However, permafrost was inferred to be present throughout the remainder of this profile and all of profile 13, reaching bedrock at depths of 8–10 m. Resistivities beneath depressions and shallow surface water exceeded 1000 Ωm, suggesting cryotic conditions but with greater unfrozen moisture contents due to higher temperatures than beneath more elevated parts of the plateau.
4.1.5 Neveisik Island, NL
The most northerly wetland on the transect is on Neveisik Island, located about 60 km from the open Atlantic coast at the northeast end of Lake Melville, a tidal estuary fed by the Churchill and other rivers. Peat mounds were common throughout the wetland but were lower, smaller in areal extent, and more elongated than those observed at the other field sites (Fig. 2d). Vegetation cover was more extensive and higher than at the other sites, with many mounds partially covered by low- to medium-height shrubs. The mounds showed evidence of degradation, with surface cracks and exposed peat, and numerous ponds were present in the uneven terrain (Fig. 2d).
Ground temperatures on a 1 m high mound about 500 m from the coast averaged −0.9 ∘C at 15 cm of depth and −2.3 ∘C at 55 cm (2014–2016). Late-winter snow cover at the site was 15 cm deep. Frost probing at a variety of locations showed thaw depths between 40 and 60 cm for peat mounds (31 July 2014) with complete probe penetration at non-elevated peat covered or vegetated surfaces. Ground temperatures measured at a low shrub site and a wetland site without dry peat cover on the island, respectively, averaged 2.9 ∘C (70 cm of depth) and 1.5 ∘C (100 cm of depth).
The observations at this wetland indicate that permafrost was present beneath the peat mounds, which are best described as palsas, but was absent elsewhere on the island. The ground temperatures measured beneath the mound are surprisingly low for the isolated patches permafrost zone. They reflect cool summer temperatures in this coastal environment and cold winters during which temperatures as low as −12 ∘C were recorded at a depth of 55 cm.
4.2 Peatland permafrost ground ice content
Mound height and permafrost thickness (including uncertainties) can be used to calculate average excess ice fractions (EICs) in the peatland permafrost using Eq. (1) (Lewkowicz et al., 2011):
Mean EICs calculated for the palsas examined using ERT ranged from 0.1 to 0.6 with a median value of 0.18 (n=26) (Fig. 10 and Table S2). P6 at Red Bay and the peat plateau at Main Tickle were not included in this analysis because of the difficulty in establishing permafrost thickness where bedrock is inferred to be present at depth. Given the relatively low height of the peat plateau and thick permafrost, the EICs at Main Tickle would likely be lower than 0.15. Mean EICs are lower than those observed for palsas in the southern Yukon (0.2–0.4) (Lewkowicz et al., 2011) but higher than those for northern Sweden (<0.03–0.25) (Sjöberg et al., 2015) (Fig. 10). The calculated EICs indicate that a considerable amount of heat would need to be transmitted into the mounds to melt the ground ice during permafrost thaw.
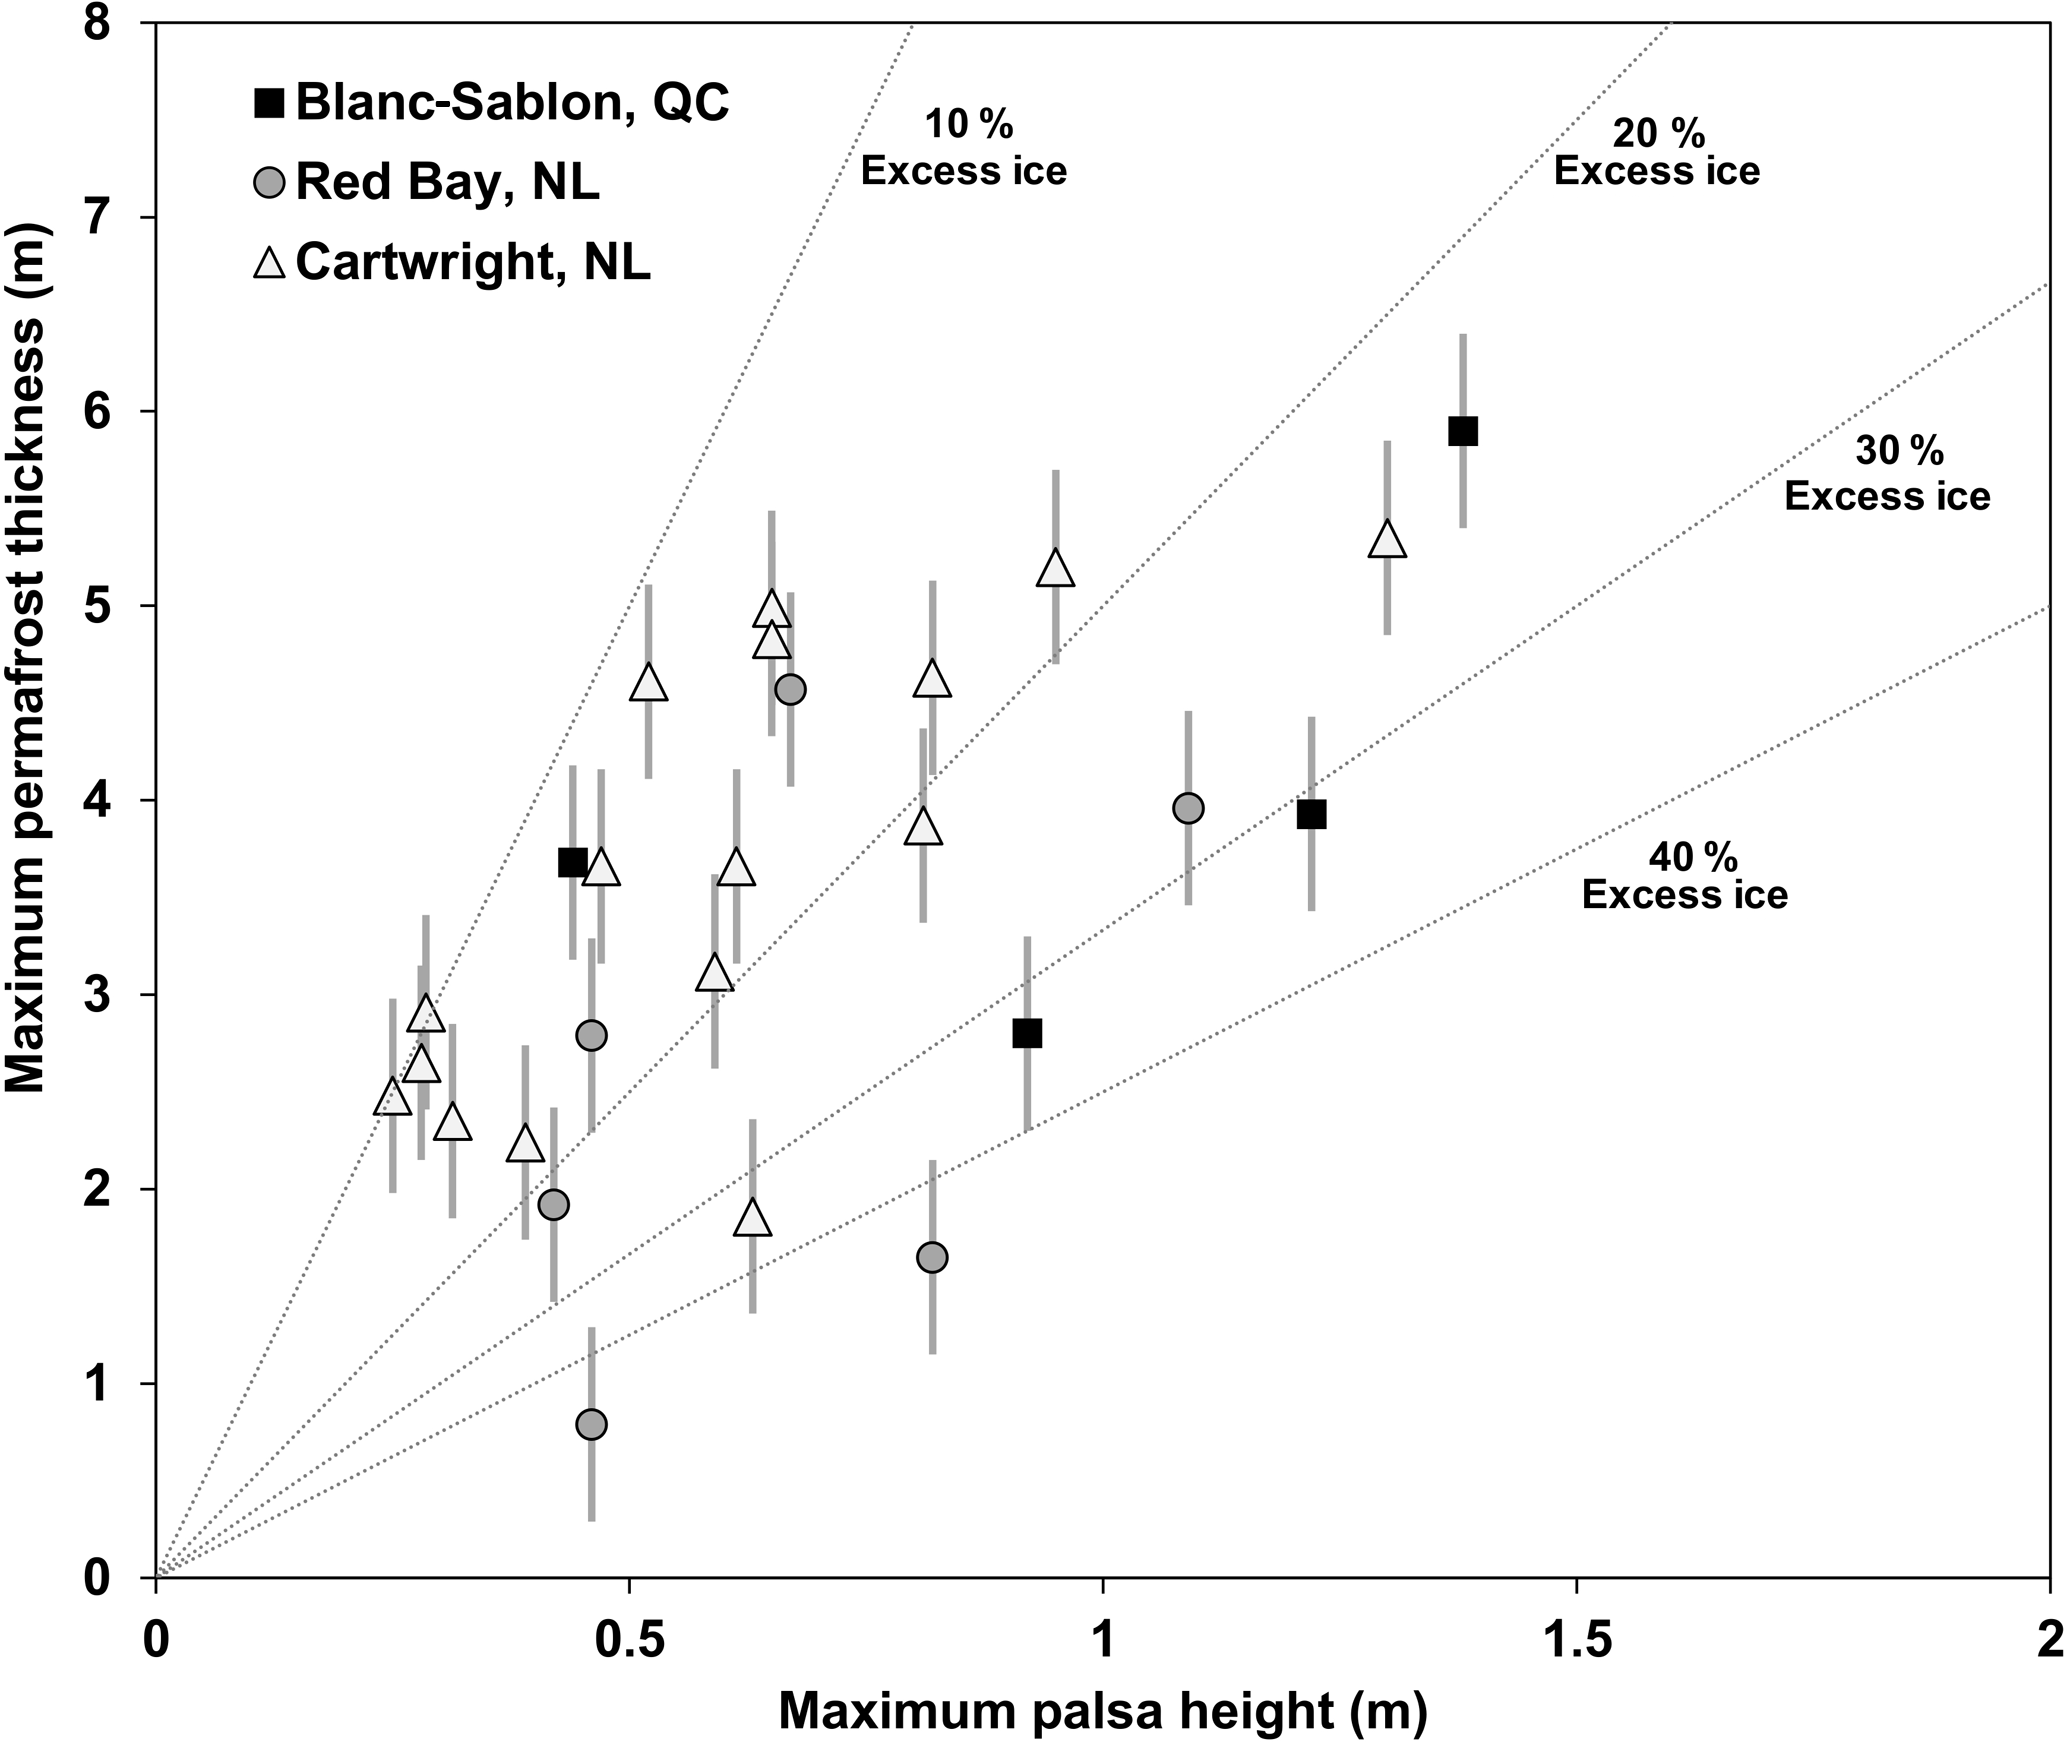
Figure 10Comparison between maximum mound height and inferred maximum permafrost thickness. Dotted lines depict the association for excess ice quantities of 10 %, 20 %, 30 %, and 40 %.
4.3 Ground temperature modelling
Modelled and measured daily ground temperatures for 2014–2016 were in good agreement at the Blanc-Sablon and Cartwright borehole sites following calibration (Figs. S3, S4). The model reproduced the thin permafrost at both locations and the sizable observed thermal offsets (−2.7 ∘C at Blanc-Sablon and −1.7 ∘C at Cartwright). To achieve these matches, the geothermal heat fluxes were set to 0.54 and 1.02 W m−2. These fluxes are an order of magnitude larger than the geothermal heat flux in deep ground (Pollack et al., 1993) but are similar to values used for modelling permafrost mounds in northern Quebec (Buteau et al., 2004). They likely reflect horizontal heat flow from surrounding unfrozen terrain and water in deep ground rather than being the geothermal heat flow at depth. A higher flux was needed for Cartwright because the observed permafrost thickness is like that at Blanc-Sablon but air and near-surface ground temperatures are lower. This is linked to the smaller and more isolated permafrost mound which was monitored at Cartwright compared to that at Blanc-Sablon. At both sites, the geothermal heat fluxes were also kept constant throughout the model simulations due to limitations imposed by using a two-dimensional modelling approach. Three-dimensional modelling (e.g. Kurylyk et al., 2016) would be needed to resolve the nature of expected changes in these fluxes over time as feature morphology evolved with degradation. The snow scouring factor was similarly high for the two sites (0.85 for Blanc-Sablon and 0.83 for Cartwright), which resulted in modelled winter snow depths of about 15 cm, values that are comparable to the field observations.

Figure 11Permafrost thickness modelled with NEST for 1900–2100 for (a) Blanc-Sablon and (b) Cartwright. Future predictions are for RCP2.6, RCP4.5, and RCP8.5.
Modelled permafrost thickness declined from about 5 m at both sites in 1900 to 3.8 m at Blanc-Sablon and 2.5 m at Cartwright in 2016 (Fig. 11). Permafrost thinning due to warming from below began in the 1940s at Cartwright and in the 1950s at Blanc-Sablon but slowed in the 1960s, and there was some aggradation in the 1990s. Degradation has occurred since then and is projected to continue. The modelling shows permafrost disappearing at Blanc-Sablon during the 2040s or early 2050s with the timing little affected by the choice of RCP (<10 years difference). There is more variation at Cartwright, with degradation in the 2060s under RCP8.5, in the 2090s under RCP4.5, and beyond the 21st century under RCP2.6 (Fig. 11b). All these changes in permafrost thickness are due to thaw at the base. A supra-permafrost talik does not develop because the summer thaw depth is always less than the winter freezing depth due to the thin snow cover.
To test whether the permafrost can persist indefinitely if the current climate does not change, we ran the model for the Blanc-Sablon site with the future climate represented by repeating the climate conditions from 1972 to 2015. We selected this period because it represents the conditions over the past 4 decades with both cooler and warmer episodes and exactly matches leap years. The results show no future progressive permafrost degradation. This is the case even if the model is initialized without permafrost by artificially increasing daily air temperature in the initialization year (1900) by 2 ∘C. Permafrost establishes in a few years and gradually stabilizes. These results imply that permafrost thermal conditions are in equilibrium with current atmospheric climate and that permafrost would persist at Blanc-Sablon if the regional and local climatic conditions of the past 4 decades were to repeat.
The relative importance of snow wind scouring and peat cover was assessed by changing these parameters separately for Blanc-Sablon. A reduction of 15 % in the snow wind scouring factor is sufficient to eliminate contemporary permafrost at the site. Without any wind scouring, soil temperatures increase by 4.9 ∘C at 0.5–1 m of depth and 5.8 ∘C at 5 m of depth compared to the calibrated baseline conditions during 1990–2009. Without peat cover, soil temperatures at the same depths increase by 2.4 and 2.0 ∘C, respectively. This demonstrates that the impact of snow removal by wind on ground temperature is 2–3 times that of the peat cover. In both cases, the surface offset and the thermal offset all become smaller after permafrost disappears. However, the impact of snow wind scouring on ground temperatures is still 2 to 3 times (1.8 and 2.7 times for the depths of 0.5–1 and 5 m, respectively) that of peat cover.
5.1 Southeastern Labrador peatland permafrost
The palsas examined have heights of 0.3–1.5 m, which places them at the low end of the circum-Arctic range (Van Everdingen, 2005), reflecting thin permafrost and excess ice contents generally less than 25 %. Peat thickness measured during water-jet drilling varied from 1 to 2 m, so the mounds are best described as mineral-cored palsas (Gurney, 2001). Permafrost thicknesses beneath individual mounds estimated using the ERT results ranged from <1 to 6 m, although thicknesses of 7.5–10 m were inferred beneath the peat plateau at Main Tickle. Vegetation on mound crests was limited to ground cover (lichens, grasses, and herbs) at almost all sites, with low shrubs present on the sides of some mounds. Bare and wind-abraded peat was evident at some sites but the Neveisik Island palsas were the only ones with shrub cover on the mounds themselves.
Measured late-winter snow depths on monitored palsa crests were all less than 25 cm (median of 15 cm) due to wind scouring in winter, while snow depths measured at other sites in the region typically exceeded 100 cm (see Way and Lewkowicz, 2018). Way and Lewkowicz (2018) showed previously that the late-winter snow depth necessary for permafrost to exist at peatland sites in southeastern Labrador was regionally variable but ranged from less than 20 cm to less than 70 cm. These findings are similar to those from northern Scandinavia where snow depths of less than ∼50 cm were required for palsa formation (Seppälä, 2011) and where contemporary palsa characteristics are correlated with late-winter snow depths (Sannel et al., 2016). Given high regional snowfall totals in southeastern Labrador, significant shrub cover on the mound crests would capture more snow (e.g. Way and Lewkowicz, 2018) and the thermal modelling indicates that such a change would be expected to cause thaw of these permafrost landforms.
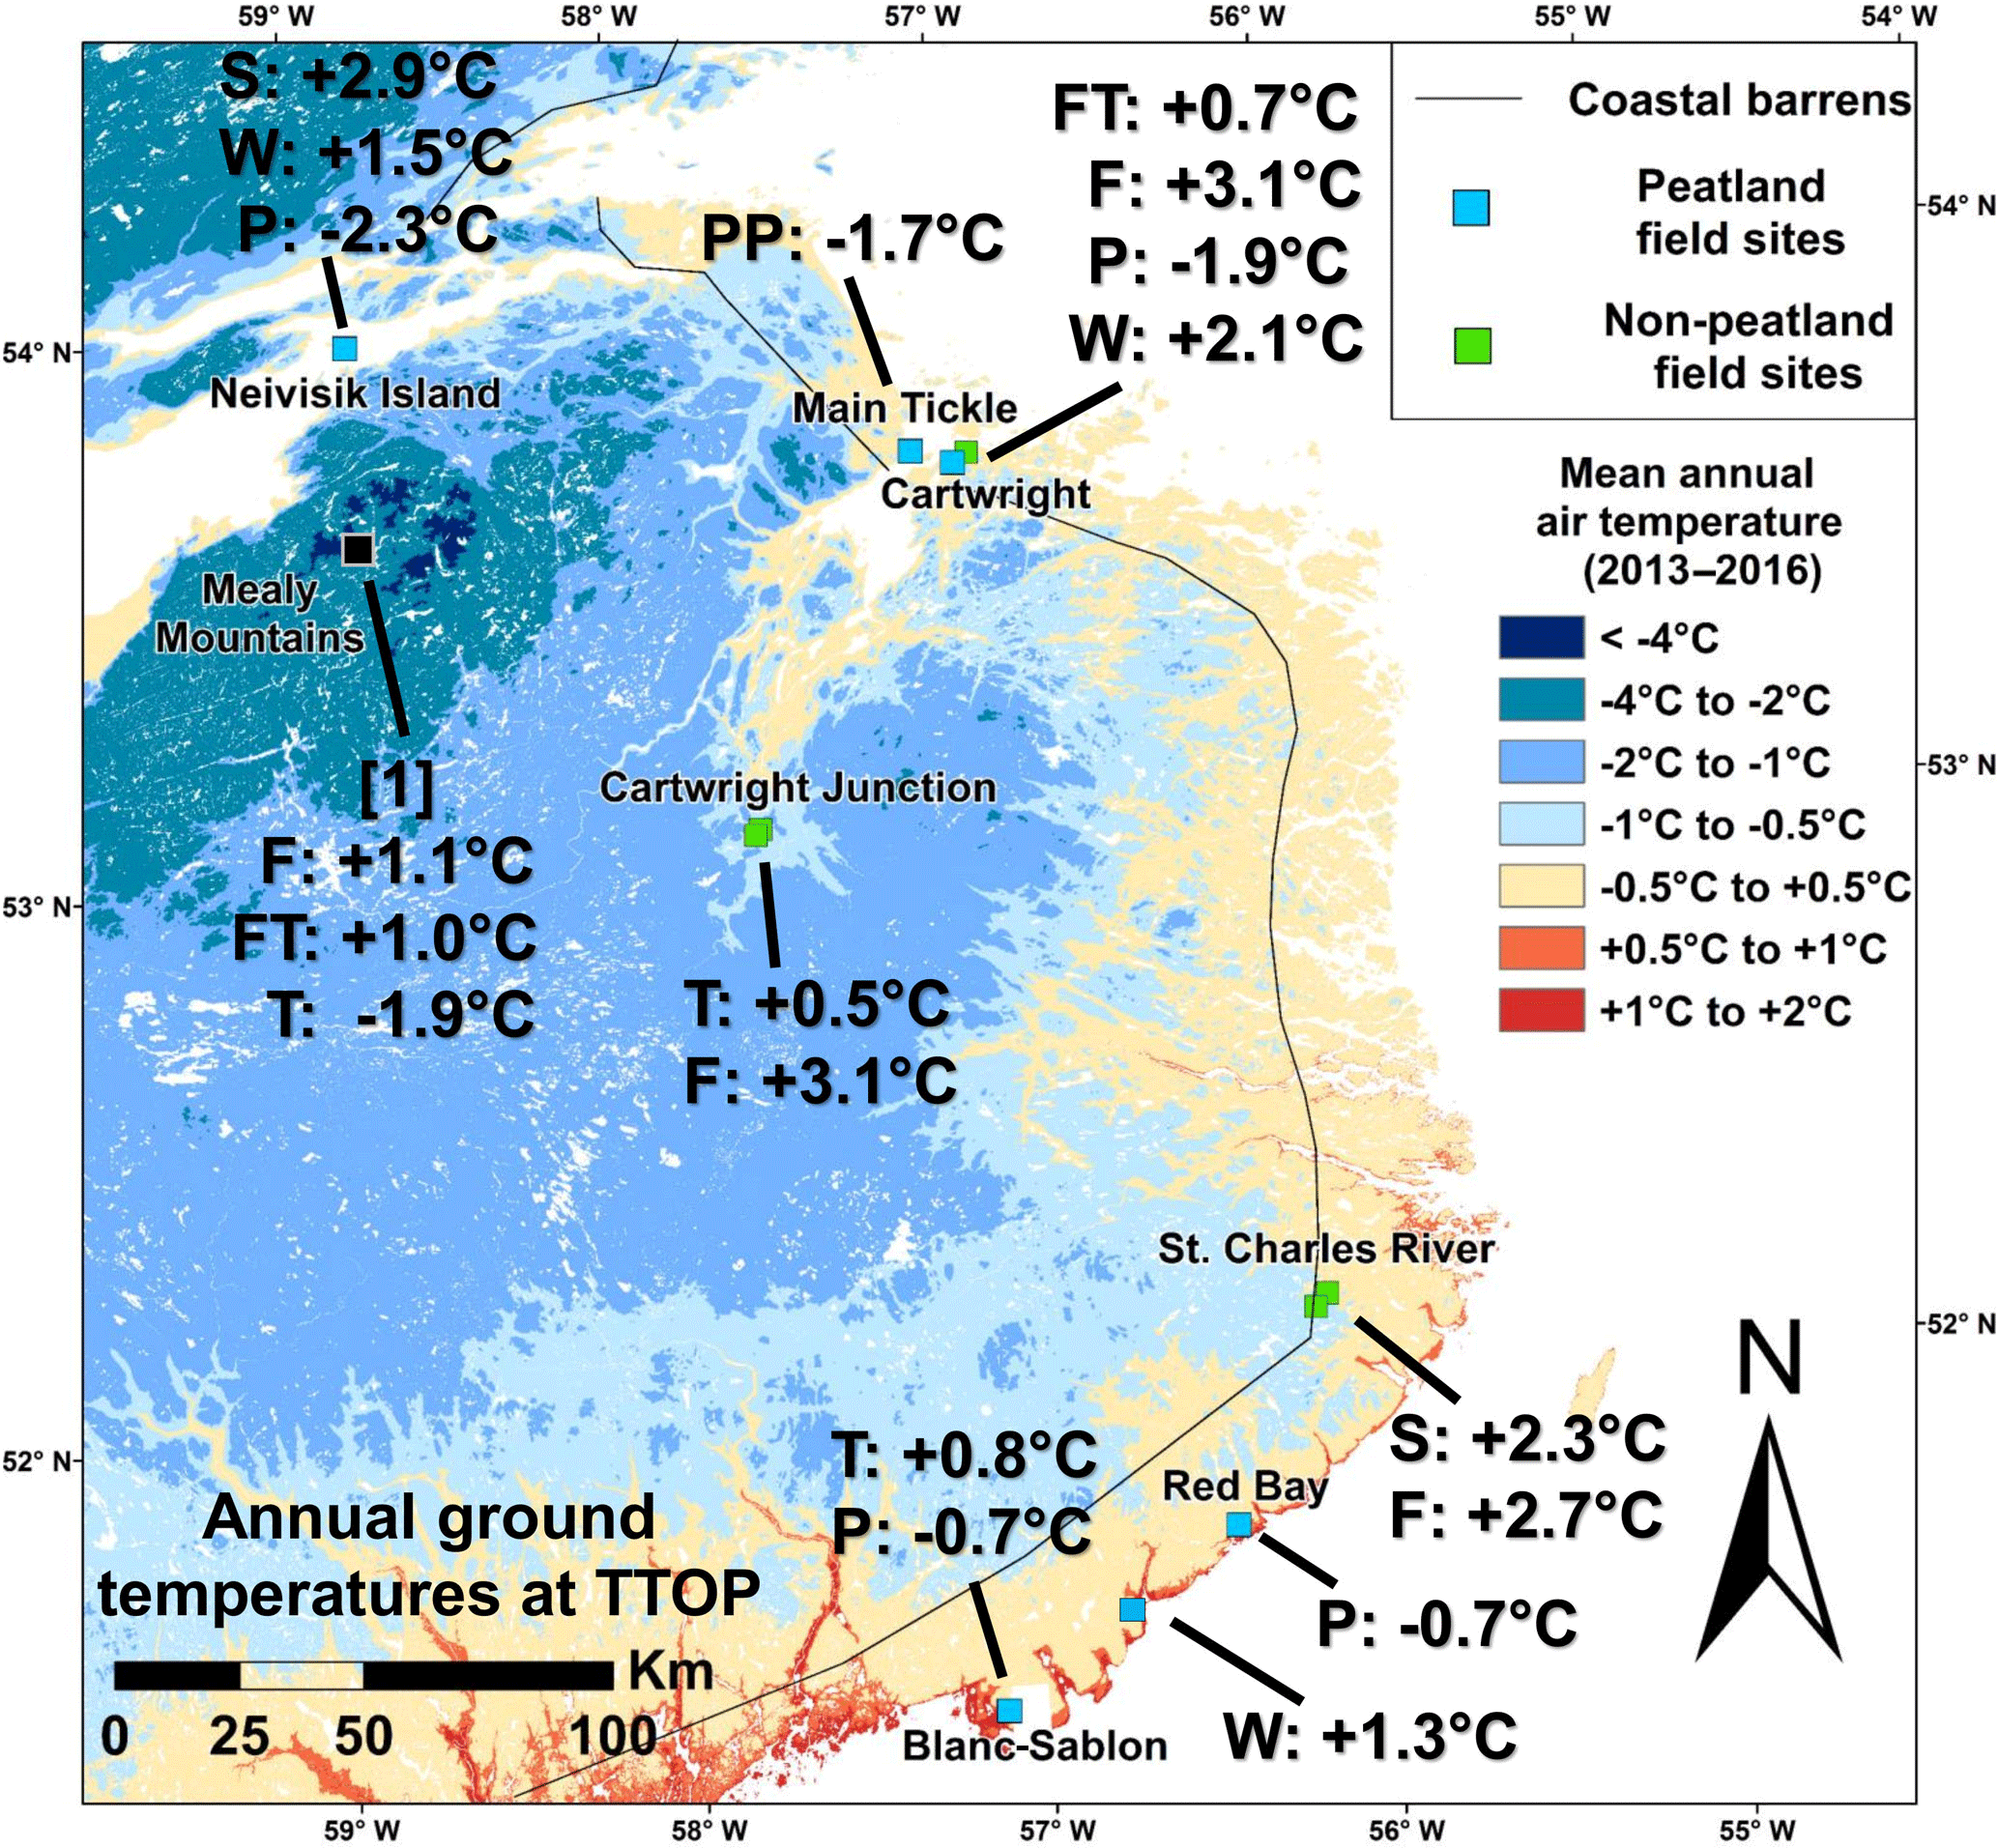
Figure 12Average ground temperatures (2013–2016) at or close to the top of permafrost or the base of seasonal freezing at University of Ottawa monitoring locations in southeastern Labrador (Way and Lewkowicz, 2018) superimposed on a map of mean annual air temperature (2013–2016) (Way et al., 2017). Letters denote primary land cover class at each location: F – forest; P – palsa; PP – peat plateau; S – shrub; T – tundra; and W – wetland. At Cartwright, ground temperatures for palsas were averaged from three sites. Mealy Mountains data (indicated by [1]) were collected by Jacobs et al. (2014) between 2001 and 2009.
Ground temperatures recorded at TTOP (see Way and Lewkowicz, 2018) on the peatland permafrost features varied from −0.7 ∘C at the southernmost site (Blanc-Sablon) to −2.3 ∘C at the northernmost one (Neveisik Island), showing a clear latitudinal gradient (Fig. 12). These are relatively low values given the range of mean annual air temperature (MAAT) and are due to the small surface offsets and large thermal offsets measured at the study sites. The latter could be caused by the slow transient response of ground temperatures to recent regional warming (Jorgenson et al., 2010; Lewkowicz et al., 2016; Morse et al., 2016), but we favour the explanation that these large offsets are due to differences in frozen and unfrozen thermal conductivities resulting from thick peat found in the well-drained raised bogs (Seppälä, 2011). This inference is supported by very shallow thaw depths, ranging from 37 to 65 cm (median: 46 cm) and by the modelling that indicates that the current ground temperatures are in equilibrium with the climate.
The shallow thaw depths observed also run counter to broader-scale models (e.g. Smith and Riseborough, 2002; Zhang et al., 2008b), which predict thick active layers (1–2 m) at the southern end of the discontinuous zone. However, coarse Earth system models do not consider that permafrost in this zone, where present, is typically in peatlands, which are not represented well on most national-scale surficial maps used as modelling inputs.
An unusual feature of the thermal conditions at the borehole sites is the relatively thin permafrost associated with strong thermal gradients. Mean temperatures at 1 m of depth at the four sites with boreholes varied from −0.7 to −1.4 ∘C, while permafrost thickness based on drill records and the ERT profiles varied from 3.7 to 8 m. Calculated geothermal gradients ranged from 0.10 to 0.38 ∘C m−1, which greatly exceed typical regional values of 0.005–0.01 ∘C m−1 (Grasby et al., 2012). These results imply high heat flows into the atmosphere and suggest that these small permafrost bodies may act as conduits for heat originating from surrounding snow-covered terrain in winter and from the unfrozen bog in summer (see Kurylyk et al., 2016). Notably, thermal modelling for two of the borehole sites could not match the measured ground temperatures without prescribing an order of magnitude increase in the geothermal heat fluxes compared to typical values for extensive permafrost. Thus, local conditions are critical for determining permafrost conditions, especially in the isolated patches zone. This underlines the challenges for mapping permafrost at high spatial resolution and for predicting the changes in permafrost due to climate change.
It has been hypothesized that palsas near Blanc-Sablon may be relict features that have persisted in the area since the Little Ice Age due to coastal effects, including persistent cloudiness (Dionne, 1984; Dionne and Richard, 2006). Elsewhere, there is evidence that permafrost in the coastal zone has degraded over the past half century. For example, palsas at Cartwright were 1.5 m high and peat plateaus were >60 m long and >6 m wide in 1968 (Brown, 1979, 1975). Currently, they do not exceed 1 m in height and permafrost-cored terrain appears to cover a much smaller part of the landscape than 50 years ago. Similarly, palsas and peat plateaus at Neveisik Island were 1.8 m high and covered most of the bog in 1968 (Brown, 1979, 1975), whereas we observed no mounds greater than 1 m high or with long axes >20 m and many collapse scars and thermokarst ponds (Fig. 2c). Degradational features on palsas were also evident at Blanc-Sablon and Cartwright where several mounds exhibited large cracks exposing their interiors. Ground temperatures recorded by Allard et al. (2014) between 1991 and 2012 (with a data gap from 1998 to 2004) at a palsa field north of Blanc-Sablon show that temperatures at 50 cm of depth increased to the point at which average ground temperatures regularly exceed 0 ∘C (Fig. S5). These data support our numerical modelling, which indicates past thinning of permafrost and field interpretations that regional permafrost degradation has occurred (Way and Lewkowicz, 2016).
5.2 Permafrost in southeastern Labrador
A preliminary analysis of Google Earth™ imagery and observations made by Brown (1979, 1975) suggest that peatland permafrost features may exist elsewhere in the coastal barrens between Blanc-Sablon and Cartwright. A detailed inventory of current palsas and peat plateaux, however, would require high-resolution aerial photography or sub-metre-resolution satellite imagery to identify the very small mounds found in many areas (Borge et al., 2017) and this has not yet been undertaken. Satellite imagery does show widespread thermokarst ponds in the region, including on the northernmost tip of Newfoundland. Archeological investigations at L'Anse aux Meadows (51.6∘ N) described the excavation of a palsa with thick surface peat (Henningsmoen, 1977), and given the geographic setting and climate in the northernmost parts of Newfoundland similar to sites at the southern end of our transect, there is no a priori reason that palsas could not exist there.
Peatland permafrost showed much smaller surface offsets (median: 1.1 ∘C) and much larger thermal offsets (median: −2.3 ∘C) than other land cover types where permafrost is absent (Way and Lewkowicz, 2018). These results indicate that peatland permafrost is ecosystem protected (Shur and Jorgenson, 2007) and only tenable due to the elevated surface, low vegetation cover and high wind speeds that facilitate low snow depths, and the thick peat that produces a large thermal offset (e.g. Jorgenson et al., 2010; Lewkowicz et al., 2016). The modelling for Blanc-Sablon indicates that this ecosystem protection will become insufficient during climate warming, as the apparent thermal offset grows to about −3.5 ∘C just prior to permafrost disappearance in response to an increasing disequilibrium between the still-frozen ground and the mean surface temperature (Fig. S6).
The peatland permafrost features were all located in the coastal barrens with MAATs between −0.5 and +1.0 ∘C (2013–2016). These coastal climates are influenced by seasonal sea ice promoting near-surface temperature inversions that cool the ground in winter and spring (Atkinson and Gajewski, 2002; Maxwell, 1981; Smith and Bonnaventure, 2017). However, additional factors must play a role because permafrost has not been observed in colder areas inland or at higher elevation (Brown, 1979; Way and Lewkowicz, 2018) (Fig. 12). First, when all other factors are the same, mean ground temperatures should be lower in coastal areas with smaller temperature ranges (Riseborough, 2004). Second, melting sea ice and ocean–atmosphere contrasts promote coastal fog and persistent cloudiness in summer, leading to Arctic-like temperatures and lower amounts of insolation along the outer coasts in Labrador (Maxwell, 1981; Way et al., 2014, 2017). Finally, persistent high winds and frequent winter melt events likely modify snow properties (e.g. density), which increase winter heat exchange between the ground and the atmosphere (Derksen et al., 2014). In addition, windy conditions influence snow redistribution and enhance wind scouring, which our modelling shows is critical for permafrost. However, the absence of permafrost beneath wind-scoured tundra hilltops near Blanc-Sablon, Cartwright Junction, and Cartwright demonstrates that permafrost cannot now exist in mineral soils at low elevations in southeastern Labrador. Towards the northern end of the study transect, larger and thicker permafrost bodies were present near Cartwright and Main Tickle (Fig. 12), and wetland terrain adjacent to the peat plateau remained frozen near the end of the thaw season. These results suggest that the −1 ∘C MAAT threshold commonly used in northern Scandinavia (e.g. Vorren, 2017) for delimiting the upper climatic boundary for palsas is too low for Labrador and that our results resemble those from a recent survey in Finnmark that found permafrost patches at MAATs as high as +1 ∘C (Borge et al., 2017).
5.3 Permafrost persistence
Our thermal modelling indicates that peatland permafrost could thaw in most of southeastern Labrador in the 21st century, with southern sites losing permafrost by about 2050. Farther north, responses depend on the RCP scenario and there is the possibility of permafrost persistence if RCP2.6 is followed. However, the modelling considered only vertical fluxes whereas isolated patches of peatland permafrost may undergo degradation via two-dimensional or three-dimensional processes including enhanced advective heat transfer, heat transport from sub-permafrost groundwater, wind abrasion of surface peat, and block collapse into adjacent standing water, all of which may accelerate the rate of permafrost loss. Degradation-induced changes in palsa morphology, due to melting of excess ice, may further warm ground temperatures via changes (i.e. increases) in snow accumulation, which are not considered in the model simulations. Correspondingly, the modelling results are likely optimistic in terms of permafrost persistence.
The modelling shows that wind scouring of snow is more important than peat cover and that, unlike in other studies (Camill and Clark, 1998; Halsey et al., 1995; Morse et al., 2016; Zhang et al., 2008a), the thermal condition of the permafrost is in equilibrium with the current atmospheric climate. However, the wind scouring occurs because of the raised elevation of the palsa crest, which is itself the product of ice segregation during permafrost formation, and because of the absence of tall shrubs. Modelling showed that even a slightly thicker snow cover (still below half the average snow depth) would preclude the presence of permafrost and hence would make it impossible for a mound to start unless its geographic or topographic position favoured extreme wind scouring. Therefore, in most of the locations investigated in this study the peatland permafrost is relict because although its thermal condition is in equilibrium with the current climate, the landforms are unlikely to develop under current conditions.
Permafrost degradation is often associated with the development of near-surface taliks in the field (Romanovsky et al., 2010; Shaoling et al., 2000) and in model simulations (Delisle, 2007; Schaefer et al., 2011; Shaoling et al., 2000; Zhang, 2013; Zhang et al., 2008b). Our modelling did not show talik development during degradation because winter freezing is much greater than summer thaw due to the combination of snow scouring by wind and thick peat cover. At our sites, the permafrost only thinned upwards from the base, which is not the norm for deep permafrost. The modelling also showed that permafrost persistence and degradation is more complicated than predicted by coarsely gridded models. Even a relatively fine grid model (e.g. Way and Lewkowicz, 2016) has difficulties including local conditions, which may be crucial for permafrost persistence. These results emphasize the importance of considering local snow conditions for permafrost modelling and mapping and suggest that the southern boundary of permafrost may not move as quickly as predicted by global climate models (e.g. Koven et al., 2013). The impact of differing climate scenarios also depends on permafrost conditions. At the warmer Blanc-Sablon site, permafrost degradation is predicted to be similar for all three RCP simulations, while at the colder Cartwright site, there are significant differences in the timing of degradation and even the prediction of permafrost persistence under RCP2.6. However, palsa surface lowering and changes to peatland microtopography due to permafrost degradation may alter local degradation rates by changing how snow redistributes across the landscape with corresponding impacts on ground thermal regimes.
Isolated patches of peatland permafrost in the coastal zone of southeast Labrador extend as far south as 51.5∘ N on the Gulf of St. Lawrence. These patches take the form of mineral-cored palsas and peat plateaux and are mainly present in raised bogs where air temperatures range from +1 ∘C in the south to −1.1 ∘C at 53.7∘ N. Field observations show that both thin wind-scoured snow cover on mound crests causing small surface offsets and thick peat causing large thermal offsets are crucial to permafrost existence. Consequently, we found no evidence that permafrost is present at low elevations outside peatlands in this part of the isolated patches zone, even where air temperatures are substantially lower.
Permafrost thicknesses within peatlands were all less than 10 m, which was lower than expected based on measured ground temperatures at the top of permafrost of −0.7 to −1.4 ∘C. We attribute the high geothermal gradients to the three-dimensional configuration of the isolated permafrost bodies, which would promote horizontal heat flow from surrounding non-permafrost areas, as well as possible heat transport from sub-permafrost groundwater. One-dimensional thermal modelling for two sites could not accurately simulate the measured ground thermal regimes without prescribing elevated geothermal heat fluxes. Sensitivity modelling showed that the reduced snow cover had an impact of 2–3 times that of the loss of peat cover at these sites.
Modelling results show that the thermal condition of the permafrost is in equilibrium with the current climate but the permafrost is dependent on thin snow, which would be unlikely to exist in the absence of a mound or exposed topographic position. Despite this, our modelling indicates that features at the northern end of the transect could persist until the end of the 21st century under RCP4.5 and RCP2.6, but would degrade entirely under RCP8.5 by about 2060. Peatland permafrost at the southern end of the transect is more vulnerable and will degrade under all three scenarios by about 2050. Given the sensitivity of southeastern Labrador peatland permafrost to future changes and potential disturbances, more effort is needed to locate, characterize, and monitor these ecosystem-protected permafrost occurrences.
All datasets used in this paper are available from the corresponding author on request. Borehole temperature data will be submitted to GTN-P following acceptance of the relevant papers in peer-reviewed journals. Code used to compile information from monitoring stations is available in the supplemental materials of Way and Lewkowicz (2018).
The supplement related to this article is available online at: https://doi.org/10.5194/tc-12-2667-2018-supplement.
RGW and AGL designed the study, established field sites, conducted geophysical surveys, and analyzed field data. YZ performed thermal modelling for sites at Blanc-Sablon and Cartwright. RGW, AGL, and YZ analyzed thermal modelling output relative to field data. RGW, AGL, and YZ drafted the final manuscript.
The authors declare that they have no conflict of interest.
Financial support for the research was provided by NSERC, the Northern
Scientific Training Program, the University of Ottawa, and the Royal Canadian
Geographical Society. Additional support to Robert G. Way was provided by the
W. Garfield Weston Foundation. We are grateful to Darya Anderson, Alexander
Brooker, Maxime Duguay, and Caitlin Lapalme for their assistance in the field
and to Patricia Way, Gary Bird, George Way, and Brenda Way for their
logistical support. We thank Cartwright community members including Gary
Bird, Leslie Hamel, and Lloyd Pardy for their help in identifying suitable
study sites. The authors would like to than the Nunatsiavut Government for permitting work at Neveisik Island and the
NunatuKavut Community Council for useful discussions regarding permafrost in the region.
The paper was improved through discussions with Michel
Allard, Denis Lacelle, Sharon Smith, and Bruce Roberts. Yu Zhang's work was
funded by Polar Knowledge Canada Science and Technology Program (project
186). It also contributes to a project affiliated with the Arctic Boreal
Vulnerability Experiment (ABoVE), a NASA Terrestrial Ecology
Program.
Edited by: Christian Hauck
Reviewed by: two anonymous referees
Allard, M. and Rousseau, L.: The internal structure of a palsa and peat plateau in the Riviere Boniface region, Québec: Inferences on the formation of ice segregation mounds, Geogr. Phys. Quatern., 53, 373–387, 1999.
Allard, M., Sarrazin, D., and L'Hérault, E.: Borehole monitoring temperatures in northeastern Canada v. 1.2 (1988–2014), Scientific data, Centre D'Étude Nordiques, https://doi.org/10.5885/45291SL-34F28A9491014AFD, 2014.
An, W. and Allard, M.: A mathematical approach to modelling palsa formation: Insights on processes and growth conditions, Cold Reg. Sci. Technol., 23, 231–244, 1995.
Atkinson, D. E. and Gajewski, K.: High-resolution estimation of summer surface air temperature in the Canadian Arctic Archipelago, J. Climate, 15, 3601–3614, 2002.
Borge, A. F., Westermann, S., Solheim, I., and Etzelmüller, B.: Strong degradation of palsas and peat plateaus in northern Norway during the last 60 years, The Cryosphere, 11, 1–16, https://doi.org/10.5194/tc-11-1-2017, 2017.
Briggs, M. A., Campbell, S., Nolan, J., Walvoord, M. A., Ntarlagiannis, D., Day-Lewis, F. D., and Lane, J. W.: Surface Geophysical Methods for Characterising Frozen Ground in Transitional Permafrost Landscapes: Surface Geophysical Methods for Characterising Frozen Ground, Permafrost Periglac., 28, 52–67, https://doi.org/10.1002/ppp.1893, 2016.
Brown, R. J.: Permafrost distribution in the southern part of the discontinuous zone in Quebec and Labrador, Geogr. Phys. Quatern., 33, 279–289, 1979.
Brown, R. J. E.: Permafrost Investigations in Quebec and Newfoundland (Labrador), Technical Paper, National Research Council of Canada, Ottawa, Ontario, 1975.
Buteau, S., Fortier, R., Delisle, G., and Allard, M.: Numerical simulation of the impacts of climate warming on a permafrost mound, Permafrost Periglac., 15, 41–57, https://doi.org/10.1002/ppp.474, 2004.
Camill, P. and Clark, J. S.: Climate Change Disequilibrium of Boreal Permafrost Peatlands Caused by Local Processes, Am. Nat., 151, 207–222, https://doi.org/10.1086/286112, 1998.
Cooper, M. D. A., Estop-Aragonés, C., Fisher, J. P., Thierry, A., Garnett, M. H., Charman, D. J., Murton, J. B., Phoenix, G. K., Treharne, R., Kokelj, S. V., Wolfe, S. A., Lewkowicz, A. G., Williams, M., and Hartley, I. P.: Limited contribution of permafrost carbon to methane release from thawing peatlands, Nat. Clim. Change, 7, 507–511, https://doi.org/10.1038/nclimate3328, 2017.
Delisle, G.: Near-surface permafrost degradation: How severe during the 21st century?, Geophys. Res. Lett., 34, L09503, https://doi.org/10.1029/2007GL029323, 2007.
Derksen, C., Lemmetyinen, J., Toose, P., Silis, A., Pulliainen, J., and Sturm, M.: Physical properties of Arctic versus subarctic snow: Implications for high latitude passive microwave snow water equivalent retrievals, J. Geophys. Res.-Atmos., 119, 2013JD021264, https://doi.org/10.1002/2013JD021264, 2014.
Dionne, J.-C.: Palses et limite méridionale du pergélisol dans l'hemisphere nord: le cas de Blanc-Sablon, Québec, Geogr. Phys. Quatern., 38, 165–184, https://doi.org/10.7202/032550ar, 1984.
Dionne, J.-C. and Gérardin, V.: Observations sur les buttes organiques de la Cote-Nord du golfe du Saint-Laurent, Québec, Geogr. Phys. Quatern., 42, 289–301, https://doi.org/10.7202/032737ar, 1988.
Dionne, J.-C. and Richard, P. J. H.: Origine, Age et taux d'accrétion verticale de la tourbiere palses de Blanc-Sablon, basse Cote-Nord, Golfe du Saint-Laurent, Québec, Geogr. Phys. Quatern., 60, 199–205, https://doi.org/10.7202/016829ar, 2006.
Douglas, T. A., Jorgenson, M. T., Brown, D. R. N., Campbell, S. W., Hiemstra, C. A., Saari, S. P., Bjella, K., and Liljedahl, A. K.: Degrading permafrost mapped with electrical resistivity tomography, airborne imagery and LiDAR, and seasonal thaw measurements, Geophysics, 81, WA71–WA85, https://doi.org/10.1190/geo2015-0149.1, 2016.
Foster, D. R. and Glaser, P. H.: The raised bogs of south-eastern Labrador, Canada: classification, distribution, vegetation and recent dynamics, J. Ecol., 74, 47–71, 1986.
Foster, D. R., Wright, H. E., Thelaus, M., and King, G. A.: Bog development and landform dynamics in central Sweden and south-eastern Labrador, Canada, J. Ecol., 76, 1164–1185, 1988.
Fulton, R. J.: Surficial Materials of Canada, 1:50,000, Geological Survey of Canada Map, Natural Resources Canada, 1995.
Glaser, P. H.: Raised Bogs in Eastern North America–Regional Controls for Species Richness and Floristic Assemblages, J. Ecol., 80, 535–554, https://doi.org/10.2307/2260697, 1992.
Grasby, S. E., Allen, D. M., Bell, S., Chen, Z., Ferguson, G., Jessop, A., Kelman, M., Ko, M., Majorowicz, J., Moore, M., Raymond, J., and Therrien, R.: Geothermal energy resource potential of Canada, Open file, Geological Survey of Canada, Natural Resources Canada, https://doi.org/10.4095/291488, 2012.
Gurney, S. D.: Aspects of the genesis, geomorphology and terminology of palsas: perennial cryogenic mounds, Prog. Phys. Geog., 25, 249–260, 2001.
Halsey, L. A., Vitt, D. H., and Zoltai, S. C.: Disequilibrium response of permafrost in boreal continental western Canada to climate change, Climatic Change, 30, 57–73, 1995.
Hauck, C.: New Concepts in Geophysical Surveying and Data Interpretation for Permafrost Terrain: Geophysical Surveying in Permafrost Terrain, Permafrost Periglac., 24, 131–137, https://doi.org/10.1002/ppp.1774, 2013.
Heginbottom, J. A., Dubreuil, M.-A., and Harker, P. A.: Canada – Permafrost, available at: http://geogratis.gc.ca/api/en/nrcan-rncan/ess-sst/d1e2048b-ccff-5852-aaa5-b861bd55c367.html (last access: 25 July 2016), 1995.
Henningsmoen, K. E.: Pollen-analytical investigations in the L'Anse aux Meadows area, Newfoundland, in: The Discovery of a Norse Settlement in America, Universitetsforlaget, Oslo, 289–340, 1977.
Hustich, I.: Notes on the coniferous forest and tree limit on the east coast of Newfoundland-Labrador, Acta Geogr., 7, 5–77, 1939.
Hutchinson, M. F., McKenney, D. W., Lawrence, K., Pedlar, J. H., Hopkinson, R. F., Milewska, E., and Papadopol, P.: Development and testing of Canada-wide interpolated spatial models of daily minimum-maximum temperature and precipitation for 1961–2003, J. Appl. Meteorol. Clim., 48, 725–741, https://doi.org/10.1175/2008JAMC1979.1, 2009.
Jacobs, J. D., Chan, S., and Sutton, E.: Climatology of the Forest-Tundra Ecotone at a Maritime Subarctic-Alpine Site, Mealy Mountains, Labrador, Arctic, 67, 28–42, https://doi.org/10.14430/arctic4358, 2014.
James, M., Lewkowicz, A. G., Smith, S. L., and Miceli, C. M.: Multi-decadal degradation and persistence of permafrost in the Alaska Highway corridor, northwest Canada, Environ. Res. Lett., 8, 045013, https://doi.org/10.1088/1748-9326/8/4/045013, 2013.
Jorgenson, M. T., Romanovsky, V., Harden, J., Shur, Y., O'Donnell, J., Schuur, E. A. G., Kanevskiy, M., and Marchenko, S.: Resilience and vulnerability of permafrost to climate change, Can. J. Forest Res., 40, 1219–1236, https://doi.org/10.1139/X10-060, 2010.
Kasprzak, M.: High-resolution electrical resistivity tomography applied to patterned ground, Wedel Jarlsberg Land, south-west Spitsbergen, Polar Res., 34, 25678, https://doi.org/10.3402/polar.v34.25678, 2015.
Koven, C. D., Riley, W. J., and Stern, A.: Analysis of Permafrost Thermal Dynamics and Response to Climate Change in the CMIP5 Earth System Models, J. Climate, 26, 1877–1900, https://doi.org/10.1175/JCLI-D-12-00228.1, 2013.
Kurylyk, B. L., Hayashi, M., Quinton, W. L., McKenzie, J. M., and Voss, C. I.: Influence of vertical and lateral heat transfer on permafrost thaw, peatland landscape transition, and groundwater flow, Water Resour. Res., 52, 1286–1305, https://doi.org/10.1002/2015WR018057, 2016.
Kwong, Y. J. and Gan, T. Y.: Northward migration of permafrost along the Mackenzie Highway and climatic warming, Climatic Change, 26, 399–419, 1994.
Lewkowicz, A. G.: Evaluation of miniature temperature-loggers to monitor snowpack evolution at mountain permafrost sites, northwestern Canada, Permafrost Periglac., 19, 323–331, https://doi.org/10.1002/ppp.625, 2008.
Lewkowicz, A. G., Etzelmüller, B., and Smith, S. L.: Characteristics of discontinuous permafrost based on ground temperature measurements and electrical resistivity tomography, southern Yukon, Canada, Permafrost Periglac., 22, 320–342, https://doi.org/10.1002/ppp.703, 2011.
Lewkowicz, A. G., Bellehumeur-Génier, O., Miceli, C. M., and Smith, S. L.: Change in discontinuous permafrost in the Alaska Highway corridor examined by repeated electrical resistivity tomography and ground temperature monitoring, northwest Canada, in: Proceedings of the 10th International Conference on Permafrost, Potsdam, Germany, 2016.
Loke, M. H. and Barker, R. D.: Rapid least-squares inversion of apparent resistivity pseudosections by a quasi-Newton method, Geophys. Prospect., 44, 131–152, 1996.
Loke, M. H., Acworth, I., and Dahlin, T.: A comparison of smooth and blocky inversion methods in 2D electrical imaging surveys, Explor. Geophys., 34, 182–187, https://doi.org/10.1071/EG03182, 2003.
Maxwell, J. B.: Climatic regions of the Canadian Arctic Islands, Arctic, 34, 225–240, 1981.
Minsley, B. J., Pastick, N. J., Wylie, B. K., Brown, D. R. N., and Andy Kass, M.: Evidence for nonuniform permafrost degradation after fire in boreal landscapes, J. Geophys. Res.-Earth, 121, 320–335, https://doi.org/10.1002/2015JF003781, 2016.
Morse, P. D., Wolfe, S. A., Kokelj, S. V., and Gaanderse, A. J. R.: The occurrence and thermal disequilibrium state of permafrost in forest ecotopes of the Great Slave Region, Northwest Territories, Canada, Permafrost Periglac., 27, 145–162, https://doi.org/10.1002/ppp.1858, 2016.
Ou, C., Leblon, B., Zhang, Y., LaRocque, A., Webster, K., and McLaughlin, J.: Modelling and mapping permafrost at high spatial resolution using Landsat and Radarsat images in northern Ontario, Canada: Part 1 – model calibration, Int. J. Remote Sens., 37, 2727–2750, https://doi.org/10.1080/01431161.2016.1157642, 2016a.
Ou, C., LaRocque, A., Leblon, B., Zhang, Y., Webster, K., and McLaughlin, J.: Modelling and mapping permafrost at high spatial resolution using Landsat and Radarsat-2 images in Northern Ontario, Canada: Part 2 – regional mapping, Int. J. Remote Sens., 37, 2751–2779, https://doi.org/10.1080/01431161.2016.1151574, 2016b.
Pollack, H. N., Hurter, S. J., and Johnson, J. R.: Heat flow from the Earth's interior: analysis of the global data set, Rev. Geophys., 31, 267–280, 1993.
Quinton, W. L., Hayashi, M., and Chasmer, L. E.: Permafrost-thaw-induced land-cover change in the Canadian subarctic: implications for water resources, Hydrol. Process., 25, 152–158, https://doi.org/10.1002/hyp.7894, 2011.
Riseborough, D. W.: Exploring the parameters of a simple model of the permafrost-climate relationship, PhD Thesis, Carleton University, Ottawa, 2004.
Roberts, B. A., Simon, N. P. P., and Deering, K. W.: The forests and woodlands of Labrador, Canada: ecology, distribution and future management, Ecol. Res., 21, 868–880, https://doi.org/10.1007/s11284-006-0051-7, 2006.
Romanovsky, V. E., Drozdov, D. S., Oberman, N. G., Malkova, G. V., Kholodov, A. L., Marchenko, S. S., Moskalenko, N. G., Sergeev, D. O., Ukraintseva, N. G., Abramov, A. A., Gilichinsky, D. A., and Vasiliev, A. A.: Thermal state of permafrost in Russia, Permafrost Periglac., 21, 136–155, https://doi.org/10.1002/ppp.683, 2010.
Sannel, A. B. K., Hugelius, G., Jansson, P., and Kuhry, P.: Permafrost Warming in a Subarctic Peatland – Which Meteorological Controls are Most Important?, Permafrost Periglac., 27, 177–188, https://doi.org/10.1002/ppp.1862, 2016.
Schaefer, K., Zhang, T., Bruhwiler, L., and Barrett, A. P.: Amount and timing of permafrost carbon release in response to climate warming: Amount and timing of permafrost carbon release, Tellus B, 63, 165–180, https://doi.org/10.1111/j.1600-0889.2011.00527.x, 2011.
Schuur, E. A. G., McGuire, A. D., Schädel, C., Grosse, G., Harden, J. W., Hayes, D. J., Hugelius, G., Koven, C. D., Kuhry, P., Lawrence, D. M., Natali, S. M., Olefeldt, D., Romanovsky, V. E., Schaefer, K., Turetsky, M. R., Treat, C. C., and Vonk, J. E.: Climate change and the permafrost carbon feedback, Nature, 520, 171–179, https://doi.org/10.1038/nature14338, 2015.
Seppälä, M.: An experimental study of the formation of palsas, in: Proc. 4th Can. Permafrost Conf, available at: http://136.159.35.81/cpc/CPC4-36.pdf (last access: 8 March 2015), 36–42, 1982.
Seppälä, M.: Synthesis of studies of palsa formation underlining the importance of local environmental and physical characteristics, Quaternary Res., 75, 366–370, https://doi.org/10.1016/j.yqres.2010.09.007, 2011.
Shaoling, W., Huijun, J., Shuxun, L., and Lin, Z.: Permafrost degradation on the Qinghai-Tibet Plateau and its environmental impacts, Permafrost Periglac., 11, 43–53, https://doi.org/10.1002/(SICI)1099-1530(200001/03)11:1<43::AID-PPP332>3.0.CO;2-H, 2000.
Shur, Y. L. and Jorgenson, M. T.: Patterns of permafrost formation and degradation in relation to climate and ecosystems, Permafrost Periglac., 18, 7–19, https://doi.org/10.1002/ppp.582, 2007.
Sjöberg, Y., Marklund, P., Pettersson, R., and Lyon, S. W.: Geophysical mapping of palsa peatland permafrost, The Cryosphere, 9, 465–478, https://doi.org/10.5194/tc-9-465-2015, 2015.
Smith, M. W. and Riseborough, D. W.: Climate and the limits of permafrost: a zonal analysis, Permafrost Periglac., 13, 1–15, https://doi.org/10.1002/ppp.410, 2002.
Smith, S. L. and Bonnaventure, P. P.: Quantifying Surface Temperature Inversions and Their Impact on the Ground Thermal Regime at a High Arctic Site, Arct. Antarct. Alp. Res., 49, 173–185, https://doi.org/10.1657/AAAR0016-039, 2017.
Swindles, G. T., Morris, P. J., Mullan, D., Watson, E. J., Turner, T. E., Roland, T. P., Amesbury, M. J., Kokfelt, U., Schoning, K., Pratte, S., Gallego-Sala, A., Charman, D. J., Sanderson, N., Garneau, M., Carrivick, J. L., Woulds, C., Holden, J., Parry, L., and Galloway, J. M.: The long-term fate of permafrost peatlands under rapid climate warming, Sci. Rep.-UK, 5, 17951, https://doi.org/10.1038/srep17951, 2016.
Tarnocai, C.: The effect of climate change on carbon in Canadian peatlands, Global Planet. Change, 53, 222–232, https://doi.org/10.1016/j.gloplacha.2006.03.012, 2006.
Tarnocai, C.: The impact of climate change on Canadian peatlands, Can. Water Resour. J., 34, 453–466, 2009.
Thibault, S. and Payette, S.: Recent permafrost degradation in bogs of the James Bay area, northern Quebec, Canada, Permafrost Periglac., 20, 383–389, https://doi.org/10.1002/ppp.660, 2009.
Turetsky, M. R., Wieder, R. K., Vitt, D. H., Evans, R. J., and Scott, K. D.: The disappearance of relict permafrost in boreal north America: Effects on peatland carbon storage and fluxes, Glob. Change Biol., 13, 1922–1934, https://doi.org/10.1111/j.1365-2486.2007.01381.x, 2007.
Van Everdingen, R.: Palsa, Multi-language glossary of permafrost and related ground-ice terms, National Snow and Ice Data Center, Boulder, Colorado, USA, 2005.
van Vuuren, D. P., Edmonds, J., Kainuma, M., Riahi, K., Thomson, A., Hibbard, K., Hurtt, G. C., Kram, T., Krey, V., Lamarque, J.-F., Masui, T., Meinshausen, M., Nakicenovic, N., Smith, S. J., and Rose, S. K.: The representative concentration pathways: an overview, Climatic Change, 109, 5–31, https://doi.org/10.1007/s10584-011-0148-z, 2011.
Vincent, L. A., Wang, X. L., Milewska, E. J., Wan, H., Yang, F., and Swail, V.: A second generation of homogenized Canadian monthly surface air temperature for climate trend analysis, J. Geophys. Res.-Atmos., 117, D18, https://doi.org/10.1029/2012JD017859, 2012.
Vorren, K.-D.: The first permafrost cycle in Færdesmyra, eastern Finnmark, Norway?, Nor. Geogr. Tidsskr. Nor. J. Geogr., 1–8, 114–121, https://doi.org/10.1080/00291951.2017.1316309, 2017.
Way, R. G. and Lewkowicz, A. G.: Investigations of discontinuous permafrost in coastal Labrador with DC electrical resistivity tomography, in: Proceedings of GéoQuebec: 68th Canadian Geotechnical Conference and 7th Canadian Permafrost Conference, Québec City, Canada, 8 pp., 2015.
Way, R. G. and Lewkowicz, A. G.: Modelling the spatial distribution of permafrost in Labrador–Ungava using the temperature at the top of permafrost, Can. J. Earth Sci., 53, 1010–1028, https://doi.org/10.1139/cjes-2016-0034, 2016.
Way, R. G. and Lewkowicz, A. G.: Environmental controls on ground temperature and permafrost in Labrador, northeast Canada, Permafrost Periglac., 29, 73–85, https://doi.org/10.1002/ppp.1972, 2018.
Way, R. G. and Viau, A. E.: Natural and forced air temperature variability in the Labrador region of Canada during the past century, Theor. Appl. Climatol., 121, 413–424, https://doi.org/10.1007/s00704-014-1248-2, 2015.
Way, R. G., Bell, T., and Barrand, N. E.: An inventory and topographic analysis of glaciers in the Torngat Mountains, northern Labrador, Canada, J. Glaciol., 60, 945–956, https://doi.org/10.3189/2014JoG13J195, 2014.
Way, R. G., Lewkowicz, A. G., and Bonnaventure, P. P.: Development of moderate-resolution gridded monthly air temperature and degree-day maps for the Labrador-Ungava region of northern Canada, Int. J. Climatol., 37, 493–508, https://doi.org/10.1002/joc.4721, 2017.
You, Y., Yu, Q., Pan, X., Wang, X., and Guo, L.: Application of electrical resistivity tomography in investigating depth of permafrost base and permafrost structure in Tibetan Plateau, Cold Reg. Sci. Technol., 87, 19–26, https://doi.org/10.1016/j.coldregions.2012.11.004, 2013.
Zhang, Y.: Spatio-temporal features of permafrost thaw projected from long-term high-resolution modeling for a region in the Hudson Bay Lowlands in Canada, J. Geophys. Res.-Earth, 118, 542–552, https://doi.org/10.1002/jgrf.20045, 2013.
Zhang, Y., Chen, W., and Cihlar, J.: A process-based model for quantifying the impact of climate change on permafrost thermal regimes, J. Geophys. Res., 108, D22, https://doi.org/10.1029/2002JD003354, 2003.
Zhang, Y., Chen, W., and Riseborough, D. W.: Disequilibrium response of permafrost thaw to climate warming in Canada over 1850–2100, Geophys. Res. Lett., 35, L02502, https://doi.org/10.1029/2007GL032117, 2008a.
Zhang, Y., Chen, W., and Riseborough, D. W.: Transient projections of permafrost distribution in Canada during the 21st century under scenarios of climate change, Global Planet. Change, 60, 443–456, https://doi.org/10.1016/j.gloplacha.2007.05.003, 2008b.
Zoltai, S. C.: Palsas and peat plateaus in central Manitoba and Saskatchewan, Can. J. Forest Res., 2, 291–302, 1972.
Zoltai, S. C. and Tarnocai, C.: Perennially frozen peatlands in the western Arctic and Subarctic of Canada, Can. J. Earth Sci., 12, 28–43, 1975.