the Creative Commons Attribution 4.0 License.
the Creative Commons Attribution 4.0 License.
Frazil-ice growth rate and dynamics in mixed layers and sub-ice-shelf plumes
David W. Rees Jones
Andrew J. Wells
The growth of frazil or granular ice is an important mode of ice formation in the cryosphere. Recent advances have improved our understanding of the microphysical processes that control the rate of ice-crystal growth when water is cooled beneath its freezing temperature. These advances suggest that crystals grow much faster than previously thought. In this paper, we consider models of a population of ice crystals with different sizes to provide insight into the treatment of frazil ice in large-scale models. We consider the role of crystal growth alongside the other physical processes that determine the dynamics of frazil ice. We apply our model to a simple mixed layer (such as at the surface of the ocean) and to a buoyant plume under a floating ice shelf. We provide numerical calculations and scaling arguments to predict the occurrence of frazil-ice explosions, which we show are controlled by crystal growth, nucleation, and gravitational removal. Faster crystal growth, higher secondary nucleation, and slower gravitational removal make frazil-ice explosions more likely. We identify steady-state crystal size distributions, which are largely insensitive to crystal growth rate but are affected by the relative importance of secondary nucleation to gravitational removal. Finally, we show that the fate of plumes underneath ice shelves is dramatically affected by frazil-ice dynamics. Differences in the parameterization of crystal growth and nucleation give rise to radically different predictions of basal accretion and plume dynamics, and can even impact whether a plume reaches the end of the ice shelf or intrudes at depth.
- Article
(3011 KB) - Full-text XML
- BibTeX
- EndNote
1.1 Frazil ice in the environment
Frazil-ice formation is an extremely rapid mode of ice growth occurring as the initial phase of ice growth in turbulent waters. Frazil ice forms as a suspension of crystals in oceans, lakes, rivers, and sub-glacial ice streams from liquid water supercooled beneath its freezing temperature (Martin and Kauffman, 1981; Lawson et al., 1998). Supercooled water at the surface of the ocean occurs when it is cooled efficiently by the atmosphere. Such conditions can occur in gaps in the ice pack (called leads) and in extensive areas of open water (called polynyas), as observed by Skogseth et al. (2009). In some Antarctic regions, frazil-ice growth in supercooled water also contributes to the accretion of platelet ice on the underside of sea ice (e.g. Gough et al., 2012; Langhorne et al., 2015).
Frazil ice can also form underneath floating ice shelves at the margins of the Antarctic continent. Plumes of relatively fresh, buoyant “ice shelf water” (ISW) flow along the underside of the ice shelves. These rise over a depth range of about a kilometre, a range associated with significant variation of the pressure-dependent freezing temperature of seawater, which varies by −0.76∘C km−1 with depth (Millero and Leung, 1976). Consequently, the temperature of a rising plume can fall beneath the in situ freezing temperature (Lewis and Perkin, 1986), triggering the formation of frazil ice. Some of the ice precipitates onto the base of the ice shelf, where it forms so-called marine ice, which has a granular texture. The presence of marine ice was inferred and subsequently observed by drilling boreholes through the ice shelf (Engelhardt and Determann, 1987; Oerter et al., 1992). Frazil-ice formation can affect the dynamics of these plumes by changing their buoyancy directly (because ice is less dense than water) and by changing their temperature and salinity.
It is just becoming possible to assess the role of frazil-ice formation on sea ice and ocean conditions through large-scale models (e.g. Galton-Fenzi et al., 2012; Wilchinsky et al., 2015; Smedsrud and Martin, 2015). Such models rely on previous theoretical work concerning frazil-ice dynamics, which was pioneered by Daly (1984). Models of frazil-ice dynamics have been applied to the study of frazil in the upper ocean (Svensson and Omstedt, 1994, 1998; Heorton et al., 2017) and also to the study of frazil ice beneath ice shelves (Jenkins and Bombosch, 1995; Khazendar and Jenkins, 2003; Smedsrud and Jenkins, 2004; Holland and Feltham, 2005; Jordan et al., 2014, 2015). The theory of frazil-ice dynamics involves parameterizations of a number of physical processes that affect the evolution of a population of ice crystals. In this paper, we revisit the theory of frazil-ice dynamics, taking into account new understanding of the microphysics of crystal growth (Rees Jones and Wells, 2015), before suggesting likely implications for these large-scale models.
1.2 Crystal growth rate
In a recent paper, Rees Jones and Wells (2015) presented numerical evidence that the growth rate of ice crystals has been significantly underestimated in some previous studies as detailed below. In this section, we briefly review this finding and explain the underlying physical ideas.
Frazil ice is observed to consist of roughly disk-shaped crystals that typically have a much greater radius R than thickness H (McFarlane et al., 2014). Crystal growth is predominantly radial, with attachment kinetics limiting growth in the basal plane and maintaining the disk-shaped geometry for crystals of modest size (Fujioka and Sekerka, 1974). The radial growth rate G of a frazil crystal depends on the rate at which the latent heat released by crystal growth is transported away from the crystal. In general, the radial growth rate can be written in the form
where ρi is the density of ice; L is the latent heat of solidification; Nu is the crystal Nusselt number, which equals 1 for purely diffusive growth and can be enhanced by flow; kl is the thermal conductivity of the liquid phase; ΔT is the amount of supercooling below the in situ freezing temperature; and f is a dimensionless geometric factor. A helpful way to interpret Eq. (1) is to rearrange it into an expression for the rate of crystal-mass growth, with the ice-crystal mass M=ρiπR2H. We find
The right-hand side is the product of the area for heat transfer A and the heat flux scale klΔT∕δT, where δT is a thermal boundary layer thickness. Numerical calculations of the temperature distribution around an ice crystal (an example is shown in Fig. 1) show that δT∝H near the crystal edges, which have an area A∝RH. However, δT∝R near the crystal faces, which have an area A∝R2. In either case, the ratio . Thus the scaling argument suggests f∝1 (cf. Eq. 2). It is interesting to note that the mass growth rate of spherical crystals is also proportional to crystal radius R, so the rate of latent heat release seems to depend on crystal size R but not on the details of the geometry.
We now consider three possible parameterizations of crystal growth, which we denote . Numerical calculations of the heat transfer by diffusion from a disk-shaped crystal (Rees Jones and Wells, 2015) show that the growth rate depends logarithmically on aspect ratio , which is similar to 1. Some previous studies are also consistent with the scaling f ∼ 1. For example, Svensson and Omstedt (1994) and Jenkins and Bombosch (1995) take f2=1. By contrast, some later studies are inconsistent with the scaling argument. For example, Smedsrud and Jenkins (2004), Holland et al. (2007), and Galton-Fenzi et al. (2012) take A∝RH and δT∝R, which gives a growth rate proportional to , i.e. a very much smaller growth rate. A further complication arises in that it is sometimes additionally assumed that the crystal aspect ratio is constant, rather than the crystal thickness H being constant. In this case, f3≡2h, which is a constant, like f2, but very much smaller (e.g. Smedsrud and Jenkins, 2004, take h=0.02). These papers are illustrative of a wider range of studies (e.g. Svensson and Omstedt, 1998; Khazendar and Jenkins, 2003; Holland and Feltham, 2005; Jordan et al., 2014, 2015; Wilchinsky et al., 2015; Smedsrud and Martin, 2015); recently it appears that growth law f3 has been used most commonly, if not exclusively. In summary, numerical calculations show that there is only weak dependence on aspect ratio: f1 is typically close to f2; however, f1 is some 10–100 times greater than f3, as illustrated in Fig. 2.
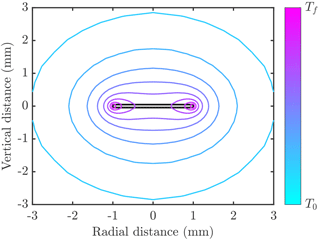
Figure 1Example of temperature distribution around a disk-shaped crystal (filled grey region outlined in black) of radius 1 mm and thickness 0.1 mm. Contours of temperature are shown varying between the freezing temperature Tf and the far-field temperature T0<Tf. In this example the crystal is growing into freshwater, and the thermal conductivity of ice is 4 times larger than than of water. The numerical calculations used to make this figure are described in Rees Jones and Wells (2015).
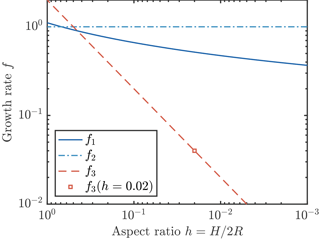
Figure 2Three parameterizations of crystal growth. The parameterization f1 (solid dark blue curve) is the result of a detailed numerical calculation (Rees Jones and Wells, 2015). Parameterizations f2 (dot–dash light blue curve) and f3 (dashed red line) are obtained by scaling analysis, as described in the text. The growth rates f1 and f2 are comparable, but f3 is much smaller at typical small aspect ratios. We also indicate (square marker) the growth rate if a constant aspect ratio h=0.02 is assumed.
The presence of salt in seawater reduces the crystal growth rate because the supercooling is reduced and salt rejected by the growing crystal needs to diffuse away. Numerical calculations performed to investigate these effects (Rees Jones and Wells, 2015) support the scaling argument used to account for the effect of salt by Galton-Fenzi et al. (2012), which in turn was based on Holland and Jenkins (1999). For practical modelling purposes, the supercooling needs to be adjusted for the salt content of seawater, and the Nusselt number should be reduced to account for salt diffusion. A good approximation based on our numerical calculations is where a<0 is the rate of change of freezing temperature with salinity S, and DS is the diffusivity of salt in water.
2.1 Physical processes
How does the growth rate of an ice crystal affect the overall ice production rate of a system? To address this question we need to investigate “frazil-ice dynamics”. We follow the comprehensive framework of the influential reviews of Daly (1984, 1994), which accounts for the evolution of a crystal size distribution in time, in space, and in crystal size space. The evolution occurs through crystal nucleation, growth, flocculation, break-up, and transport by fluid motion. There is a high degree of uncertainty in the rate of each of these processes, which in turn drives uncertainty in predictions of crucial, environmentally relevant quantities, such as the total ice production rate.
2.2 Mathematical description
In this section we set out continuum equations that describe the evolution of frazil ice in a general framework that can be applied to a wide range of specific situations, before later focussing on examples of ice growth in a mixed layer and under ice shelves. Suppose that the size of a crystal can be characterized by a single length scale R, the radius of a disk-shaped crystal. We introduce the crystal number density n, which is defined as the number of crystals per unit volume of mixture per unit length in crystal size space. Other quantities can be derived from n. For example, the crystal concentration density c=nV, where V=πR2H is the volume of a disk-shaped crystal of thickness H, and the total crystal concentration . Note that C is the volume occupied by ice crystals per unit volume of mixture. The total number density . The density n is a function of time t, position x, and crystal size R, and it is governed by (cf. Daly, 1984)
where u is the fluid velocity and Dc is the crystal diffusivity. For turbulent flows, one approach is to parameterize the effects of fluid flow u as an enhanced diffusivity, sometimes called a turbulent or eddy diffusivity. The terms on the right-hand side represent frazil dynamics terms, on which we elaborate below.
The first term represents crystal growth, where G is the radial crystal growth rate discussed in Sect. 1.2. For compactness, we rewrite Eq. (1) as
where , and f is given by one of the three growth laws. The effect of this term is to shift the crystal size distribution to larger radii R, without increasing the total number of crystals. Thus growth increases crystal concentration but not the number of crystals.
The second term represents removal due to buoyant crystal rise, where W is an effective crystal rise speed. It is well established that larger crystals rise faster. Recent experimental observations and the parameterization of crystal rise speed are discussed in McFarlane et al. (2014). For the simplest treatment, we use a linear relationship,
with W0=16 s−1, because more complicated parameterizations do not fit the data much better than this simple fit. Indeed, such a relationship is consistent with the crystal rise being a Stokes settling velocity under the assumption that crystal thickness is constant. The drag is proportional to μWR, and the buoyancy is proportional to ΔρgR2H, where Δρ is the density difference between ice and water. Thus balancing drag and buoyancy yields W∝R.
The third term represents the net effect of the processes of flocculation and break-up, where B is the rate. Positive B corresponds to flocculation greater than break-up. Note that this term is constructed to conserve crystal volume, which is physically appropriate. To see this, multiply Eq. (3) by V and integrate from R=0 to R=∞. The total volume of ice is unaffected by the flocculation term. To our knowledge, this term has received relatively little attention within the frazil-ice literature. One exception, Svensson and Omstedt (1994), includes it and takes
As a technical aside, we note that Svensson and Omstedt (1994) describe their flocculation law as linear. However, this linearity applies only to the particular discrete set of equations they present, which use logarithmically spaced size classes. At the continuum level, the quadratic Eq. (6) applies. There is no direct evidence for the form of this relationship, although Svensson and Omstedt (1994) found it helpful in fitting some experimental data. Their choice matches the intuition that larger crystals might flocculate more readily since they are more likely to come into near contact with other crystals. However, it does not account for the fact that flocculation should increase with frazil concentration. A fuller treatment would take B as an integral of an interaction kernel K multiplied by number density over crystal radius, . This kind of approach has proved fruitful in the theory of sea-ice thickness and floe-size distributions (Thorndike, 2000; Godlovitch et al., 2011; Horvat and Tziperman, 2015; Toppaladoddi and Wettlaufer, 2015). In view of the considerable uncertainties in parameterizing flocculation, we neglect this process in all of our calculations (B=0). Indeed, even the sign of B is uncertain, as it not clear whether flocculation or break-up dominates (and the balance of these processes may well depend on the fluid dynamical conditions). If break-up dominates (perhaps in more turbulent environments), setting B=0 might overestimate the number of large crystals. Conversely, if flocculation dominates, setting B=0 might underestimate the number of large crystals.
The fourth term represents crystal nucleation, where is nucleation rate. We use the mathematical construct of a delta function δ(R) in Eq. (3) to express the fact that nucleated crystals are extremely small. By integrating Eq. (3) from R=0 to , it can be shown that the nucleation flux balances the growth of small crystals, and
since the other terms give rise to contributions that are proportional to and vanish in the limit . After some primary nucleation event, nucleation is assumed to be dominated by secondary nucleation, sometimes called collisional breeding. Indeed, Daly (1984) argues that homogenous and heterogenous nucleation are extremely unlikely to occur in natural systems because the levels of supercooling achieved are less than 1 ∘C. We follow, for instance, Svensson and Omstedt (1994) and suppose that collisions between crystals cause microscopic pieces of ice to break off, which in turn become new crystals with very small radius. The total nucleation rate depends on the the rate at which a volume is swept out by a crystal and the crystal number density. We write
where
is an effective collisional velocity scale taken to be the geometric mean of a velocity scale based on turbulent motions (ϵ is the turbulent dissipation rate, ν is the kinematic viscosity) and one based on buoyant crystal rise. We define and use a value m2 s−1. The nucleation efficiency scale , where is a calibration parameter that limits the efficiency of secondary nucleation. Smedsrud (2002) points out that some of the nucleated crystals will be below the so-called “critical size” for crystals to grow, so it is plausible that , but it must be conceded that this parameterization is rather ad hoc. We use this formulation primarily for consistency with previous studies, to allow us to isolate the effect of crystal growth rate. It is simply a continuous version of that used by, for example, Svensson and Omstedt (1994), Smedsrud (2002), Smedsrud and Jenkins (2004), and Holland and Feltham (2005). Before the efficiency cap is reached, secondary nucleation is a quadratic in the number of crystals, leading to very rapid growth in crystal number.
2.3 Numerical methods to solve governing equations
Equation (3) can be discretized in radial space to facilitate numerical solution, following, for instance, Svensson and Omstedt (1994). The spatial problem is a standard advection–diffusion problem, so we do not discuss here how to discretize the left-hand side of Eq. (3) and focus on the crystal interaction terms on the right-hand side. Let Ri be a discrete set of points in radial space, where . We introduce the notation Wi=W(Ri), Gi=G(Ri), and . We work in terms of the total number of particles in size class i, denoted mi, which evolves according to
where
The discrete distribution n(Ri) can be recovered: , where . We note that Eq. (10) is only a first-order discretization in radial space, so an alternative approach could be to use a second-order discretization. This numerical representation is conservative, and we use a formulation of secondary nucleation (in terms of αi) that conserves crystal volume even when V1 is non-zero. Note that in the limit R1→0 and ΔRi→0 we recover the continuum equations discussed above.
Equation (10) is equivalent to Eq. (1) in Svensson and Omstedt (1994). They demonstrate that this model is capable of reproducing the main features of the laboratory experiments of Michel (1963) and Carstens (1966), so we do not include any experimental comparison here. However, we discuss (Sect. 3.3) how such consistency is insufficient to fully validate the model. For practical purposes, we find it advantageous to use a logarithmically spaced set of crystal sizes and test the accuracy of our discretization by increasing the number of size classes to 1024. We find that good accuracy can be achieved with 128 classes, but accuracy noticeably degrades beneath this (cf. Holland and Feltham, 2005). Software code to reproduce the calculations in the paper is available (Rees Jones, 2017).
3.1 Simplified governing equations
The upper layer of a lake or ocean can sometimes be approximated as a well-mixed layer, an approximation that can also be applied to the laboratory experiments of Michel (1963) and Carstens (1966). We assume that background turbulent stirring is sufficient to keep the layer well mixed such that all physical quantities (temperature and crystal size distribution) are uniform over the layer. Such turbulence might be driven, for example in the oceans, by wind, waves, and buoyancy-driven convection. A turbulent flow is mechanically driven in laboratory experiments. Thus we only need to solve evolution equations for average physical quantities across the layer. This approximation also significantly simplifies Eq. (3) while still retaining the key frazil-ice dynamics. Averaging Eq. (3) over the mixed layer of depth D yields
where is an effective gravitational removal term. In reality, crystal concentration would tend to decrease with depth (Svensson and Omstedt, 1998) because of crystal buoyancy. Nevertheless, is an appropriate scaling relationship because removal increases with crystal rise velocity W and decreases with mixed-layer depth D because turbulent eddies act to mix crystals down to that depth range. This type of depth-integrated representation of the process of gravitational removal has been used successfully in previous studies of turbulent, particle-laden gravity currents (Bonnecaze et al., 1993).
The temperature of the mixed layer or tank evolves due to heat extraction to the atmosphere per unit volume Q and release of the latent heat of solidification:
ρl is the density of the liquid phase, and cl is the specific heat capacity of the liquid phase. There is an implicit assumption that the ice removed through gravitational settling does not inhibit heat loss to the atmosphere (by ice accumulation at the surface); otherwise Q would decrease over time. Note that, in this section, we neglect the depth dependence of the freezing temperature, which affects the supercooling ΔT. This is a good approximation provided the mixed layer is relatively shallow, but it would not be appropriate for mixed layers deeper than O(100 m).
3.2 Rapid growth – the frazil-ice explosion
In a typical experiment, a relatively small number of crystals are seeded into supercooled water, for example by running a saw blade over a block of ice. Over time, the number of crystals undergoes a period of rapid growth, producing an optically dense suspension (Hanley and Tsang, 1984). Svensson and Omstedt (1994) include a figure from S. F. Daly (1992, personal communication) showing a period of rapid growth in the number of crystals: the total number of crystals increased by 4 orders of magnitude over around 250 s. The frazil-ice explosion was observed to reduce the supercooling in the mixed layer to a small residual amount.
Our goal in this section is to ascertain the conditions under which such a frazil-ice explosion can occur and hence to determine conditions for their occurrence in geophysical settings as well as laboratory experiments. To motivate our approach, we consider the time evolution of a mixed layer seeded with some small initial concentration and cooled beneath freezing by a constant flux Q. The initial size distribution of crystals is taken to be uniform on [0,2R0], and we vary the total number of crystals to vary the initial concentration. Throughout this section, we fix the crystal growth law f2=1. We present an example of such a calculation in Fig. 3. In one calculation, with slightly less ice initially present (blue curve in Fig. 3), all of the ice is removed (by gravitational rise), and supercooling continues to build. Eventually we would expect heterogenous and later homogenous nucleation to occur (Daly, 1984), but we do not model these processes. In the other calculation, with slightly more ice initially present (red curve in Fig. 3), the ice concentration increases rapidly before attaining a steady state in which supercooling is almost exhausted (see Sect. 3.4). We consider this an example of a “frazil-ice explosion” of the kind observed in experiments. A greater initial seeding concentration of ice always makes an explosion more likely, so we investigate the minimum initial concentration (or equivalently number of crystals, if the initial size is fixed) required to trigger an explosion as a function of the other parameters of the system.
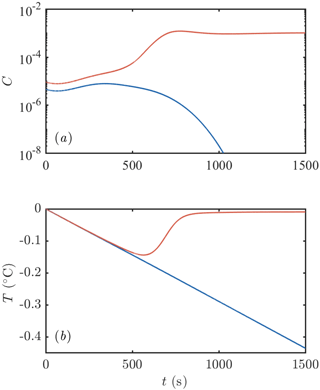
Figure 3Example of the evolution of (a) frazil-ice concentration and (b) supercooling after an initial seeding event. One calculation is initialized with slightly more crystals than the other: the red curve has an initial crystal number density of 106 m−3 compared to 5 × 10⁵ m−3 for the blue curve. The former leads to a frazil-ice explosion with a large concentration of ice and all the supercooling exhausted. The latter eventually loses all of the ice initially present. Calculations were performed with Q=1200 W m−3, m2 s−3, D=1 m, m−3, R0=0.2 mm, and H=0.05 mm. The parameter values are similar to Svensson and Omstedt (1994).
We summarize the results of our investigations in Fig. 4. Increasing the turbulent intensity ϵ (Fig. 4a) increases the rate of secondary nucleation, since crystals are more likely to collide, which promotes frazil explosions. Increasing the mixed-layer depth D (Fig. 4b) reduces the rate at which crystals are removed gravitationally, which again promotes frazil explosions. A slightly weaker effect (note the different scale on the axis) is that increasing the cooling rate Q (Fig. 4c) promotes frazil explosions. The direct mechanism is that higher cooling promotes ice growth, increasing the frazil concentration. However, there is also an important indirect mechanism: ice growth shifts the crystal size distribution to larger crystal sizes, which are more likely to collide, leading to greater secondary nucleation. This effect is somewhat offset by the fact that larger crystals are also more effectively removed by gravitational rise.
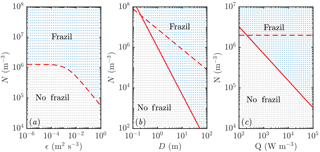
Figure 4Regime diagram showing how the parameters of the system affect the likelihood of a frazil explosion (coloured blue and labelled “frazil” in each panel) or collapse of the ice population by gravitational settling (coloured grey and labelled “no frazil”). Each dot represents a separate numerical simulation. Increased (a) turbulent intensity ϵ, (b) mixed-layer depth D, and (c) cooling rate Q all promote frazil explosions. Apart from the panels in which they are varied, the parameters used are as in Fig. 3. The dashed and solid curves show the predictions of scaling analysis described in the main text. The dashed curves correspond to Eq. (18) and the solid curves to Eq. (22). Note that in panel (a) these equations give the same predictions, so only one curve is plotted.
These mechanisms can be understood more quantitatively by scaling analysis. First, we integrate Eq. (13) across crystal sizes to obtain an evolution equation for the total number density of crystals (recalling the growth shifts the size distribution but does not change the total number of crystals):
If gravitation removal were to act alone, we would find that
where is the mean crystal size. Thus crystals are removed exponentially on a settling timescale s (based on D=1 m and mm, the initial average crystal radius), which is commensurate with the evolution timescale observed in Fig. 3.
Second, we consider a balance between secondary nucleation and gravitational removal. We expect a frazil explosion when the secondary nucleation (Eq. 8) is much greater than gravitational removal:
If were given by the initial average crystal radius, then in terms of the external parameters of the system shown in Fig. 4 we would naively expect Ncrit. to decrease with turbulent intensity (inversely proportional to U0) and mixed-layer depth (inversely proportional to D), and be independent of Q. The first prediction (Fig. 4a) is supported by the numerical results. However, the second prediction (Fig. 4b) and third prediction (Fig. 4c) are not (the dashed curves do not agree with the numerical results). The resolution of these discrepancies lies in recognizing that the average crystal size is not a constant external parameter (i.e. set by the initial condition as a consequence of the seeding strategy) but rather depends on crystal growth.
We now suppose that the average crystal size is determined by the amount a crystal can grow over a crystal removal timescale τ, i.e.
This is a good approximation provided Gτ is much larger than the initial crystal size. The growth rate G is proportional to the supercooling; in particular . We can estimate the supercooling from the heat balance Eq. (14), in which the crystal growth term is negligible until the frazil explosion occurs. We find
We substitute Eq. (20) into Eq. (19) and recall that . Rearranging for , we find
We then substitute this estimate for into Eq. (18) and obtain
Equation (22) is very appealing because it can explain nearly all the results presented in Fig. 4a, b, and c (the solid curves agree with the numerical results much better than the dashed curves). The heat flux result is perhaps slightly affected by the initial crystal size distribution at small Q, but overall the agreement is very good.
In terms of our crystal growth rate, our scaling argument in Eq. (22) suggests that the faster growth laws would necessitate a smaller initial concentration of ice to trigger a frazil explosion, something that we observe in numerical experiments (cf. Fig. 6).
In conclusion, we find that the explosive growth of frazil ice requires a sufficiently large number of seed crystals. Seed crystals might be supplied from the atmosphere as sea spray freezes, from broken-off pieces of an ice shelf above a plume, or (perhaps unlikely) by sediment acting as nuclei for crystal growth. Such growth is promoted by high turbulent intensity, a deeper mixed layer, and strong cooling rate (or larger seed crystals).
3.3 Transient evolution
Figure 5 shows an example of how the crystal size distribution (CSD) evolves when a frazil explosion occurs. Initially, the larger seed crystals are removed gravitationally, while crystals are nucleated at the smallest size due to collisional breeding. These crystals grow. Note the “travelling-wave” type solutions evident at 100 and 200 s with the radius of crystals increasing over time. Indeed, there are travelling-wave solutions to Eq. (13) if crystal growth is the only process that affects the CSD evolution. Finally, a steady-state distribution is achieved, which we discuss in more detail in Sect. 3.4.
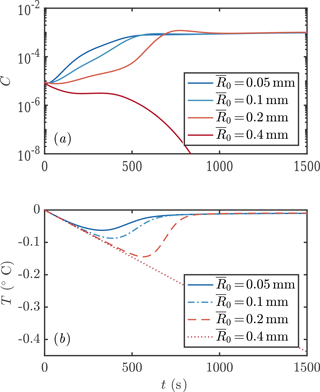
We next consider the impact of different parameterizations of crystal growth f1−3. One main experimental measurement is mixed-layer temperature as a function of time. We find that this observable is sensitive to the crystal growth rate, as shown in Fig. 6. Faster crystal growth means a faster increase in crystal concentration, with the peak growth rate occurring several hundred seconds earlier. This in turn means that the peak supercooling is lower, because of the latent heat liberated by crystal growth. These differences are experimentally detectable.
Our new parameterization produces broadly similar transient evolution curves to the older model of Svensson and Omstedt (1994). It is therefore encouraging to note that Svensson and Omstedt (1994) were able to use their model to explain the experimental observations of degree of supercooling. However, demonstration of consistency with experiments does not conclusively show that a parameterization of crystal growth is correct, because other factors also affect the predicted supercooling, such as the size distribution of the initial seed crystals (which was not controlled in the experiments of Michel (1963) and Carstens (1966) that Svensson and Omstedt (1994) used to test their model) as shown in Fig. 7. Larger seed crystals grow more slowly and achieve greater maximum supercooling, which produces similar predictions to using a slower growth-rate law. This suggests that it is worthwhile for experimentalists to try to measure crystal sizes, as well as supercooling, in order to discriminate between models.
In conclusion, we have shown that crystal growth rate significantly affects the transient evolution of the crystal size distribution. Further experimental observations are needed to discriminate between models. Geophysically, we note that the differences between models occur on timescales of a few hundred seconds. This timescale is proportional to mixed-layer depth, so a deeper mixed layer would be associated with even longer transient frazil-ice dynamics. The transient differences are therefore likely to be most significant to systems where the frazil ice is subject to processes that act on similar or shorter timescales to the transient relief of supercooling. (For processes that act on longer timescales, the frazil-ice dynamics would have equilibrated to the steady states discussed in the next section.) For example, a lateral current of 0.1 m s−1 would take 100 s to move material across a lead that is 10 m wide. These numbers offer some indication that these transient model differences may well be geophysically significant. Indeed, we show an example in the context of Ice Shelf Water plumes in Sect. 4.
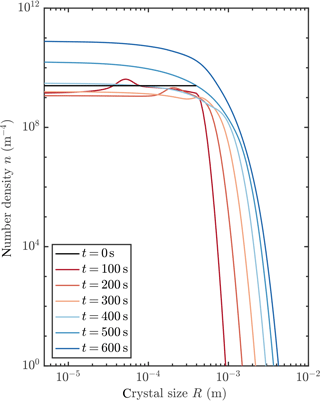
Figure 5Evolution of crystal size distribution for initial conditions that permit a frazil explosion (red curve in Fig. 3).
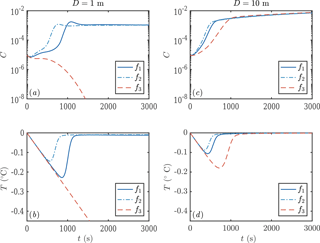
Figure 6Evolution of crystal concentration (a, c) and mixed-layer temperature (b, d) using the three growth rate formulae discussed in Sect. 1.2. Using D=1 m leads to frazil explosions for growth laws 1 and 2, but the population collapses for growth law 3. For a deeper mixed layer D=10 m, all the growth laws result in a frazil explosion. Other parameters are as in Fig. 3.
3.4 Steady states
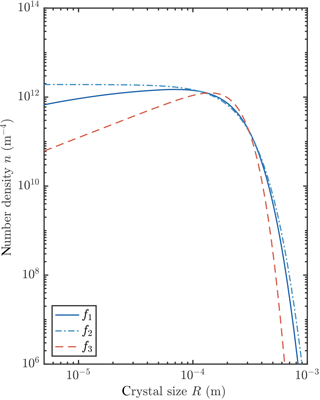
We observed that the crystal size distribution evolves to a steady state. In this section we study these steady states by numerically integrating our transient model to reach a steady state for each of the three growth laws, and by finding analytical steady-state solutions of the governing equations for two of the growth laws. We present an example of numerically obtained steady states in Fig. 8. Changing the growth law subtly shifts the crystal size distribution.
In order to understand better the physical processes involved in maintaining this steady state, we analyse the steady-state solutions of Eq. (13), namely
where . We start with the growth law f=f2 (a constant). First, we integrate Eq. (23) when R>0 to obtain
Second, at , Eq. (7) implies that
where we assume that the total number of crystals exceeds so . This is reasonable because there is a very large number of crystals after a frazil-ice explosion has occurred. Equation (25) can be manipulated by substituting in Eq. (24) and integrating to show that This expression allows the steady-state supercooling to be calculated since . Third, we use the overall heat balance from Eq. (14) in steady state,
to determine the unknown prefactor n0. Finally, we calculate the average crystal size (mean) , the total number of crystals N, and the total crystal concentration C.
We then repeat the analysis for the growth law . We report the results in Table 1.
Table 1Steady-state crystal size distribution results for two growth laws. Note that Γ() here denotes the Gamma function. The steady-state supercooling can be computed using .
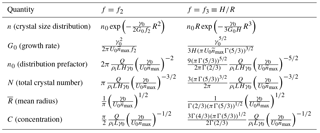
We conclude from this analysis that the average crystal radius is insensitive to the crystal growth rate. This initially surprising result can be understood by considering that the balance between growth and precipitation at large crystal sizes gives , while the balance between growth and nucleation of the smallest crystals gives . The growth-rate-dependent term G0f can be eliminated between these equations, and
in agreement with the expressions in Table 1. Therefore average crystal size depends on (1) secondary nucleation (affected by turbulent intensity through U0 and efficiency of secondary nucleation through , where more secondary nucleation means smaller crystals) and on (2) gravitational removal (a larger gravitational removal rate prefactor γ0 means larger crystals). The first effect is readily understood: secondary nucleation creates tiny crystals. The second is more subtle because gravitational removal tends to remove larger crystals. However, secondary nucleation increases more rapidly as a function of crystal radius than gravitational removal. Thus enhanced gravitational settling enhances the removal of large crystals and mutes their efficiency in driving secondary nucleation, leading to the scaling given in Eq. (27). In geophysical settings and laboratory experiments, the crystal rise velocity, mixed-layer depth, and turbulent intensity can be measured much more easily than the efficiency of secondary nucleation. We therefore suggest choosing this parameter to match with observations of average crystal size. For example, choosing the reduced value m−3 would give an average crystal size of about 0.5 mm.
The total crystal concentration C is also insensitive to the crystal growth rate. We can show this by continuing our scaling analysis as follows. From Eq. (26), we estimate
where we have used from the growth-versus-settling balance. If we define a surface heat flux scale and recall , we find
Thus at steady state, the total amount of frazil ice is determined by a balance between the surface heat flux and the rate of export of latent heat in the form of frazil ice that is removed gravitationally. This steady-state balance is unaffected by crystal growth rate (at least in the absence of advective processes).
Frazil ice also forms in plumes of ISW beneath floating ice shelves. A plume is fed by the discharge of subglacial meltwater at the start of the shelf and by melting from the shelf itself. These meltwaters are relatively fresh, so the plume rises buoyantly. The plume entrains ocean waters, resulting in an intermediate temperature and salinity called ISW. A full examination of the dynamics of these plumes is beyond the scope of this paper, and we refer the reader to previous studies by Jenkins (1991), Jenkins and Bombosch (1995), and Smedsrud and Jenkins (2004). Instead we focus more narrowly by considering a simple case study that illustrates the possible impact of different treatments of frazil-ice processes on the dynamics of an ISW plume. A linear ice shelf rises from a depth of 1400 m below sea level to a depth of 285 m below sea level over a horizontal distance of 600 km. The ambient seawater is treated as an approximation to High Salinity Shelf Water (HSSW) with a linear stratification. Jenkins and Bombosch (1995) conceived this setting as a simple configuration that is representative of a large Antarctic ice shelf. The plume becomes supercooled as it ascends the ice shelf base because of the fall in pressure and consequent change in the freezing temperature. This supercooling leads to a combination of frazil-ice formation and direct basal freezing. Frazil ice increases the plume buoyancy and so accelerates the plume. Thus we might naively expect that faster crystal growth would lead to higher frazil concentrations and faster-flowing plumes. In this section, we show that this expectation is confounded by complex feedbacks between plume dynamics and frazil-ice processes.
The plume model accounts for the evolution of plume depth D, the depth-averaged plume velocity U, temperature T, and salinity S as a function of distance s along the ice shelf. Note that we also average the freezing temperature over the depth of the plume. The frazil-ice dynamics part of the model is essentially the same as that described in Eq. (3) but integrated over the depth of the plume. The depth-averaged frazil crystal size distribution evolves according to
where p(R) is the rate at which frazil precipitates onto the base of the ice shelf.
We retain the approach of Smedsrud and Jenkins (2004) as far as possible. The full set of governing equations is described in that paper. Software code to reproduce the calculations in the paper is available (Rees Jones, 2017). Note that our thermal calculation includes an estimate of the conductive heat flux into the ice shelf (based on the thermal boundary layer parameterization of Holland and Jenkins (1999), using a core ice-shelf temperature of −15∘C; A. Jenkins, personal communication, 2014). We use a large number of crystal size classes in the discrete calculation (1000), to ensure the crystal size distribution is well resolved. By contrast Smedsrud and Jenkins (2004) use only 10 classes. This affects the quantitative results but not the qualitative behaviour of the system. One important difference compared to the mixed-layer models (Sect. 3) is that the precipitation rate depends both on crystal rise velocity and on the plume velocity, because precipitation from a turbulent plume occurs when crystal buoyancy exceeds the turbulent shear stress acting to keep it in suspension. Thus precipitation occurs when the plume velocity U is less than some critical velocity Uc that can be expressed in terms of a critical Shields number.
4.1 Results
The dynamics of an ISW plume can be very sensitive to frazil-ice processes. Our numerical investigation found two basic types of behaviour. Sometimes frazil ice precipitates out over a relatively short distance of O(10 km) and the plume itself is barely affected by the frazil. At other times the frazil ice is sustained over O(100 km) and the plume is rendered more buoyant. We illustrate this range of behaviour and explain the underlying physical mechanisms by varying the rates of secondary nucleation and crystal growth (Fig. 9). In terms of secondary nucleation, we consider no nucleation m−3, intermediate nucleation m−3 comparable to Smedsrud and Jenkins (2004), and high nucleation m−3 comparable to Svensson and Omstedt (1994). In terms of crystal growth, we contrast a slow growth law and a fast growth law. For a slow growth law, we use Smedsrud and Jenkins (2004), one of the class of growth laws we labelled f3 previously. For a fast growth law, we use Rees Jones and Wells (2015), labelled f1 previously. Calculations with the growth law f2 introduced in Sect. 1.2 are very similar to the results with f1.
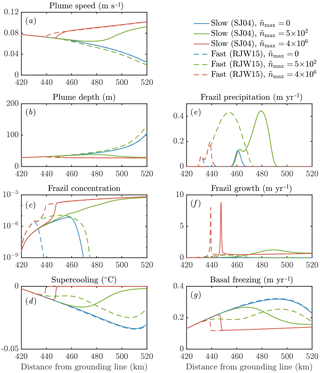
Figure 9The sensitivity of the dynamics of a frazil-laden plume to parameterizations of crystal growth and nucleation. We perform calculations with no secondary nucleation (blue), intermediate nucleation (green), and high nucleation (red). Solid lines denote slow crystal growth SJ04 (Smedsrud and Jenkins, 2004), one of the class of growth laws we labelled f3 previously. Dashed lines denote fast crystal growth RJW15 (Rees Jones and Wells, 2015), previously labelled f1. Calculations with the growth law f2 based on SO94 (Svensson and Omstedt, 1994) are very similar to the RJW15 results. Note that in the model of SJ04 a constant aspect ratio of 0.02 is assumed, whereas in SO94 and RJW15 a constant thickness 0.05 mm is assumed. Note also that the solid red curve in panel (e) is approximately zero.
Our sensitivity experiments (Fig. 9) show that secondary nucleation is needed to sustain the frazil-ice population. We would also expect a continuous source of small seed crystals to have a similar effect, were the source sufficiently large. In calculations without nucleation, the crystals precipitate out, and the total concentration remains small, insufficient to affect the plume dynamics. The faster-growing crystals precipitate more over a shorter distance (dashed blue curve, panel e), because larger crystals rise faster and are more difficult to keep in suspension. After the frazil ice precipitates out of the plume, supercooling increases (blue curves, panel d), leading to a high rate of direct basal freezing (blue curves, panel g).
By contrast, a high nucleation rate triggers rapid growth of frazil ice, which relieves the supercooling in the plume (red curves, panels c, d, f). This behaviour is analogous to the frazil-ice explosion we observed previously (Sect. 3.2), and it occurs when secondary nucleation exceeds crystal removal by precipitation. The increased frazil concentration leads to a more buoyant plume, causing it to accelerate and have a slightly smaller depth D (red curves, panels a, b). Precipitation is relatively unimportant (red curves, panel e) as a result of a positive feedback: a faster-flowing plume keeps crystals suspended more easily. Furthermore, nucleation produces small crystals, which again are kept in suspension more easily. A faster crystal growth rate is associated with a faster increase in crystal concentration along the slope, although similar quasi-steady states are reached after the supercooling is almost exhausted. As we found previously (Eq. 29), the quasi-steady ice concentration reflects the overall energy balance of the system, rather than the growth dynamics.
The case of intermediate nucleation rate illustrates the surprising interplay between nucleation, growth, and precipitation of crystals. The calculation with a faster growth rate initially leads to a greater concentration of frazil ice, but the ice concentration is eventually overtaken by the slower growth rate calculation (green curves, panel c). Faster growth leads to larger crystals, which in turn are more readily precipitated (dashed green curve, panel e). This means that the crystal concentration eventually decreases, reducing the plume buoyancy and causing it to decelerate (dashed green curve, panel a). In this case, the plume thickness starts to increase rapidly as the plume begins to intrude at depth (dashed green curve, panel b). By contrast, the case of slower growth rate eventually reaches a crystal concentration comparable to the calculations with a higher crystal nucleation rate.
In terms of the large-scale dynamics, different parameterizations of crystal growth rate and nucleation can be the difference between a plume that is reinvigorated by frazil ice and reaches the end of the shelf and a plume that decelerates and intrudes at depth. This behaviour is likely to affect the ocean circulation and water mass transformation in the shelf seas around Antarctica. The differences between models could in principle be observed by considering the amount of frazil precipitation relative to basal freezing. The total amount of frazil formation also differs between the models (panels c, f). These differences are surprising: faster growth can lead to less frazil-ice formation in total if it is removed from suspension before it can multiply. This suggests that small-scale frazil-ice processes, which are hard to constrain in models, can have major implications for our understanding of the dynamics of plumes of ISW beneath Antarctica's floating ice shelves.
The theory of frazil-ice dynamics pioneered by Daly (1984) encompasses the nucleation, growth, and removal of frazil ice. It describes the evolution of the size distribution of a population of crystals. We have applied this theory to understand ice formation in a supercooled ocean mixed layer and in a plume of ISW underneath a floating ice shelf. Understanding frazil-ice processes is significant to our understanding of ice–ocean interaction in the earliest, most explosive phase of ice growth. We have identified critical conditions for a self-sustained frazil-ice explosion, which occurs when secondary nucleation exceeds crystal removal. Crystal growth rate affects such explosions by changing the crystal size distribution and also alters the transient evolution of frazil ice, promoting faster increases in frazil concentration. We determined steady-state crystal size distributions and found that these were relatively insensitive to crystal growth rate but were sensitive to secondary nucleation and crystal removal. Thus measurement of crystal sizes could be used to estimate the nucleation rate indirectly. Finally, we showed that the parameterization of crystal growth rate and nucleation can dramatically affect the fate of plumes of supercooled ice shelf water, with implications for ice accretion on ice shelves and ocean circulation. Although our understanding of crystal growth rate has advanced recently, our understanding of crystal nucleation remains limited. Our calculations suggest that this is potentially a significant uncertainty, and it is a topic ripe for future research.
Please see https://github.com/davidreesjones/frazil-dynamics for software code to reproduce calculations and figures in the paper (Rees Jones, 2017).
The authors declare that they have no conflict of interest.
We thank Grae Worster for comments on an earlier version of this
paper and Adrian Jenkins for discussing previous models of
frazil-laden plumes. This publication arises from research funded by the John Fell Oxford University Press (OUP) Research Fund,
and Andrew J. Wells also acknowledges financial support through the research programme of the European Union FP7 award PCIG13-GA-2013-618610 SEA-ICE-CFD.
David W. Rees Jones acknowledges research funding through the NERC Consortium Grant NE/M000427/1 and NERC Standard Grant NE/I026995/1.
We would like to thank the Isaac Newton Institute for Mathematical Sciences for its hospitality during the programme Melt in
the Mantle, which was supported by EPSRC grant number EP/K032208/1.
Edited by: Christian Haas
Reviewed by: two anonymous referees
Bonnecaze, R. T., Huppert, H. E., and Lister, J. R.: Particle-driven gravity currents, J. Fluid Mech., 250, 339–369, https://doi.org/10.1017/S002211209300148X, 1993. a
Carstens, T.: Experiments with supercooling and ice formation in flowing water, Geofys. Publ. Norway, 26, 3–18, 1966. a, b, c
Daly, S. F.: Frazil ice dynamics, CRREL Monograph, 84, 46 pp., 1984. a, b, c, d, e, f
Daly, S. F.: Report on frazil ice, Tech. Rep. 94-23, USA Cold Regions Research and Engineering Laboratory, CRREL Special Report, Hanover, New Hampshire, USA, 1994. a
Engelhardt, H. and Determann, J.: Borehole evidence for a thick layer of basal ice in the central Ronne Ice Shelf, Nature, 327, 318–319, https://doi.org/10.1038/327318a0, 1987. a
Fujioka, T. and Sekerka, R. F.: Morphological stability of disc crystals, J. Cryst. Growth, 24–25, 84–93, https://doi.org/10.1016/0022-0248(74)90284-X, 1974. a
Galton-Fenzi, B. K., Hunter, J. R., Coleman, R., Marsland, S. J., and Warner, R. C.: Modeling the basal melting and marine ice accretion of the Amery Ice Shelf, J. Geophys. Res., 117, C09031, https://doi.org/10.1029/2012JC008214, 2012. a, b, c
Godlovitch, D., Illner, R., and Monahan, A.: Smoluchowski coagulation models of sea ice thickness distribution dynamics, J. Geophys. Res., 116, C12005, https://doi.org/10.1029/2011JC007125, 2011. a
Gough, A., Mahoney, A., Langhorne, P., Williams, M., Robinson, N., and Haskell, T.: Signatures of supercooling: McMurdo Sound platelet ice, J. Glaciol., 58, 38–50, https://doi.org/10.3189/2012JoG10J218, 2012. a
Hanley, T. O. and Tsang, G.: Formation and properties of frazil in saline water, Cold Reg. Sci. Technol., 8, 209–221, https://doi.org/10.1016/0165-232X(84)90052-1, 1984. a
Heorton, H. D. B. S., Radia, N., and Feltham, D. L.: A model of sea ice formation in leads and polynyas, J. Phys. Oceanogr., 47, 1701–1718, https://doi.org/10.1175/JPO-D-16-0224.1, 2017. a
Holland, D. M. and Jenkins, A.: Modeling thermodynamic ice–ocean interactions at the base of an ice shelf, J. Phys. Oceanogr., 29, 1787–1800, https://doi.org/10.1175/1520-0485(1999)029<1787:MTIOIA>2.0.CO;2, 1999. a, b
Holland, P. R. and Feltham, D. L.: Frazil dynamics and precipitation in a water column with depth-dependent supercooling, J. Fluid Mech., 530, 101–124, https://doi.org/10.1017/S002211200400285X, 2005. a, b, c, d
Holland, P. R., Feltham, D. L., and Daly, S. F.: On the Nusselt number for frazil ice growth – a correction to “Frazil evolution in channels” by Lars Hammar and Hung-Tao Shen, J. Hydraul. Res., 45, 421–424, https://doi.org/10.1080/00221686.2007.9521775, 2007. a
Horvat, C. and Tziperman, E.: A prognostic model of the sea-ice floe size and thickness distribution, The Cryosphere, 9, 2119–2134, https://doi.org/10.5194/tc-9-2119-2015, 2015. a
Jenkins, A.: A one-dimensional model of ice shelf-ocean interaction, J. Geophys. Res., 96, 20671–20677, https://doi.org/10.1029/91JC01842, 1991. a
Jenkins, A. and Bombosch, A.: Modeling the effects of frazil ice crystals on the dynamics and thermodynamics of Ice Shelf Water plumes, J. Geophys. Res., 100, 6967–6981, https://doi.org/10.1029/94JC03227, 1995. a, b, c, d
Jordan, J. R., Holland, P. R., Jenkins, A., Piggott, M. D., and Kimura, S.: Modeling ice-ocean interaction in ice-shelf crevasses, J. Geophys. Res., 119, 995–1008, https://doi.org/10.1002/2013JC009208, 2014. a, b
Jordan, J. R., Kimura, S., Holland, P. R., Jenkins, A., and Piggott, M. D.: On the Conditional Frazil Ice Instability in Seawater, J. Phys. Oceanogr., 45, 1121–1138, https://doi.org/10.1175/JPO-D-14-0159.1, 2015. a, b
Khazendar, A. and Jenkins, A.: A model of marine ice formation within Antarctic ice shelf rifts, J. Geophys. Res., 108, 3235, https://doi.org/10.1029/2002JC001673, 2003. a, b
Langhorne, P. J., Hughes, K. G., Gough, A. J., Smith, I. J., Williams, M. J. M., Robinson, N. J., Stevens, C. L., Rack, W., Price, D., Leonard, G. H., Mahoney, A. R., Haas, C., and Haskell, T. G.: Observed platelet ice distributions in Antarctic sea ice: An index for ocean-ice shelf heat flux, Geophys. Res. Lett., 42, 5442–5451, https://doi.org/10.1002/2015GL064508, 2015. a
Lawson, D. E., Strabser, J. C., Evenson, E. B., Alley, R. B., Larson, G. J., and Arcone, S. A.: Glaciohydraulic supercooling: a freeze-on mechanism to create stratified, debris-rich basal ice: I. Field evidence, J. Glaciol., 44, 547–563, https://doi.org/10.3189/S0022143000002069, 1998. a
Lewis, E. L. and Perkin, R. G.: Ice pumps and their rates, J. Geophys. Res., 91, 11756–11762, https://doi.org/10.1029/JC091iC10p11756, 1986. a
Martin, S. and Kauffman, P.: A field and laboratory study of wave damping by grease ice, J. Glaciol., 27, 283–313, 1981. a
McFarlane, V., Loewen, M., and Hicks, F.: Laboratory measurements of the rise velocity of frazil ice particles, Cold Reg. Sci. Technol., 106–107, 120–130, https://doi.org/10.1016/j.coldregions.2014.06.009, 2014. a, b
Michel, B.: Theory of formation and deposit of frazil ice, Eastern Snow Conference, Proc. Annual Meeting, Quebec, 1963. a, b, c
Millero, F. J. and Leung, W. H.: The thermodynamics of seawater at one atmosphere, Am. J. Sci., 276, 1035–1077, https://doi.org/10.2475/ajs.276.9.1035, 1976. a
Oerter, H., Kipfstuhl, J., Determann, J., Miller, H., Wagenbach, D., Minikin, A., and Graft, W.: Evidence for basal marine ice in the Filchner-Ronne ice shelf, Nature, 358, 399–401, https://doi.org/10.1038/358399a0, 1992. a
Rees Jones, D. W.: Frazil-dynamics code, https://doi.org/10.5281/zenodo.1063501, https://github.com/davidreesjones/frazil-dynamics, 2017. a, b, c
Rees Jones, D. W. and Wells, A. J.: Solidification of a disk-shaped crystal from a weakly supercooled binary melt, Phys. Rev. E, 92, 022406, https://doi.org/10.1103/PhysRevE.92.022406, 2015. a, b, c, d, e, f, g, h
Skogseth, R., Nilsen, F., and Smedsrud, L. H.: Supercooled water in an Arctic polynya: Observations and modeling, J. Glaciol., 55, 43–52, https://doi.org/10.3189/002214309788608840, 2009. a
Smedsrud, L. H.: A model for entrainment of sediment into sea ice by aggregation between frazil-ice crystals and sediment grains, J. Glaciol., 48, 51–61, https://doi.org/10.3189/172756502781831520, 2002. a, b
Smedsrud, L. H. and Jenkins, A.: Frazil ice formation in an ice shelf water plume, J. Geophys. Res., 109, C03025, https://doi.org/10.1029/2003JC001851, 2004. a, b, c, d, e, f, g, h, i, j
Smedsrud, L. H. and Martin, T.: Grease ice in basin-scale sea-ice ocean models, Ann. Glaciol., 56, 295–306, https://doi.org/10.3189/2015AoG69A765, 2015. a, b
Svensson, U. and Omstedt, A.: Simulation of supercooling and size distribution in frazil ice dynamics, Cold Reg. Sci. Technol., 22, 221–233, https://doi.org/10.1016/0165-232X(94)90001-9, 1994. a, b, c, d, e, f, g, h, i, j, k, l, m, n, o, p
Svensson, U. and Omstedt, A.: Numerical simulations of frazil ice dynamics in the upper layers of the ocean, Cold Reg. Sci. Technol., 28, 29–44, https://doi.org/10.1016/S0165-232X(98)00011-1, 1998. a, b, c
Thorndike, A.: Sea ice thickness as a stochastic process, J. Geophys. Res., 105, 1311–1313, https://doi.org/10.1029/1999JC900271, 2000. a
Toppaladoddi, S. and Wettlaufer, J. S.: Theory of the sea ice thickness distribution, Phys. Rev. Lett., 115, 148–501, https://doi.org/10.1103/PhysRevLett.115.148501, 2015. a
Wilchinsky, A. V., Heorton, H. D. B. S., Feltham, D. L., and Holland, P. R.: Study of the impact of ice formation in leads upon the sea ice pack mass balance using a new frazil and grease ice parameterization, J. Phys. Oceanogr., 45, 2025–2047, https://doi.org/10.1175/JPO-D-14-0184.1, 2015. a, b


