the Creative Commons Attribution 4.0 License.
the Creative Commons Attribution 4.0 License.
 | 05 Apr 2018
Nitrate deposition and preservation in the snowpack along a traverse from coast to the ice sheet summit (Dome A) in East Antarctica
Meredith G. Hastings
Jinhai Yu
Tianming Ma
Zhengyi Hu
Chunlei An
Chuanjin Li
Hongmei Ma
Su Jiang
Yuansheng Li
Antarctic ice core nitrate (NO) can provide a unique record of the atmospheric reactive nitrogen cycle. However, the factors influencing the deposition and preservation of NO at the ice sheet surface must first be understood. Therefore, an intensive program of snow and atmospheric sampling was made on a traverse from the coast to the ice sheet summit, Dome A, East Antarctica. Snow samples in this observation include 120 surface snow samples (top ∼ 3 cm), 20 snow pits with depths of 150 to 300 cm, and 6 crystal ice samples (the topmost needle-like layer on Dome A plateau). The main purpose of this investigation is to characterize the distribution pattern and preservation of NO concentrations in the snow in different environments. Results show that an increasing trend of NO concentrations with distance inland is present in surface snow, and NO is extremely enriched in the topmost crystal ice (with a maximum of 16.1 µeq L−1). NO concentration profiles for snow pits vary between coastal and inland sites. On the coast, the deposited NO was largely preserved, and the archived NO fluxes are dominated by snow accumulation. The relationship between the archived NO and snow accumulation rate can be depicted well by a linear model, suggesting a homogeneity of atmospheric NO levels. It is estimated that dry deposition contributes 27–44 % of the archived NO fluxes, and the dry deposition velocity and scavenging ratio for NO were relatively constant near the coast. Compared to the coast, the inland snow shows a relatively weak correlation between archived NO and snow accumulation, and the archived NO fluxes were more dependent on concentration. The relationship between NO and coexisting ions (nssSO, Na+ and Cl−) was also investigated, and the results show a correlation between nssSO (fine aerosol particles) and NO in surface snow, while the correlation between NO and Na+ (mainly associated with coarse aerosol particles) is not significant. In inland snow, there were no significant relationships found between NO and the coexisting ions, suggesting a dominant role of NO recycling in determining the concentrations.
- Article
(4243 KB) - Full-text XML
-
Supplement
(527 KB) - BibTeX
- EndNote


As the major sink of atmospheric nitrogen oxides (NOx= NO and NO2), nitrate (NO is one of the major chemical species measured in polar snow and ice. The measurements of NO in ice cores may offer potential for understanding the complex atmospheric nitrogen cycle as well as oxidative capacity of the atmosphere through time (Legrand and Mayewski, 1997; Alexander et al., 2004; Hastings et al., 2009; Geng et al., 2017). However, the sources, transport pathways and preservation of NO in Antarctic snowpack are still not well understood, hampering the interpretation of ice core NO records.
The accumulation of NO in snow is associated with various environmental factors and continental, tropospheric and stratospheric sources could influence NO concentrations (Legrand and Kirchner, 1990; McCabe et al., 2007; Wolff et al., 2008; Lee et al., 2014). In surface snow, NO levels are thought to be linked with snow accumulation rate, and higher values are usually present in areas with low accumulation, e.g., East Antarctic plateaus (Qin et al., 1992; Erbland et al., 2013; Traversi et al., 2017). Unlike sea-salt-related ions (e.g., chloride (Cl−), sodium (Na+) and occasionally sulfate (SO, NO does not usually show an elevated level in coastal Antarctic snow (Mulvaney and Wolff, 1994; Bertler et al., 2005; Frey et al., 2009), suggesting a negligible contribution from sea-salt aerosols. However, the marine emissions of alkyl NO, particularly methyl and ethyl NO, produced in surface oceans by microbiological and/or photochemical processes, are thought to be a possible contribution to Antarctic NO (Jones et al., 1999; Liss et al., 2004). At Halley station in coastal Antarctica, significant concentrations of organic nitrates (peroxyacetyl nitrate (PAN) and alkyl NO were observed in the lower atmosphere (Jones et al., 2011). Organic nitrates dominated the NOy (sum of reactive nitrogen oxide compounds) budget during the winter and were on par with inorganic nitrate compounds during the summer. Although not a direct source of snowpack nitrate, organic nitrates could act as source of NOx to coastal Antarctica that would ultimately contribute to NO within the snowpack (Jones et al., 2011).
While industrial and/or agricultural emissions have contributed to increasing NO levels in Greenland snow and ice over recent decades to hundreds of years, the anthropogenic contribution to Antarctic NO is less clear (Mayewski and Legrand, 1990; Hastings et al., 2009; Felix and Elliott, 2013; Geng et al., 2014). Lightning and NOx produced in the lower stratosphere have long been thought to play a major role (Legrand et al., 1989; Legrand and Kirchner, 1990). Recently, adjoint model simulations proposed that tropospheric transport of NO from mid-to-low-latitude NOx sources is an important source to the Antarctic year round, though less so in austral spring and summer (Lee et al., 2014). Treatment of NO in snow in the same global chemical transport model suggests that the recycling of NO and/or transport of NOx due to photolysis of NO in the surface snow layer is important in determining summertime concentrations (Zatko et al., 2016). The stratospheric inputs of NO are thought to result from N2O oxidation to NO and then formation of NO that is deposited via polar stratospheric cloud sedimentation (Legrand et al., 1989; Legrand and Kirchner, 1990). The late winter–early spring secondary maximum of NO observed in the atmosphere at coastal and inland locations has been attributed to the stratospheric source based on the NO stable isotopic composition (Legrand et al., 1989; Savarino et al., 2007; Frey et al., 2009). At some sites, the snow and ice core NO concentrations were found to be linked with regional atmospheric circulation (e.g., sea level pressure gradient; Goodwin et al., 2003; Russell et al., 2006). In general, atmospheric circulation appears to affect snow NO concentrations indirectly through an influence on the air mass transport and/or snow accumulation rate (Russell et al., 2004, 2006). In addition, while some studies suggested that snow/ice NO is possibly linked with extraterrestrial fluxes of energetic particles and solar irradiation, with solar flares corresponding to NO spikes (Zeller et al., 1986; Smart et al., 2014), other observations and recent modeling studies have established that there is not a clear connection between solar variability and NO concentrations (Legrand et al., 1989; Legrand and Kirchner, 1990; Wolff et al., 2008, 2012, 2016; Duderstadt et al., 2014, 2016). However, the potential link between the long-term (e.g., centennial to millennial timescales) variability of NO and solar cycles may be present at some locations (Traversi et al., 2012). In summary, factors influencing NO levels in snow and ice are complicated, and the significance of the relationship between NO and controlling factors varies temporally and spatially.
Gas-phase and snow concentration studies and recent isotopic investigations and modeling have shown that NO, particularly in snow on the Antarctic plateau, is a combination of deposition of HNO3 and post-depositional loss or recycling of NO (e.g., Röthlisberger et al., 2002; Davis et al., 2004; Dibb et al., 2004; Erbland et al., 2013, 2015; Shi et al., 2015; Bock et al., 2016; Zatko et al., 2016). Based upon a suite of isotopic studies in the field and laboratory, it has been demonstrated that under cold, sunlit conditions ultraviolet photolysis dominates NO post-depositional processing, whereas HNO3 volatilization may become more important at warmer temperatures > −20 ∘C (Röthlisberger et al., 2002; Frey et al., 2009; Erbland et al., 2013; Berhanu et al., 2015). In snowpack, the solar radiation decreases exponentially, with attenuation described in terms of an e-folding depth (ze) where the actinic flux is reduced to 37 % (i.e., 1∕e) of the surface value. Thus, about 95 % of snowpack photochemistry is expected to occur above the depth of three times ze (Warren et al., 2006). Field measurements at Dome C on the East Antarctic plateau suggest a ze of 10 to 20 cm (France et al., 2011), and the depth is dependent upon the concentration of impurities contained in the snow (Zatko et al., 2013). In the inland regions with low snow accumulation rates, particularly on the East Antarctic plateaus, photolysis has been shown to lead to significant post-depositional loss of NO, demonstrated by significant enrichment in 15N of snow NO (i.e., high δ15N) (Frey et al., 2009; Erbland et al., 2013, 2015; Berhanu et al., 2015; Shi et al., 2015), as well as a decrease in δ18O and Δ17O due to reformation of NO in the condensed phase (Erbland et al., 2013; Shi et al., 2015, and references therein). The transport and recycling of NOx sourced from photolysis of snow NO in the summertime has been invoked to model the distribution of snowpack NO across the Antarctic plateau (Zatko et al., 2016). However, snow physical characteristics play a crucial role in NO deposition and preservation. For instance, summertime concentrations in the surface skin layer of snow (the uppermost ∼ 4 mm) can be explained as the result of co-condensation of HNO3 and water vapor, with little to no photolytic loss in this microlayer (Bock et al., 2016). The combination of concentration and isotopic studies, along with physical aspects of the snow, could lead to the reconstruction and interpretation of atmospheric NO over time (e.g., Erbland et al., 2015; Bock et al., 2016), if there were detailed understanding of the NO deposition and preservation in different environments in Antarctica.
The effects of volatilization of NO are uncertain, given that one field experiment suggests that this process is an active player in NO loss (17 % (−30 ∘C) to 67 % (−10 ∘C) of NO lost after 2 weeks' physical release experiments; Erbland et al., 2013), while other laboratory and field studies show that volatilization plays a negligible role in NO loss (Berhanu et al., 2014, 2015). Further investigations are needed to quantify the effects of volatilization for a better understanding of NO preservation in snow and ice. Based on ze, NO at deeper depths in Antarctic snow (e.g., > 100 cm), well beyond the snow photic zone, may be taken as the archived fraction. Thus, NO in deeper snow provides an opportunity to investigate the archived fraction and potential influencing factors (e.g., snow accumulation rate). Given that an extensive array of ice core measurements is unavailable in most of Antarctica, the deeper snow pits (with depth > 100 cm) may offer a useful way to investigate the archived NO.
In the atmosphere in Antarctica, particularly during spring and summer, NO is found to be mainly in the form of gas-phase HNO3, with NO concentration several times higher in gas phase than in the particulate phase (Piel et al., 2006; Legrand et al., 2017b; Traversi et al., 2017). During post-depositional processes, the uptake of gaseous HNO3 is thought to be important in NO concentrations in surface snow layers (Udisti et al., 2004; Traversi et al., 2014, 2017). Due to the high concentration in summer, HNO3 appears to play an important role in acidifying sea-salt particles, possibly accounting for the presence of NO in the particulate phase in summer (Jourdain and Legrand, 2002; Legrand et al., 2017b; Traversi et al., 2017). It is noted that the significant increase of NO during the cold periods (e.g., Last Glacial Maximum) could be associated with its attachment to dust aerosol instead of formation of gas-phase HNO3 (Legrand et al., 1999; Wolff et al., 2010).
To date, investigations on spatial and temporal patterns of snow NO have been performed on several traverses in Antarctica (e.g., 1990 International Trans-Antarctica Expedition and DDU to Dome C; Qin et al., 1992; Bertler et al., 2005; Frey et al., 2009; Erbland et al., 2013; Pasteris et al., 2014), but these provide an uneven distribution of snow NO concentrations and leave large regions un-sampled (e.g., Lambert Glacier basin and Dome A plateau). Over the past few decades, while several glaciological observations have been carried out on the Chinese inland Antarctic traverse route from Zhongshan to Dome A, East Antarctica (Hou et al., 2007; Ding et al., 2010, 2011; Ma et al., 2010; Li et al., 2013; Shi et al., 2015), the data on snow chemistry are still rare, particularly detailed information on NO. From 2009 to 2013, we therefore conducted surface snow and snow pit sampling campaigns along the traverse route, with the main objectives to (1) describe NO distribution in surface snow and snow pits, (2) characterize the relationship between archived NO and snow accumulation rate, and (3) examine the potential effects of coexisting ions on NO preservation. The results of this study may help to better understand NO deposition and preservation in the snowpack, which is critical to the interpretation of ice core NO records.
Table 1Snow pit information on the traverse from coastal Zhongshan Station to Dome A, East Antarctica.
1 Annual snow accumulation rate is obtained from the field bamboo stick measurements (2009–2013), updated from the report (Ding et al., 2011). Note that snow accumulation rate at the two ice core sites are derived from ice core measurements. 2 Core 1, ice core data of previous report (Li et al., 1999; Xiao et al., 2004). 3 Core 2, ice core data of previous report (Li et al., 2009).
2.1 Study area (Zhongshan to Dome A traverse)
The Zhongshan to Dome A CHINARE (Chinese National Antarctic Research Expedition) inland traverse is an important leg of the ITASE (International Trans-Antarctic Scientific Expedition). The traverse is in the Indian Ocean sector of East Antarctica, passing through the Lambert Glacier, the largest glacier in Antarctica. In January 1997 the first Chinese Antarctic inland expedition reached an area ∼ 300 km from the coast; in January 1998 the traverse was extended to 464 km, and in December 1998 to the Dome A area ∼ 1100 km from the coast. In the austral 2004/2005 summer, for the first time, the traverse extended to the ice sheet summit, Dome A, a total distance of ∼ 1260 km. In January 2009, the Chinese inland research base, Kunlun station (80∘25′1.7 S and 77∘6′58.0 E; 4087 m above mean sea level), was established at Dome A, mainly aimed at deep ice core drilling and astronomical observations. Now, Kunlun base is a summer station, and the CHINARE team typically conducts an annual inland traverse from the coastal Zhongshan station to Dome A.
In January 2010, the Dome A deep ice core project was started, and the construction of basic infrastructure (including drill trench and scientific workroom) took four summer seasons. The deep ice core drilling began in January 2013, and in total 801 m ice core was recovered by the 2016/2017 season. The investigation of NO deposition and preservation in the snowpack will be of help to the interpretation of Dome A deep ice core NO records.
2.2 Sample collection
During the 2010/2011 CHINARE, surface snow samples (the topmost ∼ 3 cm) were collected at an interval of ∼ 10 km along the traverse route from Zhongshan to Dome A, using 3.0 cm diameter high-density polyethylene (HDPE) bottles (volume of 100 mL). The bottles were pre-cleaned with Milli-Q ultrapure water (18.2 MΩ), until electrical conductivity of the water stored in bottles (> 24 h) decreased to < 0.5 µS cm−1. Then, the bottles were dried under a class 100 super-clean hood at 20 ∘C. Immediately after the drying procedure, the bottles were sealed in clean PE bags that were not opened until the field sampling started. At each sampling site (typically > 500 m away from the traverse route), the bottles were pushed into surface snow layers in the windward direction. In total, 120 surface snow samples were collected. In addition, at each sampling site, the upper snow density (∼ 10 cm) was measured using a density scoop with a volume of 1000 cm3. As the field blanks, pre-cleaned bottles filled with Milli-Q water were taken to the field and treated to the same conditions as field samples (n=3).
On the Dome A plateau, the snow is soft and non-cohesive, and morphology of the surface snow is different from other areas on the traverse, with a crystal ice layer extensively developed, in particular on the sastrugi (Fig. S1 in the Supplement). The depth of the needle-like crystal ice layer (referred to as “crystal ice” in the following context) is generally < 1.0 cm. In order to investigate air–snow transfer of NO in this uppermost ∼ 1 cm layer, the crystal ice was collected using a clean HDPE scoop and then poured into clean, wide-mouth HDPE bottles. Approximately 30 g of crystal ice was collected for each sample. In total, six crystal ice samples were collected on the traverse near Dome A plateau.
In addition to surface snow, snow pit samples were collected during CHINARE inland traverse campaigns in 2009/2010, 2010/2011 and 2012/2013. The snow pits were excavated manually, and the snow wall in the windward direction was scraped clean and flat with a clean HDPE scraper. Then the bottles were pushed horizontally into the snow wall. Snow pit samples were collected from the base towards the top layer along a vertical line. During the sampling process, all personnel wore PE gloves and face masks to minimize potential contamination. Note that the snow pits are generally > 1 km from the traverse route to avoid possible contamination from the expedition activities. All information about individual snow pits, including location, distance from the coast, elevation, snow pit depth, sampling resolution, collection date and annual snow accumulation rate, is summarized in Table 1. All together, 20 snow pits (SP1 to SP20 in Fig. 2, with SP20 corresponding to the location of Kunlun station at Dome A) as 1741 snow samples were collected.
To support understanding of the air–snow transfer of NO on the traverse, atmospheric NO was collected on glass fiber filters (Whatman G653) using a high-volume air sampler (HVAS), with a flow rate of ∼ 1.0 m3 min−1 for 12–15 h, during the inland traverse campaign in 2015/2016. The NO collected on glass fiber filters is expected to equal the sum of particulate NO and gaseous HNO3, based upon previous investigations in East Antarctica (Savarino et al., 2007; Frey et al., 2009; Erbland et al., 2013). In total, 34 atmospheric samples were collected on the traverse. In addition, two field blanks were collected from filters installed in the HVAS without pumping and treated as samples thereafter. Detailed information about the atmospheric sampling is presented in Table S1 in the Supplement.
After sample collection, all filters and snow samples were sealed in clean PE bags and preserved in clean thermal insulated boxes. All of the samples were transported to the laboratory under freezing conditions (< −20 ∘C).
2.3 Sample analysis
In the laboratory, three quarters of individual filters were cut into pieces using pre-cleaned scissors that were rinsed between samples, placed in ∼ 100 mL of Milli-Q water, ultrasonicated for 40 min and leached for 24 h under shaking. The sample solutions were then filtered through 0.22 µm ANPEL PTFE filters for concentration analysis. Snow samples were melted in the closed sampling bottles on a super-clean bench (class 100) before chemical measurements. Analyses of Na+, NH, K+, Mg2+, Ca2+, Cl−, NO and SO were performed using a Dionex ICS-3000 ion chromatography system. The column used for cation analysis (Na+, NH, K+, Mg2+ and Ca2+) was a Dionex column CS12 (2×250 mm), with a guard column CG12 (2×50 mm), while the anions (Cl−, NO and SO were analyzed using a Dionex column AS11 (2×250 mm) with a guard column AG11 (2×50 mm). The eluent for cations was 18.0 mM methanesulfonic acid, and the gradient elution method was employed for anion analysis, with eluent of potassium hydroxide. More details on this method are described in a previous report (Shi et al., 2012). During sample analysis, duplicated samples and field blanks were synchronously analyzed. The pooled standard deviation (σp; , where ni and are the size and variance of the ith samples, respectively, and k is the total number of sample sets) of all replicate samples run at least twice in two different sample sets is 0.019 (Cl−), 0.023 (NO, 0.037 (SO, 0.022 (Na+), 0.039 (NH, 0.006 (K+), 0.006 (Mg2+) and 0.006 (Ca2+) µeq L−1, respectively (n=65 pairs of samples). Ion concentrations in field blanks (n=3) are generally lower than the detection limit (3 standard deviations of water blank in the laboratory).
For Antarctic snow samples, the concentrations of H+ are usually not measured directly, but deduced from the ion-balance disequilibrium in the snow. Here, H+ concentration is calculated through ion balance.
where ion concentrations are in µeq L−1. In addition, the non-sea-salt fractions of SO (nssSO and Cl− (nssCl−) can be calculated from the following expressions, by assuming Na+ exclusively from sea salt (in µeq L−1).
It is noted that SO fractionation (the precipitation of mirabilite, Na2SO4 ⋅ 10H2O) may introduce a bias in nssSO, particularly during the winter half year (Wagenbach et al., 1998a).
3.1 NO concentration in surface snow
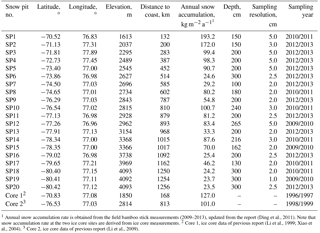
Concentrations of NO in surface snow are shown in Fig. 1, ranging from 0.6 to 5.1 µeq L−1, with a mean of 2.4 µeq L−1. One standard deviation (1σ) of NO concentration in surface snow is 1.1 µeq L−1, with coefficient of variation (Cv, 1σ over mean) of 0.5, indicating a moderate spatial variability. About 450 km from the coast, NO shows a slightly increasing trend towards the interior, with low variability, while NO concentrations are higher in the inland region, with a large fluctuation. It is notable that in the area ∼ 800 km from the coast, where snow accumulation is relatively high, NO concentrations decrease to < 2.0 µeq L−1, comparable to the values on the coast. Near the Dome A plateau (> 1000 km from coast), there is a tendency for higher NO concentrations (> 5.0 µeq L−1). Similarly, atmospheric NO concentrations increase from the coast towards the plateau, ranging from 6 to 118 ng m−3 (mean of 38 ng m−3) (Fig. 1).
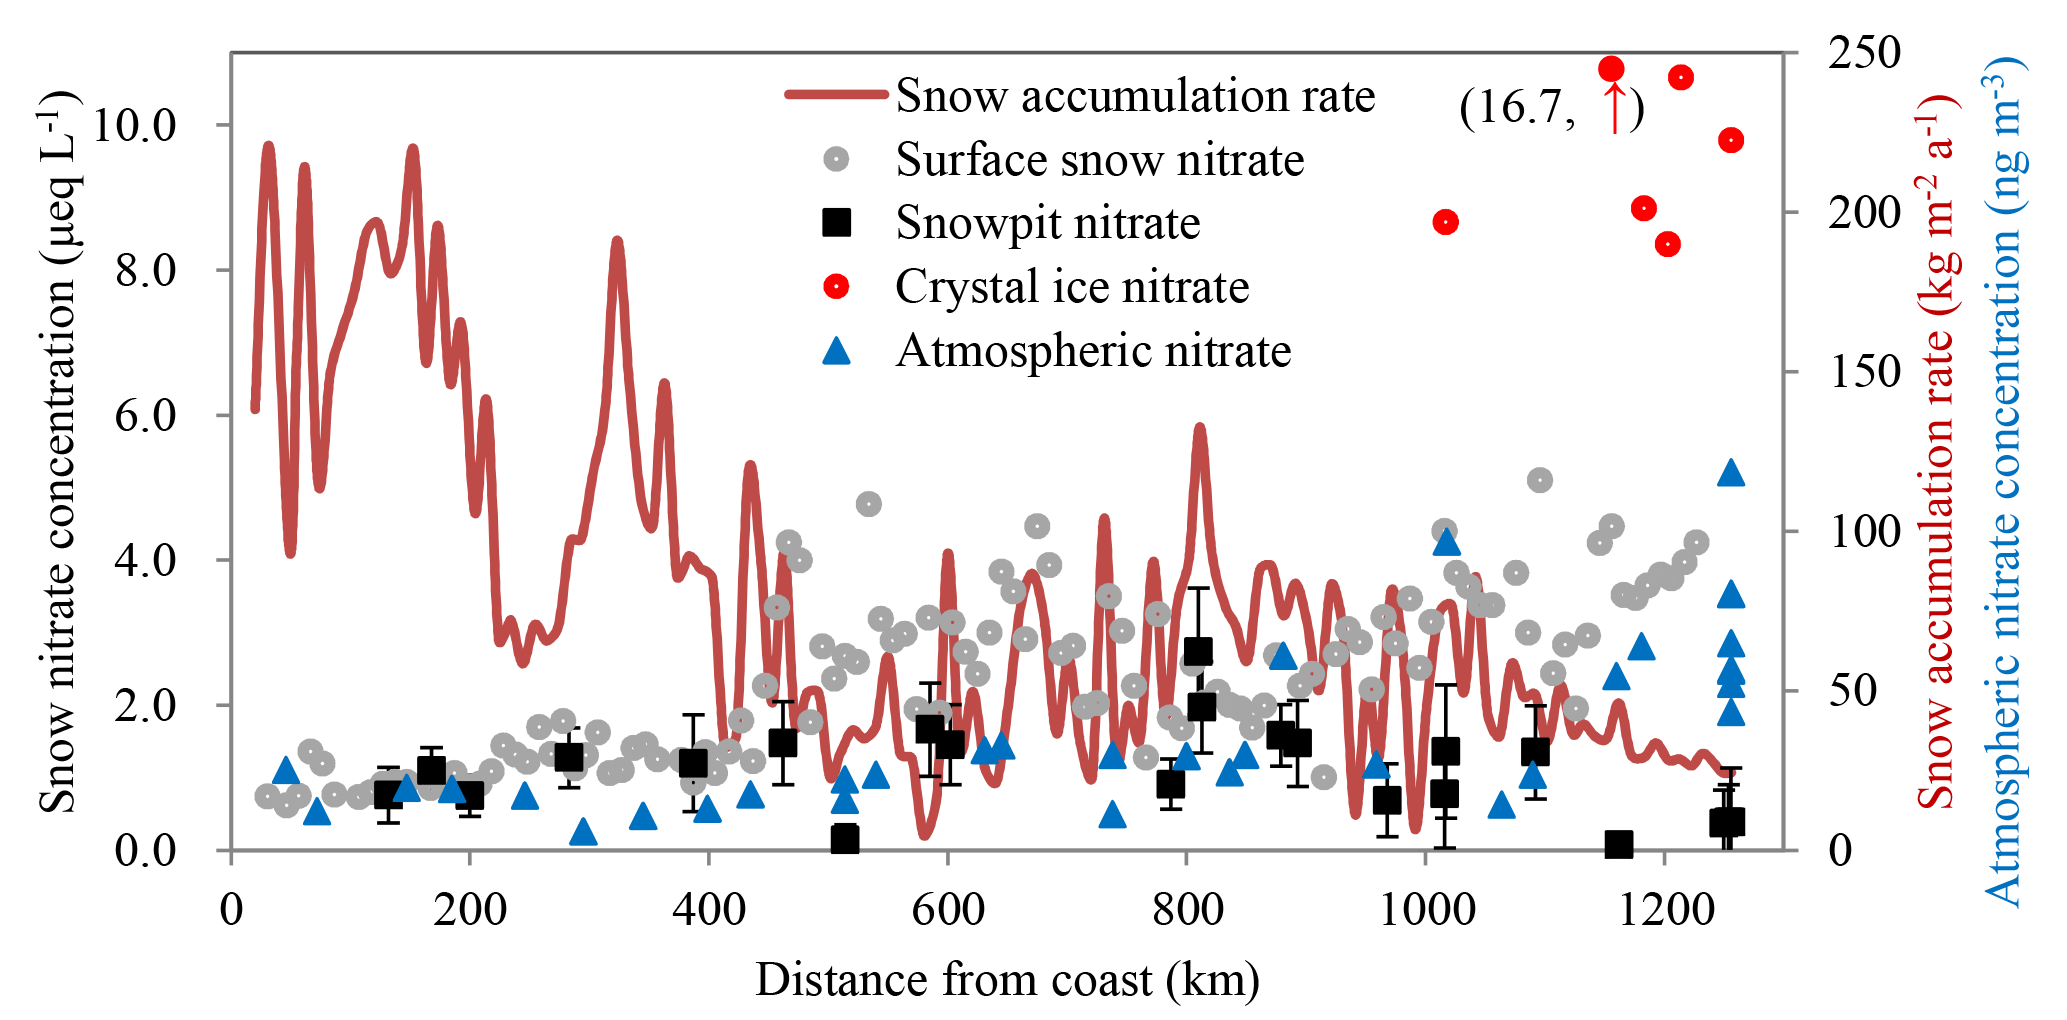
Figure 1Concentrations of NO in snow (surface snow, crystal ice and snow pits; on the primary y axis) and atmosphere (on the secondary y axis), with error bars representing 1 standard deviation of NO (1σ) for individual snow pits. Also shown is the annual snow accumulation rate on the traverse (red solid line; based on Ding et al., 2011). Note that NO concentration in one crystal ice sample (red dot) is higher than the maximum value of the primary y axis (NO concentration = 16.7 µeq L−1 in the parentheses).
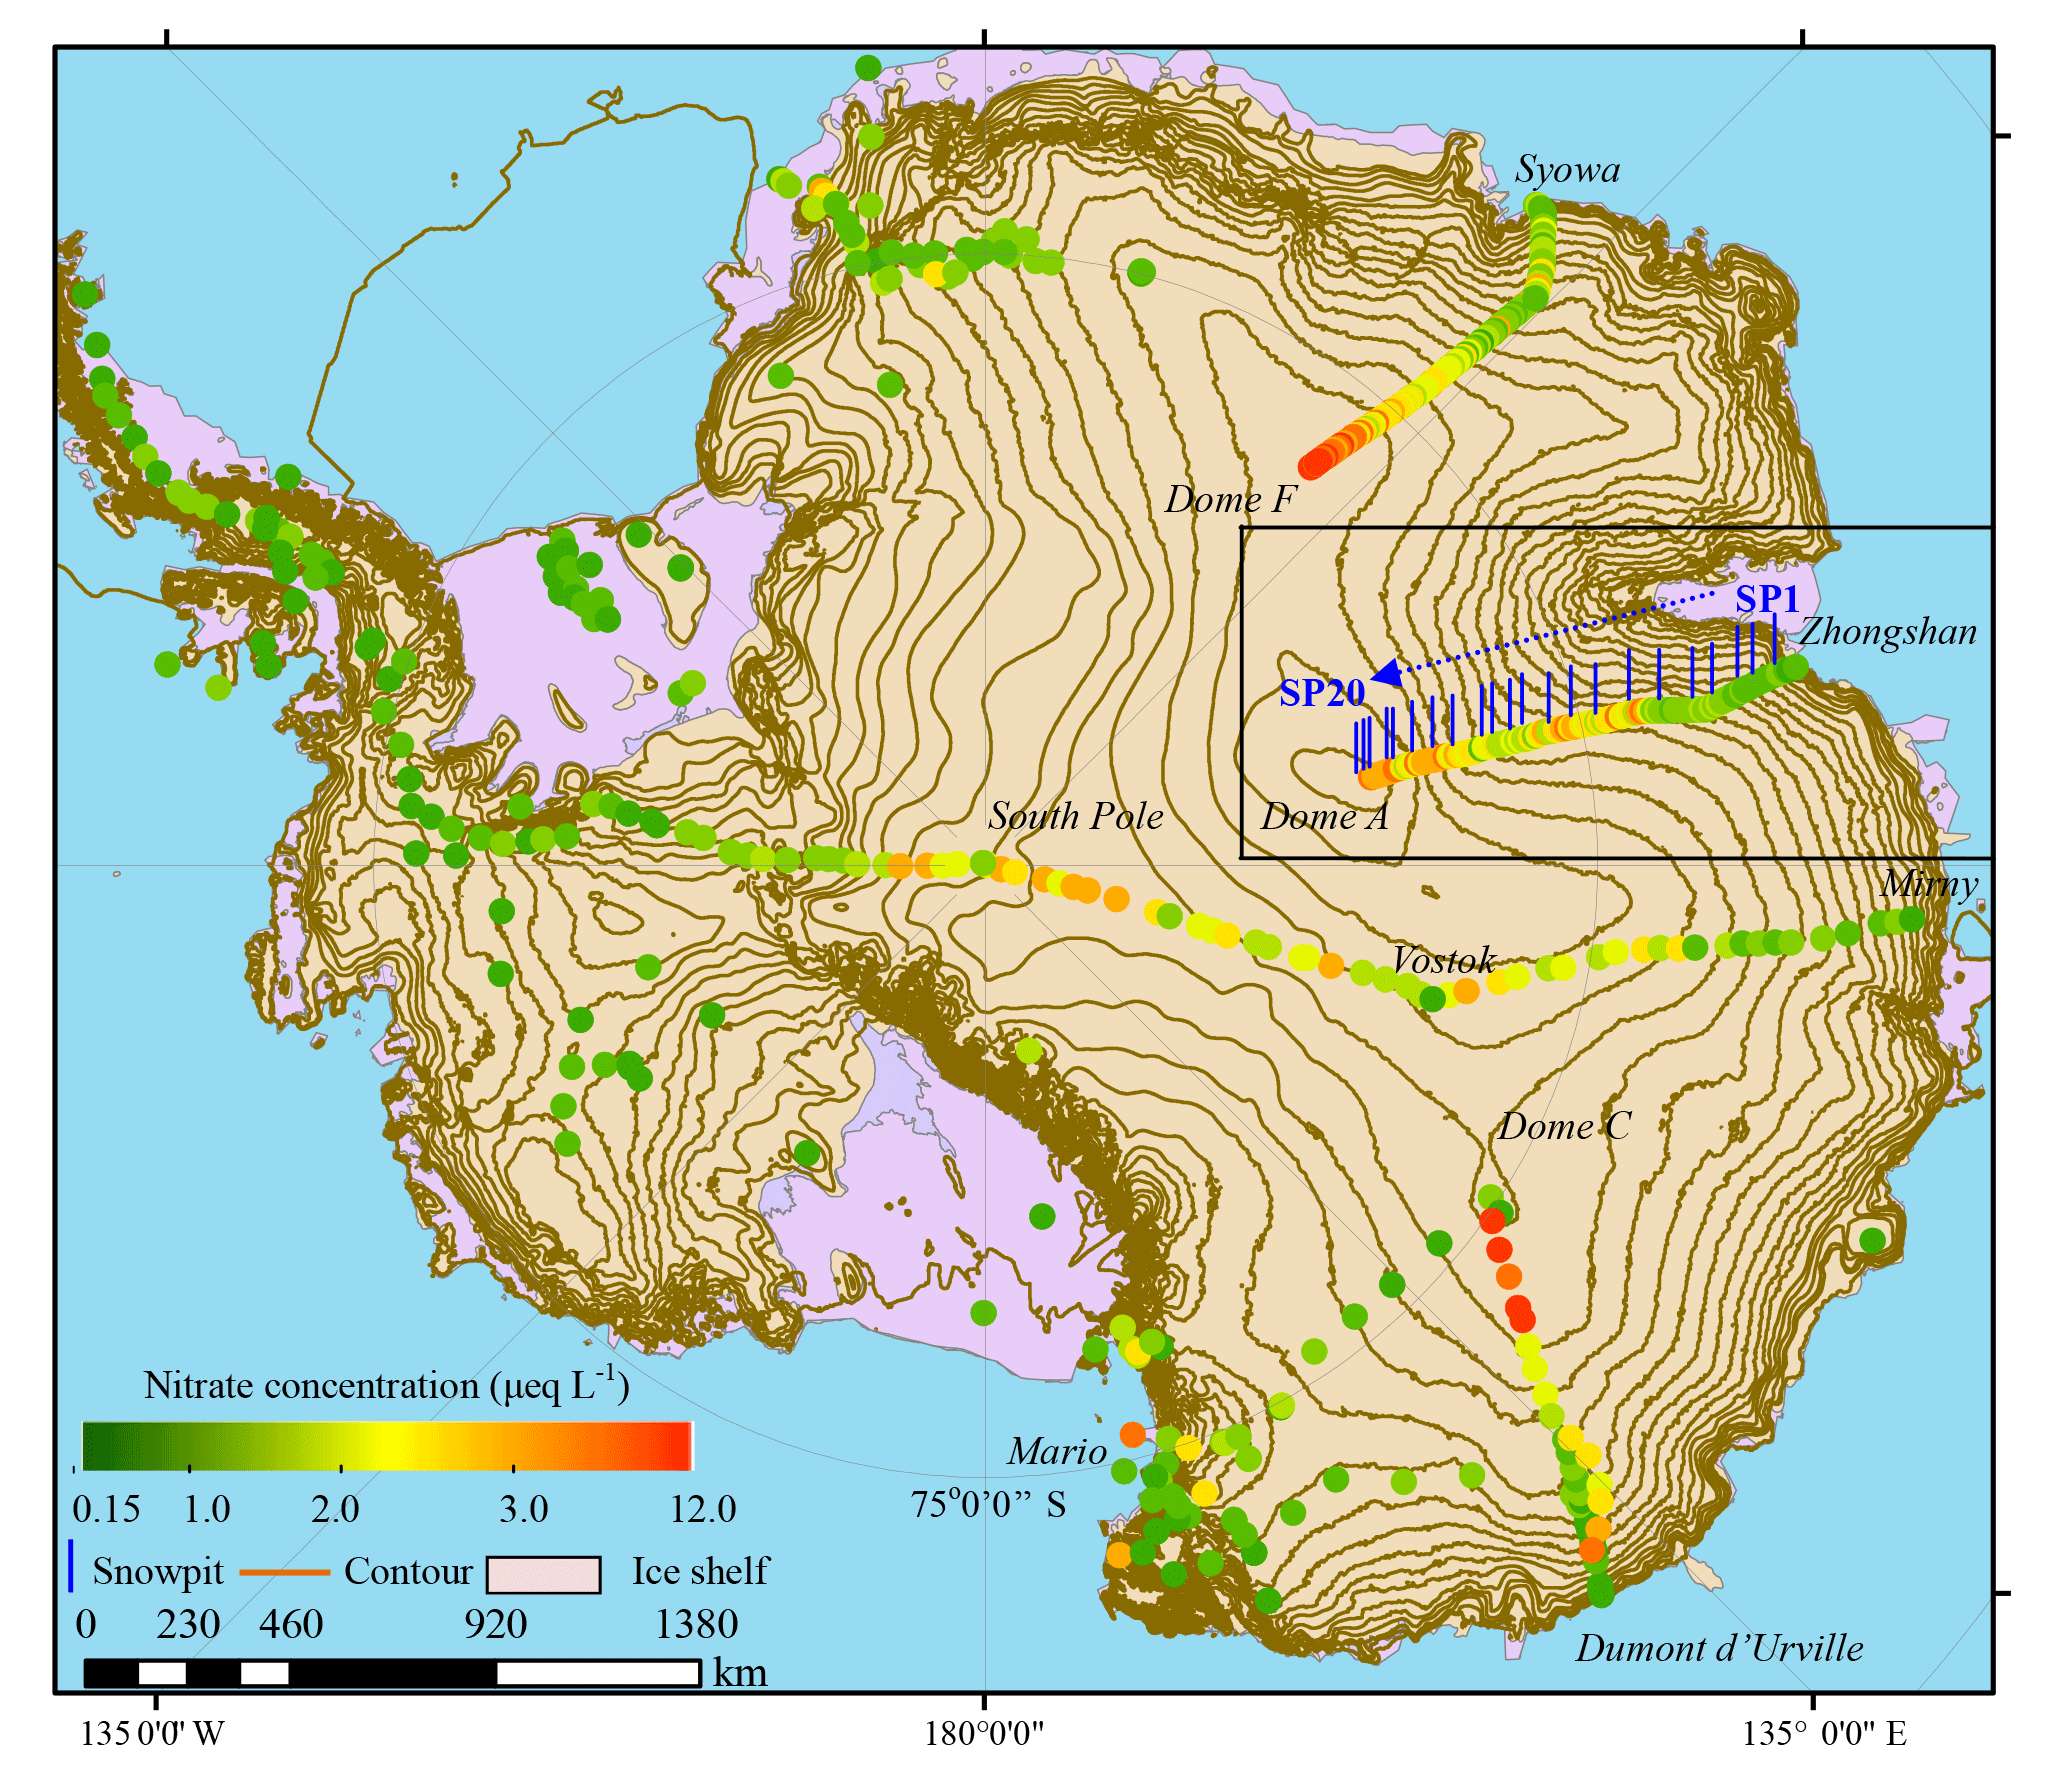
Figure 2Concentrations of NO in surface snow across Antarctica. Note that the values of crystal ice around Dome A were not included. The data of DDU to Dome C are from Frey et al. (2009). The other surface snow NO concentrations are from compiled data (Bertler et al., 2005, and references therein). Also illustrated are the locations of snow pits on the traverse route from Zhongshan to Dome A in this study (SP1 to SP20, solid short blue line; Table 1).
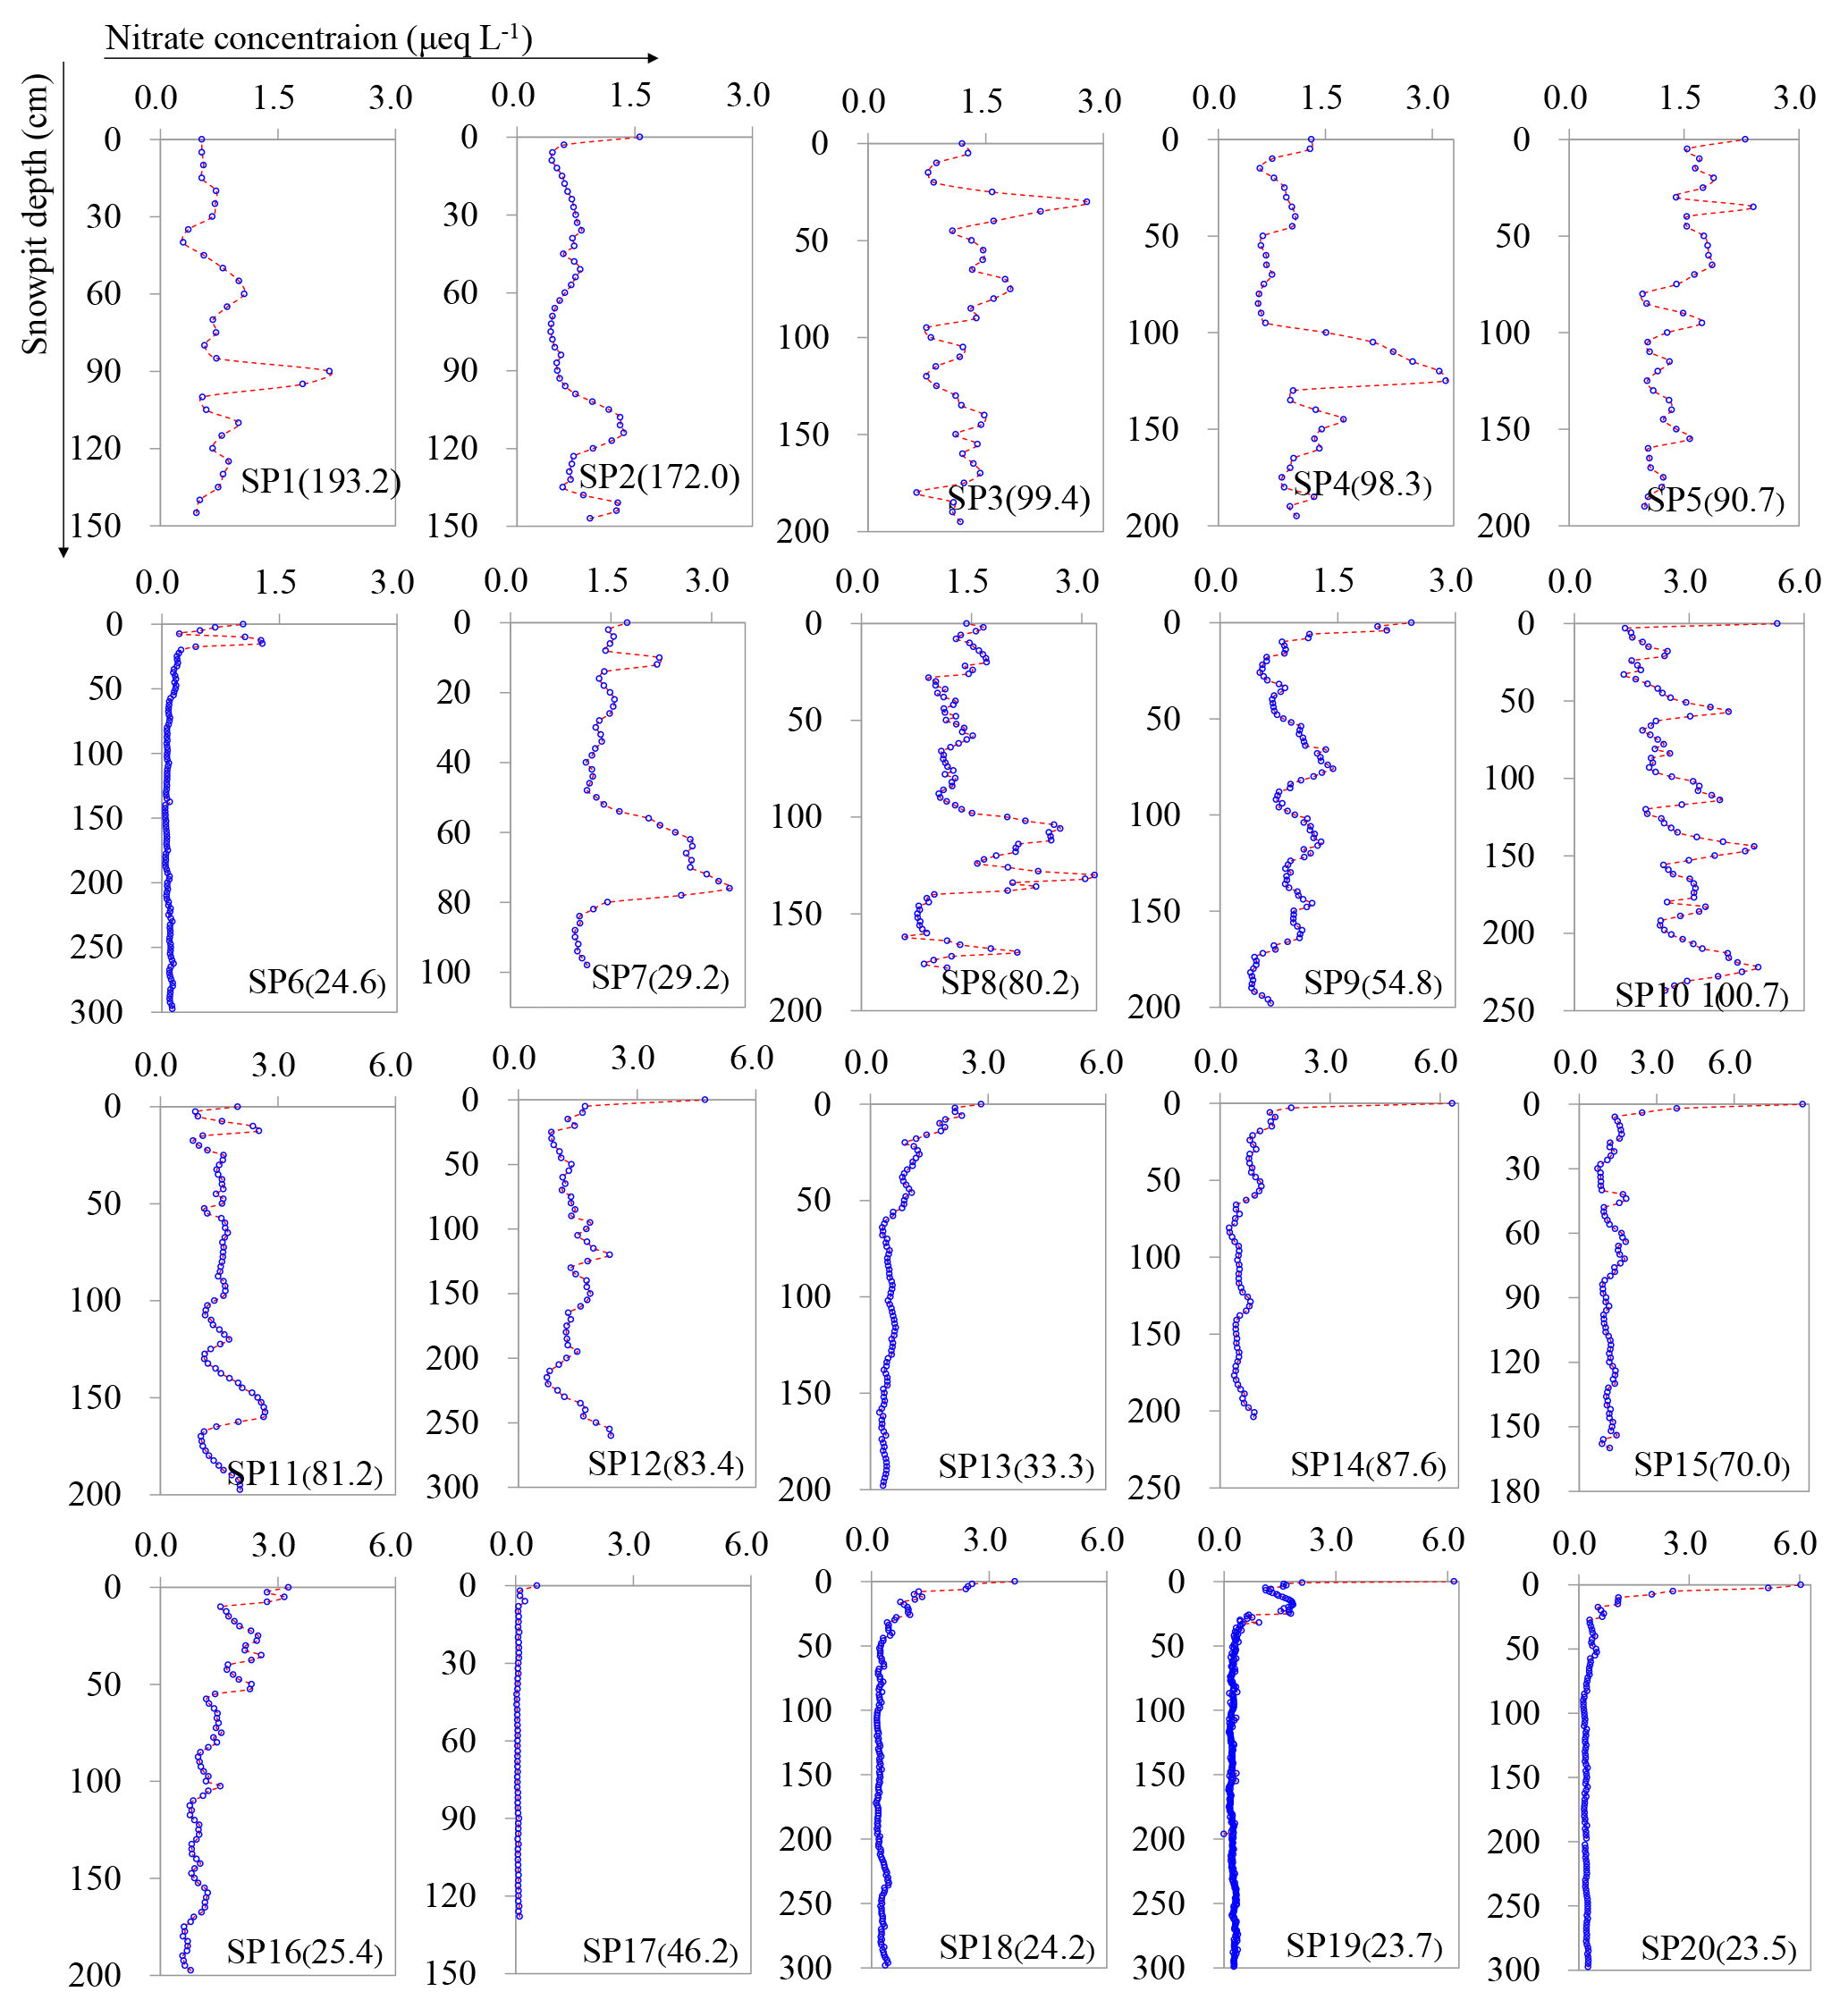
Figure 3The full profiles of NO concentrations for snow pits collected on the traverse from the coast to Dome A, East Antarctica (SP1 is closest the coast; SP20 the furthest inland; see Fig. 2). The details on sampling of the snow pits refer to Table 1. The numbers in parentheses in each panel denote the annual snow accumulation rates (kg m−2 a−1). Note that the scales of x axes for the snow pits SP1–SP9 and SP10–SP20 are different.
The percentage that surface snow NO contributes to total ions (i.e., total ionic strength, sum of Na+, NH, K+, Mg2+, Ca2+, Cl−, NO , SO and H+, in µeq L−1) varies from 6.7 to 37.6 % (mean of 27.0 %; Fig. S2 in the Supplement), with low values near the coast and high percentages on the plateau. A strong relationship was found between NO and the total ionic strength in surface snow (R2=0.55, p<0.01).
In the crystal ice, the means (ranges) of Cl−, NO, SO, Na+, NH, K+, Mg2+, Ca2+ and H+ concentrations are 0.98 (0.62–1.27), 10.40 (8.35–16.06), 1.29 (0.87–2.13), 0.27 (0.21–0.33), 0.24 (0.03–0.56), 0.05 (0.03–0.08), 0.18 (0.15–0.22), 0.18 (0.05–0.57) and 11.75 (9.56–18.12) µeq L−1, respectively. H+ and NO are the most abundant species, accounting for 46.4 and 41.0 % of the total ions, followed by SO (5.1 %) and Cl− (3.9 %). The other five cations, Na+, NH, K+, Mg2+ and Ca2+, only represent 3.6 % of the total ion budget. A significant linear relationship was found between NO and the total ionic strength (R2=0.99, p<0.01), possibly suggesting that NO is the species controlling ion abundance by influencing acidity of the crystal ice (i.e., H+ levels). In comparison with surface snow, concentrations of H+ and NO are significantly higher in crystal ice (independent samples t test, p<0.01), while concentrations of Cl−, SO, Na+, NH, K+, Mg2+ and Ca2+ are comparable in the two types of snow samples (Fig. S2 in the Supplement). To date, the information on the chemistry of ice crystal is rather limited but data from the so-called skin layer at Dome C (top ∼ 4 mm snow), where NO concentrations are in the range of 9–22 µeq L−1 in summertime (Erbland et al., 2013), are generally comparable to our observations.
NO concentrations in surface snow have been widely measured across Antarctica (Fig. 2), and the values vary from 0.2 to 12.9 µeq L−1, with a mean of 2.1 µeq L−1 (n= 594, 1σ=1.7 µeq L−1) and a median of 1.4 µeq L−1. Most of the data (87 %) fall in the range of 0.5–4.0 µeq L−1, and only 7 % of the values are above 5.0 µeq L−1, mainly distributed on the East Antarctic plateaus. Spatially, NO concentrations show an increasing trend with distance inland, and the values are higher in East than in West Antarctica. Overall, this spatial pattern is opposite to that of the annual snow accumulation rate (Arthern et al., 2006), i.e., low (high) snow accumulation corresponds to high (low) NO concentrations. It is difficult to compare with NO concentrations derived from the “upper snow layer” in different studies because each study sampled a different depth (Fig. 2), e.g., 2–10 cm for DDU-Dome C traverse (Frey et al., 2009; Erbland et al., 2013), 25 cm for the 1989–1990 International Trans-Antarctica Expedition (Qin et al., 1992) and 3 cm for this study. The different sampling depths can result in large differences in NO concentration, especially on the East Antarctic plateaus (e.g., the values of the topmost 1 cm of snow, the crystal ice in this study, can be up to > 15 µeq L−1; Fig. 1). Because of this, any comparison of NO concentrations in surface snow collected in different campaigns should be made with caution.
3.2 Snow pit NO concentrations
Mean NO concentrations for snow pits are shown in Fig. 1. From the coast to ∼ 450 km inland, snow pit NO means are comparable to those of surface snow, whereas NO means are lower in inland snow pits than in surface snow with the exception of sites ∼ 800 km from the coast. In general, the differences between snow pit NO means and the corresponding surface snow values are small at sites with high snow accumulation (e.g., close to coast), while the differences are large in low snow accumulation areas (e.g., near Dome A).
The profiles of NO for all snow pits are shown in Fig. 3. NO concentrations vary remarkably with depth in pits SP1–SP5, which are located near the coast. Although SP2 and SP5 show high NO concentrations in the topmost sample, the data from deeper depths can be compared with the surface values. In addition, NO means for the entire snow pits are close to the means of the topmost layer covering a full annual cycle of accumulation (i.e., the most recent year of snow accumulation) at SP1–SP5 (Fig. 4). Given the high snow accumulation (Fig. 1), NO variability in coastal snow pits is likely suggestive of a seasonal signature (Wagenbach et al., 1998b; Grannas et al., 2007; Shi et al., 2015). Among the coastal snow pits, water isotope ratios (δ18O of H2O) of samples at SP2 were also determined, thus allowing for investigating NO seasonal variability (Fig. S3 in the Supplement). In general, the δ18O(H2O) peaks correspond to high NO concentrations (i.e., NO peaks present in summer). This seasonal pattern is in agreement with previous observations of NO in snow/ice and atmosphere in coastal Antarctica (Mulvaney and Wolff, 1993; Mulvaney et al., 1998; Wagenbach et al., 1998b; Savarino et al., 2007).
In contrast, most of the inland snow pits show high NO concentrations in the top layer and then fall sharply from > 2.0 µeq L−1 in top snow to < 0.2 µeq L−1 in the first meter of depth (Fig. 3). NO means for the entire snow pits are typically lower than those of the most recent year snow layer (Fig. 4). Similar NO profiles for snow pits have been reported elsewhere in Antarctica, as a result of post-depositional processing of NO (Röthlisberger et al., 2000; McCabe et al., 2007; Erbland et al., 2013; Shi et al., 2015).
Comparison of the NO profile patterns reveals significant spatial heterogeneity, even for neighboring sites. For instance, sites SP11 and SP12, 14 km apart, feature similar snow accumulation rate (Table 1). If it is assumed that snow accumulation is relatively constant during the past several years at SP11 (sampled in 2012/2013), snow in the depth of ∼ 54 cm corresponds to the deposition in 2009/2010 (snow density = 0.45 g cm−3, from field measurements). NO concentrations are much higher in the top snow of SP12 (sampled in 2009/2010) than in the depth of ∼ 54 cm in SP11 (Fig. 3). This variation in NO profiles on a local scale has been reported, possibly related to local morphologies associated with sastrugi formation and wind drift (Frey et al., 2009; Traversi et al., 2009). It is interesting that higher NO concentrations were not found in the uppermost layer at sites SP7 and SP8 (∼ 600 km from coast; Fig. 3), where large sastrugi with hard smooth surfaces had extensively developed (from field observations; Fig. S4 in supporting information). Snow accumulation rate in this area fluctuates remarkably, and the values of some sites are rather small or close to zero due to the strong wind scouring (Fig. 1) (Ding et al., 2011; Das et al., 2013). In this case, the snow pit NO profiles appear to be largely influenced by wind scour on snow, possibly resulting in missing years and/or intra-annual mixing.
4.1 Accumulation influence on NO
The preservation of NO is thought to be closely associated with snow accumulation, where most of the deposited NO is preserved at sites with higher snow accumulation (Wagenbach et al., 1994; Hastings et al., 2004; Fibiger et al., 2013), whereas NO may be altered significantly at sites with low snow accumulation, largely due to photolysis (Blunier et al., 2005; Grannas et al., 2007; Frey et al., 2009; Erbland et al., 2013, 2015). In the following discussion, we divide the traverse into two zones, i.e., the coastal zone (< ∼ 450 km from the coast, including SP1–SP5 and Core 1; Table 1) and the inland region (∼ 450 km to Dome A, including pits SP6-SP20 and Core 2; Table 1), following NO distribution patterns in surface snow and snow pits (Sect. 3.1 and 3.2) as well as the spatial pattern of snow accumulation rate (Fig. 1).
As for snow pits, NO levels in top and deeper layers are comparable near the coast, while NO differs considerably between the upper and deeper snow at inland sites (Figs. 3 and 4). Photochemical processing is responsible for NO distribution in inland snow pits (Erbland et al., 2013; Berhanu et al., 2015). Considering that the actinic flux is always negligible below the depth of 1 m, the bottom layers of the snow pits (i.e., > 100 cm; Table 1) are well below the photochemically active zone (France et al., 2011; Zatko et al., 2013). In this case, NO in the bottom snow pit, i.e., below the photic zone, can be taken as the archived fraction without further modification, as also suggested by previous observations (Frey et al., 2009; Erbland et al., 2013, 2015). Here, we define NO in the bottom layer covering a full annual cycle of deposition as an approximation of the annual mean of archived NO (i.e., beyond photochemical processing; denoted as “Carchived” in the following context; Fig. 4), thus allowing for calculating the archived annual NO flux (i.e., the product of Carchived and annual snow accumulation rate). Although there is uncertainty in the calculation of archived NO flux due to interannual variability in NO inputs and snow accumulation, this assumption provides a useful way to investigate the relationship between preservation of NO and physical factors considering that an extensive array of ice core measurements are unavailable in most of Antarctica. It is noted that Carchived is generally close to (lower than) the NO means for entire snow pits in coastal (inland) Antarctica (Fig. 4).
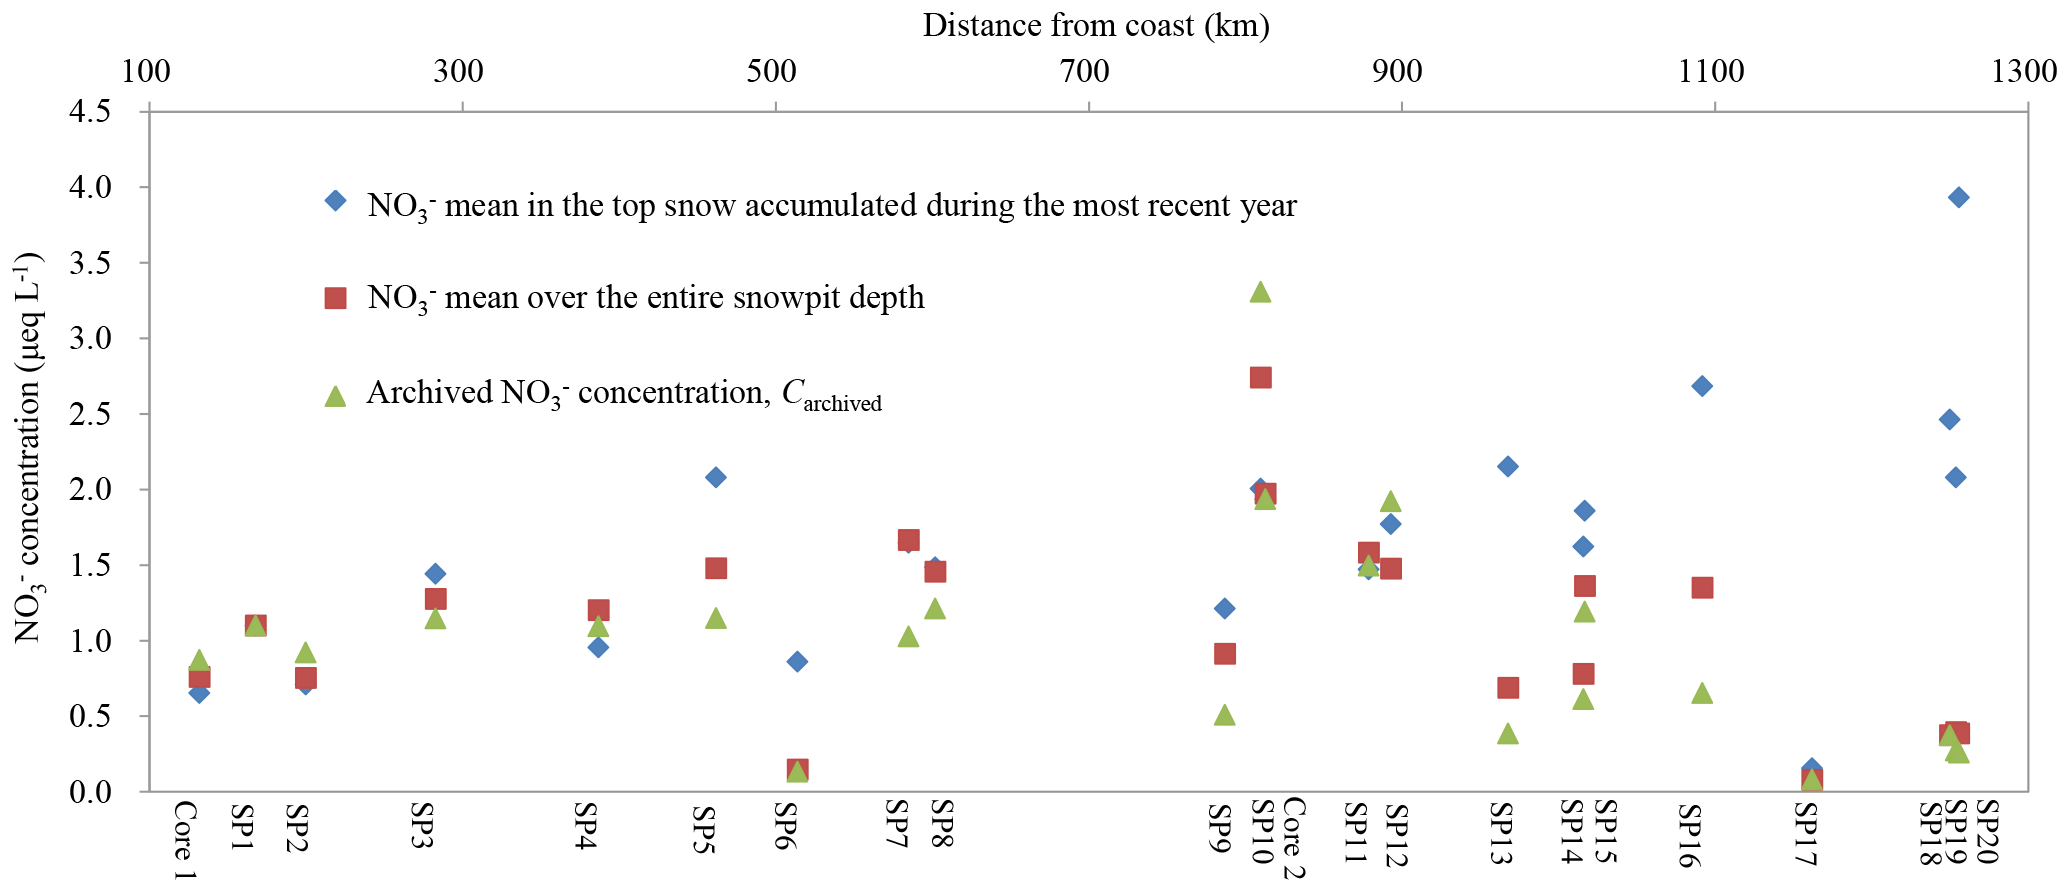
Figure 4Mean concentrations of NO for the entire snow pit depth (in square), the uppermost layer covering one-year snow accumulation (in diamond) and the bottom layer covering a full annual cycle of deposition (archived NO concentration, Carchived, in triangle).
4.1.1 NO in coastal snowpack
The simplest plausible model to relate flux and concentration of NO in snow to its atmospheric concentration (Legrand, 1987; Alley et al., 1995) can be expressed as
where Ftotal is snow NO flux (µeq m−2 a−1); Catm is atmospheric concentration of NO (µeq m−3); A is annual snow accumulation rate (kg m−2 a−1); Cfirn is measured firn NO concentration (µeq L−1, here Cfirn=Carchived); K1 is the dry deposition velocity (cm s−1); and K2 is the scavenging ratio for precipitation (m3 kg−1), which allows conversion of atmospheric concentration to snow concentration of NO in this study. From Eqs. (4) and (5), firn NO concentration can be expressed as
If K1 and K2 are constants, a linear relationship between measured NO concentration (Cfirn) and snow accumulation (A) can be interpreted using Eq. (6), which assumes regional spatial homogeneity of fresh snow NO levels and dry deposition flux. The slope (K1Catm) of the linear model represents an approximation of dry deposition flux of NO (i.e., an apparent dry deposition flux), while the intercept (K2Catm) stands for NO concentration in fresh snowfall. If dry deposition (K1Catm) is much larger than wet deposition (K2CatmA), the concentration of NO in snow will be proportional to its concentration in the atmosphere. In the condition of a constant atmospheric concentration, larger snow accumulation will increase the flux of NO but decrease its concentration in snow. While this linear model is a gross oversimplification of the complex nature of air–snow exchange of NO, it provides a simple approach to compare the processes occurring on the coast versus those inland. In addition, this model can provide useful parameter values in modeling NO deposition and preservation on large scales, considering that observations remain sparse across Antarctica (e.g., Zatko et al., 2016).
The relationship between Carchived of NO and snow accumulation rate is shown in Fig. 5. The linear fit of Carchived vs. inverse snow accumulation (R2=0.88, p<0.01; Fig. 5a) supports the assumptions of spatial homogeneity. The intercept and slope of the linear fit suggest a NO concentration in fresh snow and an apparent NO dry deposition flux of 0.7±0.07 µeq L−1 and 45.7±7.8 µeq m−2 a−1, respectively. The apparent dry deposition flux is opposite to the observation in Dronning Maud Land (DML) region, where a negative dry deposition flux suggested net losses of NO (Pasteris et al., 2014).

Figure 5The relationships amongst snow accumulation rate, the archived concentration (Carchived), and flux of NO in coastal (a, b and c) and inland (d, e and f) Antarctica. In panel (d), the linear fit in black line () includes the full data set, while the linear equation in red () was obtained by excluding two cases (open circles) with snow accumulation rate larger than 100 kg m−2 a−1 (see the main text). The flux values are the product of Carchived of NO and snow accumulation rate, namely the archived flux. Least-squares regressions are noted with solid lines and are significant at p<0.01. Error bars represent 1 standard deviation (1σ).
Figure 5b shows the archived fluxes of NO on the coast, with values from 104 (at the lowest accumulation site) to 169 µeq m−2 a−1 (at the highest accumulation site). Taking the calculated NO dry deposition flux of 45.7 µeq m−2 a−1, dry deposition accounts for 27–44 % (mean of 36 %) of total NO inputs, with higher (lower) percentages at lower (higher) snow accumulation sites. This result is in line with the observations in Taylor Valley (coastal West Antarctica), where the snowfall was found to be the primary driver for NO inputs (Witherow et al., 2006). This observation also generally agrees with, but is greater than, that in the modeling study of Zatko et al. (2016), which predicts a ratio of dry deposition to total deposition of NO in Antarctica as < 20 % close to the coast, increasing towards the plateaus.
In Fig. 5a and b, the strong linear relationships between NO and snow accumulation support that K1 and K2 are relatively constant on the coast (Eqs. 4 and 6). The average atmospheric concentration of NO in the coastal ∼ 450 km region is 15.6 ng m−3 in summer (Table S1 in the Supplement). Taking Catm=15.6 ng m−3, K1 is estimated to be 0.6 cm s−1, close to a typical estimate for HNO3 deposition velocity to a snow/ice surface (0.5 cm s−1; Seinfeld and Pandis, 1997). This predicted K1 value is lower than that calculated for the dry deposition of HNO3 at South Pole (0.8 cm s−1; Huey et al., 2004). It is noted that the true K1 value could be larger than the prediction (0.6 cm s−1) due to the higher values of Catm in summer (i.e., 15.6 ng m−3 for the calculation of K1) than in other seasons (Mulvaney et al., 1998; Wagenbach et al., 1998b; Savarino et al., 2007). The scavenging ratio for precipitation (K2) is estimated to be about 0.2×10⁴ m3 kg−1, i.e., 2 m3 g−1.
If it is assumed that NO concentration in snow is related to its concentration in the atmosphere, the scavenging ratio for NO (W) can be calculated on a mass basis from the following expression (Kasper-Giebl et al., 1999):
where ρatm is air density (g m−3), and Cf-snow and Catm are NO concentrations in fresh snow (ng g−1) and atmosphere (ng m−3), respectively. If taking ρatm≈1000 g m−3 (on average, ground surface temperature t≈255 K, ground pressure P≈0.08 MPa, in the coastal region) ng g−1 (see discussion above and Sect. 4.2 below) and Catm=15.6 ng m−3, W is calculated to be ∼ 2700, generally comparable to previous reports (Barrie, 1985; Kasper-Giebl et al., 1999; Shrestha et al., 2002). It is noted that the calculation here may be subject to uncertainty due to the complex transfer of atmospheric NO into the snow. However, the scavenging ratio provides valuable insights into the relation between NO concentrations in the atmosphere and snow, which might be useful in modeling NO deposition on a large scale.
Figure 5c shows the distribution of flux is negatively correlated with Carchived of NO, which is not surprising since Carchived is positively related to inverse accumulation (Fig. 5a). Based on the observed strong linear relationship between NO flux and snow accumulation (Fig. 5b), the archived NO flux is more accumulation-dependent compared to Carchived. This is compatible with the observations in Greenland (Burkhart et al., 2009), where accumulation is generally above 100 kg m−2 a−1, similar to the coastal values in this study.
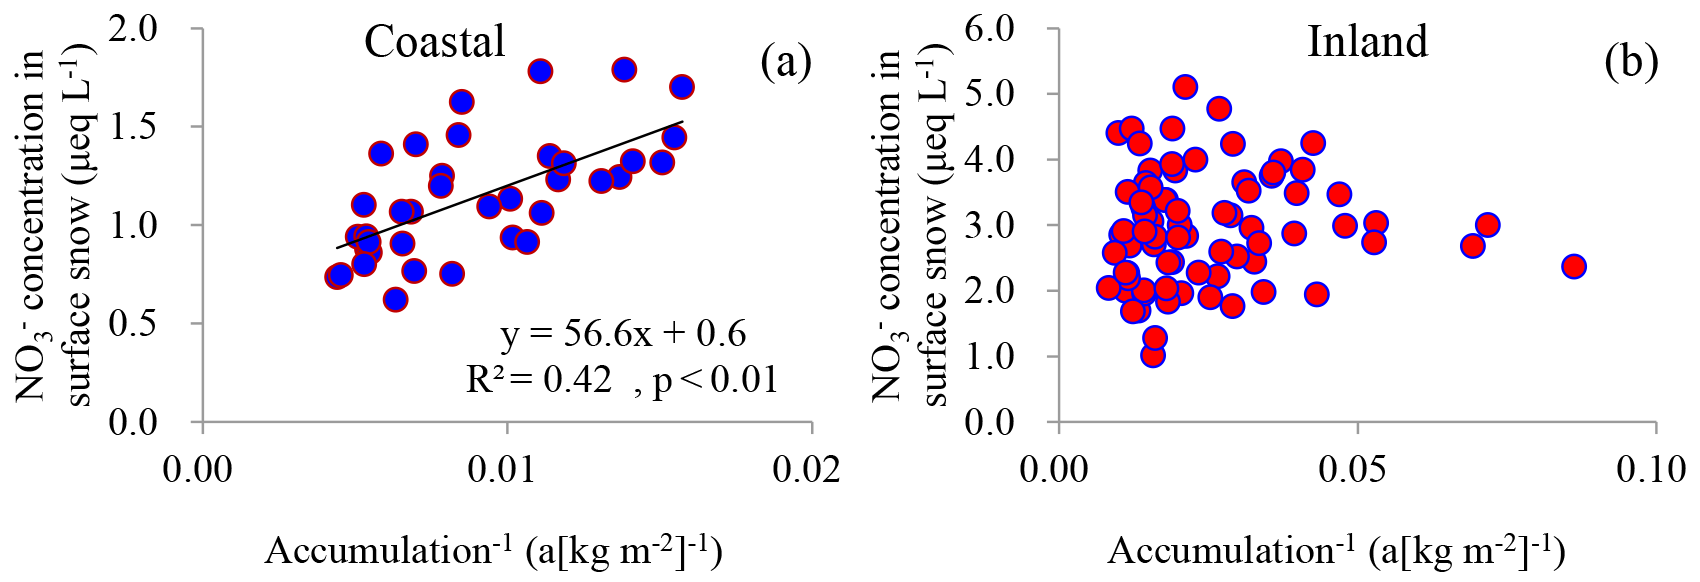
Figure 6The relationships between NO concentration and inverse snow accumulation rate in surface snow in coastal (a) and inland (b) Antarctica. Least-squares regressions are noted with solid line and are significant at p<0.01.
In terms of surface snow on the coast, NO may be disturbed by the katabatic winds and wind convergence located near the Amery Ice Shelf (that is, the snow-sourced NOx and NO from the Antarctic plateau possibly contributes to coastal snow NO (Parish and Bromwich, 2007; Ma et al., 2010; Zatko et al., 2016). In addition, the sampled ∼ 3 cm surface layer roughly corresponds to the net accumulation in the past 0.5–1.5 months, assuming an even distribution of snow accumulation in the course of a single year. This difference in exposure time of the surface snow at different sampling sites could possibly affect the concentration of NO, although the post-depositional alteration of NO was thought to be minor on the coast (Wolff et al., 2008; Erbland et al., 2013; Shi et al., 2015). Taken together, NO in coastal surface snow might represent some post-depositional alteration. Even so, a negative correlation between NO concentration and snow accumulation rate was found at the coast (R2=0.42, p<0.01; Fig. 6a), suggesting that overall the majority of the NO appears to be preserved and is determined by snow accumulation.
4.1.2 NO in inland snowpack
In comparison with the coast, the correlation between Carchived and inverse snow accumulation is relatively weak in inland regions (Fig. 5d), suggesting more variable conditions in ambient concentrations and dry deposition flux of NO. In addition, the relationship of Carchived vs. inverse accumulation inland is opposite to that on the coast. Based on current understanding of the post-depositional processing of NO, the negative correlation between Carchived and inverse snow accumulation (Fig. 5d) suggests losses of NO. The slope of the linear relationship indicates an apparent NO dry deposition flux of µeq m−2 a−1, much larger than that of DML ( µeq m−2 a−1), where the snow accumulation is generally lower than 100 kg m−2 a−1 (Pasteris et al., 2014). At Kohnen Station (an inland site in East Antarctica), with snow accumulation of 71 kg m−2 a−1, the emission flux of NO is estimated to be µeq m−2 a−1 (Weller and Wagenbach, 2007), which is also smaller in comparison with this observation. Weller et al. (2004) proposed that the loss rate of NO does not depend on snow accumulation rate and the losses become insignificant at accumulation rates above 100 kg m−2 a−1. Among the inland sites, SP10 and Core2 (∼ 800 km from the coast), characterized by high snow accumulation rate (> 100 kg m−2 a−1; Table 1 and Fig. 1), exhibit even higher values of Carchived and archived fluxes of NO than those of the coastal sites. It is noted that these two cases influence the linear regression significantly (Fig. 5d). If the two sites are excluded, we can get a linear regression with a slope of µeq m−2 a−1, which is comparable to previous reports in DML (Pasteris et al., 2014).
The depths of inland snow pits cover several to tens of years snow accumulation, thus allowing for directly investigating NO emission rate. The difference between NO concentrations in the snow layer accumulated during the most recent year (Fig. 4) and in the snow accumulated during the year before the most recent year can represent the loss rate of NO. If it is assumed that snow accumulation rate is relatively constant during recent decades at specific-sites, on average, 36.7±21.3 % of NO (in µeq L−1) was lost during 1 year, with the two sites (SP10 and Core2) with snow accumulation > 100 kg m−2 a−1 excluded from the calculation. The percentages are generally higher at the sites with lower snow accumulation rate. Together with snow accumulation rate, the emission flux of NO is calculated to be µeq m−2 a−1, close to the linear model prediction ( µeq m−2 a−1). Significant losses can account for NO profiles at inland sites, i.e., NO concentration decreasing with increasing depths. Previous observations and modeling works suggested that photolysis dominates the losses (Frey et al., 2009; Erbland et al., 2013; Shi et al., 2015). During photolysis of NO, some of the photoproducts (NOx) are emitted into the gas phase (Davis et al., 2004; France et al., 2011), and these products could undergo reoxidation by the local oxidants (e.g., hydroxyl radical (OH), NO2 + OH + M → HNO3 + M), forming gas-phase HNO3. In inland Antarctica, the dominant NO species in the atmosphere is gaseous HNO3 during summertime, while particulate NO is more important in winter (Legrand et al., 2017b; Traversi et al., 2017). The high levels of gas-phase HNO3 in summer support the importance of the re-emission from snow through the photolysis of NO in affecting the atmospheric NOx∕ NO budget (Erbland et al., 2013). On the one hand, the gaseous HNO3 can be efficiently co-condensed with water vapor onto the extensively developed crystal ice layers on Antarctic plateaus (e.g., Fig. S1 in the Supplement), leading to an enrichment of NO in surface snow (Bock et al., 2016). On the other hand, a large concentration of HNO3 would enhance its reaction with sea salt, leading to elevated particulate NO concentrations (Legrand et al., 2017b). The significant correlation between NO and H+ in inland Antarctic surface snow (R2=0.65, p<0.01) seems to support the importance of atmospheric gas-phase HNO3 in affecting surface snow NO concentrations, in particular NO levels in the crystal ice samples (Fig. 1).
Several modeling works have been performed to understand NO recycling processes across Antarctica (e.g., Erbland et al., 2015; Zatko et al., 2016; Bock et al., 2016), but each employs different assumptions and large uncertainty remains in quantifying NO recycling and preservation. It is thought that emission and transport strength are the main factors controlling the recycling of NO, while the former is associated with initial NO concentrations, UV and snow optical properties, and the latter is linked with air mass movement (Wolff et al., 2008; Frey et al., 2009). As a result, snow accumulation alone is likely insufficient to account for NO variability in surface snow (i.e., no significant correlation between NO concentration and snow accumulation; Fig. 6b).
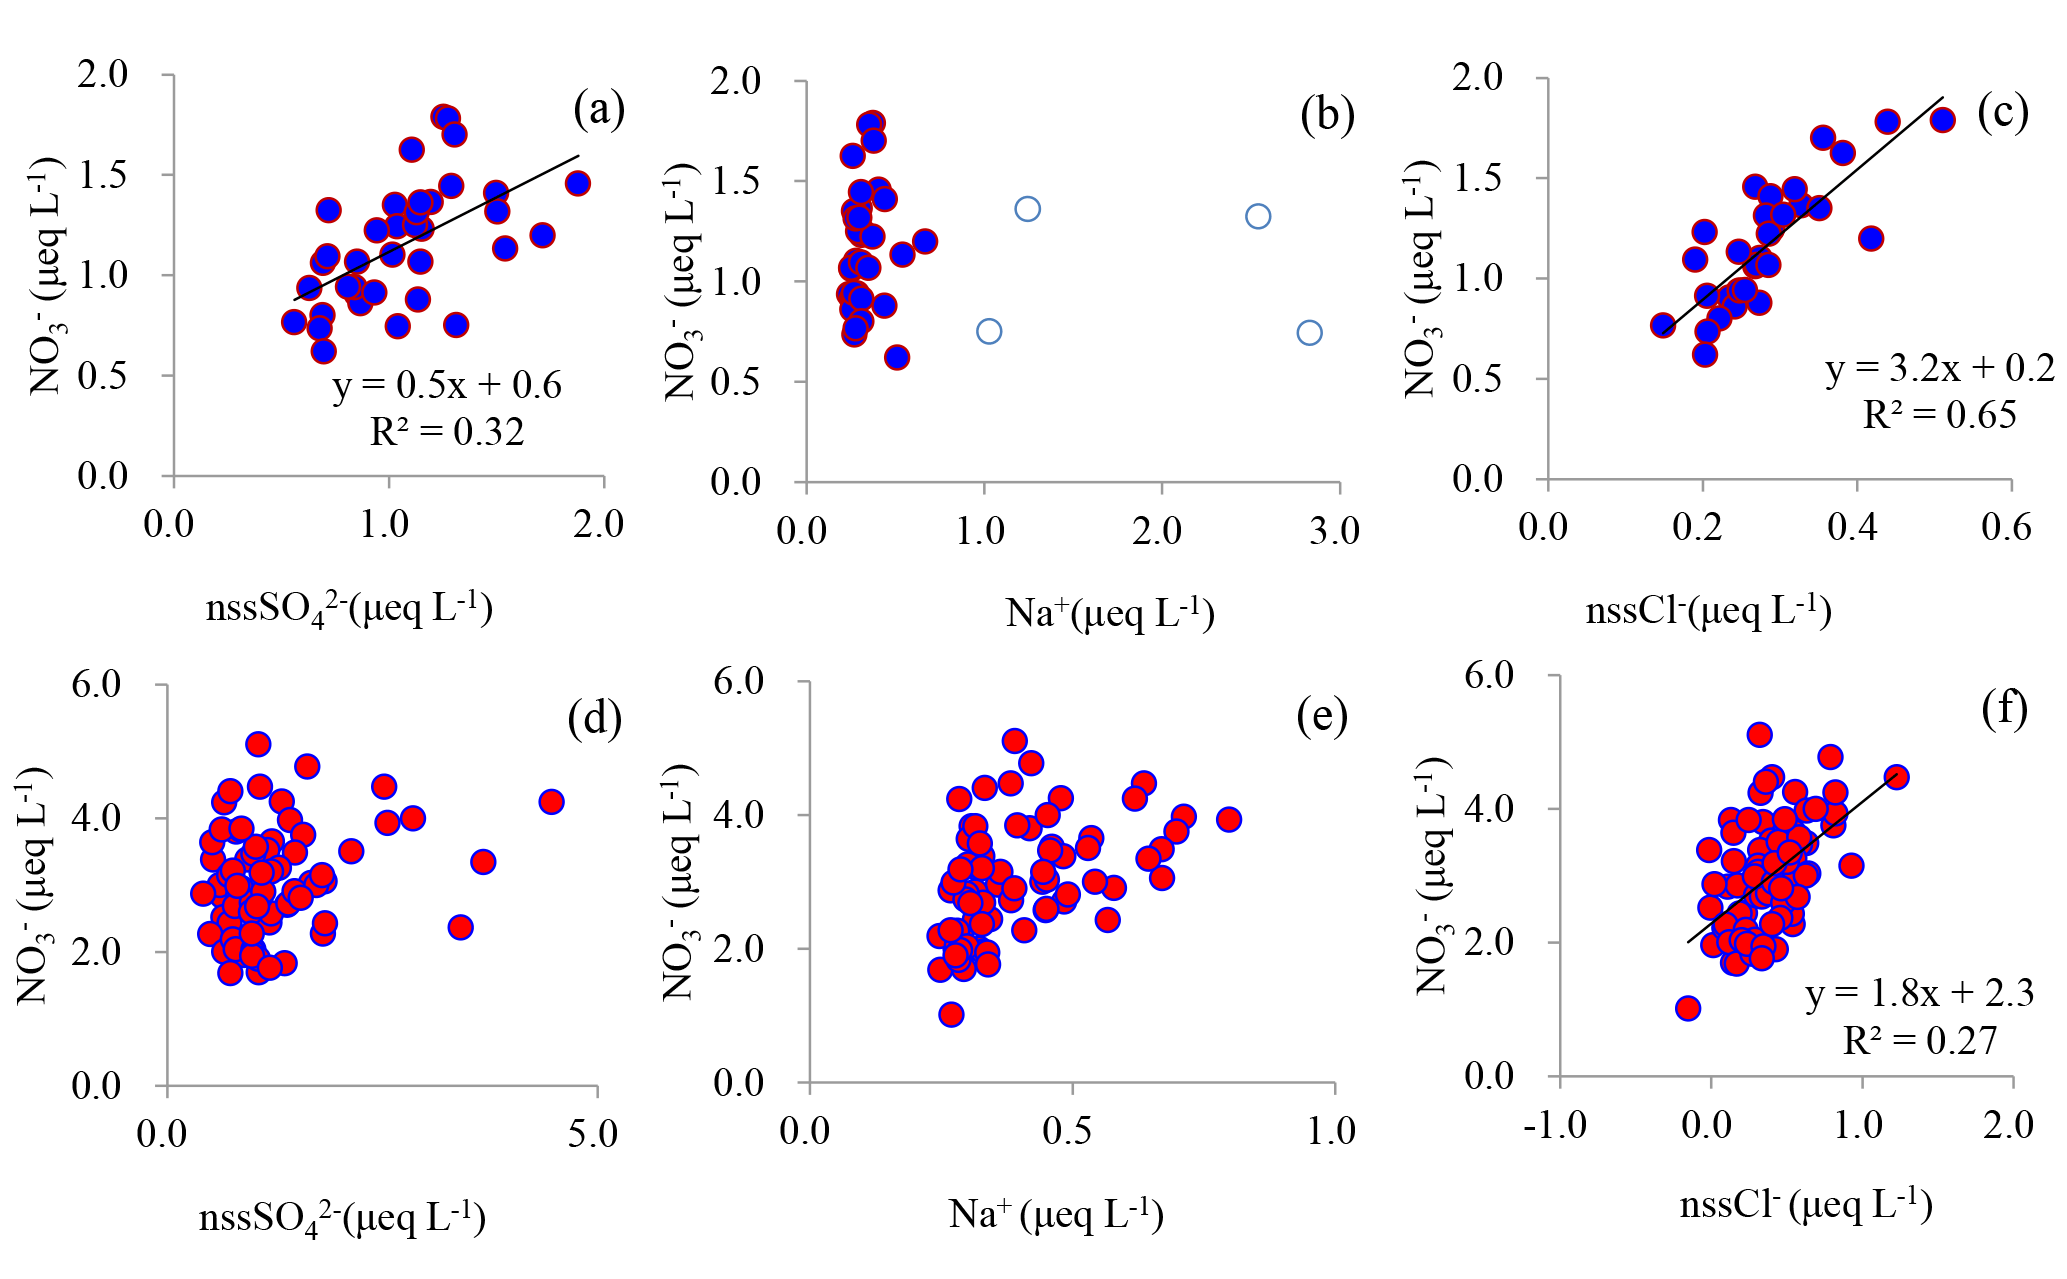
Figure 7Relationships between NO and co-existing major ions in surface snow in coastal (top row, a, b and c) and inland (bottom row, d, e and f) Antarctica. Least-squares regressions are noted with solid line and are significant at p<0.01. The four samples with high Na+ concentrations are denoted by blue open circles (b), the same as those in Fig. 8 (the blue open circles). Note that the four samples were excluded in the plot of NO vs. nssCl− (c).
The archived NO fluxes vary considerably among inland sites, from ∼ 3 to 333 µeq m−2 a−1, with high values generally corresponding to high snow accumulation (Fig. 5e). However, the nearly 1:1 relationship between Carchived and NO flux (Fig. 5f), suggests that accumulation rate is not the main driver of the archived NO concentration. In inland Antarctica, the archived NO fraction is largely influenced by the length of time that NO was exposed to UV radiation (Berhanu et al., 2015), which decreases exponentially in the snowpack. The e-folding depth, ze value, is thought to be influenced by a variety of factors, such as co-existent impurities (e.g., black carbon), bulk density and grain size (Zatko et al., 2013). In addition, the snow albedo is also dependent on snow physical properties (Carmagnola et al., 2013). Taken together, this suggests that the inland plateau is below a “threshold” of accumulation rate such that the archived NO flux cannot be explained by snow accumulation rate.
4.2 Effects of coexisting ions on NO
Atmospheric NO in Antarctica is thought to be mainly associated with mid-latitude sources, re-formed NO driven by snow-sourced photolysis products and/or stratospheric inputs (Savarino et al., 2007; Lee et al., 2014; Traversi et al., 2017, and references therein). Although organic nitrates can play an important role in the atmospheric NOy budget, multi-seasonal measurements of surface snow NO correlate strongly with inorganic NOy species (especially HNO3) rather than organic (Jones et al., 2011). Here, we investigate whether NO in snow is closely associated with coexisting ions (e.g., Cl−, SO, Na+, K+, Mg2+ and Ca2+) since these ions have different main sources; e.g., Cl− and Na+ are predominantly influenced by sea salt, and SO is likely dominated by marine inputs (e.g., sea salt and bioactivity source) (Bertler et al., 2005). In the snow, Cl−, Na+ and SO are the most abundant ions in addition to NO.
In surface snow, the non-sea-salt fraction of SO accounted for 75–99 % of its total budget, with a mean of 95 %. The percentages were relatively higher in inland regions than at coastal sites. On the coast, a positive relationship was found between nssSO and NO (R2=0.32, p<0.01; Fig. 7a). Previous observations suggest that NO and nssSO peaks in the atmosphere and snow are usually present in summer (Jourdain and Legrand, 2002; Wolff et al., 2008; Sigl et al., 2016; Legrand et al., 2017a, b). However, the similar seasonal pattern of the two species is associated with distinct sources, i.e., SO is mainly derived from marine biogenic emissions while NO is influenced by photolysis and tropospheric transport (Savarino et al., 2007; Lee et al., 2014; Zatko et al., 2016). In the atmosphere, SO is typically found on the submicron particles, while most of the NO is gaseous HNO3 and the particulate NO is mainly on intermediate size particles (Jourdain and Legrand, 2002; Rankin and Wolff, 2003; Legrand et al., 2017a, b). Thus, the correlation between NO and SO is unlikely explained by the sources or their occurrence state in the atmosphere (i.e., gaseous and particulate phases). Laluraj et al. (2010) proposed that the correlation between nssSO and NO in ice (R2=0.31, p<0.01) could be associated with fine nssSO aerosols, which provide nucleation centers forming multi-ion complexes with HNO3 in the atmosphere. This assertion, however, should be examined further, considering that the complex chemistry of SO and NO in the atmosphere is far from understood (e.g., Wolff, 1995; Brown et al., 2006). Thus far, the mechanism of nssSO influencing NO in the snowpack, however, is still debated, and it cannot be ruled out that nssSO further affects mobilization of NO during and/or after crystallization (Legrand and Kirchner, 1990; Wolff, 1995; Röthlisberger et al., 2000). It is noted that no relationship was found between nssSO and NO in inland snow (Fig. 7d), possibly due to the strong alteration of NO during post-depositional processes, as discussed in Sect. 4.1.2.

Figure 8Concentrations of NO and Na+ in surface snow samples on the coast. Four samples with high Na+ concentrations are denoted by open circles, corresponding to those in Fig. 7b. Note that Na+ concentrations in two samples, 2.5 and 2.8 µeq L−1 in parentheses, are above the maximum value of the secondary y axis (Na+ concentration). The sample in the dashed ellipse, with Na+ concentration of 2.8 µeq L−1, is the fresh snowfall.
In comparison with nssSO aerosols, the sea-salt aerosols (Na+) are coarser and can be removed preferentially from the atmosphere due to a larger dry deposition velocity. High atmospheric sea-salt aerosol concentrations are expected to promote the conversion of gaseous HNO3 to the particulate phase, considering that most of the NO in the atmosphere is in the gas phase (HNO3). In this case, particulate NO can be efficiently lost via aerosol mechanisms. In addition, the saline ice favors the direct uptake of gaseous HNO3 to the ice surface. Changes in partitioning between gas phase (HNO3) and particulate phase will affect NO levels due to the different wet and dry deposition rates of the two species (Aw and Kleeman, 2003). Thus, sea-salt aerosols play an important role in the scavenging of gaseous HNO3 from the atmosphere (Hara et al., 2005), and elevated NO concentrations are usually accompanied by Na+ spikes in the snowpack (e.g., at Halley station; Wolff et al., 2008). Surprisingly, no significant correlation was found between Na+ and NO in coastal snow (Fig. 7b). The concentration profiles of NO and Na+ in coastal surface snow are shown in Fig. 8, and NO roughly corresponds to Na+ in some areas, e.g., 50–150 and 300–450 km distance inland, although in general they are not very coherent. It is noted that amongst the four snow samples with Na+>1.5 µeq L−1 (open circles in Fig. 8), only one sample co-exhibits a NO spike. This is different from observations at Halley station, where Na+ peaks usually led to elevated NO levels in surface snow in summer (Wolff et al., 2008). Of the four largest Na+ spikes, one is a fresh snowfall sample (dashed ellipse in Fig. 8), and this sample shows the highest Na+ concentration (2.8 µeq L−1) and low NO (0.75 µeq L−1). It is noted that NO concentration in this fresh snowfall is close to the model predictions (0.7±0.07 µeq L−1; Sect. 4.1.1), validating that the simple linear deposition model (i.e., the Eq. 6) can depict well the deposition and preservation of NO in coastal snowpack. At inland sites, no correlation was found between NO and Na+ (Fig. 7e), likely explained by the alteration of NO concentration by post-depositional processing.
In surface snow, nssCl− represents 0–64 % (mean of 40 %) of the total Cl−. On the coast, it is of interest that nssCl− in the four samples with the highest Na+ concentrations (open circles in Figs. 7b and 8) are close to 0, and positive nssCl− values were found for the other samples. The fractionation of Na+ can occur due to mirabilite precipitation in sea-ice formation at < −8 ∘C (Marion et al., 1999), possibly leading to the positive nssCl−. However, even if all of SO in seawater is removed via mirabilite precipitation, only 12 % of sea-salt Na+ is lost (Rankin et al., 2002). Considering the smallest sea-ice extent in summertime in East Antarctica (Holland et al., 2014), the high Cl− / Na+ ratio (mean of 2.1, well above 1.17 of seawater, in µeq L−1) in surface snow is unlikely from sea-salt fractionation associated with mirabilite precipitation in sea-ice formation. In this case, nssCl− could be mainly related to the deposition of volatile HCl, which is from the reaction of H2SO4 and/or HNO3 with NaCl (Röthlisberger et al., 2003). Thus, nssCl− in snowpack can roughly represent the atmospherically deposited HCl. In summertime, most of the dechlorination (i.e., production of HCl) is likely associated with HNO3 due to its high atmospheric concentrations (Jourdain and Legrand, 2002; Legrand et al., 2017b). Accordingly, the observed relationship between NO and nssCl− (Fig. 7c) appears to suggest that HCl production can be enhanced by elevated HNO3 levels in the atmosphere.
With regard to the crystal ice, no significant correlation was found between NO and the coexisting ions (e.g., Cl−, Na+ and SO, suggesting that these ions are generally less influential on NO in this uppermost thin layer compared to the strong air–snow transfer process of NO (Bock et al., 2016). It is noted that NO accounts for most of the calculated H+ concentrations (81–97 %, mean of 89 %), and a strong linear relationship was found between them (R2=0.96, p<0.01), suggesting that NO is mainly deposited as acid, HNO3, rather than in particulate form as salts (e.g., NaNO3 and Ca(NO3)2). This deduction is in line with the atmospheric observations at Dome C, where NO was found to be mainly in gaseous phase (HNO3) in summer (Legrand et al., 2017b). On average, the deposition of HNO3 contributes > 91 % of NO in the crystal ice (the lower limit, 91 %, calculated by assuming all of the alkaline species (Na+, NH, K+, Mg2+ and Ca2+) are neutralized by HNO3 in the atmosphere), suggesting a dominant role of HNO3 deposition in snow NO concentrations. The elevated high atmospheric NO concentrations observed at Dome A (> 100 ng m−3; 77.12∘ E and 80.42∘ S; Table S1 in the Supplement) possibly indicate oxidation of gaseous NOx to HNO3, providing further evidence that NO recycling driven by photolysis plays an important role in its abundance in snowpack on East Antarctic plateaus.
Samples of surface snow, snow pits and the uppermost layer of crystal ice, collected on the traverse from the coast to Dome A, East Antarctica, were used to investigate the deposition and preservation of NO in snow. In general, a spatial trend of NO in surface snow was found on the traverse, with high (low) concentrations on the plateau (coast). Similarly, NO concentrations in the atmosphere are higher on the plateau than at coastal sites, with a range of 6 to 118 ng m−3. Extremely high NO levels (e.g., > 10 µeq L−1) were observed in the uppermost crystal ice layer, possibly associated with re-deposition of recycled NO from snow-sourced NOx. As for the snow pits, NO exhibits high levels in the top layer and low concentrations at deeper depths in the inland region, while no clear trend was found on the coast.
On the coast, the archived NO flux in snow is positively correlated with snow accumulation rate, but negatively with NO concentration. A linear model can well depict the relationship between archived NO and snow accumulation, supporting that atmospheric levels and dry deposition fluxes of NO are spatially homogeneous on the coast and that dry deposition plays a minor role in snow NO inputs. The dry deposition velocity and scavenging ratio for NO are estimated to be 0.6 cm s−1 and 2700, respectively. In inland Antarctica, the archived NO fluxes, varying significantly among sites, are largely dependent on NO concentration. A weak correlation between snow accumulation and archived NO suggests variable ambient concentrations and dry deposition flux of NO, and the relationship is opposite to that on the coast. This supports the idea that post-depositional processing dominates NO concentration and distribution in inland Antarctica (e.g., Erbland et al., 2013, 2015; Shi et al., 2015; Zatko et al., 2016).
The major ions, Cl−, SO and Na+, originate from different sources than NO but could potentially affect the scavenging and preservation of NO. In coastal surface snow, a positive correlation between nssSO and NO suggests the potential influence of fine aerosols on NO formation and/or scavenging, while the coarse sea-salt aerosol (e.g., Na+) is likely less influential. In contrast to the coast, NO in inland surface snow is dominated by post-depositional processes, and the effects of coexisting ions on NO appear to be rather minor. In inland surface snow, the strong relationship between NO and H+ suggests a dominant role of gaseous HNO3 deposition in determining NO concentrations.
Data on nitrate concentrations in snow on the traverse from coast (Zhongshan Station) to Dome A are available from the Chinese National Arctic and Antarctic Data Center, https://doi.org/10.11856/SNS.D.2018.001.v0 (Shi, 2018).
The supplement related to this article is available online at: https://doi.org/10.5194/tc-12-1177-2018-supplement.
The authors declare that they have no conflict of interest.
This project was supported by the National Science Foundation of China
(grant nos. 41576190, 41206188, and 41476169), the National Key
Research and Development Program of China (grant no. 2016YFA0302204), the
Fundamental Research Funds for the Central Universities and Chinese Polar Environment Comprehensive
Investigation and Assessment Programmes (grant nos. CHINARE 201X-02-02 and
201X-04-01). The authors appreciate the CHINARE inland members for providing
help during sampling. The authors would like to thank Joel Savarino
and two anonymous referees for their help in the development and improvement
of this paper.
Edited by: Joel Savarino
Reviewed by: two anonymous referees
Alexander, B., Savarino, J., Kreutz, K. J., and Thiemens, M.: Impact of preindustrial biomass-burning emissions on the oxidation pathways of tropospheric sulfur and nitrogen, J. Geophys. Res., 109, D08303, https://doi.org/10.1029/2003JD004218, 2004.
Alley, R., Finkel, R., Nishizumi, K., Anandakrishnan, A., Shuman, C., Mershon, G., Zielinski, G., and Mayewski, P. A.: Changes in continental and sea-salt atmospheric loadings in central Greenland during the most recent deglaciation: Model-based estimates, J. Glaciol., 41, 503–514, 1995.
Arthern, R. J., Winebrenner, D. P., and Vaughan, D. G.: Antarctic snow accumulation mapped using polarization of 4.3-cm wavelength microwave emission, J. Geophys. Res., 111, D06107, https://doi.org/10.1029/2004JD005667, 2006.
Aw, J. and Kleeman, M. J.: Evaluating the first-order effect of intraannual temperature variability on urban air pollution, J. Geophys. Res., 108, 4365, https://doi.org/10.1029/2002JD002688, 2003.
Barrie, L. A.: Scavenging ratios, wet deposition, and in-cloud oxidation: An application to the oxides of sulphur and nitrogen, J. Geophys. Res., 90, 5789–5799, 1985.
Berhanu, T. A., Meusinger, C., Erbland, J., Jost, R., Bhattacharya, S., Johnson, M. S., and Savarino, J.: Laboratory study of nitrate photolysis in Antarctic snow. II. Isotopic effects and wavelength dependence, J. Chem. Phy., 140, 244306, https://doi.org/10.1063/1.4882899, 2014.
Berhanu, T. A., Savarino, J., Erbland, J., Vicars, W. C., Preunkert, S., Martins, J. F., and Johnson, M. S.: Isotopic effects of nitrate photochemistry in snow: a field study at Dome C, Antarctica, Atmos. Chem. Phys., 15, 11243–11256, https://doi.org/10.5194/acp-15-11243-2015, 2015.
Bertler, N., Mayewski, P. A., Aristarain, A., Barrett, P., Becagli, S., Bernardo, R., Bo, S., Xiao, C., Curran, M., and Qin, D.: Snow chemistry across Antarctica, Ann. Glaciol., 41, 167–179, 2005.
Blunier, T., Floch, G., Jacobi, H.-W., and Quansah, E.: Isotopic view on nitrate loss in Antarctic surface snow, Geophys. Res. Lett., 32, L13501, https://doi.org/10.1029/2005GL023011, 2005.
Bock, J., Savarino, J., and Picard, G.: Air-snow exchange of nitrate: a modelling approach to investigate physicochemical processes in surface snow at Dome C, Antarctica, Atmos. Chem. Phys., 16, 12531–12550, https://doi.org/10.5194/acp-16-12531-2016, 2016.
Brown, S., Ryerson, T., Wollny, A., Brock, C., Peltier, R., Sullivan, A., Weber, R., Dube, W., Trainer, M., and Meagher, J.: Variability in nocturnal nitrogen oxide processing and its role in regional air quality, Science, 311, 67–70, https://doi.org/10.1126/science.1120120, 2006.
Burkhart, J. F., Bales, R. C., McConnell, J. R., Hutterli, M. A., and Frey, M. M.: Geographic variability of nitrate deposition and preservation over the Greenland Ice Sheet, J. Geophys. Res., 114, D06301, https://doi.org/10.1029/2008JD010600, 2009.
Carmagnola, C. M., Domine, F., Dumont, M., Wright, P., Strellis, B., Bergin, M., Dibb, J., Picard, G., Libois, Q., Arnaud, L., and Morin, S.: Snow spectral albedo at Summit, Greenland: measurements and numerical simulations based on physical and chemical properties of the snowpack, The Cryosphere, 7, 1139–1160, https://doi.org/10.5194/tc-7-1139-2013, 2013.
Das, I., Bell, R. E., Scambos, T. A., Wolovick, M., Creyts, T. T., Studinger, M., Frearson, N., Nicolas, J. P., Lenaerts, J. T., and van den Broeke, M. R.: Influence of persistent wind scour on the surface mass balance of Antarctica, Nat. Geosci., 6, 367–371, https://doi.org/10.1038/NGEO1766, 2013.
Davis, D., Chen, G., Buhr, M., Crawford, J., Lenschow, D., Lefer, B., Shetter, R., Eisele, F., Mauldin, L., and Hogan, A.: South Pole NOx chemistry: an assessment of factors controlling variability and absolute levels, Atmos. Environ., 38, 5375–5388, https://doi.org/10.1016/j.atmosenv.2004.04.039, 2004.
Dibb, J. E., Gregory Huey, L., Slusher, D. L., and Tanner, D. J.: Soluble reactive nitrogen oxides at South Pole during ISCAT 2000, Atmos. Environ., 38, 5399–5409, https://doi.org/10.1016/j.atmosenv.2003.01.001, 2004.
Ding, M., Xiao, C., Jin, B., Ren, J., Qin, D., and Sun, W.: Distribution of δ18O in surface snow along a transect from Zhongshan Station to Dome A, East Antarctica, Chin. Sci. Bull., 55, 2709–2714, https://doi.org/10.1007/s11434-010-3179-3, 2010.
Ding, M., Xiao, C., Li, Y., Ren, J., Hou, S., Jin, B., and Sun, B.: Spatial variability of surface mass balance along a traverse route from Zhongshan station to Dome A, Antarctica, J. Glaciol., 57, 658–666, 2011.
Duderstadt, K. A., Dibb, J. E., Jackman, C. H., Randall, C. E., Solomon, S. C., Mills, M. J., Schwadron, N. A., and Spence, H. E.: Nitrate deposition to surface snow at Summit, Greenland, following the 9 November 2000 solar proton event, J. Geophys. Res., 119, 6938–6957, https://doi.org/10.1002/2013JD021389, 2014.
Duderstadt, K. A., Dibb, J. E., Schwadron, N. A., Spence, H. E., Solomon, S. C., Yudin, V. A., Jackman, C. H., and Randall, C. E.: Nitrate ion spikes in ice cores not suitable as proxies for solar proton events, J. Geophys. Res., 121, 2994–3016, https://doi.org/10.1002/2015JD023805, 2016.
Erbland, J., Vicars, W. C., Savarino, J., Morin, S., Frey, M. M., Frosini, D., Vince, E., and Martins, J. M. F.: Air-snow transfer of nitrate on the East Antarctic Plateau – Part 1: Isotopic evidence for a photolytically driven dynamic equilibrium in summer, Atmos. Chem. Phys., 13, 6403–6419, https://doi.org/10.5194/acp-13-6403-2013, 2013.
Erbland, J., Savarino, J., Morin, S., France, J. L., Frey, M. M., and King, M. D.: Air-snow transfer of nitrate on the East Antarctic Plateau – Part 2: An isotopic model for the interpretation of deep ice-core records, Atmos. Chem. Phys., 15, 12079–12113, https://doi.org/10.5194/acp-15-12079-2015, 2015.
Felix, J. D. and Elliott, E. M.: The agricultural history of human – nitrogen interactions as recorded in ice core δ15N-NO, Geophys. Res. Lett., 40, 1642–1646, https://doi.org/10.1002/grl.50209, 2013.
Fibiger, D. L., Hastings, M. G., Dibb, J. E., and Huey, L. G.: The preservation of atmospheric nitrate in snow at Summit, Greenland, Geophys. Res. Lett., 40, 3484–3489, https://doi.org/10.1002/grl.50659, 2013.
France, J. L., King, M. D., Frey, M. M., Erbland, J., Picard, G., Preunkert, S., MacArthur, A., and Savarino, J.: Snow optical properties at Dome C (Concordia), Antarctica; implications for snow emissions and snow chemistry of reactive nitrogen, Atmos. Chem. Phys., 11, 9787–9801, https://doi.org/10.5194/acp-11-9787-2011, 2011.
Frey, M. M., Savarino, J., Morin, S., Erbland, J., and Martins, J. M. F.: Photolysis imprint in the nitrate stable isotope signal in snow and atmosphere of East Antarctica and implications for reactive nitrogen cycling, Atmos. Chem. Phys., 9, 8681–8696, https://doi.org/10.5194/acp-9-8681-2009, 2009.
Geng, L., Alexander, B., Cole-Dai, J., Steig, E. J., Savarino, J., Sofen, E. D., and Schauer, A. J.: Nitrogen isotopes in ice core nitrate linked to anthropogenic atmospheric acidity change, P. Natl. Acad. Sci., 111, 5808–5812, https://doi.org/10.1073/pnas.1319441111, 2014.
Geng, L., Murray, L. T., Mickley, L. J., Lin, P., Fu, Q., Schauer, A. J., and Alexander, B.: Isotopic evidence of multiple controls on atmospheric oxidants over climate transitions, Nature, 546, 133–136, https://doi.org/10.1038/nature22340, 2017.
Goodwin, I., De Angelis, M., Pook, M., and Young, N.: Snow accumulation variability in Wilkes Land, East Antarctica, and the relationship to atmospheric ridging in the 130∘–170∘ E region since 1930, J. Geophys. Res., 108, 4673, https://doi.org/10.1029/2002JD002995, 2003.
Grannas, A. M., Jones, A. E., Dibb, J., Ammann, M., Anastasio, C., Beine, H. J., Bergin, M., Bottenheim, J., Boxe, C. S., Carver, G., Chen, G., Crawford, J. H., Dominé, F., Frey, M. M., Guzmán, M. I., Heard, D. E., Helmig, D., Hoffmann, M. R., Honrath, R. E., Huey, L. G., Hutterli, M., Jacobi, H. W., Klán, P., Lefer, B., McConnell, J., Plane, J., Sander, R., Savarino, J., Shepson, P. B., Simpson, W. R., Sodeau, J. R., von Glasow, R., Weller, R., Wolff, E. W., and Zhu, T.: An overview of snow photochemistry: evidence, mechanisms and impacts, Atmos. Chem. Phys., 7, 4329–4373, https://doi.org/10.5194/acp-7-4329-2007, 2007.
Hara, K., Osada, K., Kido, M., Matsunaga, K., Iwasaka, Y., Hashida, G., and Yamanouchi, T.: Variations of constituents of individual sea-salt particles at Syowa station, Antarctica, Tellus B, 57, 230–246, 2005.
Hastings, M. G., Steig, E., and Sigman, D.: Seasonal variations in N and O isotopes of nitrate in snow at Summit, Greenland: Implications for the study of nitrate in snow and ice cores, J. Geophys. Res., 109, D20306, https://doi.org/10.1029/2004JD004991, 2004.
Hastings, M. G., Jarvis, J. C., and Steig, E. J.: Anthropogenic impacts on nitrogen isotopes of ice-core nitrate, Science, 324, 1288–1288, https://doi.org/10.1126/science.1170510, 2009.
Holland, P. R., Bruneau, N., Enright, C., Losch, M., Kurtz, N. T., and Kwok, R.: Modeled Trends in Antarctic Sea Ice Thickness, J. Climate, 27, 3784–3801, https://doi.org/10.1175/JCLI-D-13-00301.1, 2014.
Hou, S., Li, Y., Xiao, C., and Ren, J.: Recent accumulation rate at Dome A, Antarctica, Chin. Sci. Bull., 52, 428–431, 2007.
Huey, L. G., Tanner, D. J., Slusher, D. L., Dibb, J. E., Arimoto, R., Chen, G., Davis, D., Buhr, M. P., Nowak, J. B., Mauldin Iii, R. L., Eisele, F. L., and Kosciuch, E.: CIMS measurements of HNO3 and SO2 at the South Pole during ISCAT 2000, Atmos. Environ., 38, 5411–5421, https://doi.org/10.1016/j.atmosenv.2004.04.037, 2004.
Jones, A. E., Weller, R., Minikin, A., Wolff, E. W., Sturges, W. T., Mcintyre, H. P., Leonard, S. R., Schrems, O., and Bauguitte, S.: Oxidized nitrogen chemistry and speciation in the Antarctic troposphere, J. Geophys. Res., 1042, 21355–21366, 1999.
Jones, A. E., Wolff, E. W., Ames, D., Bauguitte, S. J.-B., Clemitshaw, K. C., Fleming, Z., Mills, G. P., Saiz-Lopez, A., Salmon, R. A., Sturges, W. T., and Worton, D. R.: The multi-seasonal NOy budget in coastal Antarctica and its link with surface snow and ice core nitrate: results from the CHABLIS campaign, Atmos. Chem. Phys., 11, 9271–9285, https://doi.org/10.5194/acp-11-9271-2011, 2011.
Jourdain, B., and Legrand, M.: Year-round records of bulk and size-segregated aerosol composition and HCl and HNO3 levels in the Dumont d'Urville (coastal Antarctica) atmosphere: Implications for sea-salt aerosol fractionation in the winter and summer, J. Geophys. Res., 107, ACH20-21–ACH20-13, https://doi.org/10.1029/2002JD002471, 2002.
Kasper-Giebl, A., Kalina, M. F., and Puxbaum, H.: Scavenging ratios for sulfate, ammonium and nitrate determined at Mt. Sonnblick (3106 m a.s.l.), Atmos. Environ., 33, 895–906, 1999.
Laluraj, C., Thamban, M., Naik, S., Redkar, B., Chaturvedi, A., and Ravindra, R.: Nitrate records of a shallow ice core from East Antarctica: Atmospheric processes, preservation and climatic implications, The Holocene, 21, 351–356, https://doi.org/10.1177/0959683610374886, 2010.
Lee, H.-M., Henze, D. K., Alexander, B., and Murray, L. T.: Investigating the sensitivity of surface-level nitrate seasonality in Antarctica to primary sources using a global model, Atmos. Environ., 89, 757–767, https://doi.org/10.1016/j.atmosenv.2014.03.003, 2014.
Legrand, M.: Chemistry of Antarctic snow and ice, Le Journal De Physique Colloques, 48, C1-77–C71-86, 1987.
Legrand, M. and Kirchner, S.: Origins and variations of nitrate in South Polar precipitation, J. Geophys. Res., 95, 3493–3507 1990.
Legrand, M. and Mayewski, P. A.: Glaciochemistry of polar ice cores: a review, Rev. Geophys., 35, 219–243, 1997.
Legrand, M., Wolff, E., and Wagenbach, D.: Antarctic aerosol and snowfall chemistry: implications for deep Antarctic ice-core chemistry, Ann. Glaciol., 29, 66–72, 1999.
Legrand, M., Preunkert, S., Weller, R., Zipf, L., Elsässer, C., Merchel, S., Rugel, G., and Wagenbach, D.: Year-round record of bulk and size-segregated aerosol composition in central Antarctica (Concordia site) – Part 2: Biogenic sulfur (sulfate and methanesulfonate) aerosol, Atmos. Chem. Phys., 17, 14055–14073, https://doi.org/10.5194/acp-17-14055-2017, 2017a.
Legrand, M., Preunkert, S., Wolff, E., Weller, R., Jourdain, B., and Wagenbach, D.: Year-round records of bulk and size-segregated aerosol composition in central Antarctica (Concordia site) – Part 1: Fractionation of sea-salt particles, Atmos. Chem. Phys., 17, 14039–14054, https://doi.org/10.5194/acp-17-14039-2017, 2017b.
Legrand, M. R., Stordal, F., Isaksen, I. S. A., and Rognerud, B.: A model study of the stratospheric budget of odd nitrogen, including effects of solar cycle variations, Tellus B, 41B, 413–426, https://doi.org/10.1111/j.1600-0889.1989.tb00318.x, 1989.
Li, C., Ren, J., Qin, D., Xiao, C., Hou, S., Li, Y., and Ding, M.: Factors controlling the nitrate in the DT-401 ice core in eastern Antarctica, Sci. China Ser. D, 56, 1531–1539, https://doi.org/10.1007/s11430-012-4557-2, 2013.
Li, Y., Cole-Dai, J., and Zhou, L.: Glaciochemical evidence in an East Antarctica ice core of a recent (AD 1450-1850) neoglacial episode, J. Geophys. Res., 114, D08117, https://doi.org/10.1029/2008JD011091, 2009.
Li, Z., Zhang, M., Qin, D., Xiao, C., Tian, L., Kang, J., and Li, J.: The seasonal variations of δ18O, Cl−, Na+, NO and Ca2+ in the snow and firn recovered from Princess Elizabeth Land, Antarctica, Chin. Sci. Bull., 44, 2270–2273, 1999.
Liss, P. S., Chuck, A. L., Turner, S. M., and Watson, A. J.: Air-sea gas exchange in Antarctic waters, Antarct. Sci., 16, 517–529, https://doi.org/10.1017/S0954102004002299, 2004.
Ma, Y., Bian, L., Xiao, C., Allison, I., and Zhou, X.: Near surface climate of the traverse route from Zhongshan Station to Dome A, East Antarctica, Antarct. Sci., 22, 443–459, https://doi.org/10.1017/S0954102010000209, 2010.
Marion, G., Farren, R., and Komrowski, A.: Alternative pathways for seawater freezing, Cold Reg. Sci. Technol., 29, 259–266, 1999.
Mayewski, P. A. and Legrand, M. R.: Recent increase in nitrate concentration of Antarctic snow, Nature, 346, 258–260, 1990.
McCabe, J. R., Thiemens, M. H., and Savarino, J.: A record of ozone variability in South Pole Antarctic snow: Role of nitrate oxygen isotopes, J. Geophys. Res., 112, D12303, https://doi.org/10.1029/2006JD007822, 2007.
Mulvaney, R. and Wolff, E.: Evidence for winter/spring denitrification of the stratosphere in the nitrate record of Antarctic firn cores, J. Geophys. Res., 98, 5213–5220, 1993.
Mulvaney, R. and Wolff, E.: Spatial variability of the major chemistry of the Antarctic ice sheet, Ann. Glaciol., 20, 440–447, 1994.
Mulvaney, R., Wagenbach, D., and Wolff, E. W.: Postdepositional change in snowpack nitrate from observation of year-round near-surface snow in coastal Antarctica, J. Geophys. Res., 103, 11021–11031, 1998.
Parish, T. R. and Bromwich, D. H.: Reexamination of the near-surface airflow over the Antarctic continent and implications on atmospheric circulations at high southern latitudes, Mon. Weather. Rev., 135, 1961–1973, https://doi.org/10.1175/MWR3374.1, 2007.
Pasteris, D., McConnell, J. R., Edwards, R., Isaksson, E., and Albert, M. R.: Acidity decline in Antarctic ice cores during the Little Ice Age linked to changes in atmospheric nitrate and sea salt concentrations, J. Geophys. Res., 119, 5640–5652, https://doi.org/10.1002/2013JD020377, 2014.
Piel, C., Weller, R., Huke, M., and Wagenbach, D.: Atmospheric methane sulfonate and non-sea-salt sulfate records at the European Project for Ice Coring in Antarctica (EPICA) deep-drilling site in Dronning Maud Land, Antarctica, J. Geophys. Res., 111, D03304, https://doi.org/10.1029/2005JD006213, 2006.
Qin, D., Zeller, E. J., and Dreschhoff, G. A.: The distribution of nitrate content in the surface snow of the Antarctic Ice Sheet along the route of the 1990 International Trans-Antarctica Expedition, J. Geophys. Res., 97, 6277–6284, 1992.
Röthlisberger, R., Hutterli, M. A., Sommer, S., Wolff, E. W., and Mulvaney, R.: Factors controlling nitrate in ice cores: Evidence from the Dome C deep ice core, J. Geophys. Res., 105, 20565–20572, 2000.
Röthlisberger, R., Hutterli, M. A., Wolff, E. W., Mulvaney, R., Fischer, H., Bigler, M., Goto-Azuma, K., Hansson, M. E., Ruth, U., and Siggaard-Andersen, M.-L.: Nitrate in Greenland and Antarctic ice cores: A detailed description of post-depositional processes, Ann. Glaciol., 35, 209–216, 2002.
Röthlisberger, R., Mulvaney, R., Wolff, E. W., Hutterli, M. A., Bigler, M., De Angelis, M., Hansson, M. E., Steffensen, J. P., and Udisti, R.: Limited dechlorination of sea-salt aerosols during the last glacial period: Evidence from the European Project for Ice Coring in Antarctica (EPICA) Dome C ice core, J. Geophys. Res., 108, 4526, https://doi.org/10.1029/2003JD003604, 2003.
Rankin, A. M. and Wolff, E. W.: A year-long record of size-segregated aerosol composition at Halley, Antarctica, J. Geophys. Res., 108, 4775, https://doi.org/10.1029/2003JD003993, 2003.
Rankin, A. M., Wolff, E. W., and Martin, S.: Frost flowers: Implications for tropospheric chemistry and ice core interpretation, J. Geophys. Res., 107, 4683, https://doi.org/10.1029/2002JD002492, 2002.
Russell, A., Mcgregor, G. R., and Marshall, G. J.: An examination of the precipitation delivery mechanisms for Dolleman Island, eastern Antarctic Peninsula, Tellus A, 56, 501–513, 2004.
Russell, A., McGregor, G., and Marshall, G.: 340 years of atmospheric circulation characteristics reconstructed from an eastern Antarctic Peninsula ice core, Geophys. Res. Lett., 33, L08702, https://doi.org/10.1029/2006GL025899, 2006.
Savarino, J., Kaiser, J., Morin, S., Sigman, D. M., and Thiemens, M. H.: Nitrogen and oxygen isotopic constraints on the origin of atmospheric nitrate in coastal Antarctica, Atmos. Chem. Phys., 7, 1925–1945, https://doi.org/10.5194/acp-7-1925-2007, 2007.
Seinfeld, J. H. and Pandis, S. N.: Atmospheric Chemistry and Physics: From Air Pollution to Climate Change, 2nd ed. Wiley, New York, 1997.
Shi, G.: Data set to: Nitrate concentrations in surface snow and snowpit on the traverse from coast (Zhongshan Station) to Dome A, Data-sharing Platform of Polar Science, Chinese Antarctic and Arctic Data Centre-CHINARE, https://doi.org/10.11856/SNS.D.2018.001.v0, 2018.
Shi, G., Li, Y., Jiang, S., An, C., Ma, H., Sun, B., and Wang, Y.: Large-scale spatial variability of major ions in the atmospheric wet deposition along the China Antarctica transect (31∘ N∼ 69∘ S), Tellus B, 64, 17134, https://doi.org/10.3402/tellusb.v64i0.17134, 2012.
Shi, G., Buffen, A. M., Hastings, M. G., Li, C., Ma, H., Li, Y., Sun, B., An, C., and Jiang, S.: Investigation of post-depositional processing of nitrate in East Antarctic snow: isotopic constraints on photolytic loss, re-oxidation, and source inputs, Atmos. Chem. Phys., 15, 9435–9453, https://doi.org/10.5194/acp-15-9435-2015, 2015.
Shrestha, A., Wake, C., Dibb, J., and Whitlow, S.: Aerosol and Precipitation Chemistry at a Remote Himalayan Site in Nepal, Aerosol Sci. Technol., 36, 441–456, 2002.
Sigl, M., Fudge, T. J., Winstrup, M., Cole-Dai, J., Ferris, D., McConnell, J. R., Taylor, K. C., Welten, K. C., Woodruff, T. E., Adolphi, F., Bisiaux, M., Brook, E. J., Buizert, C., Caffee, M. W., Dunbar, N. W., Edwards, R., Geng, L., Iverson, N., Koffman, B., Layman, L., Maselli, O. J., McGwire, K., Muscheler, R., Nishiizumi, K., Pasteris, D. R., Rhodes, R. H., and Sowers, T. A.: The WAIS Divide deep ice core WD2014 chronology – Part 2: Annual-layer counting (0–31 ka BP), Clim. Past, 12, 769–786, https://doi.org/10.5194/cp-12-769-2016, 2016.
Smart, D. F., Shea, M. A., Melott, A. L., and Laird, C. M.: Low time resolution analysis of polar ice cores cannot detect impulsive nitrate events, J. Geophys. Res.-Space Phys., 119, 9430–9440, https://doi.org/10.1002/2014JA020378, 2014.
Traversi, R., Becagli, S., Castellano, E., Cerri, O., Morganti, A., Severi, M., and Udisti, R.: Study of Dome C site (East Antartica) variability by comparing chemical stratigraphies, Microchem. J., 92, 7–14, https://doi.org/10.1016/j.microc.2008.08.007, 2009.
Traversi, R., Usoskin, I., Solanki, S., Becagli, S., Frezzotti, M., Severi, M., Stenni, B., and Udisti, R.: Nitrate in Polar Ice: A New Tracer of Solar Variability, Sol. Phys., 280, 237–254, 2012.
Traversi, R., Udisti, R., Frosini, D., Becagli, S., Ciardini, V., Funke, B., Lanconelli, C., Petkov, B., Scarchilli, C., and Severi, M.: Insights on nitrate sources at Dome C (East Antarctic Plateau) from multi-year aerosol and snow records, Tellus B, 66, 22550, https://doi.org/10.3402/tellusb.v66.22550, 2014.
Traversi, R., Becagli, S., Brogioni, M., Caiazzo, L., Ciardini, V., Giardi, F., Legrand, M., Macelloni, G., Petkov, B., Preunkert, S., Scarchilli, C., Severi, M., Vitale, V., and Udisti, R.: Multi-year record of atmospheric and snow surface nitrate in the central Antarctic plateau, Chemosphere, 172, 341–354, https://doi.org/10.1016/j.chemosphere.2016.12.143, 2017.
Udisti, R., Becagli, S., Benassai, S., Castellano, E., Fattori, I., Innocenti, M., Migliori, A., and Traversi, R.: Atmosphere-snow interaction by a comparison between aerosol and uppermost snow-layers composition at Dome C, East Antarctica, Ann. Glaciol., 39, 53–61, 2004.
Wagenbach, D., Graf, V., Minikin, A., Trefzer, U., Kipfstuhl, J., Oerter, H., and Blindow, N.: Reconnaissance of chemical and isotopic firn properties on top of Berkner Island, Antarctica, Ann. Glaciol., 20, 307–312, 1994.
Wagenbach, D., Ducroz, F., Mulvaney, R., Keck, L., Minikin, A., Legrand, M., Hall, J. S., and Wolff, E. W.: Sea-salt aerosol in coastal Antarctic regions, J. Geophys. Res., 103, 10961–10974, 1998a.
Wagenbach, D., Legrand, M., Fischer, H., Pichlmayer, F., and Wolff, E. W.: Atmospheric near-surface nitrate at coastal Antarctic sites, J. Geophys. Res., 103, 11007–11020, 1998b.
Warren, S. G., Brandt, R. E., and Grenfell, T. C.: Visible and near-ultraviolet absorption spectrum of ice from transmission of solar radiation into snow, Appl. Optics, 45, 5320–5334, 2006.
Weller, R. and Wagenbach, D.: Year-round chemical aerosol records in continental Antarctica obtained by automatic samplings, Tellus B, 59, 755–765, https://doi.org/10.1111/j.1600-0889.2007.00293.x, 2007.
Weller, R., Traufetter, F., Fischer, H., Oerter, H., Piel, C., and Miller, H.: Postdepositional losses of methane sulfonate, nitrate, and chloride at the European Project for Ice Coring in Antarctica deep-drilling site in Dronning Maud Land, Antarctica, J. Geophys. Res., 109, 1–9, https://doi.org/10.1029/2003JD004189, 2004.
Witherow, R. A., Lyons, W. B., Bertler, N. A., Welch, K. A., Mayewski, P. A., Sneed, S. B., Nylen, T., Handley, M. J., and Fountain, A.: The aeolian flux of calcium, chloride and nitrate to the McMurdo Dry Valleys landscape: evidence from snow pit analysis, Antarct. Sci., 18, 497–505, https://doi.org/10.1017/S095410200600054X, 2006.
Wolff, E. W.: Nitrate in polar ice, in: Ice core studies of global biogeochemical cycles, edited by: Delmas, R. J., Springer, New York, 195–224, 1995.
Wolff, E. W., Jones, A. E., Bauguitte, S. J.-B., and Salmon, R. A.: The interpretation of spikes and trends in concentration of nitrate in polar ice cores, based on evidence from snow and atmospheric measurements, Atmos. Chem. Phys., 8, 5627–5634, https://doi.org/10.5194/acp-8-5627-2008, 2008.
Wolff, E. W., Barbante, S., Becagle, S., Bigler, M., Boutron, C. F., Castellano, E., de Angelis, M., and Federer, U.: Changes in environment over the last 800,000 years from chemical analysis of the EPICA Dome C ice core, Quaternary Sci. Rev., 29, 285–295, 2010.
Wolff, E. W., Bigler, M., Curran, M., Dibb, J., Frey, M., Legrand, M., and McConnell, J.: The Carrington event not observed in most ice core nitrate records, Geophys. Res. Lett., 39, L08503, https://doi.org/10.1029/2012GL051603, 2012.
Wolff, E. W., Bigler, M., Curran, M. A. J., Dibb, J. E., Frey, M. M., Legrand, M., and Mcconnell, J. R.: Comment on “Low time resolution analysis of polar ice cores cannot detect impulsive nitrate events” by D.F. Smart et al., J. Geophys. Res., 121, 1920–1924, https://doi.org/10.1002/2015JA021570, 2016.
Xiao, C., Mayewski, P. A., Qin, D., Li, Z., Zhang, M., and Yan, Y.: Sea level pressure variability over the southern Indian Ocean inferred from a glaciochemical record in Princess Elizabeth Land, east Antarctica, J. Geophys. Res., 109, D16101, https://doi.org/10.1029/2003JD004065, 2004.
Zatko, M. C., Grenfell, T. C., Alexander, B., Doherty, S. J., Thomas, J. L., and Yang, X.: The influence of snow grain size and impurities on the vertical profiles of actinic flux and associated NOx emissions on the Antarctic and Greenland ice sheets, Atmos. Chem. Phys., 13, 3547–3567, https://doi.org/10.5194/acp-13-3547-2013, 2013.
Zatko, M., Geng, L., Alexander, B., Sofen, E., and Klein, K.: The impact of snow nitrate photolysis on boundary layer chemistry and the recycling and redistribution of reactive nitrogen across Antarctica and Greenland in a global chemical transport model, Atmos. Chem. Phys., 16, 2819–2842, https://doi.org/10.5194/acp-16-2819-2016, 2016.
Zeller, E. J., Dreschhoff, G. A., and Laird, C. M.: Nitrate flux on the Ross Ice Shelf, Antarctica and its relation to solar cosmic rays, Geophys. Res. Lett., 13, 1264–1267, 1986.