the Creative Commons Attribution 4.0 License.
the Creative Commons Attribution 4.0 License.
 | 26 Jan 2026
Single particle ICP-TOFMS on previously characterised EGRIP ice core samples: new approaches, limitations, and challenges
Nicolas Stoll
David Clases
Raquel Gonzalez de Vega
Matthias Elinkmann
Piers Larkman
Pascal Bohleber
Polar ice contains chemical impurities, which can be used as a proxy for the past climate, using state-of-the-art chemical methods. Despite its capability to access critical physicochemical parameters of insoluble particles, such as number concentration, mass and size distribution, and elemental composition, single particle inductively coupled plasma-time of flight mass spectrometry (SP ICP-TOFMS) has yet to be fully utilised to study polar ice. We demonstrate the largely qualitative SP ICP-TOFMS analysis of eight EGRIP ice core samples, which were previously characterised with Raman spectroscopy and laser ablation inductively coupled plasma-mass spectrometry. This resulted in three major developments. First, by analysing samples from different climate periods over the last 50 ka, we extend available ice core SP data to the Younger Dryas and the Last Glacial, and provide an overview of largely unexplored particulate elements in deep polar ice. Second, we develop an approach for handling discrete samples with highly variable particle concentrations, complementing time-intensive continuous analyses despite certain limitations. Third, we suggest adapting an approach for estimating particle sizes based on mineralogical data from previously conducted Raman spectroscopy analyses. This particle size analysis complements established particle sizing and counting techniques by covering the mostly unexplored nanometre range while providing additional chemical information. Overall, we outline the advantages and disadvantages of conducting SP ICP-TOFMS as the final step in a cascade of complementary techniques applied to the same samples. Given the ongoing endeavour to retrieve and analyse precious “Oldest Ice”, utilising SP ICP-TOFMS, even in a more qualitative way, may become critical for accessing vital information and new depths of insight.
- Article
(3943 KB) - Full-text XML
- BibTeX
- EndNote


Chemical impurities in polar ice cores deliver essential information about the climate of the past, dust sources, and atmospheric transport paths (e.g. Legrand and Mayewski, 1997; Lambert et al., 2008; Újvári et al., 2022). They are further influential components within the ice microstructure impacting, among other factors, the deformation of ice (e.g. Paterson, 1991; Stoll et al., 2021b). Different techniques are applicable to measure ice core samples depending on the focus of the investigation. Bulk impurity concentrations are usually measured with continuous flow analysis (CFA) via melting and measuring the uncontaminated inner parts of an ice sample (e.g. Röthlisberger et al., 2000; Kaufmann et al., 2008). Non- or micro-destructive methods on discrete samples are, for example, cryo-Raman spectroscopy (e.g. Fukazawa et al., 1997; Ohno et al., 2005; Stoll et al., 2022), scanning electron microscopy (SEM) (e.g. Barnes et al., 2002), and laser ablation-inductively coupled plasma-mass spectrometry (LA-ICP-MS), which can investigate the distribution of impurities in one or two dimensions (e.g. Della Lunga et al., 2017; Bohleber et al., 2020). Recent studies on the East Greenland Ice-core Project (EGRIP) ice core, coupling different optical and chemical methods, such as confocal cryo-Raman spectroscopy and LA-ICP-MS 2D Imaging, shone new light on the microstructural localisation of insoluble and soluble impurities by systematically analysing the same samples (Stoll et al., 2021a, 2022, 2023b; Bohleber et al., 2023). These efforts lead to progress in the generalisation of localisation trends (Stoll et al., 2023a) and the development of homogenous LA-ICP-MS ice standards enabling the intensity output to be calibrated to concentrations and thus, a better comparison between future CFA and LA-ICP-MS measurements (Bohleber et al., 2024). Glaciological instrumentation, methodology, and measurement-based modelling approaches (e.g. Larkman et al., 2025) rapidly advance, but it still takes years or decades to implement state-of-the-art chemistry techniques into routine settings for ice core research.
Over the last two decades, the so called “single particle (SP) mode” of ICP-MS has gained momentum in the fields of elemental mass spectrometry (e.g. Bolea et al., 2021; Laborda et al., 2023) due to high counting rates and the ability to determine natural abundances of particles in complex environmental matrices. In this mode, mainly inorganic particles with dimensions at the nano- and lower microscale are introduced individually into a plasma and are atomised and ionised to form secluded clouds of elemental cations. Following extraction and by using rapid mass analysers and detectors, each ion cloud can be detected with several data points, and spatially resolved “particle events” are registered at the detector. Here, the frequency and intensity of events can be calibrated into particle number concentrations and the elemental mass per particle, if suitable standards are analysed concurrently. A particle standard containing a particle with known composition, size, and density (or alternatively with a known number concentration) is analysed to determine the transport efficiency, i.e. the fraction of particles transported into the plasma following nebulisation. Further, an ionic standard (and a blank for background subtraction) containing the target elements at a known concentration is analysed to determine elemental responses, and to calibrate raw intensities into masses. The dissolved forms of an analysed element are derived from the background signal (baseline) due to its homogeneous distribution in the aerosol droplets.
Time of flight (TOF)-based analysers provide a (quasi-) simultaneous detection mechanism enabling the analysis of virtually all elements and their isotopes of the periodic table contained in single particles. When operated in SP mode, TOF-based analysis is ideal for counting and characterising particulates and is applied across medical to materials science (see examples in e.g. Clases and Gonzalez de Vega, 2022). Although quadrupole-based methods are generally more sensitive for individual isotopes, SP ICP-TOFMS provides post-processing options and specific hardware features for successful trace element (Lockwood et al., 2024) and cluster analysis (Lockwood et al., 2025). SP ICP-TOFMS also facilitates non-target particle screening, which means that particulate elements can be screened for without a priori knowledge (Gonzalez de Vega et al., 2023). The analysis of particles in natural systems requires certain assumptions to establish suitable bottom-up models on various particulate parameters, including size and mass distributions, particle number concentrations, and internal and external mixing states. The internal and external mixing of particles describe the chemical constitution within a single particle and the populations of particles containing particles of different constitutions, respectively (e.g. Li et al., 2016; Stevens and Dastoor, 2019). Therefore, it is possible to derive the elemental composition of individual particles, which is useful for inferring mineralogy and origin analysis.
Besides elemental composition, it is also crucial to assess the size of dust particles. For example, accurate particle size data is vital in modelling global climate change due to the radiative effect of mineral aerosols in the atmosphere and their impact on other aspects of the climate system, such as biogeochemistry and cloud nucleation (e.g. Tegen and Lacis, 1996; Mahowald et al., 2014; Adebiyi and Kok, 2020). Especially the sub-micrometre range is of interest, covering aerosols with the longest atmospheric residence times and transport distances. Furthermore, dust might play a vital role in reconstructing the age of million-year-old ice by comparing the ice core dust flux with dust proxies from marine sediment cores (Martínez-Garcia et al., 2011; Wolff et al., 2022). However, access to the nanometre-realm is usually limited with established methods such as Coulter Counter (usually 0.6–10 µm) and laser particle detectors (usually 0.9–15 µm) (Vallelonga and Svensson, 2014). Recent progress in the single-particle extinction and scattering (SPES, usually 0.2–2 µm) method is promising (Zeppenfeld et al., 2025), but does not cover ultrafine particles, provides no composition data, and has to be run in tandem with CFA to obtain chemical data. Raman spectroscopy is usually limited to micrometre-sized inclusions, as they must be optically resolvable with a microscope. LA-ICP-MS is usually applied with a laser spot size of 10–40 µm, even though it can measure with spot sizes of 1 µm, but remains a niche setting at the current state (Bohleber et al., 2025).
Addressing the knowledge gap around nanoparticles in ice core samples can be tackled by recent progress in SP ICP-TOFMS. SP data can be used to estimate particle size (as small as 20–50 nm) if the particle mineralogy (and therefore elemental mass fractions and phase density) is known (Pace et al., 2011; Lockwood et al., 2021, 2025). Thus, SP ICP-TOFMS can derive critical properties of thousands of insoluble, nano-scaled particles per minute – a potential that remains largely unexplored.
To our knowledge, SP ICP-TOFMS has been applied to ice cores in only three peer-reviewed studies to date. Modern-era ice from the Disko Island ice cap (DS14) and an inland site on the Greenland ice sheet (GW14) were analysed by Osman et al. (2017). Erhardt et al. (2019) mainly described the extension of the Bern CFA system by investigating a continuous section of late Holocene ice from the EGRIP ice core, the first deep ice core drilled through an ice stream (Stoll et al., 2025a). Both studies focused primarily on the analytical challenges and advantages of the technique and a few major elements (e.g. Fe, Mg, Al) or particle classes for source region identification. Recently, Bohleber et al. (2024) used SP ICP-TOFMS data for additional reference values to compare the soluble and particulate fractions within calibration standards for LA-ICP-MS. Even though additional work on the Dome C ice core is underway (Lee et al., 2024), SP ICP-TOFMS ice core data remain sparse despite the advantages mentioned above. Here, we apply state-of-the-art SP ICP-TOFMS to eight EGRIP samples previously characterised with Raman spectroscopy and LA-ICP-MS. Alone, SP ICP-TOFMS may only determine the mass of elements within a particle and any information on particle species, size, and shape is lost upon the atomisation step. However, based on micro-Raman analysis and the compositional data of single particles, some mineral phases may be inferred (e.g. Tharaud et al., 2022; Goodman et al., 2022). Further, only melted ice can be analysed and soluble particle fractions or agglomerates may thus not be conserved. Thus, benefits of applying these methods to the same samples are, among others, a more holistic characterisation of impurities in the ice, and conserving samples, exemplarily shown by the BELDC core, which currently has no archive piece at crucial depths. Our objective is to extend the strongly limited available SP data to (1) the Younger Dryas and the Last Glacial, and (2) samples with highly varying insoluble particle concentration, applying a semi-qualitative approach. We build on the Raman spectroscopy-derived mineralogy from Stoll et al. (2022, 2023b) to estimate particle sizes based on established algorithms (Pace et al., 2011; Lockwood et al., 2021, 2025). The here presented multi-method and maximum-output strategy, not possible with most other sample types due to unavoidable melting, offers a valuable approach for analysing precious ice samples, such as these from the ongoing “Oldest Ice” quest (Fischer et al., 2013).
2.1 Samples
We used eight samples from the EGRIP ice core, which we previously analysed regarding their microstructure (microstructure mapping), and insoluble, micrometre-sized (confocal cryo-Raman spectroscopy) and general (LA-ICP-MS 2D imaging) impurity localisation (Stoll et al., 2021a, 2022, 2023b; Bohleber et al., 2023). Our samples deliberately represent dust-rich sections with high concentrations of respective elements. Samples were initially microtomed and decontaminated with ceramic knives several times and repeatedly checked for micro-cracks. The previously conducted analyses did not display any indications of contamination. The samples originate from the innermost section of the EGRIP “physical properties” section, which borders the CFA section, and were thus never exposed to drill liquid. Analysing samples from the inner part of the core, such as the CFA piece, would be preferable; however, they are melted during CFA analysis and thus unavailable for studies involving different analyses of the same sample.
The shallowest two samples were labelled as S1 and S10 in Stoll et al. (2022), and deeper ones were S1, S2, S7, S8, S11, and S13 in Stoll et al. (2023b). We re-labelled them according to their climate period plus a chronological number increasing with depth/age. The youngest sample is from the Holocene and thus H1, while the deepest is from the last glacial and thus G8 (Table 1). Details on depth, age, and minerals of interest as previously identified via Raman spectroscopy are also displayed in Table 1. Insoluble particle concentration data are only available for the shallowest two samples (H1, YD2) (Stoll et al., 2021a), which showed very low and very high concentrations for H1 and YD2, respectively. The latter sample originates from the Younger Dryas (GS-1), thus having a very high insoluble particle concentration, further explored in a detailed LA-ICP-MS investigation focusing on clusters of Fe and Al interpreted as insoluble particles (Bohleber et al., 2023). For samples G3–G8, only visual stratigraphy data are available as insoluble particle proxy (Stoll et al., 2023b). These data show no features (G3), weak cloudy bands (G3 and G7), i.e. layers of high insoluble particle content, intermediate cloudy bands (G4 and G5), and strongly defined cloudy bands (YD2 and G6). Except for the mentioned studies, no chemical data from these sections is published.
Table 1Analysed EGRIP samples and respective properties. Further information on the first two samples can be found in Stoll et al. (2022) and the remaining six in Stoll et al. (2023b). YD2 was investigated in detail by Bohleber et al. (2023).
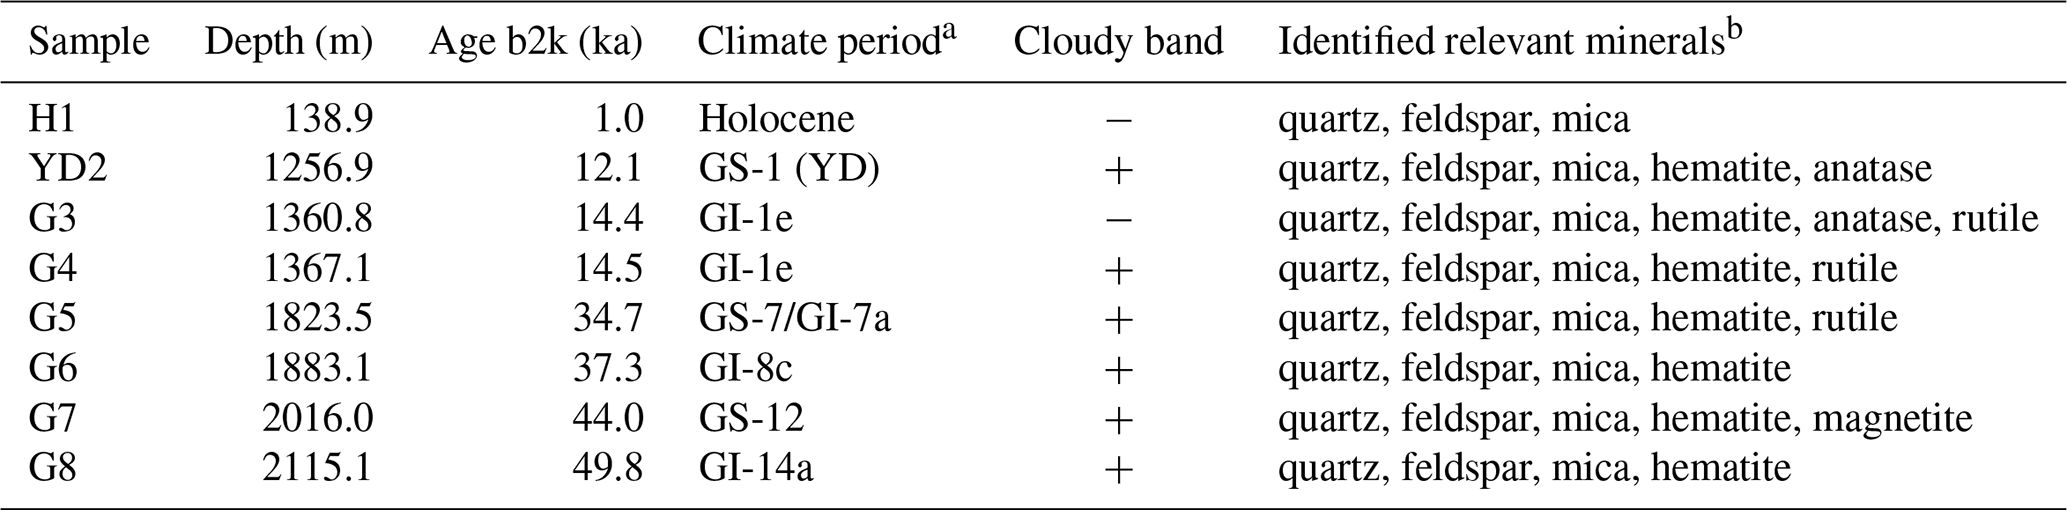
b2k: before 2000 CE after Stoll et al. (2025a), GS: Glacial stadial, GI: Glacial interstadial, YD: Younger Dryas, a after Rasmussen et al. (2013), b identified by Stoll et al. (2022) and Stoll et al. (2023b) and chosen for particle size estimates; does not represent all characterised minerals in these samples.
2.2 Sample preparation
Analysis was carried out over three sessions at the NanoMicroLAB at the Institute of Chemistry, University of Graz, Austria. All samples were transported from Venice, Italy, to Graz, Austria, in cooled polystyrene boxes, and no melting was observed. The workflow is schematically displayed in Fig. 1. Given the previous measurements and the specific approach of this study, we adapted a decontamination protocol from Delmonte et al. (2004) for our solid samples (∼ 1 cm3). For future studies beyond the scope of the pilot study described here, we suggest using larger samples to enable the application of an extended decontamination protocol, as handling small samples can be challenging. However, we aim here for a mainly qualitative comparison of ice core samples from different climate periods that have not yet been investigated. The samples were rinsed several times from all sides with Milli-Q ultra-pure water (MQ) under a fume hood, removing at least 50 % of the sample volume. The decontaminated samples were stored briefly in fresh vials at room temperature and analysed directly after melting. Residual MQ water can remain on the decontaminated sample, potentially diluting the sample. However, this is uncritical for this study as we mainly focus on volume-independent parameters, only a fraction of the liquid sample is analysed, mixing always occurs, as in CFA, when the original ice sample melts, and we aim for a qualitative approach of analysing different EGRIP samples from the last 50 ka for the first time with SP ICP-TOFMS. Ultra-pure water blanks were handled the same; blank levels were checked regularly to confirm the absence of contamination.
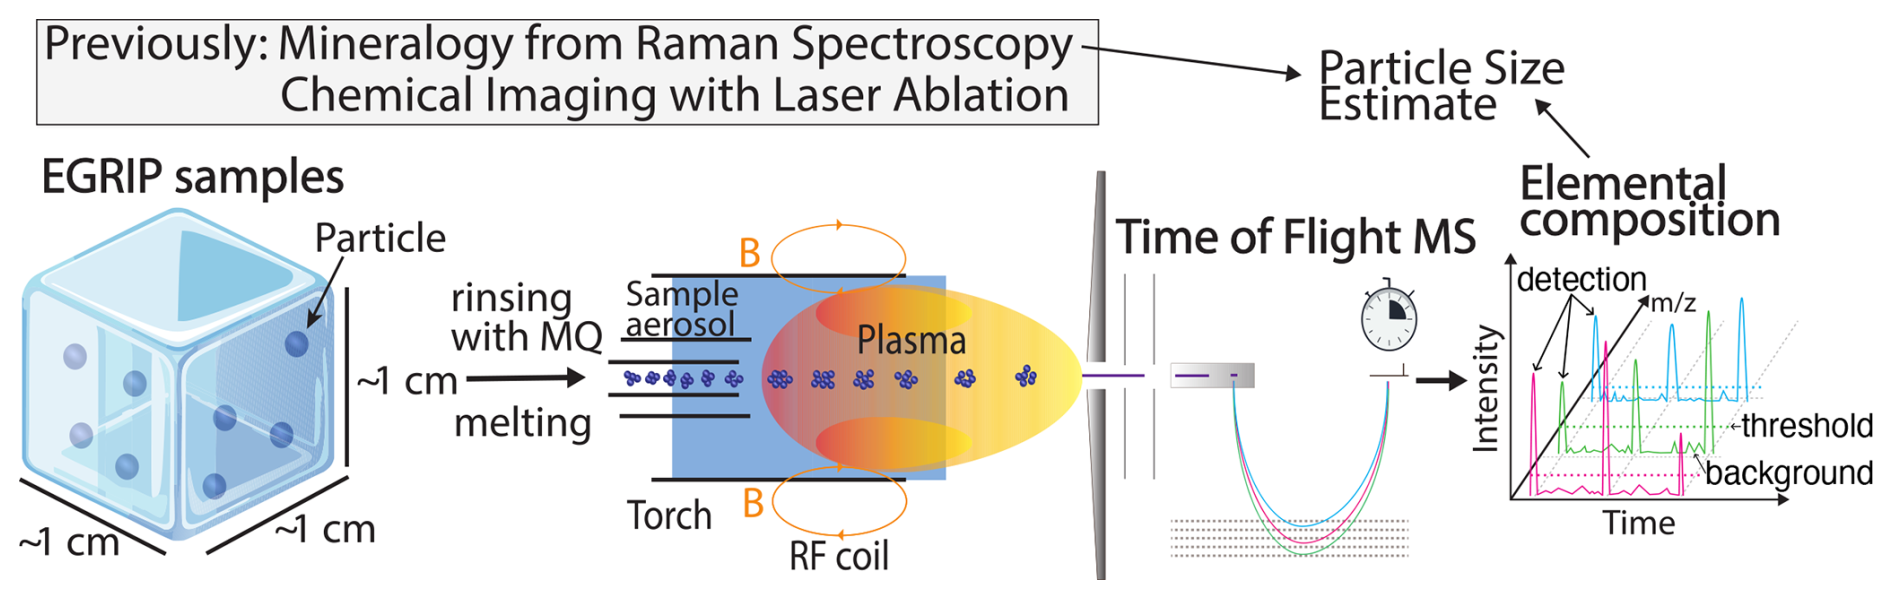
Figure 1Schematic overview of the workflow and set-up of SP ICP-TOFMS. Ice core samples are decontaminated with MQ water and melted. The sample aerosol is introduced via liquid nebulisation into the ICP for ionisation. Time of Flight measurements resolve the elemental composition of particles (not to scale) previously contained in the ice. Detection, threshold, and background are visualised. Mineralogy data from Raman spectroscopy enable the estimate of particle sizes. : mass-to-charge ratio, B: magnetic field, RF: Radio Frequency, MS: Mass Spectrometer.
2.3 Single particle ICP-TOFMS measurements
A Vitesse ICP-TOFMS system by Nu Instruments (Wrexham, UK) was operated in SP mode to record and bin mass spectra from 20–240 amu, every 100 µs (4 spectra binning) before saving data to disc while blanking the range 31.5–38.5 amu due to a high signal from the oxygen dimer to avoid signal saturation at the detector. Each sample, blank (frozen ultra-pure MQ water let to melt), and calibration standards were recorded for 100 s. The ICP-TOFMS instrument was equipped with a concentric nebuliser (Glass Expansions) and a cooled cyclonic spray chamber (5 °C). The plasma was operated at 1.35 kW, and the segmented reaction cell was operated with He and H2 flow rates of 12 and 7 mL min−1, respectively. The typical nebuliser flow rate was approximately 1.2 L min−1. Data acquisition was performed using the Nu Codaq software (Nu Instruments). The uptake rate was 0.2 mL min−1 and samples were introduced manually with a peristaltic pump. Transport efficiency was about 5 % and determined daily by analysing Au Nanoparticles (nanoComposix, US) and ionic standards with a known mass and concentration, respectively, using an automated approach via the open-source SP data processing platform SPCal (Lockwood et al., 2021, 2025).
2.4 Ionic background and thresholds
Thresholds are statistically derived parameters for pinpointing particulate signals. For most , background intensities were < 10 cts and compound Poisson statistics were used to distinguish ionic background (“background” in Fig. 1) and noise from SP events with an α value of . This provides the threshold (“threshold” in Fig. 1) over which a detection event is considered a particle signal (“detection” in Fig. 1). In cases with a higher background, Gaussian statistics were more adequate and selected (Lockwood et al., 2025). We applied automatic thresholds for all analyses except particle size, where we used the highest relative thresholds as explained below. We refer to Lockwood et al. (2025) for an in-depth description of threshold selection.
Our samples showed large differences in insoluble particle content (e.g. Holocene vs. Younger Dryas ice) and, consequently, different ionic backgrounds and, thus, different detection limits. We thus focus on a qualitative comparison between the samples. To enable higher comparability regarding particle size estimates, the overall highest threshold of a certain element (bold values in Table A1) was applied to all other samples. While this prevents the detection of small particles and therefore underestimates number concentrations and overestimates size distributions, it allows to compare the occurrence and distribution of particles in a common size window.
2.5 Single particle data processing and analysis
To process the data, we applied SPCal version 1.2.7, designed to process and analyse SP data (Lockwood et al., 2021, 2025). The measured MQ was used to obtain a blank value, and the determined ionic background and particle numbers were subtracted for each analysed element. We focused on the most abundant isotopes of the most abundant elements, i.e. 27Al, 28Si, 48Ti, and 56Fe. Throughout this article, we indicate the isotope that was selected to determine total elemental mass. It shall therefore be emphasised that, for example, mass values reported for 56Fe reflect total Fe mass determined via the 56Fe isotope. For the analysis of 48Ti, 48Ca may potentially interfere. However, we have not detected particles containing both Ca and Ti, as evaluated by considering several Ca and Ti isotopes and monitoring their isotope ratios. Finally, we use a highly conservative approach and show only less common elements, such as 133Cs and 197Au, after detailed investigation of the raw data and elements with low detection numbers, i.e. those bordering the threshold, were discarded. Assessing data quality and elemental abundance remains challenging due to the lack of SP data from (deep) ice cores. Split event correction is not needed with the setup (Nu Instruments Vitesse) and software (SPCal) used, due to the high time resolution, the fast detector, and the built-in event reconstruction algorithm.
2.6 Particle signal losses and overlap
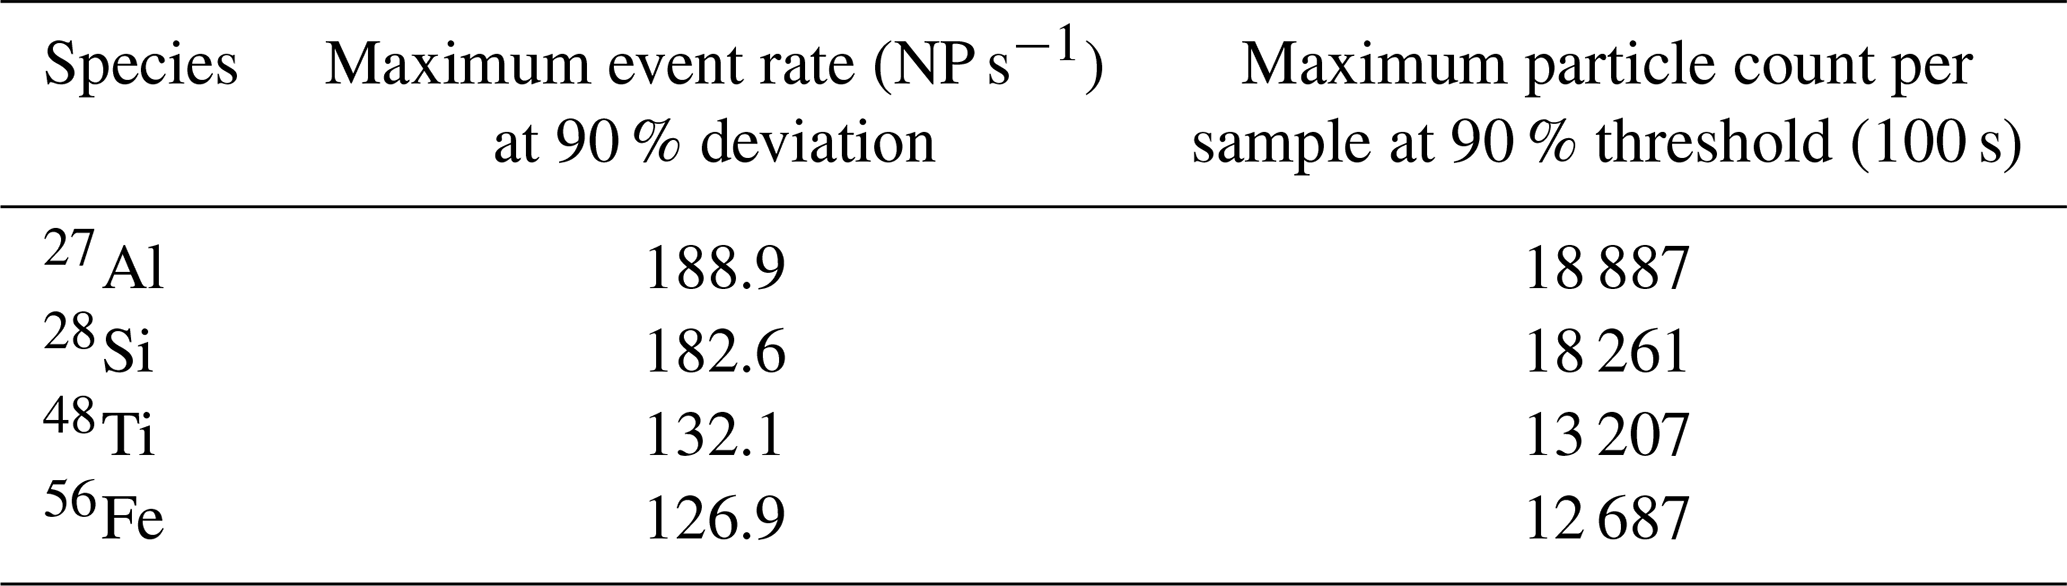
In this study, ice was melted and immediately analysed. Due to the small volume, it was not possible to test different dilutions to find the optimal SP ICP-TOFMS conditions. Following visual inspection, we found that particle detection numbers were high in some samples, which increased the probability for signal overlap, which can impact accuracy regarding number and size determinations. However, this allowed us to analyse particles in the native meltwater environment. To flag samples, in which particle signal overlap was significant (> 10 %), we used a post-analysis approach that was based on a Poisson model to estimate the loss of particle signals due to event overlap as suggested by Peyneau and Guillon (2021). We chose a sample with a low event rate (H1) to estimate the mean peak width at base for SP events of each element for all other samples. This approach was chosen as the best estimator for the peak width, as higher event count rates introduce a bias that overestimates peak widths (Peyneau, 2022). Importantly, these studies demonstrated that the distribution of event durations is irrelevant, as only the expected values (i.e. the average) are required, making the approach highly stable.
In the data, depending on the element, we observed a mean peak width at base from 206 to 632 µs, which agrees reasonably well with peak width values reported in the literature (e.g. Fuchs et al., 2018). Next, “true” particle event rates up to 4000 s−1 with spacings of 0.01 s−1 were calculated. For each entry, the observable particle count rate was calculated, considering losses from event overlap (Peyneau and Guillon, 2021) (Table 2). The highest tolerated count rate, i.e. the upper particle number concentration threshold, was defined in the following way: When the quotient of the observed count rate divided by the true count rate was lower than 90 %, this observed count rate was defined as the upper number concentration threshold. For samples with more particles than the respective threshold, the data can be assumed to be skewed towards (1) fewer particles, (2) apparently larger particles, and (3) apparently more mixed composition particles. We marked samples and particle species reaching this threshold, and it should be emphasised that reported values present a conservative measure underestimating number concentrations and overestimating sizes. This approach allowed us to maintain the most native sample conditions, refraining from altering the sample, e.g. by dilution via a carrier solution.
Table 2Thresholds for the maximum observable event rate (NP s−1) and the maximum observable absolute particle count per sample for the most abundant elements.
2.7 Particle size estimate
SP ICP-TOFMS is mass sensitive, and elemental masses within an SP can be determined accurately. Pace et al. (2011) presented a guide on how to count and size nanoparticles via SP ICP-MS, which was automated and integrated into a GUI by Lockwood et al. (2021, 2025). For details on the theoretical background, the equations used, and the comparison to reference nanoparticles, we refer to these publications. The estimation of particle sizes from SP ICP-TOFMS data requires knowledge about the particle species, i.e. the mineral, to consider elemental mass fractions and density. Cryo-Raman spectroscopy can carry out in-situ mineral characterisation, which helps to link detected elements with specific mineral species and crystal phases and estimate the elemental mass fractions. Especially in scenarios in which multiple polymorphic phases are present (e.g. rutile and anatase, both TiO2) or in which only a small number of particles are counted, compromises in the modelling of size distributions are required. We emphasise that Raman spectroscopy and SP ICP-TOFMS focus on different size scales, which is interesting for complementary analysis but limiting when the same particle fractions shall be characterised in a multi-modal fashion. We determined mineral composition using hundreds of micrometre-sized particles identified with Raman spectroscopy (Stoll et al., 2022, 2023b), which enabled us to get a broader understanding of abundant microminerals and infer possible mineralogy at the nanoscale. The aim was to base calibration on the a priori determined mineralogy. However, the chosen element-mineralogy relationship remains a simplification with certain inaccuracies and therefore is limited, and should be treated with caution as described later.
We applied the described size estimate approach to calibrate the most dominant particulate elements 27Al, 28Si, 48Ti, and 56Fe following previous studies (Stoll et al., 2022, 2023b). In all samples analysed here (Table 1), Stoll et al. (2022, 2023b) identified quartz and members of the feldspar and mica group. SiO2 (quartz, density of 2.3 g cm−3) is known to be dominant in atmospheric dust and was chosen as the dominant proxy for 28Si. However, aluminosilicates, among others, also contain Si. To show this, we conducted a limited cluster analysis for the four most abundant clusters per sample containing 27Al, 28Si, 48Ti, and 56Fe. Conducting such an analysis for all elements is beyond the scope of this study. For size estimates, a clear differentiation between different minerals containing the same element remains an option for a dedicated future study. For simplicity and based on Raman spectroscopy data, the very abundant potassium feldspar (KAlSi3O8, density of 2.6 g cm−3) was chosen for 27Al. Hematite (Fe2O3, density of 5.2 g cm−3) occurred in all samples except the shallowest and, thus, was selected for 56Fe. We chose TiO2 (rutile, density of 4.2 g cm−3) for 48Ti, because it was the more abundant form of the two observed titanium-oxide forms (rutile and anatase), which were identified in 13 samples by Stoll et al. (2022, 2023b). We emphasise that this approach provides tentative estimates that take dominant mineral phases into account.
3.1 Particulate concentration and relative detections
In view of the limited knowledge of common particulate elements in glacier ice across various locations and to ensure reliable results, a non-target particle screening was carried out according to Gonzalez de Vega et al. (2023). Here, thresholds for every are determined and data points above are counted and reported if they exceed a corresponding threshold. We chose a non-target screening score of 100 ppm, which corresponds to 100 data points above the determined threshold for a specific element for a sample size of 1 million data points. This procedure returned a defined range of particulate analytes across all mass channels across all samples (Fig. 2).
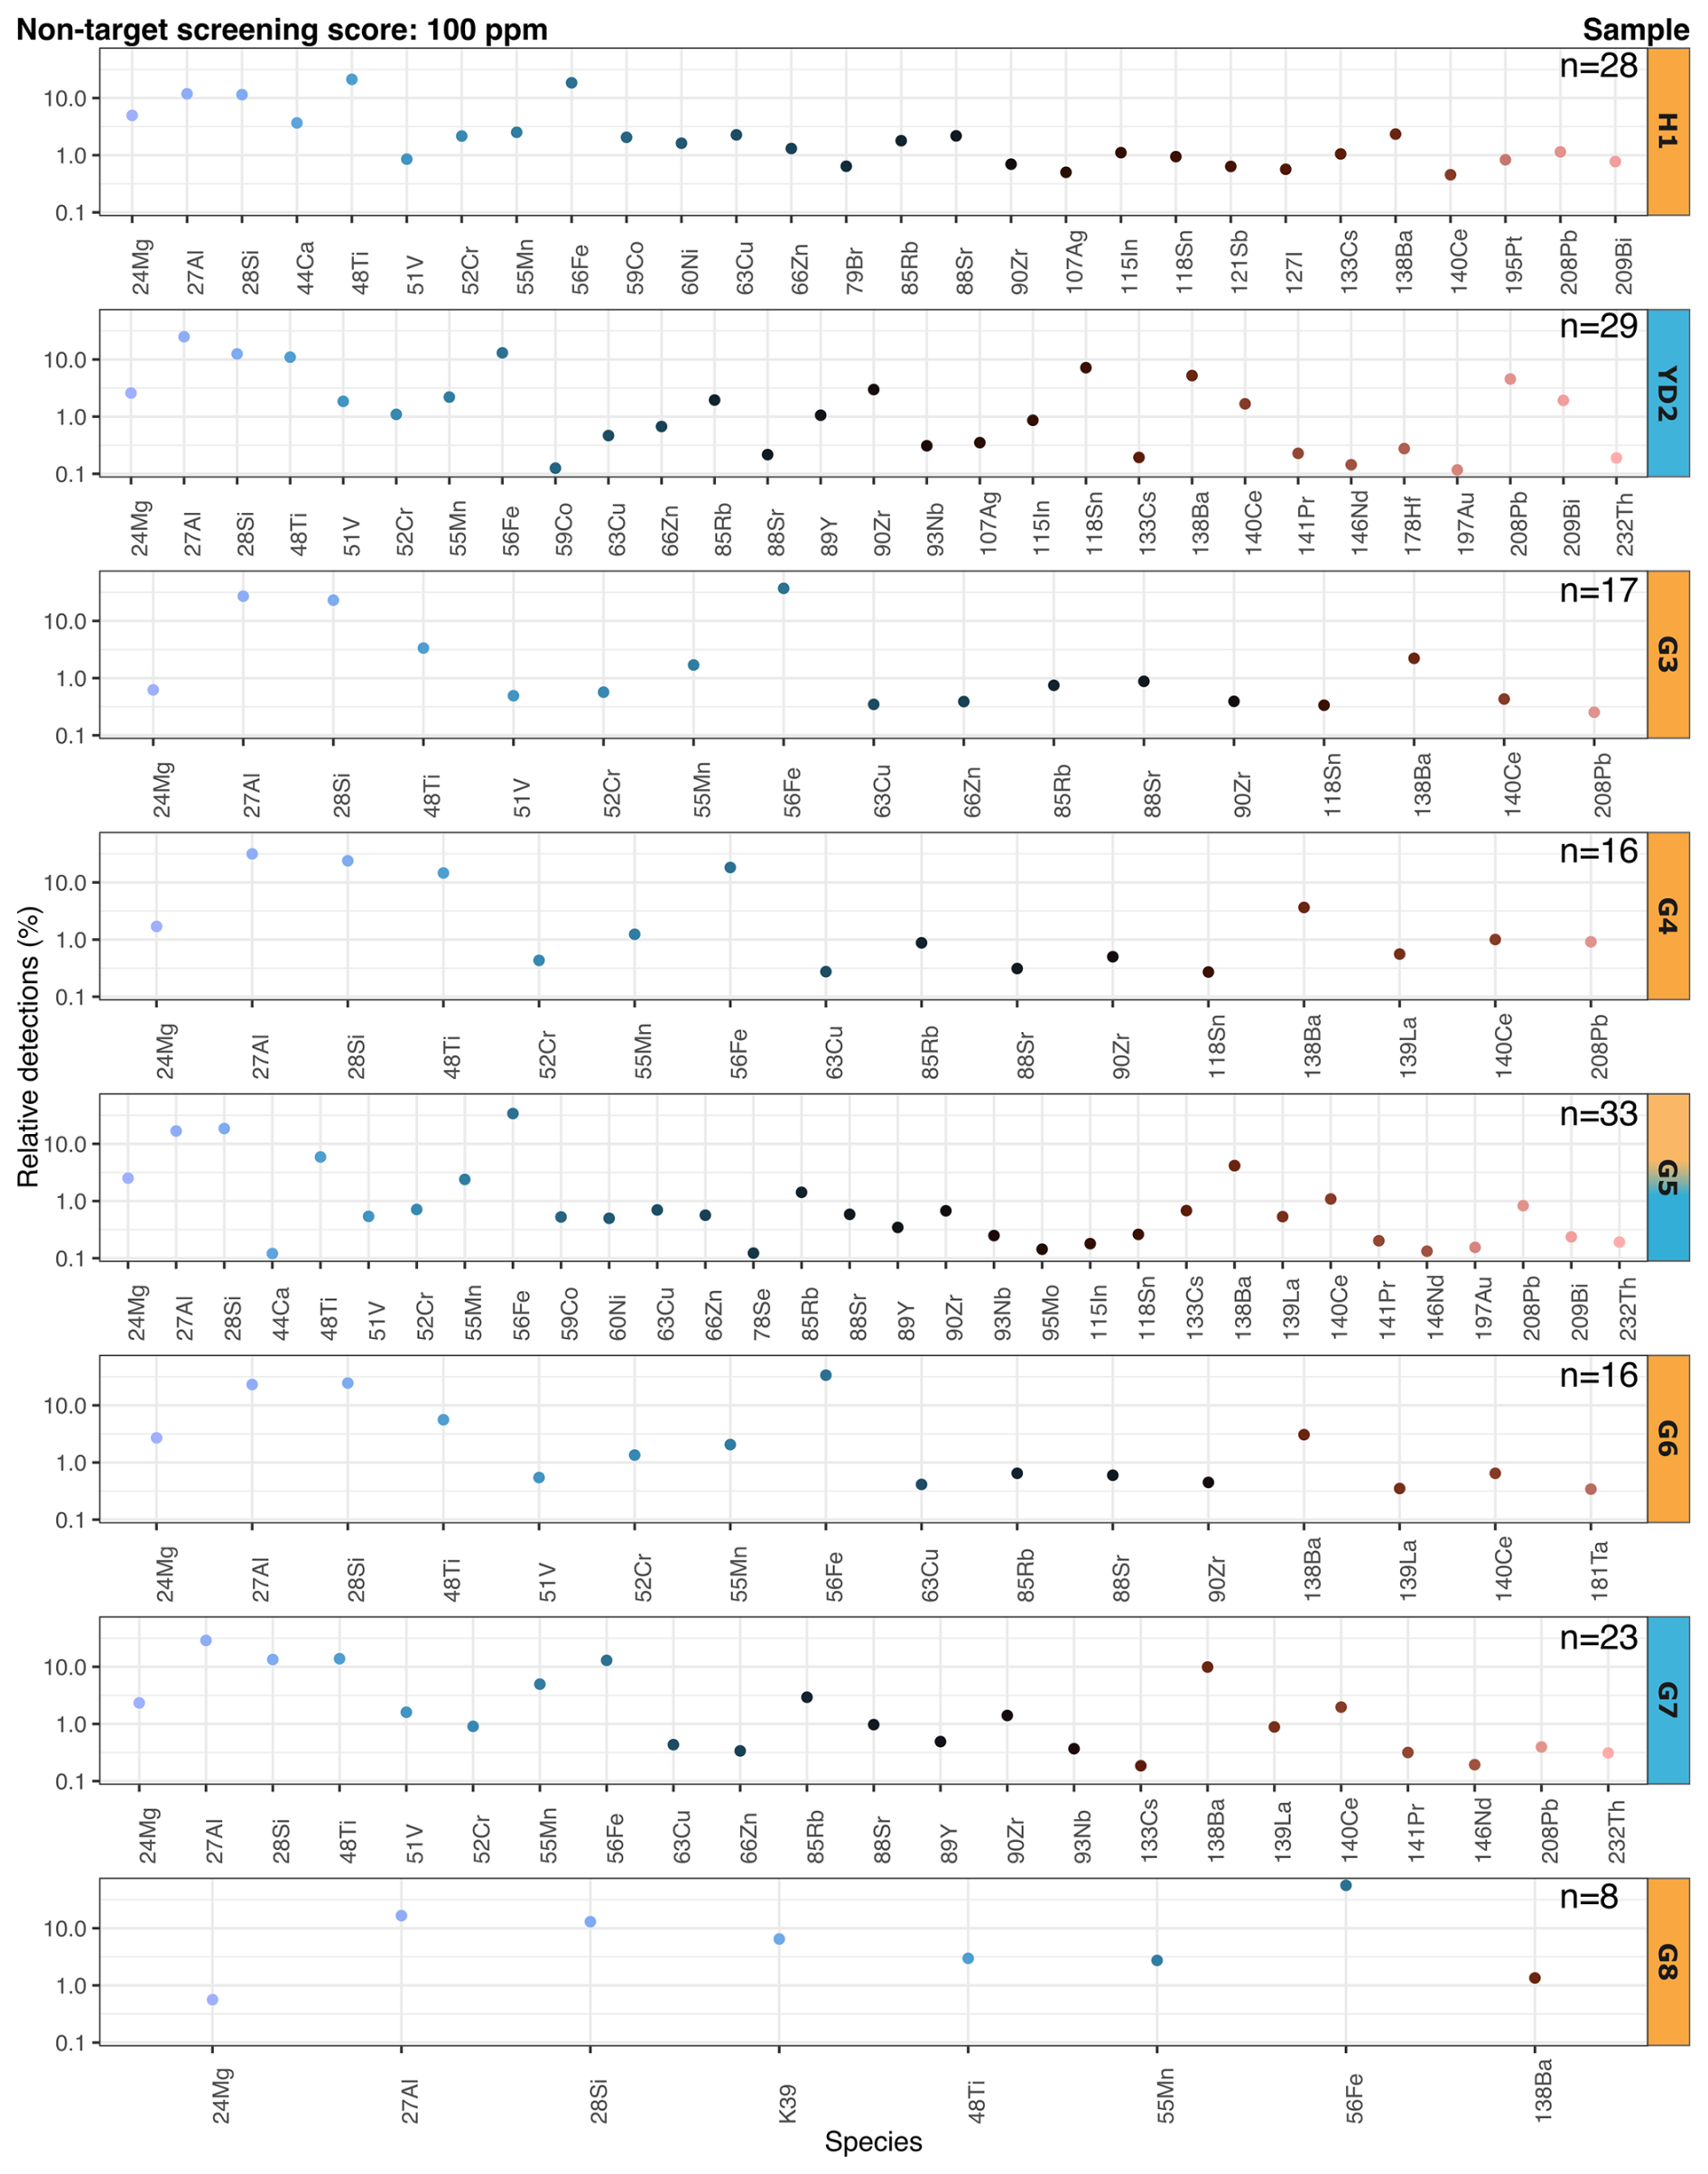
Figure 2Relative detections for chemical species above a screening score of 100 ppm detected with the automatic ionic background threshold; blank values were subtracted. The number of particulate elements in the sample is indicated by n. Each sample tag is filled with orange or blue for Holocene/interstadial and stadial samples, respectively. The debatable climate period of G5 is discussed in the text. Note the varying chemical species on the x-axis.
With the non-target screening score of 100 ppm, up to 33 different particulate elements were identified in the eight analysed samples. The relative detections for all detected particulate elements are displayed in Fig. 2, and specific elements are discussed below. G5 contained the largest number of particulate elements (n=33), followed by YD2 (n=29), H1 (n=28), and G7 (n=23). We detected 17 elements in G3, 16 in G4 and G6, and eight in G8. The most abundant detectable element (in relative share) was 56Fe (56.3 % in G8).
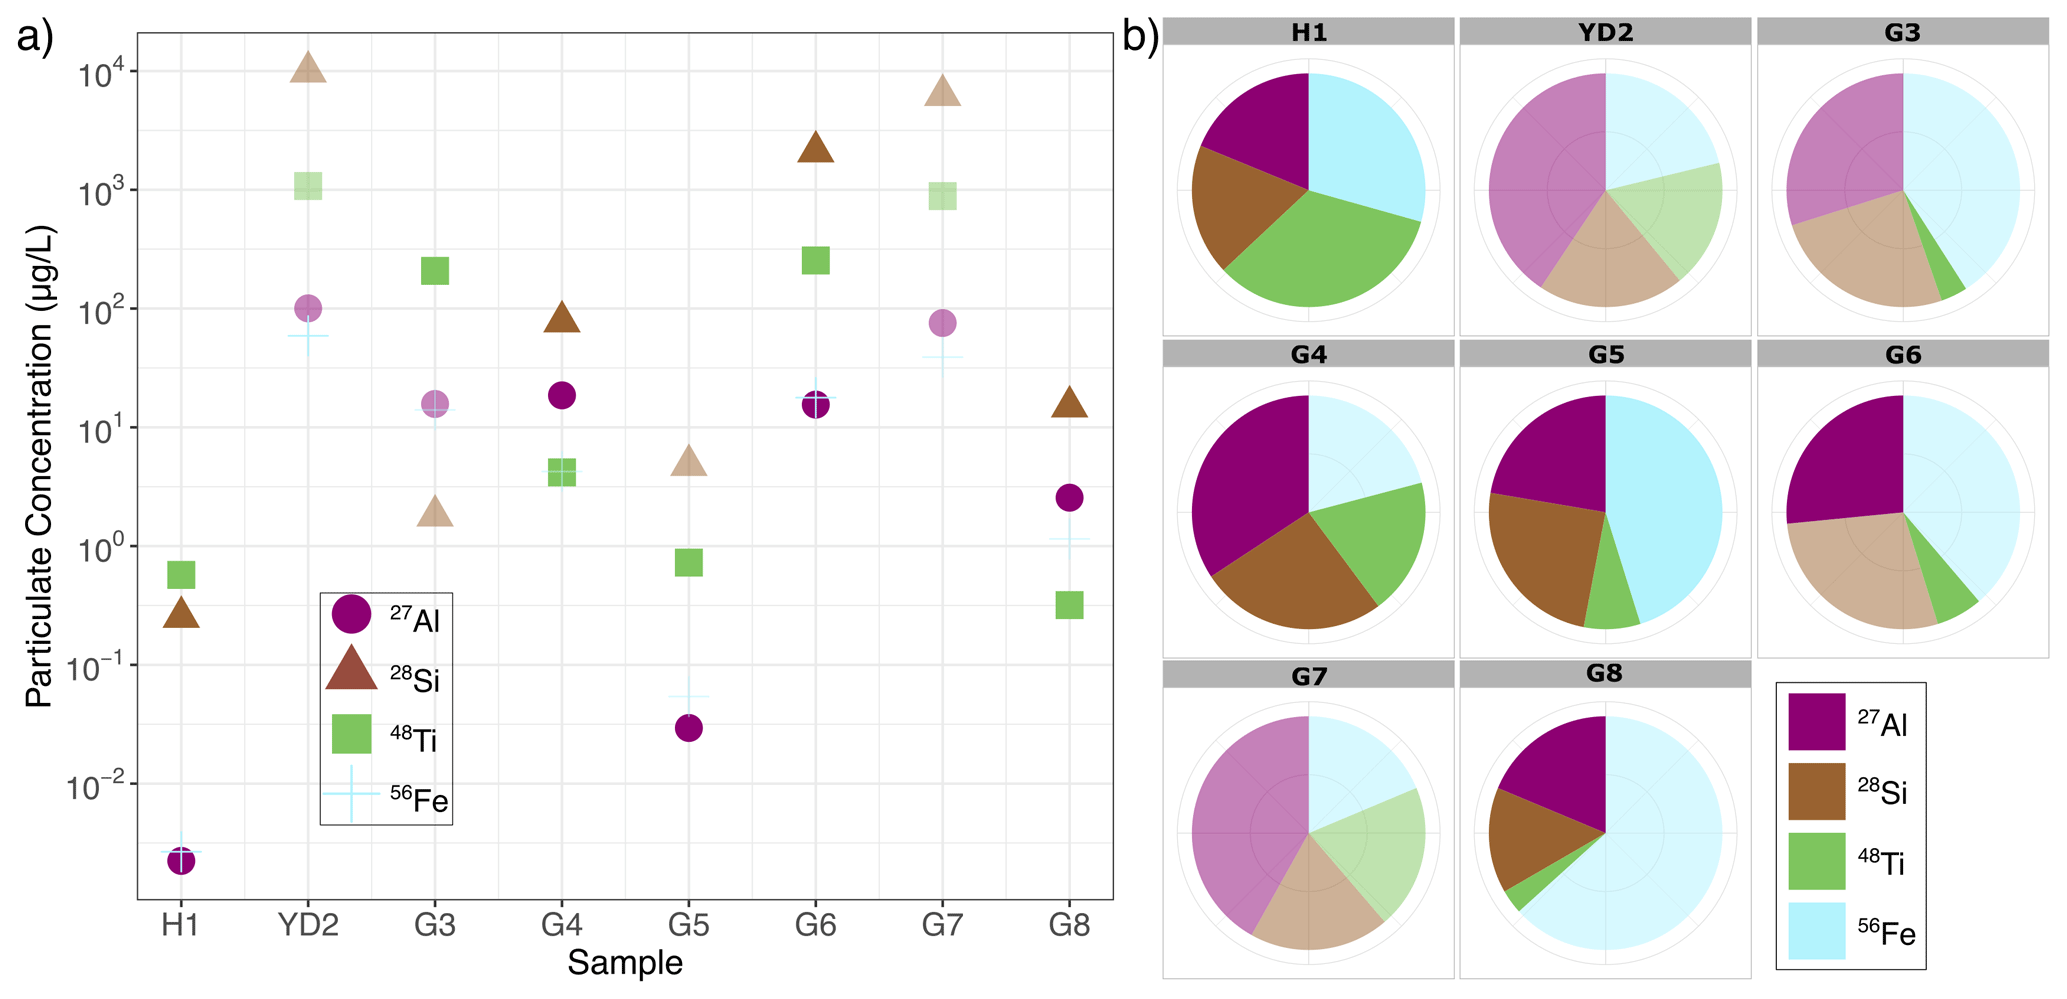
Figure 3Derived (a) particulate mass concentrations for 27Al, 28Si, 48Ti, and 56Fe and (b) relative detections for each respective species and sample. Elements with particle detections above the calculated maximum observable event rate threshold (Table 2) are indicated by lower opacity and mentioned in the text.
In the following we focus on the most abundant particulate elements 27Al, 28Si, 48Ti, and 56Fe. The highest particulate mass concentrations were found in YD2 and G7 (Fig. 3a). The concentrations in H1 were by far the lowest followed by G5. Usually, 28Si and 48Ti showed the highest concentration followed in decreasing order by 27Al and 56Fe. The relative data (Fig. 3b) show that 48Ti was a dominant detectable particulate element, by concentration, in the Holocene (H1), 27Al in the Younger Dryas (YD2), and 56Fe in the last glacial (G3, G5, G6, G8) with the exception of G4 and G7 where 27Al was more abundant. In G8, 56Fe represented almost two-thirds of the total relative particulate concentration share. 28Si has the most constant share throughout all samples, and its abundance fluctuates roughly between one-third and one-quarter. Detections above the event rate thresholds described in Sect. 2.6 were found in YD2 (27Al, 28Si, 48Ti, 56Fe), G3 (27Al, 28Si, 56Fe), G4 (56Fe), G6 (28Si, 56Fe), G7 (27Al, 28Si, 48Ti, 56Fe), and G8 (56Fe).
3.2 Particle clusters
Different mass analysers are available for SP ICP-MS. While quadrupoles provide the highest sensitivities enabling the detection of small particles, TOFMS provides the crucial advantage to acquire virtually any simultaneously. Thus, we can study the elemental composition of each particle resulting in distinct “clusters”. Using hierarchical agglomerative clustering (Tharaud et al., 2022), we inquired the four most common mass compositions per sample for 27Al, 28Si, 48Ti, and 56Fe (Fig. 4).
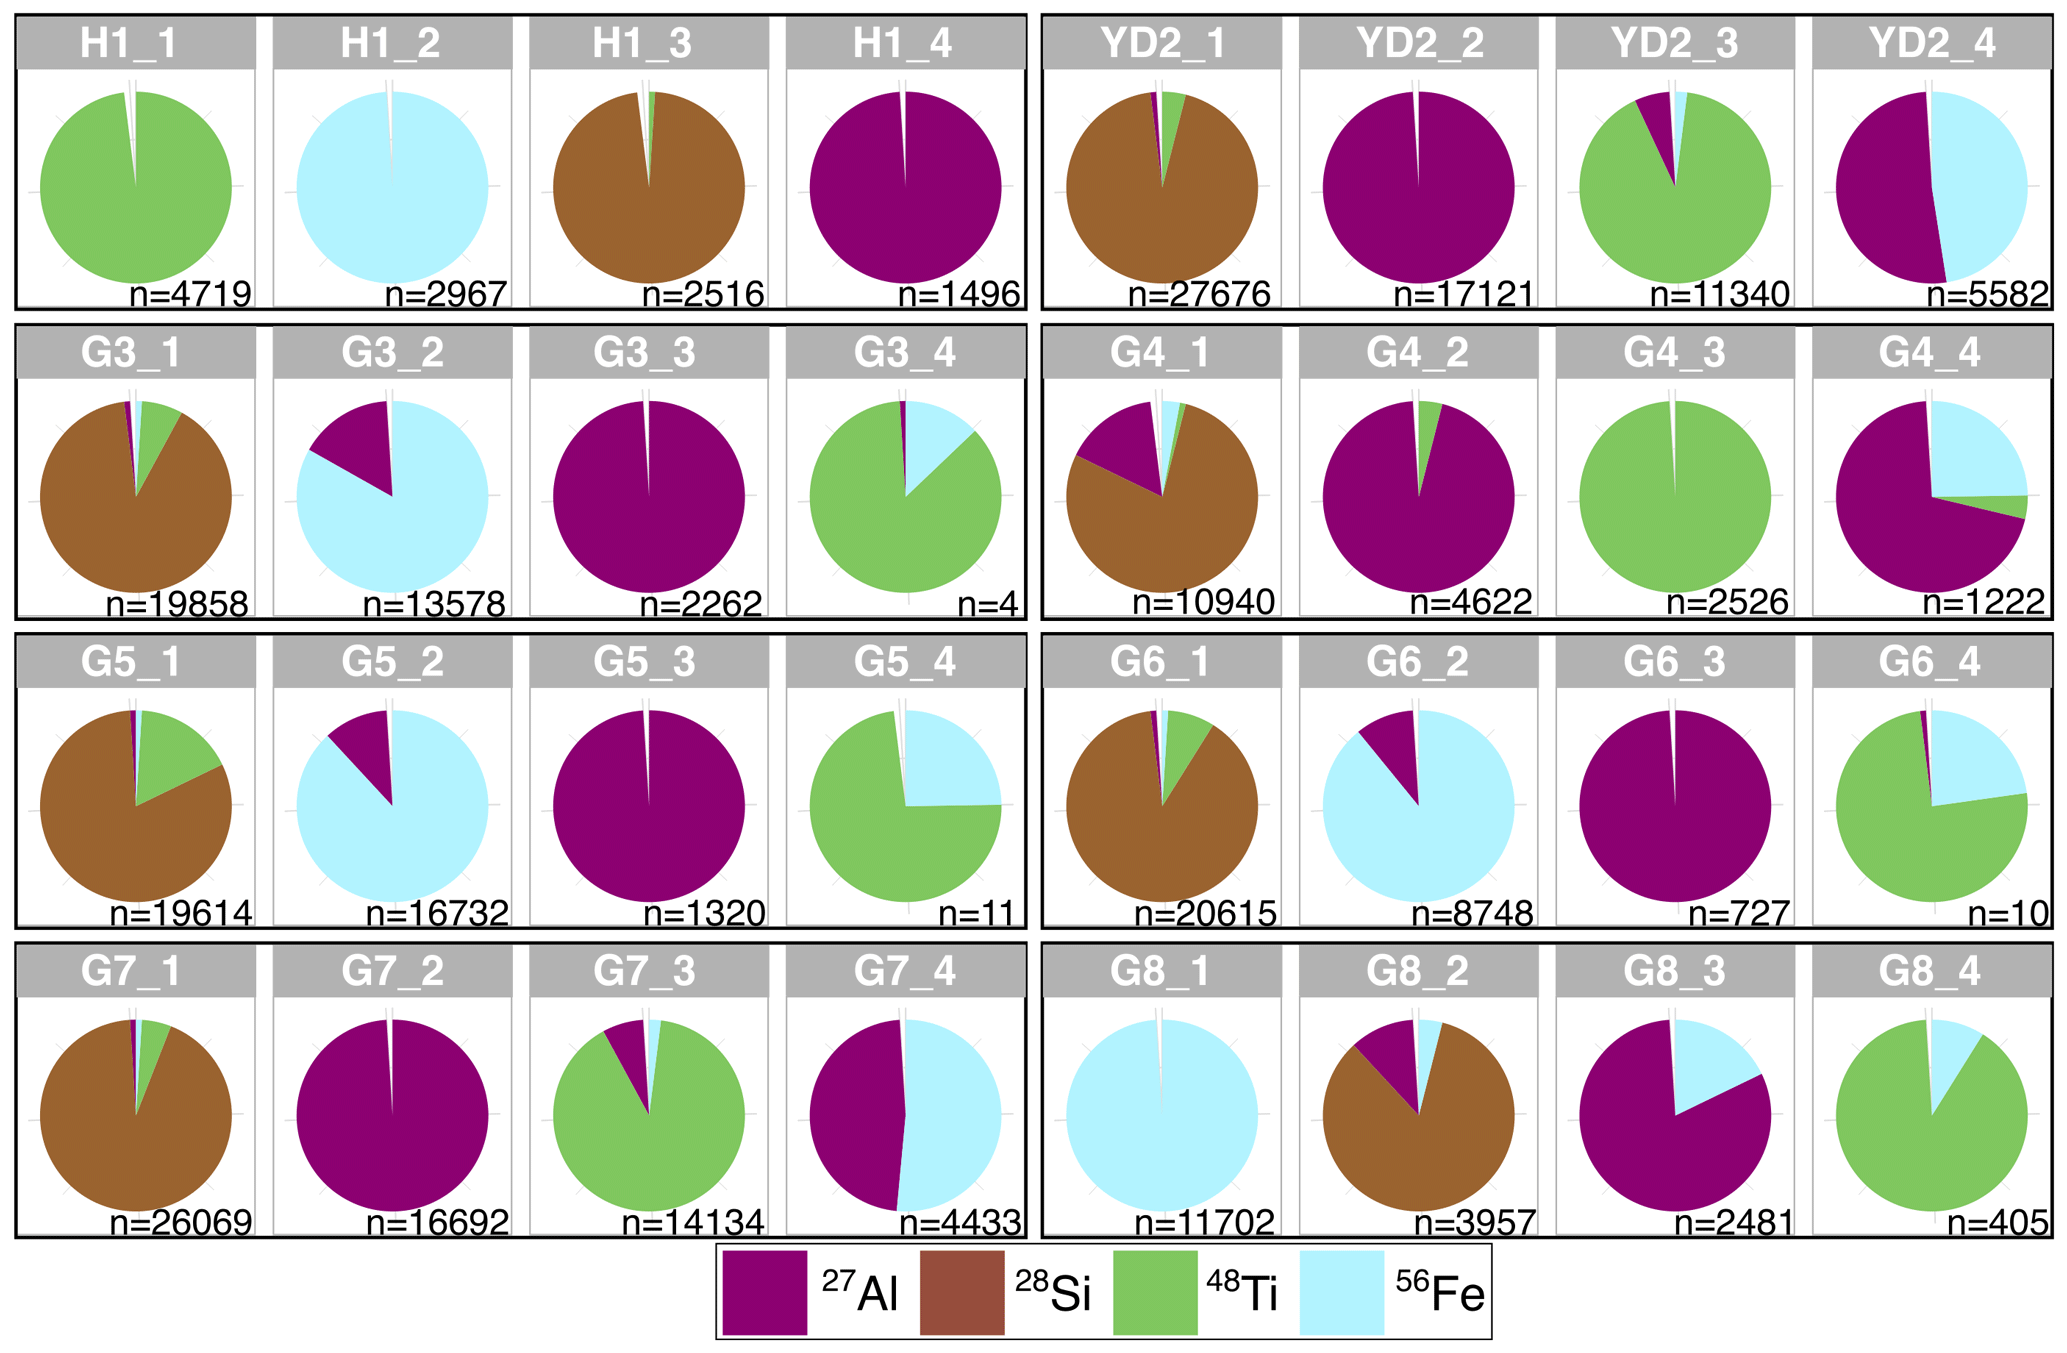
Figure 4The four most abundant elemental compositions (“clusters”) per SP by mass containing 27Al, 28Si, 48Ti, and 56Fe. The sub-plot title indicates the sample and the cluster in order of decreasing abundance; n indicates the number of particles with the displayed composition and the fraction in the chart represents the relative abundance of each element. Due to rounding, values do not always sum up to 100 %.
Eight of all 32 analysed clusters contain only one element (Fig. 4). 27Al forms five single-element clusters, followed by 56Fe (2), and 48Ti (1). Overall, 27Al, has the largest cumulative share. Cluster analysis revealed that a large portion of particles contained almost entirely 28Si with little additions of other elements; these clusters are the most abundant in six samples. Absolute numbers of particles with certain elemental compositions are much higher in the Last Glacial and Younger Dryas compared to the Holocene. The most abundant clusters are YD2_1 (n=27 676), G7_1 (n=26 069), and G6_1 (n=20615).
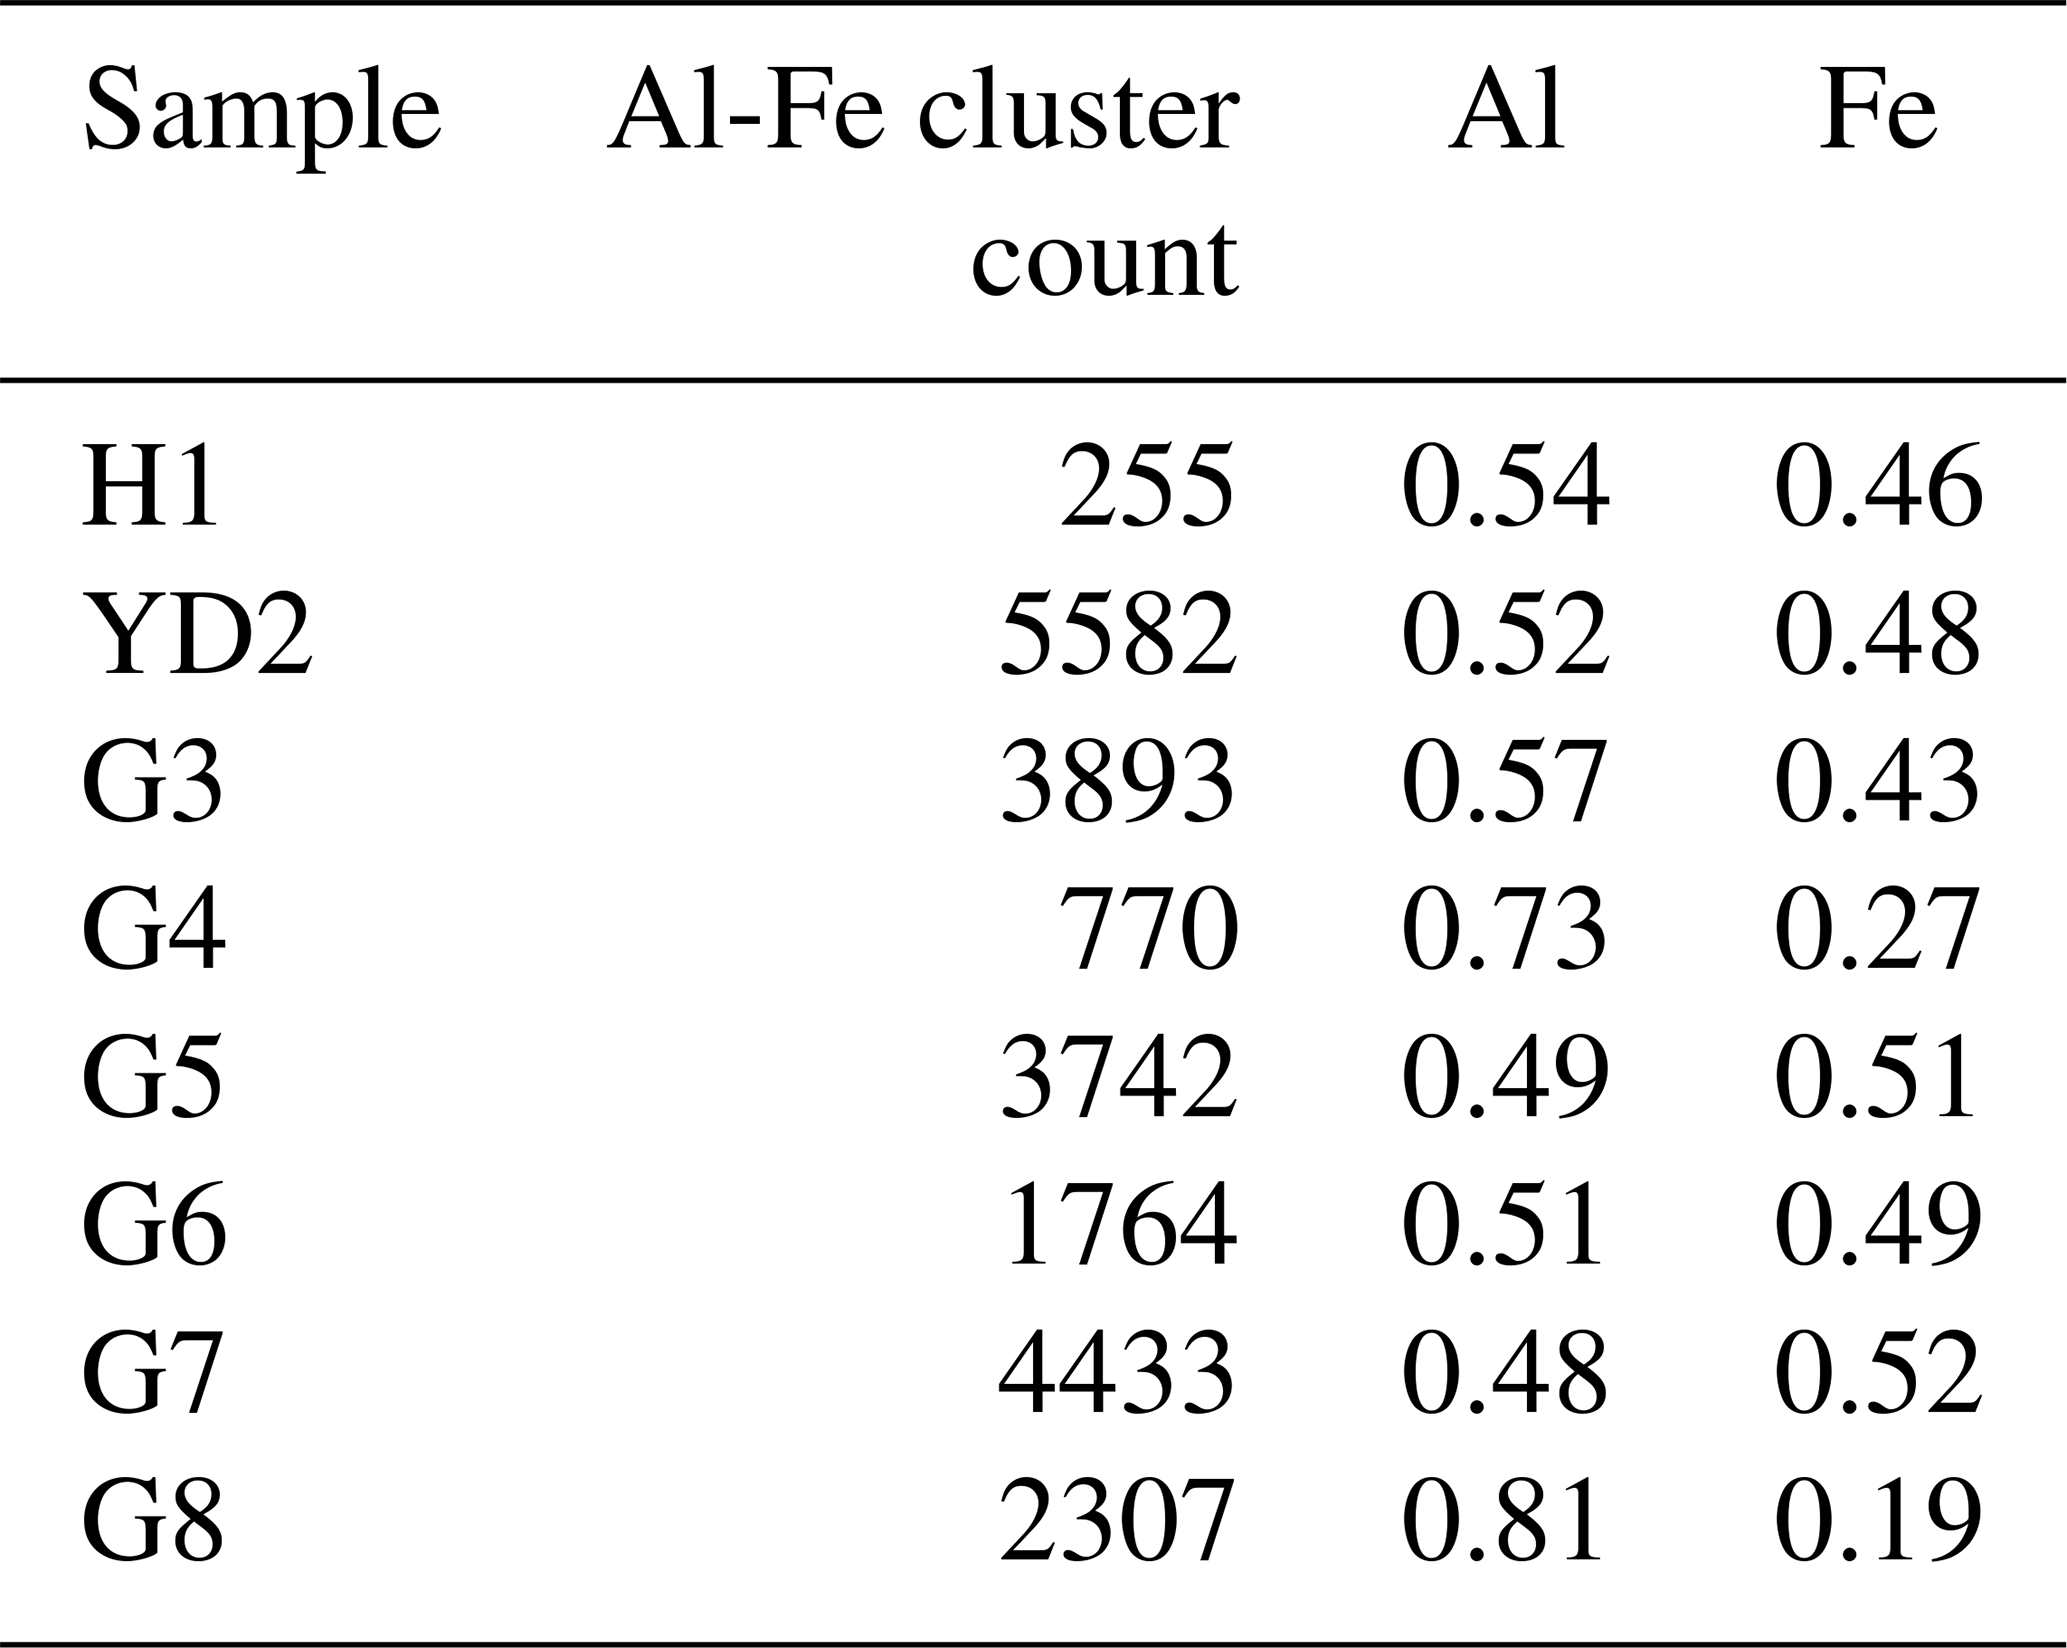
Cluster analysis further allows us to calculate precise ratios of certain elements in particles that contain only these elements. We conducted an example analysis for particles consisting only of 27Al and 56Fe (Table 3), referring to the commonly used Fe Al ratio as a source region proxy. By mass, 27Al usually dominates slightly; comparably high 27Al shares were detected in G4 and G8. This approach could be extended to other elements, depending on the focus of investigation.
Table 3Particle clusters containing only 27Al and 56Fe and their respective mass shares; calculated with the automatic ionic background threshold.
3.3 Particle size estimate
3.3.1 Mean mass and particle sizes
Particle sizes were estimated based on mineral phases previously identified with Raman spectroscopy (Sect. 2.7). Comparing particle sizes across different samples is challenging with SP ICP-MS, as the lower detection limit is set by the ionic background, which is often inconsistent when comparing melted ice core samples from different climate periods. Consequently, small limits in samples with low background allow for the detection of smaller particles and to access a size fraction which cannot be considered in samples which exhibit large background signals and therefore higher detection limits. To enable a comparison, we chose a conservative approach, in which the overall highest limit of detection was chosen to set a common size window in which all samples are compared. It is worth noting that this approach misses the smallest particles in samples with low ionic background (e.g. H1), but it allows facilitated comparison across samples with varying backgrounds.
Across all samples, we selected the highest ionic background to make the detection of (large) particles comparable (see Sect. 2.4). Detections above the event rate thresholds (Sect. 2.6) were only reached in YD2 (27Al, 28Si, 48Ti, 56Fe) and G7 (27Al, 28Si, 48Ti, 56Fe). While this approach enables the (conservative) comparison of particle size and number, it prevents the analysis of small, e.g. nanometre-sized, particles. Therefore, the following comparisons are merely qualitative within the size window stipulated.
Mean mass ranges from 0.056 fg (27Al in G5) to 3508 fg (28Si in G6) (Fig. 5a). Within our conservative threshold frame, particles containing 28Si and 48Ti are usually heaviest while 56Fe particles are the lightest.
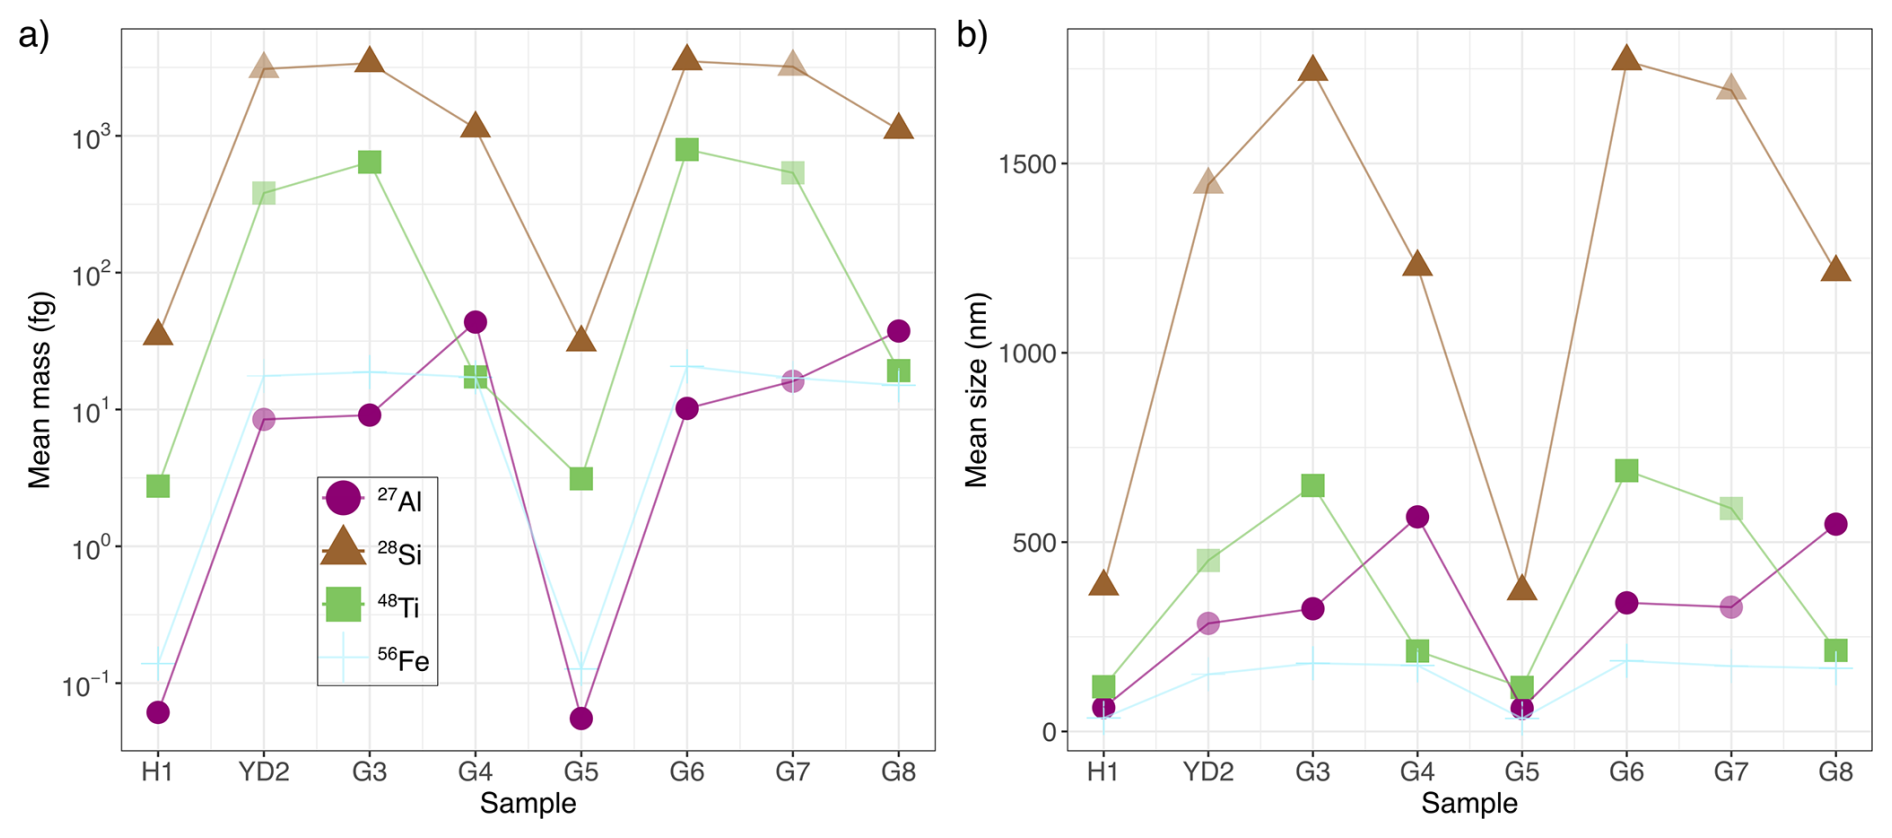
Figure 5Single particle parameters calculated with uniform ionic background thresholds for 27Al, 28Si, 48Ti, and 56Fe after assigning minerals based on previous Raman spectroscopy work. (a) Mean mass measurements and (b) mean size estimates. Size estimates are based on the chosen mineralogy as explained in Sect. 2.7. Opacity and colour legend as in Fig. 3.
The estimated mean and median particle sizes (Figs. 5b and A1, respectively) show a wide range within samples and over the sampled spectrum. In the following comparisons and discussions, we will refer to mean values. Particles are comparably small in samples H1 (36–383 nm) and G5 (34–370 nm). 28Si-containing particles are the largest in six samples (H1, YD2, G3, G5, G6, G7) and range from 370 nm (G5) to 1770 nm (G6). It is worth noting that as particles increase in size, transport efficiency is reduced and data from large particles need to be interpreted with care (Lomax-Vogt et al., 2025). 56Fe-bearing particles are always the smallest, ranging from 34 nm (G5) to 187 nm (G6). Median sizes are similar to the mean values (Fig. A1).
3.3.2 Particle size distribution
We show the size distributions of H1, G4, and G6 in Fig. 6. Generally, we can resolve the distribution of very fine particles obtaining insights into nanometre-sized particles, which is likely more useful than exact numbers. Distributions are normally lognormal or close to it with a few exceptions, such as large 28Si-particles in H1 (Fig. 6a). In G4 and G6 (Fig. 6b and c), 28Si and 48Ti cover an extensive size range reaching into the micrometre range.
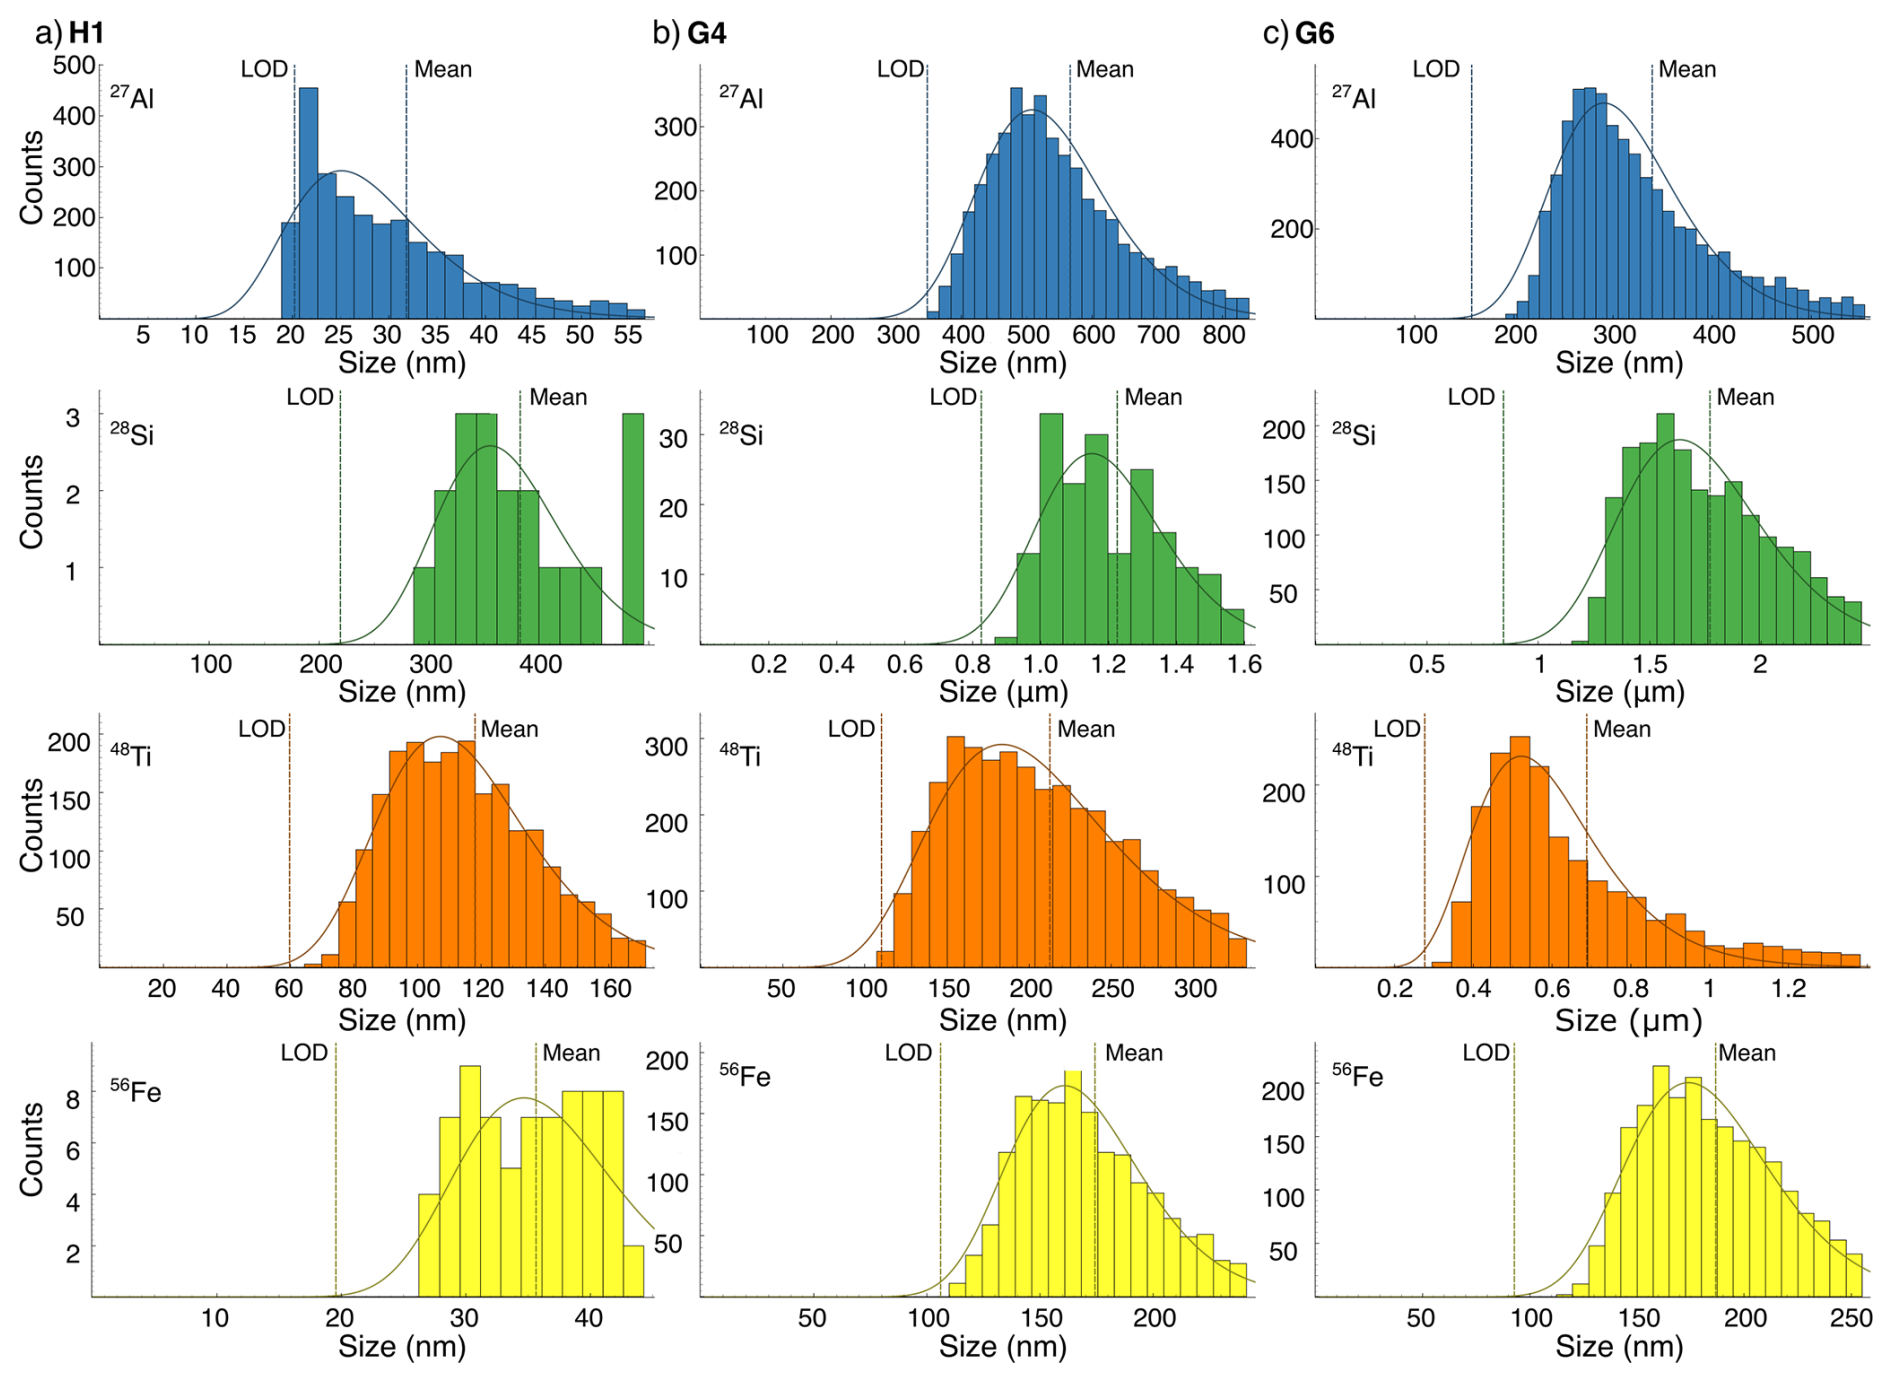
Figure 6Particle size distribution for assumed minerals based on Raman spectroscopy data (Sect. 2.7) for 27Al (blue), 28Si (green), 48Ti (orange), and 56Fe (yellow) in (a) H1, (b) G4, and (c) G6. The histogram displays estimated data based on measured SP data. The dashed line indicates the lognormal distribution and should be treated with caution for the area below the limit of detection (LOD), which varies depending on the sample's ionic background. Note µm on the x-axis for 28Si in G4 and 28Si and 48Ti in G6.
4.1 Characterisation of particles and their link to climate
Our findings show how SP ICP-TOFMS can help in better characterising nanoparticulate dust particles and climate periods based on particle concentration, composition, and particle size. In most samples, 28Si was dominant (YD2, G4-G8) (Fig. 3a). Given the high abundance of silicate minerals, such as quartz (90 % in the Earth’s crust), this was an expected result as crustal material has been transported to Greenland regularly (e.g. Steffensen, 1997; Vallelonga and Svensson, 2014). Si is the second most abundant element in the Earth's crust (28.2 %), most often forming silicates together with the most abundant element O (46.1 %) or aluminosilicates together with 27Al, the third most abundant crustal element (8.2 %). The high concentration of 27Al can be explained by Al being the most abundant metal, forming several aluminium oxides and members of the clay, feldspar, and mica groups. The fourth most abundant element in the crust is Fe (5.6 %), forming iron oxides and being part of, for example, sulfides, mica, and feldspar varieties, explaining the high concentration of 56Fe (Fig. 3a). Especially in the last glacial, dust minerals, such as mica, feldspar, and hematite, are very abundant (e.g. Stoll et al., 2023b). The concentration and relative abundance of 48Ti vary between our samples, as Ti is the ninth-most-abundant element (0.6 %) in the crust and forms a variety of titanium oxides and other minerals. We stress that the reported particles are detections limited by the applied instrument and its limit of detections in combination with the specific geochemical characteristics of the sample, which have been shown to vary strongly on the microscale (e.g. Eichler et al., 2019; Stoll et al., 2022, 2023b).
Our data show that the dust-rich cloudy band from the Younger Dryas (YD2) and the prominent cloudy band in G7 from the last glacial (GS-12) have by far the highest particle concentrations (Fig. 3a). The cluster analysis (Fig. 4) shows that particle clusters in both samples are very similar in composition. In both samples, 27Al is the dominant element (Fig. 3b) followed by 56Fe, 28Si, and 48Ti. This indicates that the analysed particles originate from similar source regions and were transported under comparable climate conditions. As discussed by Stoll et al. (2021a, 2023b); Bohleber et al. (2023), these cloudy bands are stratigraphic features indicating high insoluble particle concentrations partially from dry deposition events. These bands dominate the ice stratigraphy below the bubble-hydrate transition helping to assess the macroscale palaeoclimate record integrity and are potentially areas of enhanced diffusion and microstructural ice rheology differences (Faria et al., 2010). Unfortunately, there is no EGRIP chemical data, e.g. from CFA, from the depths analysed in this study. For a comparison and further in-depth characterisations, more data are thus needed.
Sample G5 displays how SP ICP-TOFMS can help in defining climatic periods in a very precise manner. G5 is roughly 34.7 ka old and should thus be from a stadial, i.e. GS-7 (34.74–33.74 ka b2k) (Rasmussen et al., 2014). However, G5 is characterised by low particulate concentrations (Fig. 3a) and very small particles (Fig. 5) similar to H1, which is roughly 1000 years old and from the relatively warm Medieval Warm Period (e.g. Broecker, 2001; Mayewski et al., 2004; Goosse et al., 2006; Neukom et al., 2014). The particle properties of G5 indicate a reduced transport of comparably small particles to Greenland. Weak winds during warmer climate periods explain our observations, which is in agreement with previous work on interstadials (Rasmussen et al., 2014). Thus, our data indicate that the age estimate or the sample cut of G5 is slightly off. G5 probably originates from a slightly warmer period, i.e. the end of GI-7a (34.8–34.74 ka b2k) (Rasmussen et al., 2014). In contrast, aerosol transport was more potent during colder times, with stronger winds transporting larger particles farther, which can, thus, be deposited further from their source (Vallelonga and Svensson, 2014). The high number of different detected elements (Fig. 2) could further imply that the detected particles originated from different regions depending on the prevailing regional wind systems. Such detailed insights could be crucial for identifying climate periods in highly thinned ice.
4.2 Elemental composition via cluster analysis and multi-method investigations
With SP ICP-TOFMS, we may resolve nanoparticle populations and characterise them in their physical and chemical properties (e.g. size, number, composition), which is interesting for comparisons with observations from the macroscale. The conducted particle cluster analysis (Fig. 4) reveals diverse particle compositions with certain trends, providing a starting point for a more accurate classification of populations of nano- and micro-particles in polar ice. One quarter of the analysed clusters contain only a single element. Based on Raman spectroscopy and literature data, we infer that these particles also contain oxygen, likely in the form of oxides. 56Fe-oxides could be, for instance, Wüstite (FeO), hematite (Fe2O3) or magnetite (Fe3O4); 28Si-oxides could represent quartz (SiO2) or quartz polymorphs, and 48Ti-oxides could be rutile, anatase, or other polymorphs (all TiO2). Complex clusters usually contain mostly 28Si, potentially representing feldspar (always and primarily containing Si and Al) or mica (always containing Si and potentially Al, Mg, Fe, and Mn), and clay minerals, such as the very abundant Illite (Svensson et al., 2000). Observed clusters containing only Fe and Ti could represent Ilmenite (FeTiO3). These interpretations of SP cluster data broadly agree with the found mineralogy from micrometre-sized particles within EGRIP ice (Stoll et al., 2022, 2023b). However, we note that inferring mineralogy based on literature and Raman data is an oversimplification. As can be seen in Fig. 4, various different elemental compositions were common throughout the ice core. These compositions may provide additional hints to what mineralogy is present and can be interrogated in extensive detail. However, the aim here was to provide new concepts demonstrating how SP ICP-TOFMS may complement or even advance previous approaches.
Raman spectroscopy revealed e.g. quartz and hematite as prominent phases, SP data demonstrate heterogeneity in particle composition (Fig. 4). Some reports state that the mass composition of single particles can be used to assign specific minerals, which could help complement Raman insights and validate them. In our case, Raman spectroscopy provided useful insights but also showed that the, almost uncharted, nanorealm is far more complex, warranting further investigation. It demonstrates that we need to develop representative simplifications when dealing with vast amounts of data as generated by SP ICP-TOFMS. Additionally, samples must be carefully evaluated. The high particle concentration, e.g. in YD2 and G7, may change the element composition and affect cluster analysis by overestimating the number of clusters, which should be kept in mind. We display representative examples of co-detections over time in the raw data of H1 in Fig. A2.
The novel approach of this study, i.e., directly comparing Raman spectroscopy, LA-ICP-MS, and SP ICP-TOFMS data, is encouraging, yielding similar results despite the different limitations of these methods, especially regarding particle size. The presented data of YD2, the cloudy band from the Younger Dryas, show relative shares of 20.3 % and 21.2 % Si- and Fe-bearing particles, respectively (Fig. 3b). An investigation of an area within YD2 with LA-ICP-MS 2D Imaging showed several pixels interpreted as clusters of heterogeneous Fe-, Si-, and Al-bearing particles (Bohleber et al., 2023). The authors report 20 %–28 % “Si without Al” pixels, a quartz proxy, and 21 % “Fe without Al” pixels, a hematite proxy. Stoll et al. (2022) found 20 % quartz (SiO2) and 6 % hematite (Fe2O3) in YD2. Obtaining representative statistics with confocal Raman spectroscopy is time-demanding and thus challenging, especially when focusing on one plane 500 µm below the sample's surface (Stoll et al., 2022, 2023b). Quantitative results are, thus, likely to differ, explaining the discrepancy in the Raman spectroscopy-derived hematite share. This comparison exemplifies the potential for more systematic liaisons between Raman spectroscopy, LA-ICP-MS 2D Imaging, and SP ICP-TOFMS. More data gathered with this multi-method approach might enable the development of more robust generalisations about dust particles in polar ice, deepening our understanding of past climate.
4.3 Trace element analysis
We present a proof-of-concept demonstrating that trace-element analysis of particles trapped in discrete solid ice samples is possible with SP ICP-TOFMS. Our data display the chemical variety of particles bearing numerous particulate elements ranging from very abundant, such as 28Si, 27Al, and 56Fe, to scarce (trace elements), such as 107Ag, 208Pb, and 118Sn (Fig. 2). The greatest number of distinct particulate elements was detected in G5, suggesting that the source regions and minerals of the detected particles were comparably diverse. However, it remains to be tested if the number of different elements is suitable to act as such a proxy. Estimating mass fractions and mineral phases for trace elements is currently impossible due to a lack of data, and we thus only report the number of different particulate elements and respective detections. An in-depth discussion of all measured elements in our samples, their respective properties, and their potential implications would only be possible if more data from EGRIP or other polar ice cores were available. Unfortunately, little is known about trace elements in Antarctica (e.g. Gabrielli et al., 2005) and Greenland (e.g. Barbante et al., 2003), especially regarding data from deep ice cores. Glaciers outside the polar regions have been investigated more closely regarding trace element concentrations (Kutuzov et al., 2022); however, the primary focus is on trace elements related to anthropogenic pollution, and the samples are thus comparably young. For example, low concentrations (pg g−1) of Ag, Au, Pt, Pd, and Rh were identified in ice and snow from the Mont Blanc in the French–Italian Alps with a maximum age of roughly 250 years (Van de Velde et al., 2000). In the Italian Dolomites, Gabrielli et al. (2008) identified several trace elements, such as Ag and Cd, in recent winter surface snow. This lack of data was mainly due to the missing sensitivity of the available analytical techniques and the extremely low concentrations of these elements in polar ice. For example, Au is not detectable in bulk measurements, and its abundance in ice from the last glacial is thus unknown. However, with SP ICP-TOFMS we may pick up rare particles that disappear in bulk analysis.
4.4 Towards a more holistic representation of insoluble particle size in polar ice
While established techniques focus on the microscale, SP ICP-TOFMS enables the characterisation of the nanoscale (Fig. 5b and 6) and provides insights that are not available with other techniques. These findings expand the state-of-the-art as most studies on insoluble particles in ice cores are limited in their size range (e.g. Coulter Counter (0.6–10 µm), laser particle detector (0.9–15 µm)) and report a particle size distribution of around 1–2 µm (e.g. Petit et al., 1981; Delmonte et al., 2002; Wegner et al., 2015; Potenza et al., 2016). However, already Steffensen (1997) showed that the particle size distribution in the GRIP ice core was lognormal in the interval between 0.4–2 µm. Recent work by Zeppenfeld et al. (2025) using SPES on two shallow cores close to EGRIP further supports our size estimate data, displaying a vast abundance of tiny particles. Since dust particle size is an essential constraint for modelling atmospheric transport and the impact of dust on, e.g. global radiation, clouds, and biogeochemistry (e.g. Tegen and Lacis, 1996; Mahowald et al., 2014; Adebiyi and Kok, 2020), further SP analyses of polar ice could establish a more realistic representation of insoluble particle sizes in the nanometre range. Investigating the dust particle size in the nanometre range could also help to link future million-year-old ice core records, such as Beyond EPICA Oldest Ice, Million Year Old Ice or Dome Fuji 3, with marine dust records from Antarctic Ocean Drilling Program (ODP) cores (Wolff et al., 2022). Additionally, these particle size data can establish models on internal and external mixing states and can therefore give size distributions for specific particle species. The particle size estimate approach presented here could be further developed by incorporating a wider array of occurring minerals, building on elemental compositions derived from cluster analysis (Fig. 4). Even though these clusters do not provide accurate mineralogy data, they enable sophisticated guesses regarding nanometre-sized particles as explained above. However, there are limits. Clusters of a diverse composition remain hard to characterise. For some samples, the LOD of certain elements limits the exploration of the full particle size distribution and small particles or particles with small elemental mass fractions may be missed. On the other hand, SP ICP-TOFMS is limited by its particle cut-off size (2–5 µm) and particles in the larger micrometre-sized range have to be treated with caution as they are not transported into the plasma any longer (Lomax-Vogt et al., 2025).
Our approach to estimating particle size relies on a few assumptions regarding the mineralogy. These assumptions are based on previous Raman spectroscopy work (Stoll et al., 2022, 2023b), literature, and partly on the conducted cluster analysis, and are thus convincing assumptions. To further check this, instead of only using Fe2O3 (hematite) for 56Fe particles, we conducted tests using Fe3O4 (magnetite) as magnetite was identified in G7 by Stoll et al. (2023b). However, mean and median particle sizes only decreased by ca. 2 nm for this configuration, supporting the validity of our Fe-bearing particle size estimates. This could differ for other elements and respective minerals, but it is adequate for a proof of concept.
4.5 Challenges and limitations of ice-related SP analysis
The compositional analysis of particles can be divided into elemental and mineral. SP ICP-TOFMS can tackle the former, and counting sufficient particles allows to establish models on both the internal and external mixing states using, for example, statistical tools (e.g. hierarchical agglomerative clustering) (Tharaud et al., 2022). While the coincidence of elements in a single particle and the calibration of their relative mass fractions can help to suggest mineral data, spectroscopic techniques are more adequate for a direct identification. However, Raman spectroscopy investigates light scattered inelastically by particles and accounts for only a fraction of the overall scattered light. As such, Raman spectroscopy is often limited to investigations of particles with dimensions at the microscale (depending on refractive index). For the presented particle size estimate, it would be beneficial to conduct dedicated overview measurements with Raman spectroscopy on, e.g. a few samples per climate period, delivering benchmark minerals as input parameters. Taking advantage of the state-of-the-art in analytical chemistry could further push comprehensive particle characterisation by applying, e.g. online hyphenation of optofluidic force induction (OF2i) coupled with Raman spectroscopy and SP ICP-TOFMS (Neuper et al., 2024).
The calibration of number concentrations of abundant particles may require prior dilution, which can alter the matrix and, consequently, particle stability (Gonzalez de Vega et al., 2022). Investigating particles with low number concentrations, however, may require extended acquisition times. If samples are too diluted, we cannot recover the (rare) large particles, but we can detect the small particles. When not diluted, we detect large particles, but not the small ones. In summary, finding ideal conditions for various particles can be challenging, and a compromise is often necessary, including trade-offs that depend on the question at hand. In this study, analysis times were up to 100 s, and no dilution was performed to conserve the natural ionic strength. Especially in particle-rich ice, such as cloudy bands, some particles were so abundant that coincidental detection was likely. The applied threshold method is a suitable approach to tackle this issue. However, it is worth noting that at higher coincidences, calculating accurate number concentrations, sizes, and compositions becomes increasingly tricky. In such cases, numbers should be regarded only qualitatively, as particle numbers may be significantly underestimated while sizes are increasingly overestimated.
Finally, the determination of particle number concentrations in ice core samples may be hampered by the large difference in the numbers of different detectable particulate species, especially when investigating a variety of samples. For example, particles containing Fe, Al, Ti, or Si are very common, while other entities containing elements such as lanthanides or actinides are relatively rare. Choosing a uniform threshold for each element for several samples enables inter-compatibility between samples, even though different LODs remain depending on the sample, but filters out a certain number of particles. Additionally, artefacts could occur if elements are not analysed with consistent statistics. Choosing the right approach is also crucial when analysing particle clusters. Here, we decided to conduct the particle cluster analysis without applying a uniform background. This limits the comparison between the samples, but provides the best overview of detectable clusters. Applying a uniform threshold would strongly limit the number of analysed clusters, thus deviating from the actual content of the ice. An example for cluster analysis applying uniform thresholds is shown for H1 (Fig. A3). Here, only four clusters of three different compositions (containing only 27Al, and 56Fe) were detected instead of more than 11600 (sum of all H1 clusters in Fig. 4). Depending on the research objective, it has to be debated which approach is the most appropriate.
4.6 Implications
Our multi-element analysis revealed a high level of complexity at the nanoscale and that inferring particle sizes and species can be challenging. One reason is that the abundance of particles varied drastically between investigated samples and in some instances, a mathematical correction model was required to indicate likelihood for co-detection of particles. This co-detection has implications for the interpretation of particulate parameters as numbers are underestimated, sizes are overestimated, and composition analysis is biased. While the analysis of some samples should be regarded tentatively, it is obvious that SP ICP-TOFMS has many facets to add and is adjuvant to chart polar archives at a little known scale. Especially compositional analyses revealed many different nanoparticulate clusters. Their fingerprint contains important information that may be useful to deduce their origin but also to infer their mineralogy. We have previously carried out single particle Raman spectroscopy, which allowed us to only sample a subset of large particles. While we could reveal the presence of various microminerals, nano mineral diversity may be much larger and dedicated compositional analyses may be helpful to deduce mineralogy which in turn would help in source analysis as well as in other mineral-concerning questions. While SP ICP-TOFMS may chart the nanoscale when focussed on polar ice, it is also noteworthy that the analysis of microparticulates is still limited. As particles increase in size, their transport in SP ICP-MS get increasingly affected and quantitative analysis in the microscale can only be regarded as very tentatively. The data showcased in this study show a tentative view on nanoparticulate matter in the EGRIP core and simplifies and interpolates complex associations and differences. However, the aim was not to provide accurate and precise metrics, but to demonstrate the potential provided with SP ICP-TOFMS. This is both challenging and promising, as there is a lot of information encoded in the nano realm. Future studies will need to focus on subtle differences and the deciphering of information encoded at the nanoscale.
This study (1) shows the potential of applying a holistic multi-method approach regarding impurities in ice and (2) advances the knowledge about particles, especially in the sub-micrometre size range, setting a new benchmark for size and elemental and mineralogical composition studies on dust in ice. We exhibit that such an approach is possible with small ice volumes, such as the used cubic samples with dimensions of often less than cm. For an extended analysis, we recommend using larger samples, making the handling of the samples during decontamination easier.
The International Partnership in Ice Core Sciences aims to recover the “Oldest Ice”; thus, retrieving as much information as possible from each sample, especially from the deepest, highly thinned regions, is essential, and our multi-method approach could be key here. Other areas of interest are the “geochemical reactor in ice” hypothesis (Eichler et al., 2019; Baccolo et al., 2021) and the investigation of dust particle clustering. Bohleber et al. (2023) and Stoll et al. (2021a, 2022) found clusters of insoluble particles, which likely separate during the melting process of CFA and thus remain largely unexplored. Analysing the chemical co-localisation of SPs after Raman and LA-ICP-MS analyses may help explore this issue. Including SP ICP-TOFMS in ice core analysis routines will immensely help when details on dust characteristics are needed. However, developing a “best practice” approach for SP ice core analyses is necessary to foster comparability of results from different labs. It ranges from laboratory guidelines to coordinated data processing and analysis routines. With this study, we display some of the challenges, limitations, and possibilities of SP ICP-TOFMS for ice core science.
We show the potential, challenges, and limitations of SP ICP-TOFMS analysis for impurity-related ice core research. We display the first SP ICP-TOFMS data from a polar ice core covering several climate stages, such as the Holocene, the Younger Dryas, and different glacial stadials and interstadials. We describe approaches dealing with discrete samples and vastly different ionic backgrounds showing substantial differences between the samples in relative particle number, concentration, and dominant composition. We focus on some of the most abundant elements in the Earth´s crust, i.e. 27Al, 56Fe, 28Si, and 48Ti and conduct a particle cluster analysis displaying the most dominant element compositions. We also suggest a new technique to estimate particle sizes based on its measured elemental chemistry and a priori knowledge from previous Raman spectroscopy analysis. Particles range from a few nanometres to micrometres displaying the need for a more accurate characterisation of particles in the nano-realm, which is possible via SP ICP-TOFMS. This study thus presents the final stage of a systematic multi-method analysis approach merging the benefits of Raman spectroscopy, laser-ablation inductively coupled plasma-mass spectrometry, and SP ICP-TOFMS. Incorporating this approach for dedicated samples in the planned analyses of precious million-year-old ice would foster interdisciplinary collaborations and boost the scientific outcome.
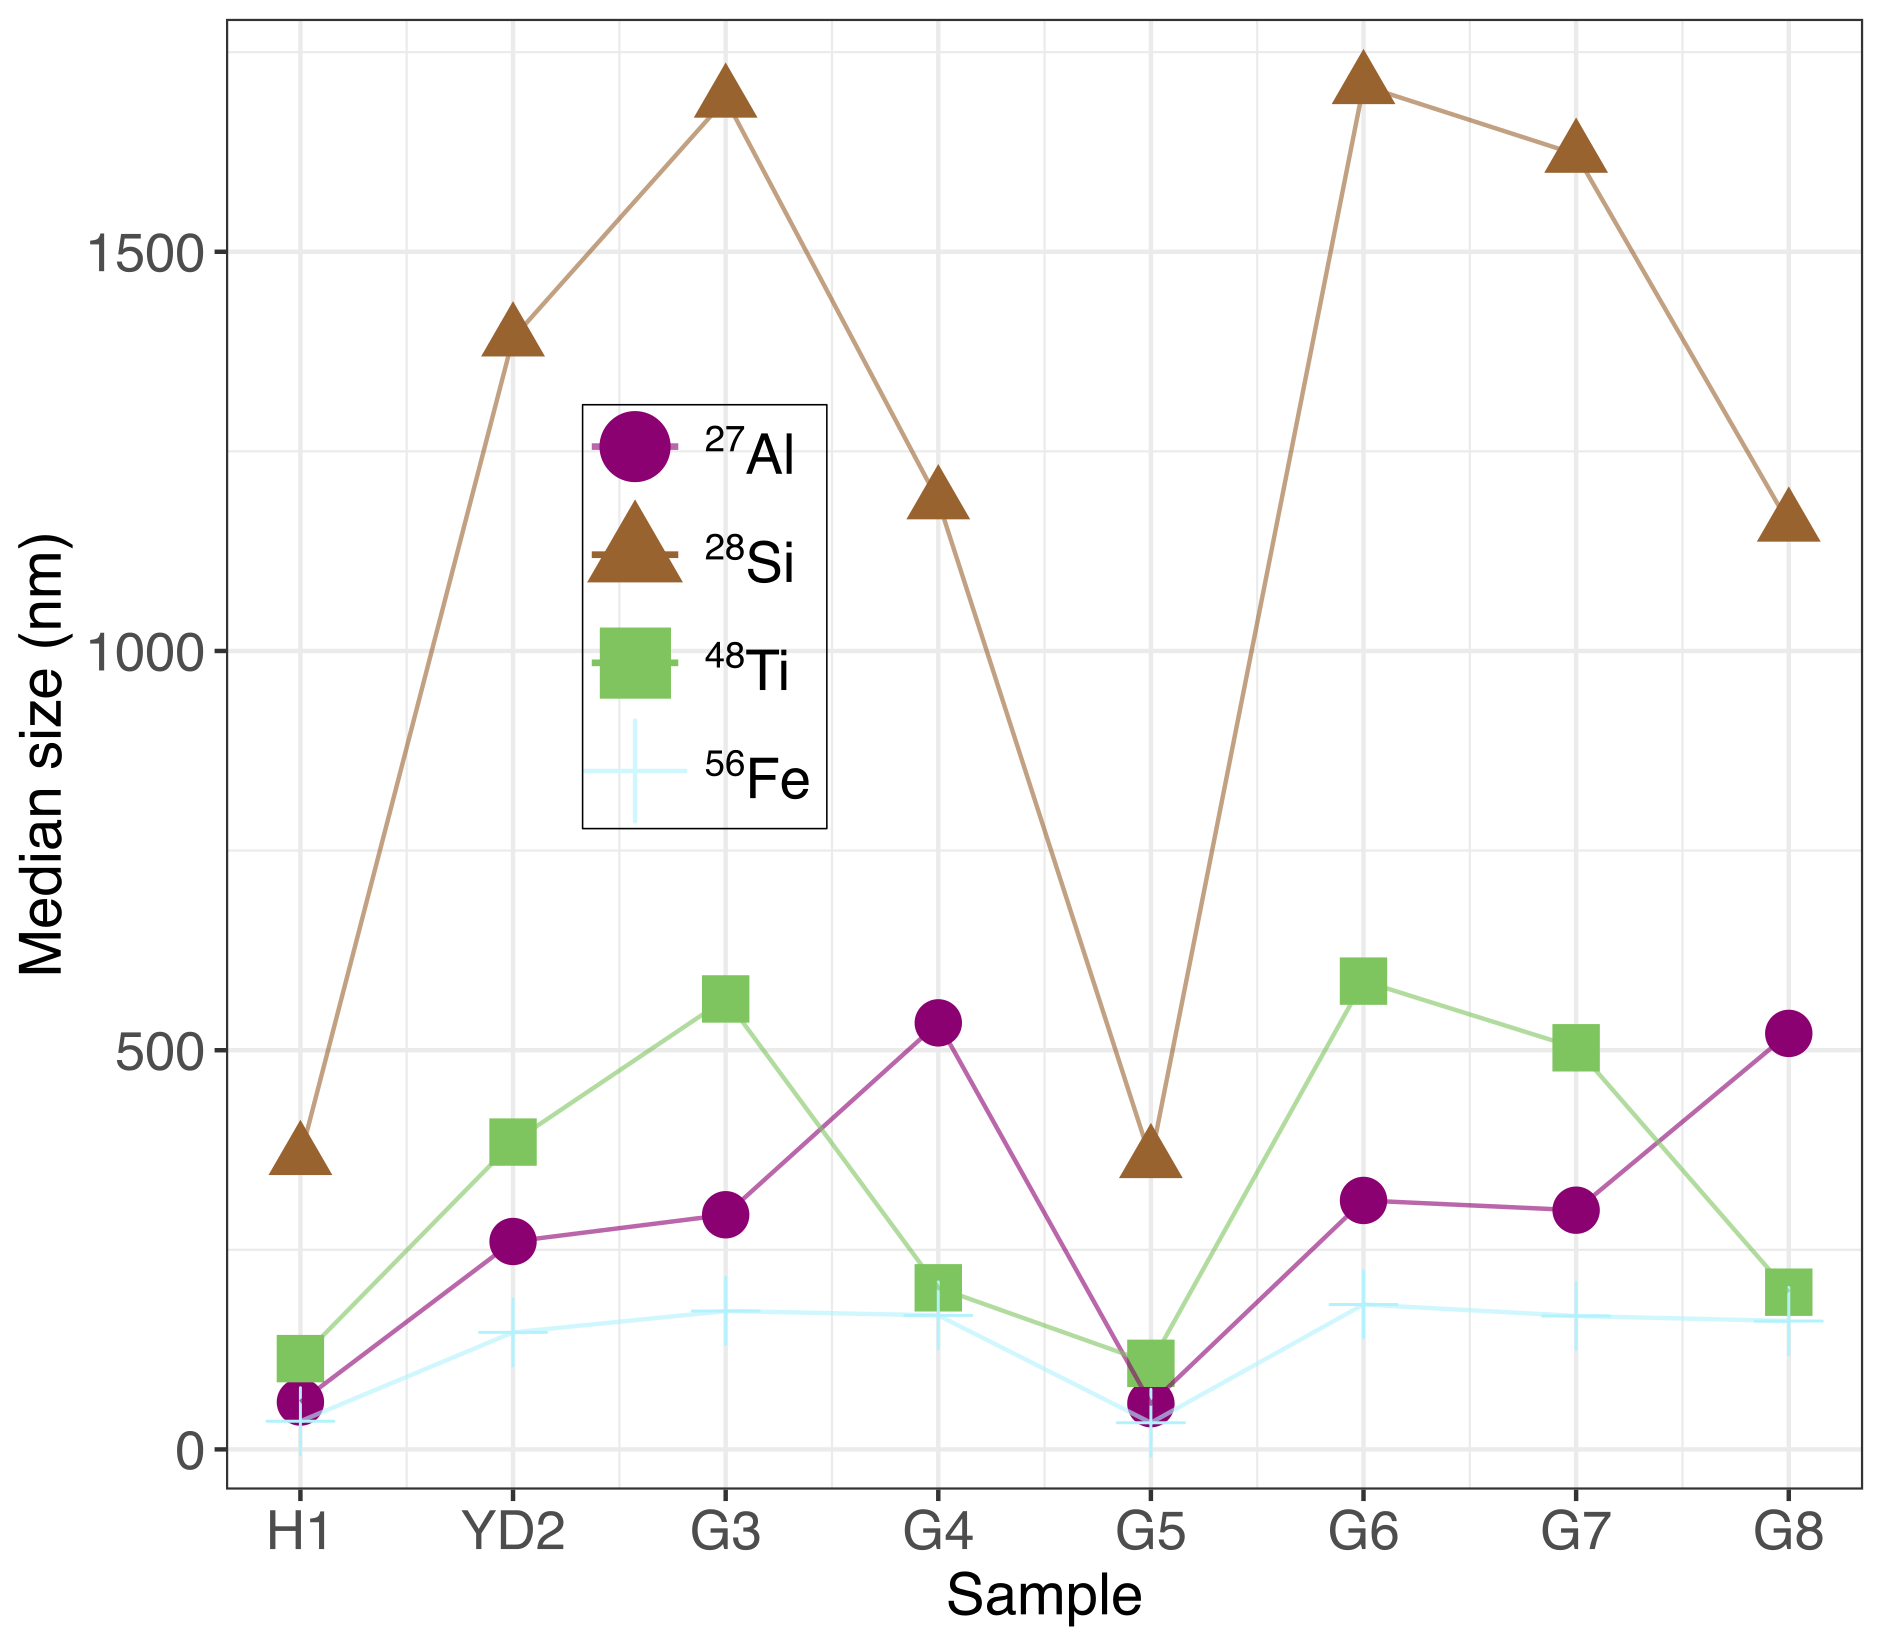
Figure A1Median size estimates with uniform ionic background thresholds for 27Al, 28Si, 48Ti, and 56Fe. Size estimates are based on the chosen mineralogy as explained in Sect. 2.7.
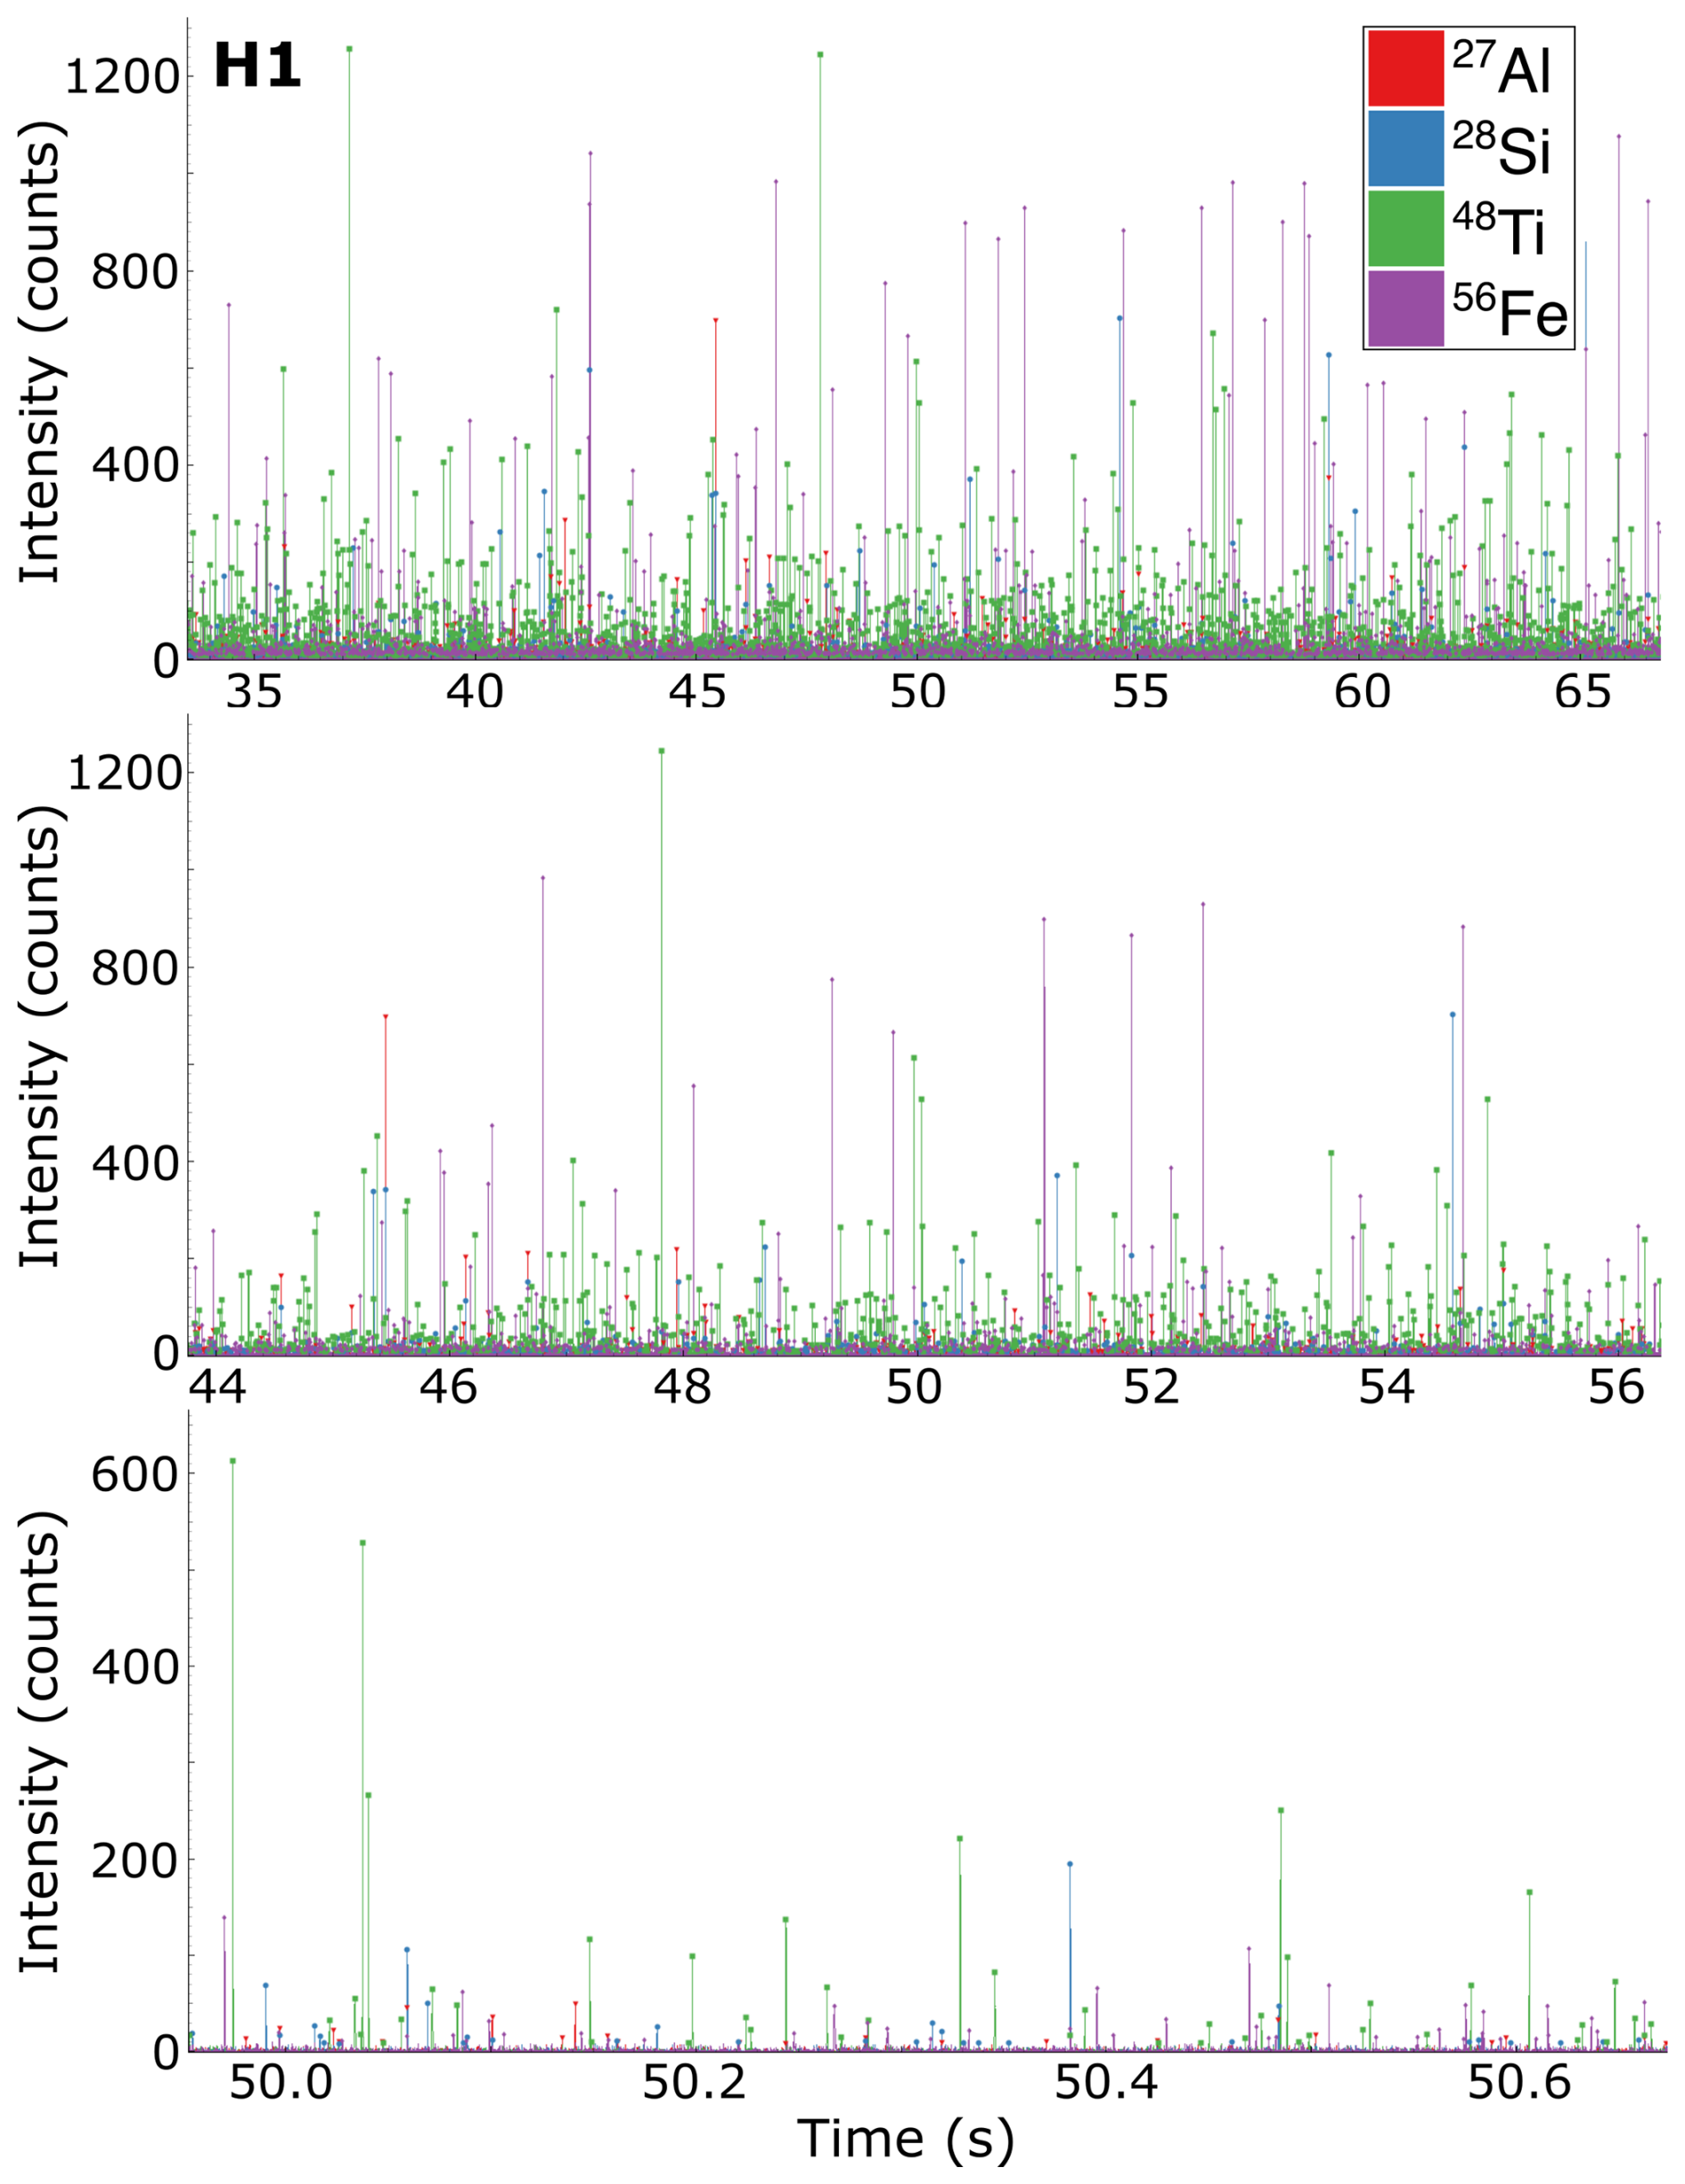
Figure A2Representative detections over time in H1 displaying the clustering of certain elements.
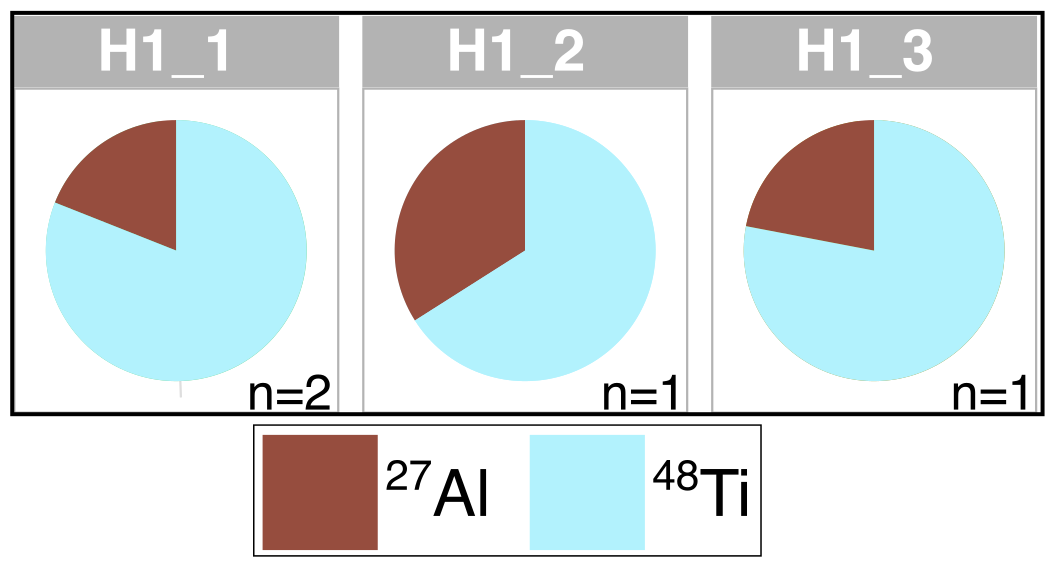
Figure A3Detected particle clusters in H1 after applying uniform thresholds. Only three different cluster, containing 27Al and 48Ti, were detected. Annotations as in Fig. 4.
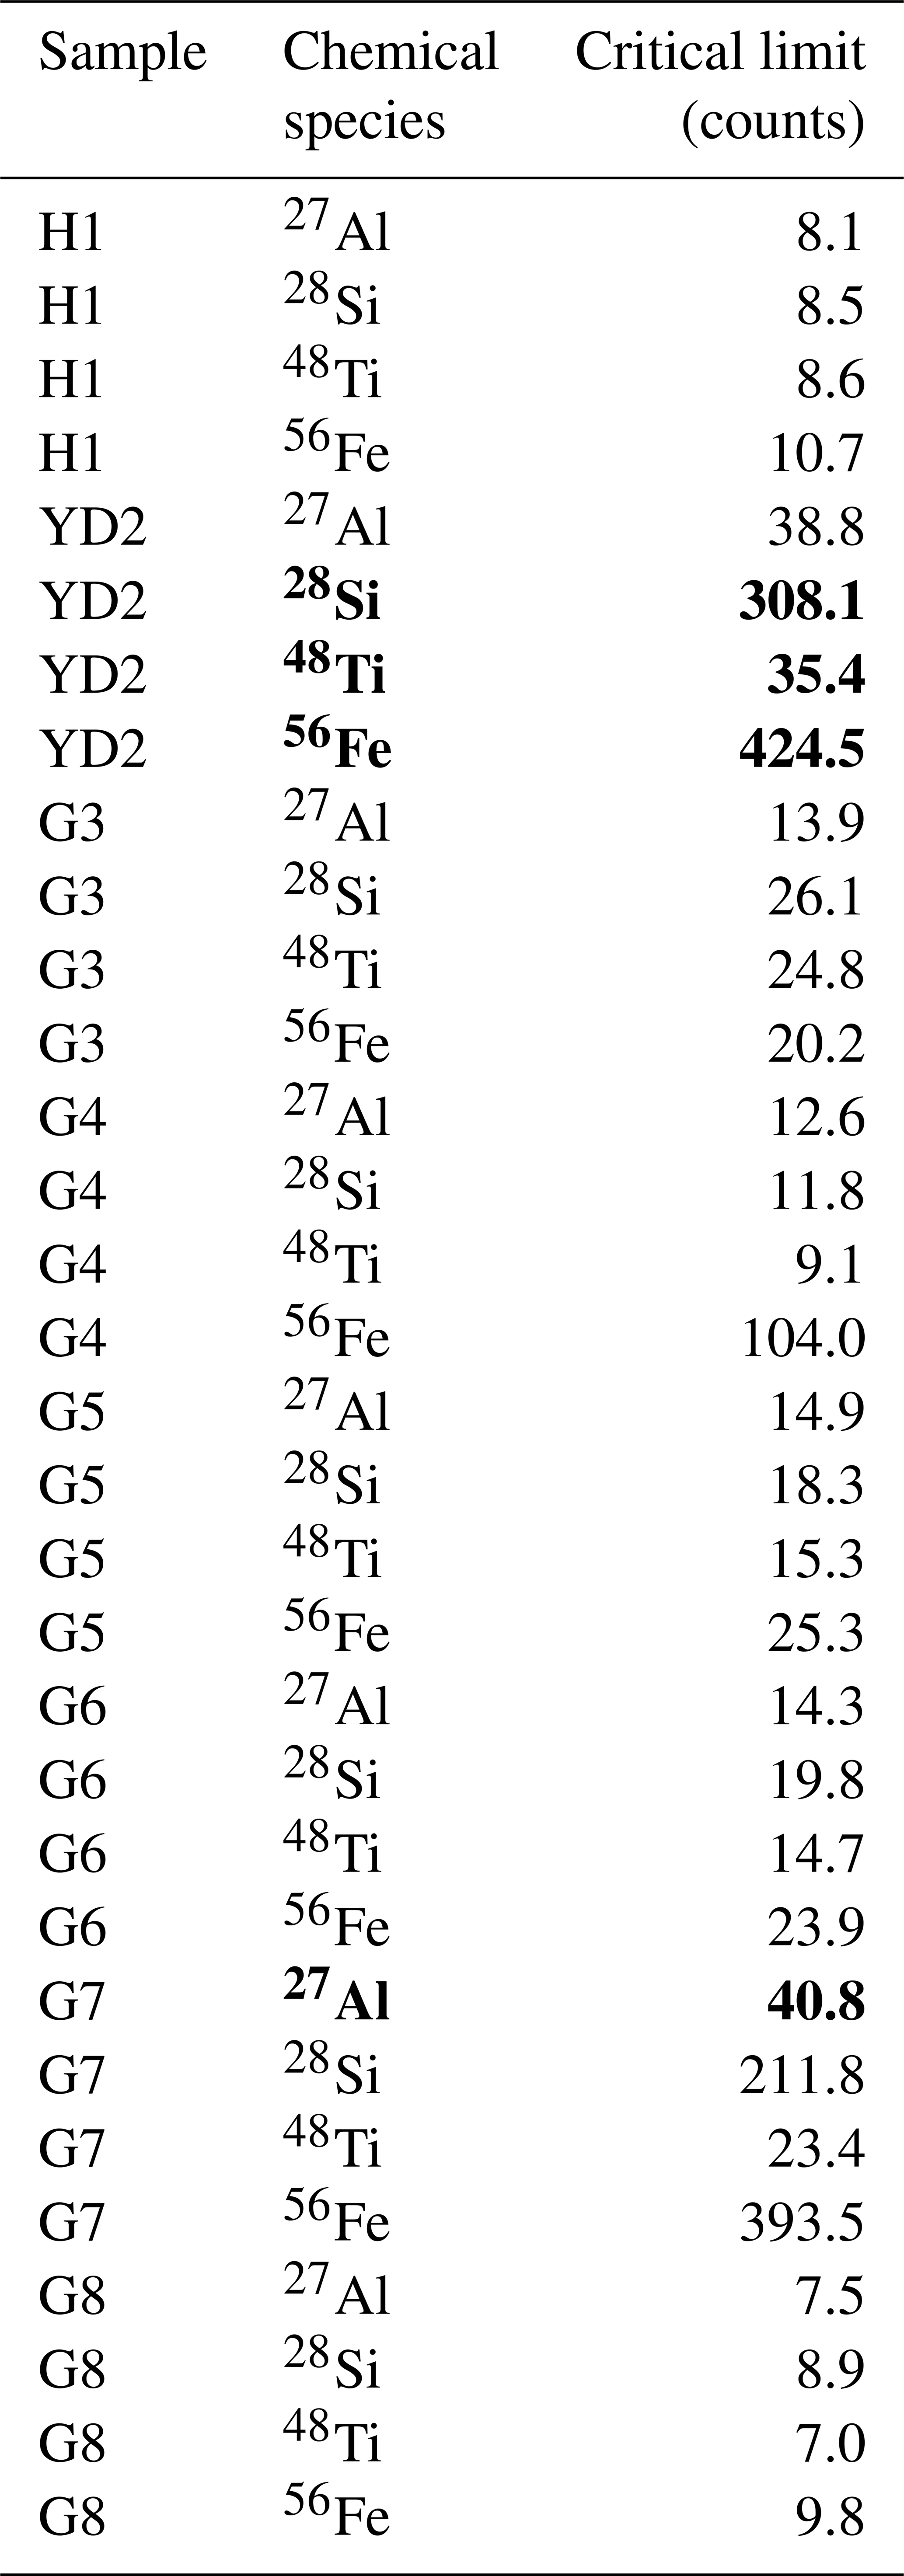
Table A1Critical limit thresholds for all samples and elements. Bold numbers refers to the highest ionic background threshold for the respective element throughout all samples, which was applied to all elements for the size estimate.
The code for “SPCal” can be found at https://github.com/djdt/spcal (Lockwood et al., 2025).
Data can be accessed at https://doi.org/10.5281/zenodo.18038801 (Stoll et al., 2025b).
NS wrote the initial manuscript with contributions from all co-authors. Samples were prepared by NS and measurements were conducted by NS, DC, QGV, PL, and PB. Data processing was done by NS, DC, ME, and RGV. Funding for NS and PB was acquired by PB.
The contact author has declared that none of the authors has any competing interests.
Views and opinions expressed are however those of the authors only and do not necessarily reflect those of the European Union or the European Research Council. Neither the European Union nor the granting authority can be held responsible for them.
Publisher's note: Copernicus Publications remains neutral with regard to jurisdictional claims made in the text, published maps, institutional affiliations, or any other geographical representation in this paper. The authors bear the ultimate responsibility for providing appropriate place names. Views expressed in the text are those of the authors and do not necessarily reflect the views of the publisher.
Nicolas Stoll and Pascal Bohleber gratefully acknowledge funding by the Programma di Ricerca in Artico (PRA). Nicolas Stoll further acknowledges funding from the European Union’s Horizon 2020 research and innovation program under the Marie Skłodowska-Curie grant agreement no. 101146092. This work was further supported by Chronologies for Polar Paleoclimate Archives – Italian-German Partnership (PAIGE) and the “Initiative and Networking Fund of the Helmholtz Association”. Pascal Bohleber gratefully acknowledges funding from the European Union’s Horizon 2020 research and innovation program under the Marie Skłodowska-Curie grant agreement no. 101018266 and further funding by the European Union (ERC, AiCE, 101088125). Piers Larkman gratefully acknowledges funding from the European Union’s Horizon 2020 research and innovation programme under the Marie Sklodowska-Curie grant agreement no. 955750. David Clases gratefully acknowledges funding by the European Union (ERC, NanoArchive, 101165171). We thank Tobias Erhardt, Hubertus Fischer, and Geunwoo Lee for fruitful discussions. Further, we express our gratitude to the people who facilitated and took part in the ice-core drilling operations and the processing. EastGRIP is directed and organised by the Centre for Ice and Climate at the Niels Bohr Institute, University of Copenhagen. It is supported by funding agencies and institutions in Denmark (A. P. Møller Foundation, University of Copenhagen), USA (US National Science Foundation, Office of Polar Programs), Germany (Alfred Wegener Institute, Helmholtz Centre for Polar and Marine Research), Japan (National Institute of Polar Research and Arctic Challenge for Sustainability), Norway (University of Bergen and Trond Mohn Foundation), Switzerland (Swiss National Science Foundation), France (French Polar Institute Paul-Emile Victor, Institute for Geosciences and Environmental research), Canada (University of Manitoba) and China (Chinese Academy of Sciences and Beijing Normal University).
This research has been supported by the Programma di Ricerche in Artico (PRA) (PRA2021-009 “Abrupt climate change and Greenland ice cover in a high-resolution ice core record”) and the European Union's Horizon 2020 research and innovation program under the Marie Skodowska-Curie grant agreements nos. 101146092, 101018266, and 955750, and additional funding by the European Union (ERC, AiCE, 101088125; ERC, NanoArchive, 101165171).
This paper was edited by Benjamin Smith and reviewed by Geunwoo Lee and one anonymous referee.
Adebiyi, A. A. and Kok, J. F.: Climate models miss most of the coarse dust in the atmosphere, Science Advances, 6, eaaz9507, https://doi.org/10.1126/sciadv.aaz9507, 2020. a, b
Baccolo, G., Delmonte, B., Niles, P. B., Cibin, G., Di Stefano, E., Hampai, D., Keller, L., Maggi, V., Marcelli, A., Michalski, J., Snead, C., and Frezzotti, M.: Jarosite formation in deep Antarctic ice provides a window into acidic, water-limited weathering on Mars, Nature Communications, 12, 1–8, https://doi.org/10.1038/s41467-020-20705-z, 2021. a
Barbante, C., Boutron, C., Morel, C., Ferrari, C., Jaffrezo, J. L., Cozzi, G., Gaspari, V., and Cescon, P.: Seasonal variations of heavy metals in central Greenland snow deposited from 1991 to 1995, Journal of Environmental Monitoring, 5, 328–335, https://doi.org/10.1039/B210460A, 2003. a
Barnes, P. R. F., Mulvaney, R., Robinson, K., and Wolff, E. W.: Observations of polar ice from the Holocene and the glacial period using the scanning electron microscope, Annals of Glaciology, 35, 559–566, 2002. a
Bohleber, P., Roman, M., Šala, M., and Barbante, C.: Imaging the impurity distribution in glacier ice cores with LA-ICP-MS, Journal of Analytical Atomic Spectrometry, 35, 2204–2212, https://doi.org/10.1039/D0JA00170H, 2020. a
Bohleber, P., Stoll, N., Rittner, M., Roman, M., Weikusat, I., and Barbante, C.: Geochemical Characterization of Insoluble Particle Clusters in Ice Cores Using Two-Dimensional Impurity Imaging, Geochemistry, Geophysics, Geosystems, 24, e2022GC010595, https://doi.org/10.1029/2022GC010595, 2023. a, b, c, d, e, f, g
Bohleber, P., Larkman, P., Stoll, N., Clases, D., Gonzalez de Vega, R., Šala, M., Roman, M., and Barbante, C.: Quantitative Insights on Impurities in Ice Cores at the Micro-Scale From Calibrated LA-ICP-MS Imaging, Geochemistry, Geophysics, Geosystems, 25, e2023GC011425, https://doi.org/10.1029/2023GC011425, 2024. a, b
Bohleber, P., Stoll, N., Larkman, P., Rhodes, R. H., and Clases, D.: New evidence on the microstructural localization of sulfur and chlorine in polar ice cores with implications for impurity diffusion, The Cryosphere, 19, 5485–5498, https://doi.org/10.5194/tc-19-5485-2025, 2025. a
Bolea, E., Jimenez, M. S., Perez-Arantegui, J., Vidal, J. C., Bakir, M., Ben-Jeddou, K., Gimenez-Ingalaturre, A. C., Ojeda, D., Trujillo, C., and Laborda, F.: Analytical applications of single particle inductively coupled plasma mass spectrometry: a comprehensive and critical review, Analytical Methods, 13, 2742–2795, https://doi.org/10.1039/D1AY00761K, 2021. a
Broecker, W. S.: Was the Medieval Warm Period Global?, Science, 291, 1497–1499, https://doi.org/10.1126/science.291.5508.1497, 2001. a
Clases, D. and Gonzalez de Vega, R.: Facets of ICP-MS and their potential in the medical sciences – Part 2: nanomedicine, immunochemistry, mass cytometry, and bioassays, Analytical and Bioanalytical Chemistry, 414, 7363–7386, https://doi.org/10.1007/s00216-022-04260-8, 2022. a
Della Lunga, D., Müller, W., Rasmussen, S. O., Svensson, A., and Vallelonga, P.: Calibrated cryo-cell UV-LA-ICPMS elemental concentrations from the NGRIP ice core reveal abrupt, sub-annual variability in dust across the GI-21.2 interstadial period, The Cryosphere, 11, 1297–1309, https://doi.org/10.5194/tc-11-1297-2017, 2017. a
Delmonte, B., Petit, J. R., and Maggi, V.: LGM–Holocene changes and Holocene millennial-scale oscillations of dust particles in the EPICA Dome C ice core, East Antarctica, Annals of Glaciology, 35, 306–312, https://doi.org/10.3189/172756402781816843, 2002. a
Delmonte, B., Basile-Doelsch, I., Petit, J. R., Maggi, V., Revel-Rolland, M., Michard, A., Jagoutz, E., and Grousset, F.: Comparing the Epica and Vostok dust records during the last 220,000 years: stratigraphical correlation and provenance in glacial periods, Earth-Science Reviews, 66, 63–87, https://doi.org/10.1016/j.earscirev.2003.10.004, 2004. a
Eichler, J., Weikusat, C., Wegner, A., Twarloh, B., Behrens, M., Fischer, H., Hörhold, M., Jansen, D., Kipfstuhl, S., Ruth, U., Wilhelms, F., and Weikusat, I.: Impurity Analysis and Microstructure Along the Climatic Transition From MIS 6 Into 5e in the EDML Ice Core Using Cryo-Raman Microscopy, Frontiers in Earth Science, 7, 1–16, https://doi.org/10.3389/feart.2019.00020, 2019. a, b
Erhardt, T., Jensen, C. M., Borovinskaya, O., and Fischer, H.: Single Particle Characterization and Total Elemental Concentration Measurements in Polar Ice Using Continuous Flow Analysis-Inductively Coupled Plasma Time-of-Flight Mass Spectrometry, Environmental Science & Technology, 53, 13275–13283, https://doi.org/10.1021/acs.est.9b03886, 2019. a
Faria, S. H., Freitag, J., and Kipfstuhl, S.: Polar ice structure and the integrity of ice-core paleoclimate records, Quaternary Science Reviews, 29, 338–351, https://doi.org/10.1016/j.quascirev.2009.10.016, 2010. a
Fischer, H., Severinghaus, J., Brook, E., Wolff, E., Albert, M., Alemany, O., Arthern, R., Bentley, C., Blankenship, D., Chappellaz, J., Creyts, T., Dahl-Jensen, D., Dinn, M., Frezzotti, M., Fujita, S., Gallee, H., Hindmarsh, R., Hudspeth, D., Jugie, G., Kawamura, K., Lipenkov, V., Miller, H., Mulvaney, R., Parrenin, F., Pattyn, F., Ritz, C., Schwander, J., Steinhage, D., van Ommen, T., and Wilhelms, F.: Where to find 1.5 million yr old ice for the IPICS ”Oldest-Ice” ice core, Clim. Past, 9, 2489–2505, https://doi.org/10.5194/cp-9-2489-2013, 2013. a
Fuchs, J., Aghaei, M., Schachel, T. D., Sperling, M., Bogaerts, A., and Karst, U.: Impact of the Particle Diameter on Ion Cloud Formation from Gold Nanoparticles in ICPMS, Analytical Chemistry, 90, 10271–10278, https://doi.org/10.1021/acs.analchem.8b02007, 2018. a
Fukazawa, H., Suzuki, D., Ikeda, T., Mae, S., and Hondoh, T.: Raman Spectra of Translational Lattice Vibrations in Polar Ice, The Journal of Physical Chemistry B, 101, 6184–6187, https://doi.org/10.1021/jp963161r, 1997. a
Gabrielli, P., Barbante, C., Boutron, C., Cozzi, G., Gaspari, V., Planchon, F., Ferrari, C., Turetta, C., Hong, S., and Cescon, P.: Variations in atmospheric trace elements in Dome C (East Antarctica) ice over the last two climatic cycles, Atmospheric Environment, 39, 6420–6429, https://doi.org/10.1016/j.atmosenv.2005.07.025, 2005. a
Gabrielli, P., Cozzi, G., Torcini, S., Cescon, P., and Barbante, C.: Trace elements in winter snow of the Dolomites (Italy): A statistical study of natural and anthropogenic contributions, Chemosphere, 72, 1504–1509, https://doi.org/10.1016/j.chemosphere.2008.04.076, 2008. a
Gonzalez de Vega, R., Lockwood, T. E., Xu, X., Gonzalez de Vega, C., Scholz, J., Horstmann, M., Doble, P. A., and Clases, D.: Analysis of Ti- and Pb-based particles in the aqueous environment of Melbourne (Australia) via single particle ICP-MS, Analytical and Bioanalytical Chemistry, 414, 5671–5681, https://doi.org/10.1007/s00216-022-04052-0, 2022. a
Gonzalez de Vega, R., Lockwood, T. E., Paton, L., Schlatt, L., and Clases, D.: Non-target analysis and characterisation of nanoparticles in spirits via single particle ICP-TOF-MS, Journal of Analytical Atomic Spectrometry, 38, 2656–2663, https://doi.org/10.1039/D3JA00253E, 2023. a, b
Goodman, A. J., Gundlach-Graham, A., Bevers, S. G., and Ranville, J. F.: Characterization of nano-scale mineral dust aerosols in snow by single particle inductively coupled plasma mass spectrometry, Environmental Science: Nano, 9, 2638–2652, https://doi.org/10.1039/D2EN00277A, 2022. a
Goosse, H., Arzel, O., Luterbacher, J., Mann, M. E., Renssen, H., Riedwyl, N., Timmermann, A., Xoplaki, E., and Wanner, H.: The origin of the European ”Medieval Warm Period”, Clim. Past, 2, 99–113, https://doi.org/10.5194/cp-2-99-2006, 2006. a
Kaufmann, P. R., Federer, U., Hutterli, M. A., Bigler, M., Schüpbach, S., Ruth, U., Schmitt, J., and Stocker, T. F.: An Improved Continuous Flow Analysis System for High-Resolution Field Measurements on Ice Cores, Environmental Science & Technology, 42, 8044–8050, https://doi.org/10.1021/es8007722, 2008. a
Kutuzov, S. S., Mikhalenko, V. N., Legrand, M., Khairedinova, A. G., Vorob’ev, M. A., and Vinogradova, M. M.: Promising Trends in Ice Core Research, Herald of the Russian Academy of Sciences, 92, 370–379, https://doi.org/10.1134/S1019331622030121, 2022. a
Laborda, F., Abad-Álvaro, I., Jiménez, M. S., and Bolea, E.: Catching particles by atomic spectrometry: Benefits and limitations of single particle - inductively coupled plasma mass spectrometry, Spectrochimica Acta Part B: Atomic Spectroscopy, 199, 106570, https://doi.org/10.1016/j.sab.2022.106570, 2023. a
Lambert, F., Delmonte, B., Petit, J. R., Bigler, M., Kaufmann, P. R., Hutterli, M. A., Stocker, T. F., Ruth, U., Steffensen, J. P., and Maggi, V.: Dust - Climate couplings over the past 800,000 years from the EPICA Dome C ice core, Nature, 452, 616–619, https://doi.org/10.1038/nature06763, 2008. a
Larkman, P., Rhodes, R. H., Stoll, N., Barbante, C., and Bohleber, P.: What does the impurity variability at the microscale represent in ice cores? Insights from a conceptual approach, The Cryosphere, 19, 1373–1390, https://doi.org/10.5194/tc-19-1373-2025, 2025. a
Lee, G., Erhardt, T., Zeppenfeld, C., Larkman, P., Bohleber, P., and Fischer, H.: Exploration of elemental details of single mineral dust particles in the EPICA Dome C ice core during interglacial and glacial periods, EGU General Assembly 2024, Vienna, Austria, 14–19 Apr 2024, EGU24-17433, https://doi.org/10.5194/egusphere-egu24-17433, 2024. a
Legrand, M. and Mayewski, P.: Glaciochemistry of polar ice cores: A review, Reviews of Geophysics, 35, 219–243, https://doi.org/10.1029/96RG03527, 1997. a
Li, W., Shao, L., Zhang, D., Ro, C.-U., Hu, M., Bi, X., Geng, H., Matsuki, A., Niu, H., and Chen, J.: A review of single aerosol particle studies in the atmosphere of East Asia: morphology, mixing state, source, and heterogeneous reactions, Journal of Cleaner Production, 112, 1330–1349, https://doi.org/10.1016/j.jclepro.2015.04.050, 2016. a
Lockwood, T. E., de Vega, R. G., and Clases, D.: An interactive Python-based data processing platform for single particle and single cell ICP-MS, Journal of Analytical Atomic Spectrometry, 36, 2536–2544, https://doi.org/10.1039/D1JA00297J, 2021. a, b, c, d, e
Lockwood, T. E., de Vega, R. G., Du, Z., Schlatt, L., Xu, X., and Clases, D.: Strategies to enhance figures of merit in ICP-ToF-MS, Journal of Analytical Atomic Spectrometry, 39, 227–234, https://doi.org/10.1039/D3JA00288H, 2024. a
Lockwood, T. E., Schlatt, L., and Clases, D.: SPCal – an open source, easy-to-use processing platform for ICP-TOFMS-based single event data, Journal of Analytical Atomic Spectrometry, 40, 130–136, https://doi.org/10.1039/D4JA00241E, 2025 (code available at: https://github.com/djdt/spcal, last access: 28 November 2025). a, b, c, d, e, f, g, h, i
Lomax-Vogt, M., Carter, L. M., Wielinski, J., Kutuzov, S., Lowry, G. V., Sullivan, R., Gabrielli, P., and Olesik, J. W.: Challenges in measuring nanoparticles and microparticles by single particle ICP-QMS and ICP-TOFMS: size-dependent transport efficiency and limited linear dynamic range, Journal of Analytical Atomic Spectrometry, 40, 848–859, https://doi.org/10.1039/D4JA00425F, 2025. a, b
Mahowald, N., Albani, S., Kok, J. F., Engelstaeder, S., Scanza, R., Ward, D. S., and Flanner, M. G.: The size distribution of desert dust aerosols and its impact on the Earth system, Aeolian Research, 15, 53–71, https://doi.org/10.1016/j.aeolia.2013.09.002, 2014. a, b
Martínez-Garcia, A., Rosell-Melé, A., Jaccard, S. L., Geibert, W., Sigman, D. M., and Haug, G. H.: Southern Ocean dust–climate coupling over the past four million years, Nature, 476, 312–315, https://doi.org/10.1038/nature10310, 2011. a
Mayewski, P. A., Rohling, E. E., Curt Stager, J., Karlén, W., Maasch, K. A., Meeker, L. D., Meyerson, E. A., Gasse, F., Van Kreveld, S., Holmgren, K., Lee-Thorp, J., Rosqvist, G., Rack, F., Staubwasser, M., Schneider, R. R., and Steig, E. J.: Holocene climate variability, Quaternary Research, 62, 243–255, https://doi.org/10.1016/j.yqres.2004.07.001, 2004. a
Neukom, R., Gergis, J., Karoly, D. J., Wanner, H., Curran, M., Elbert, J., González-Rouco, F., Linsley, B. K., Moy, A. D., Mundo, I., Raible, C. C., Steig, E. J., Van Ommen, T., Vance, T., Villalba, R., Zinke, J., and Frank, D.: Inter-hemispheric temperature variability over the past millennium, Nature Climate Change, 4, 362–367, https://doi.org/10.1038/nclimate2174, 2014. a
Neuper, C., Šimić, M., Lockwood, T. E., Gonzalez de Vega, R., Hohenester, U., Fitzek, H., Schlatt, L., Hill, C., and Clases, D.: Optofluidic Force Induction Meets Raman Spectroscopy and Inductively Coupled Plasma-Mass Spectrometry: A New Hyphenated Technique for Comprehensive and Complementary Characterizations of Single Particles, Analytical Chemistry, https://doi.org/10.1021/acs.analchem.3c04657, 2024. a
Ohno, H., Igarashi, M., and Hondoh, T.: Salt inclusions in polar ice core: Location and chemical form of water-soluble impurities, Earth and Planetary Science Letters, 232, 171–178, https://doi.org/10.1016/j.epsl.2005.01.001, 2005. a
Osman, M., Zawadowicz, M. A., Das, S. B., and Cziczo, D. J.: Real-time analysis of insoluble particles in glacial ice using single-particle mass spectrometry, Atmos. Meas. Tech., 10, 4459–4477, https://doi.org/10.5194/amt-10-4459-2017, 2017. a
Pace, H. E., Rogers, N. J., Jarolimek, C., Coleman, V. A., Higgins, C. P., and Ranville, J. F.: Determining Transport Efficiency for the Purpose of Counting and Sizing Nanoparticles via Single Particle Inductively Coupled Plasma Mass Spectrometry, Analytical Chemistry, https://doi.org/10.1021/ac201952t, 2011. a, b, c
Paterson, W. S. B.: Why ice-age ice is sometimes “soft”, Cold Regions Science and Technology, 20, 75–98, 1991. a
Petit, J.-R., Briat, M., and Royer, A.: Ice age aerosol content from East Antarctic ice core samples and past wind strength, Nature, 293, 391–394, https://doi.org/10.1038/293391a0, 1981. a
Peyneau, P.-E.: Statistical properties of spikes in single particle ICP-MS time scans, Journal of Analytical Atomic Spectrometry, 37, 2683–2690, https://doi.org/10.1039/D2JA00312K, 2022. a
Peyneau, P.-E. and Guillon, M.: Number of spikes in single particle ICP-MS time scans: from the very dilute to the highly concentrated range, Journal of Analytical Atomic Spectrometry, 36, 2460–2466, https://doi.org/10.1039/D1JA00156F, 2021. a, b
Potenza, M. A. C., Albani, S., Delmonte, B., Villa, S., Sanvito, T., Paroli, B., Pullia, A., Baccolo, G., Mahowald, N., and Maggi, V.: Shape and size constraints on dust optical properties from the Dome C ice core, Antarctica, Scientific Reports, 6, 28162, https://doi.org/10.1038/srep28162, 2016. a
Rasmussen, S. O., Abbott, P. M., Blunier, T., Bourne, A. J., Brook, E., Buchardt, S. L., Buizert, C., Chappellaz, J., Clausen, H. B., Cook, E., Dahl-Jensen, D., Davies, S. M., Guillevic, M., Kipfstuhl, S., Laepple, T., Seierstad, I. K., Severinghaus, J. P., Steffensen, J. P., Stowasser, C., Svensson, A., Vallelonga, P., Vinther, B. M., Wilhelms, F., and Winstrup, M.: A first chronology for the North Greenland Eemian Ice Drilling (NEEM) ice core, Clim. Past, 9, 2713–2730, https://doi.org/10.5194/cp-9-2713-2013, 2013. a
Rasmussen, S. O., Bigler, M., Blockley, S. P., Blunier, T., Buchardt, S. L., Clausen, H. B., Cvijanovic, I., Dahl-Jensen, D., Johnsen, S. J., Fischer, H., Gkinis, V., Guillevic, M., Hoek, W. Z., Lowe, J. J., Pedro, J. B., Popp, T., Seierstad, I. K., Steffensen, J. P., Svensson, A. M., Vallelonga, P., Vinther, B. M., Walker, M. J. C., Wheatley, J. J., and Winstrup, M.: A stratigraphic framework for abrupt climatic changes during the Last Glacial period based on three synchronized Greenland ice-core records: refining and extending the INTIMATE event stratigraphy, Quaternary Science Reviews, 106, 14–28, https://doi.org/10.1016/j.quascirev.2014.09.007, 2014. a, b, c
Röthlisberger, R., Bigler, M., Hutterli, M., Sommer, S., Stauffer, B., Junghans, H. G., and Wagenbach, D.: Technique for continuous high-resolution analysis of trace substances in firn and ice cores, Environmental Science and Technology, 34, 338–342, https://doi.org/10.1021/es9907055, 2000. a
Steffensen, J. P.: The size distribution of microparticles from selected segments of the Greenland Ice Core Project ice core representing different climatic periods, Journal of Geophysical Research, 102, 26755–26763, 1997. a, b
Stevens, R. and Dastoor, A.: A Review of the Representation of Aerosol Mixing State in Atmospheric Models, Atmosphere, 10, 168, https://doi.org/10.3390/atmos10040168, 2019. a
Stoll, N., Eichler, J., Hörhold, M., Erhardt, T., Jensen, C., and Weikusat, I.: Microstructure, micro-inclusions, and mineralogy along the EGRIP ice core – Part 1: Localisation of inclusions and deformation patterns, The Cryosphere, 15, 5717–5737, https://doi.org/10.5194/tc-15-5717-2021, 2021a. a, b, c, d, e
Stoll, N., Eichler, J., Hörhold, M., Shigeyama, W., and Weikusat, I.: A Review of the Microstructural Location of Impurities and Their Impacts on Deformation, Frontiers in Earth Science, 8, https://doi.org/10.3389/feart.2020.615613, 2021b. a
Stoll, N., Hörhold, M., Erhardt, T., Eichler, J., Jensen, C., and Weikusat, I.: Microstructure, micro-inclusions, and mineralogy along the EGRIP (East Greenland Ice Core Project) ice core – Part 2: Implications for palaeo-mineralogy, The Cryosphere, 16, 667–688, https://doi.org/10.5194/tc-16-667-2022, 2022. a, b, c, d, e, f, g, h, i, j, k, l, m, n, o, p, q
Stoll, N., Bohleber, P., Dallmayr, R., Wilhelms, F., Barbante, C., and Weikusat, I.: The new frontier of microstructural impurity research in polar ice, Annals of Glaciology, 1–4, https://doi.org/10.1017/aog.2023.61, 2023a. a
Stoll, N., Westhoff, J., Bohleber, P., Svensson, A., Dahl-Jensen, D., Barbante, C., and Weikusat, I.: Chemical and visual characterisation of EGRIP glacial ice and cloudy bands within, The Cryosphere, 17, 2021–2043, https://doi.org/10.5194/tc-17-2021-2023, 2023b. a, b, c, d, e, f, g, h, i, j, k, l, m, n, o, p, q, r
Stoll, N., Weikusat, I., Jansen, D., Bons, P., Darányi, K., Westhoff, J., Llorens, M.-G., Wallis, D., Eichler, J., Saruya, T., Homma, T., Rasmussen, S. O., Sinnl, G., Svensson, A., Drury, M., Wilhelms, F., Kipfstuhl, S., Dahl-Jensen, D., and Kerch, J.: Linking crystallographic orientation and ice stream dynamics: evidence from the EastGRIP ice core, The Cryosphere, 19, 3805–3830, https://doi.org/10.5194/tc-19-3805-2025, 2025a. a, b
Stoll, N., Clases, D., Gonzalez de Vega, R., Elinkmann, M., Larkman, P., and Bohleber, P.: Supporting data for manuscript “Single particle ICP-TOFMS on previously characterised EGRIP ice core samples: new approaches, limitations, and challenges”, Zenodo [data set], https://doi.org/10.5281/zenodo.18038801 2025b. a
Svensson, A., Biscaye, P. E., and Grousset, F. E.: Characterization of late glacial continental dust in the Greenland Ice Core Project ice core, Journal of Geophysical Research: Atmospheres, 105, 4637–4656, https://doi.org/10.1029/1999JD901093, 2000. a
Tegen, I. and Lacis, A. A.: Modeling of particle size distribution and its influence on the radiative properties of mineral dust aerosol, Journal of Geophysical Research: Atmospheres, 101, 19237–19244, https://doi.org/10.1029/95JD03610, 1996. a, b
Tharaud, M., Schlatt, L., Shaw, P., and Benedetti, M. F.: Nanoparticle identification using single particle ICP-ToF-MS acquisition coupled to cluster analysis. From engineered to natural nanoparticles, Journal of Analytical Atomic Spectrometry, 37, 2042–2052, https://doi.org/10.1039/D2JA00116K, 2022. a, b, c
Újvári, G., Klötzli, U., Stevens, T., Svensson, A., Ludwig, P., Vennemann, T., Gier, S., Horschinegg, M., Palcsu, L., Hippler, D., Kovács, J., Di Biagio, C., and Formenti, P.: Greenland Ice Core Record of Last Glacial Dust Sources and Atmospheric Circulation, Journal of Geophysical Research: Atmospheres, 127, e2022JD036597, https://doi.org/10.1029/2022JD036597, 2022. a
Vallelonga, P. and Svensson, A.: Ice Core Archives of Mineral Dust, in: Mineral Dust: A Key Player in the Earth System, edited by Knippertz, P. and Stuut, J.-B. W., Springer Netherlands, Dordrecht, 463–485, ISBN 978-94-017-8978-3, https://doi.org/10.1007/978-94-017-8978-3_18, 2014. a, b, c
Van de Velde, K., Barbante, C., Cozzi, G., Moret, I., Bellomi, T., Ferrari, C., and Boutron, C.: Changes in the occurrence of silver, gold, platinum, palladium and rhodium in Mont Blanc ice and snow since the 18th century, Atmospheric Environment, 34, 3117–3127, https://doi.org/10.1016/S1352-2310(99)00434-3, 2000. a
Wegner, A., Fischer, H., Delmonte, B., Petit, J.-R., Erhardt, T., Ruth, U., Svensson, A., Vinther, B., and Miller, H.: The role of seasonality of mineral dust concentration and size on glacial/interglacial dust changes in the EPICA Dronning Maud Land ice core, Journal of Geophysical Research: Atmospheres, 120, 9916–9931, https://doi.org/10.1002/2015JD023608, 2015. a
Wolff, E. W., Fischer, H., van Ommen, T., and Hodell, D. A.: Stratigraphic templates for ice core records of the past 1.5 Myr, Clim. Past, 18, 1563–1577, https://doi.org/10.5194/cp-18-1563-2022, 2022. a, b
Zeppenfeld, C., Erhardt, T., Jensen, C. M., and Fischer, H.: Continuous Characterization of Insoluble Particles in Ice Cores Using the Single-Particle Extinction and Scattering Method, Environmental Science & Technology, 59, 328–336, https://doi.org/10.1021/acs.est.4c07098, 2025. a, b