the Creative Commons Attribution 4.0 License.
the Creative Commons Attribution 4.0 License.
 | 26 Jan 2026
Numerical simulation of a severe blowing snow event over the Prydz Bay Region
Jinfeng Ding
Yuan Shang
Yulong Shan
Jingkai Ma
Xichuan Liu
Xiaoqiao Wang
Antarctic blowing snow is a critical process regulating the mass balance of the ice sheet. From 15–17 July 2022, a mid-latitude cyclone invaded the Prydz Bay region of East Antarctica. Automatic weather stations at Zhongshan Station recorded a maximum minute-averaged wind speed exceeding 30 m s−1, while lidar ceilometer data and manual observations indicated that blowing snow persisted for approximately 36 h, marking the most intense blowing snow event of that year. This study reproduced the process using the CRYOWRF model and found that the strong winds induced by the cyclone triggered blowing snow and generated complex nonlinear motions under the influence of local topography, in turn shaping the transport of blowing snow. Topographically forced strong winds also triggered heavy snowfall, which replenished the wind-eroded snow layer. After deposition, this snow was more easily entrained by winds, mixing with falling snow to form blizzards. These results highlight the complexity of blowing snow processes in Antarctic coastal zones, which encompass topographic forcing on atmospheric circulation as well as dynamic feedback between snowfall and blowing snow. Therefore, adopting high-resolution non-hydrostatic numerical models combined with multi-source observations to accurately capture the key physical details of this complex process is of irreplaceable significance for the precise assessment of the Antarctic regional surface mass balance.
- Article
(16792 KB) - Full-text XML
- BibTeX
- EndNote


Antarctica, as the coldest continent on Earth, is characterized by its unique ice-snow underlying surface, strong surface temperature inversion layer, and topography, which jointly shape the katabatic winds that prevail almost throughout the continent all year round (Parish and Bromwich, 1987). During their movement, winds can cause snow particles on the surface of the ice sheet to saltate and detach from the snowpack through stress, and then be entrained into the atmospheric boundary layer by turbulent eddies for further transport, forming blowing snow. Blowing snow is a very common phenomenon in Antarctica, which has a major impact on mass balance primarily through redistribution of snow and enhanced sublimation (Gallée et al., 2001; Déry and Yau, 2002; Lenaerts et al., 2012).
The Antarctic marginal zone is a high-frequency area for blowing snow events, which is closely related to the acceleration of katabatic winds affected by the steep topography (Parish and Cassano, 2003; Palm et al., 2017). Based on the response of blowing snow layers to the backscatter signal intensity and depolarization ratio of the Cloud Aerosol Lidar and Infrared Pathfinder Satellite Observations (CALIPSO), it has been found that the frequency of blowing snow increases notably when the wind speed exceeds 4 m s−1, and the blowing snow events over the austral winter even exceeds 70 % in the coastal areas of East Antarctica (Palm et al., 2011). Multi-year in-situ observations conducted at sites D47 and D17 in Adélie Land, East Antarctica, further confirm this trend of blowing snow frequency being dependent on wind speed, while also highlighting topography as the dominant factor regulating the horizontal transport of blowing snow (Amory, 2020).
In addition, winds can also drive the three-dimensional transport of blowing snow under topographic forcing. Using ground observations, satellite data, and Weather Research and Forecasting (WRF) simulations, Vignon et al. (2020) found that katabatic winds crossing abrupt topographic transitions can trigger gravity waves, lifting snow to ∼1 km and forming a blowing snow wall. Similar phenomena also exhibit snow billow characteristics in Moderate-resolution Imaging Spectroradiometer (MODIS) images over Terra Nova Bay; the billows reach a vertical height of 200 m, extend horizontally for tens to 200 km, and have a wavelength of 5–10 km, consistent with gravity wave activities over steep terrain (Scarchilli et al., 2010). Therefore, although wind is the driving factor for blowing snow formation, topographic setting strongly modulates the transport, leading to pronounced local variability.
The Antarctic marginal zone serves as a transitional area connecting the Antarctic continent and the Southern Ocean, frequently influenced by local polar lows (Stoll, 2022) or mid-latitude cyclone intrusions (Priestley et al., 2020). These intense meso- and microscale weather systems can enhance the horizontal pressure gradient between the ice sheet and the open ocean, thereby significantly strengthening katabatic winds. Consequently, most coastal strong wind events are associated with cyclone-induced enhancement of katabatic winds (Turner et al., 2009). More importantly, cyclones also deliver heavy snowfall, increasing the supply of transport-ready snow for blowing snow events. At Princess Elisabeth Station, ∼70 % of snowfall coincides with cyclone activities, and prolonged snowfall expands the snow-covered area, making upstream snow more likely to be transported to the station by wind (Souverijns et al., 2018). Further observations at Neumayer III Station reveal that 92 % of blowing snow events are closely related to cyclone-induced snowfall (Gossart et al., 2017). A similar phenomenon has recently been confirmed in lidar ceilometer observations at China's Zhongshan Station (St. ZS) in Antarctica (Ye et al., 2025). Additionally, the physical properties (such as dendricity, density, sphericity, and particle sizes) of the snowpack surface layer undergo dynamic changes due to wind erosion and compaction, which in turn affects the accurate assessment of blowing snow flux (Lehning et al., 2000; Gallée et al., 2001; Clifton et al., 2006). In summary, blowing snow events under the influence of synoptic-scale cyclones reflect the interplay among wind, snowfall, snow accumulation, and topography. Accurately describing the physical processes involved is of great significance for understanding the surface mass balance in different regions of Antarctica.
During 15–17 July 2022, as a cyclone invaded the Prydz Bay in East Antarctica, a severe blowing snow event struck St. ZS. The automatic surface observation station recorded a maximum minute-averaged wind speed exceeding 30 m s−1, while the lidar ceilometer and manual observations indicated that blowing snow persisted for approximately 36 h, making it one of the strongest blowing snow events affecting St. ZS in 2022. Due to limited historical observations, few relevant studies have been published on this station; thus, this typical case offers an excellent opportunity to investigate the blowing snow process under a cyclone background and its implications for regional surface mass balance. To achieve this research goal, blowing snow models are indispensable. Some early efforts have developed blowing snow models from observations and empirical fits (Pomeroy et al., 1993; Déry and Yau, 1999; Essery et al., 1999), which have been transplanted into regional climate models as parameterization schemes, such as RACMO (van Wessem et al., 2018; Lenaerts et al., 2012) and MAR (Amory et al., 2015). However, due to the fact that the resolution of regional climate models is usually insufficient to finely resolve the wind field under rugged terrain, and most of them adopt a hydrostatic equilibrium dynamic framework, the simulation of blowing snow under such conditions may deviate from the actual situation (Amory et al., 2021; Lenaerts and van den Broeke 2012). Indeed, Gerber et al. (2023) demonstrated that these limitations, often coupled with simplified physical representations such as the omission of horizontal advection of blowing snow particles (e.g., in RACMO), lead to a systematic underestimation of blowing snow mass fluxes. Recently, the fully open-source CRYOWRF model (Sharma et al., 2023) has realized the two-way online coupling between WRF and the high-complexity snow model SNOWPACK (Bartelt and Lehning, 2002). The non-hydrostatic WRF framework is well suited to finely resolving flow fields such as gravity waves and hydraulic jumps in complex terrain. Combined with the adopted blowing snow double-moment scheme, CRYOWRF can quantitatively simulate blowing snow physics within dynamic flow fields.
In this study, CRYOWRF is employed to examine in detail the occurrence and evolution of this extreme event, and to clarify the relationships between blowing snow and various factors such as synoptic background, terrain, strong winds, and snowfall. By comparing simulations with observations and conducting sensitivity experiments, we aim to provide guidance for improving the accuracy of blowing snow simulations in the future. The paper is organized as follows: Section 2 introduces the data and model; Sect. 3 outlines the synoptic background and observation results; Sect. 4 analyzes the detailed process of the event; Sect. 5 presents the discussion and conclusions.
2.1 ERA5 Reanalysis Data
ERA5 is the fifth-generation global atmospheric reanalysis dataset produced by the Copernicus Climate Change Service (C3S) of the European Centre for Medium-Range Weather Forecasts (ECMWF). It covers climate data from January 1940 to the present (Hersbach et al., 2020). Due to its high precision, high-resolution, long-time span, and diverse parameter types, it has become an essential tool in multiple fields such as meteorological forecasting, climate simulation, environmental monitoring, and climate change research. The ERA5 dataset provides global meteorological variables on a 0.25° grid at hourly intervals across pressure levels ranging from 1000–1 hPa. In this study, three-hourly pressure-level data and land surface data were used as background fields and boundary conditions to jointly drive the numerical model.
2.2 Field Observation Data
This study primarily uses two automatic observations from an automatic weather station (AWS) and a ceilometer (C12), both installed at St. ZS, which is located on the Rasman Hills of Princess Elizabeth Land, southeastern Antarctica, along the southeast coast of Prydz Bay (69°22′24.7′′ S, 76°22′14.2′′ E; see Fig. 1). The AWS is included in the World Meteorological Organization (WMO)'s Antarctic Basic Synoptic Network (ABSN) and Antarctic Basic Climatological Network (ABCN), and also integrated into the Global Climate Observing System Surface Network (GSN); it has an international meteorological station number of 89 573 and is operationally maintained by the China Meteorological Administration. The data provided by this AWS and used in this study includes minute-by-minute measurements of surface wind speed, wind direction, pressure, and temperature. The C12 ceilometer, deployed since January 2022, serves as an all-weather cloud measurement sensor; it continuously monitors cloud base height and thickness, and outputs vertical visibility during obscured sky conditions. Employing 905 nm Mie-scattering LiDAR technology, the ceilometer emits vertical pulse signals every minute, receiving scattered signals from blowing snow, snowfall, clouds, and fog to generate 12 000 m vertical analog-digital signals with 5 m range gates. The raw signal strength correlates with airborne particulate concentration and size, enabling 5 m resolution for cloud height and vertical visibility (with a measurement uncertainty of ±15 m). Featuring a sloped south-facing window to avoid direct sunlight, the ceilometer incorporates lens contamination detection and automatic heating for ice/snow removal, ensuring stable operation in Antarctica's extreme winds and temperatures (Ye et al., 2025).
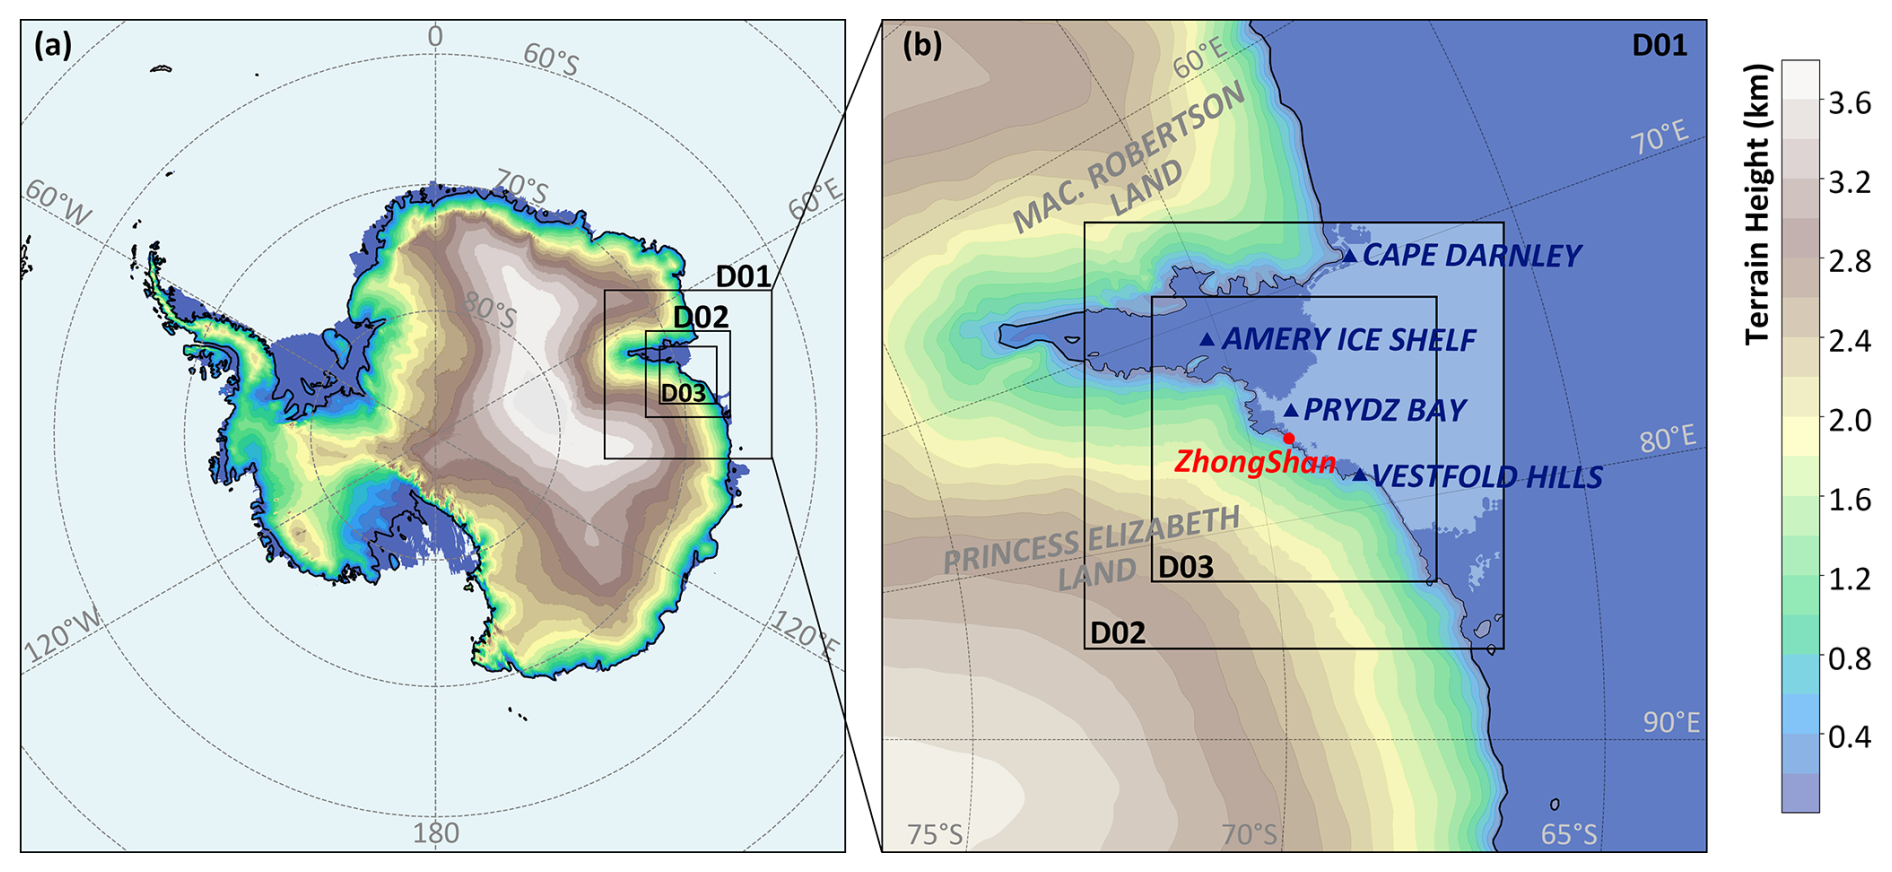
Figure 1Model domain and corresponding topographic distribution for the three nested domains: D01, D02, and D03. The model utilizes a triple-nested setup with horizontal grid resolutions of 12 km for the outermost domain (D01), 4 km for the intermediate domain (D02), and 1 km for the innermost domain (D03).
Additionally, this study uses manual observation records from meteorological staff to assist in validating on-site weather conditions. These records mainly document the duration of daily weather phenomena, including blowing snow, snowfall, blizzard, and clear-sky conditions, with measurements taken every 6 h starting from 00:00 UTC daily.
2.3 Satellite Remote Sensing Data
Thermal infrared channel data from Band 31 (central wavelength of 11.03 µm) obtained by the Moderate Resolution Imaging Spectroradiometer (MODIS) payload aboard the Terra and Aqua Earth-observing satellites is also used to observe the movement of the cyclone. The data has a spatial resolution of 1 km×1 km and a swath width of 2330 km. Based on this data, infrared brightness temperature images of the area around Prydz Bay during the event were generated to visually reflect the brightness temperature of the surface or cloud tops.
2.4 Model Description and Case Simulation Configuration
The CRYOWRF model (Sharma et al., 2023) is a multi-scale atmospheric-snowpack coupling simulation framework specifically developed for the cryosphere (such as snow cover, glaciers, ice sheets and other regions). Its core integrates the mainstream mesoscale atmospheric model WRF with the high-complexity SNOWPACK model through online coupling technology, and introduces a new blowing snow parameterization scheme to achieve snow-atmosphere interaction simulation from synoptic scale to turbulent scale. The model aims to address the problems of simplified snow processes and missing blowing snow effects in traditional models. Among them, SNOWPACK can resolve the vertical stratification of snowpack and particle scale processes, such as the physical processes of snow density, temperature, and grain morphology evolution. In addition, bidirectional real-time interaction between the atmosphere and snowpack is realized, that is, WRF provides driving data such as wind and radiation to SNOWPACK, and SNOWPACK feeds back surface albedo, sensible/latent heat flux and snowpack status (such as erosion/deposition amount) to achieve mass and energy conservation. In terms of blowing snow simulation, by introducing a double-moment blowing snow scheme in WRF cloud microphysical parameterization, the ability to simulate the mass mixing ratio and number concentration of blowing snow particles in WRF is realized.
The model domain features a triple-nested configuration with horizontal grid resolutions of 12, 4, and 1 km, comprising grid sizes of 123×124, 187×190, and 505×505, respectively; its configuration is illustrated in Fig. 1. Vertically, it employs 69 vertical layers with the model top set at 50 hPa. For parameterization schemes, both long-wave and short-wave radiation are handled by the RRTMG (Rapid Radiative Transfer Model for General Circulation Models) scheme (Iacono et al., 2008). The planetary boundary layer is resolved by the MYNN 2.5-level TKE (Turbulent Kinetic Energy) scheme (Nakanishi and Niino, 2004). The Morrison double-moment microphysics scheme is applied for microphysical parameterization (Morrison et al., 2005), and the Kain–Fritsch (new Eta) scheme is used for cumulus convection parameterization (Kain, 2004). The land surface component employs the SNOWPACK module, with snow cover initialization data derived from the Firn Densification Model (FDM; Ligtenberg et al., 2011). FDM is driven by RACMO 2.3 (van Wessem et al., 2018), which provides vertical profile data of snow layer thickness, density, and temperature across the entire Antarctic continent, along with snow grain radius data. The detailed configuration of the SNOWPACK model in this study strictly follows Case Ia as described in Sharma et al. (2023). The simulation was initiated at 12:00 UTC on 14 July 2022, running for 60 h. Notably, the first 12 h of this simulation served as a spin-up phase, and results from this period were excluded from the analysis.
Figure 2 depicts the circulation background fields at the 500 and 850 hPa pressure levels during the period from 00:00 UTC on 15 July 2022 to 00:00 UTC on 17 July 2022, as derived from ERA5 data. At 00:00 UTC on 15 July 2022, an incipient extratropical cyclone was positioned near (58.8° S, 62.0° E); a fully developed closed circulation center had already manifested at the 850 hPa, whereas the corresponding closed center structure at 500 hPa was in its nascent stage (Fig. 2a and d). Under the steering influence of an upper-level trough, the extratropical cyclone commenced its trajectory towards the Prydz Bay region of the Antarctic continent. By 00:00 UTC on 16 July 2022, a complete rotational structure of the cyclone was observed from the 850 hPa to the 500 hPa levels, and its center was approaching the Cape Darnley in the north, located on the western side of the Amery Ice Shelf (Fig. 2b and e). At 850 hPa, the cyclone carried a strong maritime warm advection, resulting in a significant temperature rise in Prydz Bay and along the continental margin to its east (Fig. 2e). At 500 hPa, the warm ridge had extended deep into the upper atmosphere of the continent, reaching approximately 75° S (Fig. 2b). Thereafter, during the process of the cyclone making landfall on the Antarctic continent, under the combined influence of unfavorable factors such as topographic friction and the entrainment of cold air masses, the intensity of the core part of the cyclone began to decrease rapidly. As can be seen from the situation at 00:00 UTC on 17 July 2022, the air pressure at the cyclone center started to rise, the temperature dropped, and the wind force in the periphery decreased significantly (Fig. 2c and f). The cyclone dissipated within the following one day.
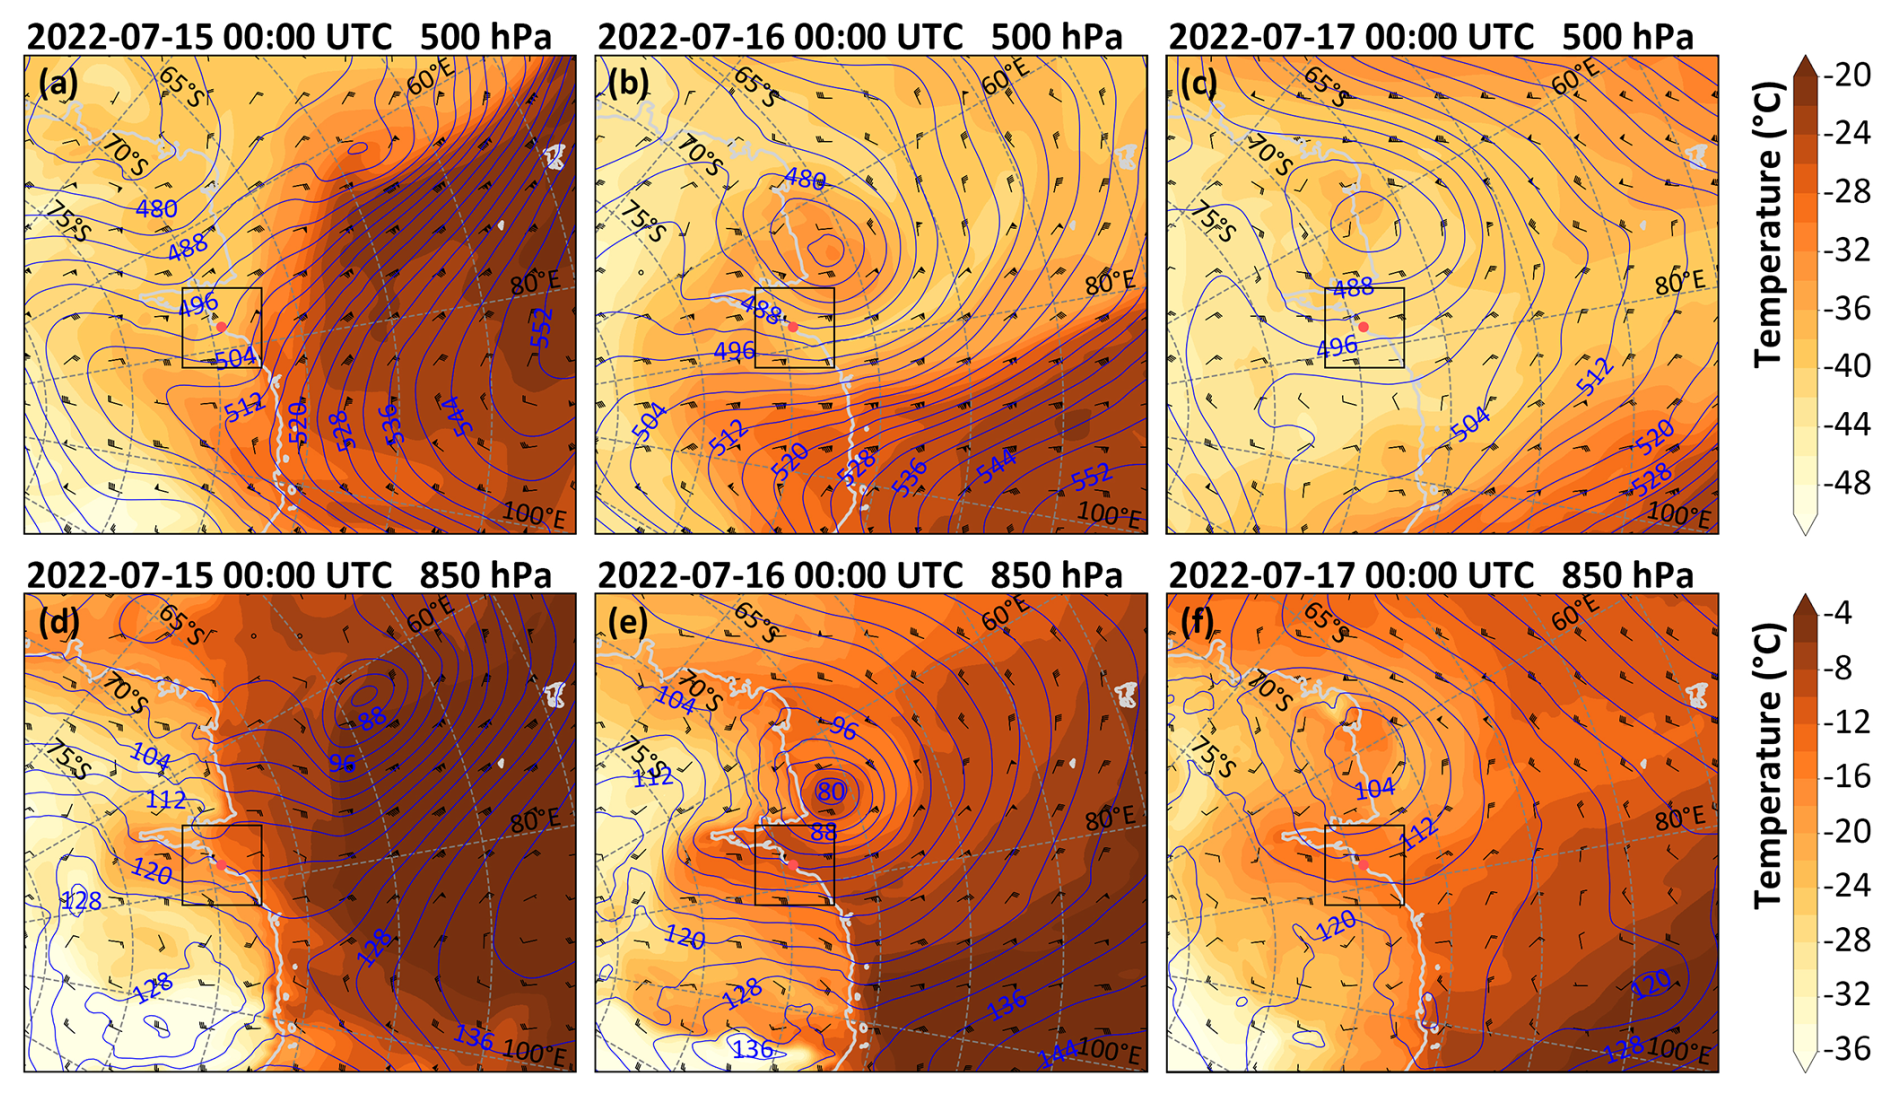
Figure 2Distribution of geopotential metre (gpm, blue solid lines), temperature (color shading), and wind vectors (triangular pennants representing 20 m s−1, long horizontal bars indicating 4 m s−1, and short horizontal bars denoting 2 m s−1) at 500 hPa (a–c) and 850 hPa (d–f) from 00:00 UTC on 15 July 2022 to 00:00 UTC on 17 July 2022, as derived from ERA5 data. The red dot in these subplots represents the location of St. ZS. The black rectangles denote the d03 domain of the model simulation.
Figure 3 shows the time-varying conditions of wind speed, wind direction, temperature, and sea level pressure obtained from the AWS and the model simulation at St. ZS. According to the surface wind observations, the event can be roughly divided into three characteristic stages. The first stage is prior to 11:00 UTC on 15 July 2022. Throughout this period, even though there was a notable decrease in sea level pressure, the wind speed at St. ZS remained at a relatively low magnitude, and there was also a gentle breeze (wind ) that persisted for several hours, dominated by easterly to east-southeasterly winds with obvious directional oscillation (90–110°). The second stage was from 11:00 UTC on 15 July 2022 to 00:00 UTC on 16 July 2022. During this period, as the sea level pressure continued to drop, the wind speed surged, indicating that the core wind speed area of the cyclone had affected the station area. The surface wind speed reached its maximum of 30 m s−1 at 15:00 UTC on 15 July 2022. Meanwhile, after the wind speed exceeded 15 m s−1, the wind direction remained stable at around 65°. Furthermore, during this stage, the temperature kept rising; in fact, the significant temperature increase preceded the wind speed surge and began in the middle of the first stage. The third stage was from 00:00 UTC on 16 July 2022 to 00:00 UTC on 17 July 2022 (the end of the simulation). During this time, accompanied by the rising rate of sea level pressure, the wind speed decreased in tandem, and the wind direction remained stable, indicating that the influence of the cyclone was weakening.
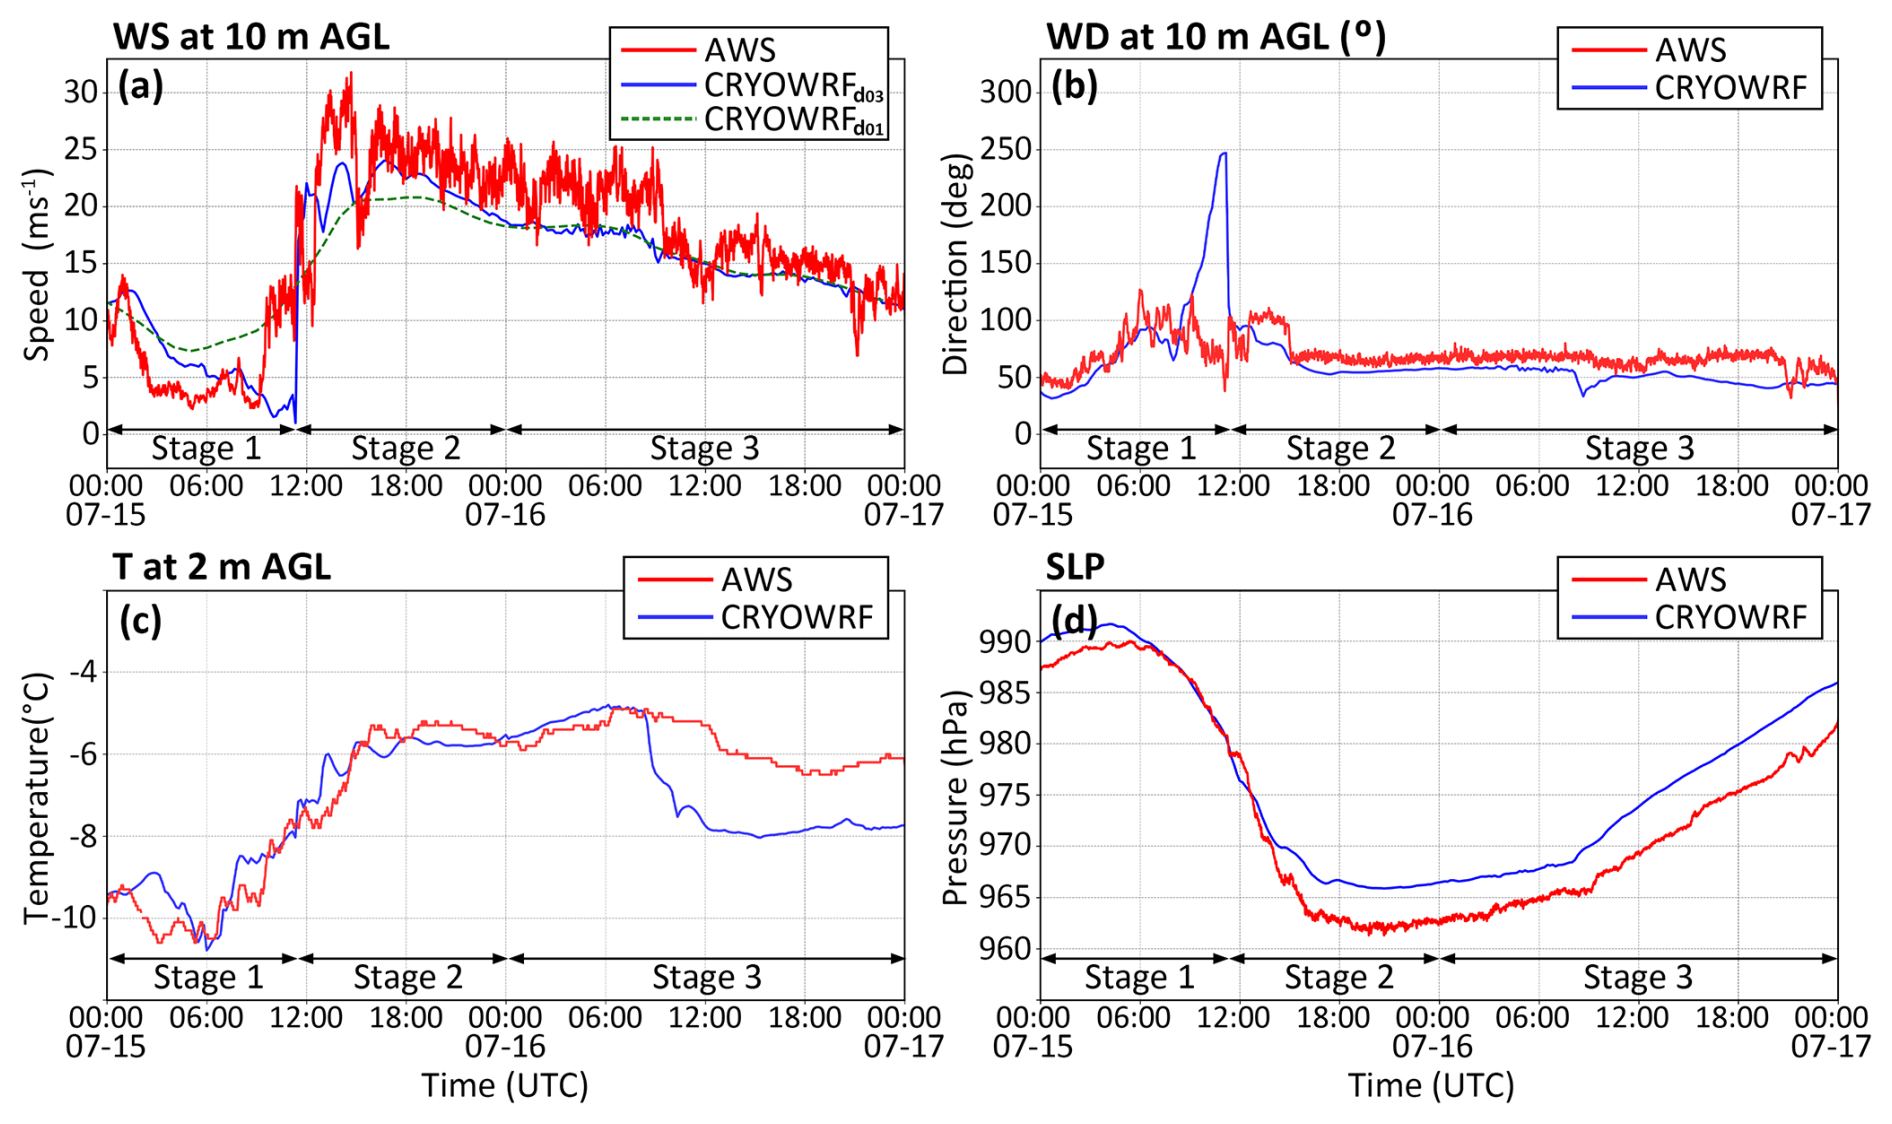
Figure 3Time series of (a) wind speed and (b) wind direction at a height of 10 m above the ground (AGL), (c) temperature at a height of 2 m a.g.l. (above ground level), and (d) sea level pressure obtained from the automatic weather station and model simulations at St. ZS.
The model simulation results are in good agreement with observations in terms of trends, with the following mean biases between simulated and observed values: for 10 m wind speed, −8.92° for 10 m wind direction, −0.48 °C for 2 m air temperature, and 3.02 hPa for sea-level pressure. Aside from a certain degree of underestimation in wind speed, two notable discrepancies remain. The first occurs in wind direction between 09:00 and 11:00 UTC on 15 July 2022, which may be attributed to extremely low wind speeds during this period, simulation results are highly susceptible to local topographic or thermal disturbances under such conditions, leading to disordered fluctuations in wind direction. The second discrepancy appears after 08:00 UTC on 16 July 2022; while the surface temperature decreases in both the simulation and observations, the simulated temperature decline is more pronounced than that observed.
To facilitate readers in establishing a macro understanding of the event's background, topographic features, and circulation characteristics based on the aforementioned three stages, a schematic diagram of the entire event's evolutionary process (Fig. 4) is presented herein in advance of the detailed observational and simulation analyses in the subsequent chapter. It is intended to distill the key features of each stage, thereby aiming to provide clear guidance for the refined phase-by-phase analyses and mechanism discussions in the following sections.
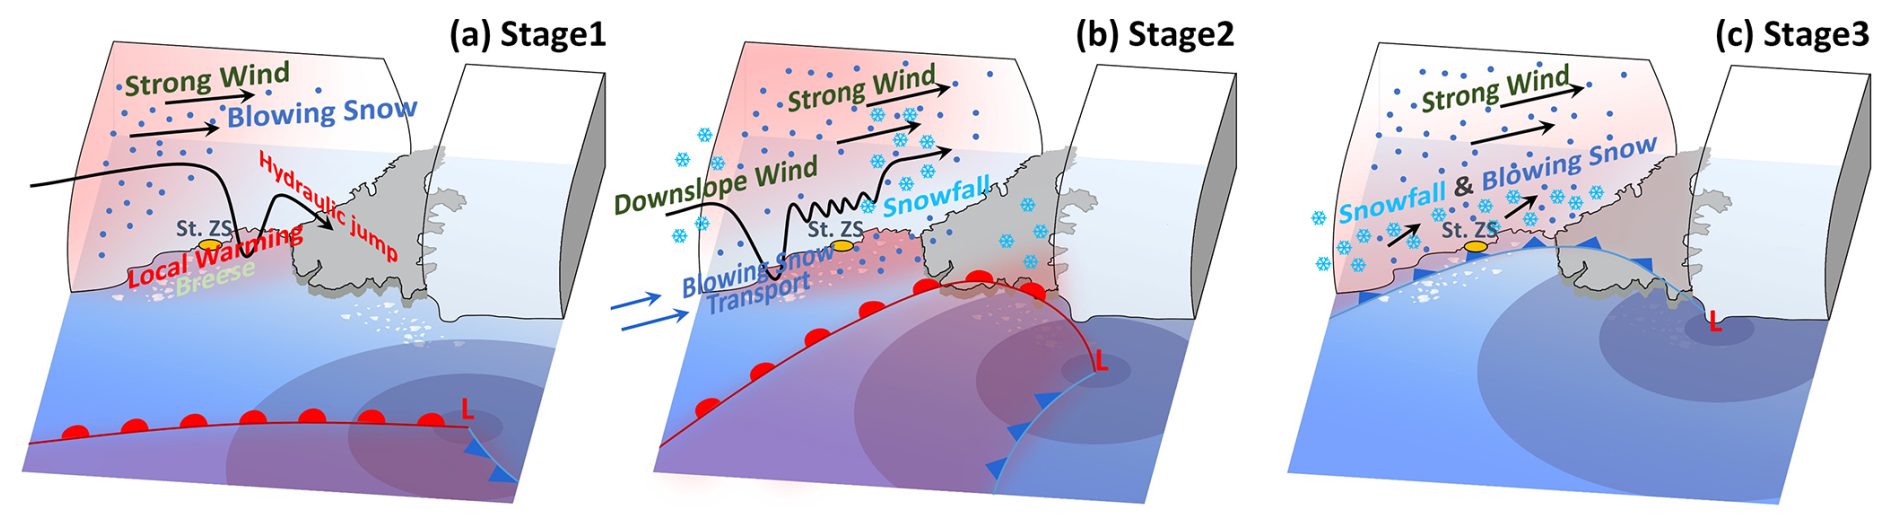
Figure 4Schematic diagram of a typical strong wind and blowing snow event caused by cyclone invasion over the Prydz Bay Region. Blue dots represent blowing snow, bright blue snowflakes represent snowfall, and red shaded areas represent warming regions.
Based on the backward scattering signal profile of the lidar ceilometer (Fig. 5a), at approximately 11:00 UTC on 15 July 2022, the lidar ceilometer first detected signals in the air, which appeared at a height of over 100 m above ground level (a.g.l.). About an hour later, the bottom of the high-value zone of the backward scattering signal quickly transitioned to ground contact, indicating the onset of the blowing snow. At this time, manual observations simultaneously recorded snowfall, blowing snow, and blizzard (Fig. 5a). According to the model simulations, strong winds, snowfall, and blowing snow all started at 11:00 UTC on 15 July 2022 (Fig. 5b–d). Among them, the blowing snow reached its peak around 18:00 UTC on 15 July 2022, when its upper boundary also reached 500 m a.g.l. Overall, the intensity of the blowing snow obtained from the simulation shows a good consistency with the wind speed. This is quite understandable because the blowing snow in the model originates from the saltation of snow particles on the surface, which mainly depends on the critical velocity.
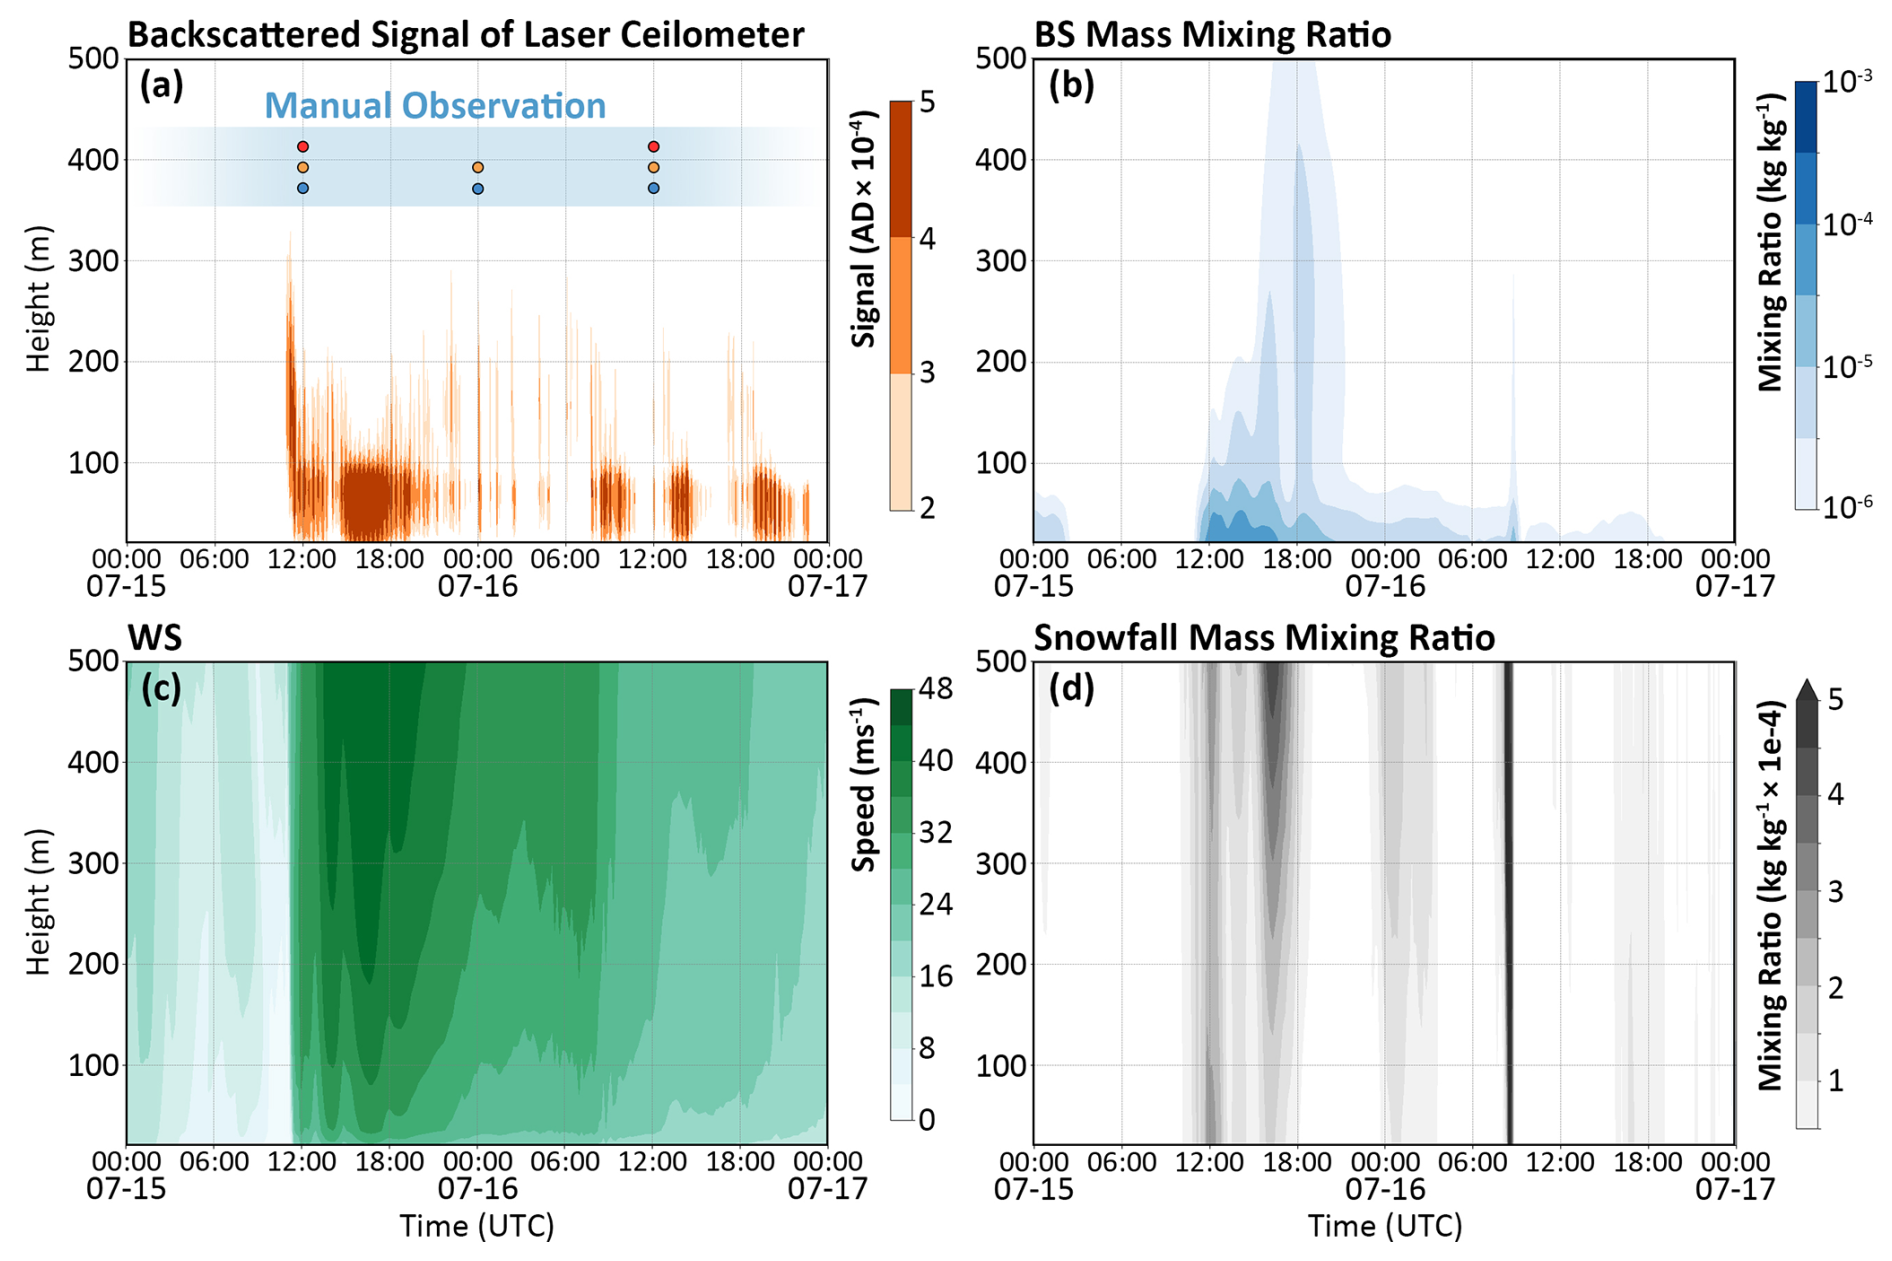
Figure 5(a) Backscatter profile observed by the lidar ceilometer at St. ZS, as well as (b) the profiles of mass mixing ratio of blowing snow, (c) horizontal wind speed and (d) mass mixing ratio of snowfall calculated by the model. In (a), the manual observation results at 6 h intervals are marked with dots in three colors, with blue, yellow, and red respectively representing snowfall, blowing snow, and blizzard. The starting point of the vertical coordinate is 13 m (the height of St. ZS at the corresponding position in the model).
Simulation results also demonstrate that the magnitude of the mass mixing ratio for snowfall is significantly higher than that for blowing snow (Fig. 5b and d). In addition, the scattering signal detected by the lidar ceilometer in the actual atmospheric environment is a combination of blowing snow and snowfall components. Therefore, it is logical and expected that the high values measured by the lidar ceilometer exhibit a closer correspondence with snowfall. In this case for instance, the snowfall event that took place from 11:00 UTC–19:00 UTC on 15 July 2022, precisely overlaps with the time interval during which the lidar ceilometer registered elevated backward scattering signals. It is important to emphasize that owing to the substantial attenuation effect exerted by snow particles, the lidar ceilometer's signal is unable to penetrate areas characterized by a high density of particles. As a result, the vertical thickness of the region with high intensity scattering signals is around 100 m. Following 00:00 UTC on 16 July 2022, a rapid decline in wind speed led to the disappearance of blowing snow in the model simulation outcomes. In contrast, both lidar ceilometer measurements and manual observations indicate the intermittent occurrence of blowing snow or blizzard, suggesting that the model may encounter certain limitations in simulating this particular stage of the process.
4.1 Impact of topography on blowing snow
4.1.1 The suppression of blowing snow by the katabatic wind hydraulic jump
Both the wind speed observations from the automatic surface meteorological station and the simulation results (Fig. 3) indicate that St. ZS experienced approximately six hours of gentle breeze with no blowing snow occurring during this period before the arrival of strong winds (11:00 UTC on 15 July 2022). However, according to the numerical simulation results at 10:00 UTC on 15 July 2022, blowing snow had already occurred above the surface upstream of St. ZS at this time (Fig. 6d), which was attributed to wind speeds generally exceeding 16 m s−1 over the surface of the continental plateau. The winds in the St. ZS region flow from the plateau towards the ocean along the terrain gradient, approximately 30° counterclockwise from the maximum slope line (Fig. 6a), with vertical velocities exceeding 1 m s−1 in the coastal areas (Fig. 6b). However, it appears that the strong winds diminished rapidly upon reaching St. ZS, leading to the emergence of a localized low wind speed zone accompanied by a corresponding high temperature region over the ocean near St. ZS (Fig. 6a).
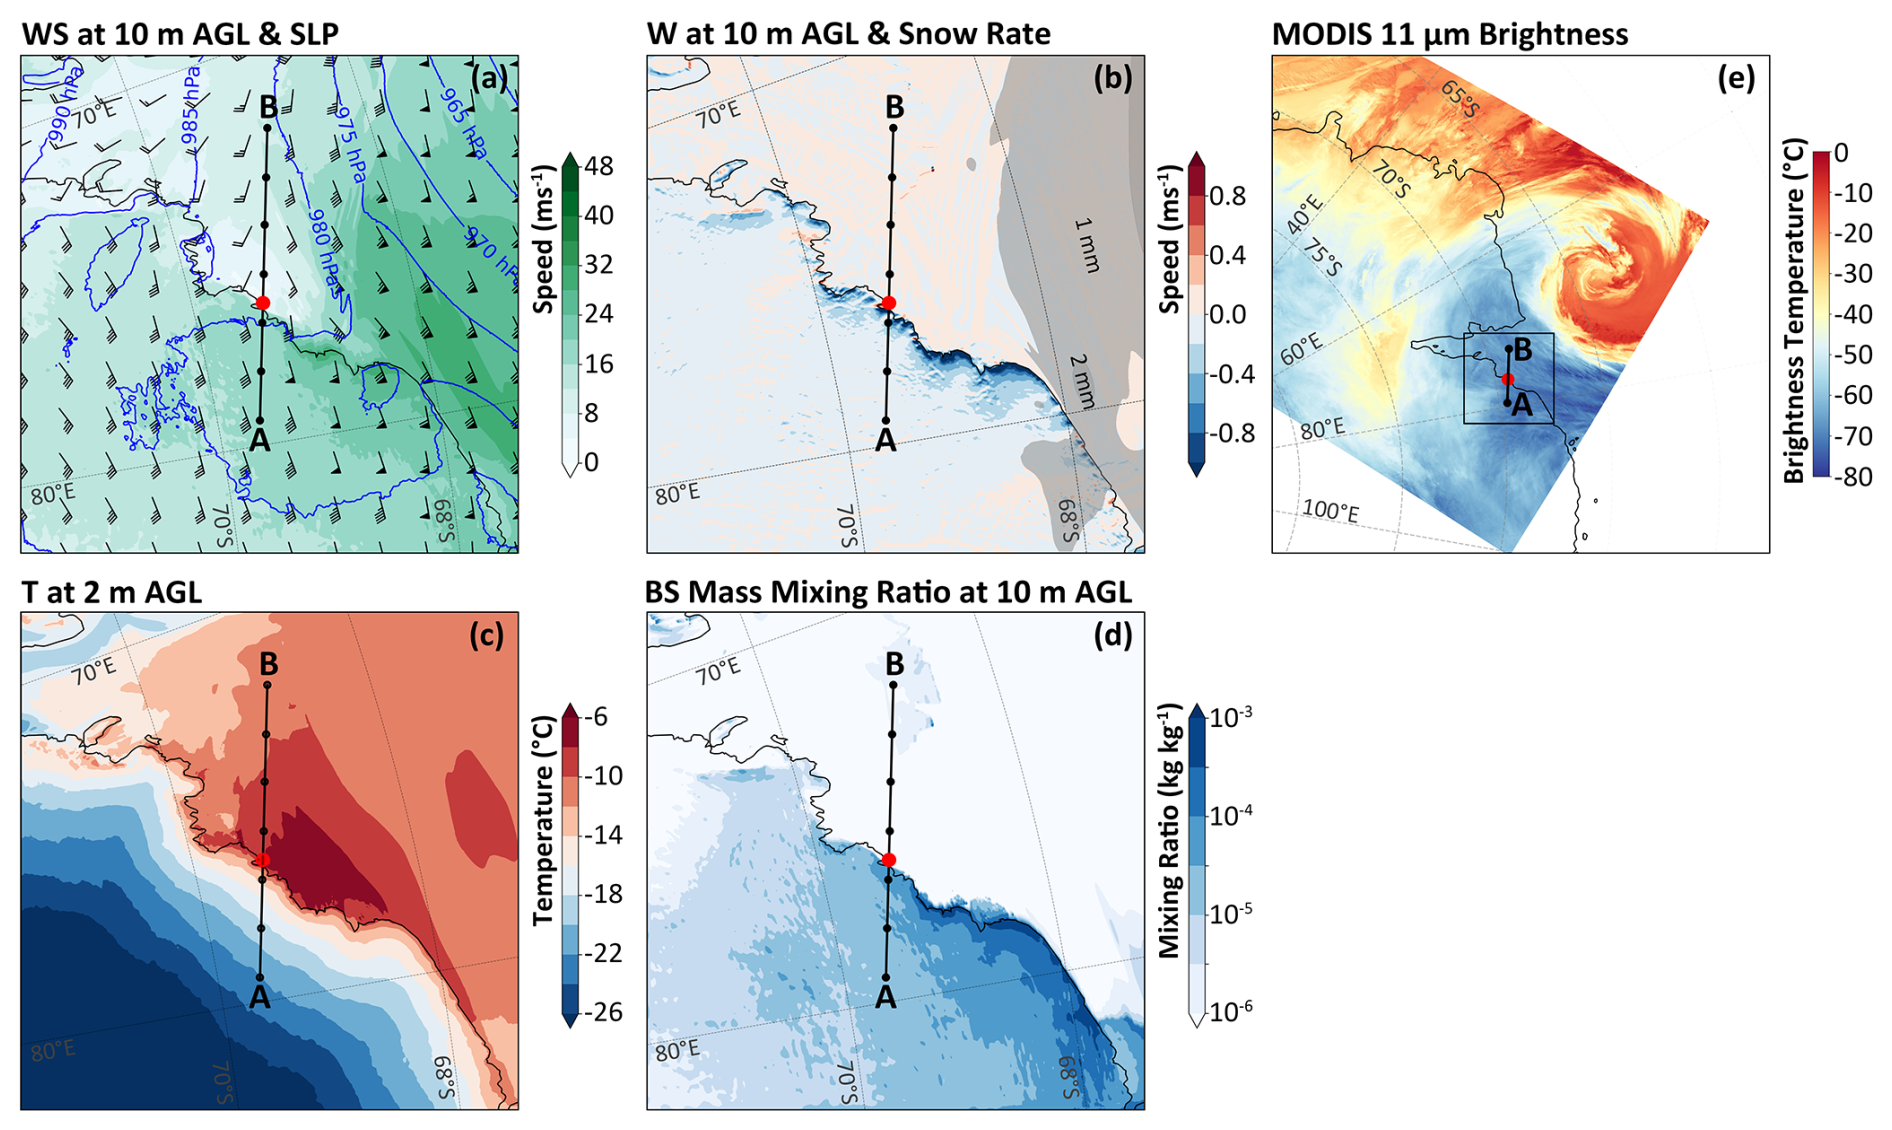
Figure 6Simulation results of meteorological elements at the ground (sea surface) at 10:00 UTC on 15 July 2022. (a) Horizontal wind at 10 m a.g.l. (color filling representing speed value; triangular pennant, long horizontal bar and short horizontal bar on the wind barb indicating a wind speed of 20, 4 and 2 m s−1, respectively) and sea level pressure (blue solid lines). (b) Vertical wind speed at 10 m a.g.l. (color filling) and snowfall rate at the surface (snowfall amount per hour, grayscale filling). (c) Air temperature at 2 m a.g.l., (d) Mass mixing ratio of blowing snow at 10 m a.g.l. (e) MODIS 11 µm brightness product at 11:30 UTC on 15 July 2022. The black straight lines represent the position of the cross-section shown in Fig. 7, and the black rectangle on (e) denotes the d03 domain of the model simulation, i.e., the area of (a)–(d).
In order to further analyze such phenomenon, a cross-sectional analysis was conducted along the direction of the surface wind speed at St. ZS at 10:00 UTC on 15 July 2022, as shown in Fig. 7. From the cross-sectional wind field (Fig. 7a and c), there is a high wind speed layer with a thickness of approximately 1 km near the surface of the plateau ice sheet. The horizontal wind speed in the section exceeds 24 m s−1, and it moves downward along the terrain from the plateau, which forms a cold katabatic wind (Fig. 7b). There is a folded area of potential temperature isopleths above the katabatic wind layer, the horizontal wind speed in the sectional projection is very low in this area while the vertical movement is significant, indicating that the kinetic energy is dissipated by the hydraulic jump. At the same time, as the terrain gradient becomes rapidly steeper when approaching the continental margin, the thickness of the katabatic wind is further compressed. The most intense warming and vertical jump occur at the location with the largest gradient in the marginal area of the ice sheet (at the 115 km position of the section, marked as blue triangle on Fig. 7). The potential temperature isopleths here are almost perpendicular to the ground, indicating that after the air mass reaches the ground, it piles up and moves vertically due to obstruction, resulting in a sharp decrease in the wind speed and an increase in temperature downstream due to adiabatic warming. The low wind speed zone below an altitude of 0.5 km extends downstream to the edge of the Amery Ice Shelf, and the energy of the strong winds is transported upward and downstream. Under such circumstances, blowing snow is naturally difficult to occur.
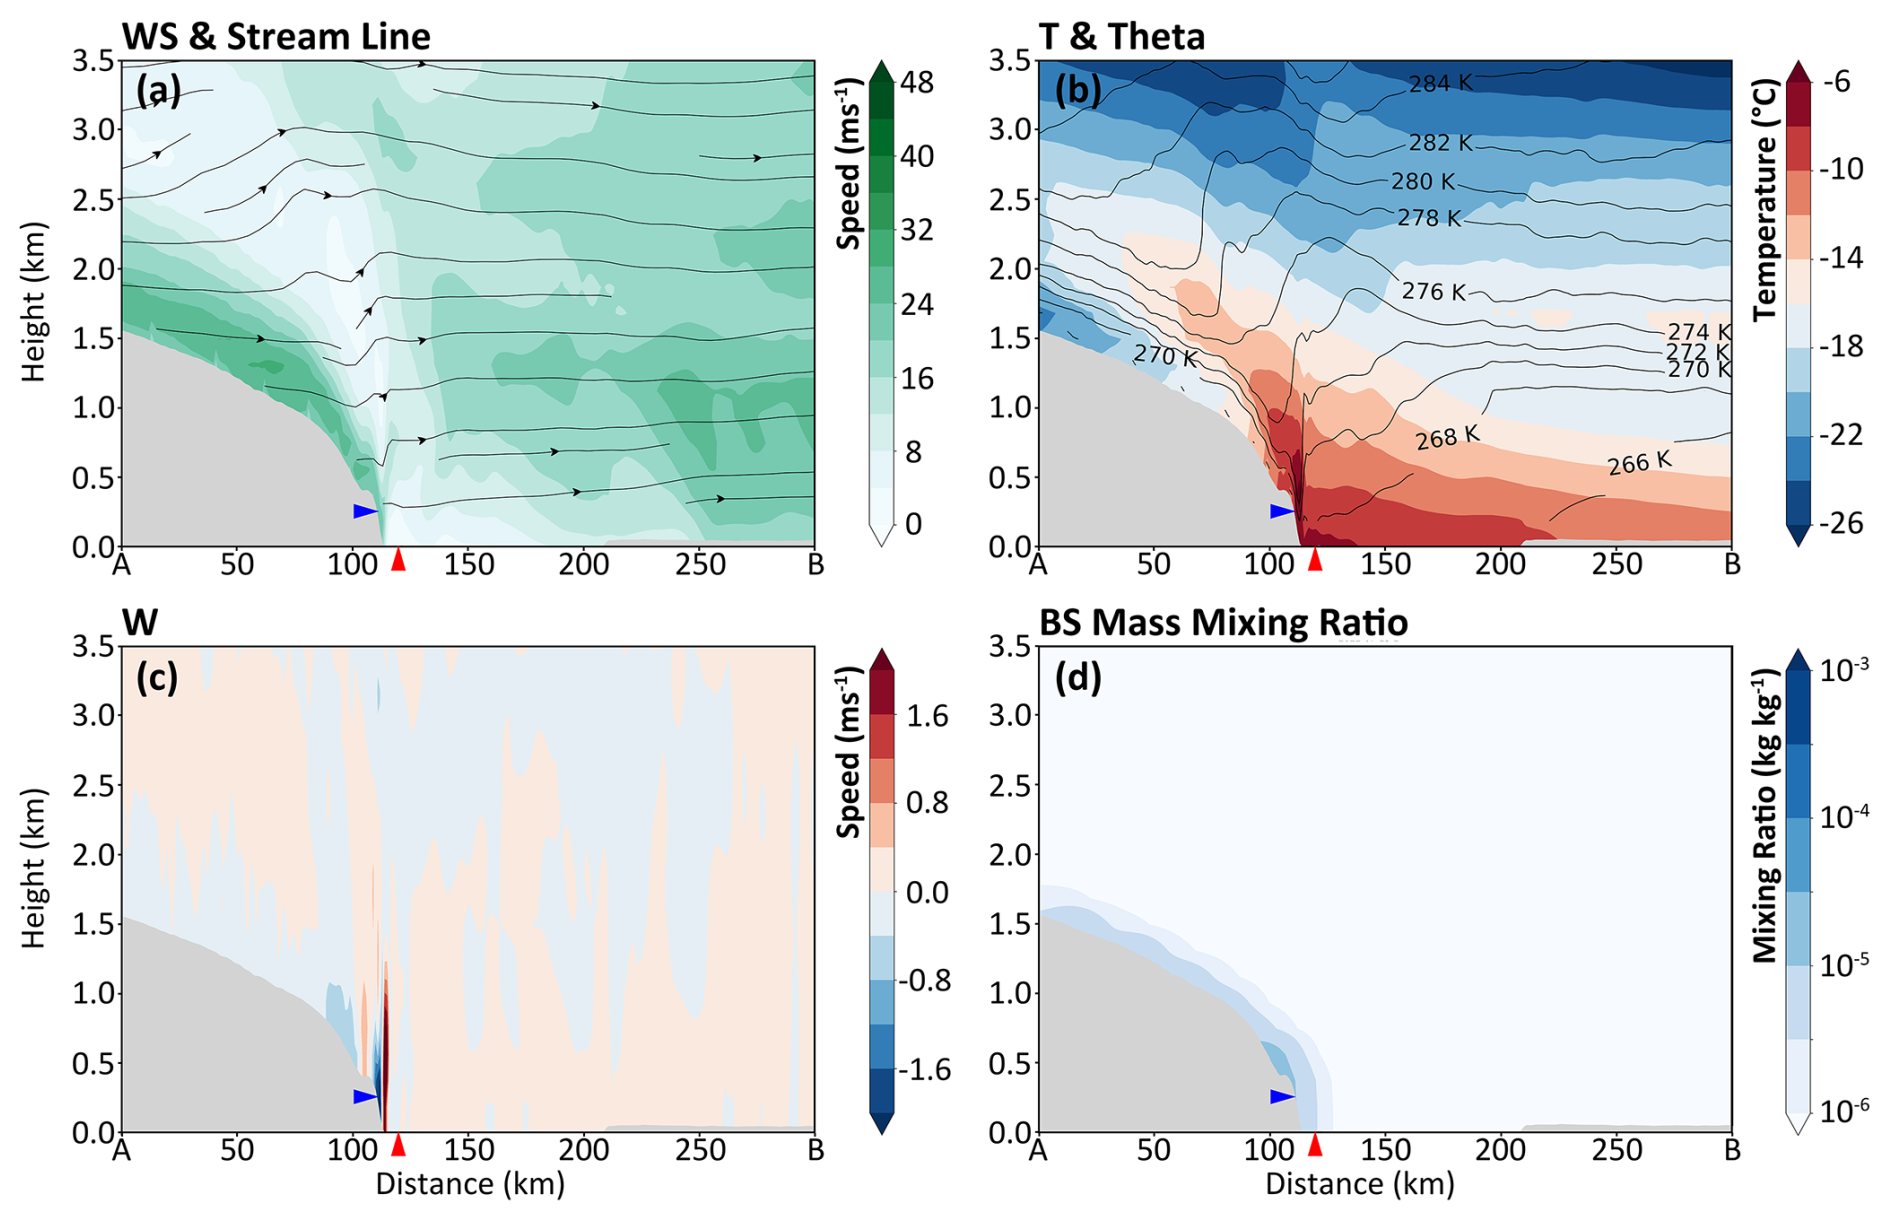
Figure 7Simulation results of meteorological elements at the cross-section passing through St. ZS (marked by the black straight line in Fig. 6) at 10:00 UTC on 15 July 2022. (a) Horizontal wind speed and streamlines of the sectional projection (the vertical wind speed is magnified by 400 times when drawing the streamlines). (b) Temperature field (color shading) and potential temperature field (black solid lines). (c) Vertical wind speed. (d) Blowing snow mass mixing ratio. The position marked by the red triangle is the location of St. ZS, and the blue triangle marks the location with the most significant warming (corresponding to 115 km on the horizontal axis).
It is worth noting that since the occurrence of the hydraulic jump is closely related to terrain, a grid with relatively high resolution is theoretically required to achieve a good simulation result. By comparing the wind speed simulation results presented in Fig. 3a (comparing d03 and d01), under the condition of coarser resolution, the simulated wind speed at St. ZS during the hydraulic jump phase is significantly higher than the observed value; which illustrates the importance of high-resolution grid configuration.
4.1.2 The transport of blowing snow under the influence of downslope windstorm
After 11:00 UTC on 15 July 2022, as the cyclone approached the western side of the Prydz Bay (Fig. 2b and e), the strong wind zone swept across the eastern side of the Prydz Bay. By 18:00 UTC on 15 July 2022, the strong shear line of the surface frontal zone was located over the Amery Ice Shelf, fierce northeasterly winds prevailed from the sea surface to the plateau land surface (Fig. 8a); and the intense surface winds triggered severe blowing snow over the land. Concurrently, northeasterly winds exceeding 32 m s−1 extend downstream from the topographic promontory around the Vestfold Hills and the West Ice Sheet, covering the Prydz Bay and forming a distinct transport belt over the sea surface (Fig. 8d). In addition, influenced by the cyclone's water vapor transport and orographic lifting, heavy snowfall centers with a rate exceeding 3 mm h−1 emerged on the frontal surface of the Amery Ice Shelf and at the terrain promontories on both the east and west sides of St. ZS, which is mainly attributed to dynamic orographic lifting.
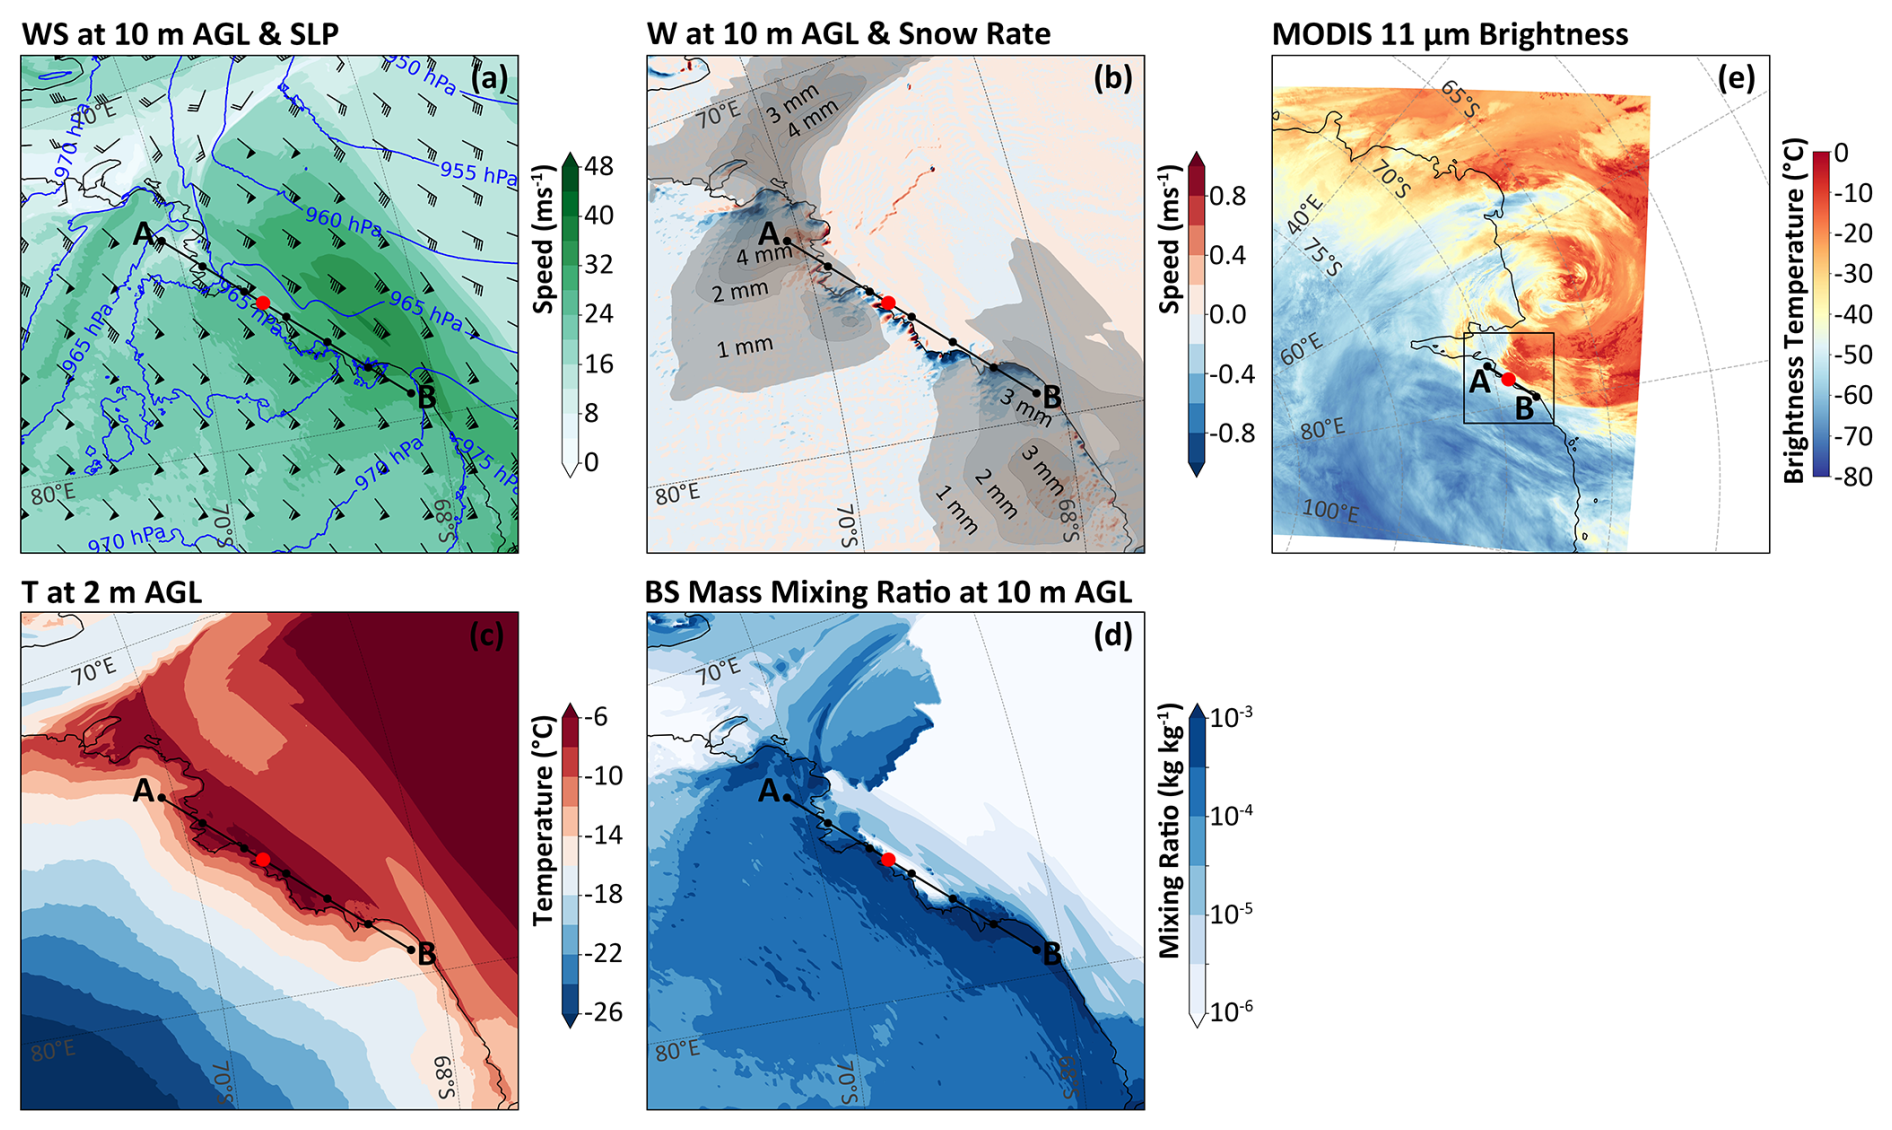
Figure 8Similar to Fig. 6, but the simulation results (a–d) are taken at 18:00 UTC on 15 July 2022; while the MODIS product is taken at 19:35 UTC on 15 July 2022. The black straight lines represent the position of the cross-section shown in Fig. 9, and the black rectangle on (e) denotes the d03 domain of the model simulation, i.e., the area of (a)–(d).
Similarly, an analysis was conducted along the cross-section passing through St. ZS at 18:00 UTC on 15 July, as illustrated in Fig. 9. The figure reveals that once the strong winds reached the Vestfold Hills, they were disrupted by the topography, leading to the generation of powerful downslope winds on the leeward side exceeding 44 m s−1. The strong winds are mainly concentrated below 1.5 km in altitude and extend downstream from the leeward slope (Fig. 9a), accompanied by significant adiabatic warming and bending of potential temperature isopleths (Fig. 9b), which is consistent with the classic topographically induced downslope windstorm structure (Lilly, 1978). The downslope winds also induced lee waves, leading to an alternating sequence of positive and negative vertical velocity along the cross section (Fig. 9c). However, due to the topographic lifting at the western side of Prydz Bay (point A), the near-surface wind speed where St. ZS is located is relatively lower (Fig. 9a).
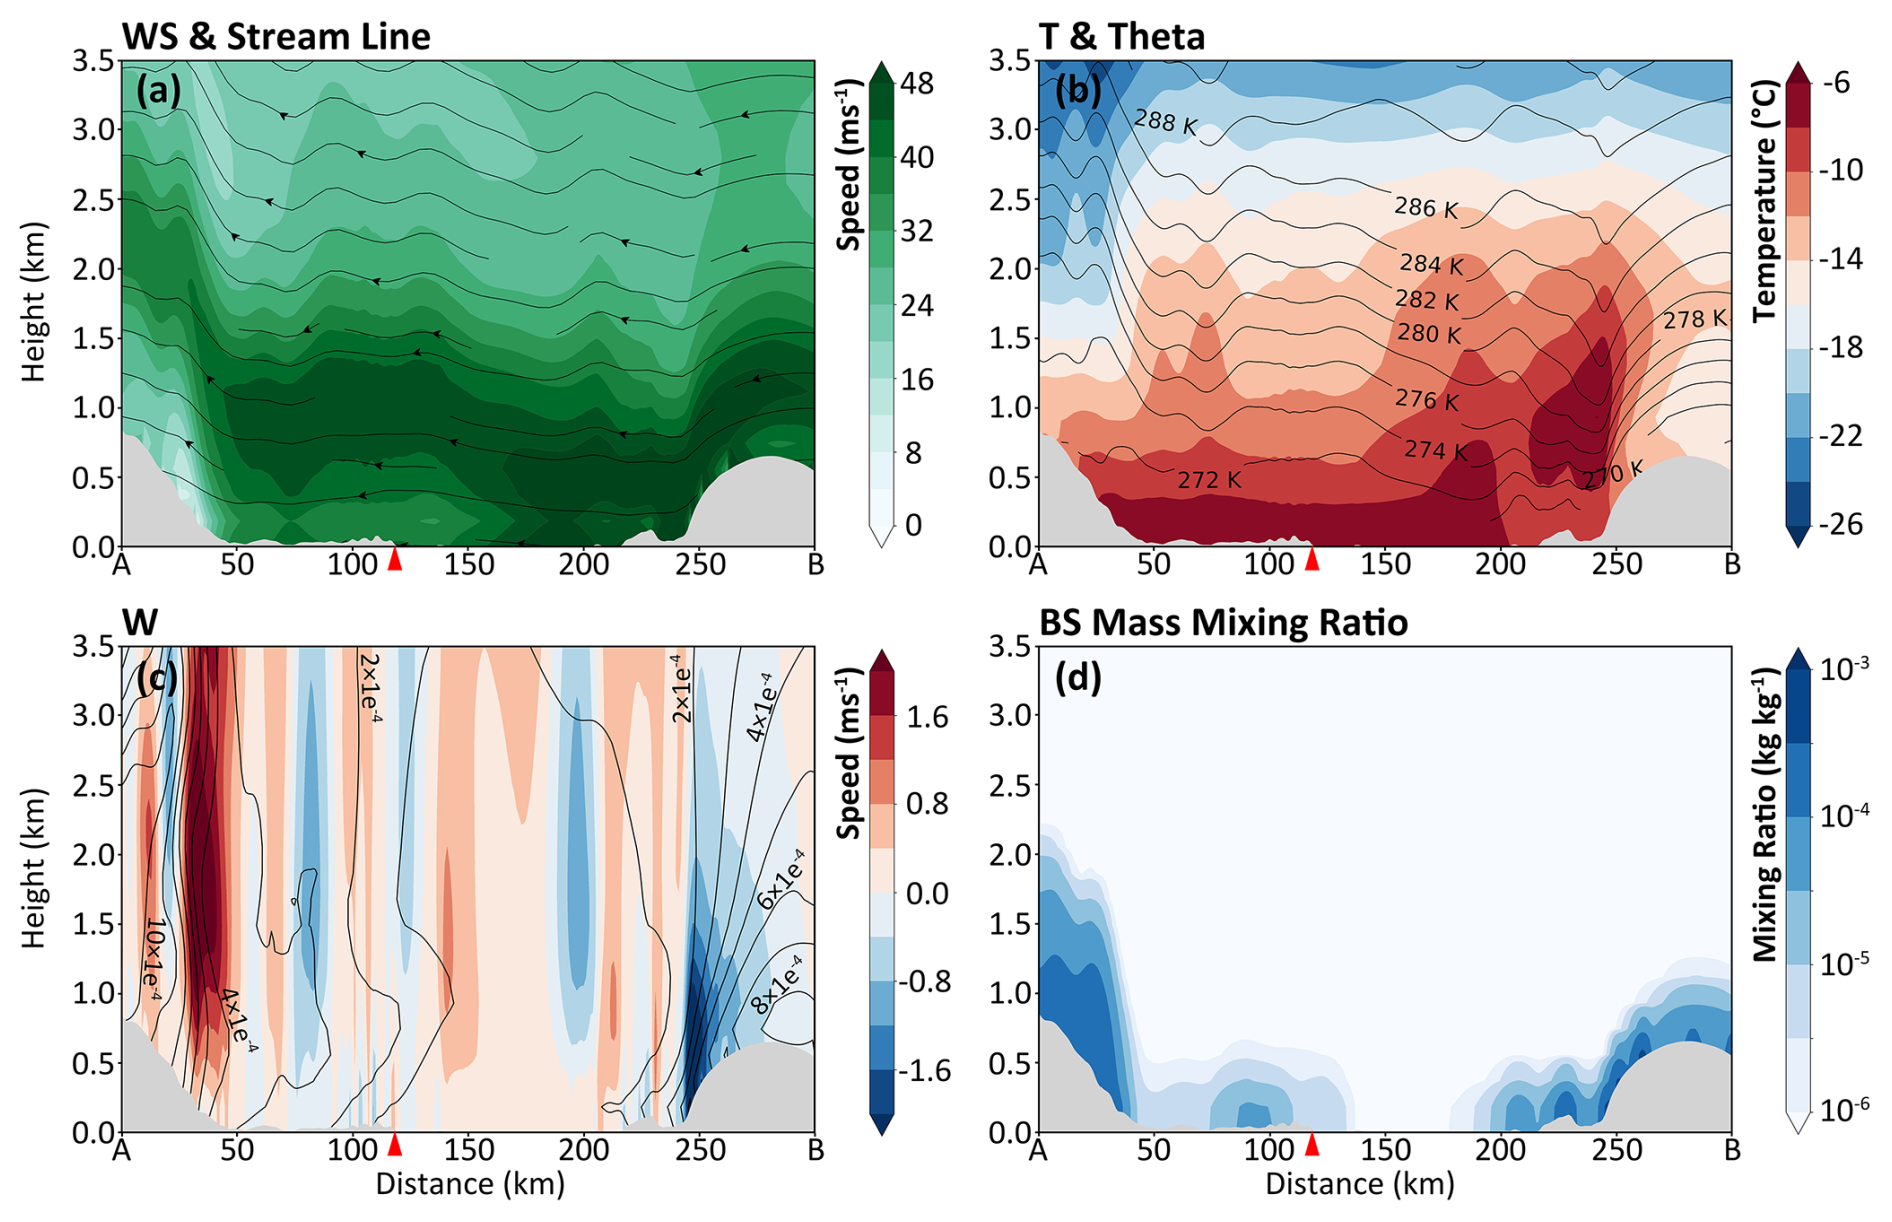
Figure 9Similar to Fig. 7, but taken at 18:00 UTC on 15 July. Additionally, the solid line in (c) represents the mass mixing ratio of snowfall obtained from model simulations. The cross-section is indicated by the black straight line shown in Fig. 8.
The topographic impact on blowing snow manifests in two aspects. Firstly, topographically induced downslope windstorm cause a sharp increase in wind speed, triggering significant blowing snow, while the notable vertical motion it induce can affect the vertical distribution of blowing snow. In this case, on the windward slope of the terrain promontory west of St. ZS (near the 30 km mark on the horizontal axis of Fig. 9d), intense upward motion can transport blowing snow to an altitude of 1 km above the terrain; in contrast, on the leeward slope of Vestfold Hills (near the 250 km mark on the horizontal axis of Fig. 9d), strong downward motion confines blowing snow closely to the surface. Secondly, terrain also exerts a substantial influence on snowfall distribution. For instance, on the windward slopes of Vestfold Hills and the terrain west of St. ZS, the atmosphere undergoes significant snowfall due to orographic forced lifting (Figs. 8b and 9c). Such snowfall can effectively compensate for the loss caused by blowing snow, while the newly fallen snow is more prone to erosion, making blizzards more likely to occur.
Based on the previously presented ceilometer observations, significant blowing snow was also detected at St. ZS around 18:00 UTC on 15 July (Fig. 5a). Its main sources are further diagnosed through simulations. For the period 11:00 UTC on 15 July to 00:00 UTC on 16 July at St. ZS, the temporal evolution of the blowing snow mass mixing ratio profile (Fig. 10a) and its primary contributing sources (Fig. 10b–d) are presented. For a single station, the simulated blowing snow mixing ratio mainly originates from sub-grid blowing snow parameterization processes (primarily snow particle saltation, sedimentation, diffusion, turbulent mixing, and phase change) and grid-scale processes (including horizontal and vertical advection). In this case, the positive contribution of parameterization is mainly in the surface layer approximately 50–60 m above the ground (Fig. 10b), which is directly linked to the SNOWPACK model's real-time saltation flux output, driven by rapidly intensifying surface wind speed. Although strong winds significantly enhance saltation, the resulting intense horizontal advection also rapidly transports blowing snow downstream, thereby balancing the mixing ratio of locally generated blowing snow (Fig. 10c).
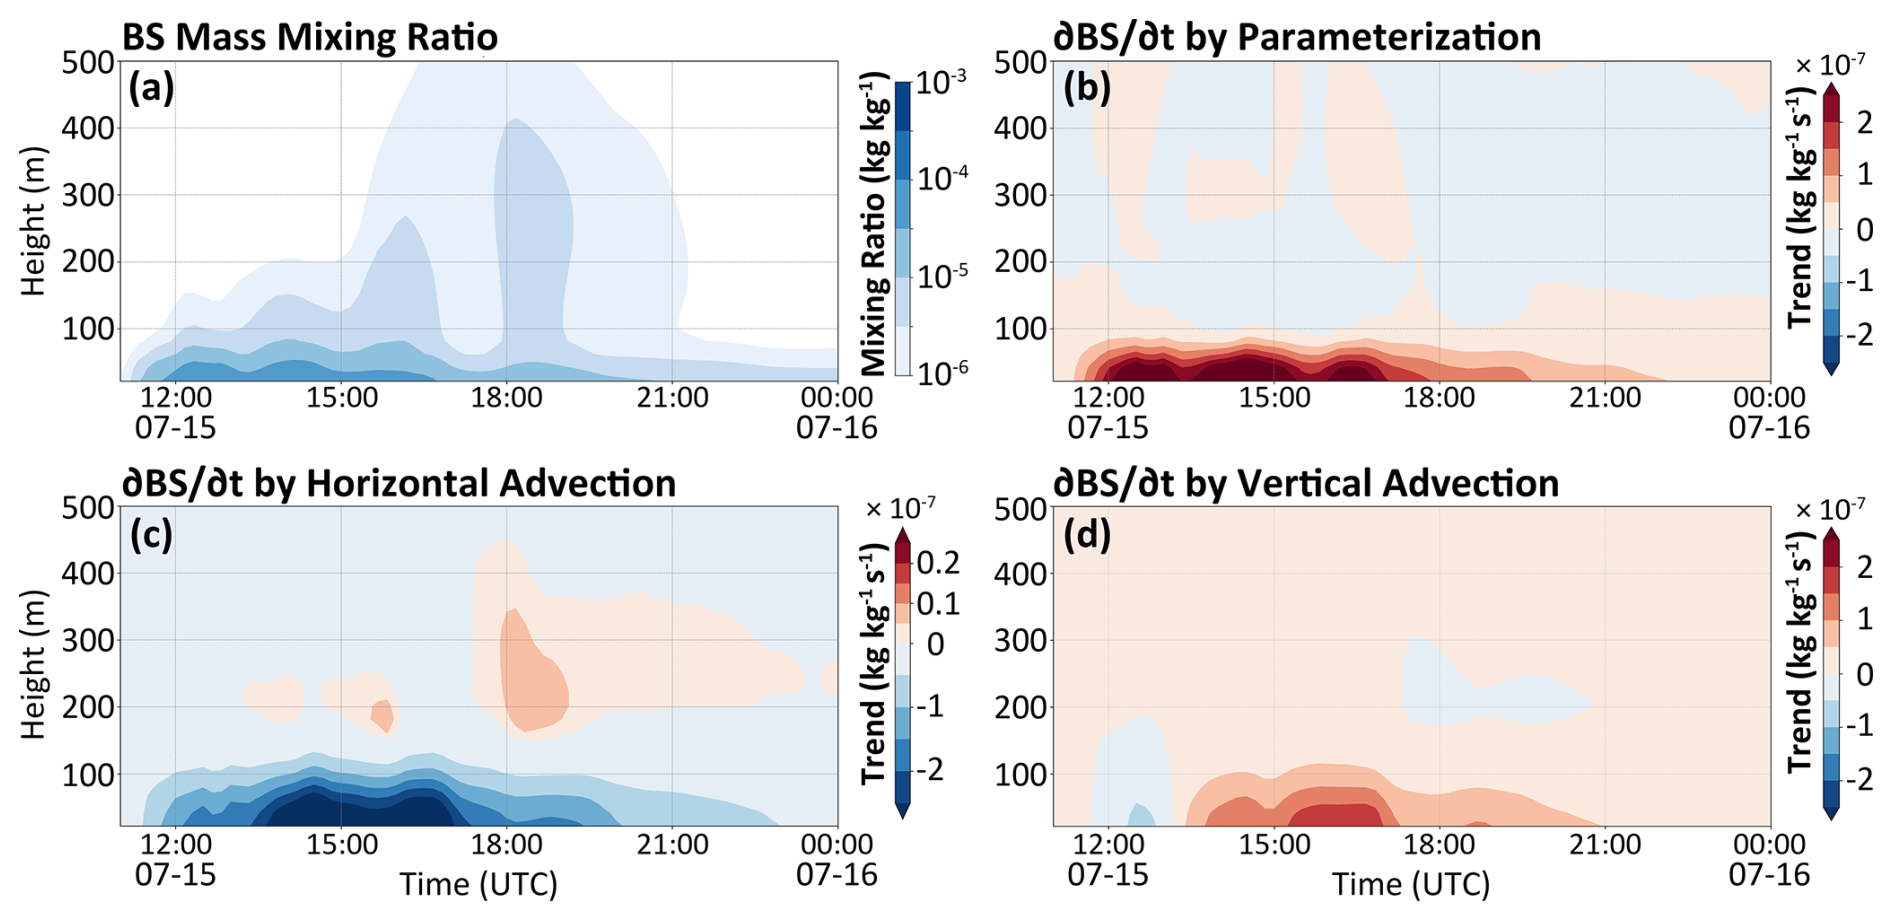
Figure 10Profiles of (a) the mass mixing ratio of blowing snow, and (b)–(d) the variation tendency of blowing snow, encompassing the contributions from the parameterization scheme, horizontal advection, and vertical advection.
Notably, during the period from 13:00–21:00 UTC on 15 July, as the cyclonic front swept past St. ZS (figure omitted), vertical advection intensified significantly, making a positive contribution to the upward transport of blowing snow particles. This phenomenon is also related to the obvious upward motion generated by the downslope windstorm under the influence of the marginal terrain where St. ZS is located. Meanwhile, in the hours after 15:00 UTC, the top of the blowing snow layer extended upward remarkably, reaching a maximum height of over 500 m, which is mainly attributed to the contribution of horizontal advection (Fig. 10c). Although the magnitude of the contribution from horizontal advection is much lower than that from surface saltation (for example, the mixing ratio of blowing snow particles above 100 m is approximately below , an order of magnitude lower than that near the surface), the phenomenon that blowing snow particles are transported to the air above St. ZS over a long distance is still worthy of attention. This may be closely related to the obvious upward motion generated by the lee waves upstream of St. ZS (southeast of St. ZS, near the 130 km mark on the horizontal axis of Fig. 9c), which transports particles upward and is subsequently followed by horizontal advection via strong winds.
4.2 Impact of snow layer properties on blowing snow considering simulation-observation discrepancy
After 00:00 UTC on 16 July 2022, the cyclone began to weaken upon landfall. Both surface observations and simulation results have shown that the air pressure started to gradually rise, and the wind speed also gradually decreased (Fig. 3). As previously mentioned, although the simulated blowing snow ceased rapidly as the wind speed dropped sharply, intermittent blowing snow was still detected by ceilometer observations. Particularly after 08:00 UTC on 16 July 2022, both ceilometer and manual observations recorded snowfall and blowing snow, with blizzards also documented by manual observations, until 00:00 UTC on 17 July 2022. Coincidentally, at 08:30 UTC on 16 July 2022, the model simulation showed a short-term heavy snowfall, which aligns precisely with the time when the lidar ceilometer again detected continuous blowing snow around 08:00 UTC on 16 July 2022 (Fig. 5d).
This short-term snowfall is associated with the weak cold front behind the cyclone. Figure 11 presents the distribution of surface meteorological elements at 08:30 UTC on 16 July 2022. Although the intensity of the cyclone center weakened, the annular circulation around it drove air to move along the eastern coast of Prydz Bay as the center approached the continent, with the strong wind speed zone having shifted to the central-eastern region of the Amery Ice Shelf. At this time, a narrow precipitation belt caused by a weak cold front just swept across the eastern coast of the Prydz Bay, and the snowfall rate at St. ZS reached 2 mm h−1 (Fig. 11b). This front can be identified in the cross-section along the dominant wind direction of St. ZS at 08:20 UTC on 16 July, where the temperature exhibits a distribution of higher values in the southwest and lower values in the northeast, with potential temperature isopleths tilting northeastward below an altitude of 1.5 km (Fig. 12b). Combined with the distributions of the vertical velocity and the mass mixing ratio of snowfall (Fig. 12c), the occurrence of snowfall was closely related to the superposition of the cold front's dynamic characteristics and the orographic lifting effect.
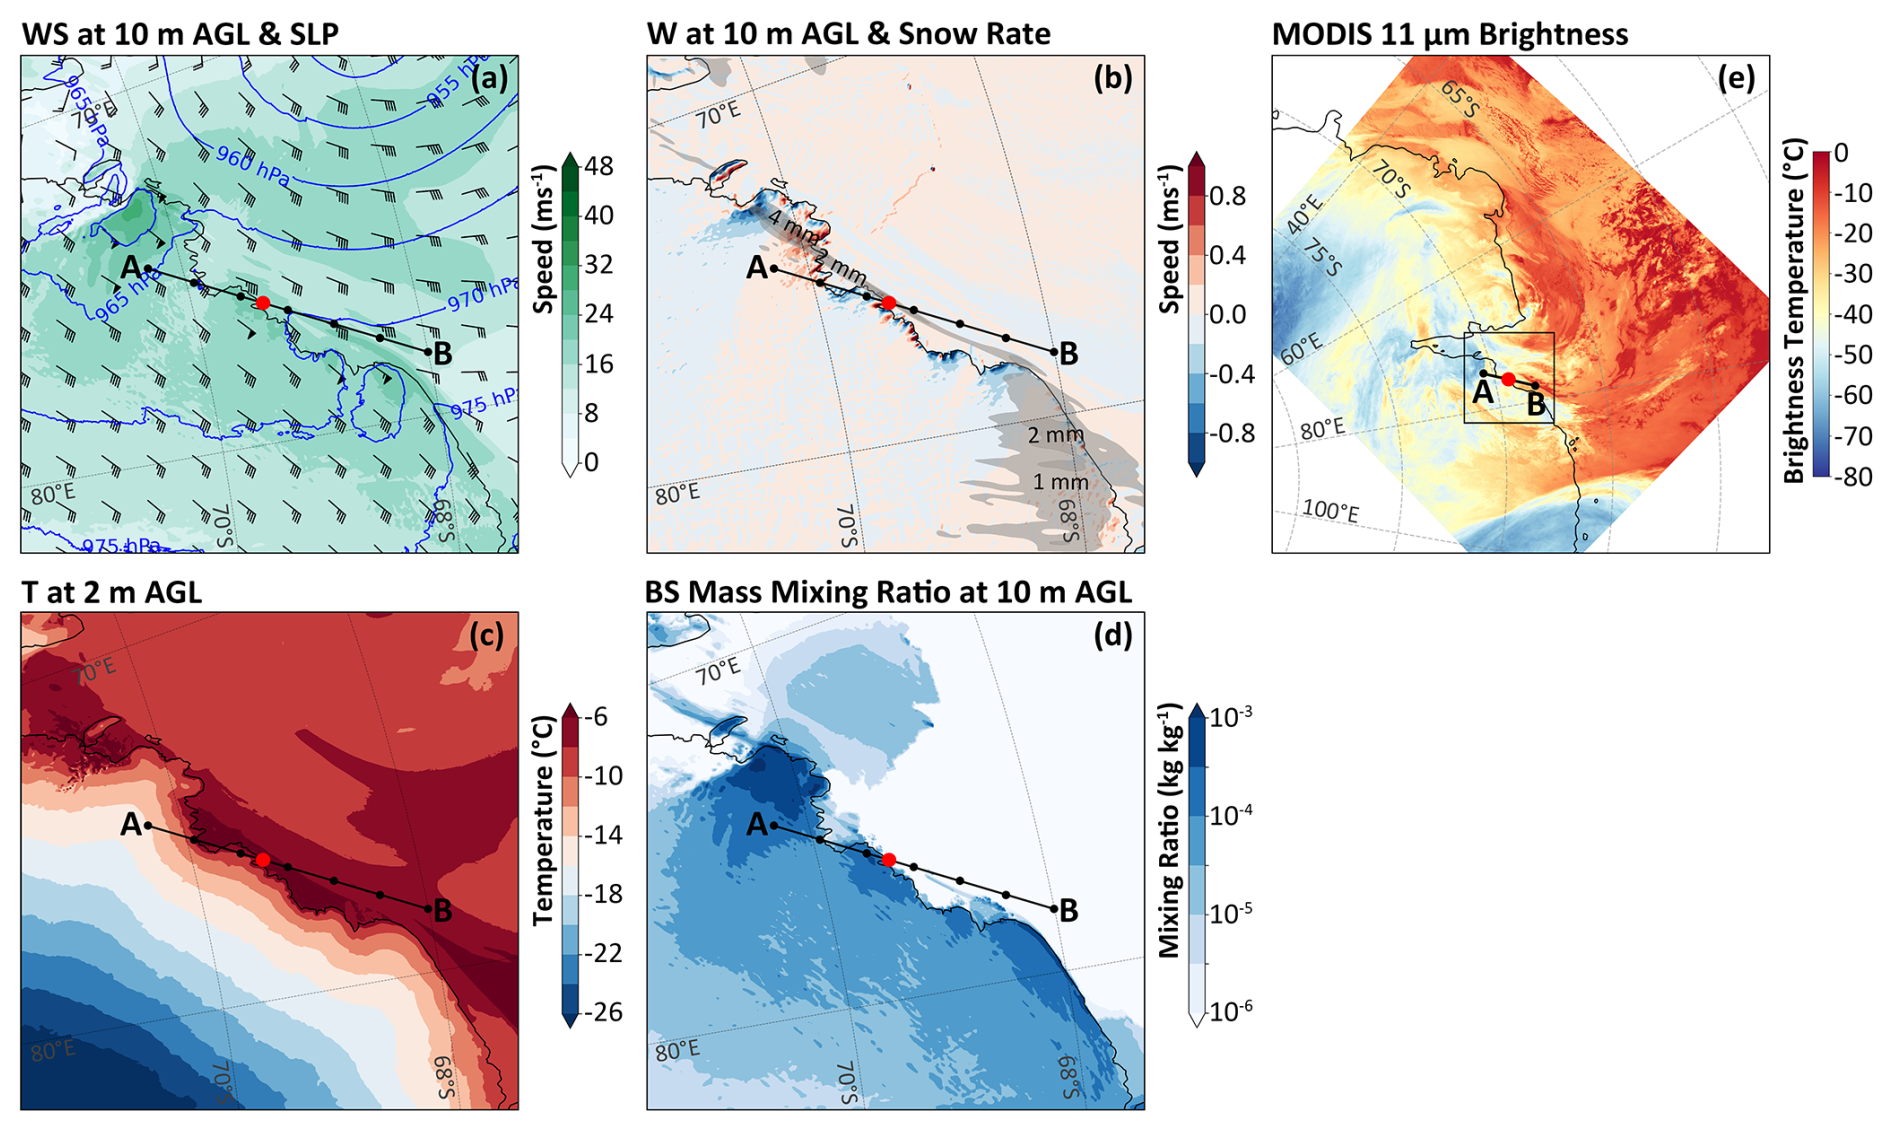
Figure 11Similar to Fig. 6, but the model simulations (a)–(d) are taken at 08:20 UTC on 16 July 2022; while the MODIS product is taken at 10:35 UTC on 16 July 2022. The black straight lines represent the position of the cross-section shown in Fig. 12, and the black rectangle on (e) denotes the d03 domain of the model simulation, i.e., the area of (a)–(d).
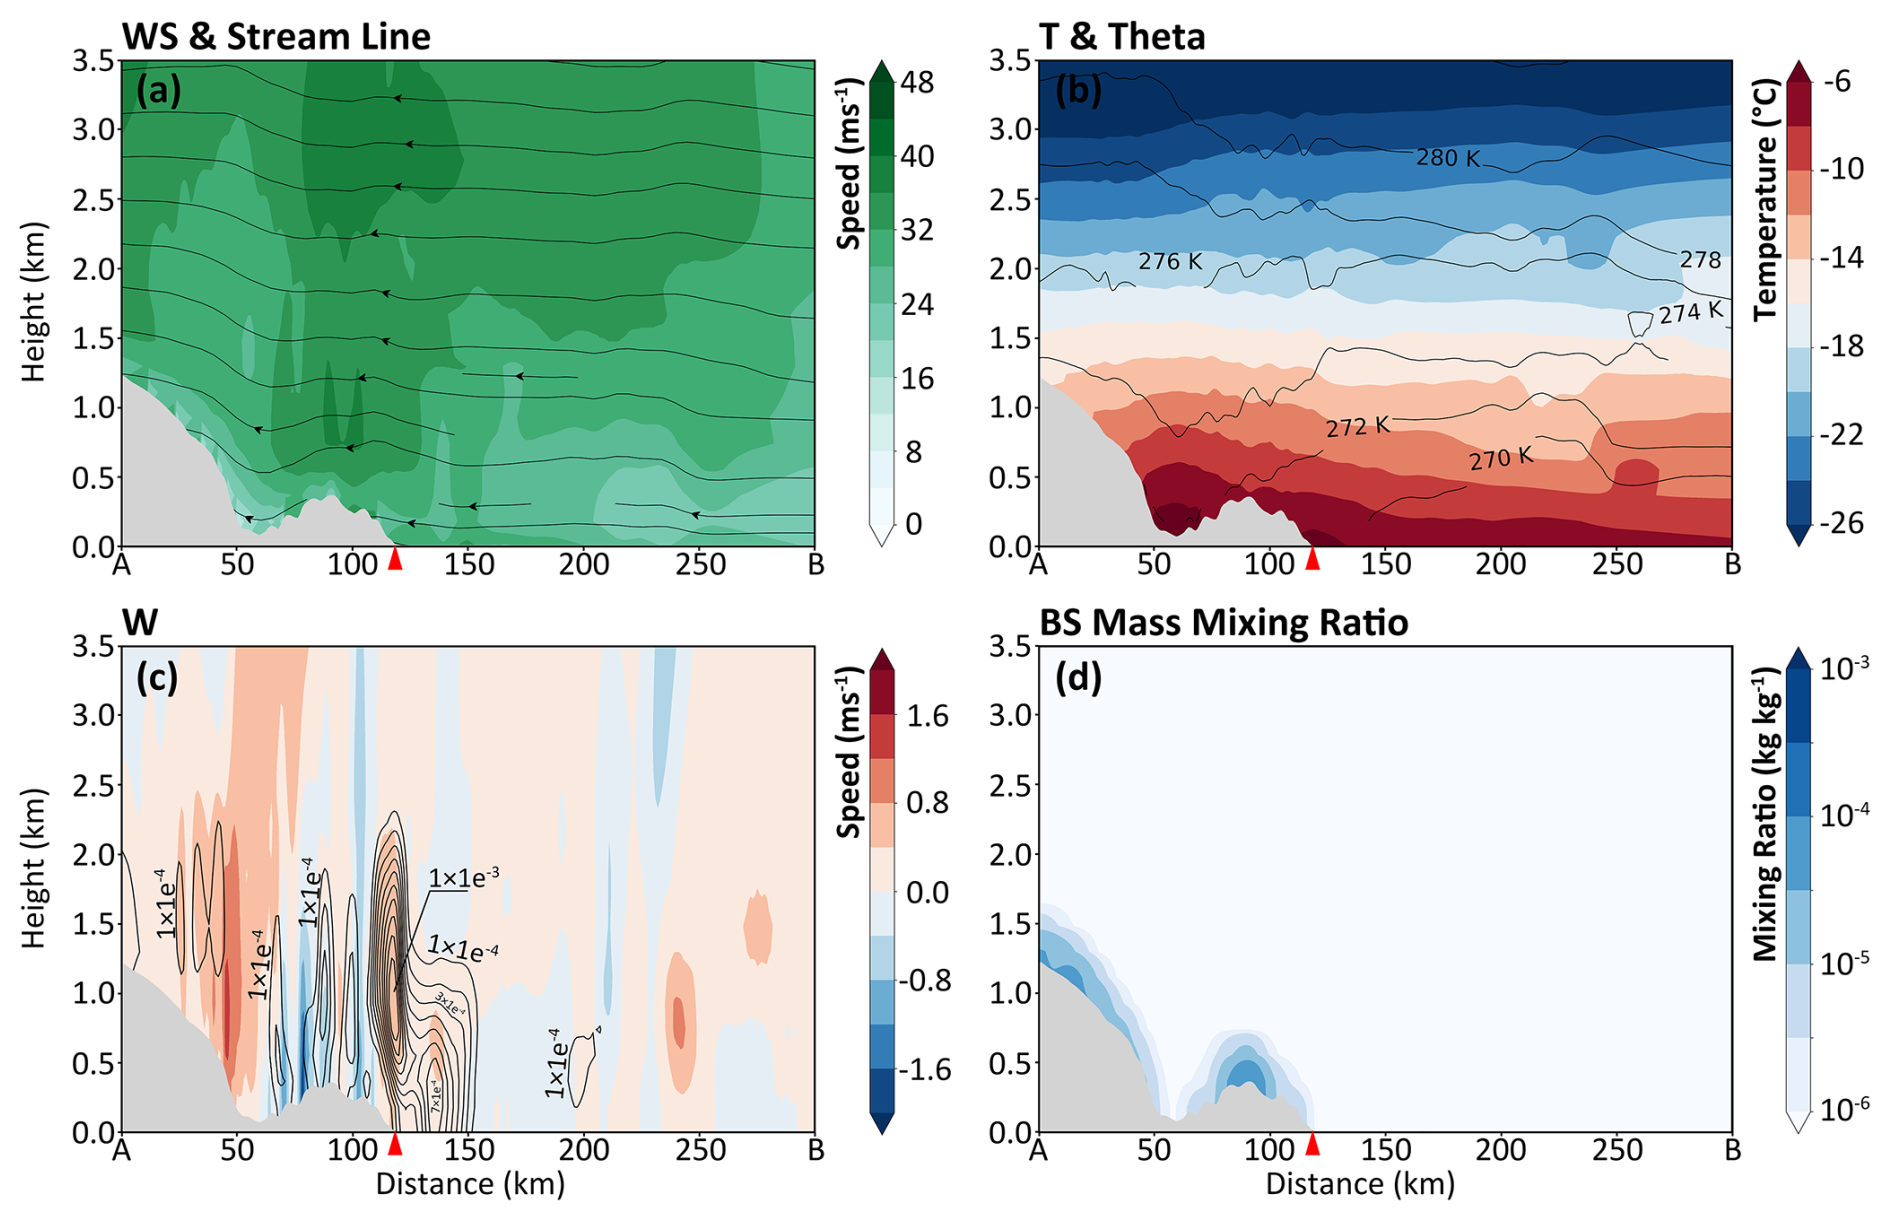
Figure 12Similar to Fig. 7, but taken at 08:20 UTC on 16 July. Additionally, the solid line in (c) represents the mass mixing ratio of snowfall obtained from model simulations. The cross-section is indicated by the black straight line shown in Fig. 11.
In theory, fresh snow is more prone to saltation due to its loose structure, low cohesion, and uncompacted snow layer, which may explain the persistence of intermittent blowing snow in observations. To further verify whether these characteristics are reflected in this case simulation, a set of sensitivity experiments was designed, specifically adopting pairwise combinations of turning on or off blowing snow and snowfall respectively. The changes in snow layer properties at St. ZS throughout the event were observed, with the results presented in Fig. 13.
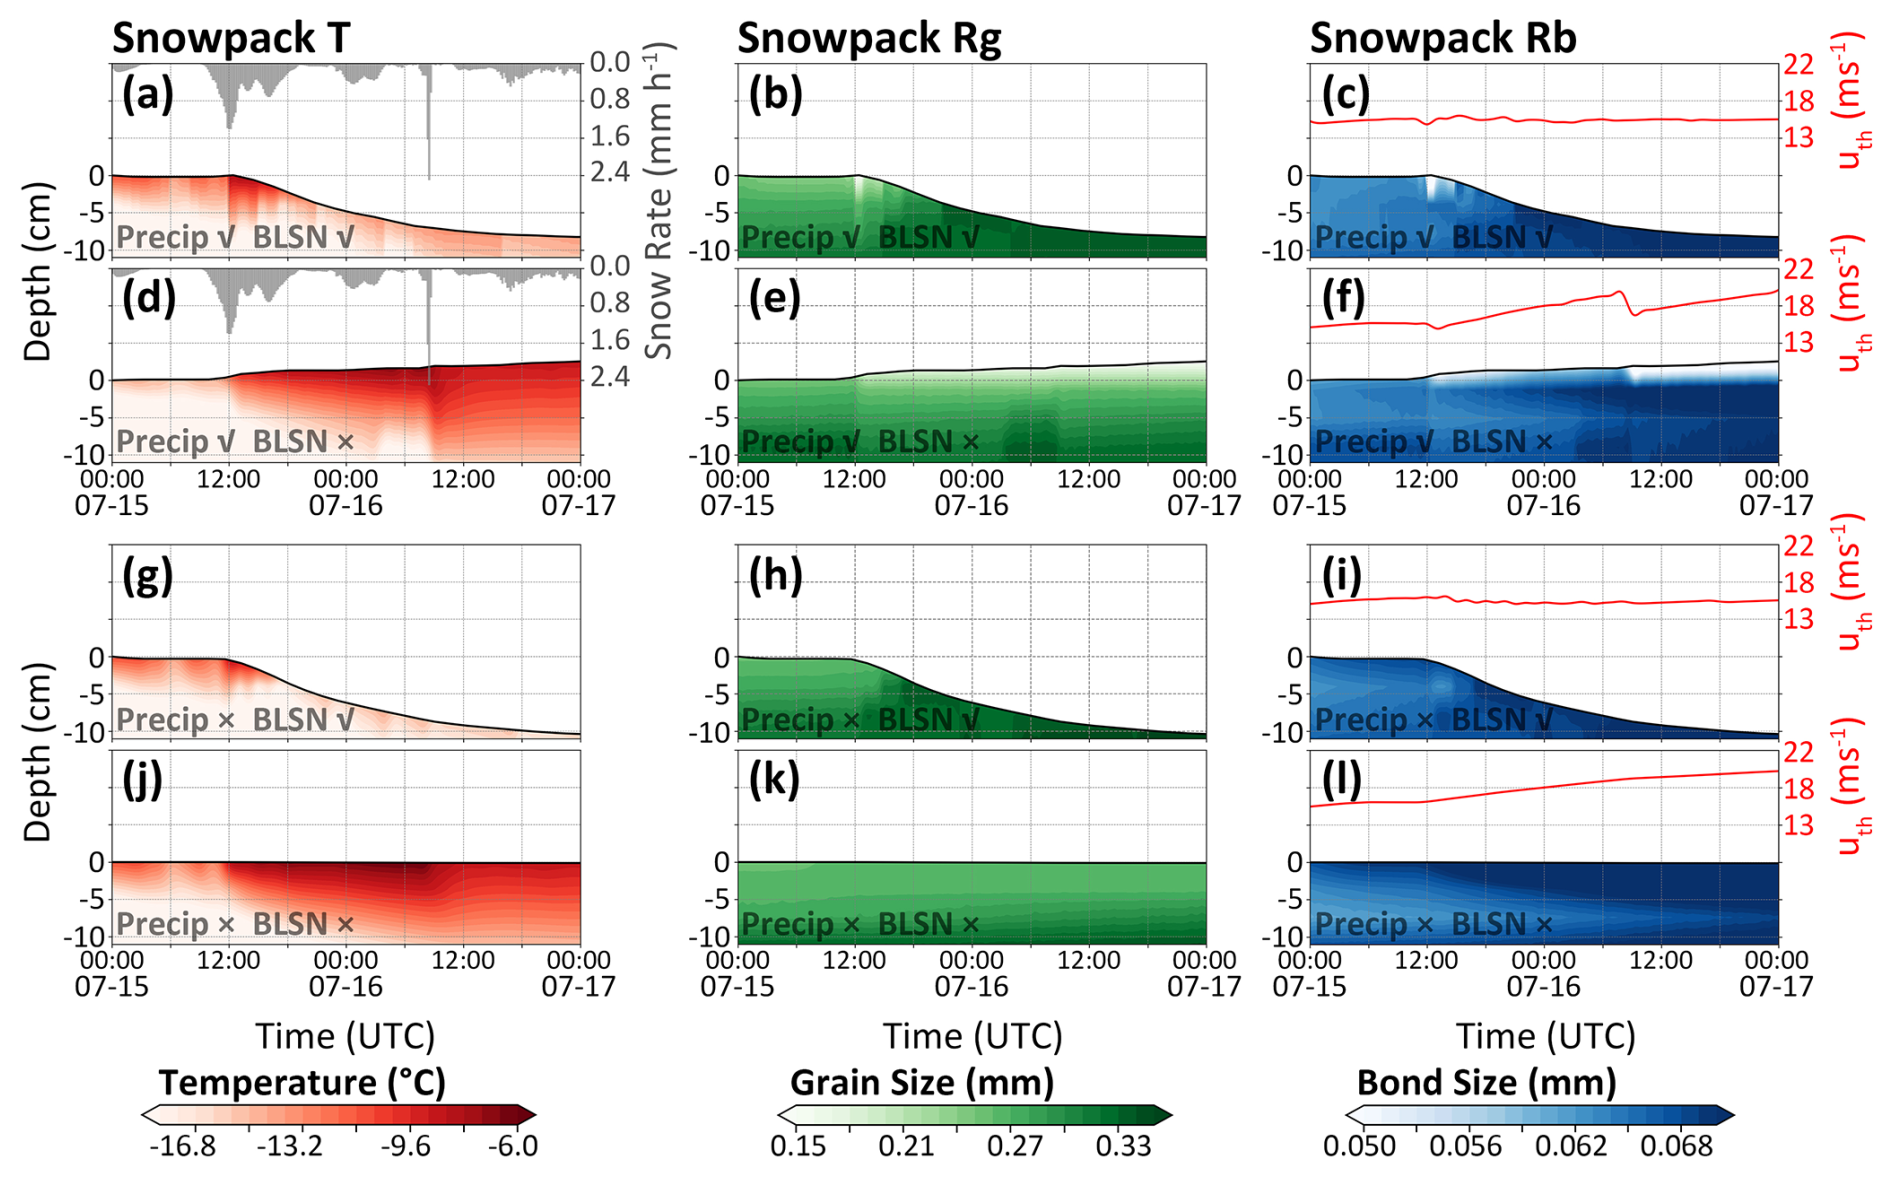
Figure 13Profiles of (a) snow layer temperature, (b) snow layer particle size, and (c) snow layer particle bond size over time in the control experiment. The black solid line represents the snow surface (with the initial time marked as 0 m). The gray histogram in (a) indicates the surface snowfall rate, and the red solid lines in (c) show the theoretical minimum wind speed threshold (at 10 m height) for snow particle saltation. The second to fourth rows are identical to the first row, except for the results of the sensitivity experiments. The sensitivity experiments test the impacts of turning on or off the snowdrift scheme and whether the land surface receives snowfall. The sensitivity configurations are marked by check or cross symbols at the lower-left corner of the first column of figures.
The most obvious contrast shows that snow depth remains unchanged when neither blowing snow nor snowfall is considered (Fig. 13j), snow depth increases gradually when only snowfall is included without accounting for blowing snow erosion (Fig. 13d), and when only erosion is considered, snow depth decreases significantly after the onset of strong surface winds at 11:00 UTC on 15 July 2022, with the erosion loss of snow exceeding the precipitation supply (compare Fig. 13a with g). This indicates that the online-coupled CRYOWRF model can effectively handle the mass exchange between the atmosphere and the land surface. Meanwhile, the SNOWPACK land surface process is also capable of rapidly responding to atmospheric temperature and wind. As the cyclone's warm front arrived around 11:00 UTC on 15 July 2022, the snow layer temperature began to rise significantly, particularly in the two sets of sensitivity experiments without blowing snow. This is likely because the exclusion of wind erosion allowed the surface snow layer sufficient time for heat exchange with the atmospheric underlying surface. In addition, the effects of wind erosion and temperature increase are also fully reflected in the land surface process. It can be seen from the two experiments without considering snowfall that when blowing snow is present, the surface snow layer is quickly removed, exposing the underlying snow layer with larger particle sizes (Fig. 13h); when there is no blowing snow, the particle size shows almost no change (Fig. 13k), but the bond size of the snow layer gradually increases under the influence of temperature increase (Fig. 13l).
However, even though the model has achieved effective online coupling, the issue in this case appears to lie in the critical wind speed threshold for blowing snow. By jointly applying the calculation formula for the saltation friction velocity threshold (, Lehning et al., 2000) and the logarithmic wind profile of boundary layer, the wind speed threshold at 10 m height in the atmosphere (uth) required to initiate snow particle saltation can be derived, based on the snow layer properties (using the average value of the 0.05 m top layer of the snow layer) provided by the SNOWPACK model. The results are shown by the red solid lines in Fig. 13. It indicates that in the two sets of experiments without blowing snow (Fig. 13f and l), the minimum wind speed threshold shows an upward trend, which is mainly related to increases in snow layer temperature, even though fresh snow can reduce the critical wind speed to a certain extent due to its smaller particle bonding size. In the two sets of experiments with blowing snow, the critical wind speed threshold remained between 15–16 m s−1, which was higher than the 10 m wind speed simulated by the model after 06:00 UTC on 16 July 2022 (Fig. 3a), thus making it difficult for snow particles to undergo saltation and form blowing snow. This is likely the main reason for the discrepancy between the simulation and observations. Drawing on the statistical results of Ye et al. (2025), only a wind speed of approximately 5 m s−1 is required to generate significant blowing snow after snowfall at the St. ZS site. This indicates that, at least for this site, further refined and multi-variable joint measurements are needed to improve the existing empirical formulas, thereby more accurately depicting the blowing snow process.
4.3 Impact of blowing snow on mass balance and wind speed
Based on the aforementioned sensitivity experiments, the changes in snow depth during the entire event (00:00 UTC 15 July–00:00 UTC 17 July 2022) are further analyzed, as shown in Fig. 14. A comparison between the control experiment (Fig. 14a, considering both blowing snow and snowfall), and the difference between the control experiment and the sensitivity experiment (excluding blowing snow) (Fig. 14b, reflecting the contribution of blowing snow) reveals that snowfall was the primary source of surface snow accumulation on the ice sheet during the event. The regions with the most significant increase in snow depth correspond to the high precipitation areas induced by the cyclone (Fig. 8b). The overall contribution of blowing snow to snow accumulation is not significant, which may be attributed to two factors. On one hand, blowing snow induces snow layer loss through erosion; on the other hand, it transfers snow from upstream through advection and deposition processes. The most significant erosion occurred along the coast of Prydz Bay (including the St. ZS region) and the leading edge of the Amery Ice Shelf. Combined with previous simulation analyses, these regions have relatively low total snowfall and are located in the core area of downslope windstorms, resulting in significant snow loss during the entire event.
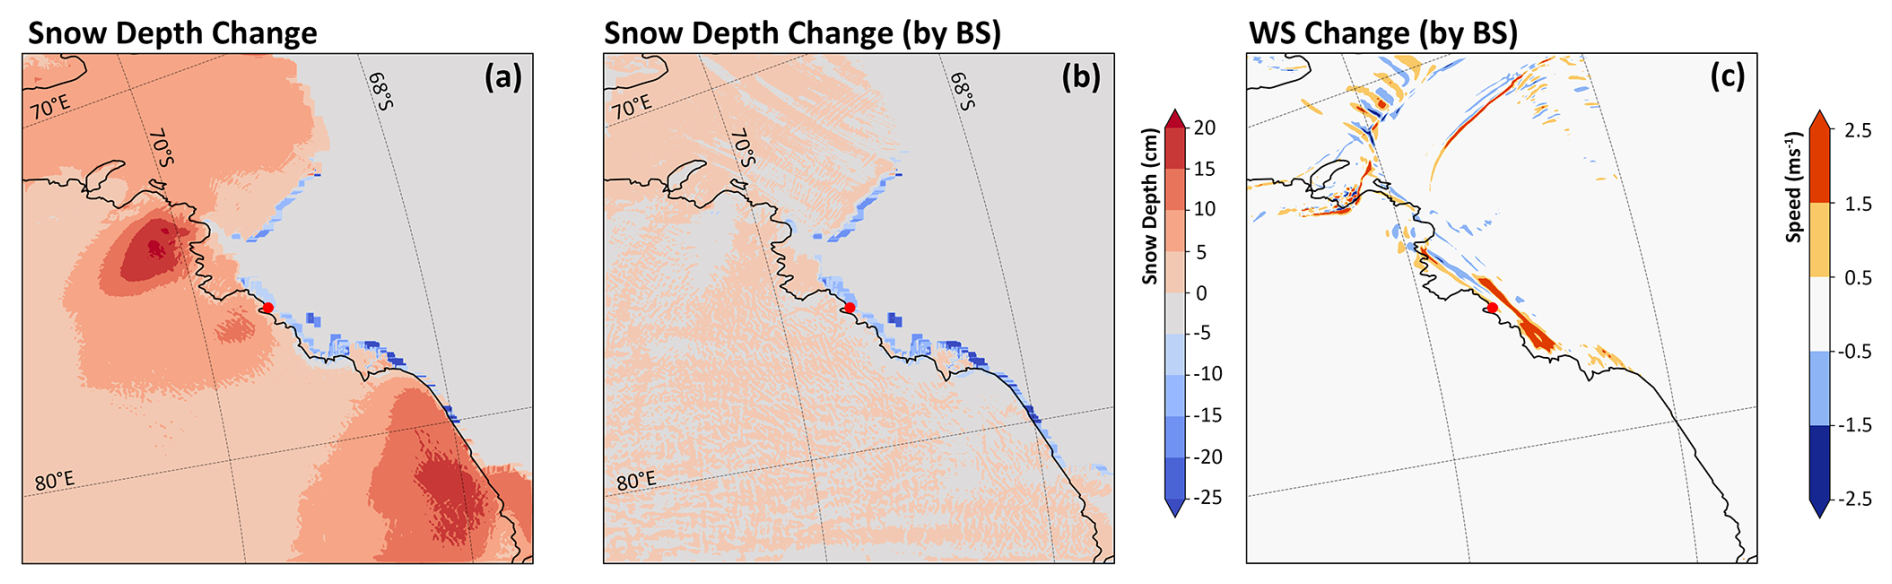
Figure 14(a, b) Changes of snow depth during the event (from 00:00 UTC on 15 July 2022–00:00 UTC on 17 July 2022) for (a) combined effects of blowing snow and snowfall (control experiment), and (b) effects of blowing snow (control experiment minus the sensitivity experiment excluding blowing snow); (c) Changes of wind speed at 18:00 UTC on 15 July 2022 (control experiment minus the sensitivity experiment excluding blowing snow).
In addition, an early study based on observational statistics found that blowing snow can enhance wind speed by increasing the density of downslope winds (Kodama et al., 1985); this phenomenon may be difficult to reproduce in models without online coupling. The existing CRYOWRF model already includes the blowing snow mixing ratio (qbs) as a hydrometeor component, which participates in the calculation of fluid density. Therefore, the introduction of blowing snow could affect the wind speed simulations. In this case, the impact of blowing snow on wind speed at 18:00 UTC 15 July 2022 is quantified through the difference between the above-mentioned control experiment and sensitivity experiment (Fig. 14c). It can be seen that significant wind speed changes occurred in the Prydz Bay region north of St. ZS, downstream of the Vestfold Hills, as well as in the cyclonic front and the area ahead of the front (located on the Amery Ice Shelf). Meanwhile, a comparison with Fig. 8d reveals that these regions with significant wind speed changes are exactly situated in the area with a strong gradient of blowing snow mixing ratio, which appears to support the aforementioned argument. However, the results may also be influenced by other factors. Firstly, the inclusion of blowing snow in the model not only changes density but also triggers processes such as phase transitions. Secondly, due to the long-term integration of the model, cumulative effects may occur because initial perturbations caused by the impact of blowing snow particles on fluid density evolve and accumulate through the continuous feedback loop between the snow surface and the atmospheric boundary layer. Finally, affected by the significant horizontal pressure gradient force caused by the weather system and the Coriolis force, the scenario of this case differs greatly from that the katabatic force caused solely by near-surface stratification. Therefore, the results of this sensitivity experiment have uncertainties. Nevertheless, the dynamic impact of blowing snow on ambient wind speed deserves attention, as it may trigger significant chain reactions with land surface processes and increase the complexity of research on this issue.
This study employs the numerical model CRYOWRF to simulate and reproduce a representative case in which a cyclone system intruded into the Antarctic marginal zone, ultimately inducing severe gale and blowing snow phenomena. The high-resolution simulations distinctly reveals that several key physical processes, including atmospheric dynamic processes, topographic-induced perturbations, the occurrence and accumulation of snowfall, and snowpack erosion, interacted in a synergistic manner during this meteorological event.
Although katabatic winds in Antarctica exhibit strong regularity, under the influence of intense weather systems, both the pressure gradient force and the Coriolis force undergo dynamic changes; this causes air currents to flow through steep terrain at varying speeds and directions, easily triggering typical non-hydrostatic processes such as hydraulic jumps and downslope storms. However, most current regional climate models are hydrostatic models, and using them to assess the contribution of blowing snow to the surface mass balance may lead to significant uncertainties. Meanwhile, intense weather systems bring combined effects of temperature fluctuations, strong winds, and snowfall, resulting in significant changes in snowpack properties. These snowpack properties play a decisive role in the critical wind speed required to initiate blowing snow, which means existing parameterization schemes still demand continuous improvement. Gerber et al. (2023) also confirmed this issue in their evaluation of the CRYOWRF model, while the model can well reproduce the overall distribution of blowing snow at the continental scale, the parameters used for saltation calculation carry substantial uncertainties that may in turn lead to inaccuracies in the calculation of blowing snow mass flux.
It is important to note that accurate observations remain an indispensable link for the improvement of model simulations. However, on the one hand, conducting blowing snow observations in Antarctica is highly challenging, especially in plateau regions with harsh environments; for instance, Amory et al. (2021) pointed out that due to the lack of data support, the performance of blowing snow simulation results in high-altitude areas remains unclear, which may have a significant impact on the assessment of surface mass balance. On the other hand, the accuracy of observations is worthy of attention. Existing observations usually employ instruments such as FlowCapt sensors (Cierco et al., 2007) and snow particle counters (Sato et al., 1993), which are installed very close to the ground to observe the saltation process of snow particles (Amory, 2020; Trouvilliez et al., 2015; Scarchilli et al., 2010; Gallée et al., 2013). However, the results in this study suggest that the contributions from long-distance transport and preferential deposition of precipitation (Lehning et al., 2008) are also of non-negligible importance. Because instruments like FlowCapt actually measure the total airborne snow during high-wind events, misinterpreting these external contributions as part of the local saltation process may lead to biased parameterizations in blowing snow models; such phenomena deserve particular attention in the coastal margin regions of Antarctica.
Based on the above analysis, future research should focus on two key aspects. First, enhance the three-dimensional observation capability of blowing snow. In addition to conducting long-term measurements of saltation flux and surface meteorological elements, supplementary three-dimensional observations of profiles, cloud and snowfall, as well as snowpack property observations should be carried out simultaneously to improve observation reliability. Second, continuously optimize the parameterization schemes for polar land surface processes and blowing snow, conduct comprehensive verification and evaluation across multiple sites, quantify the specific contributions to the mass balance from various processes involved in blowing snow during complex events, including saltation, suspension, sublimation, and deposition, and enhance the short-range nowcasting capabilities for such high-impact weather events in polar regions.
The model data supporting the findings of this study can be accessed at https://doi.org/10.5281/zenodo.18213206 (Wang, 2026). Additional details regarding the observed and reanalysis data are provided in Sect. 2.
JD and XW conceptualized the original ideas presented in this manuscript. JD performed the analysis of the model results and wrote the initial draft of the manuscript. XW, YS, YLS, JM, JY, XL, and LL contributed to the interpretation of results, manuscript preparation, and revisions. JD and YS carried out the model simulations. All authors contributed to the article and approved the final version.
The contact author has declared that none of the authors has any competing interests.
Publisher's note: Copernicus Publications remains neutral with regard to jurisdictional claims made in the text, published maps, institutional affiliations, or any other geographical representation in this paper. The authors bear the ultimate responsibility for providing appropriate place names. Views expressed in the text are those of the authors and do not necessarily reflect the views of the publisher.
The completion of this study was made possible by the support and assistance from multiple parties, to whom we extend our sincere gratitude. We would like to express our appreciation for the funding provided by the National Key R&D Program of China (grant-no.: 2021YFC2802501) and the National Natural Science Foundation of China (grant-no.: 42406259). Additionally, we are thankful to the Polar Research Institute of China, the National Marine Environment Forecasting Center, and the meteorological forecasters of the 38th Chinese Antarctic Expedition Team. Their professional support in the deployment of observation equipment and data collection at China's Zhongshan Station in Antarctica laid the foundation for obtaining valuable on-site observation data for this study. We are also grateful to the journal editors and reviewers for their constructive comments on the research results, which have effectively contributed to the improvement of the study.
This research has been supported by the National Key Research and Development Program of China (grant-no. 2021YFC2802501) and the National Natural Science Foundation of China (grant-no. 42406259).
This paper was edited by Xavier Fettweis and reviewed by Michael Lehning and two anonymous referees.
Amory, C.: Drifting-snow statistics from multiple-year autonomous measurements in Adélie Land, East Antarctica, The Cryosphere, 14, 1713–1725, https://doi.org/10.5194/tc-14-1713-2020, 2020.
Amory, C., Trouvilliez, A., Gallée, H., Favier, V., Naaim-Bouvet, F., Genthon, C., Agosta, C., Piard, L., and Bellot, H.: Comparison between observed and simulated aeolian snow mass fluxes in Adélie Land, East Antarctica, The Cryosphere, 9, 1373–1383, https://doi.org/10.5194/tc-9-1373-2015, 2015.
Amory, C., Kittel, C., Le Toumelin, L., Agosta, C., Delhasse, A., Favier, V., and Fettweis, X.: Performance of MAR (v3.11) in simulating the drifting-snow climate and surface mass balance of Adélie Land, East Antarctica, Geosci. Model Dev., 14, 3487–3510, https://doi.org/10.5194/gmd-14-3487-2021, 2021.
Bartelt, P. and Lehning, M.: A physical SNOWPACK model for the Swiss avalanche warning: Part I: numerical model, Cold Reg. Sci. Technol., 35, 123–145, https://doi.org/10.1016/S0165-232X(02)00074-5, 2002.
Clifton, A., Rüedi, J.-D., and Lehning, M.: Snow saltation threshold measurements in a drifting-snow wind tunnel, J. Glaciol., 52, 585–596, 2006.
Cierco, F.-X., Naaim-Bouvet, F., and Bellot, H.: Acoustic sensors for snowdrift measurements: How should they be used for research purposes?, Cold Reg. Sci. Technol., 49, 74–87, https://doi.org/10.1016/j.coldregions.2007.01.002, 2007.
Déry, S. J. and Yau, M. K.: A bulk blowing snow model, Bound.-Lay. Meteorol., 93, 237–251, https://doi.org/10.1023/A:1002065615856, 1999.
Déry, S. J. and Yau, M. K.: Large-scale mass balance effects of blowing snow and surface sublimation, J. Geophys. Res.-Atmos., 107, ACL 8-1–ACL 8-17, https://doi.org/10.1029/2001JD001251, 2002.
Essery, R., Li, L., and Pomeroy, J.: A distributed model of blowing snow over complex terrain, Hydrol. Process., 13, 2423–2438, 1999.
Gerber, F., Sharma, V., and Lehning, M.: CRYOWRF – Model evaluation and the effect of blowing snow on the Antarctic surface mass balance, J. Geophys. Res.-Atmos., 128, e2022JD037744, https://doi.org/10.1029/2022JD037744, 2023.
Gallée, H., Trouvilliez, A., Agosta, C., Genthon, C., Favier, V., and Naaim-Bouvet, F.: Transport of snow by the wind: A comparison between observations in Adélie Land, Antarctica, and simulations made with the regional climate model MAR, Bound.-Lay. Meteorol., 146, 133–147, https://doi.org/10.1007/s10546-012-9764-z, 2013.
Gallée, H., Guyomarc'h, G., and Brun, E.: Impact of snow drift on the Antarctic ice sheet surface mass balance: possible sensitivity to snow-surface properties, Bound.-Lay. Meteorol., 99, 1–19, https://doi.org/10.1023/A:1018776422809, 2001.
Gossart, A., Souverijns, N., Gorodetskaya, I. V., Lhermitte, S., Lenaerts, J. T. M., Schween, J. H., Mangold, A., Laffineur, Q., and van Lipzig, N. P. M.: Blowing snow detection from ground-based ceilometers: application to East Antarctica, The Cryosphere, 11, 2755–2772, https://doi.org/10.5194/tc-11-2755-2017, 2017.
Hersbach, H., Bell, B., Berrisford, P., Hirahara, S., Horányi, A., Muñoz-Sabater, J., Nicolas, J., Peubey, C., Radu, R., Schepers, D., Simmons, A., Soci, C., Abdalla, S., Abellan, X., Balsamo, G., Bechtold, P., Biavati, G., Bidlot, J., Bonavita, M., De Chiara, G., Dahlgren, P., Dee, D., Diamantakis, M., Dragani, R., Flemming, J., Forbes, R., Fuentes, M., Geer, A., Haimberger, L., Healy, S., Hogan, R. J., Hólm, E., Janisková, M., Keeley, S., Laloyaux, P., Lopez, P., Lupu, C., Radnoti, G., De Rosnay, P., Rozum, I., Vamborg, F., Villaume, S., and Thépaut, J.: The ERA5 global reanalysis, Q. J. R. Meteorolog. Soc., 146, 1999–2049, https://doi.org/10.1002/qj.3803, 2020.
Iacono, M. J., Delamere, J. S., Mlawer, E. J., Shephard, M. W., Clough, S. A., and Collins, W. D.: Radiative forcing by long-lived greenhouse gases: Calculations with the AER radiative transfer models, J. Geophys. Res.-Atmos., 113, D13103, https://doi.org/10.1029/2008JD009944, 2008.
Kain, J. S.: The Kain–Fritsch convective parameterization: an update, J. Appl. Meteorol., 43, 170–181, https://doi.org/10.1175/1520-0450(2004)043<0170:TKCPAU>2.0.CO;2, 2004.
Kodama, Y., Wendler, G., and Gosink, J.: The effect of blowing snow on katabatic winds in Antarctica, Ann. Glaciol., 6, 59–62, 1985.
Lilly, D. K.: A Severe Downslope Windstorm and Aircraft Turbulence Event Induced by a Mountain Wave, J. Atmos. Sci., 35, 59–77, https://doi.org/10.1175/1520-0469(1978)035<0059:ASDWAA>2.0.CO;2, 1978.
Lehning, M., Löwe, H., Ryser, M., and Raderschall, N.: Inhomogeneous precipitation distribution and snow transport in steep terrain, Water Resour. Res., 44, W07404, https://doi.org/10.1029/2007WR006545, 2008.
Lehning, M., Doorschot, J., and Bartelt, P.: A snowdrift index based on SNOWPACK model calculations, Ann. Glaciol., 31, 382–386, https://doi.org/10.3189/172756400781819770, 2000.
Lenaerts, J. T. M., van den Broeke, M. R., van Angelen, J. H., van Meijgaard, E., and Déry, S. J.: Drifting snow climate of the Greenland ice sheet: a study with a regional climate model, The Cryosphere, 6, 891–899, https://doi.org/10.5194/tc-6-891-2012, 2012.
Lenaerts, J. T. M. and van den Broeke, M. R.: Modeling drifting snow in Antarctica with a regional climate model: 2. Results, J. Geophys. Res.-Atmos., 117, D05109, https://doi.org/10.1029/2010JD015419, 2012.
Ligtenberg, S. R. M., Helsen, M. M., and van den Broeke, M. R.: An improved semi-empirical model for the densification of Antarctic firn, The Cryosphere, 5, 809–819, https://doi.org/10.5194/tc-5-809-2011, 2011.
Morrison, H., Curry, J. A., and Khvorostyanov, V. I.: A new double-moment microphysics parameterization for application in cloud and climate models. Part I: Description, J. Atmos. Sci., 62, 1665–1677, https://doi.org/10.1175/JAS3446.1, 2005.
Nakanishi, M. and Niino, H.: An improved Mellor–Yamada level-3 model with condensation physics: Its design and verification, Bound.-Lay. Meteorol., 112, 1–31, https://doi.org/10.1023/B:BOUN.0000020164.04146.98, 2004.
Parish, T. R. and Bromwich, D. H.: The surface windfield over the Antarctic ice sheets, Nature, 328, 51–54, 1987.
Parish, T. R. and Cassano, J. J.: Diagnosis of the katabatic wind influence on the wintertime Antarctic surface wind field from numerical simulations, Mon. Weather Rev., 131, 1128–1139, https://doi.org/10.1175/1520-0493(2003)131<1128:DOTKWI>2.0.CO;2, 2003.
Palm, S. P., Yang, Y., Spinhirne, J. D., and Marshak, A.: Satellite remote sensing of blowing snow properties over Antarctica, J. Geophys. Res.-Atmos., 116, D16123, https://doi.org/10.1029/2011JD015828, 2011.
Palm, S. P., Kayetha, V., Yang, Y., and Pauly, R.: Blowing snow sublimation and transport over Antarctica from 11 years of CALIPSO observations, The Cryosphere, 11, 2555–2569, https://doi.org/10.5194/tc-11-2555-2017, 2017.
Pomeroy, J. W., Gray, D. M., and Landine, P. G.: The prairie blowing snow model – Characteristics, validation, operation, J. Hydrol., 144, 165–192, https://doi.org/10.1016/0022-1694(93)90171-5, 1993.
Priestley, M. D., Ackerley, D., Catto, J. L., Hodges, K. I., McDonald, R. E., and Lee, R. W.: An overview of the extratropical storm tracks in CMIP6 historical simulations, J. Climate, 33, 6315–6343, https://doi.org/10.1175/JCLI-D-19-0928.1, 2020.
Scarchilli, C., Frezzotti, M., Grigioni, P., De Silvestri, L., Agnoletto, L., and Dolci, S.: Extraordinary blowing snow transport events in East Antarctica, Clim. Dynam., 34, 1195–1206, https://doi.org/10.1007/s00382-009-0601-0, 2010.
Stoll, P. J.: A global climatology of polar lows investigated for local differences and wind-shear environments, Weather Clim. Dynam., 3, 483–504, https://doi.org/10.5194/wcd-3-483-2022, 2022.
Souverijns, N., Gossart, A., Gorodetskaya, I. V., Lhermitte, S., Mangold, A., Laffineur, Q., Delcloo, A., and van Lipzig, N. P. M.: How does the ice sheet surface mass balance relate to snowfall? Insights from a ground-based precipitation radar in East Antarctica, The Cryosphere, 12, 1987–2003, https://doi.org/10.5194/tc-12-1987-2018, 2018.
Sharma, V., Gerber, F., and Lehning, M.: Introducing CRYOWRF v1.0: multiscale atmospheric flow simulations with advanced snow cover modelling, Geosci. Model Dev., 16, 719–749, https://doi.org/10.5194/gmd-16-719-2023, 2023.
Sato, T., Kimura, T., Ishimaru, T., and Maruyama, T.: Field test of a new snow-particle counter (SPC) system, Ann. Glaciol., 18, 149–154, https://doi.org/10.3189/S0260305500011411, 1993.
Turner, J., Chenoli, S. N., Abu Samah, A., Marshall, G. J., Phillips, T., and Orr, A.: Strong wind events in the Antarctic, J. Geophys. Res.-Atmos., 114, D18103, https://doi.org/10.1029/2008JD011642, 2009.
Trouvilliez, A., Naaim-Bouvet, F., Bellot, H., Genthon, C., and Gallée, H.: Evaluation of the FlowCapt Acoustic Sensor for the Aeolian Transport of Snow, J. Atmos. Ocean. Tech., 32, 1630–1641, https://doi.org/10.1175/JTECH-D-14-00104.1, 2015.
van Wessem, J. M., van de Berg, W. J., Noël, B. P. Y., van Meijgaard, E., Amory, C., Birnbaum, G., Jakobs, C. L., Krüger, K., Lenaerts, J. T. M., Lhermitte, S., Ligtenberg, S. R. M., Medley, B., Reijmer, C. H., van Tricht, K., Trusel, L. D., van Ulft, L. H., Wouters, B., Wuite, J., and van den Broeke, M. R.: Modelling the climate and surface mass balance of polar ice sheets using RACMO2 – Part 2: Antarctica (1979–2016), The Cryosphere, 12, 1479–1498, https://doi.org/10.5194/tc-12-1479-2018, 2018.
Vignon, É., Picard, G., Durán-Alarcón, C., Alexander, S. P., Gallée, H., and Berne, A.: Gravity wave excitation during the coastal transition of an extreme katabatic flow in Antarctica, J. Atmos. Sci., 77, 1295–1312, https://doi.org/10.1175/JAS-D-19-0264.1, 2020.
Wang, X.: Numerical Simulation of a Severe Blowing Snow Event over the Prydz Bay Region, Zenodo [data set] https://doi.org/10.5281/zenodo.18213206, 2026.
Ye, J., Liu, L., Ding, J., Liu, X., Xie, H., and Chen, Y.: First blowing snow measurement at Zhongshan Station in Antarctica using ceilometer, Adv. Atmos. Sci., 42, 1–11, https://doi.org/10.1007/s00376-024-4172-0, 2025.