
the Creative Commons Attribution 4.0 License.
the Creative Commons Attribution 4.0 License.
 | 15 Oct 2026
Brief communication: Mass balance of glaciers in the Eastern Hindu Kush from 1979 to 2002 using KH-9 panoramic and SPOT-5 stereo imagery
Azka Ramzan

Sajid Ghuffar
Glaciers exhibit region-specific mass loss patterns in response to ongoing climate change. In this study, we provide a geodetic mass balance assessment for glaciers within the Hindu Kush region spanning the period 1979–2002, utilizing KH-9 panoramic imagery and SPOT-5 stereo satellite imagery. Our analysis reveals a moderate mass loss of m w.e. a−1, a rate similar to post-2000 observations given their uncertainties. We found that debris-covered glaciers and clean-ice glaciers experienced a nearly similar mass loss at the respective rates of and m w.e. a−1, which is close to the regional mass balance. However, we observe that most of the retreating glaciers are clean-ice with the highest retreat of 2.4 km. Additionally, we discuss and analyze the response of the surging glaciers, and observe a mass loss of and m w.e. a−1 for surging and non-surging glaciers, respectively. These observations represent the first geodetic mass balance estimates for the Eastern Hindu Kush prior to 2000, extending the temporal record of glacier change by two decades and revealing that moderate mass loss has been sustained since the late 1970s, similar to the post-2000 observations.
- Article
(3720 KB) - Full-text XML
-
Supplement
(4799 KB) - BibTeX
- EndNote


The global acceleration in the mass loss of glaciers has become a serious concern and is ascribed to the ongoing climate change (Hugonnet et al., 2021; Ciracì et al., 2020; Gardner et al., 2013). However, in the High Mountain Asia (HMA), historical images reveal that glaciers have been losing mass since the 1960s (Bhattacharya et al., 2021; Zhao et al., 2020; King et al., 2019; Maurer et al., 2019; Zhou et al., 2017). Mountain glaciers of HMA are important freshwater resource on which downstream communities are reliant for drinking water, agriculture, power generation, and domestic use. Increasing mass loss of these glaciers can cause disastrous effects such as floods, landslides and can eventually deplete water resources leading to food and water insecurity (Wang et al., 2024). The glacier response to climate change is regionally heterogeneous varying from slightly positive to highly negative mass changes and factors such as debris cover and surge activity make the glacier response to climate change further variable (Miles et al., 2021; Romshoo et al., 2024; Zhao et al., 2024; Ke et al., 2024).
The Hindu Kush region is situated to the south of the Pamir and west of the Karakoram, spanning the Pakistan-Afghanistan border region (as shown in Fig. 1). The highest peak of Hindu Kush is Tirich Mir (7708 m), while most glaciers are at elevations above 3000 m. The largest glacier, the Atrak Glacier (see Fig. S1 in the Supplement), covers an area of approximately 90 km2. The total area of the glaciers in the Eastern Hindu Kush region is nearly 3000 km2. In this study we focus on the region covering the border between Pakistan (Chitral district) and Afghanistan (Wakhan corridor), which contains the largest concentration of glaciers in the Eastern Hindu Kush region. We provide mass balance of 265 glaciers covering an area of around 1050 km2. According to the surge glacier inventory of Guo et al. (2023), there are nine surge-type glaciers (classified as verified and probable in Guo et al., 2023) in this study area (see Fig. S2 in the Supplement). Climatically, the Hindu Kush falls under the influence of westerlies, receiving snowfall primarily during winter, whereas ablation primarily occurs from April to October, lasting somewhat longer at lower elevations (Scher et al., 2021). Glacier meltwater from this region feeds into the Chitral River – also known as the Kunar or Kabul River in subsequent regions – supplying freshwater resources to areas in Afghanistan and Pakistan before eventually joining the Indus River. While studies have shown that the glaciers in the Karakoram and Pamir have remained stable in the pre-2000 time period (Bhattacharya et al., 2021; Bolch et al., 2017; Zhou et al., 2017), there is a scarcity of observations for the Hindu Kush region. Therefore, in this study we focus on the pre-2000 time period for Hindu Kush glaciers mass balance estimation.
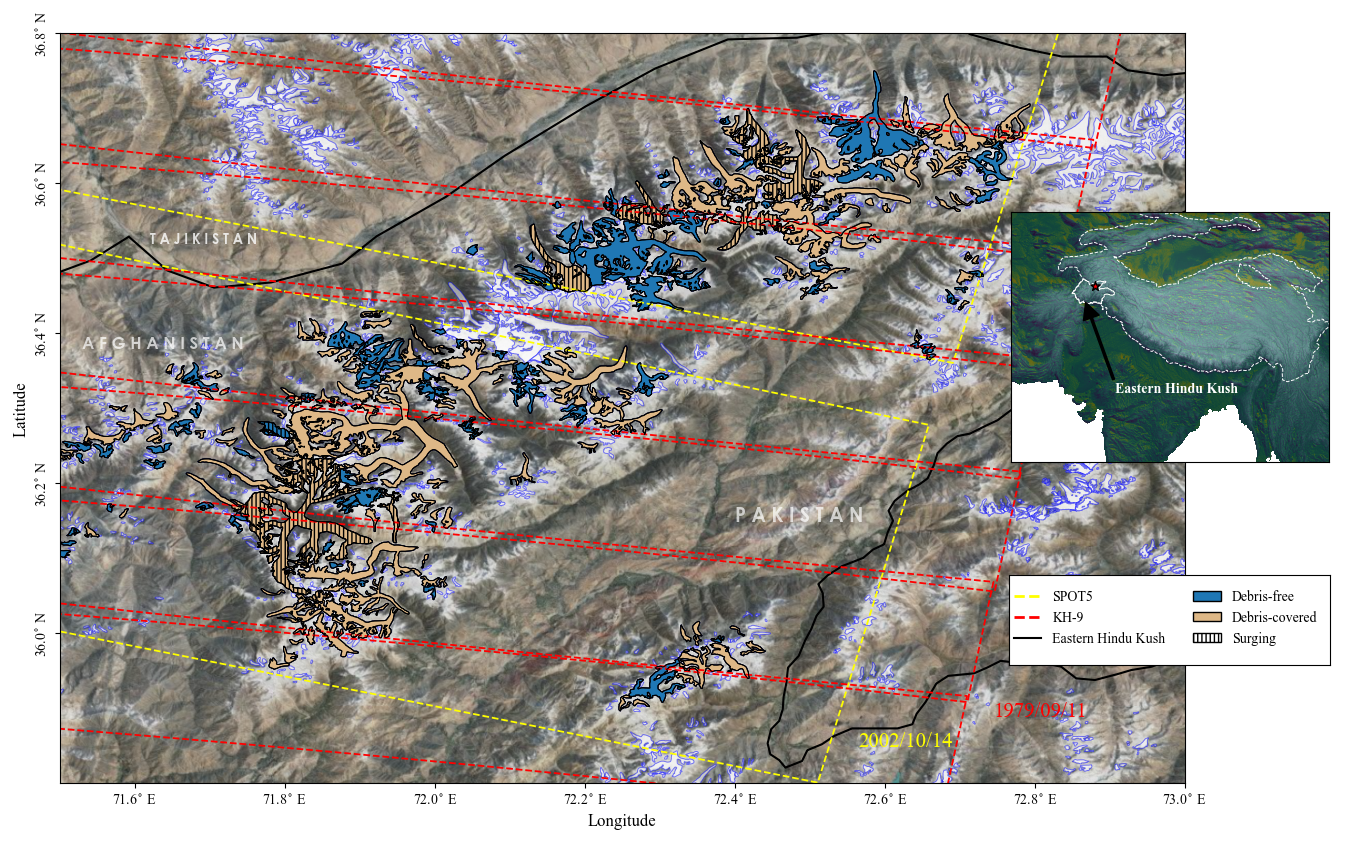
Figure 1Glaciers of the Eastern Hindu Kush region. Mass balance is computed for glaciers which fall within the stereo coverage of both KH-9 and SPOT-5 and have an area >0.5 km2.
Regional glacier mass balance studies have estimated a moderate mass loss in the Hindu Kush region. Specifically, Brun et al. (2017) estimated a mass loss of m w.e. a−1 from 2000–2016 using the Advanced Spaceborne Thermal Emission and Reflection Radiometer (ASTER) stereo images, Shean et al. (2020) has shown a mass loss of ( m w.e. a−1) from 2000–2018 using high resolution satellite stereo imagery and ASTER Digital Elevation Models (DEMs), while (Hugonnet et al., 2021) has computed a mass loss of m w.e. a−1 from 2000–2019 using ASTER DEMs. During the period 2000–2008, Scherler et al. (2011) also observed stagnation or slow retreat in Hindu Kush. Wang et al. (2017) show that 1 m anomaly in precipitation is associated with 5.5±1.6 m w.e. change in the Hindu Kush and also observed an elevation change trend of m a−1. Gardelle et al. (2013) observed a mass loss of m w.e. a−1 for the glaciers in north-eastern Hindu Kush and that the thinning of clean-ice glaciers is higher compared to debris-covered using SPOT-5 HRG stereo images and SRTM. For almost the same glaciers, Lin et al. (2017) obtained mass loss of m w.e. a−1 using TerraSAR-X/TanDEM-X and SRTM radar datasets whereas Zhou et al. (2018) obtained a mass loss of m w.e. a−1 during 1973–2000 using KH-9 mapping camera and SRTM. Sarikaya et al. (2012) observed that retreating glaciers dominated the Hindu Kush region from 1976–2007 using Landsat and ASTER images. Using ICESat-1, Kääb et al. (2012) estimated high thinning ( m a−1) during the period 2003–2009. Only the study by Zhou et al. (2018) extends the mass balance of Hindu Kush glaciers before the year 2000, which is based on the Chianter and neighboring glaciers – the area is ambiguously known as Hindu Kush or Hindu Raj; Gardelle et al. (2013) and Lin et al. (2017) also uses similar sample of glaciers to represent the mass balance of Hindu Kush. The current study analyses glaciers different from Zhou et al. (2018), including a combination of debris-covered and surge-type glaciers.
This study employs the KH-9 panoramic imagery in contrast to the mapping camera used in previous studies; the KH-9 panoramic cameras had a high spatial resolution of around 60 cm. The KH-9 panoramic imagery of the study area consists of seven stereo pairs from September 1979 (as given in Table 1). The KH-9 DEM from this data was computed following the Corona Stereo Pipeline (CoSP) (Ghuffar et al., 2022, 2023). GCPs were automatically extracted using LightGlue (Lindenberger et al., 2023) and Sentinel-2 imagery, while the dense matching was performed using a variant of SGM implemented in MicMac (Rupnik et al., 2017). The dense point cloud was registered to the reference DEM using tile-based Least Squares Matching approach using 3D affine transformation and then interpolated into the raster DEM.
To represent the post-2000 period, data acquired by the High Resolution Stereoscopic (HRS) sensor onboard SPOT-5 was used which contains two cameras pointed at 20° forward and backward from the nadir and obtained data with a resolution of 5 m × 10 m in the panchromatic band. Images acquired before the accumulation season and with the least cloud cover were searched. Based on availability, we used SPOT-5 stereo images from October, 2002 and used Ames Stereo Pipeline (ASP) for stereo processing. Semi Global Matching (SGM) was employed for dense matching, and the final DEMs were produced at 20 m resolution (Beyer et al., 2018; Hirschmuller, 2007). The SPOT-5 DEM coregistration was carried out based on stable terrain using the Nuth and Kääb method (Nuth and Kääb, 2011) and bias correction was applied where required.
The Shuttle Radar Topography Mission (SRTM) DEM was used as reference for KH-9 and SPOT-5 DEM coregistration. Randolph Glacier Inventory (RGI) version 7.0, which is based on Landsat TM and ETM+ images mainly from the year 2002, was used for glacier outlines. We modified RGI outlines of the glaciers that retreated during the study period to represent the glacier extent from 1979, as indicated by the KH-9 orthoimages and DEMs. The RGI glacier outlines were also edited to represent the termini positions of some glaciers for the year 2002. The mass balance of 265 glaciers (size >0.5 km2), which fall within the stereo coverage of the scenes covering an area of approximately 1050 km2 are computed. The surging glacier inventory by Guo et al. (2023) was used to identify surging glaciers. Debris cover was mapped using Landsat-7 ETM+ images from August 2002. Clean ice and the debris-covered ice was differentiated using Red/SWIR, and the pixels <2 were taken as debris-covered. Glaciers where debris cover constitutes more than 15 % of the area are considered debris-covered.
After KH-9 and SPOT-5 DEM differencing, the values outside ±150 m were removed from the elevation change, assuming that glacier changes of such magnitude are unlikely. The obtained elevation-change grid showed anomalously high negative values in the accumulation zone; these values were removed by normalizing elevation and using a sigmoid function (see the supplementary of Barandun et al., 2021) to remove outliers (Pieczonka and Bolch, 2015). Next, the values outside ±3 standard deviation from each 50 m elevation bin were removed for each glacier. Then,we removed glaciers that lost >30 % of data during the filtering process. To fill the voids in the elevation change grid, Gap filling was performed using local hypsometric interpolation (McNabb et al., 2019). Voids occur in the DEMs due to occlusions and lack of texture in the stereo images as well as due to the filtering process.
Table 1Datasets.

∗ Only the aft images of KH-9 stereo pair are shown.
The glacier mass balance was computed based on hypsometric bins at 50 m elevation intervals using the xDEM library (Dehecq et al., 2022).
To compute the uncertainty of individual glaciers, we considered the stable surface at 1000 m buffer around each glacier. Following (Rolstad et al., 2009) and (Fischer et al., 2015), the random component of the elevation uncertainty is
where σstable is the standard deviation of elevation differences over stable terrain (see Fig. S3), Aglac is the glacier area, and L is the spatial correlation length, assumed to be 500 m. The systematic error was estimated as the mean elevation difference over the stable terrain,
The total elevation uncertainty for each glacier was then obtained by combining the random and systematic components in quadrature,
The uncertainty in glacier volume change is σΔV=AσΔz, where A is the glacier area. The total mass-balance uncertainty was calculated by propagating the uncertainties associated with glacier volume change, the density conversion factor (850±60 kg m−3) (Huss, 2013), and glacier area as:
where f=850 kg m−3 is the density conversion factor, σf=60 kg m−3 is its uncertainty, ρw=1000 kg m−3 is the density of water, Δt=23 years is the observation period, and σA is the absolute glacier-area uncertainty ( assumed to be 10 %).
For the uncertainty associated with glacier subgroups (e.g., debris-covered or surging glaciers) as well as region-wide uncertainty, the error in elevation change (σΔz) was computed separately across 50 m hypsometric bins (Gardelle et al., 2013; Bolch et al., 2017; Ren et al., 2022) for the whole glacier area, followed by the bin area weighted aggregation. For each 50 m elevation bin i, the effective number of independent observations was calculated as
where Ntot,i is the number of valid stable-terrain pixels in the elevation bin, PS is the pixel size (20 m), and L is the spatial correlation length (500 m). The random and systematic elevation errors were added in quadrature for each bin.
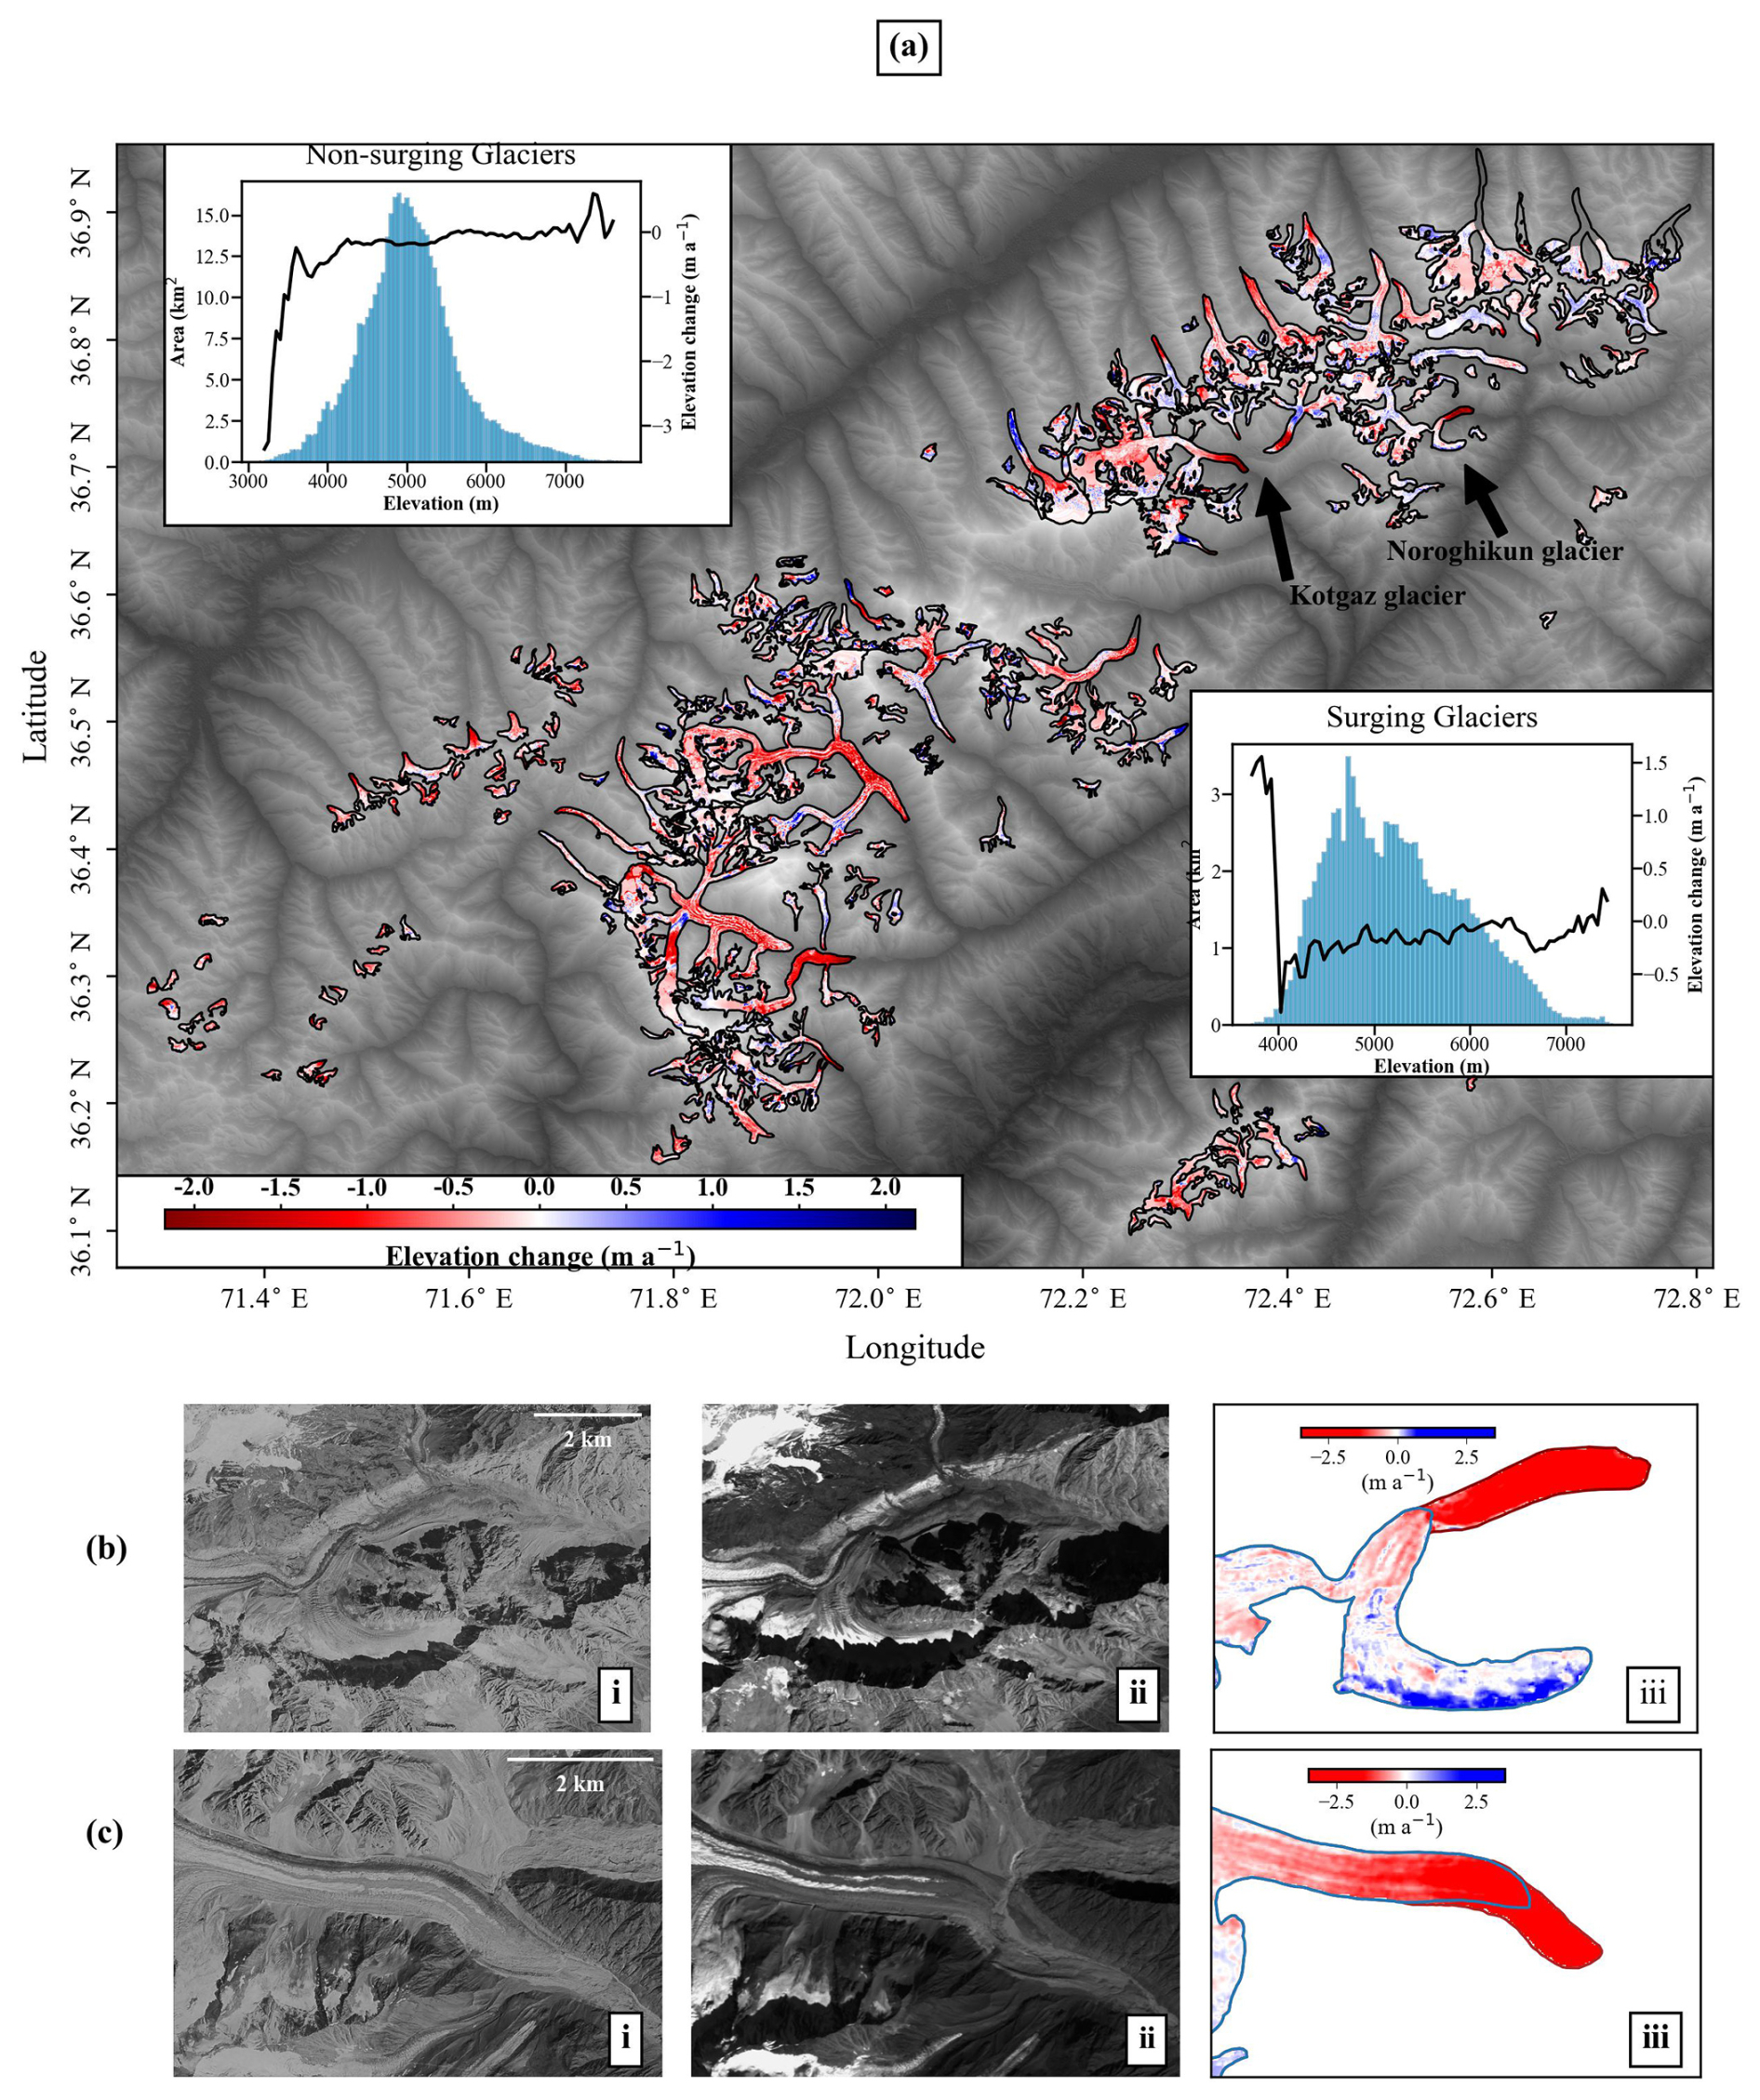
Figure 2(a) Elevation change of the studied glaciers in Eastern Hindu Kush during 1979–2002, (b) and (c) show the retreat of Noroghikun and Kotgaz glacier respectively. From (i) to (iii): orthoimage of KH-9, orthoimage of SPOT-5, glacier outlines before and after retreat and elevation change at the front of glacier under retreat.
During the period 1979–2002, mass balance of glaciers we studied is m w.e. a−1, which corresponds to a loss of nearly 3.4 Gt of mass over 23 years. For comparison, we computed the mass balance for glaciers in the current study using elevation change grids from the post-2000 studies and observed that our results show similar mass loss rate given the uncertainties of estimation (see Fig. S4 in the Supplement).
In the studied region, some glaciers show high frontal thinning, reaching an elevation change of below −3 m a−1. The highest retreat of about 2.4 km was observed at Noroghikun glacier (possible surging glacier according to Guo et al., 2023), which caused its terminus to shift from an elevation of 3286 to 3640 m (see Fig. 2). Significant retreat of 1.3 km is also observed at Kotgaz glacier where elevation of terminus changed from 3450 to 3627 m. Kotgaz glacier also showed high thinning with a mass loss at m w.e. a−1 and is one of the prominent retreating glaciers in the region. In the studied region of the Hindu Kush, glacier retreat is generally observed at elevations below 4400 m. RGI2000-v7.0-G-14-01959 and RGI2000-v7.0-G-14-06147 (henceforth ids will be refered to as G-14-06147) are from the few glaciers that experienced retreat above 4200 m. During our analysis, we observed that the post-retreat glacier termini did not match the RGI outlines (also based on 2002), and we manually adjusted the termini positions for the year 2002.
The elevation of the Hindu Kush peaks at the Tirich Mir which surrounds glaciers showing a variable and complex melting pattern. Atrak and Tirich (also known as Upper Tirich glacier), which are the largest glaciers in the study area, are losing mass at and m w.e. a−1 during the study period, respectively. The Lower Tirich glacier (G-14-02464), which is crevassed with a band-like appearance, shows high mass loss at m w.e. a−1. The North Barum glacier (G-14-02549) shows a mass balance of m w.e. a−1 with retreat of 550 m, whereas its neighboring South Barum glacier (G-14-02551) shows mass loss at m w.e. a−1. The meltwater from North and South Barum glaciers drain directly into the Barum Gol. Here, the Owir glacier (G-14-02536) situated between South Barum and the Dirgol glacier shows a mass loss at m w.e. a−1. In contrast, the Dirgol glacier (G-14-02482) exhibits mass loss at m w.e. a−1. G-14-02500 shows a high mass loss at m w.e. a−1; the meltwater has created a proglacial lake known as Pindoru chaat, which has undergone rapid expansion during the recent years. In contrast its neighbouring glacier G-14-02522, which is also linked with a proglacial lake, shows lake expansion during the study period but exhibits stability after the post-2000 period. In the westernmost part of the study area, G-14-06147 has a high mass loss of m w.e. a−1 while the neighboring glaciers G-14-06056 and G-14-06098, which share almost the same attributes, show a relatively low mass loss at and m w.e. a−1. Compared to neighbouring glaciers, G-14-06147 has experienced higher thinning in the ablation zone. Glaciers situated in the south-east including the Khorabohr (G-14-03906), Gordoghan (G-14-03931), and Phargram (G-14-03937), are also identified with highly negative mass balance; meltwater from these glaciers joins the Phargram Gol which is immediately connected to a settlement area. In the studied region, most glaciers show a negative mass balance, whereas mass gain is generally observed at few glaciers in the study area; the G-14-01968 and Kach glacier (G-14-01937) are among the few largest glaciers that show positive mass balance.
The current analysis includes nine surge-type glaciers classified as verified or probable according to Guo et al. (2023), ranging in area from 3 to 82 km2. During the study period, we observed a mass loss of m w.e. a−1 for surging glaciers and m w.e. a−1 for non-surging glaciers. Most surging glaciers show a stable mass balance; the Upper Tirich glacier, which is distinct in size, shows the highest mass loss. The elevation profile of most surging glaciers shows alternating bands of positive and negative elevation change. Thickening at the terminus with concomitant thinning in the upper part of the glacier is a common observation among surging glaciers and may increase mass loss of these glaciers in the subsequent years due to melting at the lower part. Thickening at the front of some surging glaciers, such as G-14-02385 and Chuttidum glacier (G-14-01720), may indicate that the glacier has advanced during the study period. The Upper Tirich glacier is the largest surging glacier and the second largest among all glaciers. It comprises six tributaries; its longest tributary extending towards Tirich Mir indicates a surge-type elevation change pattern. Noroghikun, a highly crevassed glacier, classified as a possible surging glacier according to Guo et al. (2023), observes the highest retreat. G-14-01753 and G-14-02385 show a prominent surge-type elevation change pattern with thickening at the front and thinning at the upper part along with a stable mass balance. In surging glaciers, only G-14-02321 exhibits thinning at the glacier terminus while also maintaining a nearly stable mass balance. Most surging glaciers showed a stable or melting behaviour whereas, no significant mass gain was observed. Among all surging glaciers, the fronts of G-14-02385, G-14-01461 and Noroghikun glacier are extended at the elevations below 3900 m, which may undergo higher melting at the lower parts of the glacier in response to surge activity.
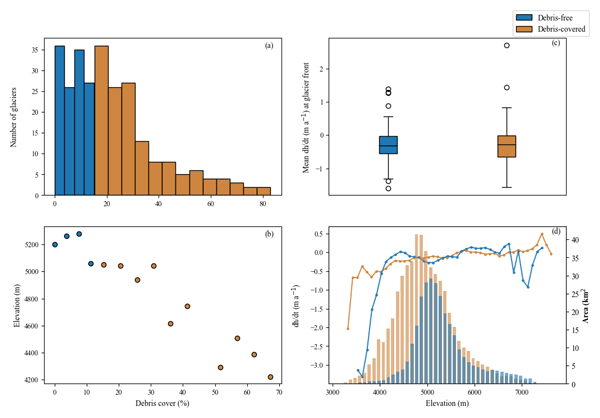
Debris cover is dominant in the ablation zone of glaciers and has been related to the stability of glaciers due to its role in preventing mass loss (Herreid et al., 2015). Debris-covered glaciers are common in the Hindu Kush, nearly 27 % of the total glacier area in the studied region is debris-covered. For most glaciers in the study area, debris cover is between 0 %–30 %, whereas there are a few glaciers with above 50 % debris cover (see Fig. 3). Debris-free glaciers are mostly present at higher elevations compared to debris-covered glaciers. Most of the retreating glaciers in the region are debris-free glaciers which have reportedly lost above 1 km2 of their glacier area. Glacier retreat is mainly observed but is not restricted to debris-free glaciers. On the other hand, a slight retreat is also observed on some debris-covered glaciers. The elevation change profile of debris-covered and debris-free glaciers differs at the glacier front, possibly due to higher melting of debris-free glaciers. At the glacier front, thinning and retreat are higher for debris-free glaciers, whereas debris-covered glaciers mostly show stable glacier fronts (Scherler et al., 2011). Debris-free and debris-covered glaciers show almost similar rates of mass loss at and m w.e. a−1 respectively. Surging glaciers with the highest debris cover are G-14-02385 and G-14-01461, which show a melting and stable behaviour respectively, whereas G-14-02399, a debris-free surging glacier, shows stability during the study period. G-14-02399 has most of its area situated at high elevations which can play a role in stable mass balance. Stability of some glaciers may be attributable to debris cover, such as the Kach glacier which has 66 % debris cover. In contrast Roshgol glacier (G-14-05949), which is 63 % debris covered, is losing mass at m w.e. a−1. In the current analysis, all surging glaciers are debris-covered except G-14-02399 and the Noroghikun glacier. Debris cover thickness plays an important role in the mass balance of glaciers, but this information was not available for this study. Individually, the mass balance of debris-covered and debris-free glaciers shows high variability, while the mass balance when differentiated between debris-covered and debris-free glaciers is nearly the same.
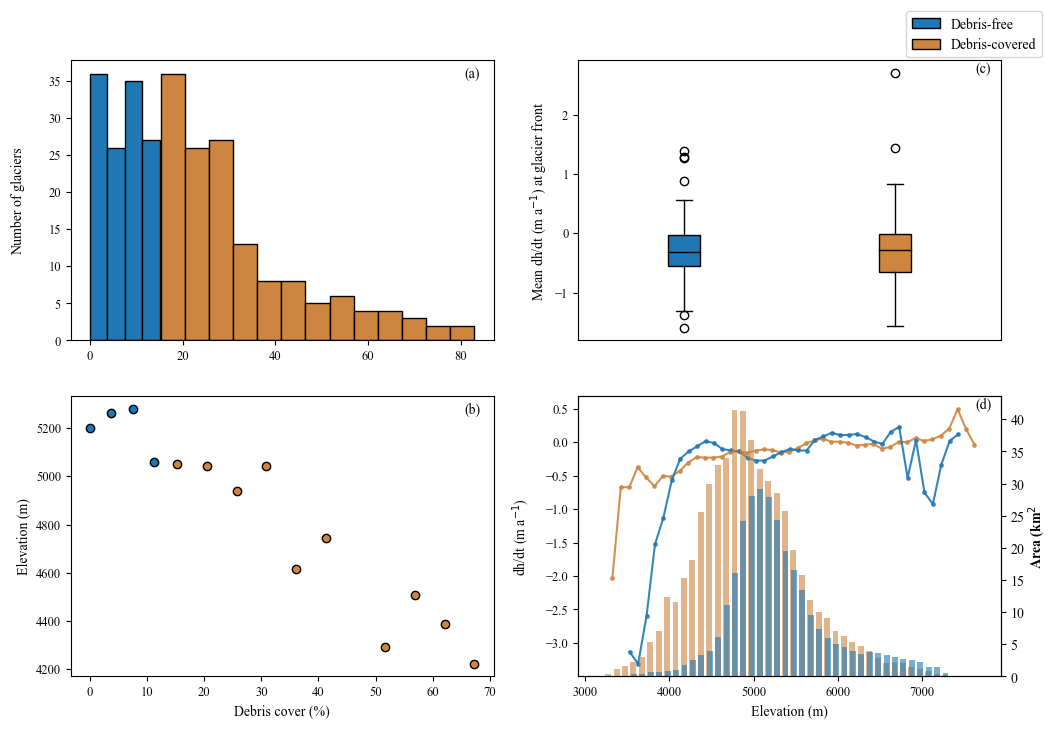
Figure 3(a) Histogram representing debris cover percentage and number of glaciers. (b) Debris cover percentage versus median elevation of the glaciers as shown in bins of (a). (c) Elevation change rate at the terminus. (d) Elevation versus mean elevation change at 50 m elevation bins and hypsometry for debris-covered and debris-free glaciers (non-surging).
In this study, we present our results on mass balance for the glaciers of Hindu Kush which contribute to extending the existing knowledge regarding the state of these glaciers to nearly two decades in the pre-2000 period. We employ state of the art sensors available during the study period and report the mass balance of glaciers which, to our knowledge, has not been documented before. Our estimated mass loss is slightly negative which is in agreement with Brun et al. (2017) , Shean et al. (2020), and Hugonnet et al. (2021) within their respective uncertainties. Our results combined with literature, suggest that glaciers in Hindu Kush have maintained a nearly stable rate of mass loss for at least four decades which is in contrast with the accelerated mass loss generally observed in parts of High Mountain Asia such as the Nyainqentanglha and the Tien Shan (Bhattacharya et al., 2021). We further re-assessed the retreating glaciers in the region and estimate a higher retreat compared to previously documented (Sarikaya et al., 2012).
Despite overall moderate mass balance conditions, the mass balance of glaciers in Hindu Kush shows high variability. Generally, the mass balance variation is high in small glaciers (area between 0.5–4 km2) but converges to a moderate value as the glacier size increases. In the current analysis, we observed no substantial difference between the mass balance of debris-covered and debris-free glaciers. We further observed that glaciers above 50 % debris cover are mostly close to a stable mass balance whereas debris-free glaciers mostly showed retreat. Variability in the mass balance of individual glaciers can also be driven by factors such as debris cover thickness, and topography which affects precipitation at local scale. The temperature and precipitation patterns acquired from the meteorological station in Chitral show an increase in temperature at 0.33 °C per decade, whereas precipitation has remained variable over time without any significant long-term trend (as shown in Fig. S5). Despite rising temperatures in Upper Chitral, the glaciers have maintained a moderate rate of mass loss. Generally, the lower part of debris-covered glaciers is relatively stable compared to clean ice, whereas the higher elevation parts of debris-covered and debris-free glaciers show almost similar behaviour. The effect of rising temperature on glacier melting is either moderated by precipitation or due to the debris cover of glaciers. The mass balance of Hindu Kush glaciers have a strong relation with precipitation which depends on the westerly patterns of the region (Wang et al., 2017). Debris cover adds uncertainty in the estimation of glacier retreat as it introduces a discrepancy between the mapped debris cover and glacier extent (Shokory and Lane, 2023). Our estimation of glacier retreat is mainly guided by elevation change, along with the orthoimages. Our manual re-adjustment of glacier outlines has limitations due to medium resolution of elevation change and SPOT-5 orthoimages, and a lack of spectral analysis. Elevation change without additional information does not provide an accurate estimate of retreat as the distinction between glacier retreat and thinning becomes unclear.
In this work, we studied the mass balance of glaciers in the Eastern Hindu Kush during the period 1979–2002. Individually, the glaciers of the region exhibit high variability, whereas the regional mass balance is estimated at m w.e. a−1 during the study period. We observed that some glaciers experience retreat; the highest retreat of 2.4 and 1.3 km is observed at Noroghikun and Kotgaz glaciers, respectively. The study region includes nine surging glaciers, which show a mass loss of m w.e. a−1 whereas non-surging glaciers show mass loss at m w.e. a−1. In terms of debris cover, glaciers in the study area range from debris-free to above 60 % debris-covered glaciers. In general, debris-free and debris-covered glaciers show nearly the same rate of mass loss occurring at a moderate rate, while debris-free glaciers experienced the highest retreat. Our estimated mass balance for the Hindu Kush region is slightly more negative as compared to Brun et al. (2017), Hugonnet et al. (2021), and Shean et al. (2020) but is within the respective uncertainties.
Datasets used in this study can be accessed through the following link: https://doi.org/10.5281/zenodo.17946709 (Ramzan and Ghuffar, 2025).
The supplement related to this article is available online at https://doi.org/10.5194/tc-20-5993-2026-supplement.
AR and SG designed the study, AR processed the SPOT-5 stereo imagery and computed mass balance, SG processed KH-9 imagery. Both AR and SG analyzed the results and contributed to the final form of the paper.
The contact author has declared that neither of the authors has any competing interests.
Publisher's note: Copernicus Publications remains neutral with regard to jurisdictional claims made in the text, published maps, institutional affiliations, or any other geographical representation in this paper. The authors bear the ultimate responsibility for providing appropriate place names. Views expressed in the text are those of the authors and do not necessarily reflect the views of the publisher.
The authors thank Etienne Berthier for his valuable comments on the initial submission, which contributed to improving the manuscript. We also thank Mehmet Akif Sarikaya for providing data that aided our analysis of glacier retreat.
This paper was edited by Marie Dumont and reviewed by Owen King and one anonymous referee.
Barandun, M., Pohl, E., Naegeli, K., McNabb, R., Huss, M., Berthier, E., Saks, T., and Hoelzle, M.: Hot spots of glacier mass balance variability in Central Asia, Geophys. Res. Lett., 48, https://doi.org/10.1029/2020GL092084, 2021. a
Beyer, R. A., Alexandrov, O., and McMichael, S.: The Ames Stereo Pipeline: NASA's open source software for deriving and processing terrain data, Earth Space Sci., 5, 537–548, https://doi.org/10.1029/2018EA000409, 2018. a
Bhattacharya, A., Bolch, T., Mukherjee, K., King, O., Menounos, B., Kapitsa, V., Neckel, N., Yang, W., and Yao, T.: High Mountain Asian glacier response to climate revealed by multi-temporal satellite observations since the 1960s, Nat. Commun., 12, 4133, https://doi.org/10.1038/s41467-021-24180-y, 2021. a, b, c
Bolch, T., Pieczonka, T., Mukherjee, K., and Shea, J.: Brief communication: Glaciers in the Hunza catchment (Karakoram) have been nearly in balance since the 1970s, The Cryosphere, 11, 531–539, https://doi.org/10.5194/tc-11-531-2017, 2017. a, b
Brun, F., Berthier, E., Wagnon, P., Kääb, A., and Treichler, D.: A spatially resolved estimate of High Mountain Asia glacier mass balances from 2000 to 2016, Nat. Geosci., 10, 668–673, https://doi.org/10.1038/ngeo2999, 2017. a, b, c
Ciracì, E., Velicogna, I., and Swenson, S.: Continuity of the mass loss of the world's glaciers and ice caps from the GRACE and GRACE Follow-On missions, Geophys. Res. Lett., 47, e2019GL086926, https://doi.org/10.1029/2019GL086926, 2020. a
Dehecq, A., Mannerfelt, E., Hugonnet, R., and Tedstone, A.: xDEM – A python library for reproducible DEM analysis and geodetic volume change calculations, EGU General Assembly 2022, Vienna, Austria, 23–27 May 2022, EGU22-5781, https://doi.org/10.5194/egusphere-egu22-5781, 2022. a
Fischer, M., Huss, M., and Hoelzle, M.: Surface elevation and mass changes of all Swiss glaciers 1980–2010, The Cryosphere, 9, 525–540, https://doi.org/10.5194/tc-9-525-2015, 2015. a
Gardelle, J., Berthier, E., Arnaud, Y., and Kääb, A.: Region-wide glacier mass balances over the Pamir-Karakoram-Himalaya during 1999–2011, The Cryosphere, 7, 1263–1286, https://doi.org/10.5194/tc-7-1263-2013, 2013. a, b, c
Gardner, A. S., Moholdt, G., Cogley, J. G., Wouters, B., Arendt, A. A., Wahr, J., Berthier, E., Hock, R., Pfeffer, W. T., Kaser, G., Ligtenberg, S. R. M., Bolch, T., Sharp, M. J., Hagen, J. O., van den Broeke, M. R., and Paul, F.: A Reconciled Estimate of Glacier Contributions to Sea Level Rise: 2003 to 2009, Science, 340, 852–857, https://doi.org/10.1126/science.1234532, 2013. a
Ghuffar, S., Bolch, T., Rupnik, E., and Bhattacharya, A.: A pipeline for automated processing of declassified Corona KH-4 (1962–1972) stereo imagery, IEEE T. Geosci. Remote, 60, 1–14, https://doi.org/10.1109/TGRS.2022.3200151, 2022. a
Ghuffar, S., King, O., Guillet, G., Rupnik, E., and Bolch, T.: Brief communication: Glacier mapping and change estimation using very high-resolution declassified Hexagon KH-9 panoramic stereo imagery (1971–1984), The Cryosphere, 17, 1299–1306, https://doi.org/10.5194/tc-17-1299-2023, 2023. a
Guo, L., Li, J., Dehecq, A., Li, Z., Li, X., and Zhu, J.: A new inventory of High Mountain Asia surging glaciers derived from multiple elevation datasets since the 1970s, Earth Syst. Sci. Data, 15, 2841–2861, https://doi.org/10.5194/essd-15-2841-2023, 2023. a, b, c, d, e, f
Herreid, S., Pellicciotti, F., Ayala, A., Chesnokova, A., Kienholz, C., Shea, J., and Shrestha, A.: Satellite observations show no net change in the percentage of supraglacial debris-covered area in northern Pakistan from 1977 to 2014, J. Glaciol., 61, 524–536, https://doi.org/10.3189/2015JoG14J227, 2015. a
Hirschmuller, H.: Stereo processing by semiglobal matching and mutual information, IEEE T. Pattern Anal., 30, 328–341, https://doi.org/10.1109/TPAMI.2007.1166, 2007. a
Hugonnet, R., McNabb, R., Berthier, E., Menounos, B., Nuth, C., Girod, L., Farinotti, D., Huss, M., Dussaillant, I., Brun, F., and Kääb, A.: Accelerated global glacier mass loss in the early twenty-first century, Nature, 592, 726–731, https://doi.org/10.1038/s41586-021-03436-z, 2021. a, b, c, d
Huss, M.: Density assumptions for converting geodetic glacier volume change to mass change, The Cryosphere, 7, 877–887, https://doi.org/10.5194/tc-7-877-2013, 2013. a
Kääb, A., Berthier, E., Nuth, C., Gardelle, J., and Arnaud, Y.: Contrasting patterns of early twenty-first-century glacier mass change in the Himalayas, Nature, 488, 495–498, https://doi.org/10.1038/nature11324, 2012. a
Ke, L., Wang, R., Zhang, J., and Ding, X.: Remote-sensing characterization of surging glaciers in High Mountain Asia in the past two decades, Front. Earth Sci., 12, 1499882, https://doi.org/10.3389/feart.2024.1499882, 2024. a
King, O., Bhattacharya, A., Bhambri, R., and Bolch, T.: Glacial lakes exacerbate Himalayan glacier mass loss, Sci. Rep., 9, 18145, https://doi.org/10.1038/s41598-019-53733-x, 2019. a
Lin, H., Li, G., Cuo, L., Hooper, A., and Ye, Q.: A decreasing glacier mass balance gradient from the edge of the Upper Tarim Basin to the Karakoram during 2000–2014, Sci. Rep., 7, 6712, https://doi.org/10.1038/s41598-017-07133-8, 2017. a, b
Lindenberger, P., Sarlin, P.-E., and Pollefeys, M.: LightGlue: Local Feature Matching at Light Speed, in: 2023 IEEE/CVF International Conference on Computer Vision (ICCV), IEEE, https://doi.org/10.1109/ICCV51070.2023.01616, 2023. a
Maurer, J. M., Schaefer, J. M., Rupper, S., and Corley, A.: Acceleration of ice loss across the Himalayas over the past 40 years, Sci. Adv., 5, eaav7266, https://doi.org/10.1126/sciadv.aav7266, 2019. a
McNabb, R., Nuth, C., Kääb, A., and Girod, L.: Sensitivity of glacier volume change estimation to DEM void interpolation, The Cryosphere, 13, 895–910, https://doi.org/10.5194/tc-13-895-2019, 2019. a
Miles, E., McCarthy, M., Dehecq, A., Kneib, M., Fugger, S., and Pellicciotti, F.: Health and sustainability of glaciers in High Mountain Asia, Nat. Commun., 12, 2868, https://doi.org/10.1038/s41467-021-23073-4, 2021. a
Nuth, C. and Kääb, A.: Co-registration and bias corrections of satellite elevation data sets for quantifying glacier thickness change, The Cryosphere, 5, 271–290, https://doi.org/10.5194/tc-5-271-2011, 2011. a
Pieczonka, T. and Bolch, T.: Region-wide glacier mass budgets and area changes for the Central Tien Shan between 1975 and 1999 using Hexagon KH-9 imagery, Glob. Planet. Change, 128, 1–13, https://doi.org/10.1016/j.gloplacha.2014.11.014, 2015. a
Ramzan, A. and Ghuffar, S.: Mass Balance of Glaciers in the Eastern Hindu Kush from 1979 to 2002 using KH-9 Panoramic and SPOT-5 stereo imagery, Zenodo [data set], https://doi.org/10.5281/zenodo.17946709, 2025. a
Ren, S., Li, X., Wang, Y., Zheng, D., Jiang, D., Nian, Y., and Zhou, Y.: Multitemporal Glacier Mass Balance and Area Changes in the Puruogangri Ice Field during 1975–2021 Based on Multisource Satellite Observations, Remote Sens., 14, https://doi.org/10.3390/rs14164078, 2022. a
Rolstad, C., Haug, T., and Denby, B.: Spatially integrated geodetic glacier mass balance and its uncertainty based on geostatistical analysis: application to the western Svartisen ice cap, Norway, J. Glaciol., 55, 666–680, https://doi.org/10.3189/002214309789470950, 2009. a
Romshoo, S. A., Nabi, B., and Dar, R. A.: Influence of debris cover on the glacier melting in the Himalaya, Cold Reg. Sci. Technol., 222, 104204, https://doi.org/10.1016/j.coldregions.2024.104204, 2024. a
Rupnik, E., Daakir, M., and Pierrot Deseilligny, M.: MicMac–a free, open-source solution for photogrammetry, Open geospatial data, software and standards, 2, 1–9, https://doi.org/10.1186/s40965-017-0027-2, 2017. a
Sarikaya, M. A., Bishop, M. P., Shroder, J. F., and Olsenholler, J. A.: Space-based observations of Eastern Hindu Kush glaciers between 1976 and 2007, Afghanistan and Pakistan, Remote Sens. Lett., 3, 77–84, https://doi.org/10.1080/01431161.2010.536181, 2012. a, b
Scher, C., Steiner, N. C., and McDonald, K. C.: Mapping seasonal glacier melt across the Hindu Kush Himalaya with time series synthetic aperture radar (SAR), The Cryosphere, 15, 4465–4482, https://doi.org/10.5194/tc-15-4465-2021, 2021. a
Scherler, D., Bookhagen, B., and Strecker, M. R.: Spatially variable response of Himalayan glaciers to climate change affected by debris cover, Nat. Geosci., 4, 156–159, https://doi.org/10.1038/ngeo1068, 2011. a, b
Shean, D. E., Bhushan, S., Montesano, P., Rounce, D. R., Arendt, A., and Osmanoglu, B.: A systematic, regional assessment of high mountain Asia glacier mass balance, Front. Earth Sci., 7, 363, https://doi.org/10.3389/feart.2019.00363, 2020. a, b, c
Shokory, J. A. N. and Lane, S. N.: Patterns and drivers of glacier debris-cover development in the Afghanistan Hindu Kush Himalaya, J. Glaciol., 69, 1260–1274, https://doi.org/10.1017/jog.2023.14, 2023. a
Wang, H., Bin-Bin, W., Cui, P., Yao-Ming, M., Wang, Y., Jian-Sheng, H., Wang, Y., Ya-Mei, L., Li-Jun, S., Wang, J., Zhang, G.-T., Li, W.-M., Lei, Y., Zhao, W.-Q., Tang, J.-B., and Li, C.-Y.: Disaster effects of climate change in High-Mountain Asia: State of art and scientific challenges, Advances in Climate Change Research, 2024. a
Wang, Q., Yi, S., and Sun, W.: Precipitation-driven glacier changes in the Pamir and Hindu Kush mountains, Geophys. Res. Lett., 44, 2817–2824, https://doi.org/10.1002/2017GL072646, 2017. a, b
Zhao, C., He, Z., Kang, S., Zhang, T., Wang, Y., Li, T., He, Y., and Yang, W.: Contrasting Changes of Debris-Free Glacier and Debris-Covered Glacier in Southeastern Tibetan Plateau, Remote Sens., 16, 918, https://doi.org/10.3390/rs16050918, 2024. a
Zhao, X., Wang, X., Wei, J., Jiang, Z., Zhang, Y., and Liu, S.: Spatiotemporal variability of glacier changes and their controlling factors in the Kanchenjunga region, Himalaya based on multi-source remote sensing data from 1975 to 2015, Sci. Total Environ., 745, 140995, https://doi.org/10.1016/j.scitotenv.2020.140995, 2020. a
Zhou, Y., Li, Z., and Li, J.: Slight glacier mass loss in the Karakoram region during the 1970s to 2000 revealed by KH-9 images and SRTM DEM, J. Glaciol., 63, 331–342, https://doi.org/10.1017/jog.2016.142, 2017. a, b
Zhou, Y., Li, Z., Li, J., Zhao, R., and Ding, X.: Glacier mass balance in the Qinghai–Tibet Plateau and its surroundings from the mid-1970s to 2000 based on Hexagon KH-9 and SRTM DEMs, Remote Sens. Environ., 210, 96–112, https://doi.org/10.1016/j.rse.2018.03.020, 2018. a, b, c