
the Creative Commons Attribution 4.0 License.
the Creative Commons Attribution 4.0 License.
 | 12 Oct 2026
Interannual and seasonal evolution of supraglacial drainage systems on Nivlisen Ice Shelf, East Antarctica
Jiao Chen

Rebecca A. Hodge
Stewart S. R. Jamieson
Chris R. Stokes
Supraglacial drainage systems represent critical components of the surface hydrology on Antarctic ice shelves, facilitating the redistribution of meltwater, including into and out of supraglacial lakes, potentially influencing ice-shelf stability. However, the seasonal and interannual variability in their spatial extent, structural evolution, and climatic sensitivity remain poorly quantified, particularly compared to observations of supraglacial lakes. In this study, we investigate the interannual evolution of supraglacial drainage systems on Nivlisen Ice Shelf in East Antarctica between 2017 and 2024 using Sentinel-2 and Landsat-8 satellite imagery, with a detailed seasonal analysis during the 2018–2019 melt season. Key metrics including surface water area, total channel length, number of supraglacial drainage components, and the number of individual channels were derived to quantify the drainage evolution, system connectivity and complexity. We find significant interannual variability in the number of drainage components (from 34–186) and total channel length (from 345–1275 km), with peak length of channels observed in 2018. During the 2018–2019 melt season, channels progressively integrated and connected to form a very well-connected drainage system, which then fragmented towards the end of the melt season. We find that drainage systems are strongly influenced by ice shelf surface structures and undulations at a range of scales, with larger channels reforming in the same location. Correlation analysis shows that the evolution of drainage systems is tightly coupled to regional air temperature, with surface water extent and drainage connectivity strongly linked to reanalysis-based temperature outputs (r>0.9, p<0.05). Snow had variable effects, depending on its timing and how readily it could be melted. Our findings underscore the important dynamic nature of supraglacial channels in redistributing meltwater on Antarctic ice shelves.
- Article
(19902 KB) - Full-text XML
-
Supplement
(1011 KB) - BibTeX
- EndNote


As climate warming accelerates, the Antarctic Ice Sheet (AIS), which contains approximately 30 million km3 of ice, has lost mass at rates estimated at from 2002–2022 (Hanna et al., 2024). The floating ice shelves around the AIS, which hold back the grounded ice from further inland, are faced with potential threats from surface melt (Bell et al., 2018; Arthur et al., 2022; Tuckett et al., 2025). Indeed, surface water is more widespread across the AIS than previously assumed, and numerous supraglacial lakes (SGLs) and channels have been observed on Antarctic ice shelves during recent years (Langley et al., 2016; Lenaerts et al., 2017; Stokes et al., 2019; Tuckett et al., 2021, 2025; Spergel et al., 2021; Arthur et al., 2022). For example, more than 65 000 SGLs (over 1300 km2) have been observed around the margin of the East Antarctic Ice Sheet (EAIS) in the peak of the melt season in January 2017, and approximately 60 % of these lakes developed on ice shelves (Stokes et al., 2019). Meanwhile, Corr et al. (2022) identified 10223 lakes (114.7 km2) and 255 channels (4.7 km2) on the West Antarctic Ice Sheet (WAIS) and Antarctic Peninsula (AP) during January 2017 from satellite imagery.
Supraglacial lakes can trigger the collapse of ice shelves by “hydrofracturing”, a process of meltwater-induced vertical fracture propagation (Banwell et al., 2014; Dunmire et al., 2020). Primary mechanisms of hydrofracturing induced by SGLs include (1) stored meltwater in lakes that can fill and drain vertically through the pre-existing fractures, thereby promoting downward crack propagation (Van Der Veen, 2007); (2) clusters of multiple lakes that alter the local stress field through lake loading and drainage, which may lead to fracture propagation and potentially trigger cascading drainage events (Banwell et al., 2013). Although some Antarctic ice shelves are already thought to be vulnerable to hydrofracturing (Alley et al., 2018; Arthur et al., 2022), future surface melt is expected to enhance the likelihood of ice shelf disintegration by progressively reducing their capacity to store or absorb surface meltwater (Bell et al., 2018; Lai et al., 2020).
The potential impacts of SGLs (e.g. via hydrofracturing) means that they have received considerable attention in Antarctica. In contrast, supraglacial channels have been relatively overlooked, despite playing a key role in controlling the storage and routing of meltwater between SGLs and across whole ice shelves (Pitcher and Smith, 2019; Chandler and Hubbard, 2023), including over substantial distances, e.g. over 120 km (Kingslake et al., 2017; Corr et al., 2022). Depending on the connectivity of the channel network, they can move meltwater away from some areas of the ice shelf while concentrating it in others, thereby modulating the formation and persistence of SGLs and the drainage of water into the firn. Recent satellite observations, for example, reveal that some lakes are connected to each other by channels, forming well-connected large-scale drainage networks and moving surface meltwater from higher to lower elevations (Kingslake et al., 2015; Yang et al., 2021; Chen et al., 2024). The connectivity and extent of meltwater routing through channels have important implications for ice shelf stability. Channels can both move water within ice shelves and even off the ice shelf, thereby mitigating any potential for widespread hydrofracturing (Bell et al., 2017). Indeed, Bell et al. (2017) observed a 130 m wide waterfall (discharge 259–806 m3 s−1) on the ice cliff of the Nansen Ice Shelf in the WAIS. As such, they found that active drainage networks on Nansen Ice Shelf exported a large volume of water (0.04–0.56 km3 in each melt season) off the ice surface through one waterfall between 2006 and 2015. The efficient export of surface meltwater on Nansen Ice Shelf highlights the potential capacity of channels to stabilize ice shelves by reducing the risk of damage related to extensive storage of meltwater (Bell et al., 2018), but such waterfalls have not been widely reported elsewhere in Antarctica and the prevalence and spatial extent of such drainage pathways remain poorly constrained.
Understanding the development of supraglacial drainage systems is therefore necessary because they can influence the spatial redistribution of surface meltwater across ice shelves, affecting where meltwater is stored, refrozen, ponded, or potentially routed toward structurally vulnerable areas. However, there are very few detailed studies of the size and connectivity of supraglacial drainage systems and how different types of systems might develop and under what conditions. Interannual and seasonal observations are therefore needed to characterise changes in extent, organisation, and connectivity of supraglacial drainage systems across Antarctic ice shelves. This paper aims to characterize and explain the evolution of supraglacial channels and drainage systems on Nivlisen Ice Shelf between 2017 and 2024. We map surface drainage features (including lakes and channels) from satellite imagery and track their spatio-temporal evolution over multiple melt seasons. The Nivlisen Ice Shelf has a multidecadal history of surface meltwater activity (Kingslake et al., 2015; Dell et al., 2020; Tuckett et al., 2025), making it an ideal site to: (1) quantify spatial and temporal variations in supraglacial drainage systems across seasonal to interannual scales; (2) observe changes on the inter-connectivity of these drainage systems; and (3) identify the dominant climate controls on the development of drainage systems.
The Nivlisen Ice Shelf (70°68′ S, 12°09′ E) is located in Dronning Maud Land, East Antarctica, and has a surface area of 7600 km2 mainly fed by the Potsdam Glacier (Fig. 1). The ice shelf thickness ranges from 700 m at the grounding line to 150 m at the ice cliff (Dell et al., 2020). The average ice velocity of the Nivlisen is around 80 m a−1 (Fig. 1b), which is relatively slow compared to other ice shelves in Dronning Maud Land (e.g., Roi Baudouin ice shelf flows up to 205 m a−1 at average) (Berger et al., 2016; Lindbäck et al., 2019). Surface conditions across Nivlisen Ice Shelf are spatially variable, including differences in accumulation, firn properties, and near-surface ice structures. Previous field observations indicate that Nivlisen Ice Shelf is an accumulation-dominated ice shelf, with snow density of 430–450 kg m−3 in the uppermost metre and with the 3 m snow/firn-core density averaging over the ice shelf (Pratap et al., 2022). To the southeast of Nivlisen Ice Shelf, a Blue Ice Area (BIA) adjoins the exposed bedrock nunatak Schirmacheroasen at the transition between the ice shelf and the inland ice and extends from this region in a southeasterly direction for approximately 100 km (Dell et al., 2020; Fig. 1c). North of this BIA, the ice shelf transitions into an accumulation zone, where the firn layer becomes thicker. According to Kingslake et al. (2015), there was large significant meltwater coverage nearly every summer over Nivlisen Ice Shelf from 2002–2009, and the extent of surface water showed significant seasonal and interannual variations, but these variations were not quantified.
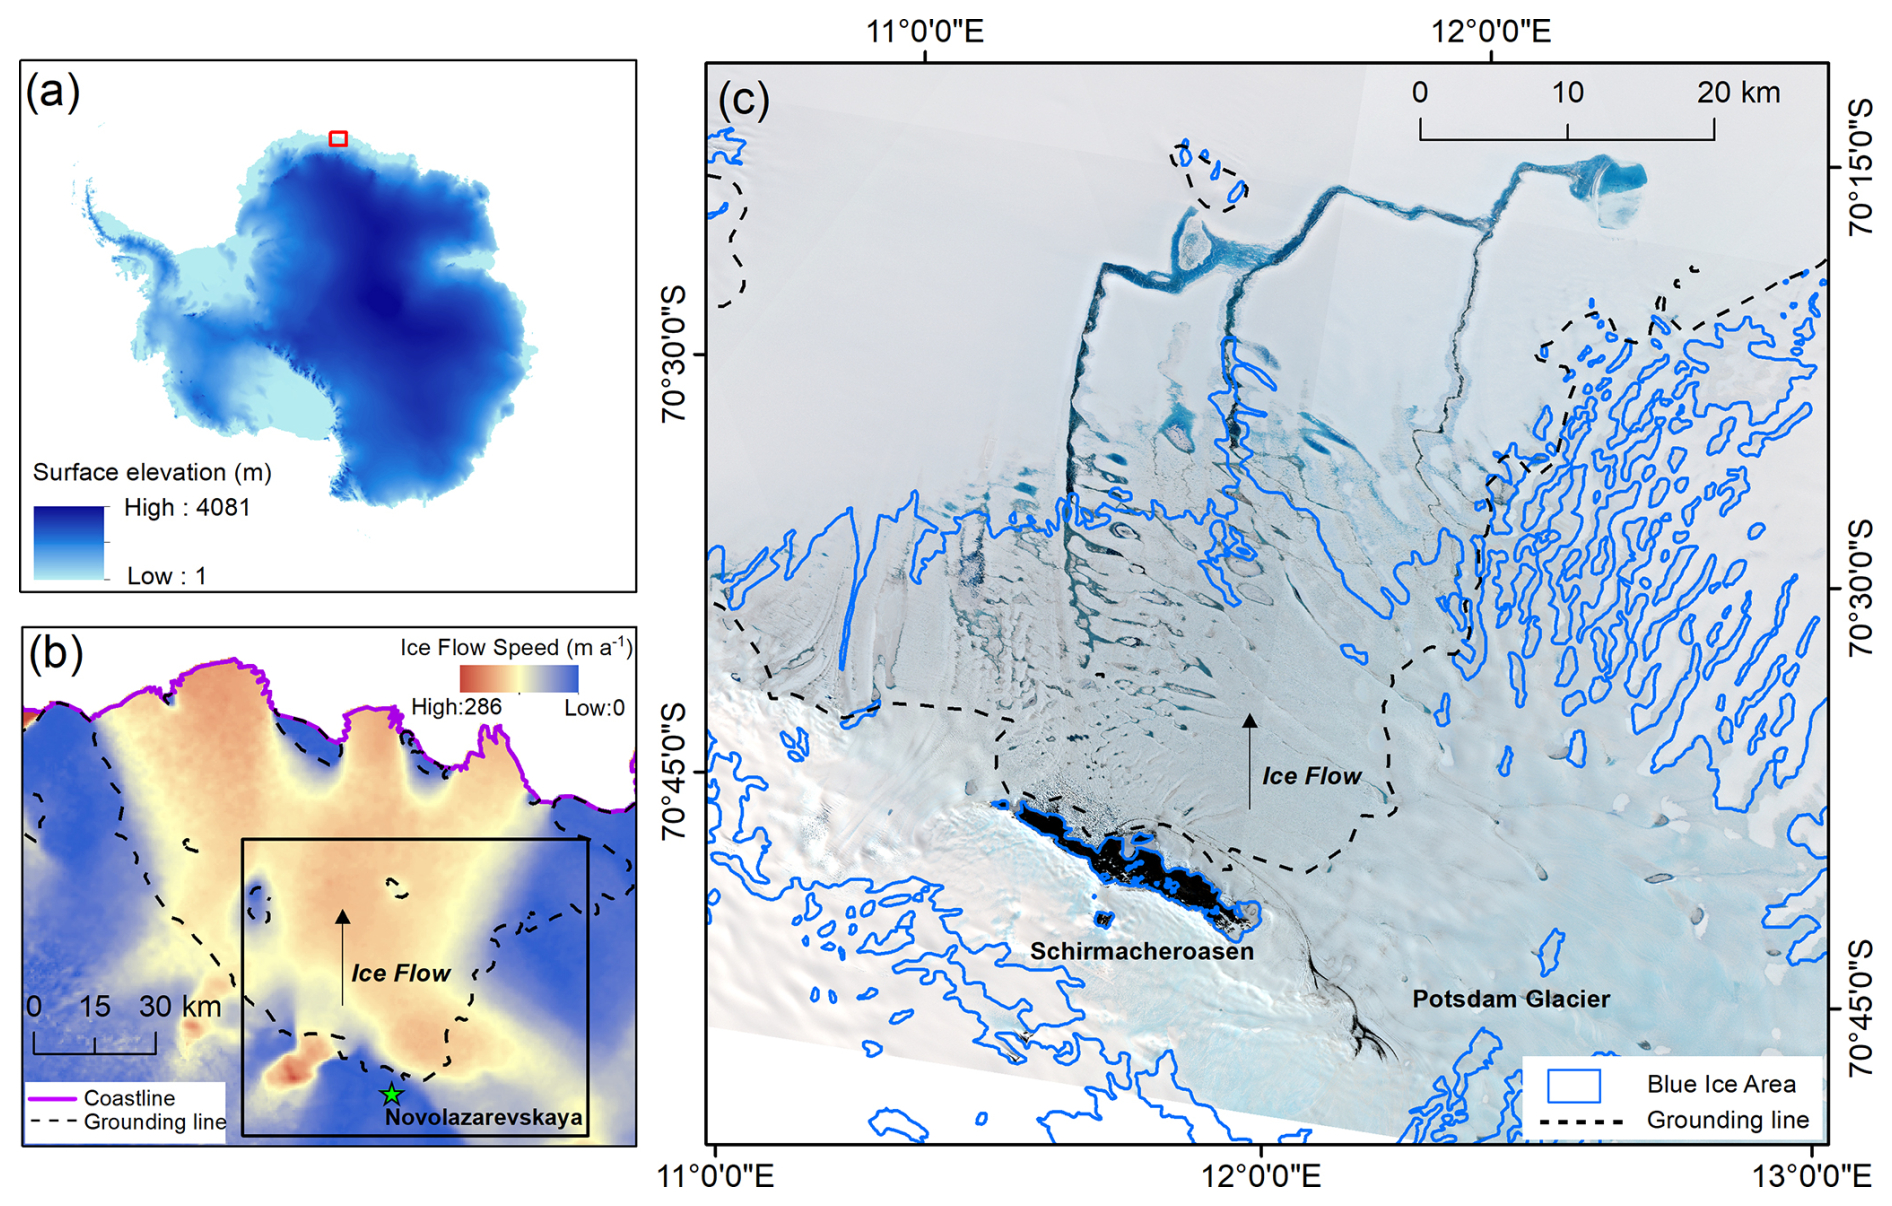
Figure 1A map of the study area: (a) surface elevation of the Antarctica Ice Sheet and surrounding ice shelves from Bedmap2 (Fretwell et al., 2022), with red box indicating the location of Nivlisen Ice Shelf; (b) the ice flow speed (Rignot et al., 2017), including the Novolazarevskaya Research Station, coastline and grounding line from Mouginot et al. (2017) and (c) SCNs on Nivlisen Ice Shelf on 26 January 2020. The solid blue lines delineate the BIA regions from Hui et al. (2014). The boxes in (a, b) illustrate the study area extent. The base imagery of (c) is a mosaicked RGB Sentinel-2 image of Nivlisen Ice Shelf.
Previous work on Nivlisen Ice Shelf has documented a complex surface hydrological system (e.g., Kingslake et al., 2015; Dell et al., 2020; Arthur et al.,2022; Chen et al., 2024), but the research focus has varied, with few studies quantifying the interannual and seasonal evolution of the channel network in detail. Dell et al. (2020), Dirscherl et al. (2021), and Arthur et al. (2022) characterized SGLs, detailing their distribution, volume changes, and links to climatic factors, but limited attention was paid to the structure and evolution of the channels. Recent work by Tuckett et al. (2025) included both lakes and channels but with a focus on the total extent of meltwater, finding a moderate increase in annual surface meltwater area from 2006/7–2020/21. Some studies have considered water transfer through channels. Dell et al. (2020) used Landsat-8 and Sentinel-2 imagery to track surface meltwater on Nivlisen Ice Shelf during summer 2016–2017. They identified 1598 water bodies, which were classified as either circular or linear features. The total volume of surface meltwater peaked at 5.5×10⁷ m3 on 26 January 2017, and 63 % of the total meltwater was stored in two linear features following the surface slopes which extended up to 27 km in length. Kingslake et al. (2015) also highlighted supraglacial lake drainage through surface channels over extensive distances (over 70 km). These observations suggest that surface meltwater on Nivlisen Ice Shelf can be spatially organised into large well-connected drainage systems, but they do not resolve whether such systems are persistent, recurrent, or short-lived features of the melt season.
Subsequent detailed investigations have largely prioritised supraglacial lakes rather than the structure and evolution of supraglacial drainage systems. Dirscherl et al. (2021) expanded the temporal scope (2015–2021) using Sentinel-1/2 satellite imagery to map the SGLs on Nivlisen Ice Shelf, recording a maximum extent of 107 km2 in early January 2019. Their analysis linked the formation of lakes to climatic factors (i.e., air temperature, solar radiation, wind conditions), and warned that repeated meltwater ponding and drainage may cause the destabilisation of ice shelves to occur sooner than expected. Arthur et al. (2022) quantified the SGLs around the EAIS during multiple melt seasons (2014–2020) from Landsat-8 imagery. Their results demonstrated that the interannual variability of the SGL volume on Nivlisen was one of the highest in East Antarctica (peaking at 144×106 m3 in summer of 2019), and identified that the temperature, surface topography, BIA, and katabatic winds enhanced the formation of SGLs. One exception to the focus on SGLs is Chen et al. (2024), who provided a snapshot of large channels (width>30 m) on Nivlisen Ice Shelf using Landsat-8 imagery, identifying a dendritic network of 47 channels in January 2020. While they measured some fluvial metrics (e.g., channel width, depth), the temporal evolution of the SCN was not analysed.
Although these previous studies mentioned that supraglacial lakes commonly co-exist with channels and that meltwater may be routed through large drainage systems, it remains unclear whether these drainage systems reoccur between melt seasons, how they evolve within a melt season, and how channel connectivity varies through time. Therefore, more detailed quantification of the drainage system's extent, connectivity, and seasonal/interannual variability is needed to provide critical insights into the role of supraglacial channels in redistributing meltwater across Nivlisen Ice Shelf.
This study uses freely available satellite data to map hydrological features (including channels and lakes) across a consecutive eight-year observational period (i.e., 2017–2024) based on the availability of high-resolution imagery, and for the 2018–2019 melt season which recorded the maximum lake extent (Dirscherl et al., 2021; Arthur et al., 2022). We quantify key metrics including surface water area, depth, number of channels, total length of channels; and correlate them with climate variables, including temperature, snowfall, and surface melt; to identify the primary drivers influencing drainage system evolution.
3.1 Images and pre-processing
3.1.1 Sentinel-2
A total of 32 Sentinel-2 Level-2A (L2A) scenes (see Table S1 in the Supplement) covering the study area were acquired between 26 January 2017 and 22 February 2024 from the Copernicus Data Space Ecosystem Browser (https://browser.dataspace.copernicus.eu, last access: 31 July 2024) to observe the interannual variations of SCNs. Supraglacial water features were delineated using the Sentinel-2 Level-2A (L2A) images with Bottom-Of-Atmosphere reflectance values. Spectral bands at a spatial resolution of 10 m including bands 2 (Blue), 3 (Green), 4 (Red), and 8 (Near infrared, NIR) were used. Each Sentinel-2 L2A image was clipped and then mosaicked to produce temporally consistent images covering the whole Nivlisen Ice Shelf and reprojected to the WGS 1984 Stereographic South Pole co-ordinate system (EPSG: 3031).
3.1.2 Landsat-8
Throughout the summer of 2018–2019, the development of SCNs was monitored across eight dates dictated by cloud-free image availability. A total of 10 Landsat-8 Level-2 Surface Reflectance (SR) optical images (see supplement Table 1) spanning 8 dates were used to conduct seasonal analysis due to the limited temporal coverage of Sentinel-2 optical imagery. Full spatial coverage of the study area was achieved using mosaicked imagery for two dates (24 December 2018 and 25 January 2019), while the remaining dates were covered by a single satellite scene. The raw Landsat-8 imagery was identified and downloaded from the USGS Earth Explorer website (https://earthexplorer.usgs.gov, last access: 31 July 2024). This part of the study specifically focussed on a single melt season from December 2018–March 2019, because this season recorded the maximum meltwater extent and had the most cloud-free images available. Spectral bands including 1 (Blue), 2 (Green), 3 (Red), 4 (Near infrared, NIR) and 8 (Panchromatic) were used to delineate supraglacial water features. Each Landsat-8 image was processed as natural-colour pan-sharpened image at 15 m spatial resolution for observing more details using NNDiffuse Pan Sharpening Sharpening tool from ENVI 5.6 software (Harris Geospatial Solutions, 2020).
3.2 Mapping supraglacial drainage systems
The mapping of supraglacial drainage systems on Nivlisen Ice Shelf involved a two-step workflow: a water index method was used to initially identify broad areal water bodies, such as lakes and larger surface-water areas, delimited by polygons. Supraglacial channels were then manually identified and drawn as lines using the output from the water index method. Surface water bodies were identified using the Normalised Difference Water Index for ice (NDWIice), which has been widely adopted to extract meltwater features on ice surfaces from satellite imagery (e.g., Moussavi et al., 2020; Dell et al., 2020; Tuckett et al., 2021; Yang et al., 2021; Chen et al., 2024). NDWIice is calculated from the normalised ratio of the blue and red bands as Eq. (1):
Surface water exhibits higher reflectance values in the Blue band and a relatively large contrast with the background (i.e., ice and snow) in the Red band of the optical imagery (Yang and Smith, 2013). A threshold of 0.20 was adopted to filter the water pixels from each NDWIice image, following previous studies where thresholds typically range between 0.15 and 0.30 (Stokes et al., 2019; Chen et al., 2024; Glen et al., 2025). However, we found that most water bodies detected from NDWIice thresholding are lakes or channels with deep water, and some thin channels which are narrower than the image resolution (approximately 10 m wide) cannot be recognised by this method (Glen et al., 2022; Langley et al., 2016). Meanwhile, some water resides in the firn and is better described as slush (Dell et al., 2020). Therefore, manual post-processing was necessary to remove some mis-classified water pixels (e.g., slush, ice background) from thresholding NDWIice. Uncertainties associated with this classification primarily arise from threshold selection and the delineation of water boundaries, particularly for shallow water and slush areas. Similar NDWI thresholding methods have been widely applied in previous studies of supraglacial hydrology in Greenland and Antarctica (Moussavi et al., 2020; Yang et al., 2021; Chen et al., 2024); however, robust quantification of classification uncertainty remains challenging in the absence of ground-truth observations.
Supraglacial channels and their terminus were manually identified and delineated as centrelines based on Landsat-8, Sentinel-2 imagery and the NDWIice product. True-colour composites (Sentinel-2 bands 4-3-2, Landsat-8 bands 4-3-2) were used for visual interpretation, supplemented by the NDWIice image to enhance the contrast between meltwater and surrounding snow or ice. The identification relied on a combination of morphological, topographic, and contextual indicators: (1) linear geometry: water bodies exhibiting narrow, elongated shapes were considered potential channels, especially those connected with circular depressions interpreted as lakes or ponded areas; (2) topographic validation: the Reference Elevation Model of Antarctica (REMA) database (Howat et al., 2019) was used to verify whether the identified features followed a downslope path, consistent with gravitational water flow; (3) temporal consistency: where available, sequential imagery from different dates within the same melt season, which means consistently observed patterns strengthened the interpretation of channels. The delineation of surface water bodies (i.e., raster polygon) and supraglacial channels (i.e., vector lines) are shown in Fig. 2, which was used to measure several metrics in the following analysis.
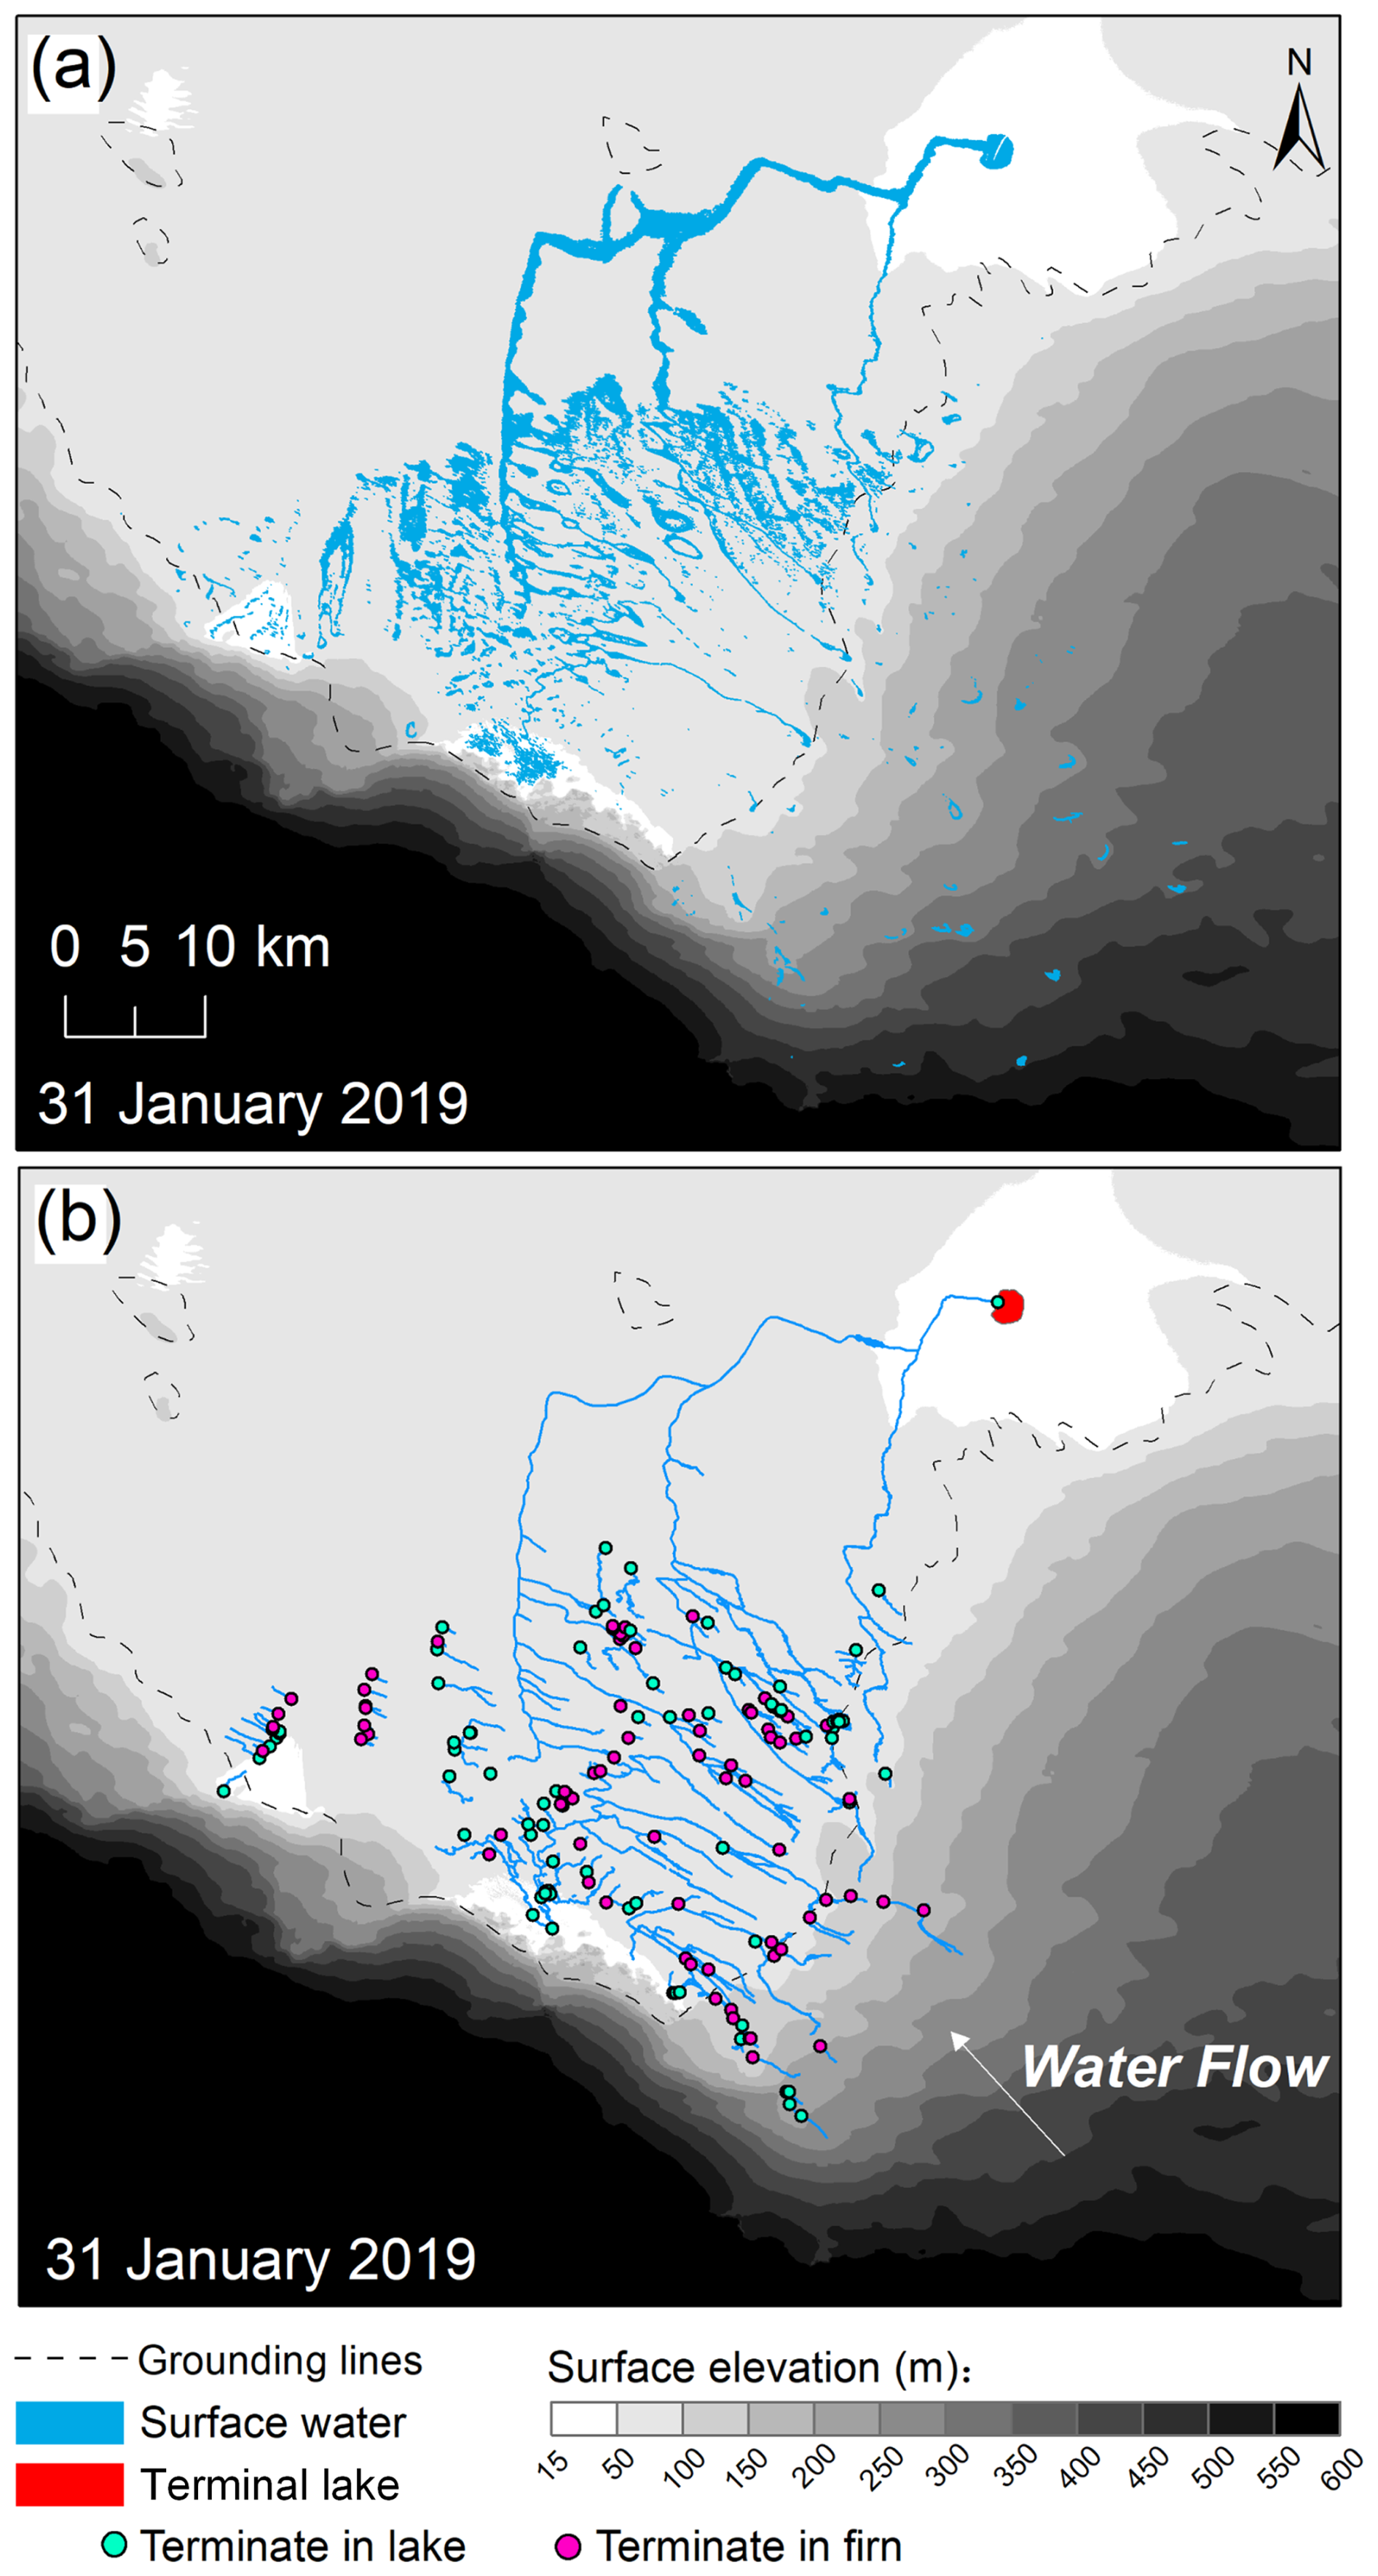
Figure 2Supraglacial drainage systems on Nivlisen Ice Shelf on 31 January 2019: (a) detected surface water using the NDWIice and (b) centrelines of manually mapped channels and channel termini (see Sect. 3.3). The base image is the REMA 10 m DEM data (Howat et al., 2019).
3.3 Quantifying the morphometry of supraglacial drainage systems
3.3.1 Key metrics of supraglacial drainage systems
The metrics used in this study are derived from different mapping units and analysis outputs, so we first define the key terms used in the morphometric analysis (Fig. 3). Channel segments are manually digitised supraglacial channel centrelines visible in the satellite imagery, with each segment defined as the channel reach bounded by adjacent connection points and/or channel endpoints (Fig. 3b). To identify which channels are connected to each other, the mapped vector centrelines were converted into binary (water and ice background) images with the spatial resolution of satellite imagery (Sentinel-2: 10 m, Landsat-8: 15 m) (Fig. 3c). Channel pixels that meet the adjacency criterion for 8-neighbor connectivity (i.e., share an edge or a vertex) (He et al., 2017) are recognised as being members of the same connected drainage system (Fig. 3c). The binary image was then converted back into vector polylines, where polylines belonging to the same system are marked with the same component ID (Fig. 3d). Each drainage component is then either an isolated channel, multiple connected channels with a wider system, or channels connected to lakes. In this study, “drainage component” is used as the primary mapping and analysis unit for all subsequent morphometric analyses.
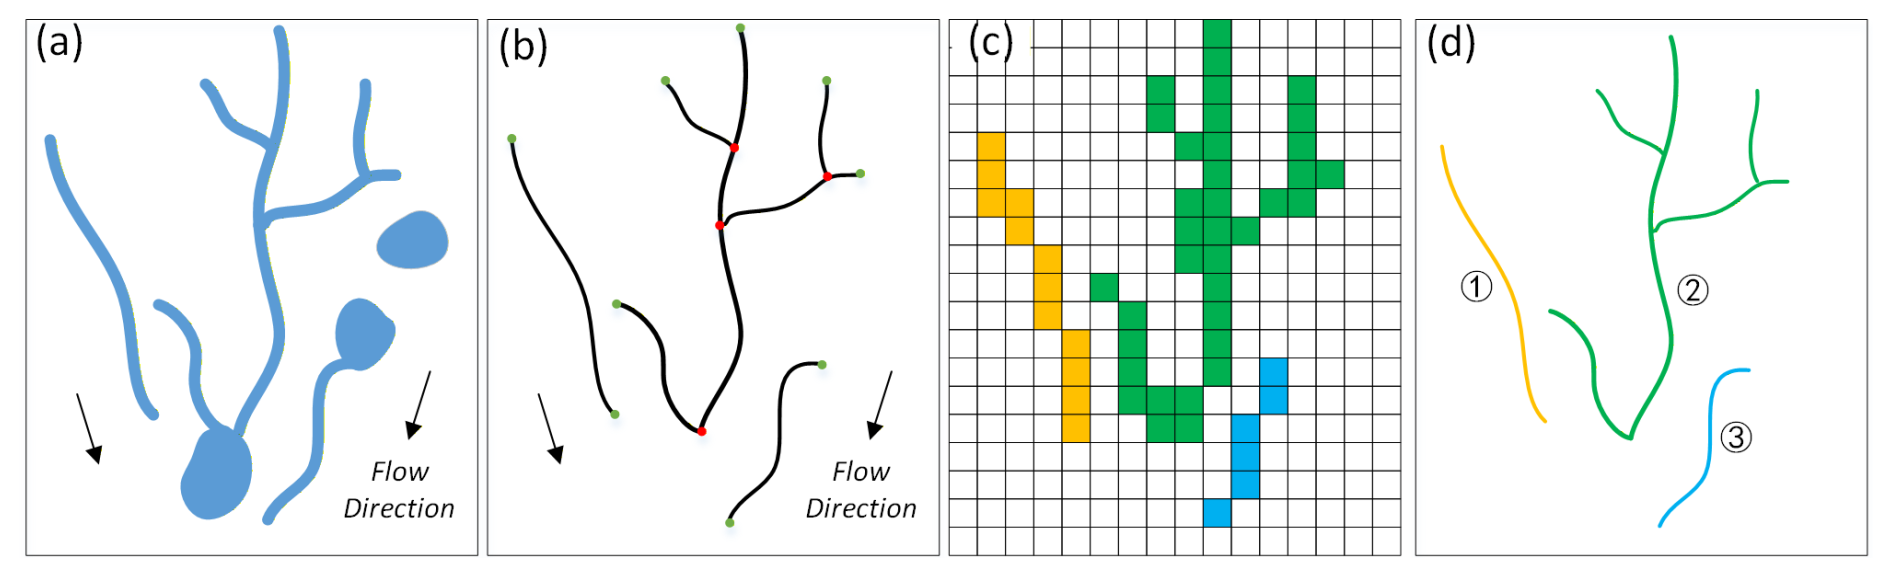
Figure 3Schematic of supraglacial drainage component detection: (a) original supraglacial water features on the satellite imagery; (b) manually mapped vector centrelines of channels segments shown in (a), with red dots indicating connection points and green dots indicating channel endpoints; (c) binary raster of vector centrelines; and (d) identification of connected components using 8-neighbors pixel connectivity, including ① isolated channels, ② multiple connected channels, and ③ channels connected to lakes. In (d), all three classes are referred to as “drainage components”.
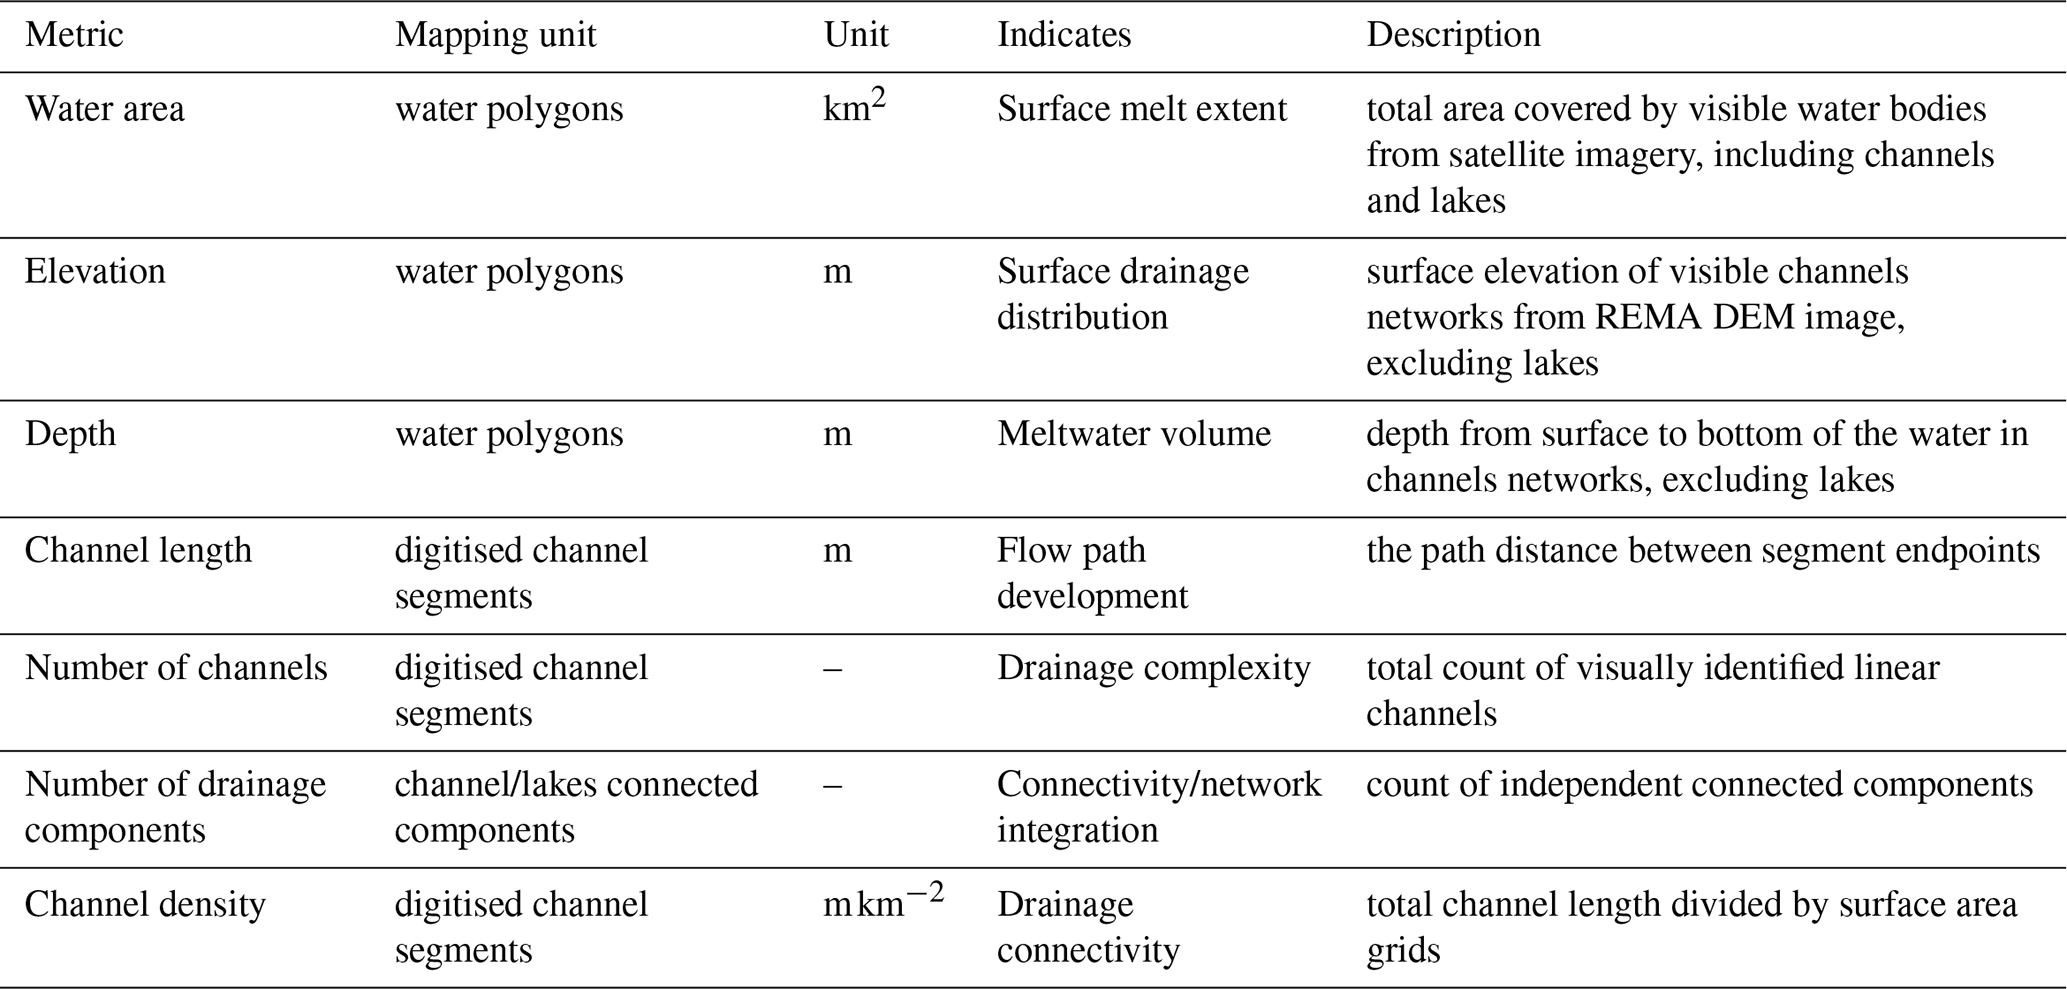
Based on the digitized water polygons and channel centrelines (e.g. Fig. 2b), several key metrics (surface water area, water depth, number of channels and total channel length) (Table 1) were measured using tools from ArcMap 10.8 (Yang et al., 2016). In addition, we used mosaiced surface elevation model (DEM) data at 10 m spatial resolution from the REMA database (Howat et al., 2019) to approximate surface water elevation by ArcMap 10.8. Channel density, defined as the total length of supraglacial channel segments per unit area (m km−2), characterizes the spatial concentration of meltwater channels. The ice shelf surface was divided into 5 km×5 km grid cells using the Fishnet tool in ArcGIS Pro 2.8.8, allowing spatially consistent drainage density calculations across different timescales. To assess whether there are statistical differences between time periods, non-parametric Kruskal–Wallis H-tests (Ostertagová et al., 2014) were conducted independently for depth and elevation.
3.3.2 Estimation of surface water depth
To assess interannual variability in surface water depth from Sentinel-2 imagery, we applied a satellite-derived depth retrieval algorithm based on reflectance-depth relationships which is widely used over the Greenland and Antarctic ice sheets (Williamson et al., 2018; Zhang et al., 2023; Melling et al., 2024). This empirical power-law formulation (dpixel, in m) is:
where Red represents the reflectance value of the Sentinel-2 Red band. For Landsat-8 imagery, a spectral band ratio approach has been adopted to derive water depth based on the dual-channel model (Eq. 3–4) (Moussavi et al., 2016; Pope et al., 2016). The empirical derivation of calibrated coefficients is (Pope et al., 2016):
where a=0.1488, b=5.0370 and c=5.0473, is the ratio of the reflectance values of Landsat-8 OLI Band-1 (Coastal/Aerosol: 0.435–0.451 µm) and Band-3 (Green: 0.533–0.590 µm), and z is the derived water depth from Landsat-8 imagery.
Optically derived water-depth estimates are subject to large uncertainties in absolute depth estimation due to the lack of in situ validation, and because the retrieval depends on assumptions about lake bed reflectance, attenuation of light within the water column, and the spectral properties of water, ice, and snow surfaces (Melling et al., 2024). These depth values provide a consistent relative metric for tracking year-to-year hydrological changes and allow a first-order estimate rather than precisely validated absolute water depths. In this study, they are used primarily to assess relative spatial and temporal variations in water depth between images and years, rather than an accurate quantification of water depth/volume. The derived depth images were masked with the thresholded NDWIce water outlines so that depth estimates were retained only within mapped water-covered areas.
3.4 Comparison with climatic variables
Climate variables including snowfall, surface melt and air temperature have been identified as key controls on surface melt and the ponding of surface water in Antarctica (Langley et al., 2016; Kittel et al., 2021; Arthur et al., 2022). To identify potential meteorological controls on SCN variability, we conducted correlation analyses between four hydrological parameters and seven climate variables spanning multiple temporal scales. The four hydrological parameters are: (1) surface water area, (2) mean water depth, (3) SCN count, and (4) channel density. The first five climate variables are from the Modèle Atmosphérique Régionale (MAR) regional climate model (MARv3.11) (Kittel et al., 2021): (1) austral winter snowfall (June–August accumulated snowfall), (2) austral spring snowfall (September–November accumulated snowfall), (3) austral summer snowfall (November to January accumulated snowfall), (4) summer season melt (November to January accumulated melt), and (5) austral summer surface mass balance (November–January net accumulation). The final two climate variables are: (6) near-surface 2 m air temperature (T2 m) at 0.1° resolution from the European Centre of Medium-range Weather Forecasts Reanalysis v.5 (ERA5) global reanalysis (Hersbach et al., 2020) and (7) local temperature data from Novolazarevskaya Research Station (70°46′ S 11°52′ E, Fig. 1b) in-situ records acquired by the REference Antarctic Data for Environmental Research (READER) Project (Turner et al., 2004). Daily MAR outputs () were summed over the corresponding seasons to obtain accumulated melt, snowfall, rainfall, and SMB values (mm w.e.).
To consider the capacity of the snow and firn layer to absorb and retain meltwater, the melt-over-accumulation (MOA) ratio was calculated following Van Wessem et al. (2023). MOA provides an indication of the balance between meltwater production and the availability of snow/firn accumulation for meltwater storage and is defined as:
For each January satellite image, annual MOA was calculated using MAR totals of surface melt, rainfall and snowfall accumulated over the 12 month period from the preceding March, through to the February that followed the January in question. For example, the MOA value associated with the January 2019 satellite observation was calculated using MAR totals from March 2018–February 2019. Therefore, MOA was used as an annual melt-year background indicator rather than as a strictly pre-image forcing variable. Because sublimation data were not available in the publicly accessible MAR dataset used in this study, a simplified MOA ratio was calculated as:
This modified formulation should be regarded as an approximation of the original MOA definition and may slightly underestimate the effective MOA ratio because sublimation reduces the amount of snow available for meltwater storage.
Climate variables were primarily chosen from the MAR climate model because it provides physically consistent surface mass balance components for ice sheets and ice shelves at a high spatial resolution. Meanwhile, the 2 m air temperature data were obtained from ERA5 because it is a well-validated, observation-constrained variable and is widely used as an independent benchmark for representing surface melt conditions (Arthur et al., 2022). MAR outputs represent deterministic model results for each year, and associated uncertainties are not explicitly quantified but are typically evaluated through interannual variability, sensitivity to model forcing, and comparison with independent datasets. Pearson correlation analyses were performed between all combinations of one of the four hydrological metrics and one of the seven climate variables (Zhang et al., 2023).
For seasonal analysis, the cumulative values of several climate variables (i.e., melt, 2 m air temperature, SMB-surface mass balance and snowfall) were calculated over fixed time windows preceding each channel network observation date (i.e., 7 and 14 d) (Dirscherl et al., 2021), which allows us to explore lagged cumulative forcing analysis of climate variability on evolution of SCNs. Specifically, only values exceeding melt-relevant thresholds were retained for some variables (e.g., maximum air temperature>0 °C for Positive Degree Days, PDD), while others were directly accumulated without thresholding. The resulting cumulative indicators were then correlated with measured metrics (e.g., water area, total channel length) using Pearson correlation.
4.1 Interannual evolution of supraglacial drainage systems
4.1.1 Interannual spatial distribution of drainage components
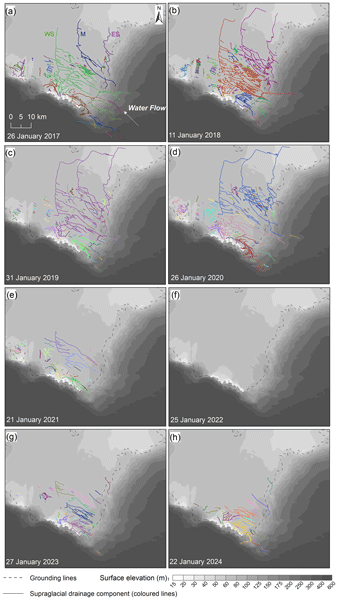
The Nivlisen Ice Shelf exhibited strong interannual variability in the extent and structure of supraglacial drainage systems from 2017–2024 (Fig. 4). A total of 710 supraglacial drainage components comprising 5513 channel segments were mapped, with approximately 52 % terminating in lakes and 48 % draining into the firn layer, i.e. with no obvious lake at the terminus. The supraglacial drainage components expanded markedly between 2017 and 2018, reaching a peak in 2018 in terms of surface water area. In 2019 and 2020 the three main channels (marked as West (WS), Middle (M) and East (ES)) connected to form the largest observed drainage system and terminated in a large (2019: 4.3 km2, 2020: 10.1 km2) lake (see Sect. 4.1.3, Fig. 8). From 2021 onwards, the drainage systems were not as well developed, with reduced surface-water extent and fewer connected drainage components No visible surface water was detected in January 2022. In 2023 and 2024, surface water partially reappeared, but the metrics remained lower than pre-2021 levels (Fig. 4g and h). Spatially, the southern-most region of the grounding line consistently hosted recurring drainage systems in years when visible surface water was detected, whereas other regions displayed high interannual variability.
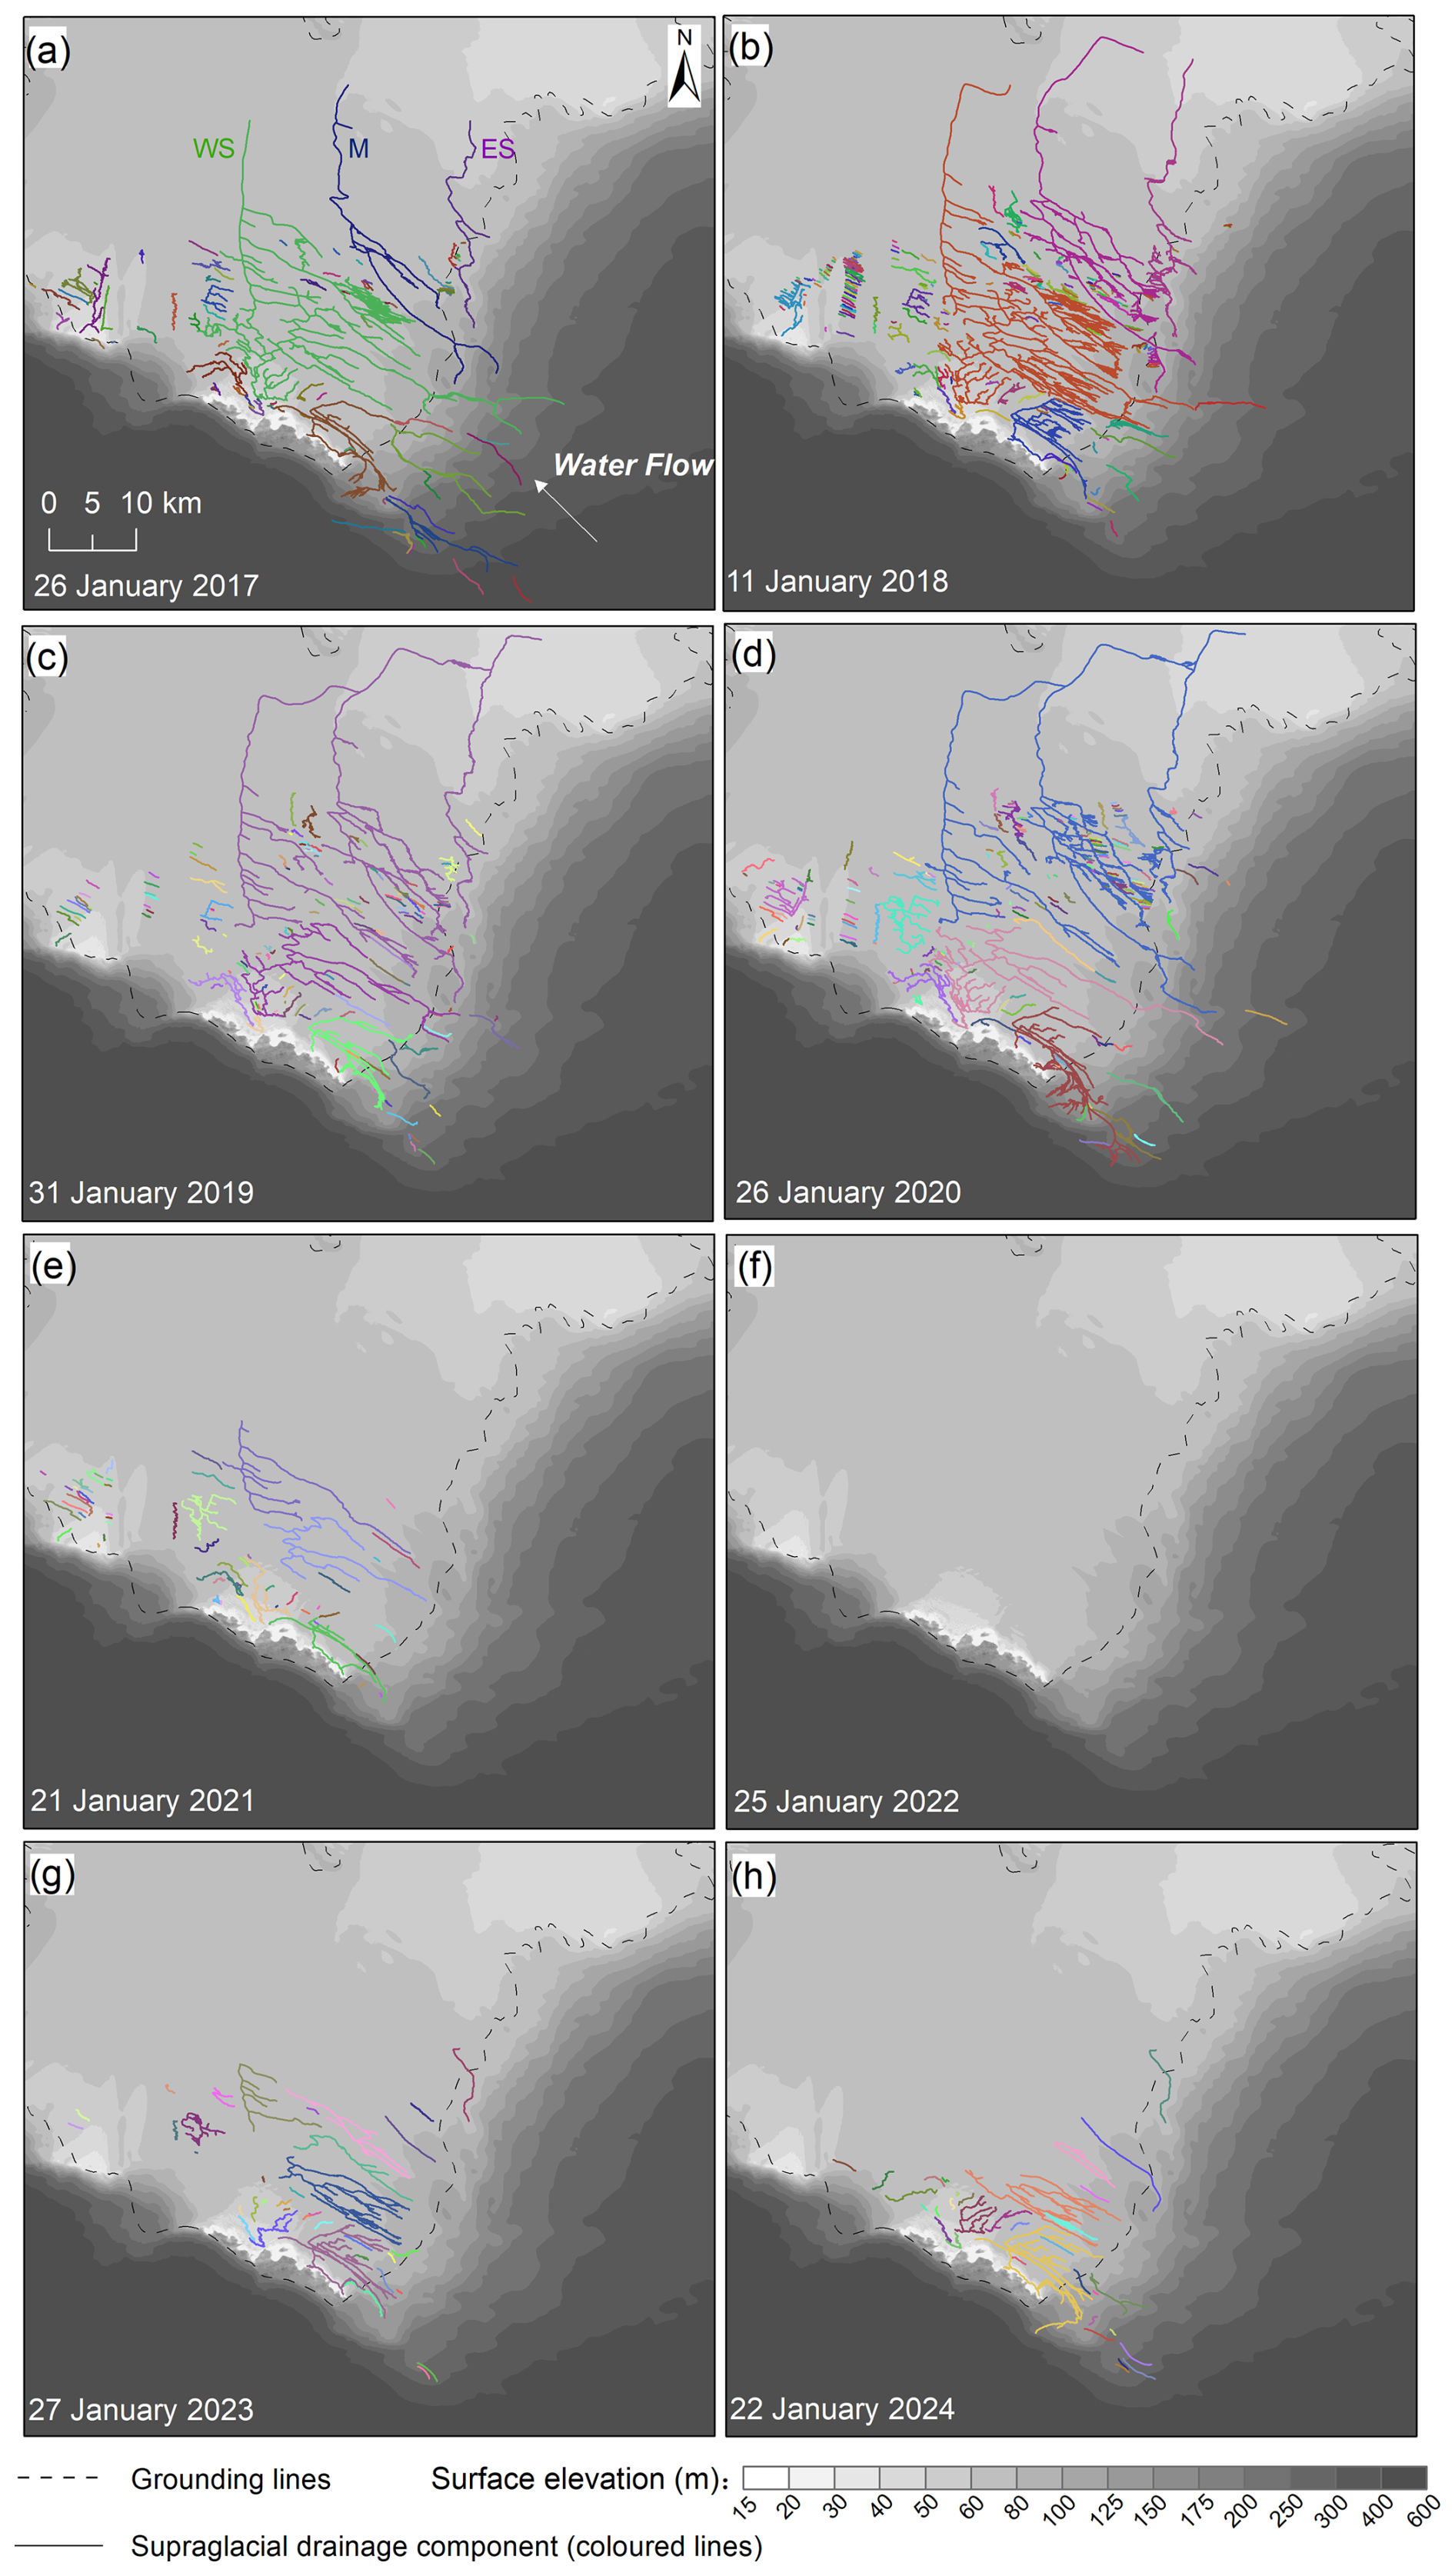
Figure 4Interannual evolution of supraglacial drainage systems on Nivlisen Ice Shelf from 2017–2024. The solid lines in different colours represent separate drainage components in each year. The base image is REMA DEM data at 10 m resolution (Howat et al., 2019). Three main channels marked as West (WS), Middle (M) and East (ES) are shown in (a). Note the non-linear increments in the surface elevation scale to emphasise the subtle relief of the generally flat ice shelf.
Figure 5 illustrates the interannual variability of surface water area, number of channels, total channel length, and number of drainage components over the eight-year study period. All metrics reach a peak in 2018, when the surface water area was approximately 172 km2. In 2018, there were 186 drainage components, 1650 channels, and the total channel length exceeded 1400 km, indicating a widespread and well-connected drainage components. However, while the surface water area decreased from ∼140 km2 in 2019 to ∼135 km2 in 2020, the number of channels increased from 938–1373, and total channel length increased from 895–1275 km. In 2022 there was a sharp decline of all metrics to zero. Partial recovery is observed in 2023 and 2024, but the surface water area remained below 50 km2, and channel-related metrics did not return to pre-2022 levels (e.g., 319 channels and 419 km of total length in 2023).
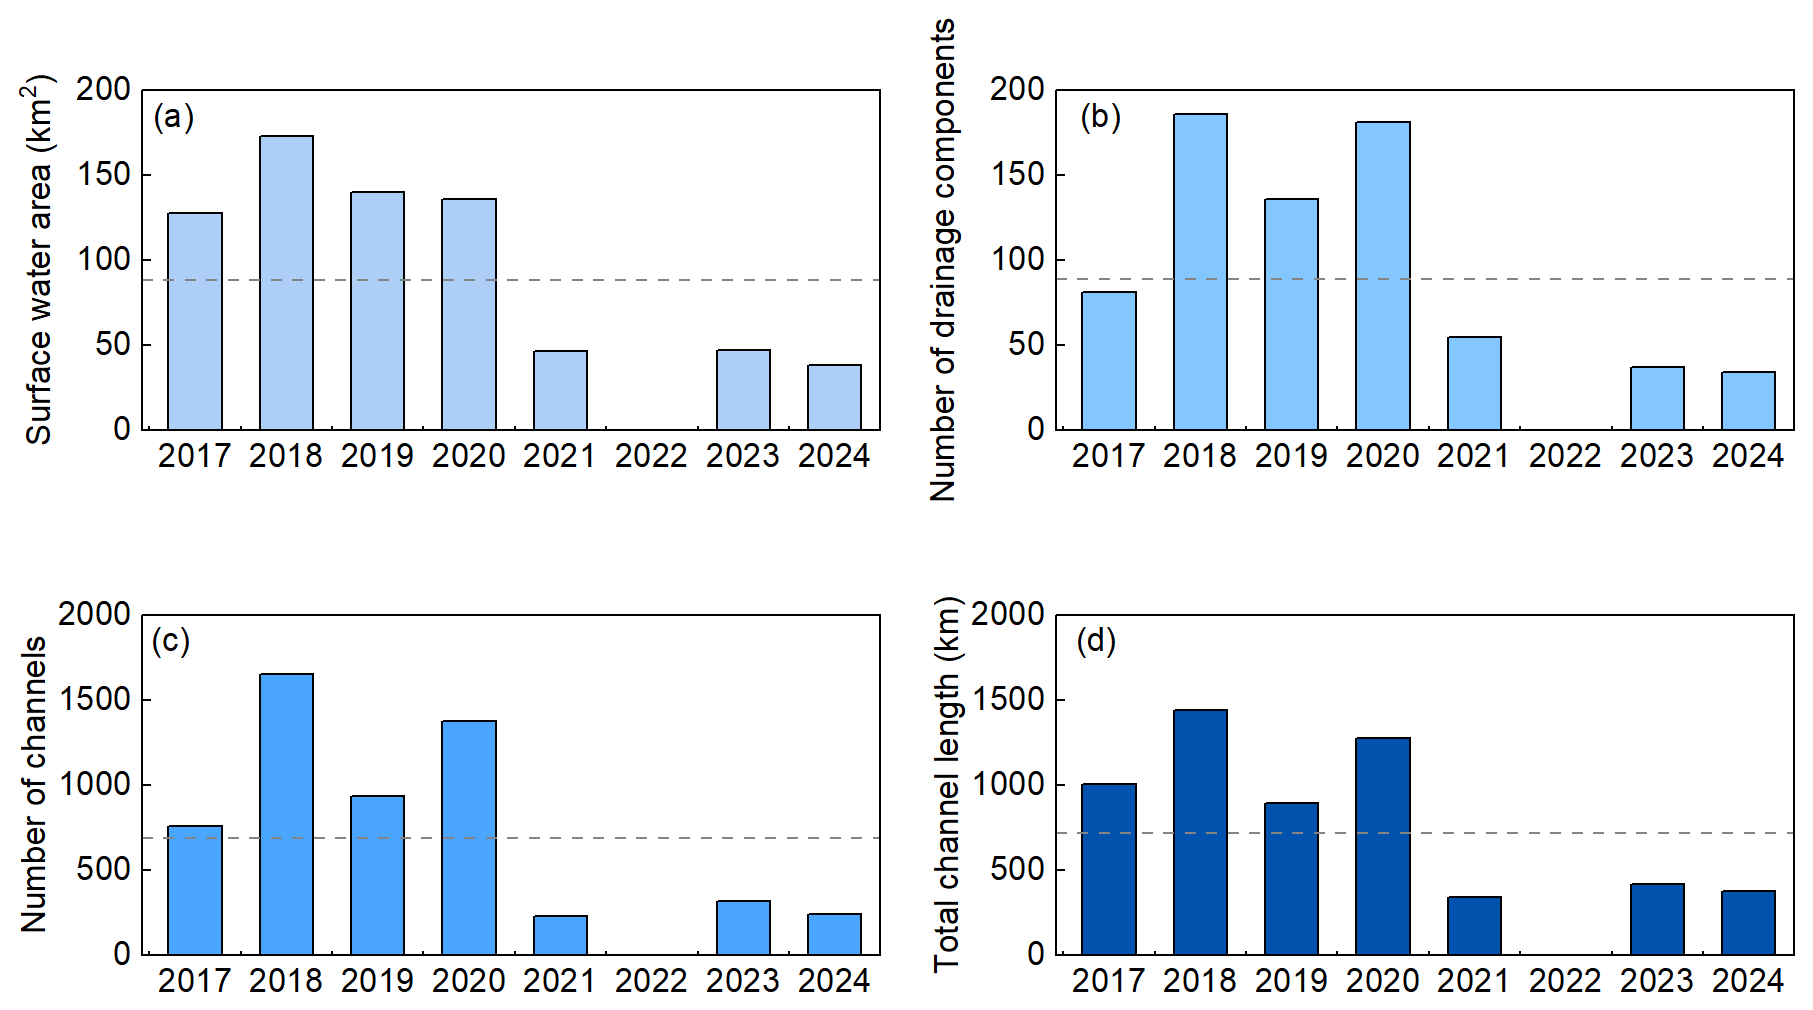
Figure 5Interannual variations in (a) total water area, (b) number of drainage components (c) number of channels and (d) total length of channels on Nivlisen Ice Shelf. Values represent annual total metrics derived from a single observation for each melt season. The grey dashed lines represent the mean value of each metric.
Kruskal–Wallis tests reveal statistically significant interannual differences in both surface water elevation and depth. For elevation, the test yielded H=5005.60 (p<0.001), although the high significance likely reflects the large sample size rather than a substantial shift in distribution. The median elevations remained broadly consistent during the study period, with most supraglacial drainage components concentrated around 70 m a.s.l. (meter above sea level) (Fig. 6). A slight decrease occurred only in 2021, when the mean elevation was lower and the minimum approached 60 m. For depth, the Kruskal–Wallis test also returned a significant result (H=17 179.2, p<0.001). Median depths were about 0.4 m from 2017–2021, and decreased slightly to ∼0.3 m in 2023 and 2024. Despite the statistical significance, these results indicate that both elevation and depth remained relatively stable through most of the study period.
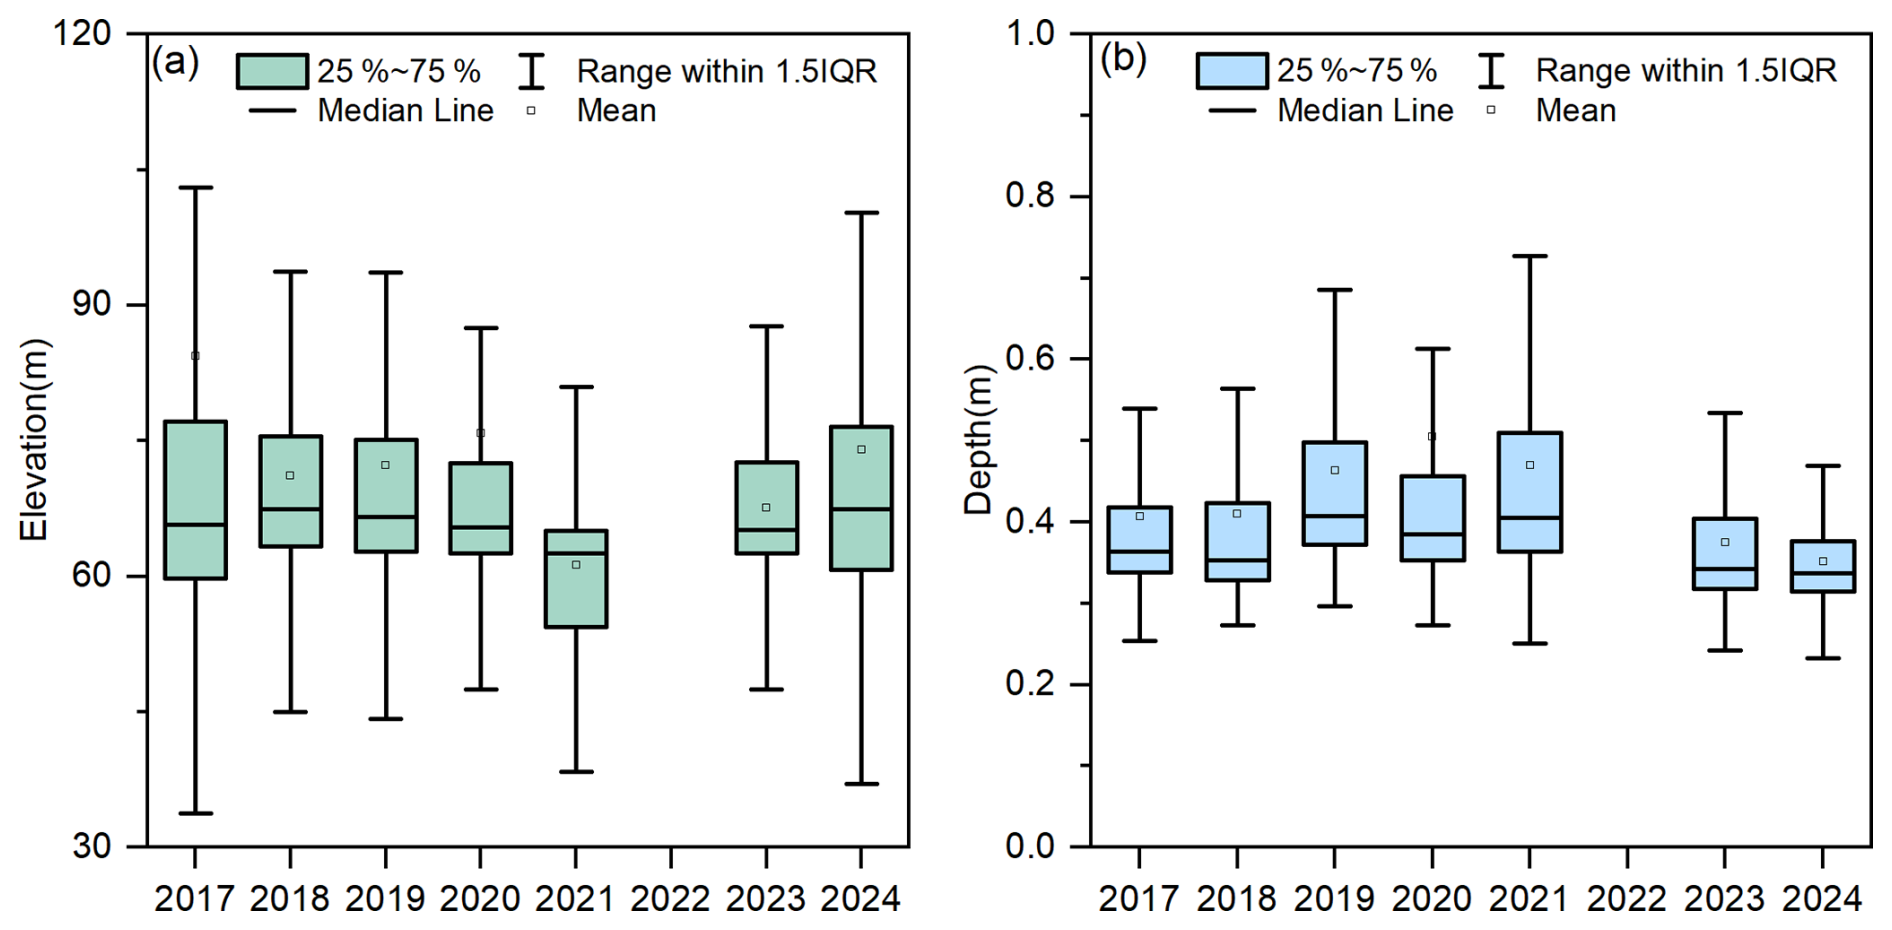
Figure 6Interannual variation in the (a) elevation and (b) water depth of supraglacial drainage components on Nivlisen Ice Shelf from 2017–2024. Medians and interquartile ranges are shown. Kruskal–Wallis tests confirm significant interannual variability for both variables (p<0.001).
4.1.2 Interannual variations in channel density and channel reoccurrence
The interannual variability in channel density is shown in Fig. 7, where areas with high channel density ( of cumulative channel length) are represented by yellow and red colours. From 2017–2018, the highest density regions are in the eastern parts of the ice shelf, close to the grounding line. Although the spatial footprint of supraglacial channels extends slightly northward in 2019, the overall density decreases compared to 2018, as indicated by the reduction in red grid cells (). In 2020 there is an appearance of more high-density areas, which shift towards the southern and northern regions, showing the formation of new channels. 2021 likely marks a transition year, where surface melt was greatly suppressed, and drainage systems disintegrated into sparse, fragmented parts with limited connectivity or meltwater supply. From 2021–2024, with the exception of 2022, few regions covered by supraglacial channels exceeded 1000 m km−2. Overall, the high-density regions exhibit significant spatial and temporal shifts during the study period. The reoccurrence map in Fig. 7h reveals that over the eight years, supraglacial channels frequently appeared in the areas near the southernmost part of grounding line, particularly near the Schirmacher Oasis nunatak (i.e., magenta grids near the grounding line). These high reoccurrence zones represent long-lived hydrological pathways, where supraglacial channels are usually active across multiple years, despite interannual variability in meltwater supply.
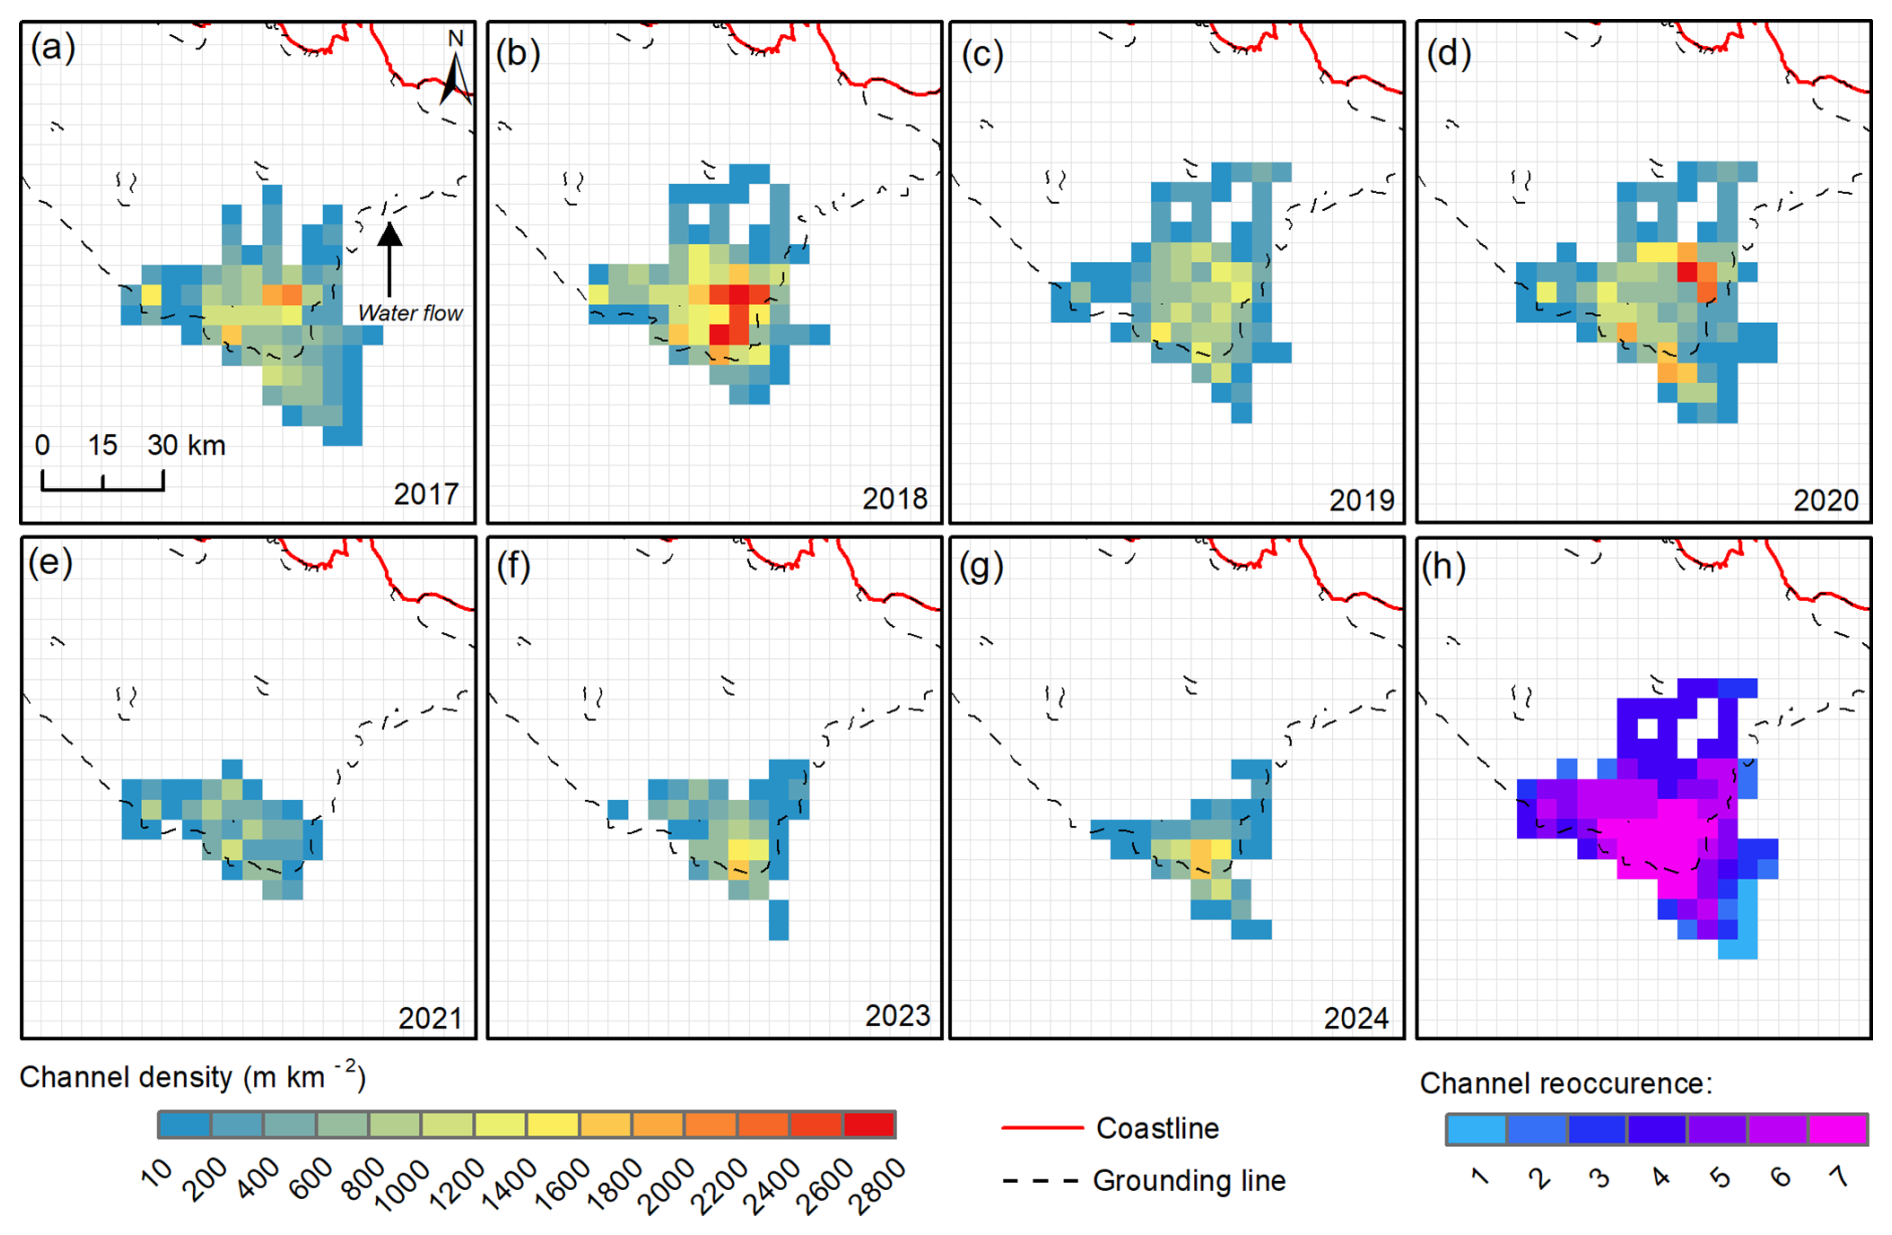
Figure 7Interannual channel density (a–g) and channel reoccurrence (h) of the supraglacial drainage systems on Nivlisen Ice Shelf from 2017–2024. Note that no channels developed in 2022 (see Figs. 4 and 5).
4.1.3 Reoccurrence of the large terminal lake in 2019 and 2020
A large supraglacial lake formed at the confluence of the WS, M, and ES channels (Fig. 4) during the summers of 2019 and 2020 (Fig. 8). On 31 January 2019, the lake was a dark-blue colour and covered an area of 4.35 km2, which was located approximately 20 km from the ice-shelf front at its closest point. This lake surface (Fig. 8a) may indicate refrozen water from an earlier stage of the melt season or from a previous melt season, although its wintertime evolution cannot be determined from the available optical imagery. By 26 January 2020, the same ice surface depression contained a larger lake of 10.1 km2 in area, but the water appeared shallower, as indicated by its lighter tone. The minimum distance from the lake margin to the ice-shelf front was 18 km. Sentinel-2 imagery from 2020 also reveals a distinct ∼50 m-wide frozen rim extending beyond the visible water margin, a feature absent in January 2019, suggesting gradual refreezing during late summer. These contrasting observations indicate that the lake experienced markedly different storage capacities and drainage regimes between the two years but that there is also a challenge in understanding its evolution in scale due to the pattern of refreezing and subsequent re-melting.
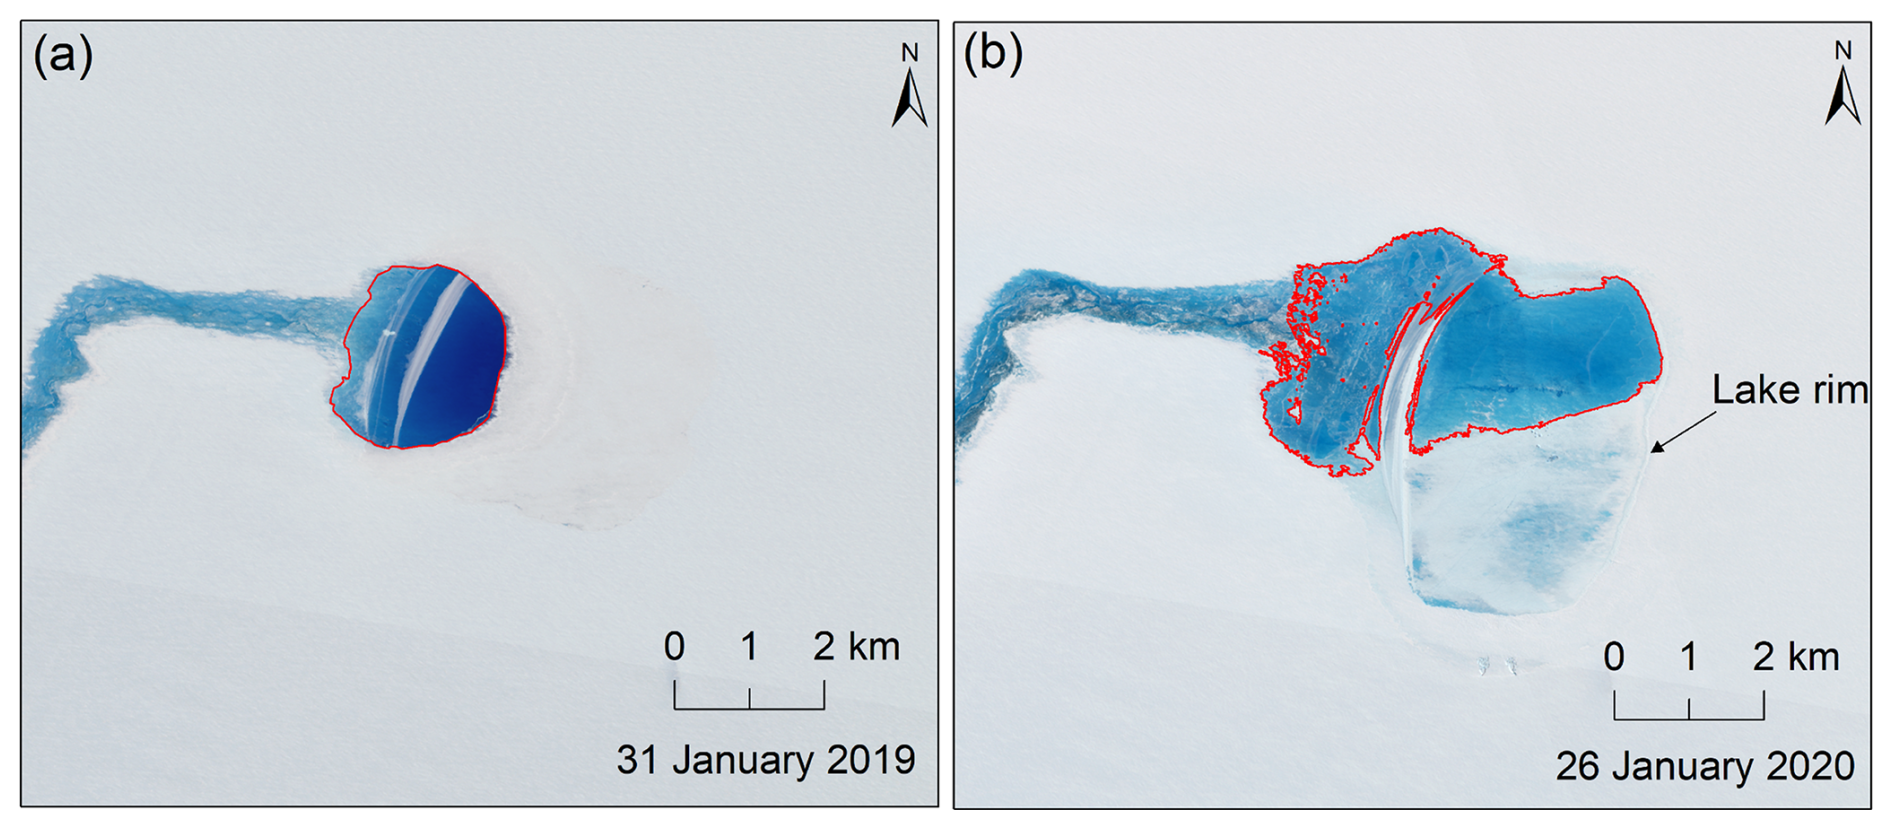
Figure 8Comparison of supraglacial lake evolution on Nivlisen Ice Shelf between 2019 and 2020: (a, b) Sentinel-2 images on 31 January 2019 and 26 January 2020, respectively, with lake boundaries shown in red. In 2020, a prominent peripheral rim is visible around the enlarged lake. In 2019, the lake was smaller (4.35 km2) but substantially deeper (up to ∼8 m). By contrast, in 2020 the lake expanded to 10.1 km2 but was considerably shallower (<2 m), with the outer rim extending ∼50 m beyond the visible water surface.
4.2 Seasonal evolution of supraglacial drainage systems
4.2.1 Seasonal spatial distribution of drainage components during a melt season
Throughout the 2018–2019 melt season, the supraglacial channels evolved from fewer and disconnected water bodies to complex, integrated systems and eventually returned to more fragmented systems (Fig. 9). In early December (1 and 10), sparse and isolated water bodies were distributed across the ice shelf. As the season progressed into mid- to late- December, supraglacial channelisation became increasingly pronounced, particularly near the grounding line, with numerous short and fragmented channels with limited connectivity. Meanwhile, lakes at high elevations decreased in size and, in some cases, disappeared completely by 24 December. By late January, the drainage systems reached their maximum spatial extent, characterized by extensive branching and well-developed main channels spanning broad regions of the ice shelf. This phase exhibited higher degrees of interconnection between individual drainage components, suggesting the integration of previously independent systems. Notably, those lakes that had previously vanished in high-elevation regions reappeared with reduced surface areas. In February and early March, the drainage systems began to fragment, with fewer continuous structures and reduced extent. Despite this decline, some main channels remained well-defined until early March, particularly in lower-elevation areas (Fig. 9f–h).
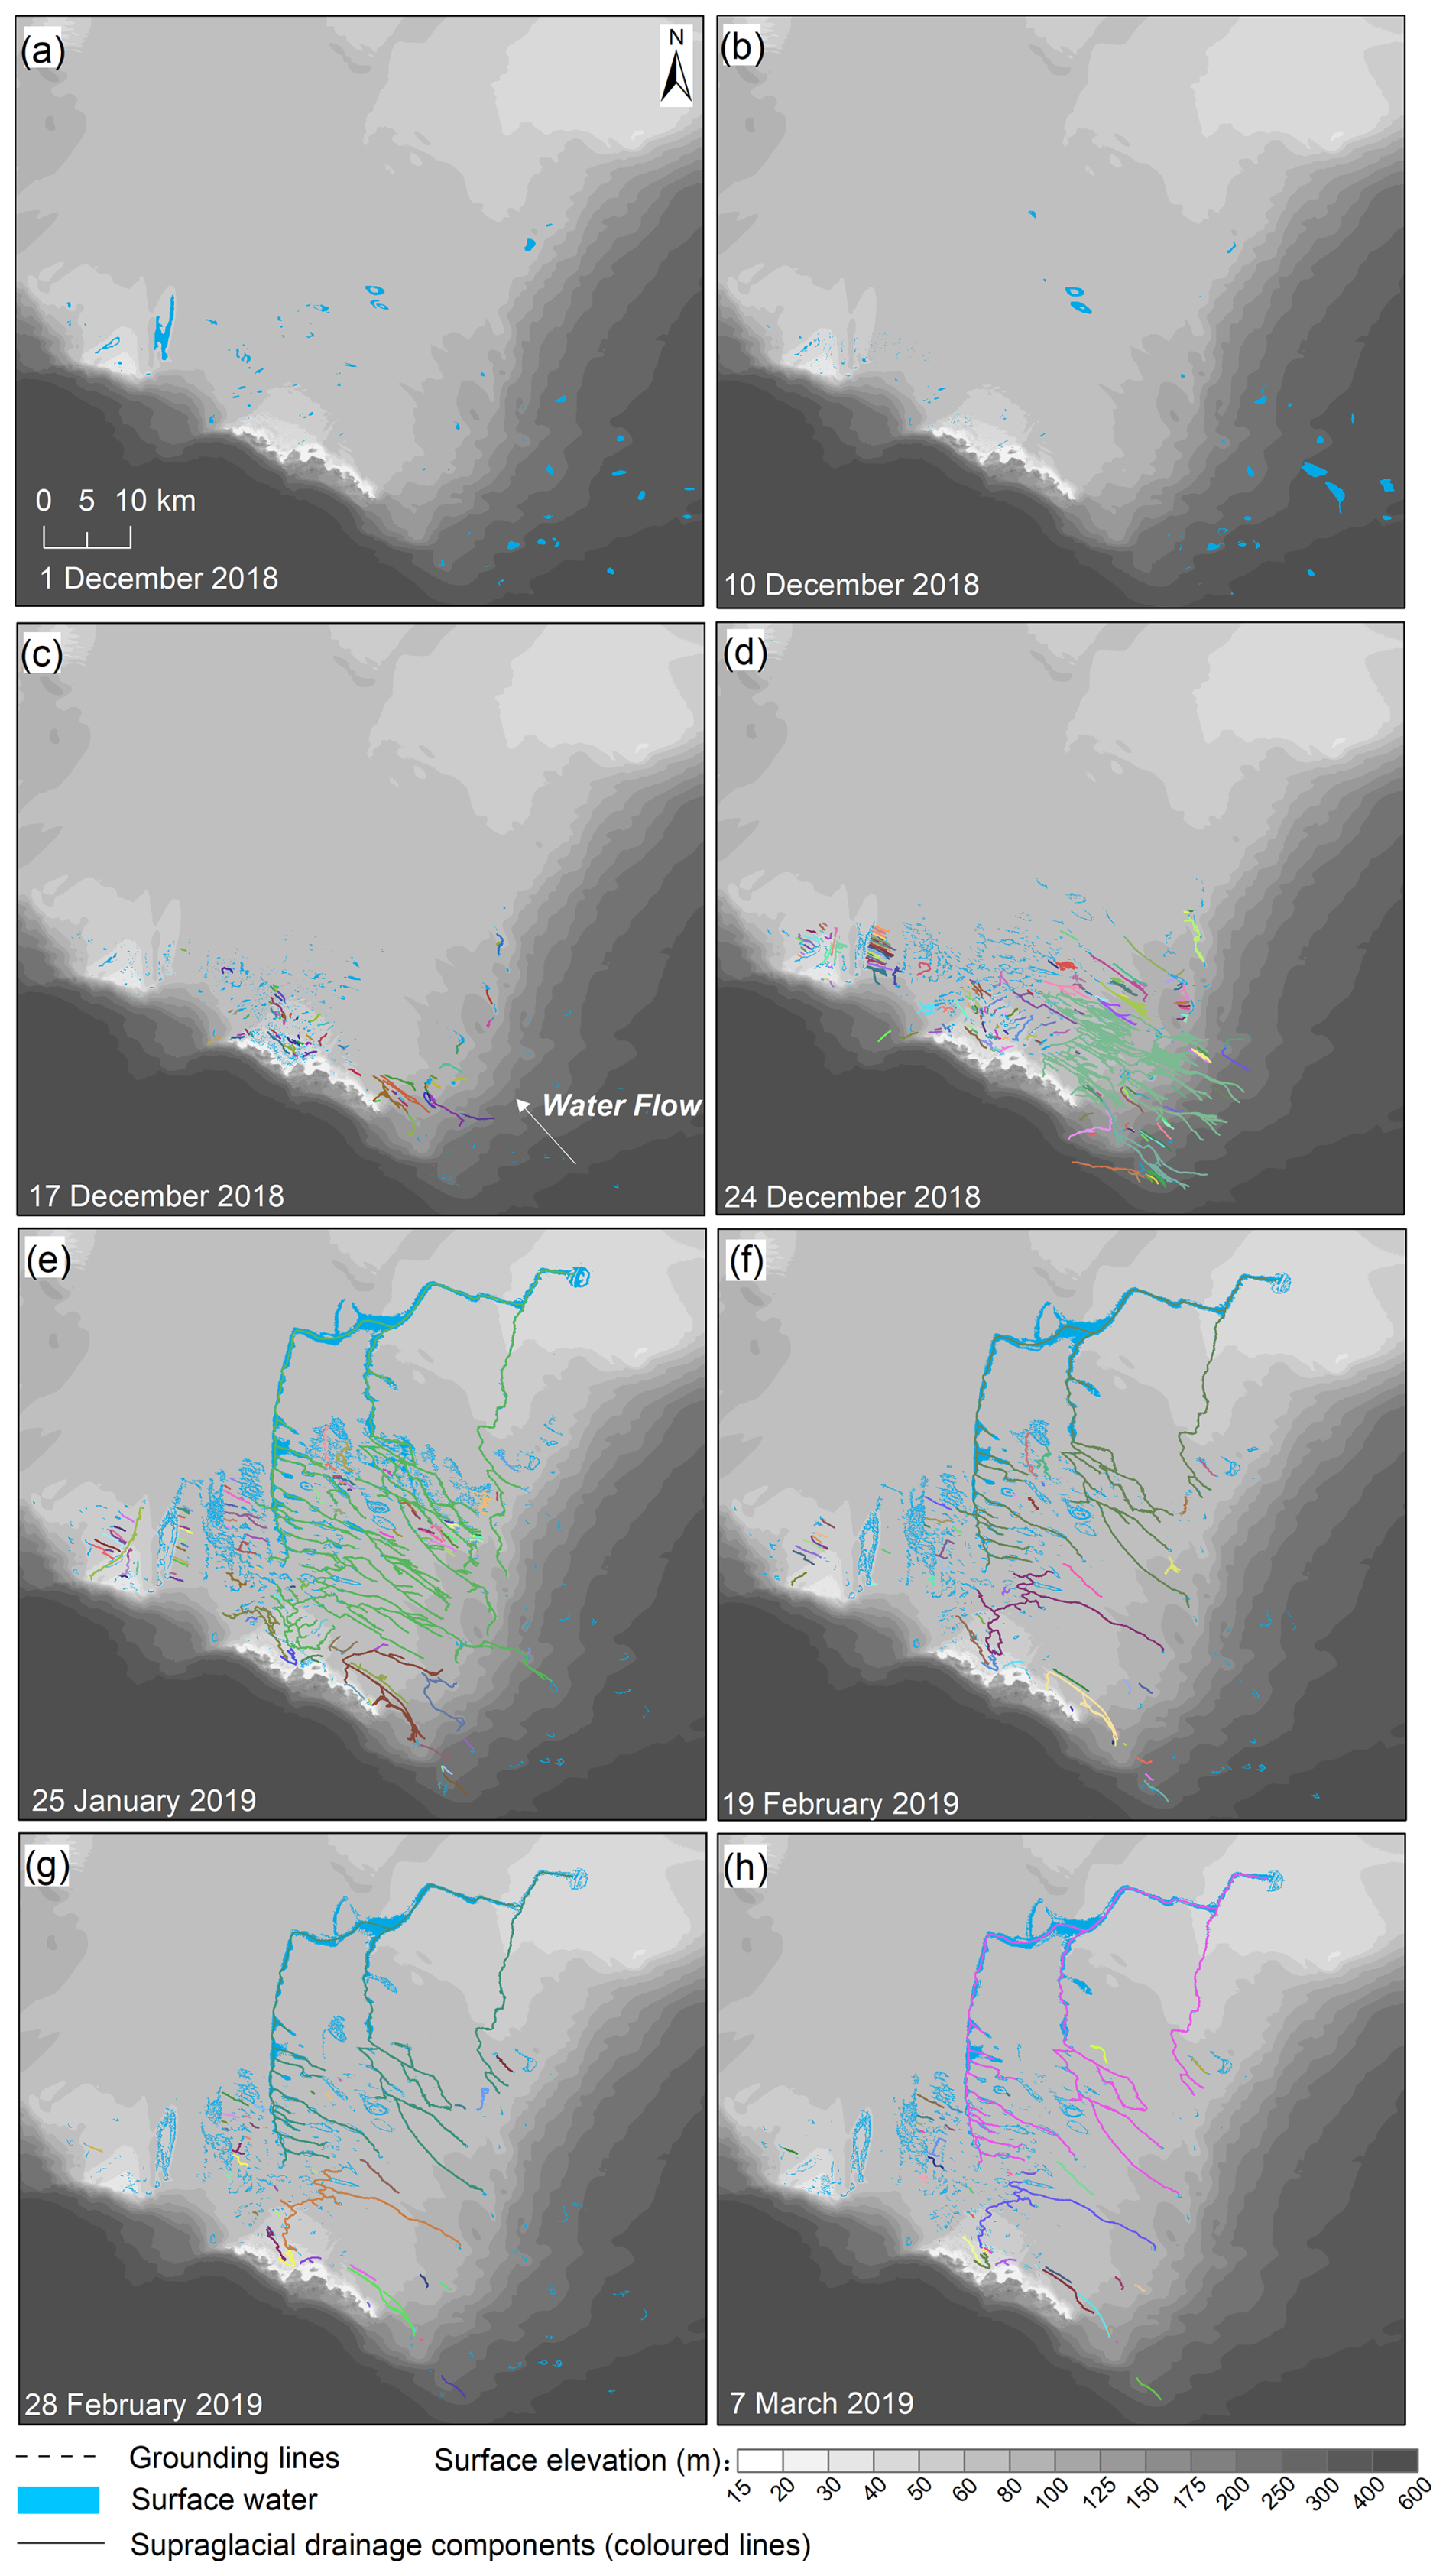
Figure 9Seasonal evolution of supraglacial drainage systems on Nivlisen Ice Shelf in melt season from 2018 December–2019 March. The solid lines in different colours represent separate supraglacial drainage components delineated manually, and the blue polygons indicate the automatically mapped surface water during the melt season. The base image is REMA DEM data at 10 m resolution (Howat et al., 2019).
Quantitative metrics clearly show the seasonal evolution of supraglacial drainage systems on Nivlisen Ice Shelf (Fig. 10). By 25 January 2019, surface water area peaked at approximately 191 km2, accompanied by the development of 924 individual channels with a total length of 967 km. This peak reflects the most widespread drainage of the melt season. Interestingly, despite the expansion in the number and extent of channels, the number of drainage components decreased after 24 December (from ∼170 to ∼100), suggesting enhanced connectivity. Following this peak, all metrics steadily declined into February and March. By 7 March, surface water area had dropped to ∼83 km2, with fewer than 300 channels remaining and the total channel length reduced to below 35 km.
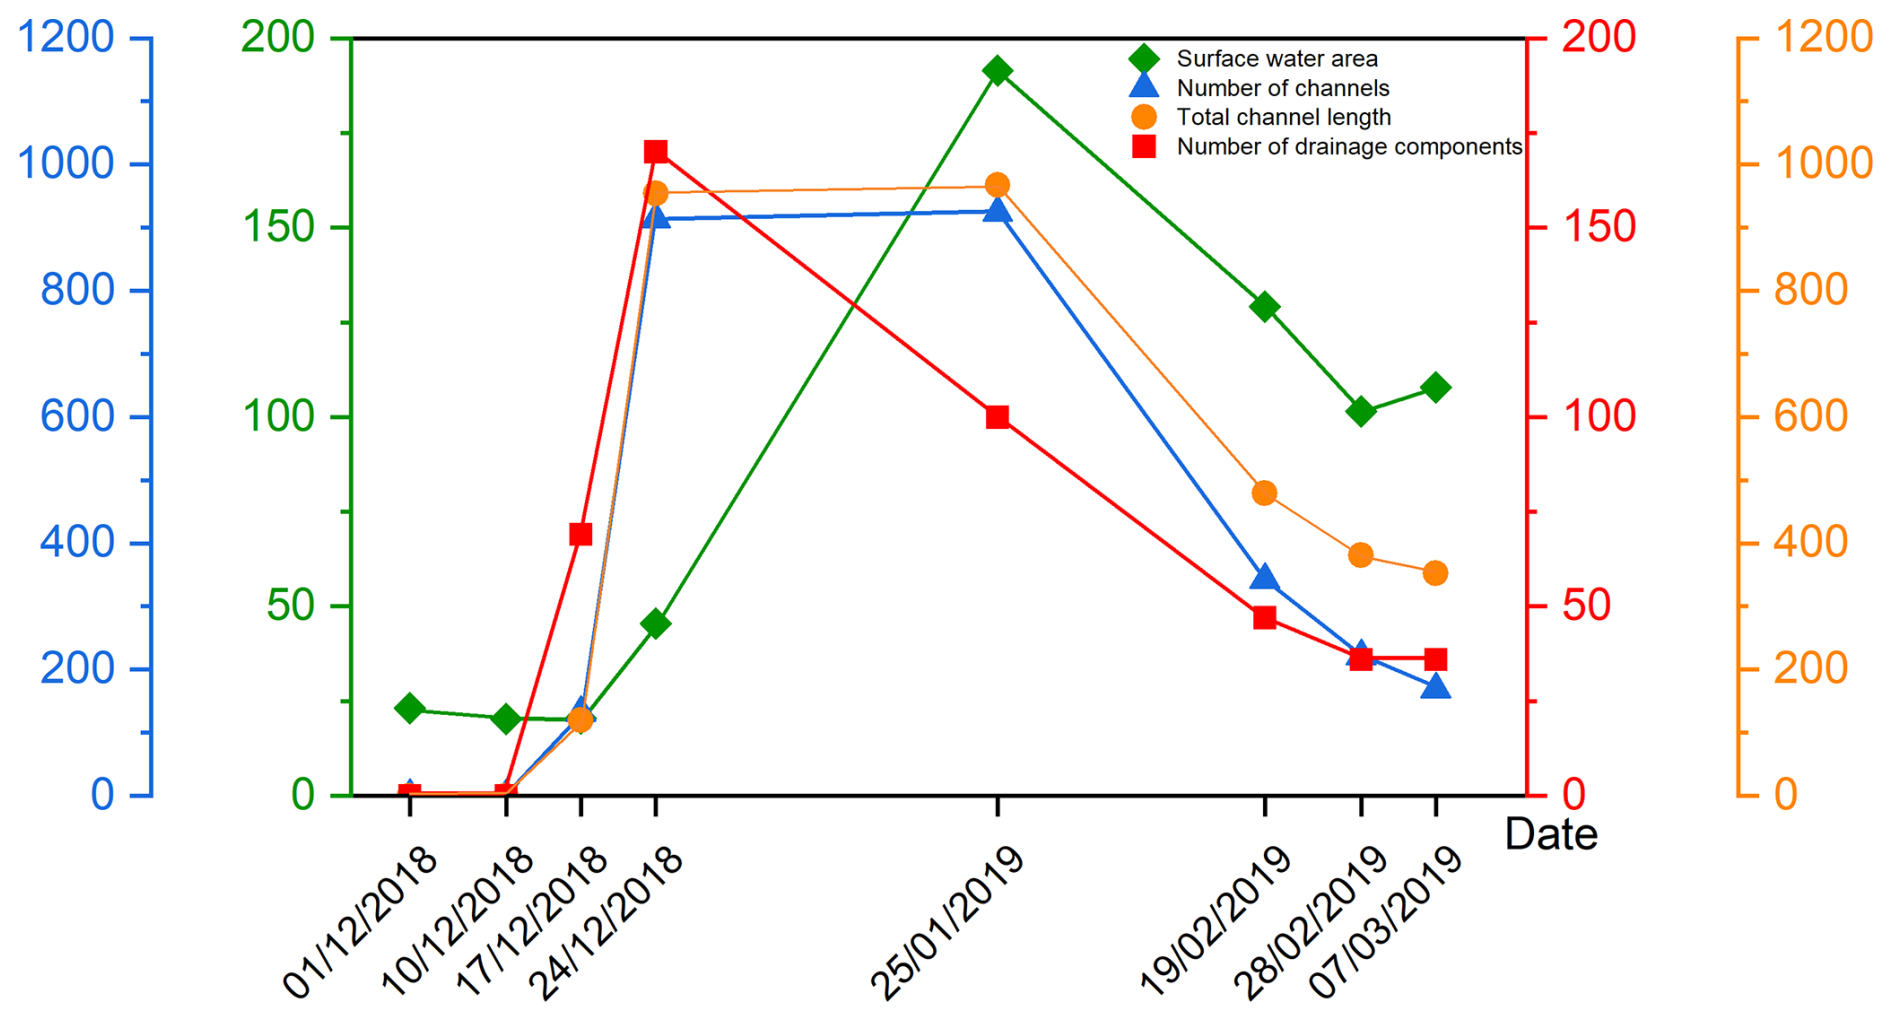
Figure 10Seasonal variations in total water area, number of channels, total length of channels and number of supraglacial drainage components on Nivlisen Ice Shelf.
Both observations from satellite images (Fig. 9) and Kruskal–Wallis test indicate significant seasonal variation in the elevation of drainage systems' development (H=5310.2, p<0.001). Starting from 17 December, when channels were first observed, the elevation range widened slightly during early melt and then gradually narrowed (Fig. 11a). By late January, most supraglacial drainage components were restricted to lower-elevation areas below 100 m a.s.l., where the values remain stable throughout February and March. This pattern indicates a downslope migration of surface meltwater over the melt season, consistent with surface drainage toward the grounding line and ice shelf front (Fig. 9). For water depth, the Kruskal–Wallis test also showed significant seasonal differences (H=7490.4, p<0.001), although visual inspection suggests that the magnitude of variation was limited. The mean depth of supraglacial drainage components on Nivlisen Ice Shelf generally increased from late December, peaked in late January, and then declined toward early March during the 2018–2019 melt season (Fig. 11b). In the early season (1–10 December 2018), water in drainage components was shallow (mostly less than 1 m) and exhibited low variability. Although we treat our absolute values of water depth with caution (see Methods), mean water depth increased notably from late December 2018, reaching a maximum on 25 January 2019, when the mean values were greater than 0.8 m. After mid-February, the water-depth estimates decreased relative to their late-January peak, and the spread of the depth distribution became narrower. This late-season pattern is consistent with reduced meltwater supply or refreezing toward the end of the melt season.
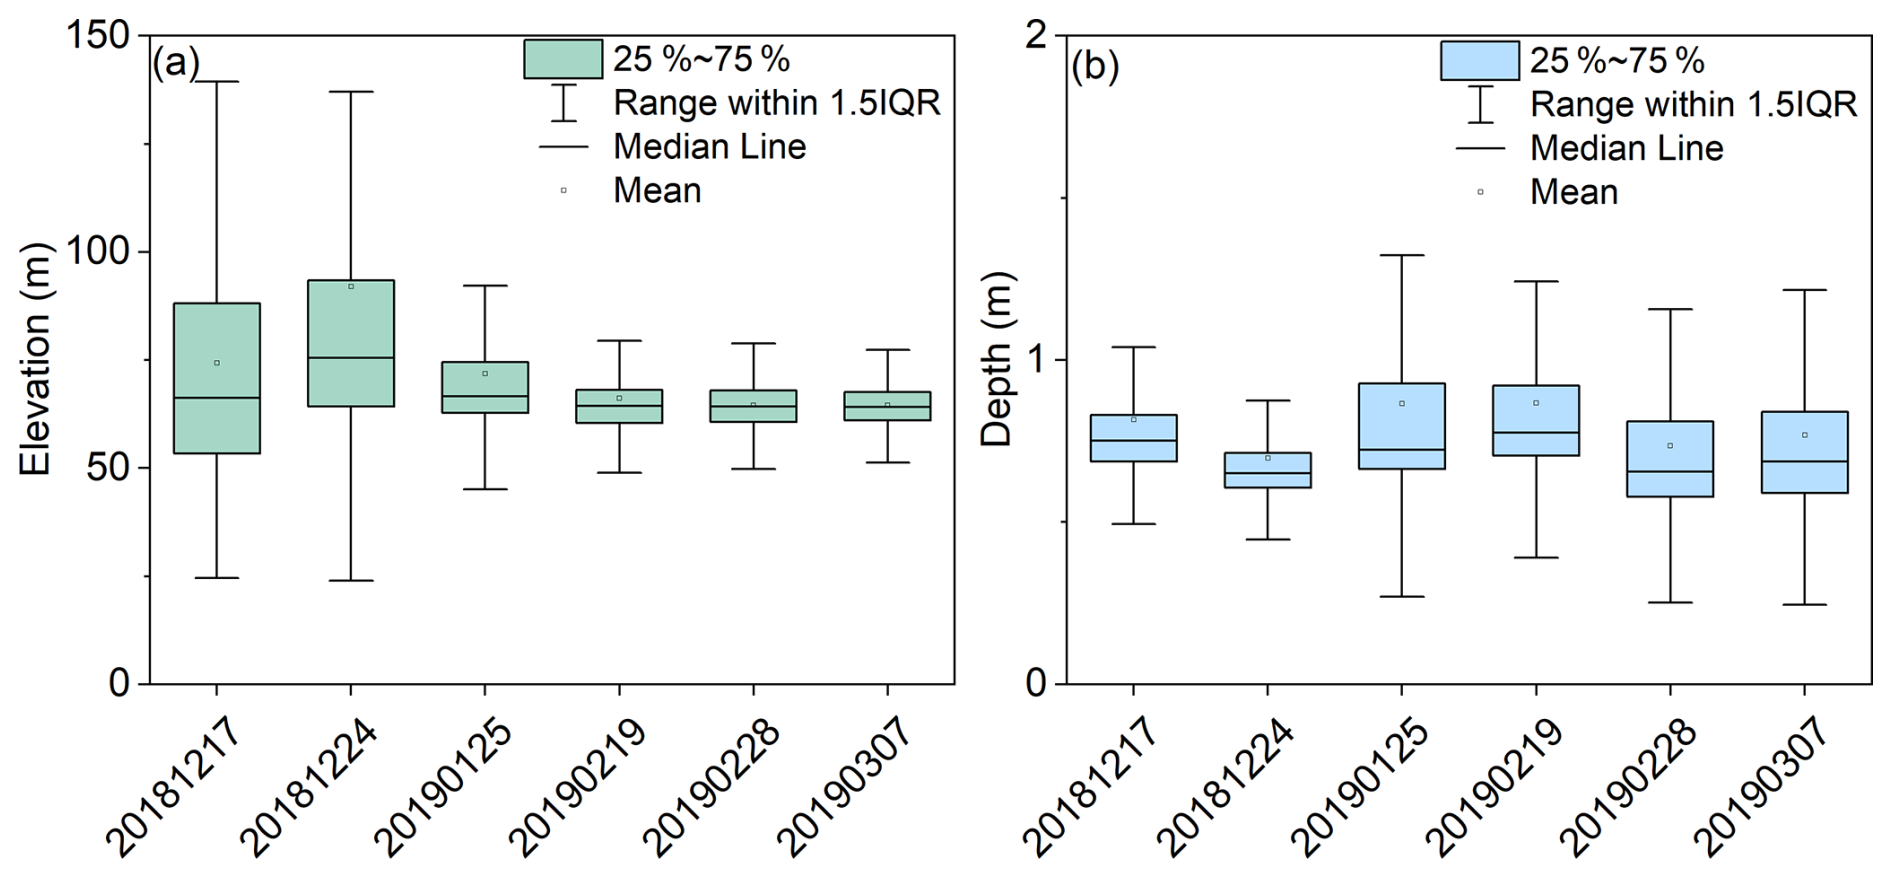
Figure 11Seasonal variation in the (a) elevation and (b) water depth of supraglacial drainage components on Nivlisen Ice Shelf during the 2018–2019 melt season. Kruskal–Wallis tests confirm significant seasonal variability for both variables (p<0.001).
4.2.2 Seasonal evolution of channel density and connectivity
Gridded channel density maps (Fig. 12) reveal a clear seasonal progression in the spatial extent and density of supraglacial channels on Nivlisen Ice Shelf during the 2018–2019 melt season. Initially sparse and localized in mid-December (mostly less than 600 m km−2), channel density peaked in magnitude in late December (with values exceeding 2800 m km−2 in red grid cells near the grounding line). By January, drainage pathways became fully established, with channels extending across nearly the entire ice shelf surface. The most extensive networks formed continuous connections between the grounding zone and the terminal lake near the ice-shelf front (Fig. 8a), reflecting a phase of maximum hydrological connectivity and widespread surface meltwater transport. Thereafter, channel density declined steadily through February and March, remaining below 400 m km−2.
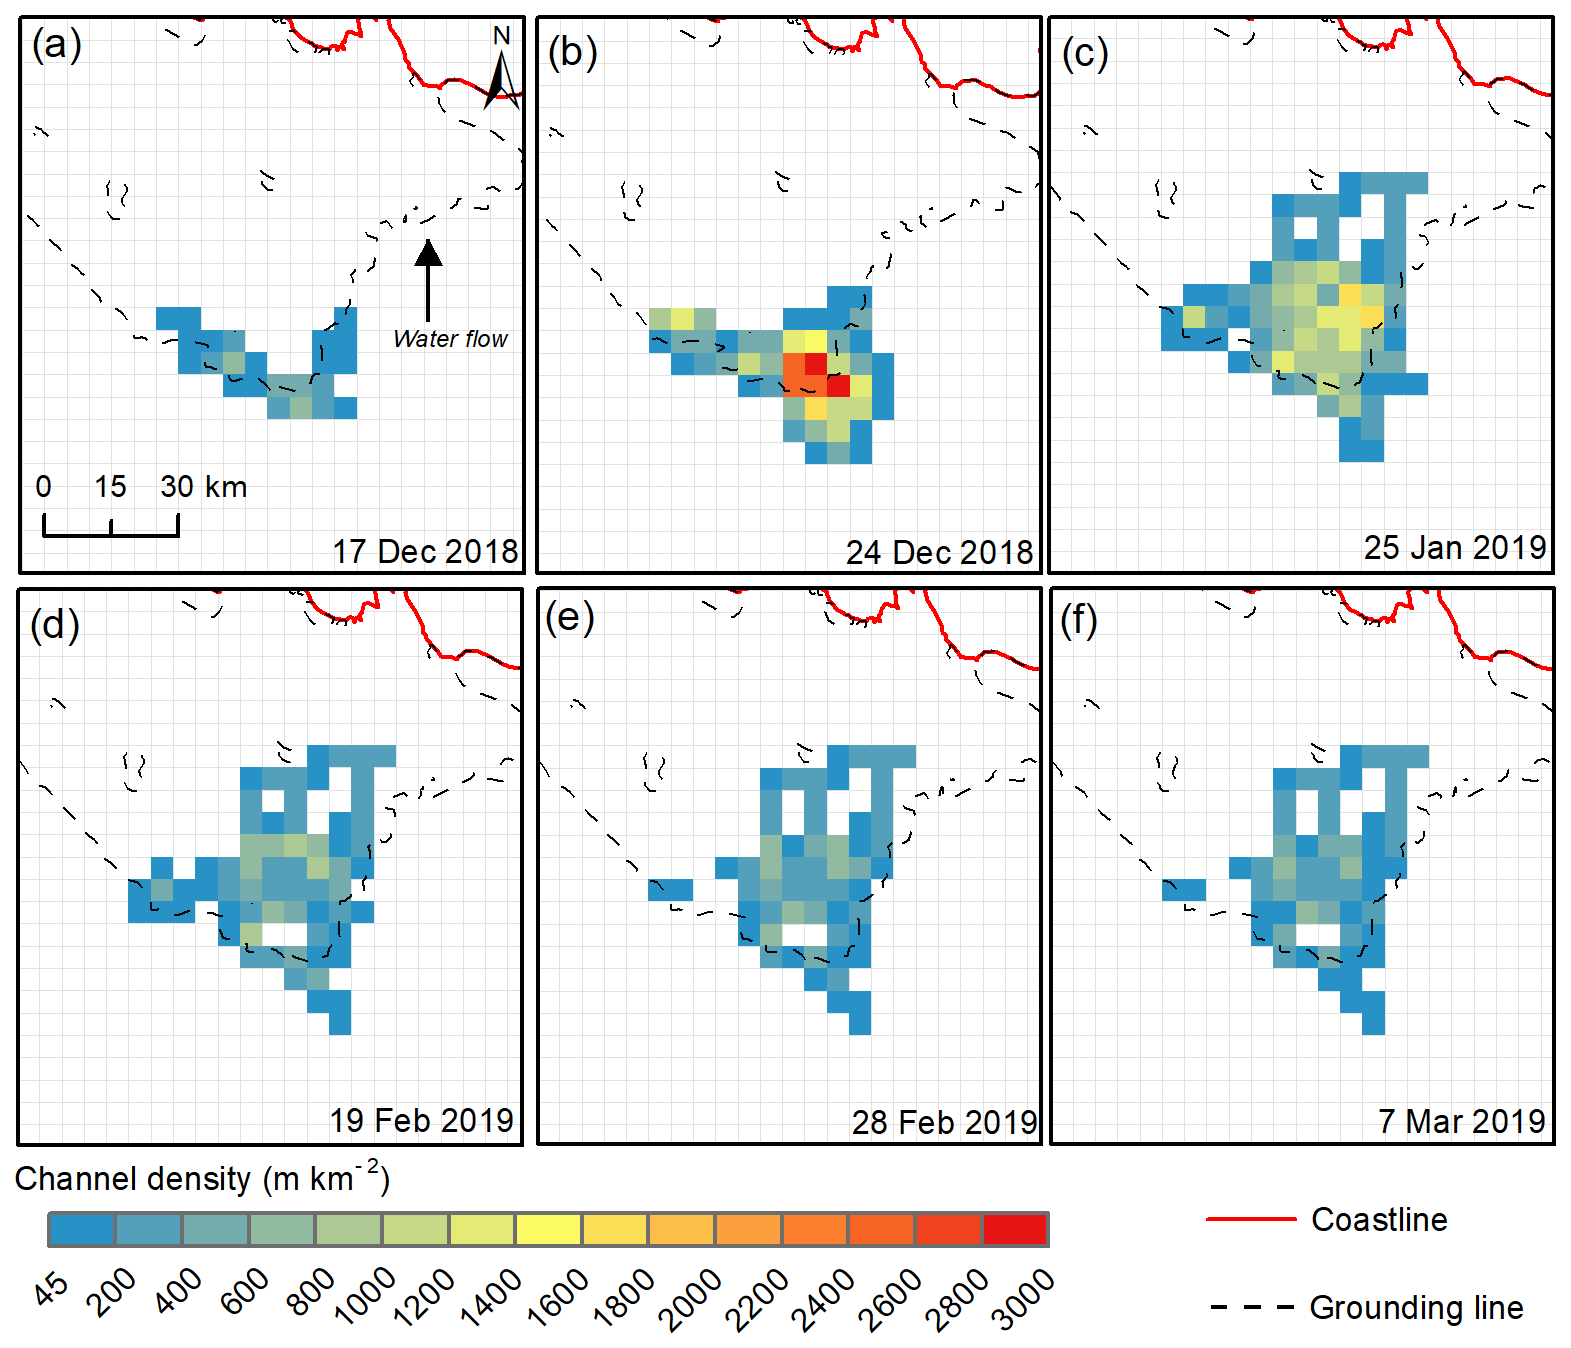
Figure 12Seasonal channel density of the supraglacial drainage systems on Nivlisen Ice Shelf during the melt season in 2018–2019.
To illustrate how connectivity of supraglacial drainage system evolves during the melt season in 2018–2019, overlapping channels across six key dates are shown in Fig. 13a. These patterns reveal a clear trend towards increased connectivity and a progressive downslope transportation of meltwater, originating from high-elevation areas in the southeast above the grounding line and extending across the grounding line toward the ice edge. Throughout this period, active channels either persisted, disappeared, or merged into more integrated drainage systems, reflecting dynamic reorganisation of surface drainage pathways. Upon examining the supraglacial channels across the entire study area during the melt season, two representative zones were selected to illustrate the impact of local topography on the spatial evolution of supraglacial drainage systems (Fig. 13b–i). Zone 1 is characterized by a significant elevation transition, and Zone 2 is a relatively flat area. On 17 December 2018, both zones exhibited fragmented and dispersed drainage systems, indicating an early stage of isolated channel development with limited interconnectivity. After seven days (24 December 2018), some of the channels in Zone 1 disappeared (grey lines in Fig. 10c), while others merge into larger and more integrated drainage system, allowing surface water to traverse the grounding line towards the northwest direction. In contrast, Zone 2 experienced an increase in channel formation (both quantity and total length) during this interval, with newly created channels developing in a more focused southward flow pattern. On 25 January 2019, the drainage systems in Zone 1 exhibited further transformation, as many previously active channels disappeared, leaving a more widely spaced drainage pattern. However, during the same period in Zone 2, a number of channels joined and formed more integrated drainage system. In the late summer (19 February 2019), more than 70 % of the channels in both zones had become invisible on the Landsat-8 imagery, which is likely associated with reduced meltwater supply and seasonal shutdown of surface drainage.
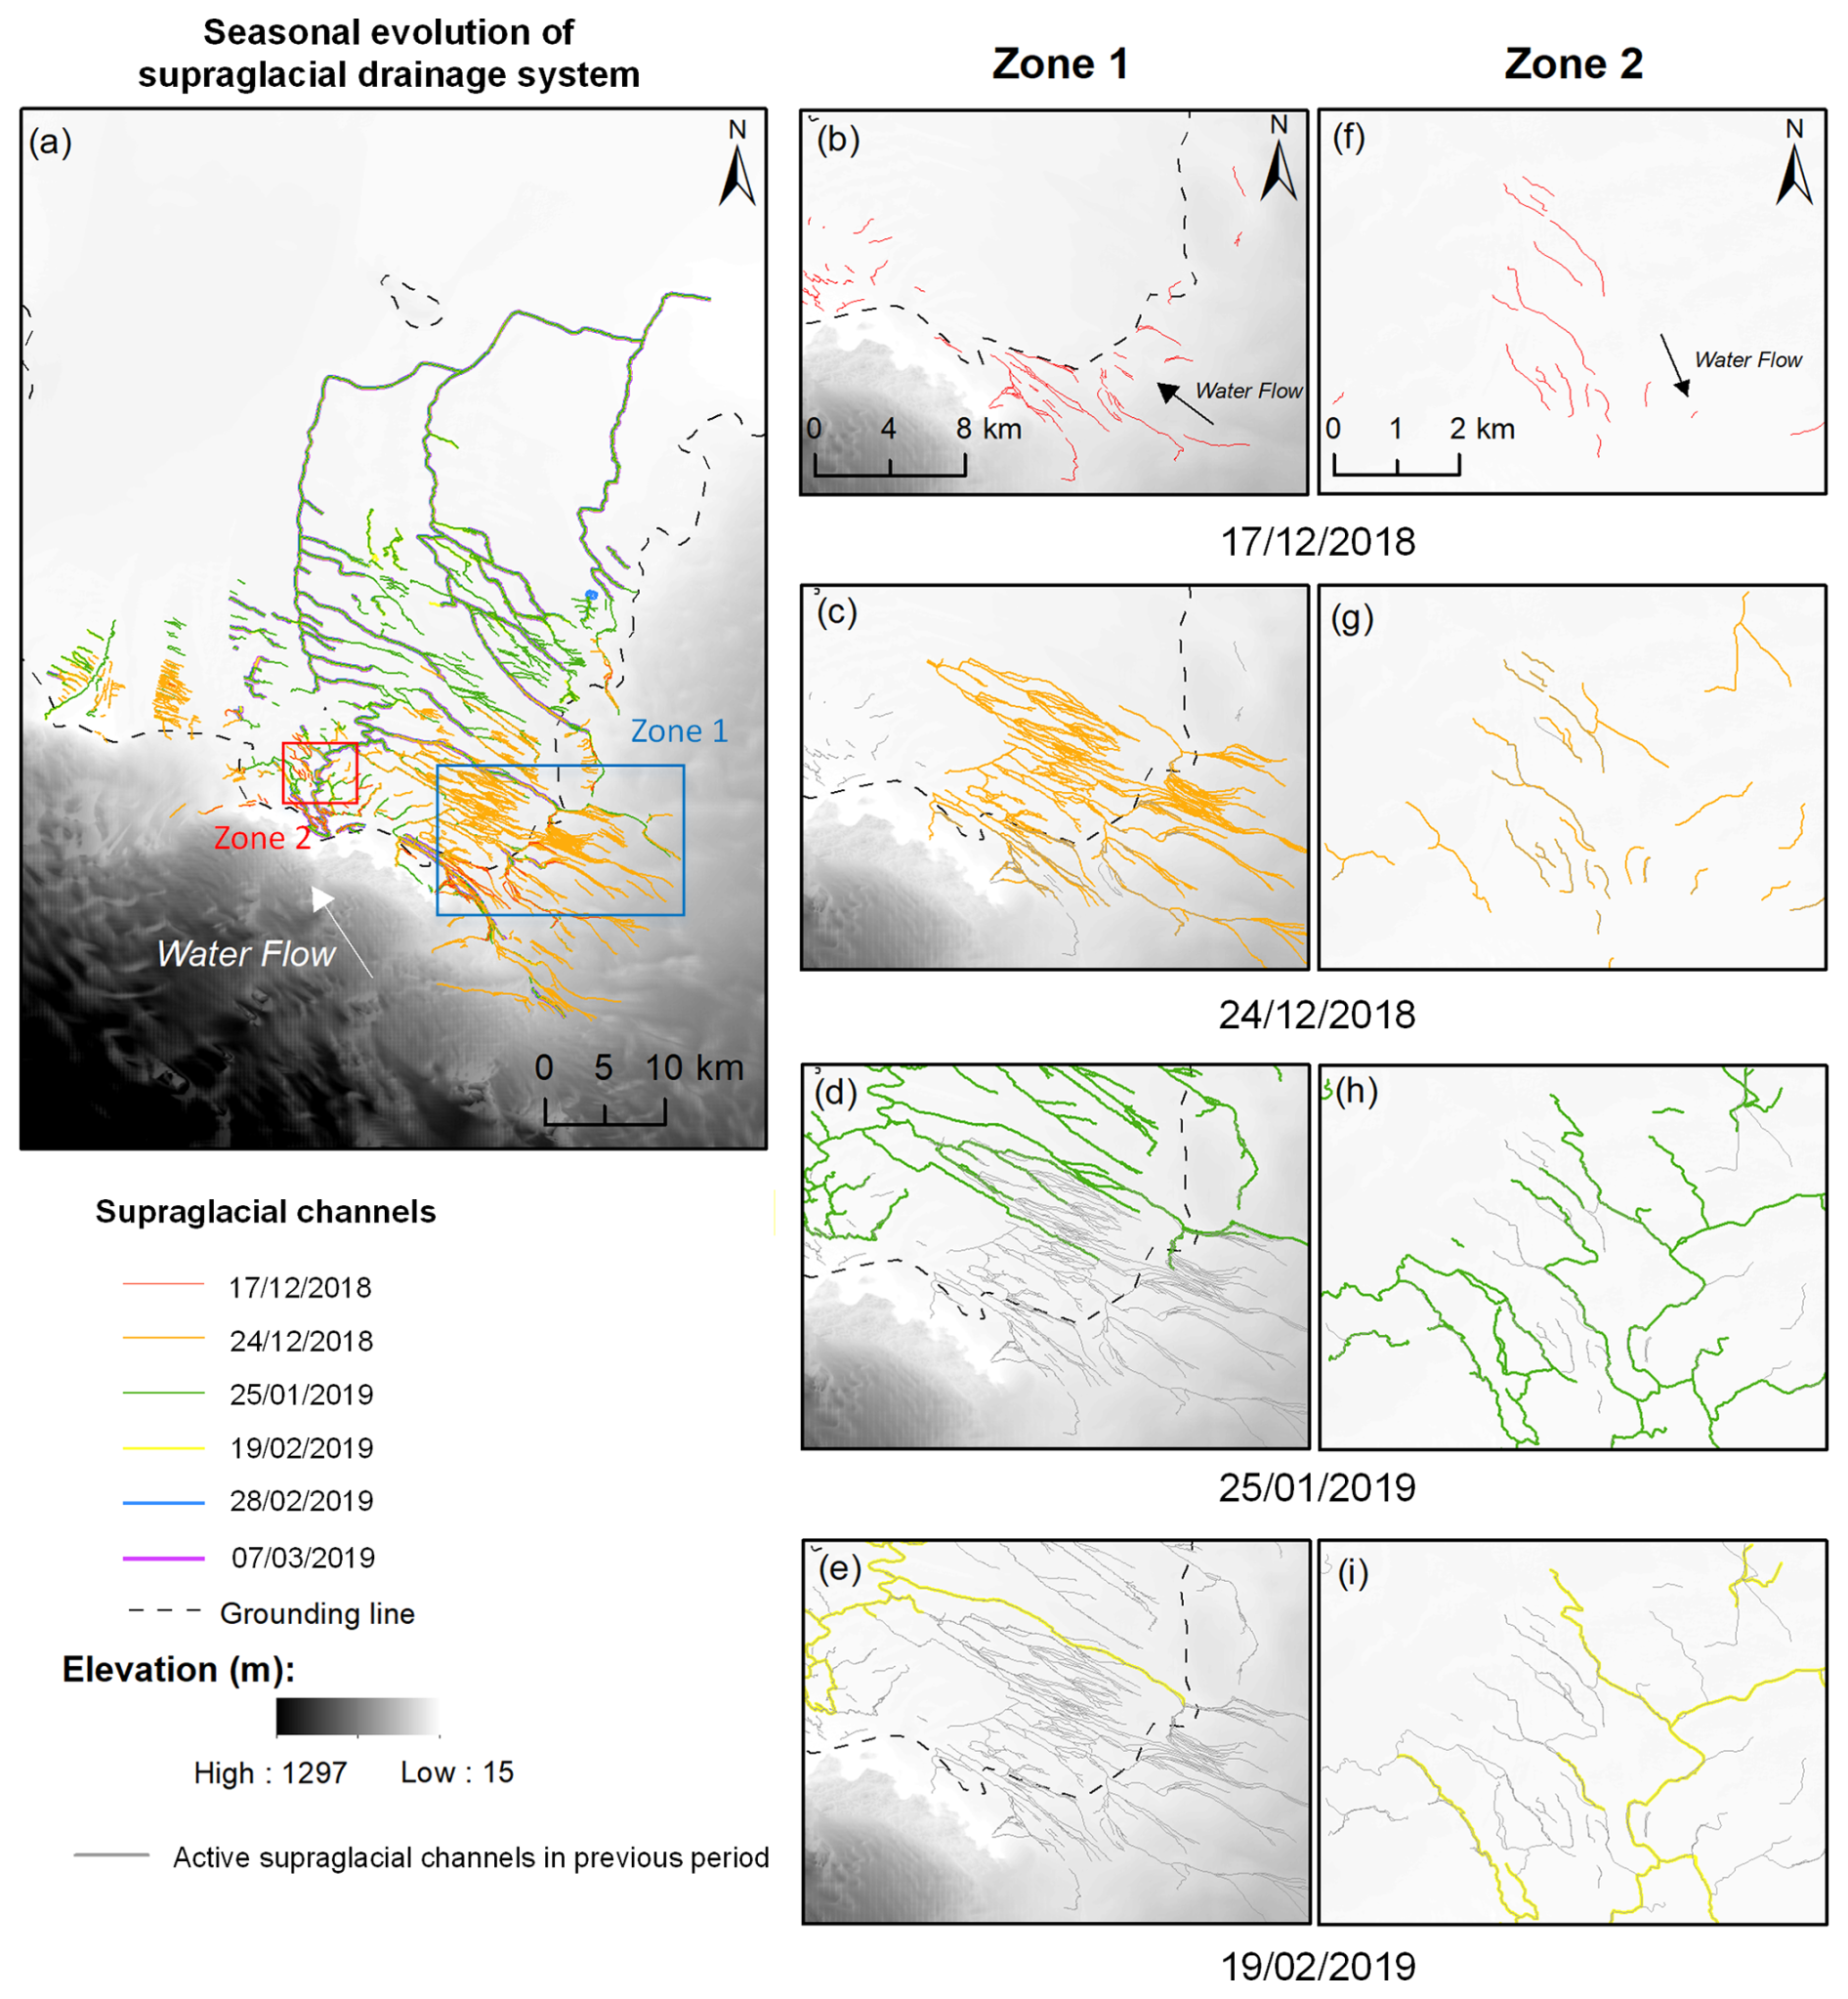
Figure 13Seasonal connectivity transition of the supraglacial drainage systems on Nivlisen Ice Shelf in summer of 2018–2019. The solid lines represent the channels in sequential time periods. The based image is REMA DEM image at 10 m spatial resolution (Howat et al., 2019).
4.3 Controls on development of supraglacial drainage systems
4.3.1 Ice surface topography and channel development
Supraglacial channels on Nivlisen Ice Shelf generally followed the orientation of ice surface “flow-stripes” (Glasser and Gudmundsson, 2012). This alignment was most apparent for the narrower upstream and lateral channel segments within the mapped drainage components, which commonly merged into larger downstream main channels. During January 2019 and January 2020, the three main channels (i.e., WS, M, and ES) connected with each other to form the most extensive drainage system observed (Fig. 4c and d). Notably, the main channel exhibits an abruptly sharp ∼90° eastward turn after merging. To understand this behaviour, we extracted surface elevation profiles along the WS channel and a nearby reference line crossing the turning point of channel (Fig. 14). The results reveal a distinct local surface high coincident with the deflection, suggesting that that local topography influenced the routing of meltwater around this feature. The same diversion was observed in summers of 2018, 2019 and 2020, indicating that this feature represents a stable, topographically controlled pathway. Downstream of the turning point, the channel terminates in a large supraglacial lake, visible in the summers of 2019 and 2020 (Sect. 4.1.3).
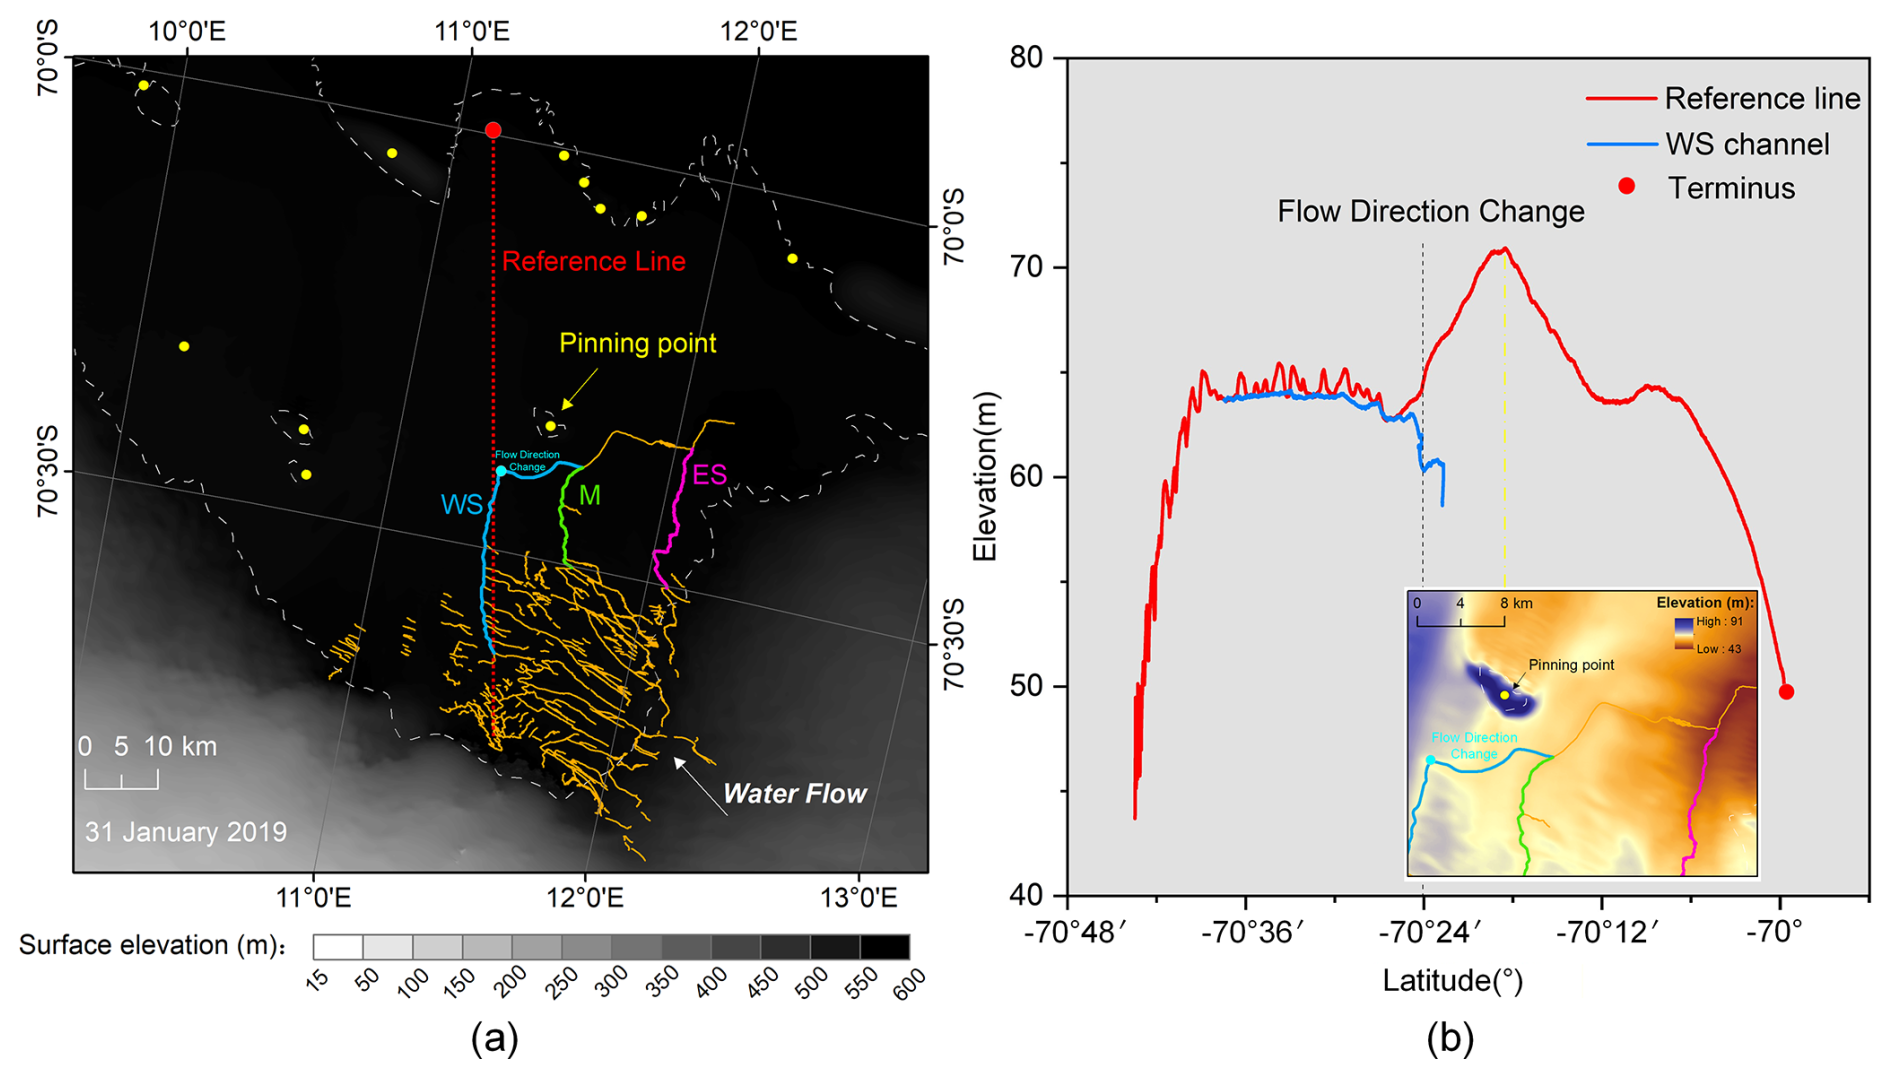
Figure 14(a) Surface elevation map of the ice shelf on 31 January 2019, showing the locations of major channels (WS, M, ES), their confluence, and the flow direction after merging. The yellow dots represent pinning points data from Miles and Bingham (2023). The pinning point near the WS channel leads to a localised ice rumple that diverts the main channel. (b) Elevation profiles along the WS channel (blue) and a reference line on the ice shelf surface (red). The subplot in Fig. 13b shows a zoom-out elevation map near the pinning point. A notable surface high along the reference profile corresponds with a sharp flow direction change in the WS channel, suggesting topographic control of meltwater routing. Note the non-linear increments in the surface elevation scale in (a) to emphasise the subtle relief of the generally flat ice shelf.
4.3.2 Climatic influences on development of supraglacial drainage systems
Climatic variables have been extracted from the MAR climate model outputs, including the melt, SMB and snowfall, reveal pronounced variability across the study period (Fig. 15). Summer melt experienced a sharp reduction between 2017 and 2018, followed by a gradual increase until 2023, whereas summer SMB remained relatively consistent. Seasonal snowfall fluctuated considerably (Fig. 15b), with exceptionally high summer snowfall in 2022 occurring mainly before the Sentinel-2 imagery we acquired on 22 January 2022, thereby obscuring meltwater features and contributing to the apparent absence of surface water in the optical record. Mean summer air temperature (MST) comparisons between ERA5 reanalysis and research-station records (Fig. 15c) indicate similar interannual patterns but systematically higher station-based values, attributable to differences in spatial representativeness between point and modelled data. Importantly, summer melt does not directly enter the SMB budget as a negative term. Only runoff contributes to mass loss in MAR, while a substantial fraction of meltwater refreezes within the firn layer. As a result, years with high melt and moderate snowfall (e.g., 2017) can still exhibit near-zero summer SMB. The simplified MOA ratio was mainly controlled by surface melt (Fig. 15d), because it remained well below the 0.7 firn-saturation threshold proposed by Van Wessem et al. (2023) as indicative of widespread firn saturation and reduced meltwater-storage capacity on Antarctic ice shelves. The highest MOA of Nivlisen Ice Shelf occurred in 2017, primarily reflecting the unusually high annual melt total during the preceding annual period. However, the interannual pattern of MOA does not closely follow the metrics of the mapped surface water (Fig. 4) from Sentinel-2 imagery, particularly for 2018–2020, when extensive drainage was observed despite relatively low MOA values.
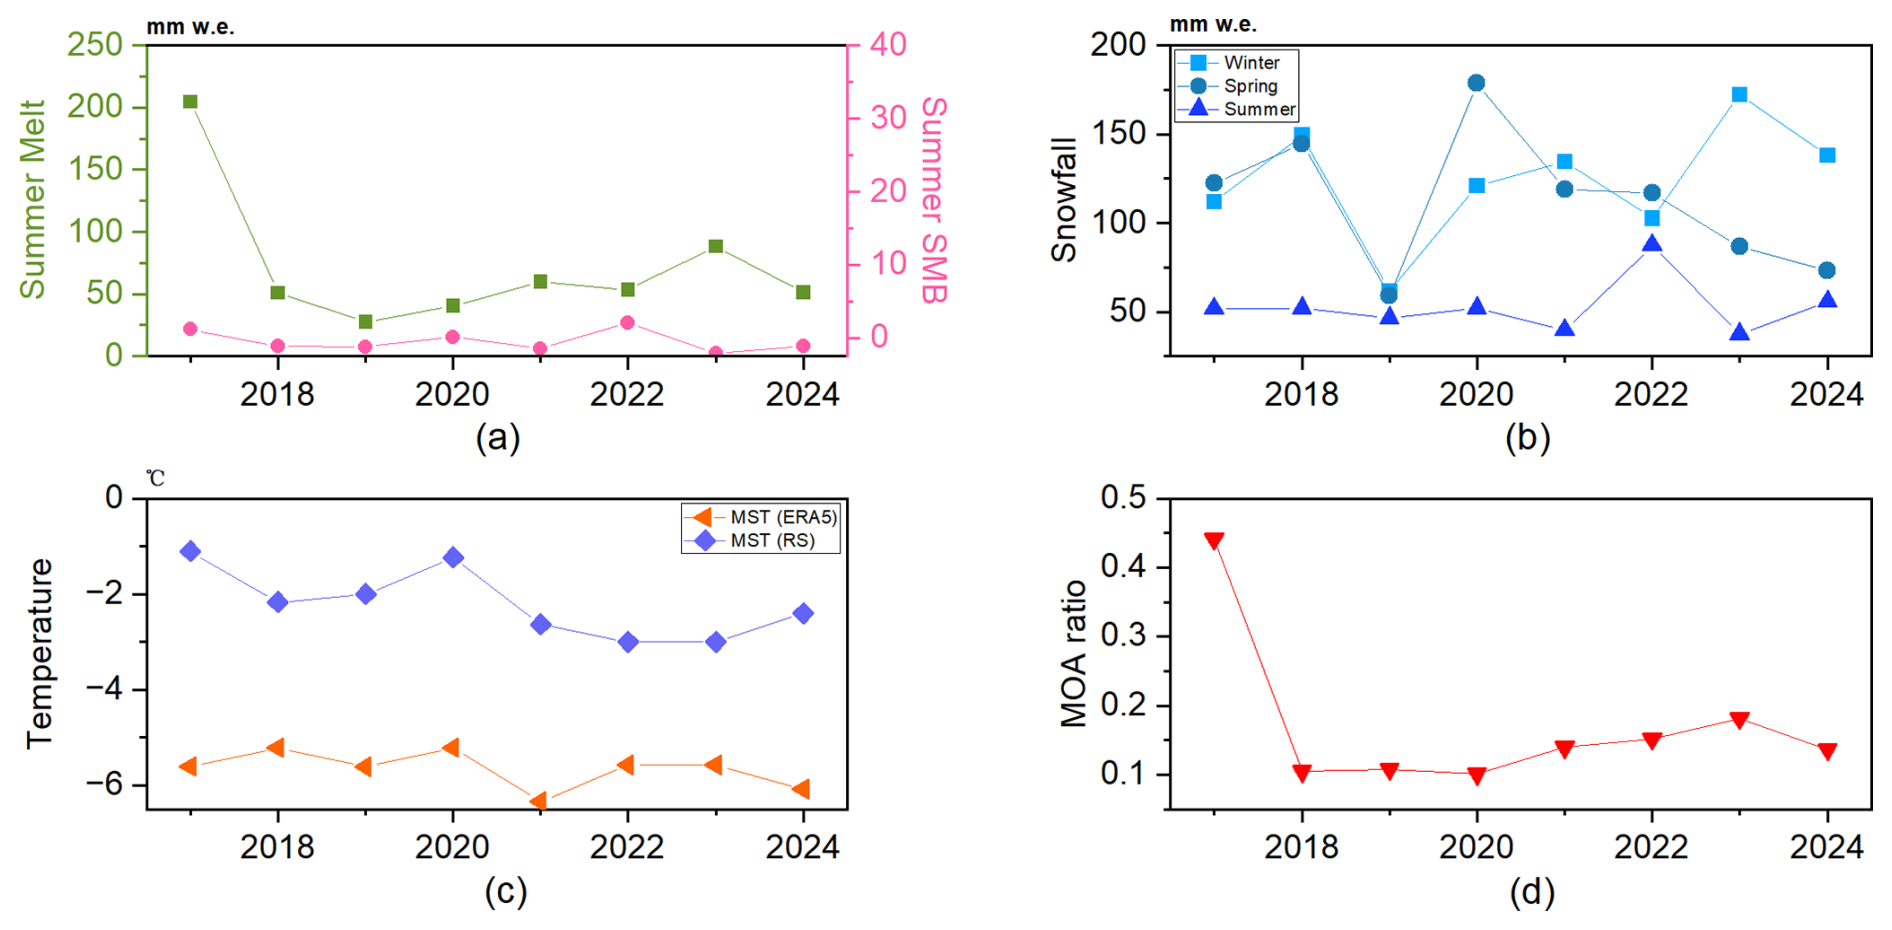
Figure 15Interannual variations in key climatic variables over Nivlisen Ice Shelf from 2017–2024: (a) summer melt and summer SMB, shown as accumulated values over November-January, derived from MAR model outputs, (b) seasonal snowfall (winter, spring, and summer) from MAR, shown as accumulated totals over austral winter (June–August), spring (September–November), and summer (November–January), (c) mean summer temperature (MST) derived from ERA5 reanalysis and in situ Research Station (RS) records, and (d) annual melt-over-accumulation ratio (MOA), calculated as cumulative melt plus rainfall divided by cumulative snowfall over the March-February annual period associated with each observed year.
To quantitatively assess the relationships between climatic conditions and supraglacial drainage characteristics, Pearson correlation coefficients were calculated between climatic factors (spring/summer/winter snowfall, summer melt/temperature/SMB, PDD) and metrics of the drainage system (Fig. 16). Correlations were calculated only for years with visible surface water and mapped drainage components (n=7). The 2022 scene was excluded as a no-visible-water year, because assigning zero values to all drainage metrics might conflate true hydrological absence with potential optical detectability limitations. All four metrics of the SCNs are highly correlated with each other, suggesting a coherent evolution of supraglacial drainage networks on Nivlisen Ice Shelf. MST data from ERA5 shows a statistically strong and significant positive correlation with all four metrics of the SCNs (r>0.9, p<0.05). Notably, mean summer temperature exerts the strongest control on total channel length (r=0.99) and number of channels (r=0.97). However, in-situ MST data from the Novolazarevskaya Research Station exhibits weaker positive and non-significant correlations (p>0.05) with all SCN-related metrics. Summer SMB has positive relationships with surface water area (r=0.48) and the SCNs (r=0.35 and r=0.52), though none are significant.
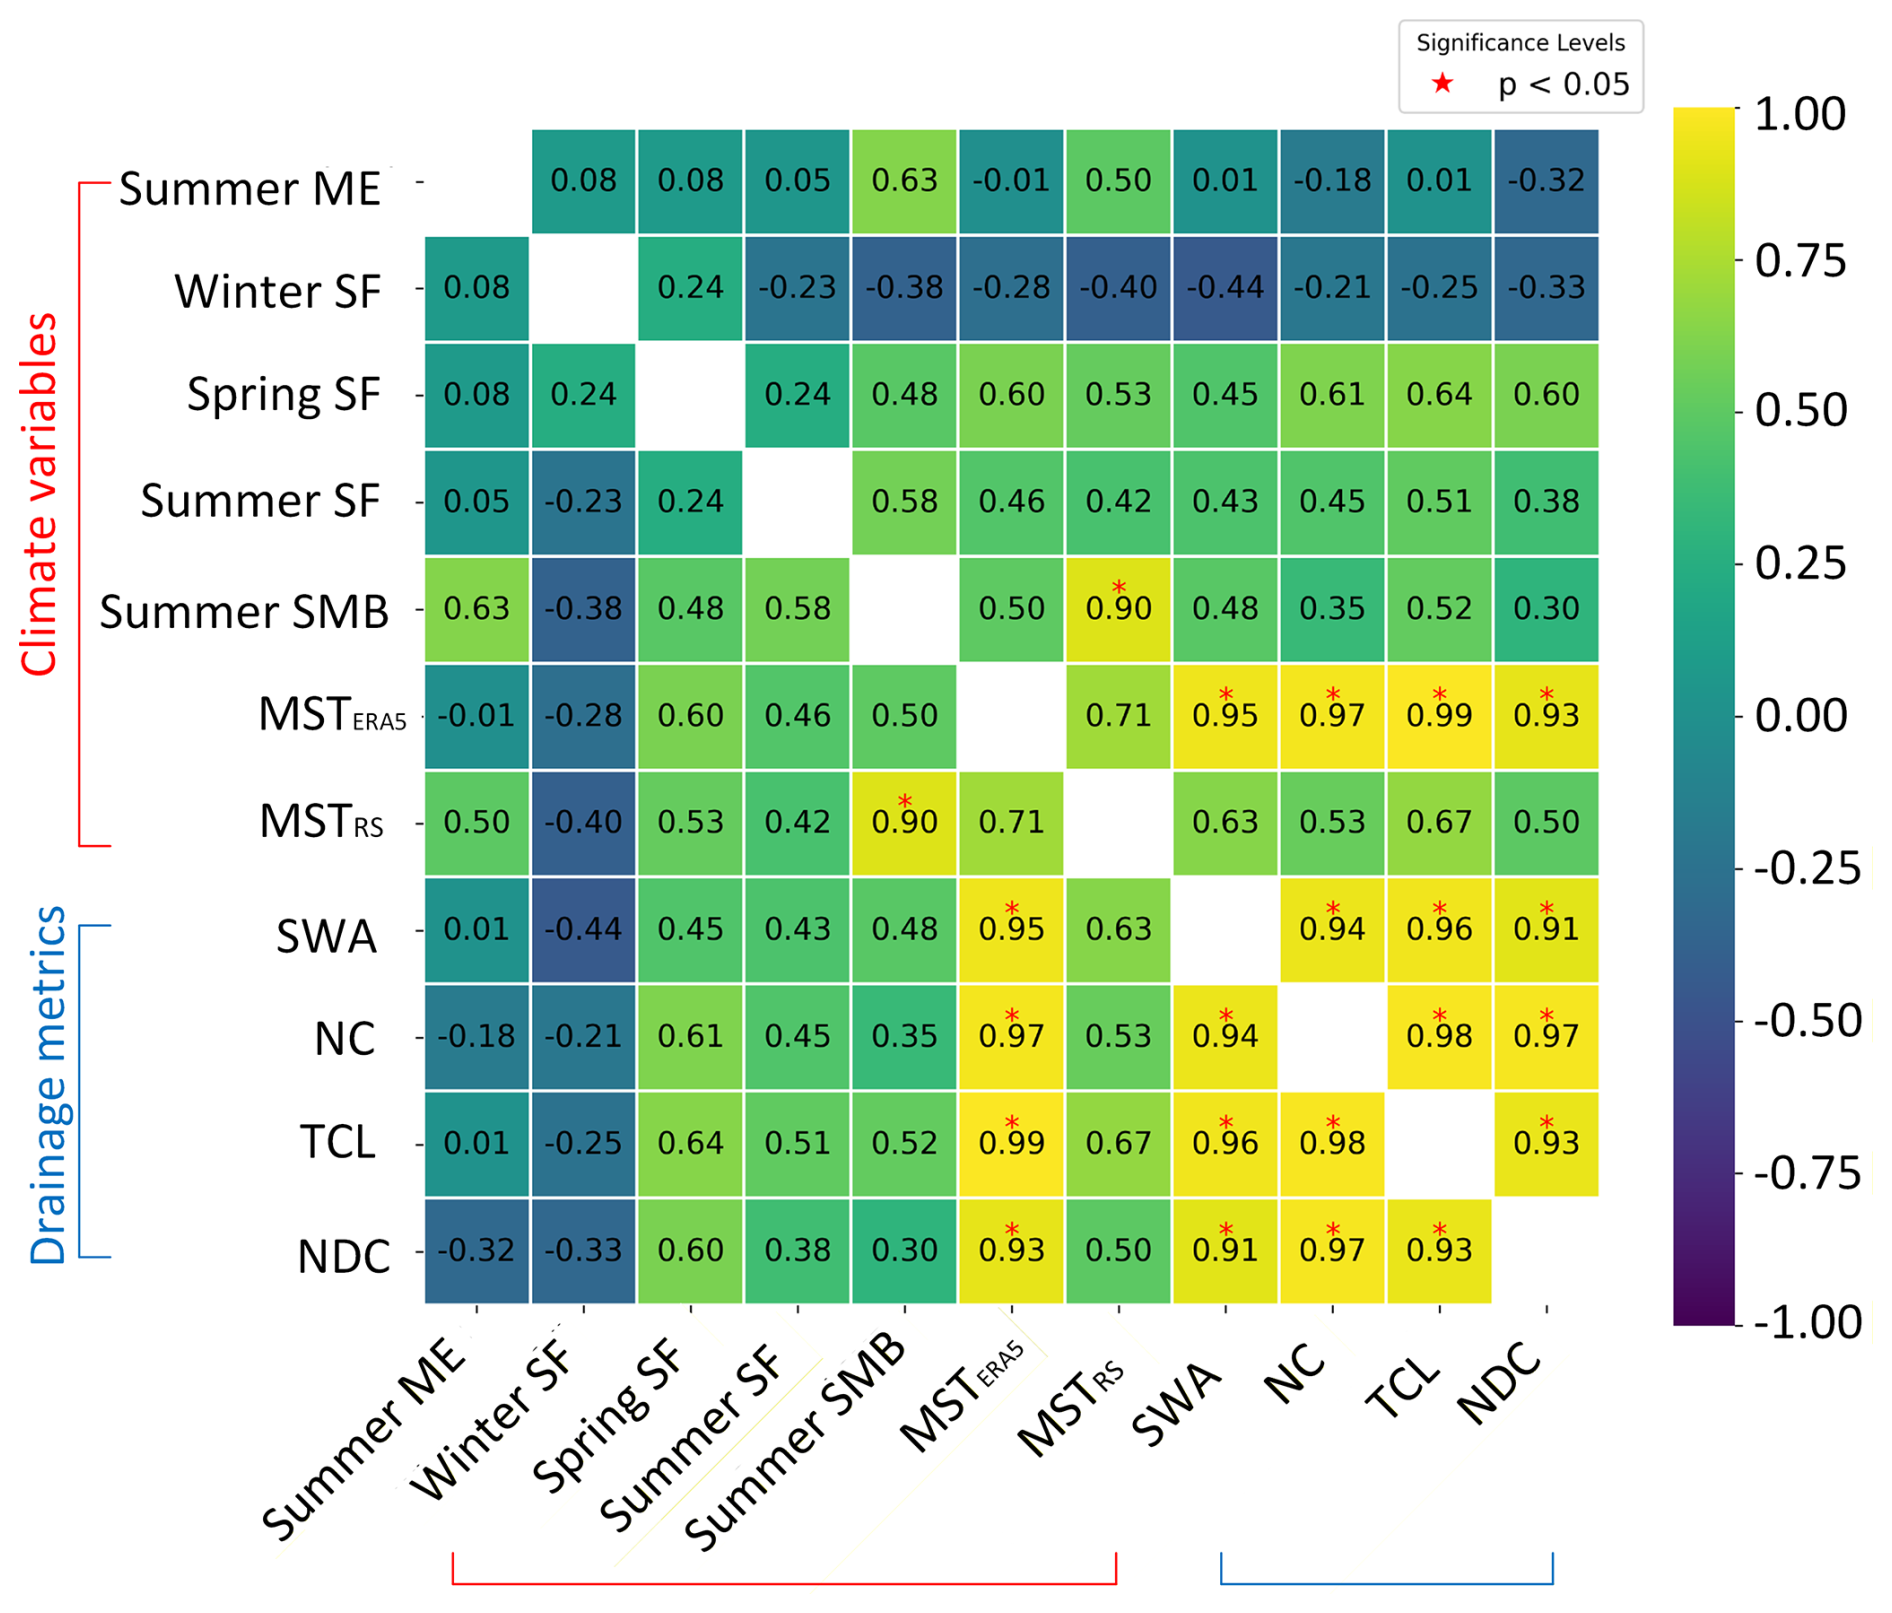
Figure 16Linear relationships between climatic variables from MAR, ERA5 and interannual key metrics of supraglacial drainage systems on Nivlisen Ice Shelf. Black numbers indicate the Pearson correlation coefficient. Climatic variables: ME-melt; SF-snowfall; SMB-surface mass balance; MST-mean summer temperature. SCN metrics: SWA-surface water area; NC-number of channels; TCL-total channel length; NDC-number of drainage components.
Considering that the metrics of supraglacial drainage systems in 2019 and 2020, such as number of channels, total length of channels, were substantially higher than in most other observed years, the correlations may be sensitive to individual high-development years. To assess this, scatter plots were examined for the strongest statistically significant relationships, particularly those between ERA5 mean summer temperature and key drainage metrics (see Fig. S1 in the Supplement). These plots indicate that the main positive relationships do not appear to be solely driven by a single outlier year, or by the years with extensive surface drainage. Instead, colder years generally correspond to lower surface water area, fewer mapped channels, shorter total channel length, and fewer mapped drainage systems, whereas warmer years are associated with more extensive drainage development. Nevertheless, given the small number of observations, these relationships should be interpreted as exploratory climatic context rather than definitive evidence of causal control.
The short-term variations in key climatic variables during the 2018–2019 melt season on Nivlisen Ice Shelf are shown in Fig. 17. MAR-derived melt exhibited pronounced short-term variability, with several melt episodes occurring between December and late January, followed by little or no modelled melt toward late February and early March (Fig. 17a and b). SMB also varied substantially through the season, reflecting the combined influence of snowfall accumulation and surface ablation rather than a simple one-to-one inverse relationship with melt. Snowfall shows strong temporal variability (Fig. 17c), with two pronounced events in mid-December and late February that likely influenced surface albedo and temporarily suppressed melt. Positive Degree Days (PDD) from ERA5 reanalysis over both 7 and 14 d windows provide a temperature-based index of melt potential (Fig. 17d). The normalised comparisons between MAR-derived melt and ERA5 PDD further highlight the differences between the two variables (Fig. 17e and f). Both variables were low at the beginning and end of the observation period, but their peak timing and late-season decline differed substantially. In particular, PDD values remained relatively high into mid-February, whereas MAR-derived melt had already declined to zero. This indicates that PDD captures periods of enhanced temperature-based melt potential but does not directly reproduce the timing or magnitude of modelled melt. The divergence between PDD and melt may reflect the dependence of modelled melt on the wider surface energy balance and conditions, including radiation, albedo changes, wind and refreezing processes.
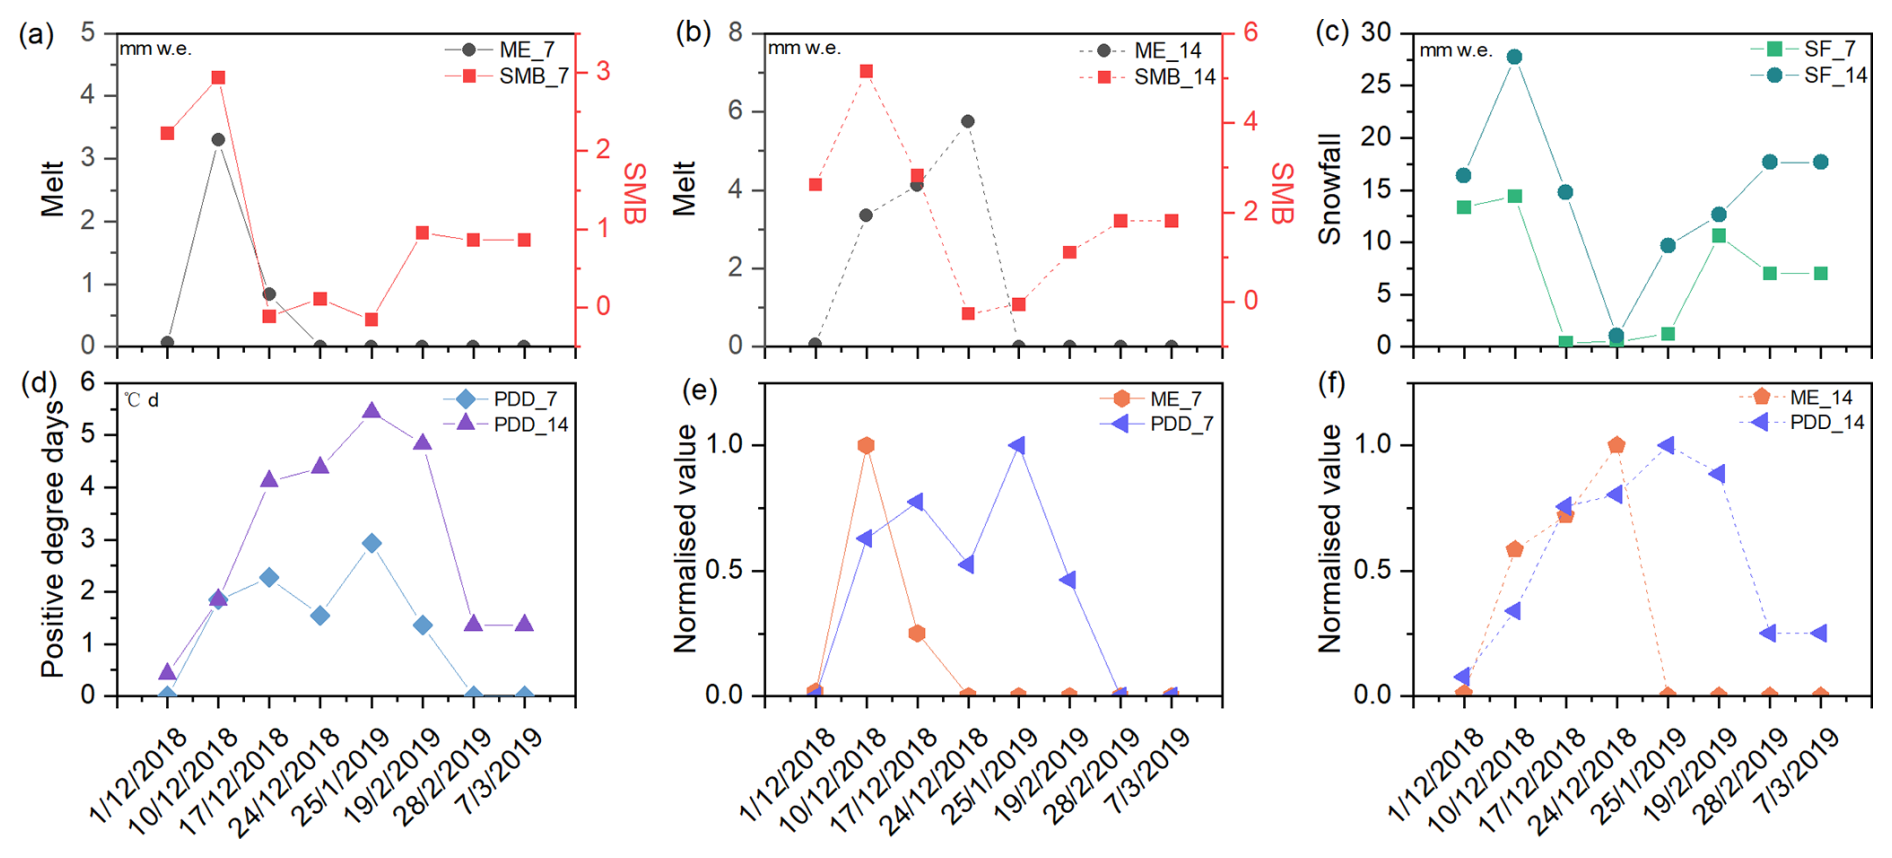
Figure 17Short-term variations of climatic variables over the Nivlisen Ice Shelf during the 2018–2019 melt season. (a, b) Melt (ME) and surface mass balance (SMB), (c) snowfall (SF), and (d) Positive Degree Days (PDD) from ERA5 reanalysis. (e, f) Normalised comparisons between MAR-derived melt and ERA5 PDD for the 7 and 14 d windows, respectively. In panels (e, f), each variable is divided by its own seasonal maximum to compare relative timing and temporal pattern rather than absolute magnitude. Variables computed over 7 and 14 d windows are indicated by subscripts “_7” and “_14”.
On a seasonal scale, both 7 and 14 d cumulative climate variables from ERA5 and MAR climate model influence channel evolution (Fig. 18), with 14 d surface melt (ME_14) having the strongest and most significant correlation with number of channels (r=0.81) and number of drainage components (r=0.80). The correlation between PDD_14 and total channel length (r=0.73, p<0.05) further confirms the sensitivity of spatial expansion of drainage components to short-term cumulative melt. Snowfall and SMB were negatively correlated with drainage components formation, and in particular, snowfall with 14 d accumulation (SF_14) is significantly negatively correlated with surface water area, implying that the snowpack inhibited or masked meltwater pooling and channels formation. Interestingly, surface melt (ME) shows a strong and significant positive correlation with SMB over 14 d cumulative periods (r=0.84).
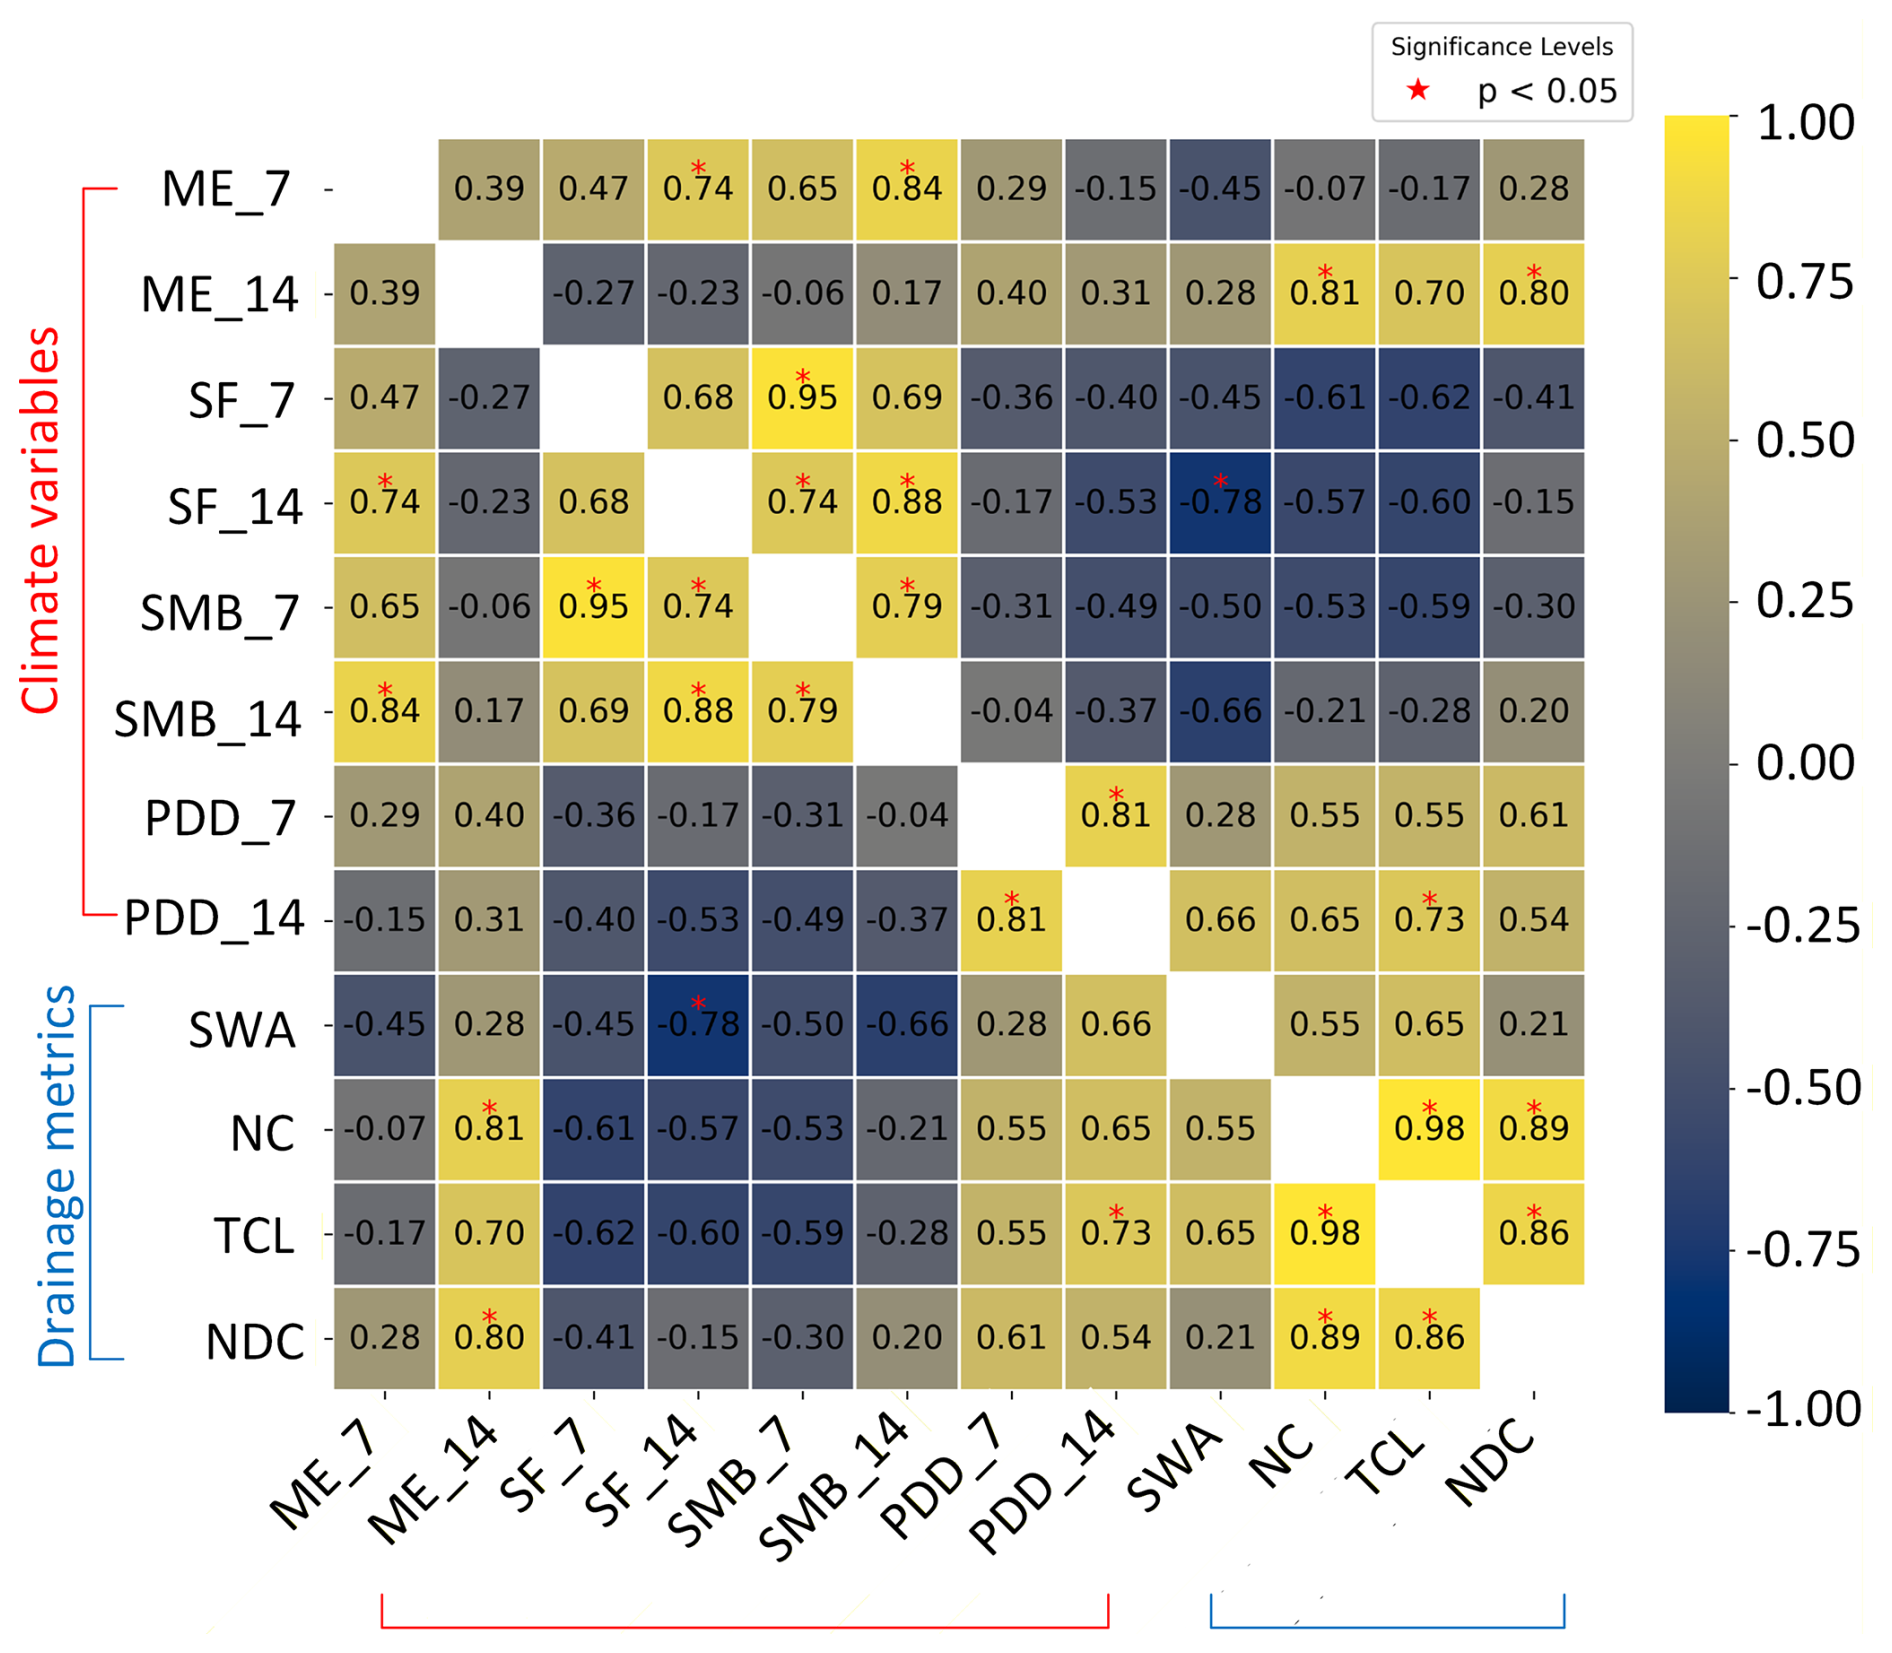
Figure 18Linear relationships between climatic variables from MAR, ERA5 and seasonal key metrics of supraglacial drainage systems on Nivlisen Ice Shelf. Black numbers indicate the Pearson correlation coefficient. Climatic variables: ME-melt; SF-snowfall; SMB-surface mass balance; PDD-positive degree days. Drainage components metrics: SWA-surface water area; NC-number of channels; TCL- total channel length; NDC-number of drainage components. Variables calculated over fixed time windows (i.e., 7 and 14 d) are denoted with subscripts “_7” and “_14”.
5.1 Interannual evolution of supraglacial drainage systems
Over the eight-year record (2017–2024), supraglacial drainage systems on Nivlisen Ice Shelf exhibit pronounced interannual variability in their connectivity, extent, and structural complexity (Fig. 4). This study presents the first comprehensive, multi-year mapping and quantitative analysis of surface drainage developments on Nivlisen Ice Shelf, revealing how channels alternate between highly integrated and fragmented states under varying climatic conditions. Despite these fluctuations, the drainage systems remained relatively stable in terms of their locations, indicating that interannual variability primarily presents as changes in the degree of channels' connectivity rather than large-scale reorganisation of flow paths. When the ES, M and WS channels connected in 2019 and 2020, for example, the drainage system exhibited its highest degree of connectivity, culminating in the formation of a large terminal lake near the ice front (Fig. 8). A qualitative check of available January Landsat imagery prior to the Sentinel-2 period shows that drainage pattern comparable to those observed in 2019 and 2020 were not common in the historical record (Fig. S2 in the Supplement), but were not unique to the Sentinel-2 observation period. A large-scale pattern of surface water and a drainage system similar to the 2019–2020 patterns, when the ES, M and WS channels connected together, is visible in January 2008. In the 1976 Landsat-2 image (Fig. S2o), a broadly similar surface drainage expression can be faintly identified, although obvious open-water coverage over the corresponding channels and lakes is not clearly visible. This suggests that large-scale drainage patterns on Nivlisen Ice Shelf may occur episodically rather than representing a uniquely recent phenomenon. Similar long-term context has been highlighted elsewhere in Antarctica, including persistent surface drainage systems observed since early Landsat imagery and aerial photographs (Bell et al., 2017; Kingslake et al., 2017), and extensive melt ponding on George VI Ice Shelf since the 1970s (Barnes et al., 2021). However, because of differences in sensor resolution, image quality, and spectral information, the historical Landsat comparison presented here is qualitative and is not combined with the Sentinel-2-based quantitative metrics.
No surface water was visible in Sentinel-2 optical imagery throughout the melt season of 2022. Instead, conditions on 25 January 2022 (Fig. 19c) show a uniformly bright ice shelf surface indicating fresh snow cover. In the subsequent melt season (2023), a modest recovery in surface water was observed, although channel length (Fig. 5) and depth (Fig. 6) remained limited. This partial recurrence may be linked to the presence of refrozen supraglacial channels that persisted through the winter and acted as conduits for new meltwater. Such a mechanism aligns with the findings from Dell et al. (2020), who proposed that relic meltwater channels, preserved as refrozen ice within the firn, can exert multiyear control over the surface meltwater routing and distribution. This idea is supported by Sentinel-1 Synthetic Aperture Radar (SAR) imagery acquired two days after the Sentinel-2 imagery (27 January 2022; Fig. 19d), which reveals a drainage system structure characterized by low-backscatter values (ranging from −15 to −25 dB) with spatial patterns closely matching those observed in 2020 (Fig. 19a and b). These low backscatter values may reflect smooth frozen or snow-covered surfaces that produce specular reflection of the radar signal away from the sensor, rather than necessarily indicating absorption by subsurface water. We therefore do not interpret the SAR signal as direct evidence for concealed meltwater or a saturated firn layer. Instead, the areas with low-backscatter values are interpreted as possible frozen or snow-covered traces of previously active surface water. A similar phenomenon was reported on the Amery Ice Shelf by Spergel et al. (2021), where large-scale supraglacial lakes and extensive drainage systems were found to freeze completely in winter, as revealed by temporal changes in SAR backscatter. Importantly, such refrozen meltwater within channels forms impermeable ice layers that lie in channel depressions and which may promote extended surface pathways in later seasons, effectively generating a relatively “stable” drainage system from year to year, albeit with differing amounts of meltwater present at the surface.
We find that surface topography is an important control on drainage development and direction on Nivlisen Ice Shelf. Channels are predominantly aligned with surface ice-flow stripes, producing a parallel pattern, reflecting the influence of long-term ice-flow morphology and internal stress regimes that constrain meltwater routing along pre-existing features (Glasser and Gudmundsson, 2012; Chen et al., 2024). At a scale of 100's of meters to multiple kilometres, subtle surface rumples and slopes, particularly those associated with subglacial topographic pinning points or ice rises (cf. Miles and Bingham, 2024), redirect meltwater laterally and promote channel convergence. This is particularly observed in the substantial eastward diversion of the main WS channel (Fig. 14) by the raised ice surface (possible ice rumple) above a basal pinning point. These observations demonstrate that even minor variations in surface slope can reorganise drainage systems and create spatial heterogeneity in meltwater routing. Ice surface topographic steering therefore defines the fundamental structure within which any liquid water moves and dictating where supraglacial channels form and persist across the ice shelf surface each year.
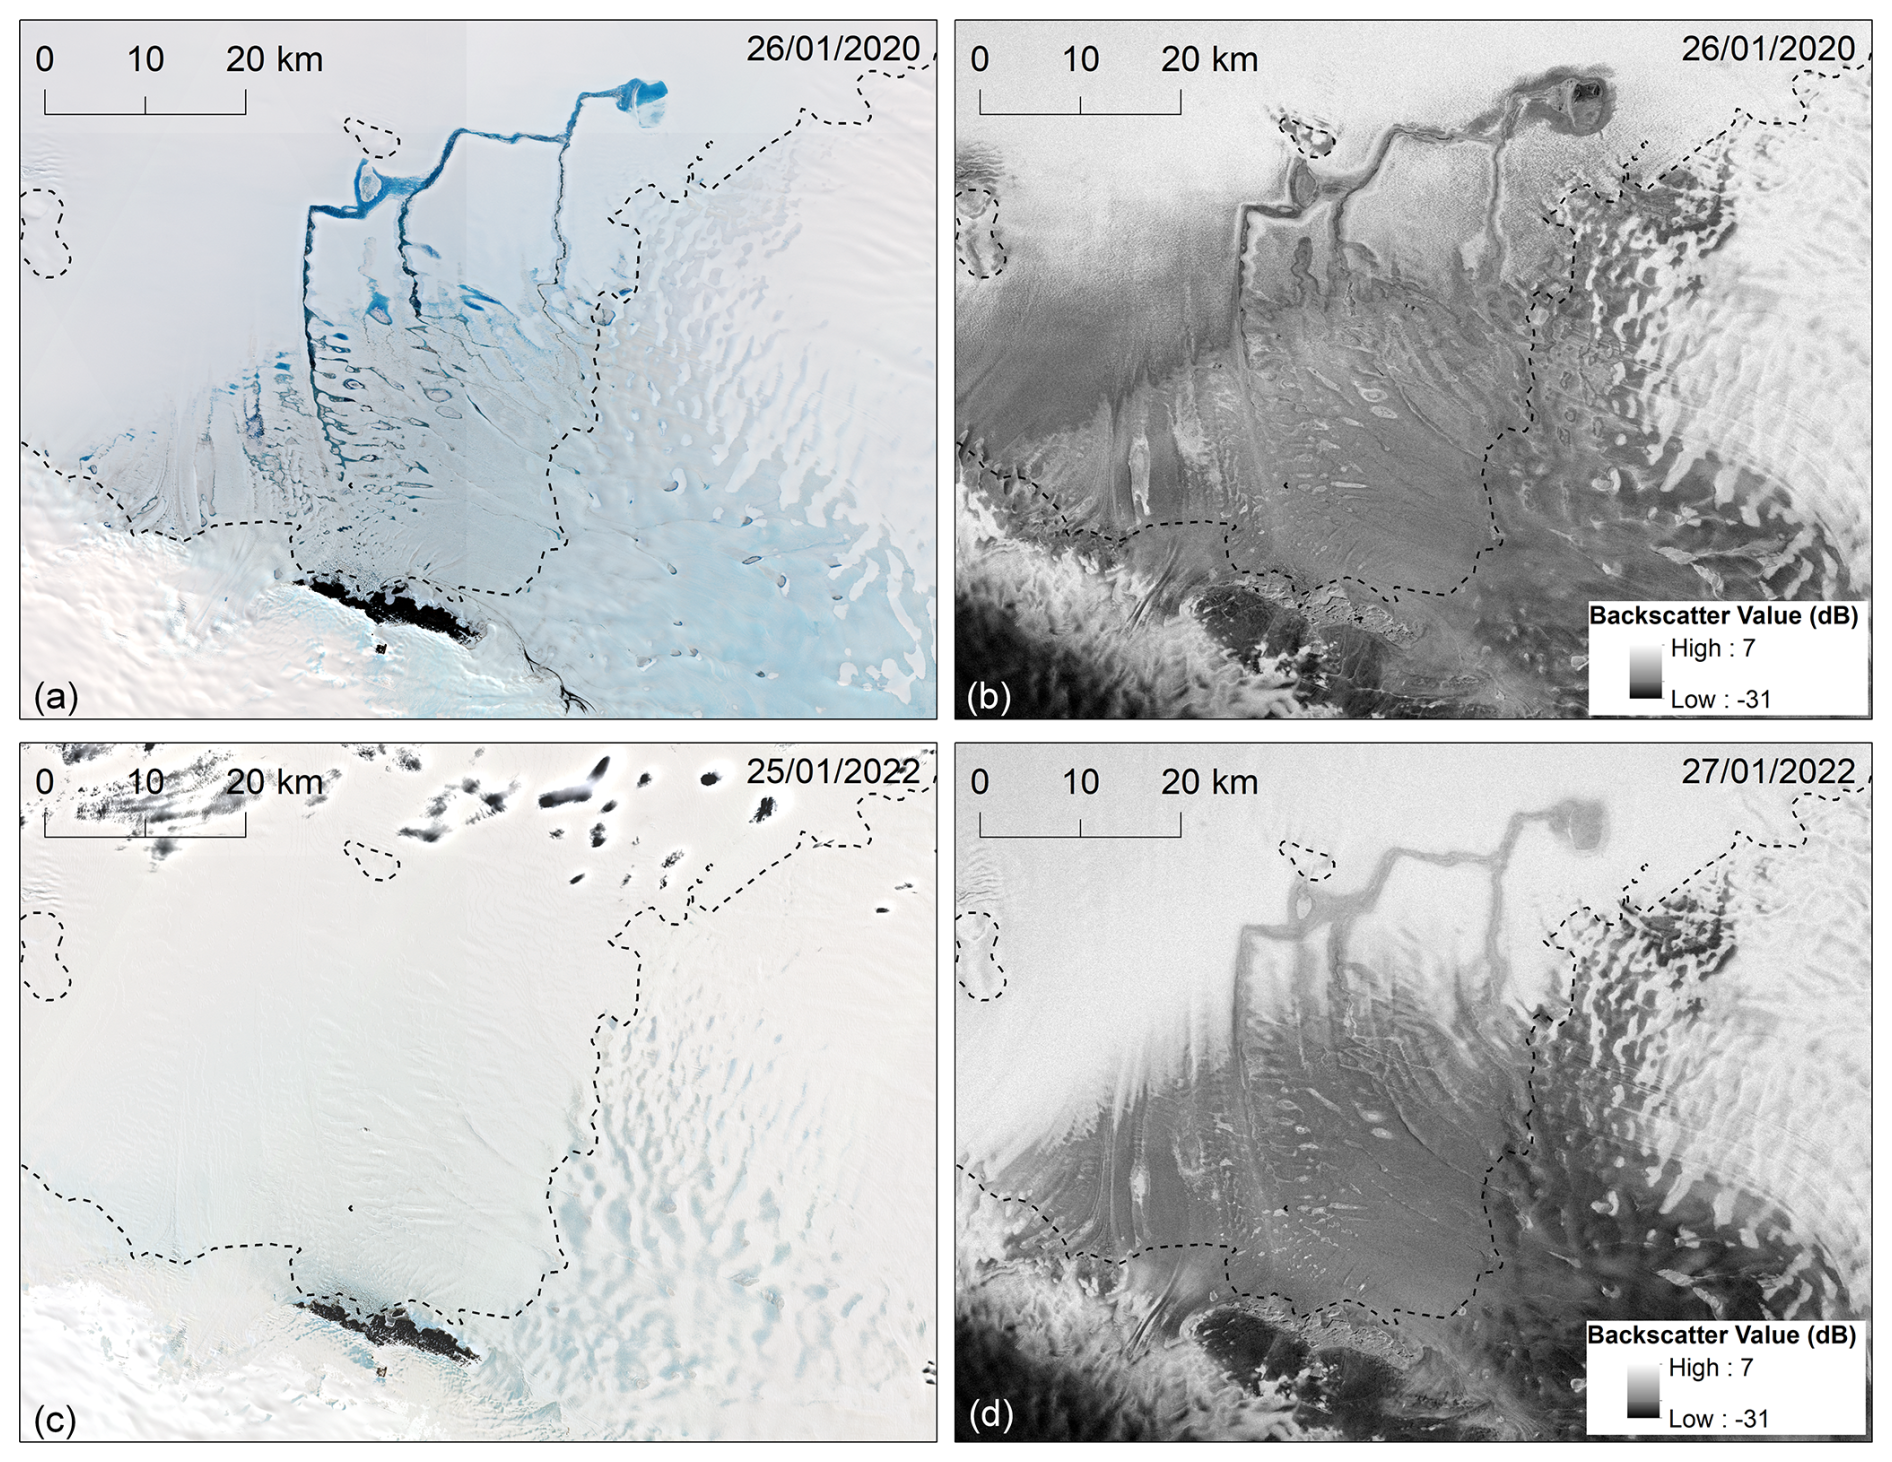
Figure 19Comparison of supraglacial drainage systems' observations on Nivlisen Ice Shelf from (a, c) Sentinel-2 optical imagery, (b, d) Sentinel-1 SAR imagery in January 2020 and 2022 respectively. The dashed black lines are grounding lines of Nivlisen Ice Shelf.
5.2 Seasonal evolution of supraglacial drainage systems
Beyond the importance of topography, climatic conditions must also be suitable for a significant drainage system to form. A key characteristic of the surface drainage systems on Nivlisen Ice Shelf is the progressive consolidation, and then fragmentation, of drainage systems throughout the melt season. As the melt season advances, isolated and disconnected drainage components gradually merge into larger, more integrated systems, resulting in increased connectivity across the ice shelf surface. This seasonal reorganisation marks a transition from a fragmented early-season drainage system to a more integrated drainage system during the peak melt. Importantly, despite the increased connectivity, most mapped meltwater ultimately remains on the ice shelf in the time period of our observations, either retained within lakes or draining into the firn, indicating a closed surface hydrological system. These results align broadly with the seasonal patterns reported by Dirscherl et al. (2021), who used Sentinel-1 and Sentinel-2 observations to monitor supraglacial lakes across Antarctic ice shelves from 2015–2021. Both studies identify a peak in surface water coverage in January, followed by a rapid decline in February and near-complete disappearance by March. The clustering of drainage components near the grounding line, is similar to the ponding identified on the Larsen C Ice Shelf (Luckman et al., 2014).
We particularly note that the water that was at higher elevations inland at the start of the melt season is less apparent as the season progresses and that this surface meltwater is progressively transferred from higher-elevation regions toward lower elevations near the shelf front over the melt season. The concurrent decrease in maximum elevation of surface water and increase in water-depth estimates during mid-season (Fig. 10) also indicates a transition toward more channelised, downslope flow. This suggests that channels in the higher part of the drainage system that may have been slower-flowing and thus contained deeper water initially in the season, are able to evacuate water to the lower parts of the drainage system more rapidly and thus have shallower water depths and are harder to identify in later imagery. Similar surface drainage evolution was observed by Kingslake et al. (2015) who documented a rapid, large-scale drainage event in 2007 when surface meltwater propagated more than 70 km from several high-elevation lakes near the grounding line toward the ice front, following refrozen pathways from previous years. The reappearance of lakes at higher elevations and close to the grounding line likely reflects their initial discharge and emptying, followed by renewed meltwater input later in the season. Overflow channels may be shallow, refrozen, snow-filled, or activated only when lake levels exceed local overflow thresholds. Continued meltwater input could therefore allow a lake to refill after partial drainage, although this remains an interpretation rather than a directly observed process. Because the satellite record is discontinuous and no continuous in situ observations are available, the full drainage-refilling sequence cannot be directly validated in this study. Similar behaviour has been observed on other Antarctic ice shelves, where early-season snow and firn initially inhibit surface ponding but later provide additional meltwater as they melt (Dell et al., 2020; Arthur et al., 2020, 2022). These processes indicate that the evolution of drainage systems on Nivlisen is governed by feedback between meltwater supply, channel stability, and refreezing dynamics, resulting in a multi-phase drainage regime that differs from the single-event drainage predicted by idealised models.
A comparison between Landsat-8 and Sentinel-2 imagery acquired within the same week in late January 2019 is provided in Fig. S3 in the Supplement to illustrate the uncertainty associated with the Landsat-based seasonal analysis. The broad drainage system including the main channels and terminal lake is visible in both images. However, the Sentinel-2 image resolves additional narrow and low-contrast channel features, particularly smaller tributaries and discontinuous channel segments, that are less clearly visible in the Landsat-8 image. This indicates that Landsat-based seasonal metrics are likely to be conservative, especially for channel number, total channel length, and drainage connectivity, although the main drainage system is still captured. Because the two images were acquired six days apart during a melt season, this comparison is used only as a qualitative indication of sensor-related visibility differences and is not used to derive correction factors or inter-sensor metric comparisons.
The results of this study provide process-level insight into how supraglacial drainage systems redistribute meltwater across Nivlisen Ice Shelf, but they do not constitute a direct assessment of future ice-shelf stability. Our observations suggest that the drainage systems on Nivlisen Ice Shelf redistributes meltwater across the shelf rather than exporting it off the ice shelf, consistent with widespread refreezing and firn infiltration at lower elevations. This behaviour is unlike grounded ice such as over Greenland and the Devon Ice Cap (Lu et al., 2020; Yang et al., 2021), where supraglacial drainage migrates upward through the season as new melt occurs at increasingly higher elevations. In such settings, rising equilibrium line altitudes and surface warming drive inland expansion of the ablation zone, while early-season meltwater at low elevations rapidly drains through moulins and crevasses. In contrast, the Nivlisen Ice Shelf exhibits a drainage system that does not expand inland and up-ice. Instead, it consists of a floating, “closed” surface drainage system in which meltwater is redistributed toward lower elevations and retained through refreezing or ponding. These differences underscore the contrasting hydrological regimes between grounded and floating ice surfaces, particularly regarding connectivity meltwater export, and retention.
5.3 Climatic Controls on evolution of supraglacial drainage systems
Among the evaluated climatic drivers, mean summer temperature data from ERA5 showed the strongest and most consistent correlations with metrics of drainage components on an interannual scale (Fig. 16). Surface water area, the number of channel networks, the number of individual channels, and total channel length are all positively correlated with ERA5 temperatures (, p<0.05), indicating that air temperature is the primary control on the extent of the drainage distribution on Nivlisen Ice Shelf. In contrast, temperature data from the nearby Novolazarevskaya Research Station has weaker correlations, particularly with total channel length (, p>0.05). Correlations were statistically significant (p<0.05) for all ERA5-based temperature-drainage relationships, whereas station-derived temperatures showed non-significant relationships (p>0.05). This discrepancy likely reflects spatial representativeness: the station provides a limited “point” measurement, while ERA5 data capture temperature variations across the ice shelf surface, better aligning with the spatial scale of drainage systems development. Correlations with snowfall and SMB were weaker and generally not statistically significant. Furthermore, annual MOA values provide additional context for the balance between liquid water production and snowfall input during each melt year. All calculated annual MOA values (Fig. 15) suggest that Nivlisen Ice Shelf remains strongly accumulation dominated and likely retains a considerable capacity for meltwater storage within the snow and firn layer. Despite these persistently low MOA values, extensive supraglacial channel networks developed during several melt seasons. This apparent discrepancy suggests that annual MOA is not a direct predictor of mapped drainage extent. Instead, MOA should be interpreted as a broad indicator of surface conditions, whereas the development of visible drainage systems is likely influenced by additional factors, including the timing and intensity of melt-season runoff, short-term weather variability, local snow and firn properties, and the reactivation of pre-existing drainage pathways.
On a seasonal timescale, the metrics of drainage systems exhibit strong sensitivity to short-term cumulative temperature and melt indicators (Fig. 18). The 14 d surface melt (ME_14) and positive degree days (PDD_14) show significant positive correlations with the number of channels (r=0.81) and total channel length (r=0.73), highlighting the rapid response of surface drainage development to melt events and aligning with previous work (Kingslake et al., 2017; Dell et al., 2020). These relationships are statistically significant (p<0.05) and indicate that supraglacial drainage responds within 1–2 weeks to cumulative melt energy increases. In contrast, snowfall (SF_14) is negatively but non-significant correlated with surface water area. Surprisingly, surface melt (ME) also shows a strong positive correlation with SMB whereby more melt occurs when there is increased SMB. This relationship may arise from synchronous increases in melt and snowfall or may reflect the dominance of snowfall in the SMB budget under prevailing accumulation conditions (Dirscherl et al., 2021). SMB variability on Nivlisen Ice Shelf is therefore strongly dominated by accumulation: snowfall was also anomalously high during summers with enhanced melt, leading to net positive mass balance despite increased ablation. In such accumulation-dominated conditions, the magnitude of snowfall offsets the melt losses, producing a statistical coupling between ME and SMB (Donat-Magnin et al., 2021). Although this correlation is statistically significant (r=0.84, p<0.05), its physical interpretation remains complex, as both melt and SMB are strongly modulated by concurrent accumulation.
Given the limited observed time series, the correlation analysis is used here as exploratory climatic context rather than as definitive evidence of causal controls on the evolution of drainage systems. At both timescales, only temperature-related variables show statistically significant correlations (p<0.05), suggesting that temperature provides the strongest climatic association. A recent study by Dirscherl et al. (2021) on the seasonal evolution of Antarctic supraglacial lakes from 2015–2021 further reinforces the importance of air temperature and solar radiation as primary climatic drivers of lakes on ice shelves around the EAIS. While their focus was on lake expansion and persistence, they identified positive correlations between surface temperature and lake area, which are broadly consistent with our findings on drainage system development, , although other studies have reported weaker relationships between summer temperature and lake volume or lake area (Arthur et al., 2020, 2022). Our correlation analyses based on temperature data from the ERA5 reanalysis demonstrate stronger positive associations (r>0.9, p<0.05) between summer air temperatures and key metrics of channel components (Figs. 16 and 17). This may partly reflect differences in how channels and lakes are represented in satellite-derived metrics, with channel length and number potentially responding more visibly to short-term melt events than lake area or volume.
By comparison, lake expansion and contraction operate over longer timescales, constrained by basin topography and refreezing processes, which buffer their response to short-term climatic fluctuations (Banwell et al., 2021; Arthur et al., 2022). Moreover, the spatial distribution and connectivity of channels may be more sensitive to regional climate variations captured by the ERA5 reanalysis dataset. The pronounced climatic sensitivities identified for drainage components also reflect their linear and interconnected morphology, which allows efficient meltwater delivery and rapid adjustment, especially where they are expanding along channels that existed in previous seasons. Compared with lakes, where meltwater is primarily stored and may refreeze later in melt season, supraglacial channels provide seasonal pathways for transporting and redistributing meltwater across Nivlisen Ice Shelf. Their geometry and connectivity therefore make them more immediate and sensitive indicators of changes in meltwater supply and surface drainage organisation. Snowfall variables showed only weak relationships with annual metrics of drainage component (Fig. 16), and none of these correlations were statistically significant (p>0.05). We therefore do not interpret snowfall as a primary control on interannual variability of drainage systems, although snowfall may still influence the visibility and short-term evolution of surface water features by altering surface albedo, temporarily masking channels in optical imagery, or modifying near-surface firn storage conditions.
Taken together, the interannual recurrence of drainage pathways, their seasonal evolution, and the climatic context provide insight into the implications of supraglacial drainage systems for stability of Nivlisen Ice Shelf. Under present conditions, the low annual MOA values, high snowfall input, and absence of an observed continuous surface-export pathway suggest that Nivlisen Ice Shelf remains largely accumulation-dominated, with meltwater commonly retained, refrozen, or stored within the snow/firn layer and downstream lakes. This indicates that the current drainage systems may buffer surface meltwater rather than directly promoting widespread meltwater export or vertical drainage. However, the recurrent extensive drainage systems also shows that meltwater can be redistributed over long distances across the ice-shelf surface. If future warming increases meltwater production or reduces firn storage capacity, these pre-existing drainage pathways could influence where meltwater is routed, refrozen, or concentrated, with possible implications for local hydrofracturing risk.
This study provides a detailed characterisation of supraglacial drainage systems on Nivlisen Ice Shelf, focusing on their seasonal evolution and connectivity during the 2018–2019 melt season and interannual variability in January from 2017–2024. In total, we mapped 710 supraglacial drainage components (that include isolated channel, multiple connected channels with a wider drainage system, or channels connected to lakes) and 5513 channel segments on Nivlisen Ice Shelf over the 8 year period. By quantifying key metrics, including the water area, number of channels, total channel length and number of drainage components, we show significant interannual variability in surface drainage networks across Nivlisen Ice Shelf, with the seasonal evolution showing a general pattern of expansion, peak development, and substantial decline. In the summer of 2018, surface water extent peaked, with 1650 channels organised into 186 drainage components, and a total channel length of approximately 1440 km. Seasonally, during the summer of 2018–2019 surface meltwater was efficiently delivered from high-elevation (about 400 m) lakes to low elevations (50 m) near the ice-shelf front (approximately 20 km) through 924 channels with total length of 967 km. The supraglacial drainage systems exhibited a dynamic process characterized by initial isolated appearance of surface water bodies near the grounding line, followed by expansion, peak connectivity, and finally, fragmentation as meltwater refreezes. As the connectivity evolves through a season, it enables the area covered by drainage component to expand across the ice shelf but at the same time, it means the channels which initially formed near the grounding line more efficiently transport water into the lower channel network, thus contain shallower water and are not visible in the imagery. Hence, the system evolves from a less efficient to more efficient system over the melt season, transporting meltwater to lower regions of the ice shelf.
Relationships between seasonal hydrological metrics and climatic drivers from the MAR climate model and ERA5 reanalysis reveal the sensitivity of drainage component to both seasonal and interannual temperature variability, confirming temperature as a primary driver controlling the extent, connectivity, and structural evolution of surface drainage systems. In addition, our work suggests that there are complexities relating to the influence of snowfall on the development and/or observation of the drainage systems and that these depend on the time of year in which snowfall is deposited and how readily it can be melted. The observed increase in connectivity implies that meltwater can be redistributed over large areas of the ice shelf during warm summers and that this routing is linked to the structure of the ice shelf (e.g. crevasses and flow stripes) as well as ice surface undulations at a range of scales which act to steer water flow. This creates the framework for a drainage system that is reoccupied each year, but to varying degrees based on the complex relationship between melt and snowfall. In particular, the presence of a topographic pinning point acts to reverse ice surface gradients and thus divert the main drainage channels at nearly right-angles resulting in a flow-transverse channel that cross-cuts and thus captures the three main channel outlets, feeding water into a major supraglacial lake. By linking detailed observations of drainage evolution with climatic forcing, this work provides crucial insights into how surface meltwater is potentially delivered within the surface drainage system of an ice shelf, a process with increasingly important implications for the surface mass balance and overall stability of the AIS in a warming future.
The satellite imagery, REMA DEM, and meteorological data are all open access and freely available (Ref. Section 3 Data and methods). The supraglacial drainage components mapped in this study have been deposited in Zenodo (https://doi.org/10.5281/zenodo.22261958; Chen et al., 2026).
Table S1: Sentinel-2 and Landsat-8 imagery information. Figure S1: Scatter plots showing the relationships between ERA5 mean summer temperature and key metrics of supraglacial drainage components. Figure S2: Qualitative historical Landsat check of January surface-water and drainage patterns on Nivlisen Ice Shelf prior to the Sentinel-2 study period. Figure S3: Comparison between (a) Landsat-8 pan-sharpened imagery acquired on 25 January 2019 and (b) Sentinel-2 imagery acquired on 31 January 2019 over Nivlisen Ice Shelf. The supplement related to this article is available online at https://doi.org/10.5194/tc-20-5785-2026-supplement.
All authors contributed to the conceptualisation of this project. JC conducted the mapping and data analysis under the supervision of RAH, SSRJ and CRS. JC led manuscript writing with comments and revisions provided by all authors.
The contact author has declared that none of the authors has any competing interests.
Publisher's note: Copernicus Publications remains neutral with regard to jurisdictional claims made in the text, published maps, institutional affiliations, or any other geographical representation in this paper. The authors bear the ultimate responsibility for providing appropriate place names. Views expressed in the text are those of the authors and do not necessarily reflect the views of the publisher.
The authors thank the editors and two anonymous referees.
This research has been supported by China Scholarship Council – Durham University joint scholarship held by Jiao Chen (grant reference CSC No. 202208890014).
This paper was edited by Louise Sandberg Sørensen and reviewed by two anonymous referees.
Alley, K. E., Scambos, T. A., Miller, J. Z., Long, D. G., and MacFerrin, M.: Quantifying vulnerability of Antarctic ice shelves to hydrofracture using microwave scattering properties, Remote Sens. Environ., 210, 297–306, https://doi.org/10.1016/j.rse.2018.03.025, 2018.
Arthur, J. F., Stokes, C. R., Jamieson, S. S. R., Carr, J. R., and Leeson, A. A.: Distribution and seasonal evolution of supraglacial lakes on Shackleton Ice Shelf, East Antarctica, The Cryosphere, 14, 4103–4120, https://doi.org/10.5194/tc-14-4103-2020, 2020.
Arthur, J. F., Stokes, C. R., Jamieson, S. S. R., Rachel Carr, J., Leeson, A. A., and Verjans, V.: Large interannual variability in supraglacial lakes around East Antarctica, Nat. Commun., 13, 1711, https://doi.org/10.1038/s41467-022-29385-3, 2022.
Banwell, A. F., MacAyeal, D. R., and Sergienko, O. V.: Breakup of the Larsen B Ice Shelf triggered by chain reaction drainage of supraglacial lakes: Larsen B chain reaction lake drainage, Geophys. Res. Lett., 40, 5872–5876, https://doi.org/10.1002/2013GL057694, 2013.
Banwell, A. F., Caballero, M., Arnold, N. S., Glasser, N. F., Mac Cathles, L., and MacAyeal, D. R.: Supraglacial lakes on the Larsen B ice shelf, Antarctica, and at Paakitsoq, West Greenland: a comparative study, Ann. Glaciol., 55, 1–8, https://doi.org/10.3189/2014AoG66A049, 2014.
Banwell, A. F., Datta, R. T., Dell, R. L., Moussavi, M., Brucker, L., Picard, G., Shuman, C. A., and Stevens, L. A.: The 32-year record-high surface melt in 2019/2020 on the northern George VI Ice Shelf, Antarctic Peninsula, The Cryosphere, 15, 909–925, https://doi.org/10.5194/tc-15-909-2021, 2021.
Barnes, T. J., Leeson, A. A., McMillan, M., Verjans, V., Carter, J., and Kittel, C.: Changes in Supraglacial Lakes on George VI Ice Shelf, Antarctic Peninsula: 1973–2020, The Cryosphere Discuss. [preprint], https://doi.org/10.5194/tc-2021-214, 2021.
Bell, R. E., Chu, W., Kingslake, J., Das, I., Tedesco, M., Tinto, K. J., Zappa, C. J., Frezzotti, M., Boghosian, A., and Lee, W. S.: Antarctic ice shelf potentially stabilized by export of meltwater in surface river, Nature, 544, 344–348, https://doi.org/10.1038/nature22048, 2017.
Bell, R. E., Banwell, A. F., Trusel, L. D., and Kingslake, J.: Antarctic surface hydrology and impacts on ice-sheet mass balance, Nat. Clim. Change, 8, 1044–1052, https://doi.org/10.1038/s41558-018-0326-3, 2018.
Berger, S., Favier, L., Drews, R., Derwael, J.-J., and Pattyn, F.: The control of an uncharted pinning point on the flow of an Antarctic ice shelf, J. Glaciol., 62, 37–45, https://doi.org/10.1017/jog.2016.7, 2016.
Chandler, D. M. and Hubbard, A.: Widespread partial-depth hydrofractures in ice sheets driven by supraglacial streams, Nat. Geosci., https://doi.org/10.1038/s41561-023-01208-0, 2023.
Chen, J., Hodge, R. A., Jamieson, S. S. R., and Stokes, C. R.: Distribution and Morphometry of Large Supraglacial Channels on Five Antarctic Ice Shelves, J. Glaciol., 1–53, https://doi.org/10.1017/jog.2024.99, 2024.
Chen, J., Hodge, R., Jamieson, S., and Stokes, C.: Interannual and seasonal evolution of supraglacial drainage systems on Nivlisen Ice Shelf, East Antarctica, Zenodo [data set], https://doi.org/10.5281/zenodo.22261958, 2026.
Corr, D., Leeson, A., McMillan, M., Zhang, C., and Barnes, T.: An inventory of supraglacial lakes and channels across the West Antarctic Ice Sheet, Earth Syst. Sci. Data, 14, 209–228, https://doi.org/10.5194/essd-14-209-2022, 2022.
Dell, R., Arnold, N., Willis, I., Banwell, A., Williamson, A., Pritchard, H., and Orr, A.: Lateral meltwater transfer across an Antarctic ice shelf, The Cryosphere, 14, 2313–2330, https://doi.org/10.5194/tc-14-2313-2020, 2020.
Dirscherl, M. C., Dietz, A. J., and Kuenzer, C.: Seasonal evolution of Antarctic supraglacial lakes in 2015–2021 and links to environmental controls, The Cryosphere, 15, 5205–5226, https://doi.org/10.5194/tc-15-5205-2021, 2021.
Donat-Magnin, M., Jourdain, N. C., Kittel, C., Agosta, C., Amory, C., Gallée, H., Krinner, G., and Chekki, M.: Future surface mass balance and surface melt in the Amundsen sector of the West Antarctic Ice Sheet, The Cryosphere, 15, 571–593, https://doi.org/10.5194/tc-15-571-2021, 2021.
Dunmire, D., Lenaerts, J. T. M., Banwell, A. F., Wever, N., Shragge, J., Lhermitte, S., Drews, R., Pattyn, F., Hansen, J. S. S., Willis, I. C., Miller, J., and Keenan, E.: Observations of Buried Lake Drainage on the Antarctic Ice Sheet, Geophys. Res. Lett., 47, e2020GL087970, https://doi.org/10.1029/2020GL087970, 2020.
Fretwell, P., Pritchard, H., Vaughan, D., Bamber, J., Barrand, N., Bell, R. E., Bianchi, C., Bingham, R., Blankenship, D., Casassa, G., Catania, G., Callens, D., Conway, H., Cook, A., Corr, H., Damaske, D., Damn, V., Ferraccioli, F., Forsberg, R., Fujita, S., Gim, Y., Gogineni, P., Griggs, J., Hindmarsh, R., Holmlund, P., Holt, J. W., Jacobel, R., Jenkins, A., Jokat, W., Jordan, T., King, E., Kohler, J., Krabill, W., Riger-Kusk, M., Langley, K., Leitchenkov, G., Leuschen, C., Luyendyk, B., Matsuoka, K., Mouginot, J., Nitsche, F., Nogi, Y., Nost, O., Popov, S., Rignot, E., Rippin, D., Rivera, A., Roberts, J. L., Ross, N., Siegert, M., Smith, A., Steinhage, D., Studinger, M., Sun, B., Tinto, K., Welch, B., Wilson, D. S., Young, D., Xiangbin, C., and Zirizzotti, A.: BEDMAP2 – Ice thickness, bed and surface elevation for Antarctica – gridding products (1.0), https://doi.org/10.5285/FA5D606C-DC95-47EE-9016-7A82E446F2F2, 2022.
Glasser, N. F. and Gudmundsson, G. H.: Longitudinal surface structures (flowstripes) on Antarctic glaciers, The Cryosphere, 6, 383–391, https://doi.org/10.5194/tc-6-383-2012, 2012.
Glen, E., Banwell, A., Maddalena, J., Leeson, A., Corr, D., and McMillan, M.: A comparison of supraglacial lake characteristics and drainage dynamics in Southwest Greenland between an extreme high, and an extreme low, melt season, EGU General Assembly 2022, Vienna, Austria, 23–27 May 2022, EGU22-7675, https://doi.org/10.5194/egusphere-egu22-7675, 2022.
Glen, E., Leeson, A., Banwell, A. F., Maddalena, J., Corr, D., Atkins, O., Noël, B., and McMillan, M.: A comparison of supraglacial meltwater features throughout contrasting melt seasons: southwest Greenland, The Cryosphere, 19, 1047–1066, https://doi.org/10.5194/tc-19-1047-2025, 2025.
Hanna, E., Topál, D., Box, J. E., Buzzard, S., Christie, F. D. W., Hvidberg, C., Morlighem, M., De Santis, L., Silvano, A., Colleoni, F., Sasgen, I., Banwell, A. F., Van Den Broeke, M. R., DeConto, R., De Rydt, J., Goelzer, H., Gossart, A., Gudmundsson, G. H., Lindbäck, K., Miles, B., Mottram, R., Pattyn, F., Reese, R., Rignot, E., Srivastava, A., Sun, S., Toller, J., Tuckett, P. A., and Ultee, L.: Short- and long-term variability of the Antarctic and Greenland ice sheets, Nat. Rev. Earth Environ., 5, 193–210, https://doi.org/10.1038/s43017-023-00509-7, 2024.
Harris Geospatial Solutions: ENVI 5.6 Help, https://www.nv5geospatialsoftware.com/docs/envinndiffusepansharpeningtask.html (last access: 28 September 2026), 2020.
He, L., Ren, X., Gao, Q., Zhao, X., Yao, B., and Chao, Y.: The connected-component labeling problem: A review of state-of-the-art algorithms, Pattern Recogn., 70, 25–43, https://doi.org/10.1016/j.patcog.2017.04.018, 2017.
Hersbach, H., Bell, B., Berrisford, P., Hirahara, S., Horányi, A., Muñoz-Sabater, J., Nicolas, J., Peubey, C., Radu, R., Schepers, D., Simmons, A., Soci, C., Abdalla, S., Abellan, X., Balsamo, G., Bechtold, P., Biavati, G., Bidlot, J., Bonavita, M., De Chiara, G., Dahlgren, P., Dee, D., Diamantakis, M., Dragani, R., Flemming, J., Forbes, R., Fuentes, M., Geer, A., Haimberger, L., Healy, S., Hogan, R. J., Hólm, E., Janisková, M., Keeley, S., Laloyaux, P., Lopez, P., Lupu, C., Radnoti, G., De Rosnay, P., Rozum, I., Vamborg, F., Villaume, S., and Thépaut, J.: The ERA5 global reanalysis, Q. J. Roy. Meteor. Soc., 146, 1999–2049, https://doi.org/10.1002/qj.3803, 2020.
Howat, I. M., Porter, C., Smith, B. E., Noh, M.-J., and Morin, P.: The Reference Elevation Model of Antarctica, The Cryosphere, 13, 665–674, https://doi.org/10.5194/tc-13-665-2019, 2019.
Hui, F., Ci, T., Cheng, X., Scambo, T. A., Liu, Y., Zhang, Y., Chi, Z., Huang, H., Wang, X., Wang, F., Zhao, C., Jin, Z., and Wang, K.: Mapping blue-ice areas in Antarctica using ETM+ and MODIS data, Ann. Glaciol., 55, 129–137, https://doi.org/10.3189/2014AoG66A069, 2014.
Kingslake, J., Ng, F., and Sole, A.: Modelling channelized surface drainage of supraglacial lakes, J. Glaciol., 61, 185–199, https://doi.org/10.3189/2015JoG14J158, 2015.
Kingslake, J., Ely, J. C., Das, I., and Bell, R. E.: Widespread movement of meltwater onto and across Antarctic ice shelves, Nature, 544, 349–352, https://doi.org/10.1038/nature22049, 2017.
Kittel, C., Amory, C., Agosta, C., Jourdain, N. C., Hofer, S., Delhasse, A., Doutreloup, S., Huot, P.-V., Lang, C., Fichefet, T., and Fettweis, X.: Diverging future surface mass balance between the Antarctic ice shelves and grounded ice sheet, The Cryosphere, 15, 1215–1236, https://doi.org/10.5194/tc-15-1215-2021, 2021.
Lai, C.-Y., Kingslake, J., Wearing, M. G., Chen, P.-H. C., Gentine, P., Li, H., Spergel, J. J., and Van Wessem, J. M.: Vulnerability of Antarctica's ice shelves to meltwater-driven fracture, Nature, 584, 574–578, https://doi.org/10.1038/s41586-020-2627-8, 2020.
Langley, E. S., Leeson, A. A., Stokes, C. R., and Jamieson, S. S. R.: Seasonal evolution of supraglacial lakes on an East Antarctic outlet glacier, Geophys. Res. Lett., 43, 8563–8571, https://doi.org/10.1002/2016GL069511, 2016.
Lenaerts, J. T. M., Lhermitte, S., Drews, R., Ligtenberg, S. R. M., Berger, S., Helm, V., Smeets, C. J. P. P., Broeke, M. R. van den, van de Berg, W. J., van Meijgaard, E., Eijkelboom, M., Eisen, O., and Pattyn, F.: Meltwater produced by wind–albedo interaction stored in an East Antarctic ice shelf, Nat. Clim. Change, 7, 58–62, https://doi.org/10.1038/nclimate3180, 2017.
Lindbäck, K., Moholdt, G., Nicholls, K. W., Hattermann, T., Pratap, B., Thamban, M., and Matsuoka, K.: Spatial and temporal variations in basal melting at Nivlisen ice shelf, East Antarctica, derived from phase-sensitive radars, The Cryosphere, 13, 2579–2595, https://doi.org/10.5194/tc-13-2579-2019, 2019.
Lu, Y., Yang, K., Lu, X., Smith, L. C., Sole, A. J., Livingstone, S. J., Fettweis, X., and Li, M.: Diverse supraglacial drainage patterns on the Devon ice Cap, Arctic Canada, J. Maps, 16, 834–846, https://doi.org/10.1080/17445647.2020.1838353, 2020.
Luckman, A., Elvidge, A., Jansen, D., Kulessa, B., Kuipers Munneke, P., King, J., and Barrand, N. E.: Surface melt and ponding on Larsen C Ice Shelf and the impact of föhn winds, Antarct. Sci., 26, 625–635, https://doi.org/10.1017/S0954102014000339, 2014.
Melling, L., Leeson, A., McMillan, M., Maddalena, J., Bowling, J., Glen, E., Sandberg Sørensen, L., Winstrup, M., and Lørup Arildsen, R.: Evaluation of satellite methods for estimating supraglacial lake depth in southwest Greenland, The Cryosphere, 18, 543–558, https://doi.org/10.5194/tc-18-543-2024, 2024.
Miles, B. W. J. and Bingham, R. G.: Progressive unanchoring of Antarctic ice shelves since 1973, Nature, 626, 785–791, https://doi.org/10.1038/s41586-024-07049-0, 2024.
Mouginot, J., Scheuchl, B., and Rignot, E.: MEaSUREs Antarctic Boundaries for IPY 2007–2009 from Satellite Radar, Version 2, https://doi.org/10.5067/AXE4121732AD, 2017.
Moussavi, M., Pope, A., Halberstadt, A., Trusel, L., Cioffi, L., and Abdalati, W.: Antarctic Supraglacial Lake Detection Using Landsat 8 and Sentinel-2 Imagery: Towards Continental Generation of Lake Volumes, Remote Sens.-Basel, 12, 134, https://doi.org/10.3390/rs12010134, 2020.
Moussavi, M. S., Abdalati, W., Pope, A., Scambos, T., Tedesco, M., MacFerrin, M., and Grigsby, S.: Derivation and validation of supraglacial lake volumes on the Greenland Ice Sheet from high-resolution satellite imagery, Remote Sens. Environ., 183, 294–303, https://doi.org/10.1016/j.rse.2016.05.024, 2016.
Ostertagová, E., Ostertag, O., and Kováč, J.: Methodology and Application of the Kruskal–Wallis Test, AMM, 611, 115–120, https://doi.org/10.4028/www.scientific.net/AMM.611.115, 2014.
Pitcher, L. H. and Smith, L. C.: Supraglacial Streams and Rivers, Annu. Rev. Earth Pl. Sc., 47, 421–452, https://doi.org/10.1146/annurev-earth-053018-060212, 2019.
Pope, A., Scambos, T. A., Moussavi, M., Tedesco, M., Willis, M., Shean, D., and Grigsby, S.: Estimating supraglacial lake depth in West Greenland using Landsat 8 and comparison with other multispectral methods, The Cryosphere, 10, 15–27, https://doi.org/10.5194/tc-10-15-2016, 2016.
Pratap, B., Dey, R., Matsuoka, K., Moholdt, G., Lindbäck, K., Goel, V., Laluraj, C. M., and Thamban, M.: Three-decade spatial patterns in surface mass balance of the Nivlisen Ice Shelf, central Dronning Maud Land, East Antarctica, J. Glaciol., 68, 174–186, https://doi.org/10.1017/jog.2021.93, 2022.
Rignot, E., Mouginot, J., and Scheuchl, B.: MEaSUREs InSAR-Based Antarctica Ice Velocity Map, Version 2, https://doi.org/10.5067/D7GK8F5J8M8R, 2017.
Spergel, J. J., Kingslake, J., Creyts, T., Van Wessem, M., and Fricker, H. A.: Surface meltwater drainage and ponding on Amery Ice Shelf, East Antarctica, 1973–2019, J. Glaciol., 67, 985–998, https://doi.org/10.1017/jog.2021.46, 2021.
Stokes, C. R., Sanderson, J. E., Miles, B. W. J., Jamieson, S. S. R., and Leeson, A. A.: Widespread distribution of supraglacial lakes around the margin of the East Antarctic Ice Sheet, Sci. Rep.-UK, 9, 13823, https://doi.org/10.1038/s41598-019-50343-5, 2019.
Tuckett, P. A., Ely, J. C., Sole, A. J., Lea, J. M., Livingstone, S. J., Jones, J. M., and van Wessem, J. M.: Automated mapping of the seasonal evolution of surface meltwater and its links to climate on the Amery Ice Shelf, Antarctica, The Cryosphere, 15, 5785–5804, https://doi.org/10.5194/tc-15-5785-2021, 2021.
Tuckett, P. A., Sole, A. J., Livingstone, S. J., Jones, J. M., Lea, J. M., and Gilbert, E.: Continent-wide mapping shows increasing sensitivity of East Antarctica to meltwater ponding, Nat. Clim. Change, 15, 775–783, https://doi.org/10.1038/s41558-025-02363-5, 2025.
Turner, J., Colwell, S. R., Marshall, G. J., Lachlan-Cope, T. A., Carleton, A. M., Jones, P. D., Lagun, V., Reid, P. A., and Iagovkina, S.: The SCAR READER Project: Toward a High-Quality Database of Mean Antarctic Meteorological Observations, J. Climate, 17, 2890–2898, https://doi.org/10.1175/1520-0442(2004)017%253C2890:TSRPTA%253E2.0.CO;2, 2004.
Van Der Veen, C. J.: Fracture propagation as means of rapidly transferring surface meltwater to the base of glaciers, Geophys. Res. Lett., 34, 2006GL028385, https://doi.org/10.1029/2006GL028385, 2007.
Van Wessem, J. M., Van Den Broeke, M. R., Wouters, B., and Lhermitte, S.: Variable temperature thresholds of melt pond formation on Antarctic ice shelves, Nat. Clim. Change, 13, 161–166, https://doi.org/10.1038/s41558-022-01577-1, 2023.
Williamson, A. G., Banwell, A. F., Willis, I. C., and Arnold, N. S.: Dual-satellite (Sentinel-2 and Landsat 8) remote sensing of supraglacial lakes in Greenland, The Cryosphere, 12, 3045–3065, https://doi.org/10.5194/tc-12-3045-2018, 2018.
Yang, K. and Smith, L. C.: Supraglacial Streams on the Greenland Ice Sheet Delineated From Combined Spectral–Shape Information in High-Resolution Satellite Imagery, IEEE Geosci. Remote Sens. Lett., 10, 801–805, https://doi.org/10.1109/LGRS.2012.2224316, 2013.
Yang, K., Smith, L. C., Chu, V. W., Pitcher, L. H., Gleason, C. J., Rennermalm, A. K., and Li, M.: Fluvial morphometry of supraglacial river networks on the southwest Greenland Ice Sheet, GISci. Remote Sens., 53, 459–482, https://doi.org/10.1080/15481603.2016.1162345, 2016.
Yang, K., Smith, L. C., Cooper, M. G., Pitcher, L. H., Van As, D., Lu, Y., Lu, X., and Li, M.: Seasonal evolution of supraglacial lakes and rivers on the southwest Greenland Ice Sheet, J. Glaciol., 67, 592–602, https://doi.org/10.1017/jog.2021.10, 2021.
Zhang, W., Yang, K., Smith, L. C., Wang, Y., Van As, D., Noël, B., Lu, Y., and Liu, J.: Pan-Greenland mapping of supraglacial rivers, lakes, and water-filled crevasses in a cool summer (2018) and a warm summer (2019), Remote Sens. Environ., 297, 113781, https://doi.org/10.1016/j.rse.2023.113781, 2023.