
the Creative Commons Attribution 4.0 License.
the Creative Commons Attribution 4.0 License.
 | 14 Aug 2026
Anatomy and impact of a high Arctic atmospheric river driving extreme winter rain and snowfall

Jason E. Box
Ben G. Kopec
Valtteri Hyöky
Hannu Marttila
Jeffrey M. Welker
Jack Kohler
Dmitry V. Divine
Alun Hubbard
Atmospheric rivers (ARs) transport concentrated fluxes of heat and moisture poleward, driving temperature and precipitation extremes. Yet, their vertical structure in the High Arctic – where small thermodynamic perturbations govern rain-snow partitioning and cryospheric response – remains poorly constrained. Here we present atmospheric vapour isotope, radiosonde, and meteorological observations from Svalbard during a record-setting AR in March 2022. The AR developed in the northwest Atlantic when a deep “bomb” cyclone established a sustained conduit of poleward heat/moisture. Integrated vapour transport exceeded 450 kg m−1 s−1, with warming and enhanced moisture emerging ∼ 2–6 km aloft before deepening through the lower-troposphere, tripling near-surface humidity. On 15 March, air temperatures rose to 5.6 °C accompanied by 43.9 mm rainfall – the highest daily March total on record. Concurrently, vapour δ18O (d-excess) attained its seasonal maximum (minimum) and marine aerosol (Na+) concentrations spiked, constraining the geochemical signature of Atlantic moisture advection. The two-day AR event delivered ∼ 0.5 Gt snowfall across Svalbard, locally equivalent to over 8 % of net 2022 glacier accumulation and offsetting surface mass loss by ∼ 7 %. Although rainfall comprised less than one-third of the total precipitation, it impacted 60 % of the glacierised terrain, driving winter rain-on-snow melt and densification across lower-elevation areas and altering snowpack structure. Our study underscores the vulnerability of Svalbard and other glacierised Arctic archipelagos to intensifying poleward moisture and heat transport by ARs, with substantial but nuanced impacts on glacier surface energy budget and mass balance through the delivery of anomalous winter rainfall, snowfall, and latent heat.
- Article
(10417 KB) - Full-text XML
-
Supplement
(948 KB) - BibTeX
- EndNote


Atmospheric rivers (ARs) play a critical role in the global climate system, conveying high fluxes of heat, moisture, and momentum into higher latitudes (Wang et al., 2024). In polar regions, this advection can trigger pronounced temperature and precipitation anomalies (Payne et al., 2020; Scholz and Lora, 2024) including extreme rainfall (Box et al., 2023), snowfall (Bailey and Hubbard, 2025; Gorodetskaya et al., 2014), and rain-on-snow (ROS) events (Box et al., 2022; Sobota et al., 2020). These anomalies can modify snowpack structure (Salzano et al., 2023; Sobota et al., 2020) and modulate radiative and turbulent fluxes (Mattingly et al., 2020), with consequences for sea-ice growth (Hegyi and Taylor, 2018; Zhang et al., 2023) and ice-sheet mass balance (Bailey and Hubbard, 2025; Mattingly et al., 2018; Wedum et al., 2026).
Recent work highlights contrasting impacts of ARs on the Antarctic and Greenland ice sheets, where large AR-fuelled snowfall events can substantially enhance surface mass balance at high elevations (Adusumilli et al., 2021; Bailey and Hubbard, 2025; Gorodetskaya et al., 2014; Wille et al., 2024a), whereas rainfall is increasingly linked to widespread surface melt and mass loss (Box et al., 2022; Gorodetskaya et al., 2023; Mattingly et al., 2020, 2023). Despite these insights, the vertical thermodynamic structure of polar ARs – and how it governs the partitioning of precipitation between rain and snow – remain poorly constrained by direct observations. This gap is particularly acute across mid- to high-latitude maritime glaciated regions with complex topography(NygÅrd et al., 2016; Payne et al., 2020), where warm air intrusions can raise winter surface air temperatures (SATs) above freezing. In such settings, small thermodynamic perturbations can critically modulate precipitation phase (Bintanja and Andry, 2017), with disproportionate consequences for seasonal snowpacks (Peeters et al., 2019), low-lying maritime glaciers (Noël et al., 2020), and the timing and magnitude of downstream hydrological and biogeochemical fluxes (Croghan et al., 2025; Kleber et al., 2025). Consequently, how AR-driven moisture transport translates into rain versus snowfall across short spatial scales remains poorly resolved, limiting process-level understanding of hydroclimatic impacts in polar maritime regions.
The Svalbard archipelago is an Arctic hotspot where mean rates of warming have exceeded 1.25 °C per decade since 1979 (Rantanen et al., 2022). Situated directly in the path of poleward-advecting Atlantic air masses, it occupies a critical position for studying ARs which contribute disproportionately to over 40 % of annual precipitation (2017–2021) (Ebell et al., 2025). Approximately ∼ 60 % of the archipelago is glacierised (∼ 36 500 km2), with an estimated volume of 6800 ± 238 km3 (van Pelt and Frank, 2025) distributed among its 1666 glaciers (RGI Consortium, 2023). Between 2002 and 2023, their mean mass deficit was 14.8 ± 1.3 Gt yr−1 (Sasgen et al., 2024), with a forecast doubling of ice loss by 2100 (Geyman et al., 2022). This combination of strong Atlantic influence, marginal winter thermal conditions, and ongoing mass loss makes Svalbard an ideal natural laboratory for examining how extreme AR moisture transport manifests in the High Arctic.
Here, we present a detailed empirical analysis of a record-setting AR event that made landfall in Svalbard during mid-March 2022 (Fig. 1a). The event drove anomalously high SATs and precipitation across a large sector of the Arctic (Bailey and Hubbard, 2025; Walbröl et al., 2024), and was followed by an intense marine cold air outbreak (CAO) (Kirbus et al., 2024) (Fig. 1b). We captured this extreme AR-CAO sequence using continuous measurements of atmospheric water vapour isotopes (δ18O, δ2H) at Ny-Ålesund, northwest Svalbard, together with upper-air radiosonde observations and meteorological data, providing rare observational constraints on the moisture provenance, thermodynamic structure, and surface coupling of the event.
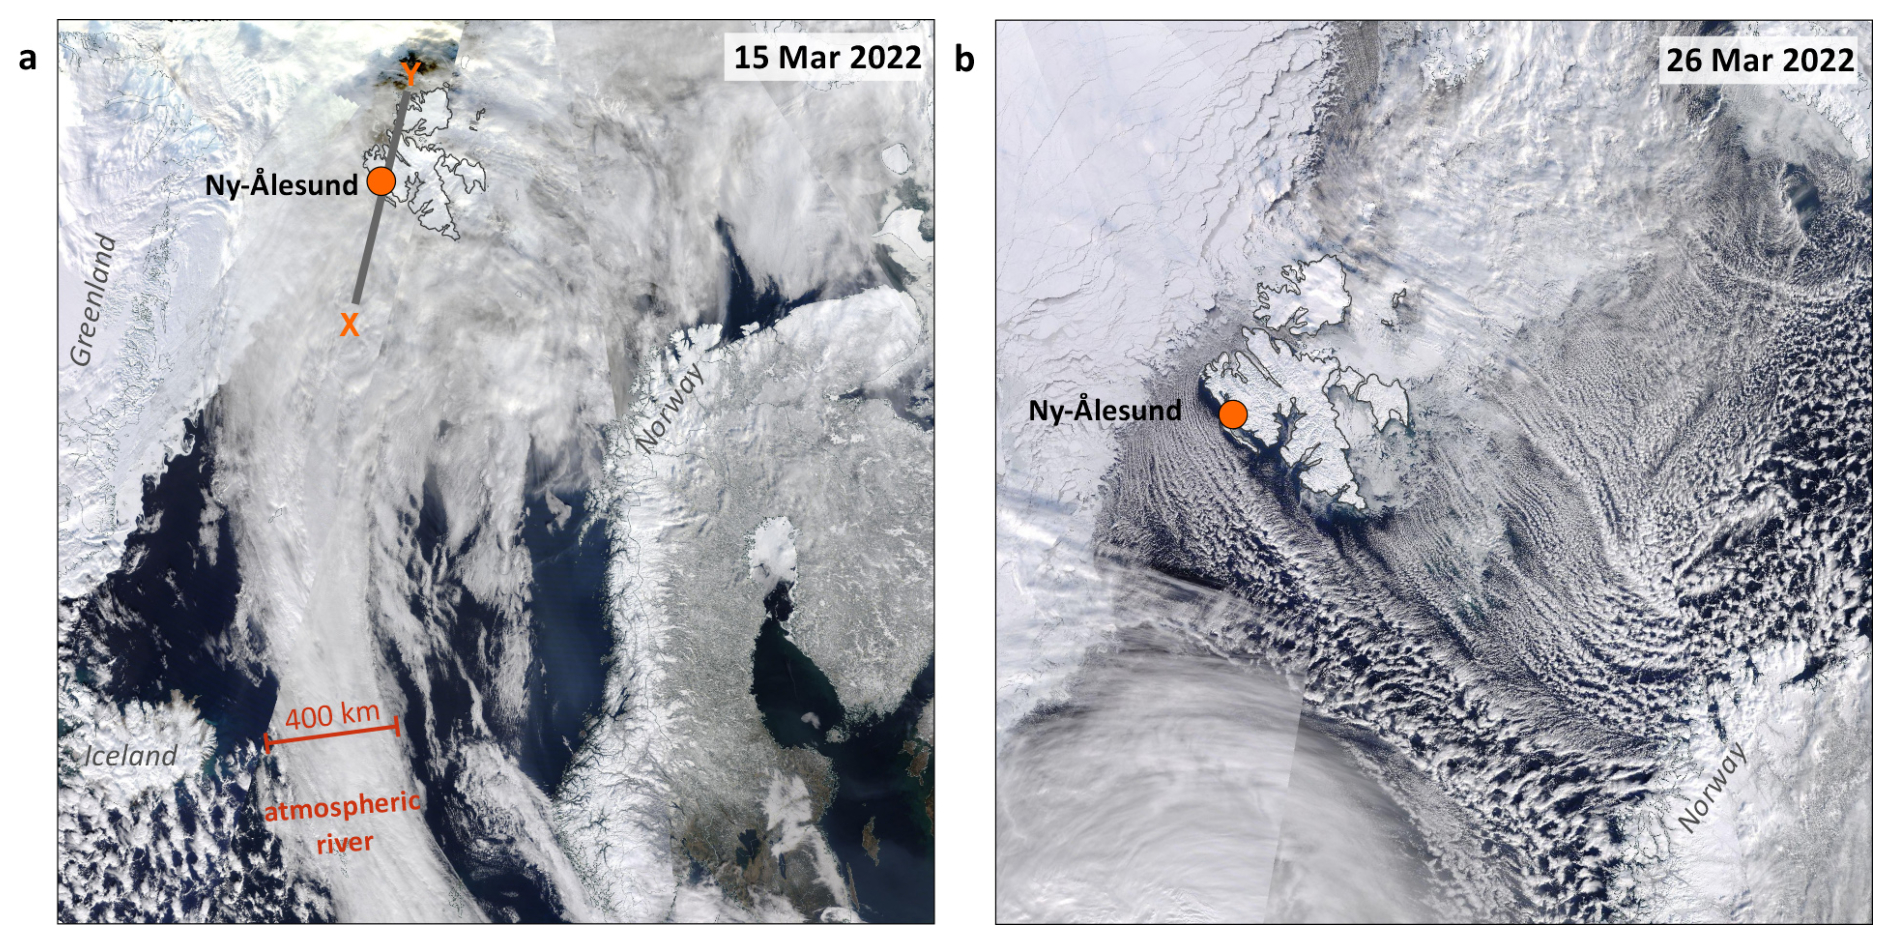
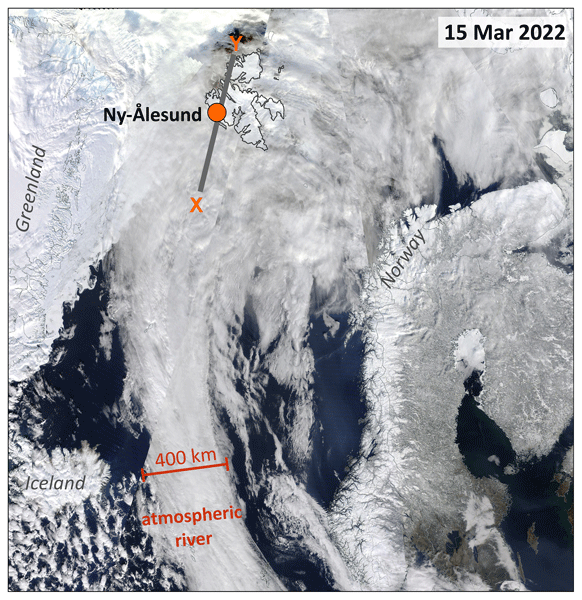
Figure 1Satellite images during mid-March 2022. Aqua-MODIS satellite images on (a) 15 March 2022 showing the North Atlantic AR transiting between Iceland/Greenland and Scandinavia toward Ny-Ålesund, Svalbard (orange circle), and (b) on 26 March 2022 during the CAO showing “cloud streets” forming off the Arctic Ocean sea ice in the Fram Strait and Barents Sea. The x-y transect in (a), passing through Ny-Ålesund, indicates the approximate location of the CARRA cross-section analysed in the Results and Discussion. Imagery from NASA Worldview.
2.1 Stable isotope measurements
Atmospheric water vapour isotopes (18O 16O and 2H 1H) and mixing ratios were measured continuously between 1 January and 31 May 2022 as part of a winter–spring 2022 measurement campaign at the NPI Zeppelin Observatory (78.91° N, 11.89° E; 475 m a.s.l.) in Ny-Ålesund, Svalbard. Ambient air was sampled through approximately 3 m of inlet tubing drawing air from above the roof of the laboratory building. To limit residence time the air was pumped through the line at a flow rate of 3 L min−1, giving a residence time of ∼ 3 s from the inlet to the analyser. A low-energy heating cable was wrapped around the inlet to prevent freezing, and a shield was used to stop precipitation from entering the sampling line. Temperature inside the laboratory was maintained at 20 °C to ensure instrument stability and prevent condensation in the line.
Vapour stable isotope ratios (δ18O and δ2H) were measured approximately every second using a cavity ring-down spectrometer (Picarro L2130-i, Picarro Inc., USA). The analyser was connected to a Picarro Standards Delivery Module supplying two reference waters with known isotopic composition approximately every 24 h (Ala-Aho et al., 2021). Calibration standards USGS-45 (δ18O ‰, δ2H ‰) and USGS-49 (δ18O ‰, δ2H ‰), which span the isotopic range of ambient measurements during the campaign, were used to correct measurements to the VSMOW-SLAP scale and monitor instrumental drift. Stable isotope data were calibrated and corrected for humidity using standard established protocols (Madsen et al., 2019). Standard waters were measured across a range of controlled water vapour concentrations to establish a humidity response function, which was subsequently applied to the dataset (Bailey et al., 2021; Pereira Freitas et al., 2024). Following calibration and quality control procedures, isotope measurements were aggregated to 5 min averages. Analytical uncertainty is estimated to be < 0.3 ‰ for δ18O and < 1.1 ‰ for δ2H – considerably smaller than the natural variability observed during the March 2022 AR-CAO sequence.
Twenty-four snowfall samples were collected at the Ny-Ålesund Research Station–Sverdrup during the measurement campaign and analysed for δ18O and δ2H at the FARLAB (University of Bergen, Norway). Samples were transferred to 1.5 mL septa-capped glass vials prior to analysis and measured using a Picarro L2140-i Cavity-Ring Down Spectrometer coupled to an autosampler (Picarro A0325) and high-precision vaporiser (Picarro A0211). For each sample, repeated injections of ∼ 2 µL of liquid water were vaporised at ∼ 110 °C and introduced into the spectrometer cavity with dry N2 carrier gas, producing water vapour concentrations of ∼ 20 000 ppm during analysis. Multiple injections (6–12) were performed for each sample to minimise memory effects, and the final isotope value was calculated from the mean of the final injections after equilibration (Mellat et al., 2021). Isotope ratios are reported in δ-notation relative to the VSMOW-SLAP scale following standard laboratory calibration procedures (Akers et al., 2024; Bailey et al., 2018). Mean analytical uncertainty is 0.05 ‰ for δ18O, 0.5 ‰ for δ2H, and 0.6 ‰ for d-excess.
2.2 Radiosonde observations
Radiosonde profiles are derived from six-hourly launches from the French-German AWIPEV Research Base in Ny-Ålesund (78.92° N, 11.92° E, 17 m a.s.l) using a Vaisala RS41 radiosonde (Maturilli, 2022). For the event analysis we use the March 2022 soundings, while percentile and record-context statistics are calculated relative to the available March radiosonde record from 1993–2022. Specific humidity was derived from measurements of air temperature (T), relative humidity (RH) and pressure (p). Integrated water vapour (IWV) was calculated by vertically integrating specific humidity in pressure coordinates over the full available radiosonde profile, and is reported in units of kg m−2, equivalent to millimetres of precipitable water.
Wet-bulb temperature (TW) was calculated from radiosonde measurements of T, RH, and p using a standard pressure-dependent psychrometric formulation (Davies-Jones, 2008). The melting level was defined as the height of the surface-connected TW=0 °C crossing, obtained by linear interpolation between adjacent levels. Uncertainty in TW was estimated through propagation of radiosonde measurement uncertainties (±0.2–0.4 K in T; ±3 %–4 % in RH) (Maturilli, 2022), yielding TW uncertainties of 0.27–0.46 °C. Given the observed vertical gradient of TW near the melting level (∼ 5.5 °C km−1), this corresponds to an uncertainty in melting-level height of approximately ±50–80 m. We note the reconstructed melting-level closely tracks observed precipitation phase at Ny-Ålesund.
2.3 Meteorological, reanalysis, and glacier data
Hourly surface meteorological observations are utilised from Ny-Ålesund (SN99910; 78.9218° N, 11.9325° E, 8 m a.s.l), Svalbard Airport (No. SN99840; 78.2453° N, 15.5015° E, 28 m a.s.l), Adventdalen (SN99870; 78.2022° N, 15.831° E, 15 m a.s.l), and Hornsund (SN99754; 77.0002° N, 15.5353° E, 10 m a.s.l) meteorological stations (https://seklima.met.no/, last access: 17 February 2026). We also utilise daily sodium (Na+) aerosol concentrations measured at the Zeppelin Observatory in Ny-Ålesund (NILU, 2023).
Synoptic meteorological and surface conditions are examined using ERA5 reanalysis fields produced by the European Centre for Medium‐Range Weather Forecasts (ECMWF) (Hersbach et al., 2020). Hourly and post-processed daily statistics on single levels (1940 to present) were retrieved from the Copernicus Climate Data Store. Variables include 2 m air temperature, mean sea level pressure, total precipitation, snowfall, snowmelt, total column water vapour (IWV), skin temperature, surface thermal radiation downwards (LWD), and surface latent heat flux (LHF) on a 0.25° × 0.25° regularly spaced grid. Hourly geopotential at 850 hPa was retrieved from the ERA5 hourly data on pressure levels dataset. ERA5 anomalies during the AR (15–16 March 2022) were calculated at each grid cell relative to the corresponding 15–16 March climatology for 1981–2010. Two-day means were used for IWV, LWD, skin temperature and LHF, while two-day accumulated totals were used for precipitation and snowmelt. To assess statistical significance, the 2022 value at each grid cell was compared with the corresponding historical values (1981–2010) using a two-sided 95 % Student's t prediction interval. Grid cells where the 2022 value fell outside this interval were considered statistically significant. To examine the synoptic evolution linking the AR and subsequent CAO, the progression of the associated Atlantic cyclone was tracked using ERA5 hourly sea-level pressure fields sampled at 6 h intervals. The track was initialised from the CAO-associated SLP minimum near Svalbard on 21 March 2022 and reconstructed backward in time by identifying the nearest constrained SLP minimum at each preceding 6 h timestep. The resulting track was compared with ERA5 daily mean SLP fields from 14–21 March 2022. The vertical integrals of eastward and northward water vapour flux were used as the two vector components of integrated vapour transport (IVT) shown in Fig. 2 and obtained from EDARA: An ERA5-based Dataset for Atmospheric River Analysis (Mo, 2024a).
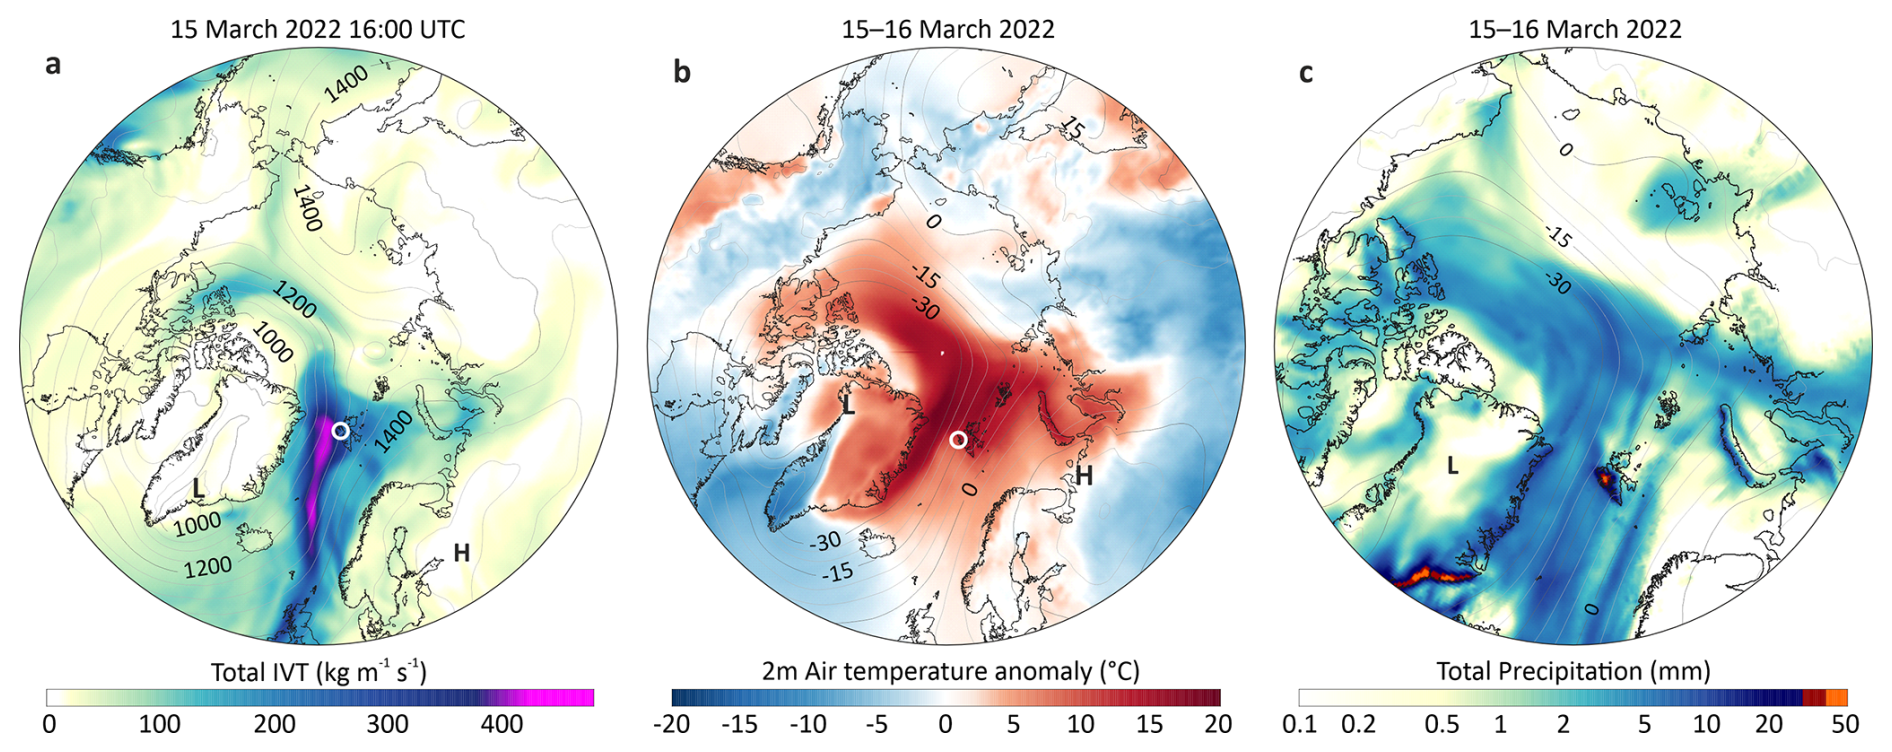
Figure 2Synoptic setting during the March 2022 AR. (a) Total integrated vapour transport (IVT) at 16:00 UTC on 15 March with corresponding 850 mb geopotential height contours; (b) mean 2 m air temperature (shading) and SLP anomalies (contours) on 15–16 March; and (c) total precipitation between 15–16 March (shading) with corresponding SLP anomalies (contours). All anomalies are relative to the 1981–2010 baseline. The white circle in (a) and (b) indicates Ny-Ålesund, Svalbard. High (H) and low (L) pressure centres are indicated. Data derive from ERA5 reanalysis (Hersbach et al., 2020). Base maps derive from the ETOPO5 gridded dataset (http://www.ngdc.noaa.gov/mgg/global/etopo5.HTML, last access: 3 December 2025).
Vertical profiles of Copernicus Arctic Regional ReAnalysis (CARRA) data (single levels from 1991 to present, East domain) (Schyberg et al., 2020) were analysed along a horizontal transect from 72.47° N, 3.48° W to 81.61° N, 30.00° W, chosen to intersect Ny-Ålesund and the NW glacier region of Svalbard approximately along the southwest-northeast axis of the AR. Variables include 3-hourly averages of wind speed, temperature, pressure, and cloud liquid water content on pressure levels between 1000 and 400 hPa. We note that CARRA provides higher ∼ 2.5 km horizontal resolution compared with ERA5 (∼ 31 km grid spacing), and is therefore used here to examine the dynamical structure of the AR in cross-section; ERA5 was retained for precipitation and surface energy analyses to ensure consistency with the 1981–2010 climatological baseline, which predates the start of the CARRA record.
Glacier outlines from the Randolph Glacier Inventory v7.0 (RGI Region 07: Svalbard and Jan Mayen) are used to quantify ERA5 precipitation and snowmelt fields across glacier basins. Rainfall was estimated as the difference between total precipitation and snowfall at each grid cell. Water-equivalent depths were converted to total mass using the glacierised area of each basin. Precipitation and snowmelt volumes were calculated as , where M is water mass, A is glacier area, and d is water-equivalent depth. Mass values were converted to gigatonnes (Gt), where 1 Gt = 109 m3 of water equivalent.
3.1 Atlantic bomb cyclogenesis and AR-CAO evolution
The March 2022 AR developed in response to rapid cyclogenesis in the northwest Atlantic, culminating in an explosively deepening low-pressure system over southern Greenland. By 15 March, the cyclone had intensified to a core sea-level pressure (SLP) below 945 hPa near the Denmark Strait. Concurrently, a persistent ridge of high pressure (> 1020 hPa) over Scandinavia established a strong meridional pressure gradient across the North Atlantic-Arctic sector (Fig. 2), consistent with a Scandinavian blocking pattern (Lapointe et al., 2024).
This synoptic configuration generated a ∼ 400 km-wide corridor of enhanced integrated vapour transport (IVT) along the eastern flank of the cyclone, extending from the North Atlantic through the Greenland Sea and Fram Strait toward Svalbard (Fig. 1a and 2a). ERA5 data indicate northward IVT exceeded ∼ 400–500 kg m−1 s−1 as the AR propagated poleward, classifying the event as very strong for the Arctic (Walbröl et al., 2024). Tightly packed geopotential height contours along the AR core reflect strong low-level winds sustaining efficient horizontal moisture transport into the High Arctic (Fig. 2a).
Poleward advection of warm, mid-latitude air produced exceptional lower-tropospheric thermodynamic anomalies. Mean 2 m SAT anomalies on 15–16 March exceeded +20 °C across a large swathe of the Central Arctic Ocean and the Greenland and Barents Seas relative to the 1981–2010 climatology (Fig. 2b). These anomalies coincided with widespread positive precipitation departures along the AR pathway, with cumulative totals exceeding 45 mm over parts of southeast Greenland, Iceland, and western Svalbard between 15 and 16 March (Fig. 2c). Cyclone back-tracking shows north-eastward progression of the system through the Greenland Sea-Fram Strait toward Svalbard and the northern Barents Sea over the subsequent four days (Fig. S3a in the Supplement). By 21 March, this migration had reorganised the pressure field around Svalbard, shifting the flow from warm, moist south-westerly advection during the AR to northerly/north-easterly cold air advection during the CAO (Fig. S3b).
3.2 Anatomy of an Arctic AR
AR cross sections using CARRA data reveal a low-level jet transporting a ∼ 2 km-deep, moisture-laden flow toward Svalbard (Fig. 3). Winds peaked near 925 hPa at > 28 m s−1 and were similarly strong above the complex terrain of NW Svalbard, where turbulent flow prompted extreme uplift and downdrafts (Fig. 3a). Turbulence was most pronounced in the lowest levels where the incident flow interacted with the mountainous terrain (Fig. 3a).
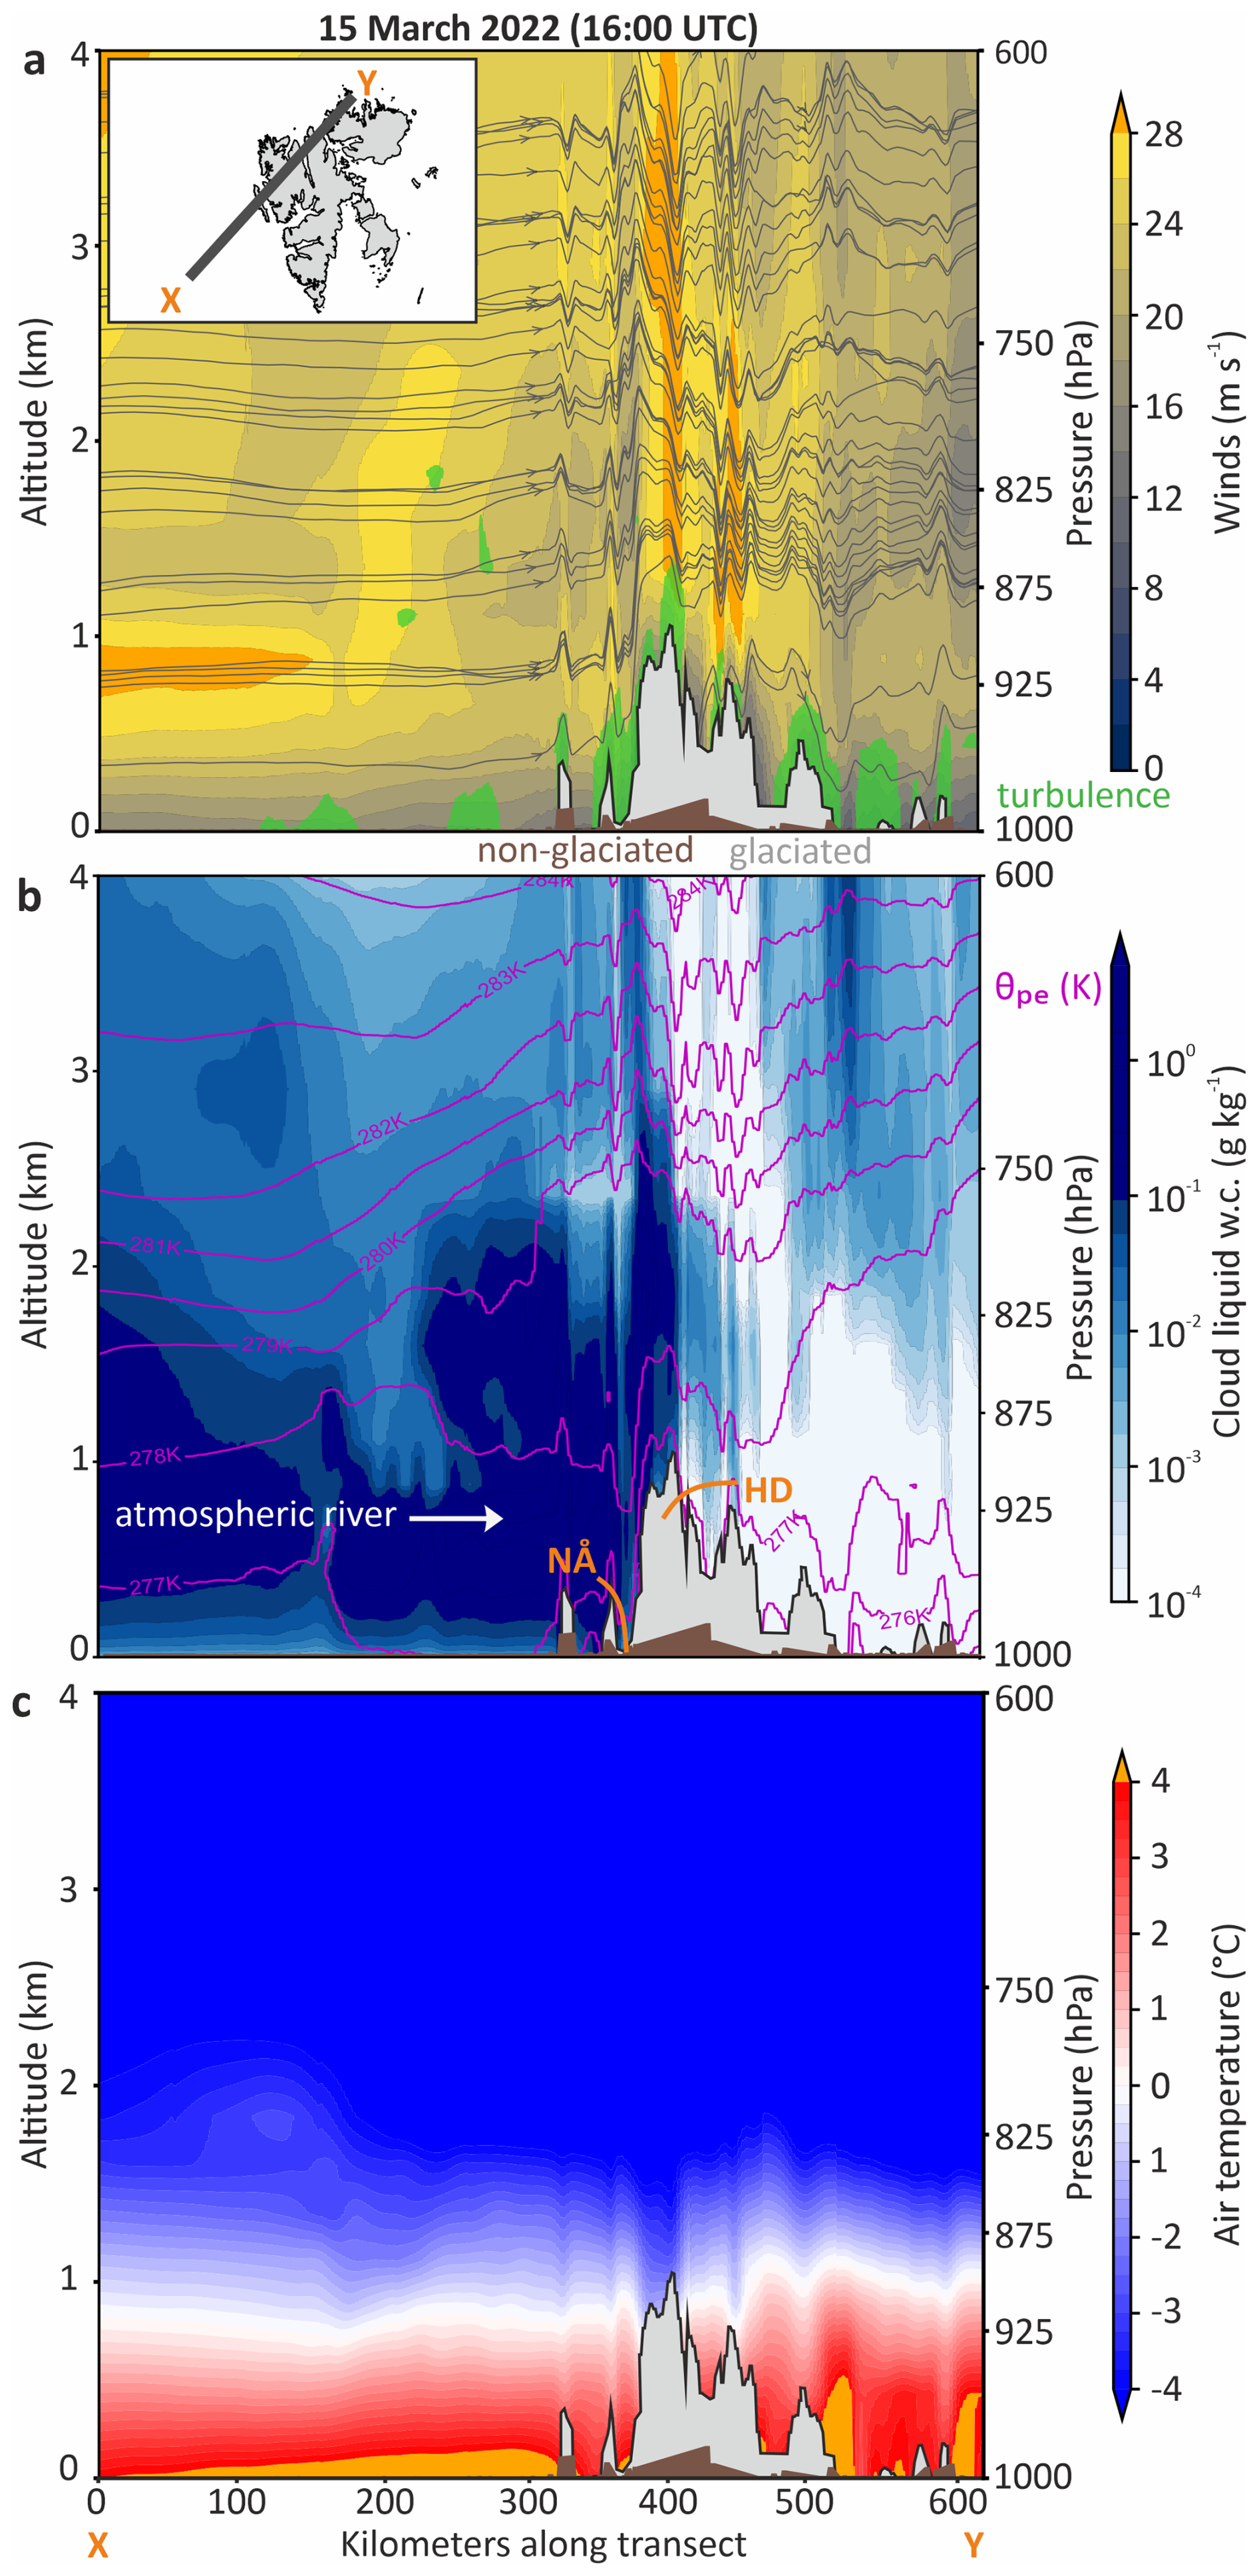
Figure 3Cross-section of the March 2022 AR. 15 March 2022 16:00 UTC CARRA (a) wind speed (shading) and streamlines (contours), with turbulence zones in green, (b) cloud liquid water content (w.c.; shading) with pseudo-adiabatic potential temperatures (θpe; magenta contours), and (c) air temperature, along the x-y transect highlighted in panel (a). The brown and grey coloured areas indicate land and glaciated areas, respectively. The approximate location of Ny-Ålesund (NÅ) and the Holtedahlfonna (HD) ice cap are indicated in (b).
Embedded within the AR was a ∼ 1.8 km-deep liquid-bearing moisture plume with cloud liquid water content (LWC) reaching 0.05 g kg−1 (Fig. 3b). Pseudo-adiabatic potential temperature (θpe) surfaces – indicating the tendency for inertial and buoyant motion – slope upward toward the terrain, indicating buoyant ascent from condensation associated with enhanced precipitation alongside terrain-forced uplift. The θpe contours exhibit repeated undulations with visually estimated horizontal wavelengths of ∼ 10–50 km, based on the spacing between successive perturbations along the CARRA cross-section. Their occurrence downstream of the steep NW Svalbard topography is consistent with orographically forced gravity waves generated as stably stratified flow interacts with the mountainous terrain. Downstream of the Holtedahlfonna ice cap (∼ 1200 m a.s.l.), cloud LWC declines sharply (Fig. 3b), indicating moisture depletion in the lee-side flow. The temperature cross section reveals a pronounced warm lower troposphere during the AR, with near-surface temperatures exceeding 4 °C with sub-freezing temperatures largely confined above ∼ 750 m a.s.l. (Fig. 3c).
Radiosondes launched every six hours from Ny-Ålesund (17 m a.s.l) capture this evolving upper-air thermodynamic structure during the AR and subsequent CAO (Fig. 4) (Maturilli, 2022). Prior to AR arrival, the atmospheric column was uniformly cold, with near-surface temperatures of ∼ −15 °C decreasing to below −60 °C by ∼ 10 km altitude (Fig. 4a). Integrated water vapour (IWV) remained low (< 3 kg m−2), consistent with the dry Arctic background state.
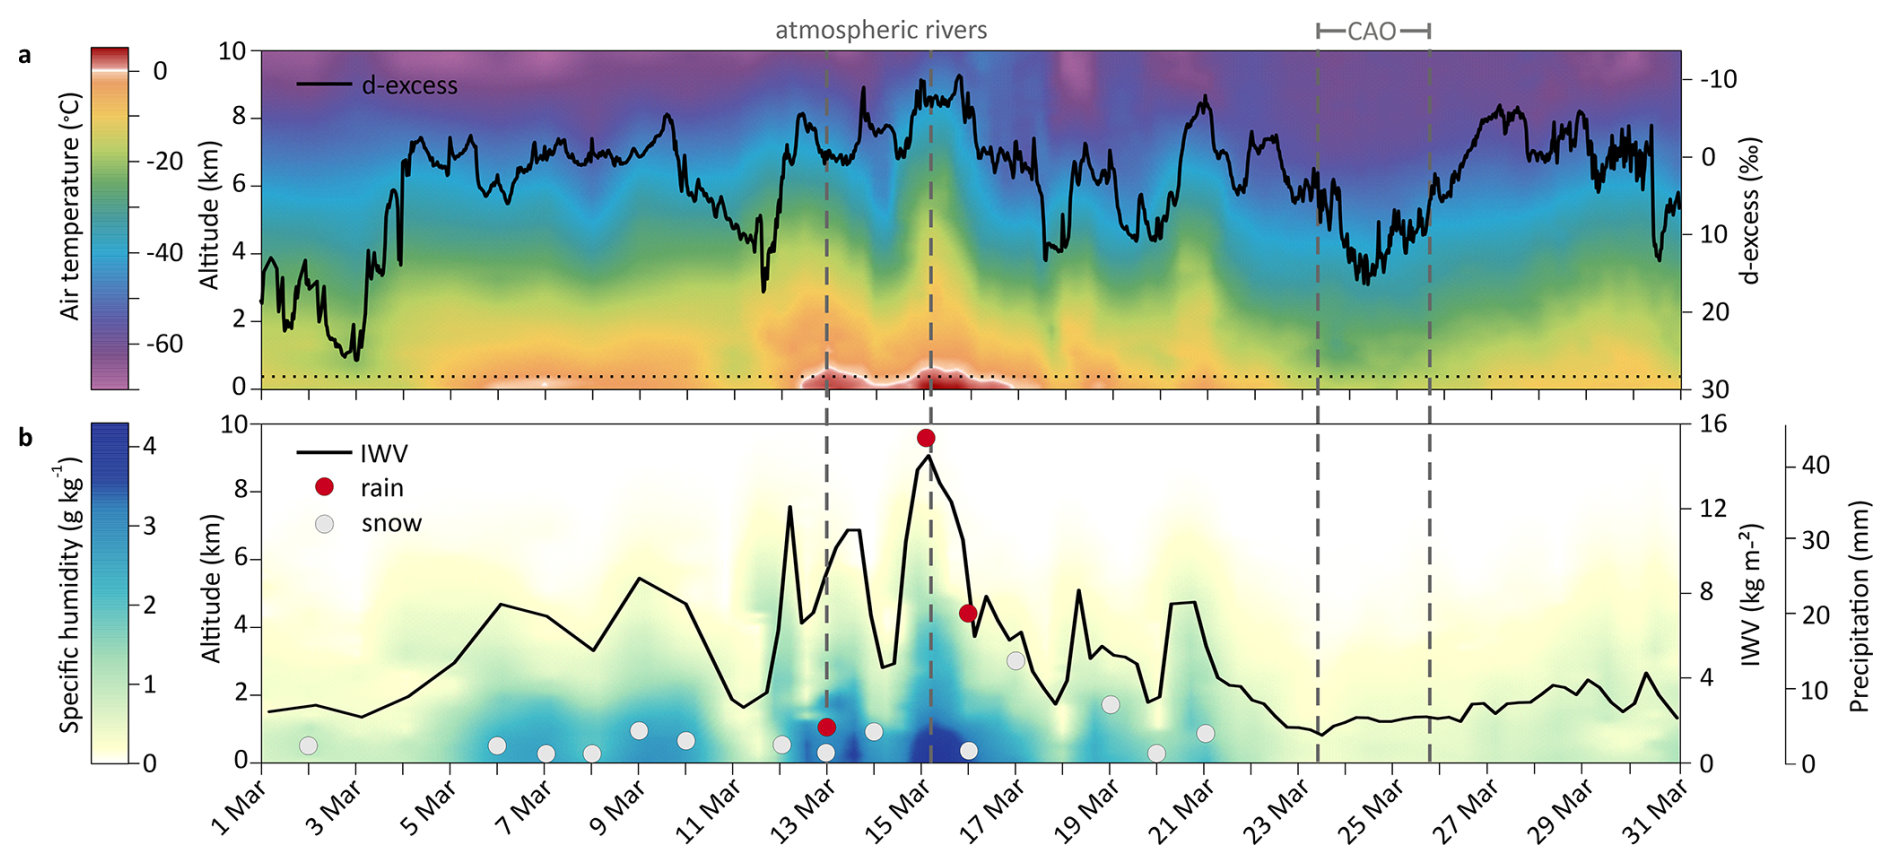
Figure 4Vertical structure of the March 2022 AR and CAO at Ny-Ålesund. (a) Interpolated radiosonde air temperature (shading) with vapour d-excess (black line; axis reversed). The horizontal dotted line marks the Zeppelin Observatory altitude; (b) specific humidity (shading) with integrated water vapour (IWV; black line) and daily precipitation (circles; rain in red, snow in grey). Soundings were launched from Ny-Ålesund (Maturilli, 2022), and the altitude axes are limited to 10 km. Vertical dashed lines indicate AR and CAO periods.
The first signature of AR influence appeared aloft around midday on 11 March, when warming initiated between ∼ 2–6 km altitude (Fig. 4a), indicating the arrival of warm maritime air overrunning the cold Arctic boundary layer. Over the following 12 h this warm anomaly deepened downward, progressively displacing the near-surface cold layer. By late 12 March, near-surface temperatures exceeded 0 °C (Fig. 4a), with above-freezing temperatures extending to ∼ 0.7 km altitude, substantially reducing the low-level lapse rate and effectively coupling warm maritime air to the surface.
Simultaneously, IWV increased rapidly and developed a double-peaked structure during 12–13 March, rising approximately four-fold from pre-AR values to maxima of 12.1 and 11.0 kg m−2 (Fig. 4b). Specific humidity profiles indicate that this increase corresponded to the arrival of the moisture plume, initially confined above ∼ 4.8 km before progressively descending into the lower troposphere. As the plume deepened, mean specific humidity within the lowest kilometre increased to ∼ 3.6 g kg−1, with the two IWV pulses indicating episodic low-level moisture delivery during the early AR phase (Fig. 4b).
The AR intensified on 15 March, producing the strongest thermodynamic and moisture anomalies of the event (Fig. 4). Near-surface temperatures reached 5.6 °C, with above-freezing conditions extending to ∼ 0.8 km altitude (Fig. 4a). IWV peaked at 14.6 kg m−2– the highest March value in the 1993–2022 radiosonde record (Maturilli, 2022) – while specific humidity exceeded ∼ 4 g kg−1 through the lowest kilometre for more than 24 h (Fig. 4b). Elevated moisture transport persisted until 16 March, coincident with extreme rainfall and low vapour d-excess measured in Ny-Ålesund (Fig. 5a–b).
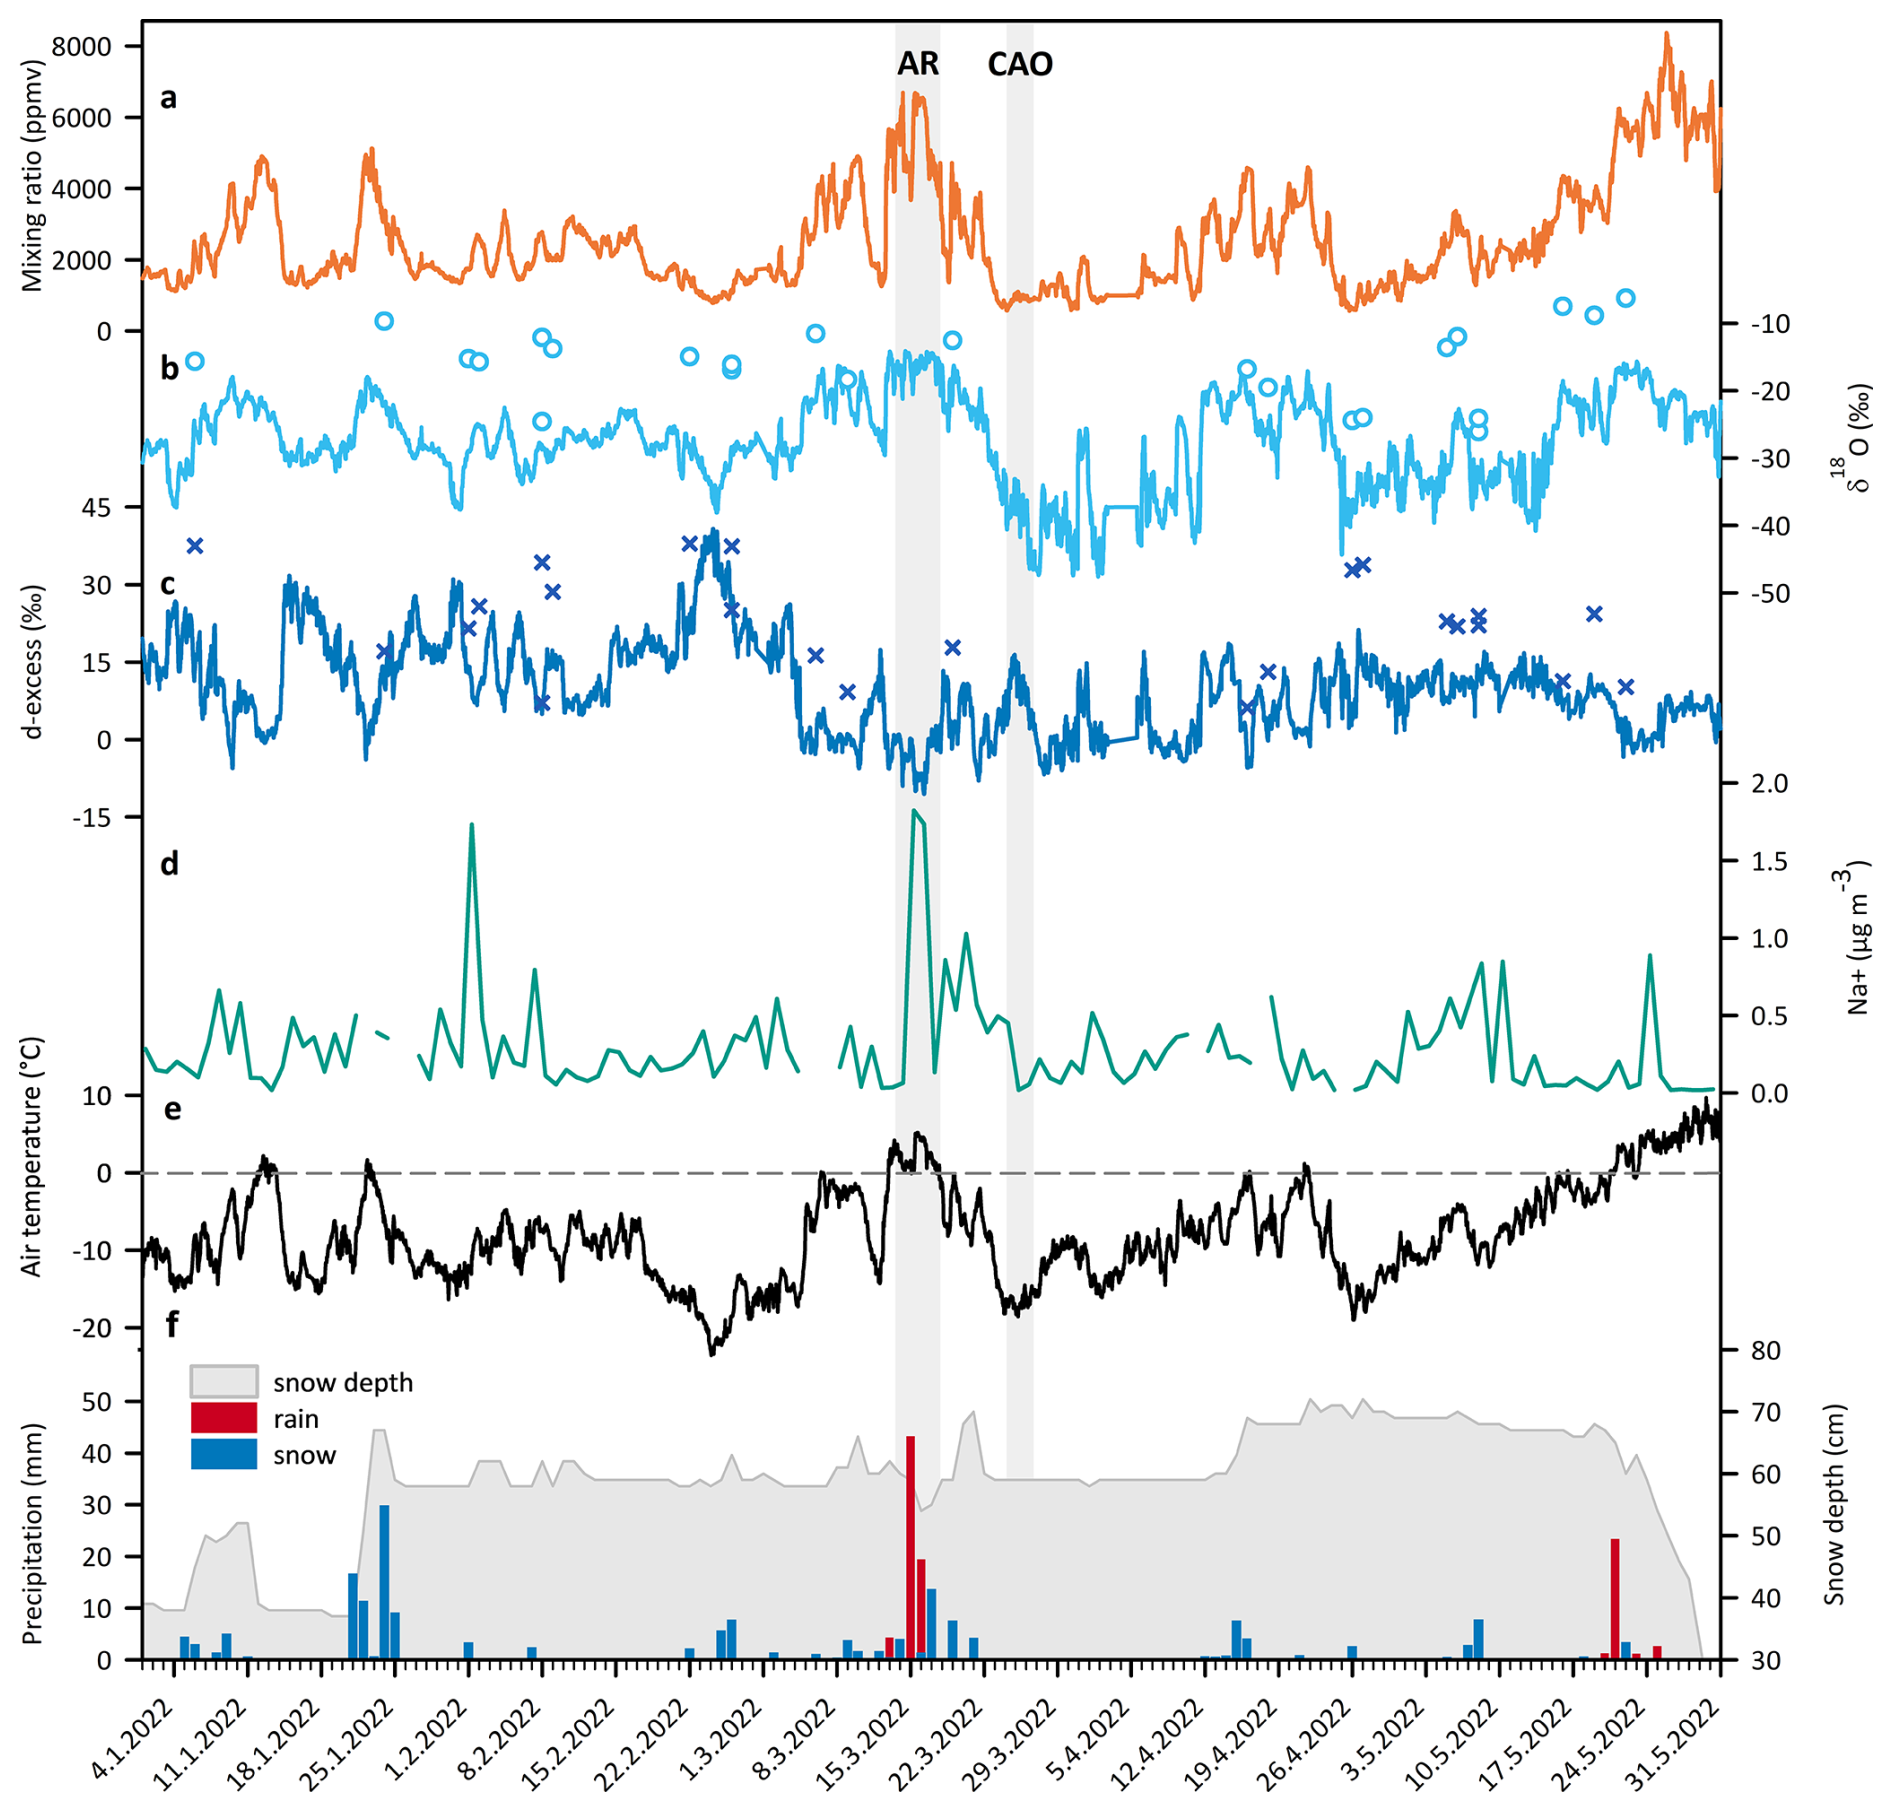
Figure 5Observations at Ny-Ålesund during winter–spring 2022. Water vapour (a) mixing ratio, (b) δ18O, (c) d-excess (5 min averages), and (d) daily sodium (Na+) aerosol concentration measured at the Zeppelin Observatory; (e) hourly 2 m air temperature, (f) daily snow depth (grey shading) and precipitation amount and phase (rain: red; snow: blue) (Champagne et al., 2024) from the Ny-Ålesund meteorological station (SN99910). Discrete snowfall isotope samples collected in Ny-Ålesund are shown as circles (δ18O) and crosses (d-excess) in (b) and (c), respectively. The mid-March AR and subsequent CAO are indicated by grey vertical shading.
From 23 March onward, radiosoundings record the transition to markedly cooler and drier conditions. The lower and mid-troposphere cooled, with near-surface temperatures falling to approximately −18 °C over the following week as the warm AR layer dissipated (Fig. 4a). IWV dropped below 1.2 kg m−2 on 24 March – below the 3rd percentile of March values in the 1993–2022 record (Maturilli, 2022) – and remained below 4 kg m−2 thereafter (Fig. 4b). This column drying coincided with rising vapour d-excess (Fig. 4a), consistent with establishment of a cold, dry Arctic air mass during the CAO.
3.3 Surface observations at Ny-Ålesund
The AR began influencing western Svalbard on 12 March 2022, triggering a sustained perturbation of near-surface atmospheric conditions (Fig. 5). Water vapour mixing ratios rose above winter baseline levels and remained elevated (> 4000 ppmv) for ∼ 120 h (12 March 16:30 UTC to 17 March 15:00 UTC). As the AR made landfall on 15 March, mixing ratios tripled from a winter baseline of 2304 ppmv to a peak of 6690 ppmv, marking the arrival of the exceptionally humid air mass (Fig. 5a).
Water vapour isotopes responded simultaneously: δ18O increased by +8.8 ‰ and δ2H by +56.1 ‰ relative to the winter baseline, reaching campaign maxima on 15 March (−14.2 ‰ and −113.4 ‰, respectively; Figs. 5b and S1). In contrast, d-excess decreased steadily from 12 March, reaching a campaign minimum of −10.5 ‰ on 16 March (Fig. 5c). Snowfall isotope samples from Ny-Ålesund broadly track the water vapour variability, with snowfall δ18O and d-excess averaging ∼ 11 ‰ higher than vapour, consistent with equilibrium condensation fractionation (Supplement Table S1). Sodium aerosol (Na+) concentrations also increased sharply as the AR made landfall, rising from background values (∼ 0.01 µg m−3)to 1.8 µg m−3 on 15–16 March (Fig. 5d).
These atmospheric anomalies were accompanied by pronounced surface meteorological changes. Daily mean 2 m air temperatures rose rapidly above freezing, reaching a record March maximum of 5.6 °C on 15 March, coincident with intense rainfall (Fig. 5e, f). A total of 43.9 mm of rain fell that day – the highest daily March rainfall at Ny-Ålesund since observations began in 1975 (Champagne et al., 2024). Snow depth decreased by ∼ 50 mm, consistent with rainfall-driven compaction and partial melt of the pre-existing snowpack (Fig. 5f).
Following the AR, conditions evolved toward a cold and dry regime characteristic of a CAO (Fig. 1b). From 21 March onward, mixing ratios declined below 1000 ppmv, while vapour δ18O and δ2H reached campaign minima on 26 March (∼ −47.5 ‰ and −380 ‰; Fig. 5a, b). Over the same period, d-excess increased by ∼ 27 ‰ relative to AR conditions (Fig. 5a–c). This transition coincided with a reversal in large-scale flow associated with cyclonic activity east of Svalbard, enhancing northerly advection of cold Arctic air across the Fram Strait (Fig. 1b). SATs fell below −18 °C and Na+ concentrations returned to near-zero levels (Fig. 5d–f). Snowfall was confined to the period immediately following the AR, with none observed during the subsequent CAO (Fig. 5f). This snowfall increased measured snow depth above pre-AR levels; however, snow depth then decreased rapidly around 21 March despite air temperatures remaining below 0 °C. This decrease coincided with a sharp increase in local 2 and 10 m wind speeds to ∼ 16 m s−1 (not shown), indicating that the reduction in measured depth most likely reflects local wind redistribution or scouring of the fresh snowpack, potentially aided by settling/compaction, rather than melt.
3.4 Precipitation phase and surface energy response
Rain-snow partitioning during the AR was governed by rapid changes in the melting level – the height at which falling snow begins to melt – derived from radiosonde wet-bulb temperature profiles (Fig. S2). The melting level rose from ∼ 100–350 m a.s.l. during the early AR phase to 585 m a.s.l. on 15 March, before collapsing to ∼ 22 m a.s.l. on 16 March as the warm maritime column broke down. This evolution closely tracked the transition from mixed-phase precipitation to rainfall and back to snowfall at Ny-Ålesund (Champagne et al., 2024) (Fig. 5f). Meteorological station observations further document the AR's progression across Svalbard, with rainfall first recorded at Hornsund and Ny-Ålesund (Fig. 6a). Peak totals occurred at Ny-Ålesund on 15 March, exceeding those at other stations by more than fivefold (Fig. 6a).
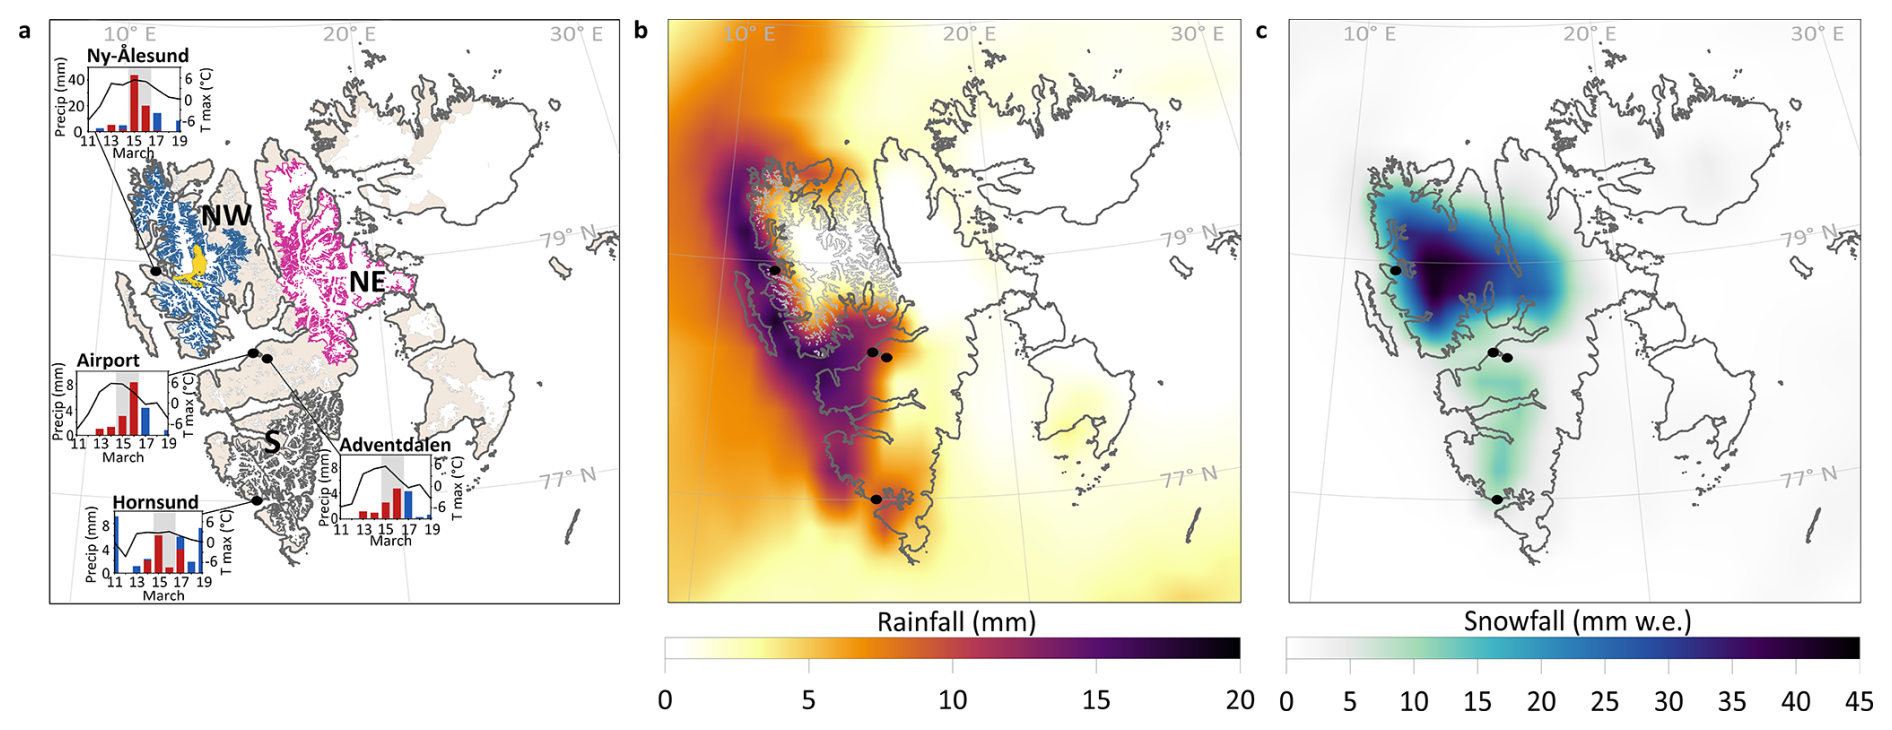
Figure 6March 2022 AR rain-snow partitioning. (a) Observed daily precipitation amount, phase (red: rain, blue: snow), and maximum air temperatures (Tmax) for 11–19 March 2022 recorded at select meteorological stations (black circles) (Norwegian Centre for Climate Services, 2022). Grey vertical shading denotes peak AR conditions. Glacier regions on Spitsbergen are indicated (NW, NE, S), with the Holtedahlfonna-Kronebreen glacier system highlighted in yellow (RGI Consortium, 2023). Total ERA5 (b) rainfall and (c) snowfall between 15–16 March 2022. The grey 585 m contour in (b) marks the radiosonde-derived melting level during the AR. Black circles indicate meteorological stations in (a). Basemaps from (Norwegian Polar Institute, 2014).
Across Svalbard, ERA5 fields for 15–16 March 2022 reveal pronounced spatial variability in precipitation magnitude and phase (Fig. 6). The AR delivered ∼ 0.7 Gt of precipitation in total, comprising ∼ 0.5 Gt snowfall and ∼ 0.2 Gt rainfall (Fig. 6b–c). Although rainfall accounted for less than one-third of the total, it extended across nearly two-thirds of glacierised terrain, primarily along western coastal margins (Fig. 6b). Snowfall was concentrated over high terrain, with mean accumulations of 30.4, 6.7 and 5.2 mm w.e. across the NW, NE and S glacier regions, respectively, and peak totals exceeding 40 mm w.e. in the NW (Fig. 6c). Over the Holtedahlfonna–Kronebreen glacier system (385 km2; 0–1441 m a.s.l.), for which seasonal mass balance data are available(WGMS, 2025), the AR delivered 42.3 mm w.e. of snowfall – equivalent to 8.3 % of the 2022 winter accumulation, offsetting its annual net mass deficit (excluding calving) by ∼ 5 %.
ERA5 data further show that the AR substantially perturbed atmospheric forcing and components of the surface energy budget across Svalbard (Figs. 7 and S4). Relative to the corresponding 15–16 March 1981–2010 baseline, IWV increased by up to 8 mm along the west coast (Fig. 7a), reaching absolute values of ∼ 13 mm on 15 March – approximately four-fold above the long-term March mean. The IWV anomalies were statistically significant (p < 0.05) across the entire archipelago. This anomalous moisture loading enhanced atmospheric emissivity, with downward longwave radiation exceeding baseline values by > 100 W m−2 across northwestern Svalbard (Fig. 7b). Mean absolute LWD reached ∼ 320 W m−2 (Fig. S4b), with statistically significant anomalies concentrated across western and central Svalbard. Total precipitation anomalies reached up to 40 mm, concentrated over high terrain in the NW glacier region and around Ny-Ålesund (Fig. 7c).
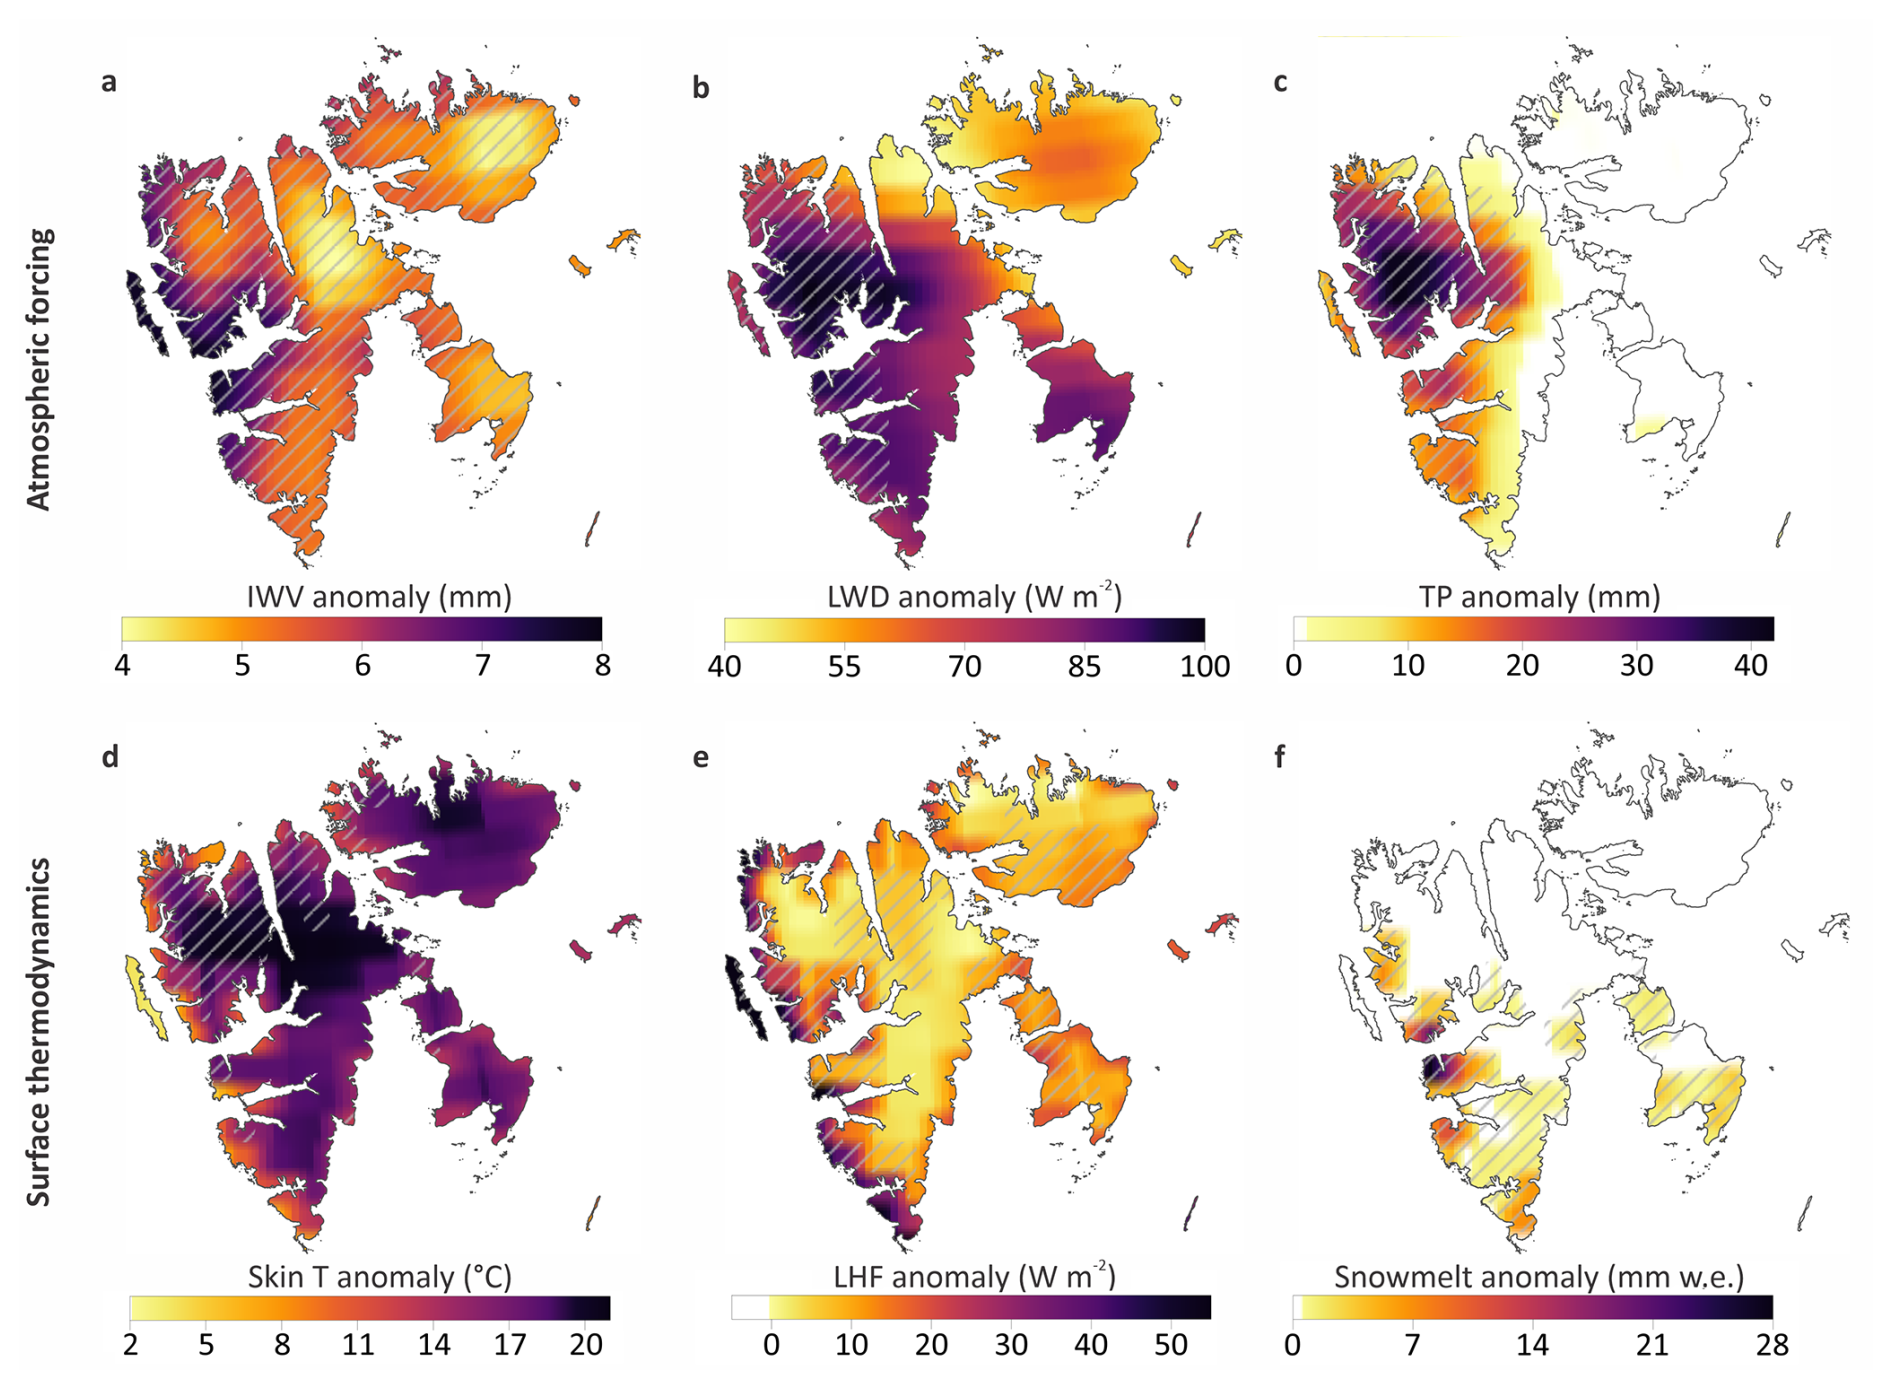
Figure 7Atmospheric and surface anomalies during the March 2022 AR. Spatial distribution of ERA5 (a) mean integrated water vapour (IWV), (b) mean downward longwave radiation (LWD), (c) total precipitation (TP), (d) mean skin temperature (T), (e) mean latent heat flux (LHF; positive downward), and (f) total snowmelt anomalies on 15–16 March 2022, relative to the 1981–2010 climatology. Hatching indicates grid cells where the 15–16 March 2022 anomalies are statistically significant at the 95 % level.
Surface thermodynamic anomalies were strongly elevation-dependent. Skin temperature anomalies reached +6 °C at Ny-Ålesund and up to +20 °C over Holtedahlfonna and parts of the NE region (Fig. 7d). Mean absolute skin temperatures of 2 °C are evident across coastal regions of Svalbard (Fig. S4d), with the largest statistically significant anomalies mainly in NW Spitsbergen. Turbulent exchange intensified, with latent heat flux anomalies up to ∼ 60 W m−2 along the western coastal margin, decreasing with elevation (Fig. 7e). Despite these pronounced atmospheric and surface perturbations, statistically significant snowmelt was largely confined to low-elevation western coastal zones and across the south, where absolute two-day totals reached ∼ 30 mm w.e. in west-central Spitsbergen and ∼ 6 mm w.e. around Ny-Ålesund. Snow surfaces above ∼ 500 m a.s.l. exhibited no detectable snow melt response (Fig. 7f). In total, net snowmelt across Svalbard was ∼ 0.04 Gt between 15–16 March, 62 % of which impacted glaciers, with the remainder affecting seasonally snow-covered but ice-free terrain.
The March 2022 AR ranks among the most intense winter atmospheric intrusions observed in the High Arctic (Ebell et al., 2025). The 43.9 mm of liquid precipitation recorded at Ny-Ålesund in a single day represents a fourfold increase of the upper-decile AR-associated total (10 mm; 2017–2021) and is nearly an order of magnitude greater than the median winter AR rainfall (5 mm), placing this event at the extreme end of documented Svalbard ARs. Notably, this event occurred in the same month as an extraordinary AR-driven heatwave in East Antarctica (Wille et al., 2024a, b), highlighting the capacity of meridional moisture transport to generate polar extremes in both hemispheres.
4.1 Moisture transport and geochemical evidence
Such exceptional high-latitude winter rainfall requires not only anomalous moisture flux but sustained poleward transport that retains high column humidity. Our vapour isotope record captures distinct pulses of Atlantic moisture marked by elevated δ18O, negative d-excess, and a near-meteoric slope, indicating high-humidity marine evaporation and – crucially – limited progressive rainout during the poleward transport (Bailey et al., 2021; Bonne et al., 2015; Leroy-Dos Santos et al., 2020). The concurrent spike in marine Na+ aerosol further supports sea-salt entrainment from marine boundary-layer sources along the North Atlantic–Greenland Sea AR corridor (Figs. 1 and 2), consistent with direct Atlantic influence and minimal upstream wet scavenging of sea-salt aerosols during transport (Yamagata et al., 2009). Because the March 2022 AR occurred in winter, its enriched isotope signal stands out against a depleted cold-season baseline; comparable summer AR signals may be harder to distinguish from the seasonal isotope maximum. Moreover, the systematic offset we observe between vapour and snowfall isotopes is in line with vapour-to-condensate fractionation, suggesting that the AR isotope anomaly was transferred into deposited snow and may therefore be captured by the snowpack/firn record. Similar AR-related winter δ18O enrichment has been observed in the firn record at a cold, high-elevation site with limited melt influence on the Greenland ice sheet (Bailey and Hubbard, 2025), demonstrating that such events can be preserved under favourable conditions. In Svalbard, however, meltwater percolation can modify firn δ18O signals and may also redistribute soluble aerosol species (e.g., Na+), complicating preservation in lower-elevation glacier and ice-field records (Spolaor et al., 2024). Where preserved, enriched isotope layers accompanied by marine aerosol markers such as Na+ may therefore archive extreme marine moisture transport and AR landfalls, rather than simply recording local paleotemperature.
The subsequent CAO provides the contrasting isotopic end-member of this coupled AR–CAO sequence (Fig. S3). As the cyclone migrated north-eastward, south-westerly advection was replaced by cold north-easterly flow. This produced depleted vapour isotopes with a shallower δ18O–δ2H slope, consistent with stronger kinetic fractionation during air-mass transformation across the sea ice–open water boundary in the Fram Strait under cold, lower-humidity conditions (Brunello et al., 2023; Mix et al., 2019). Na+ also returned to near-background concentrations (∼ 0–0.1 µg m−3), indicating replacement of the Atlantic marine aerosol plume by a distinct Arctic air mass. The low Na+ values are consistent with transport over more sea-ice-covered regions and reduced open-ocean marine boundary-layer influence, limiting sea-salt aerosol entrainment during the CAO.
Cross sections show a low-level jet transporting a deep moisture plume toward Svalbard, with cloud liquid water concentrated below ∼ 2–3 km and depleted only in the lee of the NW glaciated region through orographic precipitation. This lower-tropospheric structure is comparable to radiosonde-observed Antarctic AR landfalls, where specific humidity reaches ∼ 4 g kg−1 and strong low-level jets drive enhanced moisture transport (Gorodetskaya et al., 2020). Yet in contrast to Antarctic coastal ARs where humidity maxima and low-level jets may be vertically decoupled, the Svalbard AR showed a more vertically coherent lower-tropospheric moisture-wind anomaly that was primarily modified by NW Svalbard's steep topography at landfall, producing uplift, local flow variability, turbulence, and lee-side cloud/moisture depletion (Fig. 3). Together, these observations indicate that the March 2022 AR delivered a moisture-rich Atlantic air mass to Svalbard with limited rainout and depletion during transport, maintaining high atmospheric humidity and priming the surface for strong radiative forcing.
4.2 Surface energy balance and cryospheric response
This atmospheric perturbation reorganised Svalbard's winter surface energy balance through three reinforcing mechanisms. First, enhanced IWV increased atmospheric emissivity, driving a strong rise in downward longwave radiation that dominated net energy input while shortwave forcing remained minimal at this latitude in late winter. Second, near-saturated AR conditions generated positive latent heat flux anomalies, enhancing downward transfer of latent energy and augmenting longwave-driven warming. Third, rapid elevation of the melting level redistributed this energy vertically across the glacier system, exposing low-elevation snowpacks to rainfall while warming higher-elevation surfaces. Cross-sectional temperature structure confirms a shallow warm maritime layer confined to the lowest ∼ 700–900 m, intersecting the peak of Svalbard's glacier hypsometry (∼ 450 m a.s.l.) while the highest ice caps remained below freezing. Skin temperature responded rapidly, with anomalies reaching up to +20 °C over the NW glacierised region. Together, these coupled perturbations eroded the winter thermal deficit and drove significant snowmelt despite the event's winter timing (Fig. 7).
The AR generated a mean daily snowmelt of 0.45 mm d−1 across Svalbard, exceeding the long-term March climatology (0.001 mm d−1) by more than two orders of magnitude. Simultaneously, ∼ 60 % of Svalbard's glacierised area received ≥ 1 mm of rainfall. Yet independent snow pit observations at Ny-Ålesund show that local snow water equivalent increased(Salzano et al., 2023), demonstrating that much of the liquid input was retained within the snowpack. Where water entered this cold late-winter snowpack, percolation and refreezing would densify near-surface layers and form internal ice horizons (Mikkelsen et al., 2016), releasing latent heat and modifying snowpack thermal structure, thereby contributing to firn densification (Möller and Kohler, 2018; Van Pelt et al., 2016; Van Pelt and Kohler, 2015). This interpretation is consistent with the observed ∼ 50 mm reduction in snowpack depth (Fig. 5), indicative of compaction, densification and internal refreezing rather than substantial meltwater runoff. Ice layers documented in the snow stratigraphy of nearby Austre Lovénbreen (∼ 8 km southwest of Ny-Ålesund) further support the occurrence of local melt and refreezing processes across low-elevation glacier surfaces (Bernard and Friedt, 2025). Notably, the same study reports earlier seasonal ice exposure relative to 2023, demonstrating that winter ROS episodes can precondition glacier surfaces for earlier ablation onset despite short-term liquid retention. Although much of this liquid input was temporarily retained within the snowpack, the ∼ 0.2 Gt of rainfall and ∼ 0.04 Gt of snowmelt nonetheless pre-loaded the hydrological system, storing freshwater with the potential to influence runoff timing and magnitude during the subsequent melt season (Kleber et al., 2025).
Across the archipelago, accumulation dominated the mass response: the 0.5 Gt of AR-fuelled snowfall represents ∼ 3 %–4 % of Svalbard's mean annual total ice mass loss (Sasgen et al., 2024) and ∼ 7 % of its surface mass balance deficit (Schuler et al., 2020). These results demonstrate that a single late-winter AR can deliver sufficient snowfall over a two-day period to offset a measurable fraction of the annual net mass loss, consistent with observations in Greenland and Antarctica (Bailey and Hubbard, 2025; Gorodetskaya et al., 2014). Together with the limited contemporaneous melt and observed retention of rainfall within the snowpack, this indicates that the event likely made a net positive contribution to Svalbard's 2022 surface mass balance. Yet this event was not merely exceptional in magnitude, but dynamically efficient with a strong but nuanced impact on glacier mass balance (Hubbard et al., 2000). The rapid elevation of the melting level by several hundred metres tipped ∼ 60 % of Svalbard's glacierised area across the winter snow-rain threshold. Although the March 2022 AR demonstrates the capacity of seasonal snow and firn to buffer substantial liquid input through refreezing and internal storage – with refreezing contributing ∼ 34 % of Svalbard's mass gain (Möller and Kohler, 2018) – the effectiveness of these processes depends critically on snowpack thickness, density profile, and thermal state, while the associated structural changes may reduce pore space and permeability and thereby limit future meltwater storage. The longer-term mass-balance effect is therefore less certain than the positive contribution inferred for 2022. Moreover, Svalbard's glacier hypsometry peaks at ∼ 450 m a.s.l (Noël et al., 2020), just below the melting level reached during the AR, meaning that even modest thermodynamic shifts in melt-elevation will redistribute precipitation phase across a disproportionately large area of the glacierised surface.
Since 1979, winter IVT into this Atlantic sector of the Arctic has increased (Rinke et al., 2019), and projections indicate continued intensification and increasing frequency of winter ARs (Nellikkattil et al., 2023; Thaker et al., 2025). In a sensitive maritime Arctic climate increasingly poised near 0 °C, stronger ARs will shift winter precipitation from snow to rainfall (Bintanja and Andry, 2017), reducing the buffering role of snow and firn (Möller and Kohler, 2018) and accelerating Svalbard's runoff and glacier mass loss to proglacial and marine systems (Kopec et al., 2024). These phase transitions also destabilise snowpack structure (Sobota et al., 2020; Vickers et al., 2025) and tundra ecosystems (Aalto et al., 2026; Hiltunen et al., 2022; Niittynen et al., 2020), amplifying ROS hazards (Eckerstorfer and Christiansen, 2012). Svalbard therefore provides a natural testbed for AR-driven winter climate transitions in a rapidly warming Arctic, with the March 2022 event offering a process-level analogue for how continued Arctic amplification is shifting high-latitude winters toward increasingly rain-dominated extremes – despite their capacity to episodically replenish glacier mass.
Atmospheric water vapour isotope data are available under a Creative Commons Attribution 4.0 International license at https://doi.org/10.5281/zenodo.18888750 (Bailey et al., 2026). Ny-Ålesund radiosonde measurements are available at https://doi.org/10.1594/PANGAEA.944406 (Maturilli, 2022). Surface meteorological observations from Svalbard stations are available at https://seklima.met.no/ (last access: 17 February 2026). Sodium aerosol data measured at the Zeppelin Observatory are provided by NILU at https://ebas.nilu.no/ (last access: 12 February 2026). Integrated vapour transport (IVT) data are available at https://doi.org/10.20383/103.0935 (Mo, 2024b). Glacier mass balance data are available through the World Glacier Monitoring Service at https://wgms.ch/latest-glacier-mass-balance-data/ (last access: 28 November 2025). Glacier outlines are provided by the Randolph Glacier Inventory at https://www.glims.org/RGI/ (last access: 12 February 2026). ERA5 and CARRA data are available from the Copernicus Climate Data Store at https://cds.climate.copernicus.eu/ (last access: 23 June 2026). MODIS Satellite images are available at https://www.earthdata.nasa.gov/ (last access: 11 March 2026). Svalbard basemaps are available from the Norwegian Polar Institute at https://doi.org/10.21334/NPOLAR.1990.44CA8C2A (Norwegian Polar Institute, 2017). The base maps in Fig. 2 derive from the ETOPO5 gridded data set available at NOAA National Centers for Environmental Information here https://doi.org/10.25921/fd45-gt74 (NOAA National Centers for Environmental Information, 2022).
The supplement related to this article is available online at https://doi.org/10.5194/tc-20-4421-2026-supplement.
Conceptualisation: HB and AH. Methodology: HB, JEB, BGK, VH, JMW, DVD, and AH. Formal analysis: HB and JEB. Investigation: HB, JEB, and AH. Resources: HB, JMW, HM, DVD and AH. Data Curation: HB, BGK, VH, JK, and DVD. Writing – Original Draft: HB. Writing – Development, Review & Revision: HB, AH, JEB, and HM. Visualisation: HB and JEB. Funding acquisition: HB, JMW, and AH. Project administration: HB.
The contact author has declared that none of the authors has any competing interests.
Publisher's note: Copernicus Publications remains neutral with regard to jurisdictional claims made in the text, published maps, institutional affiliations, or any other geographical representation in this paper. The authors bear the ultimate responsibility for providing appropriate place names. Views expressed in the text are those of the authors and do not necessarily reflect the views of the publisher.
This study was supported by the Water, Energy and Environmental Engineering Research Unit at the University of Oulu, and contributes to the Research Council of Finland-funded Digital Waters (DIWA) Flagship. Water vapour isotope measurements were supported by the UArctic Chair positions held by AH and JMW, and by the University of Oulu and UiT – The Arctic University of Norway. We thank personnel of Ny-Ålesund Research Station – Sverdrup for assistance with collecting fresh snow samples, and the FARLAB at the University of Bergen for their isotopic analysis. We also thank staff at the Zeppelin Observatory for maintaining the vapour isotope instrumentation and supporting long-term atmospheric observations.
This research has been supported by the Research Council of Finland (grant nos. 348536 and 363970) and the Norges Forskningsråd (grant no. 342265). AH gratefully acknowledges support through the Otto Malm Foundation (grant no. 13678).
This paper was edited by Xavier Fettweis and reviewed by Jonathan Wille and one anonymous referee.
Aalto, J., Kämäräinen, M., Rantanen, M., Niittynen, P., Phoenix, G. K., Lenoir, J., Maclean, I., and Luoto, M.: A new era of bioclimatic extremes in the terrestrial Arctic, Sci. Adv., 12, eadw5698, https://doi.org/10.1126/sciadv.adw5698, 2026.
Adusumilli, S., Fish, M., Fricker, H. A., and Medley, B.: Atmospheric River Precipitation Contributed to Rapid Increases in Surface Height of the West Antarctic Ice Sheet in 2019, Geophys. Res. Lett., 48, https://doi.org/10.1029/2020GL091076, 2021.
Akers, P. D., Kopec, B. G., Klein, E. S., Bailey, H., and Welker, J. M.: The Pivotal Role of Evaporation in Lake Water Isotopic Variability Across Space and Time in a High Arctic Periglacial Landscape, Water Resour. Res., 60, e2023WR036121, https://doi.org/10.1029/2023WR036121, 2024.
Ala-Aho, P., Welker, J. M., Bailey, H., Pedersen, S. H., Kopec, B., Klein, E., Mellat, M., Mustonen, K.-R., Noor, K., and Marttila, H.: Arctic snow isotope hydrology: A comparative snow-water vapor study, Atmosphere-Basel, 12, https://doi.org/10.3390/atmos12020150, 2021.
Bailey, H. and Hubbard, A.: Snow Mass Recharge of the Greenland Ice Sheet Fueled by Intense Atmospheric River, Geophys. Res. Lett., 52, e2024GL110121, https://doi.org/10.1029/2024GL110121, 2025.
Bailey, H., Hubbard, A., Klein, E. S., Mustonen, K. R., Akers, P. D., Marttila, H., and Welker, J. M.: Arctic sea-ice loss fuels extreme European snowfall, Nat. Geosci., 14, 283–288, https://doi.org/10.1038/S41561-021-00719-Y, 2021.
Bailey, H., Kopec, B., Marttila, H., Hubbard, A., and Welker, J.: Ny-Ålesund Atmospheric Water Vapour Isotope Data (1 Jan–31 May 2022), Zenodo [data set], https://doi.org/10.5281/zenodo.18888750, 2026.
Bailey, H. L., Kaufman, D. S., Sloane, H. J., Hubbard, A. L., Henderson, A. C. G., Leng, M. J., Meyer, H., and Welker, J. M.: Holocene atmospheric circulation in the central North Pacific: A new terrestrial diatom and δ18O dataset from the Aleutian Islands, Quaternary Sci. Rev., 194, https://doi.org/10.1016/j.quascirev.2018.06.027, 2018.
Bernard, É. and Friedt, J. M.: Did a global heatwave have a lasting impact on the snowpack and the annual glacier mass balance? The example of a small glacial basin observatory in the High Arctic (Brøgger Peninsula, Spitsbergen), Arct. Antarct. Alp. Res., 57, https://doi.org/10.1080/15230430.2025.2479899, 2025.
Bintanja, R. and Andry, O.: Towards a rain-dominated Arctic, Nat. Clim. Change, 7, 263–267, https://doi.org/10.1038/nclimate3240, 2017.
Bonne, J.-L., Steen-Larsen, H. C., Risi, C., Werner, M., Sodemann, H., Lacour, J.-L., Fettweis, X., Cesana, G., Delmotte, M., Cattani, O., Vallelonga, P., Kjaer, H. A., Clerbaux, C., Sveinbjörnsdóttir, Á. E., and Masson-Delmotte, V.: The summer 2012 Greenland heat wave: In situ and remote sensing observations of water vapor isotopic composition during an atmospheric river event, J. Geophys. Res.-Atmos., 120, 2970–2989, https://doi.org/10.1002/2014JD022602, 2015.
Box, J. E., Wehrlé, A., van As, D., Fausto, R. S., Kjeldsen, K. K., Dachauer, A., Ahlstrøm, A. P., and Picard, G.: Greenland Ice Sheet Rainfall, Heat and Albedo Feedback Impacts From the Mid-August 2021 Atmospheric River, Geophys. Res. Lett., 49, https://doi.org/10.1029/2021GL097356, 2022.
Box, J. E., Nielsen, K. P., Yang, X., Niwano, M., Wehrlé, A., van As, D., Fettweis, X., Køltzow, M. A. Ø., Palmason, B., Fausto, R. S., van den Broeke, M. R., Huai, B., Ahlstrøm, A. P., Langley, K., Dachauer, A., and Noël, B.: Greenland ice sheet rainfall climatology, extremes and atmospheric river rapids, Meteorol. Appl., 30, e2134, https://doi.org/10.1002/met.2134, 2023.
Brunello, C. F., Meyer, H., Mellat, M., Casado, M., Bucci, S., Dütsch, M., and Werner, M.: Contrasting Seasonal Isotopic Signatures of Near-Surface Atmospheric Water Vapor in the Central Arctic During the MOSAiC Campaign, J. Geophys. Res.-Atmos., 128, e2022JD038400, https://doi.org/10.1029/2022JD038400, 2023.
Champagne, O., Zolina, O., Dedieu, J.-P., Wolff, M., and Jacobi, H.-W.: Artificial Trends or Real Changes? Investigating Precipitation Records in Ny-Ålesund, Svalbard, J. Hydrometeorol., 25, 809–825, https://doi.org/10.1175/JHM-D-23-0182.1, 2024.
Croghan, D., Pedron, S. A., Redman, Z. C., Kopec, B. G., Klein, E. S., Hubbard, A., Tomco, P. L., Feldman, G. C., Czimczik, C. I., and Welker, J. M.: Western Greenland Ice Sheet-Land-Ocean Interactions: Near-Shore Dissolved Organic Carbon 14C Ages and Composition in Eastern Baffin Bay, J. Geophys. Res.-Biogeo., 130, e2024JG008705, https://doi.org/10.1029/2024JG008705, 2025.
Davies-Jones, R.: An Efficient and Accurate Method for Computing the Wet-Bulb Temperature along Pseudoadiabats, Mon. Weather Rev., 136, 2764–2785, https://doi.org/10.1175/2007MWR2224.1, 2008.
Ebell, K., Buhren, C., Gierens, R., Chellini, G., Lauer, M., Walbröl, A., Dahlke, S., Krobot, P., and Mech, M.: Impact of weather systems on observed precipitation at Ny-Ålesund (Svalbard), Atmos. Chem. Phys., 25, 7315–7342, https://doi.org/10.5194/acp-25-7315-2025, 2025.
Eckerstorfer, M. and Christiansen, H. H.: Meteorology, Topography and Snowpack Conditions causing Two Extreme Mid-Winter Slush and Wet Slab Avalanche Periods in High Arctic Maritime Svalbard, Permafrost Periglac., 23, 15–25, https://doi.org/10.1002/ppp.734, 2012.
Geyman, E. C., J. J. van Pelt, W., Maloof, A. C., Aas, H. F., and Kohler, J.: Historical glacier change on Svalbard predicts doubling of mass loss by 2100, Nature, 601, 374–379, https://doi.org/10.1038/s41586-021-04314-4, 2022.
Gorodetskaya, I. V., Tsukernik, M., Claes, K., Ralph, M. F., Neff, W. D., and Van Lipzig, N. P. M.: The role of atmospheric rivers in anomalous snow accumulation in East Antarctica, Geophys. Res. Lett., 41, 6199–6206, https://doi.org/10.1002/2014GL060881, 2014.
Gorodetskaya, I. V., Silva, T., Schmithüsen, H., and Hirasawa, N.: Atmospheric River Signatures in Radiosonde Profiles and Reanalyses at the Dronning Maud Land Coast, East Antarctica, Adv. Atmos. Sci., 37, 455–476, https://doi.org/10.1007/S00376-020-9221-8, 2020.
Gorodetskaya, I. V., Durán-Alarcón, C., González-Herrero, S., Clem, K. R., Zou, X., Rowe, P., Rodriguez Imazio, P., Campos, D., Leroy-Dos Santos, C., Dutrievoz, N., Wille, J. D., Chyhareva, A., Favier, V., Blanchet, J., Pohl, B., Cordero, R. R., Park, S.-J., Colwell, S., Lazzara, M. A., Carrasco, J., Gulisano, A. M., Krakovska, S., Ralph, F. M., Dethinne, T., and Picard, G.: Record-high Antarctic Peninsula temperatures and surface melt in February 2022: a compound event with an intense atmospheric river, NPJ Clim. Atmos. Sci., 6, https://doi.org/10.1038/s41612-023-00529-6, 2023.
Hegyi, B. M. and Taylor, P. C.: The Unprecedented 2016–2017 Arctic Sea Ice Growth Season: The Crucial Role of Atmospheric Rivers and Longwave Fluxes, Geophys. Res. Lett., 45, 5204–5212, https://doi.org/10.1029/2017GL076717, 2018.
Hersbach, H., Bell, B., Berrisford, P., Hirahara, S., Horányi, A., Muñoz-Sabater, J., Nicolas, J., Peubey, C., Radu, R., Schepers, D., Simmons, A., Soci, C., Abdalla, S., Abellan, X., Balsamo, G., Bechtold, P., Biavati, G., Bidlot, J., Bonavita, M., De Chiara, G., Dahlgren, P., Dee, D., Diamantakis, M., Dragani, R., Flemming, J., Forbes, R., Fuentes, M., Geer, A., Haimberger, L., Healy, S., Hogan, R. J., Hólm, E., Janisková, M., Keeley, S., Laloyaux, P., Lopez, P., Lupu, C., Radnoti, G., de Rosnay, P., Rozum, I., Vamborg, F., Villaume, S., and Thépaut, J. N.: The ERA5 global reanalysis, Q. J. Roy. Meteor. Soc., https://doi.org/10.1002/qj.3803, 2020.
Hiltunen, T. A., Stien, A., Väisänen, M., Ropstad, E., Aspi, J. O., and Welker, J. M.: Svalbard reindeer winter diets: Long-term dietary shifts to graminoids in response to a changing climate, Glob. Change Biol., 28, 7009–7022, https://doi.org/10.1111/GCB.16420, 2022.
Hubbard, A., Willis, I., Sharp, M., Mair, D., Nienow, P., Hubbard, B., and Blatter, H.: Glacier mass-balance determination by remote sensing and high-resolution modelling, J. Glaciol., 46, 491–498, https://doi.org/10.3189/172756500781833016, 2000.
Kirbus, B., Schirmacher, I., Klingebiel, M., Schäfer, M., Ehrlich, A., Slättberg, N., Lucke, J., Moser, M., Müller, H., and Wendisch, M.: Thermodynamic and cloud evolution in a cold-air outbreak during HALO-(AC)3: quasi-Lagrangian observations compared to the ERA5 and CARRA reanalyses, Atmos. Chem. Phys., 24, 3883–3904, https://doi.org/10.5194/acp-24-3883-2024, 2024.
Kleber, G. E., Magerl, L., Turchyn, A. V., Schloemer, S., Trimmer, M., Zhu, Y., and Hodson, A.: Proglacial methane emissions driven by meltwater and groundwater flushing in a high-Arctic glacial catchment, Biogeosciences, 22, 659–674, https://doi.org/10.5194/bg-22-659-2025, 2025.
Kopec, B. G., Klein, E. S., Feldman, G. C., Pedron, S. A., Bailey, H., Causey, D., Hubbard, A., Marttila, H., and Welker, J. M.: Arctic Freshwater Sources and Ocean Mixing Relationships Revealed With Seawater Isotopic Tracing, J. Geophys. Res.-Oceans, 129, e2023JC020583, https://doi.org/10.1029/2023JC020583, 2024.
Lapointe, F., Karmalkar, A. V., Bradley, R. S., Retelle, M. J., and Wang, F.: Climate extremes in Svalbard over the last two millennia are linked to atmospheric blocking, Nat. Commun., 15, 4432, https://doi.org/10.1038/s41467-024-48603-8, 2024.
Leroy-Dos Santos, C., Masson-Delmotte, V., Casado, M., Fourré, E., Steen-Larsen, H. C., Maturilli, M., Orsi, A., Berchet, A., Cattani, O., Minster, B., Gherardi, J., and Landais, A.: A 4.5 Year-Long Record of Svalbard Water Vapor Isotopic Composition Documents Winter Air Mass Origin, J. Geophys. Res.-Atmos., 125, e2020JD032681, https://doi.org/10.1029/2020JD032681, 2020.
Madsen, M. V., Steen‐Larsen, H. C., Hörhold, M., Box, J., Berben, S. M. P., Capron, E., Faber, A. ‐K., Hubbard, A., Jensen, M. F., Jones, T. R., Kipfstuhl, S., Koldtoft, I., Pillar, H. R., Vaughn, B. H., Vladimirova, D., and Dahl‐Jensen, D.: Evidence of Isotopic Fractionation During Vapor Exchange Between the Atmosphere and the Snow Surface in Greenland, J. Geophys. Res.-Atmos., 124, 2932–2945, https://doi.org/10.1029/2018JD029619, 2019.
Mattingly, K. S., Mote, T. L., and Fettweis, X.: Atmospheric River Impacts on Greenland Ice Sheet Surface Mass Balance, J. Geophys. Res.-Atmos., 123, 8538–8560, https://doi.org/10.1029/2018JD028714, 2018.
Mattingly, K. S., Mote, T. L., Fettweis, X., As, D. V. A. N., Tricht, K. V. A. N., Lhermitte, S., Pettersen, C., and Fausto, R. S.: Strong Summer Atmospheric Rivers Trigger Greenland Ice Sheet Melt through Spatially Varying Surface Energy Balance and Cloud Regimes, J. Climate, 33, 6809–6832, https://doi.org/10.1175/JCLI-D-19-0835.1, 2020.
Maturilli, M.: High resolution radiosonde measurements from station Ny-Ålesund (2022-03), PANGAEA [data set], https://doi.org/10.1594/PANGAEA.944406, 2022.
Mattingly, K. S., Turton, J. V., Wille, J. D., Noël, B., Fettweis, X., Rennermalm, Å. K., and Mote, T. L.: Increasing extreme melt in northeast Greenland linked to foehn winds and atmospheric rivers, Nat. Commun., 14, https://doi.org/10.1038/s41467-023-37434-8, 2023.
Mellat, M., Bailey, H., Mustonen, K. R., Marttila, H., Klein, E. S., Gribanov, K., Bret-Harte, M. S., Chupakov, A. V., Divine, D. V., Else, B., Filippov, I., Hyöky, V., Jones, S., Kirpotin, S. N., Kroon, A., Markussen, H. T., Nielsen, M., Olsen, M., Paavola, R., Pokrovsky, O. S., Prokushkin, A., Rasch, M., Raundrup, K., Suominen, O., Syvänperä, I., Vignisson, S. R., Zarov, E., and Welker, J. M.: Hydroclimatic Controls on the Isotopic (δ18O, δ2 H, d-excess) Traits of Pan-Arctic Summer Rainfall Events, Front. Earth Sci. (Lausanne), 9, 367, https://doi.org/10.3389/FEART.2021.651731, 2021.
Mikkelsen, A. B., Hubbard, A., MacFerrin, M., Box, J. E., Doyle, S. H., Fitzpatrick, A., Hasholt, B., Bailey, H. L., Lindbäck, K., and Pettersson, R.: Extraordinary runoff from the Greenland ice sheet in 2012 amplified by hypsometry and depleted firn retention, The Cryosphere, 10, 1147–1159, https://doi.org/10.5194/tc-10-1147-2016, 2016.
Mix, H. T., Reilly, S. P., Martin, A., and Cornwell, G.: Evaluating the Roles of Rainout and Post-Condensation Processes in a Landfalling Atmospheric River with Stable Isotopes in Precipitation and Water Vapor, Atmosphere, 10, 86, https://doi.org/10.3390/ATMOS10020086, 2019.
Mo, R.: EDARA: An ERA5-based Dataset for Atmospheric River Analysis, Scientific Data, 11, 900, https://doi.org/10.1038/s41597-024-03679-1, 2024a.
Mo, R.: An ERA5-based Dataset for Atmospheric River Analysis (EDARA): Multi-decade numerical and graphical catalogues, Federated Research Data Repository [data set], https://doi.org/10.20383/103.0935, 2024b.
Möller, M. and Kohler, J.: Differing Climatic Mass Balance Evolution Across Svalbard Glacier Regions Over 1900–2010, Front. Earth Sci. (Lausanne), 6, 369364, https://doi.org/10.3389/feart.2018.00128, 2018.
Nellikkattil, A. B., Lee, J. Y., Guan, B., Timmermann, A., Lee, S. S., Chu, J. E., and Lemmon, D.: Increased amplitude of atmospheric rivers and associated extreme precipitation in ultra-high-resolution greenhouse warming simulations, Commun. Earth Environ., 4, 313, https://doi.org/10.1038/s43247-023-00963-7, 2023.
Niittynen, P., Heikkinen, R. K., and Luoto, M.: Decreasing snow cover alters functional composition and diversity of Arctic tundra, P. Natl. Acad. Sci. USA, 117, 21480–21487, https://doi.org/10.1073/pnas.2001254117, 2020.
NILU: EBAS database, Norwegian Institute for Air Research, https://ebas.nilu.no/ (last access: 12 February 2026), 2023.
NOAA National Centers for Environmental Information: ETOPO 2022 15 Arc-Second Global Relief Model, NOAA National Centers for Environmental Information [data set], https://doi.org/10.25921/fd45-gt74, 2022.
Noël, B., Jakobs, C. L., van Pelt, W. J. J., Lhermitte, S., Wouters, B., Kohler, J., Hagen, J. O., Luks, B., Reijmer, C. H., van de Berg, W. J., and van den Broeke, M. R.: Low elevation of Svalbard glaciers drives high mass loss variability, Nat. Commun., 11, 4597, https://doi.org/10.1038/s41467-020-18356-1, 2020.
Norwegian Centre for Climate Services: Observations and weather statistics – Seklima, https://seklima.met.no/observations/ (last access: 17 February 2026), 2022.
Norwegian Polar Institute: Kartdata Svalbard 1:100 000 (S100 Kartdata)/Map Data, Norwegian Polar Institute [data set], https://doi.org/10.21334/NPOLAR.2014.645336C7, 2014.
Norwegian Polar Institute: S100 Raster. Topografisk rasterkart for Svalbard, Norwegian Polar Institute [data set], https://doi.org/10.21334/NPOLAR.1990.44CA8C2A, 2017.
NygÅrd, T., Vihma, T., Birnbaum, G., Hartmann, J., King, J., Lachlan-Cope, T., Ladkin, R., Lüpkes, C., and Weiss, A.: Validation of eight atmospheric reanalyses in the Antarctic Peninsula region, Q. J. Roy. Meteor. Soc., 142, 684–692, https://doi.org/10.1002/qj.2691, 2016.
Payne, A. E., Demory, M. E., Leung, L. R., Ramos, A. M., Shields, C. A., Rutz, J. J., Siler, N., Villarini, G., Hall, A., and Ralph, F. M.: Responses and impacts of atmospheric rivers to climate change, Nat. Rev. Earth Environ., 1, 143–157, https://doi.org/10.1038/s43017-020-0030-5, 2020.
Peeters, B., Pedersen, Å. Ø., Loe, L. E., Isaksen, K., Veiberg, V., Stien, A., Kohler, J., Gallet, J. C., Aanes, R., and Hansen, B. B.: Spatiotemporal patterns of rain-on-snow and basal ice in high Arctic Svalbard: detection of a climate-cryosphere regime shift, Environ. Res. Lett., 14, 015002, https://doi.org/10.1088/1748-9326/aaefb3, 2019.
Pereira Freitas, G., Kopec, B., Adachi, K., Krejci, R., Heslin-Rees, D., Yttri, K. E., Hubbard, A., Welker, J. M., and Zieger, P.: Contribution of fluorescent primary biological aerosol particles to low-level Arctic cloud residuals, Atmos. Chem. Phys., 24, 5479–5494, https://doi.org/10.5194/acp-24-5479-2024, 2024.
van Pelt, W. and Frank, T.: New glacier thickness and bed topography maps for Svalbard, The Cryosphere, 19, 1–17, https://doi.org/10.5194/tc-19-1-2025, 2025.
Van Pelt, W. and Kohler, J.: Modelling the long-term mass balance and firn evolution of glaciers around Kongsfjorden, Svalbard, J. Glaciol., 61, 731–744, https://doi.org/10.3189/2015JoG14J223, 2015.
Van Pelt, W. J. J., Pohjola, V. A., and Reijmer, C. H.: The changing impact of snow conditions and refreezing on the mass balance of an idealized svalbard glacier, Front. Earth Sci. (Lausanne), 4, 227264, https://doi.org/10.3389/feart.2016.00102, 2016.
Rantanen, M., Karpechko, A. Y., Lipponen, A., Nordling, K., Hyvärinen, O., Ruosteenoja, K., Vihma, T., and Laaksonen, A.: The Arctic has warmed nearly four times faster than the globe since 1979, Commun. Earth Environ., 3, 168, https://doi.org/10.1038/s43247-022-00498-3, 2022.
RGI Consortium: Randolph Glacier Inventory - A Dataset of Global Glacier Outlines. (NSIDC-0770, Version 7), Boulder, Colorado USA, NASA National Snow and Ice Data Center Distributed Active Archive Center [data set], https://doi.org/10.5067/F6JMOVY5NAVZ, 2023.
Rinke, A., Segger, B., Crewell, S., Maturilli, M., Naakka, T., NygÅrd, T., Vihma, T., Alshawaf, F., Dick, G., Wickert, J., and Keller, J.: Trends of Vertically Integrated Water Vapor over the Arctic during 1979–2016: Consistent Moistening All Over?, J. Climate, 32, 6097–6116, https://doi.org/10.1175/JCLI-D-19-0092.1, 2019.
Salzano, R., Cerrato, R., Scoto, F., Spolaor, A., Valentini, E., Salvadore, M., Esposito, G., Sapio, S., Taramelli, A., and Salvatori, R.: Detection of Winter Heat Wave Impact on Surface Runoff in a Periglacial Environment (Ny-Ålesund, Svalbard), Remote Sens. (Basel), 15, https://doi.org/10.3390/rs15184435, 2023.
Sasgen, I., Steinhoefel, G., Kasprzyk, C., Matthes, H., Westermann, S., Boike, J., and Grosse, G.: Atmosphere circulation patterns synchronize pan-Arctic glacier melt and permafrost thaw, Commun. Earth Environ., 5, 375, https://doi.org/10.1038/s43247-024-01548-8, 2024.
Scholz, S. R. and Lora, J. M.: Atmospheric rivers cause warm winters and extreme heat events, Nature, 636, 640–646, https://doi.org/10.1038/s41586-024-08238-7, 2024.
Schuler, T. V., Kohler, J., Elagina, N., Hagen, J. O. M., Hodson, A. J., Jania, J. A., Kääb, A. M., Luks, B., Małecki, J., Moholdt, G., Pohjola, V. A., Sobota, I., and Van Pelt, W. J. J.: Reconciling Svalbard Glacier Mass Balance, Front. Earth Sci. (Lausanne), 8, 523648, https://doi.org/10.3389/feart.2020.00156, 2020.
Schyberg, H., Yang, X., Køltzow, M. A. Ø., Amstrup, B., Bakketun, Å., Bazile, E., Bojarova, J., Box, J. E., Dahlgren, P., Hagelin, S., Homleid, M., Horányi, A., Høyer, J., Johansson, Å., Killie, M. A., Körnich, H., Le Moigne, P., Lindskog, M., Manninen, T., Nielsen Englyst, P., Nielsen, K. P., Olsson, E., Palmason, B., Peralta Aros, C., Randriamampianina, R., Samuelsson, P., Stappers, R., Støylen, E., Thorsteinsson, S., Valkonen, T., and Wang, Z. Q.: Arctic regional reanalysis on single levels from 1991 to present, Copernicus Climate Change Service (C3S) Climate Data Store (CDS) [data set], https://doi.org/10.24381/cds.713858f6, 2020.
Sobota, I., Weckwerth, P., and Grajewski, T.: Rain-On-Snow (ROS) events and their relations to snowpack and ice layer changes on small glaciers in Svalbard, the high Arctic, J. Hydrol. (Amst.), 590, 125279, https://doi.org/10.1016/J.JHYDROL.2020.125279, 2020.
Spolaor, A., Scoto, F., Larose, C., Barbaro, E., Burgay, F., Bjorkman, M. P., Cappelletti, D., Dallo, F., de Blasi, F., Divine, D., Dreossi, G., Gabrieli, J., Isaksson, E., Kohler, J., Martma, T., Schmidt, L. S., Schuler, T. V., Stenni, B., Turetta, C., Luks, B., Casado, M., and Gallet, J.-C.: Climate change is rapidly deteriorating the climatic signal in Svalbard glaciers, The Cryosphere, 18, 307–320, https://doi.org/10.5194/tc-18-307-2024, 2024.
Thaker, R., Vavrus, S. J., Shields, C. A., DuVivier, A. K., Maclennan, M., Holland, M. M., and Landrum, L.: Arctic Atmospheric Rivers in a Changing Climate and the Impacts on Sea Ice, J. Geophys. Res.-Atmos., 130, e2024JD042521, https://doi.org/10.1029/2024JD042521, 2025.
Vickers, H., Mooney, P., and Landgren, O.: Recent and projected changes in rain-on-snow event characteristics across Svalbard, The Cryosphere, 19, 6907–6926, https://doi.org/10.5194/tc-19-6907-2025, 2025.
Walbröl, A., Michaelis, J., Becker, S., Dorff, H., Ebell, K., Gorodetskaya, I., Heinold, B., Kirbus, B., Lauer, M., Maherndl, N., Maturilli, M., Mayer, J., Müller, H., Neggers, R. A. J., Paulus, F. M., Röttenbacher, J., Rückert, J. E., Schirmacher, I., Slättberg, N., Ehrlich, A., Wendisch, M., and Crewell, S.: Contrasting extremely warm and long-lasting cold air anomalies in the North Atlantic sector of the Arctic during the HALO-(𝒜𝒞)3 campaign, Atmos. Chem. Phys., 24, 8007–8029, https://doi.org/10.5194/acp-24-8007-2024, 2024.
Wang, Z., Ding, Q., Wu, R., Ballinger, T. J., Guan, B., Bozkurt, D., Nash, D., Baxter, I., Topál, D., Li, Z., Huang, G., Chen, W., Chen, S., Cao, X., and Chen, Z.: Role of atmospheric rivers in shaping long term Arctic moisture variability, Nat. Commun., 15, 5505, https://doi.org/10.1038/s41467-024-49857-y, 2024.
Wedum, A. E., Pettersen, C., Guy, H., Gallagher, M. R., Shupe, M. D., and Mattingly, K. S.: Impacts of Atmospheric Rivers in Central Greenland: Snowfall, Clouds, and Atmospheric State, J. Geophys. Res.-Atmos., 131, e2025JD044309, https://doi.org/10.1029/2025JD044309, 2026.
WGMS: Fluctuations of Glaciers (FoG) Database, World Glacier Monitoring Service (WGMS), https://doi.org/10.5904/WGMS-FOG-2016-08, 2025.
Wille, J. D., Alexander, S. P., Amory, C., Baiman, R., Barthélemy, L., Bergstrom, D. M., Berne, A., Binder, H., Blanchet, J., Bozkurt, D., Bracegirdle, T. J., Casado, M., Choi, T., Clem, K. R., Codron, F., Datta, R., Battista, S. Di, Favier, V., Francis, D., Fraser, A. D., Fourré, E., Garreaud, R. D., Genthon, C., Gorodetskaya, I. V., González-Herrero, S., Heinrich, V. J., Hubert, G., Joos, H., Kim, S.-J., King, J. C., Kittel, C., Landais, A., Lazzara, M., Leonard, G. H., Lieser, J. L., Maclennan, M., Mikolajczyk, D., Neff, P., Ollivier, I., Picard, G., Pohl, B., Ralph, F. M., Rowe, P., Schlosser, E., Shields, C. A., Smith, I. J., Sprenger, M., Trusel, L., Udy, D., Vance, T., Vignon, É., Walker, C., Wever, N., and Zou, X.: The Extraordinary March 2022 East Antarctica “Heat” Wave. Part I: Observations and Meteorological Drivers, J. Climate, 37, 757–778, https://doi.org/10.1175/JCLI-D-23-0175.1, 2024a.
Wille, J. D., Alexander, S. P., Amory, C., Baiman, R., Barthélemy, L., Bergstrom, D. M., Berne, A., Binder, H., Blanchet, J., Bozkurt, D., Bracegirdle, T. J., Casado, M., Choi, T., Clem, K. R., Codron, F., Datta, R., Di Battista, S., Favier, V., Francis, D., Fraser, A. D., Fourré, E., Garreaud, R. D., Genthon, C., Gorodetskaya, I. V., González-Herrero, S., Heinrich, V. J., Hubert, G., Joos, H., Kim, S. J., King, J. C., Kittel, C., Landais, A., Lazzara, M., Leonard, G. H., Lieser, J. L., Maclennan, M., Mikolajczyk, D., Neff, P., Ollivier, I., Picard, G., Pohl, B., Ralph, F. M., Rowe, P., Schlosser, E., Shields, C. A., Smith, I. J., Sprenger, M., Trusel, L., Udy, D., Vance, T., Vignon, É., Walker, C., Wever, N., and Zou, X.: The Extraordinary March 2022 East Antarctica “Heat” Wave. Part II: Impacts on the Antarctic Ice Sheet, J. Climate, 37, 779–799, https://doi.org/10.1175/JCLI-D-23-0176.1, 2024b.
Yamagata, S., Kobayashi, D., Ohta, S., Murao, N., Shiobara, M., Wada, M., Yabuki, M., Konishi, H., and Yamanouchi, T.: Properties of aerosols and their wet deposition in the arctic spring during ASTAR2004 at Ny-Alesund, Svalbard, Atmos. Chem. Phys., 9, 261–270, https://doi.org/10.5194/acp-9-261-2009, 2009.
Zhang, P., Chen, G., Ting, M., Ruby Leung, L., Guan, B., and Li, L.: More frequent atmospheric rivers slow the seasonal recovery of Arctic sea ice, Nat. Clim. Change, 13, 266–273, https://doi.org/10.1038/s41558-023-01599-3, 2023.