
the Creative Commons Attribution 4.0 License.
the Creative Commons Attribution 4.0 License.
 | 07 Aug 2026
Glacier surges on James Ross Island, Antarctica, and their relationship with climate
Benjamin J. Davison
Andrew J. Sole
Gregoire Guillet
Douglas I. Benn
Jonathan Kingslake
Jeremy C. Ely
Stephen J. Livingstone
Christopher D. Stringer
Jonathan L. Carrivick
Anna E. Hogg
Although the Antarctic Peninsula has a similar climate to that of other regions hosting surge-type glaciers, only one glacier surge has been previously observed in this region. We examined ice surface velocity, elevation and terminus position changes of Antarctic Peninsula glaciers to identify glacier surges. This revealed only four surges from three glaciers, all on James Ross Island. Gourdon Glacier surged from 2005 to 2007 then again from 2013 to 2018, Kotick Glacier surged from 2013 to 2017 and Whisky Glacier surged from 2020 to 2024. All four surges were characterised by significant advances in glacier terminus position and, for the latter three surges where observations are more abundant, at least an order-of-magnitude speed-up accompanied by ice surface elevation gain in the terminal zone and drawdown of ice from above, as each surge progressed. The landform record and historical imagery suggest additional surges of Kotick Glacier and Gourdon Glacier may have occurred in the second half of the 20th century. Reanalyses, reconstructions and observations of air temperature suggest that atmospheric warming since 1940 has increasingly exposed these and neighbouring glaciers on the northern tip of the Antarctic Peninsula and its surrounding islands to conditions that are typical of surge-type glaciers globally. Climate projections indicate that future warming will expose more glaciers on the Peninsula to climatic conditions conducive to surging until the mid-20th century, after which the surge-conducive area remains steady under Shared Socioeconomic Pathway (SSP) 2-4.5 and declines under SSP5-8.5. This suggests that surges on the Antarctic Peninsula may become more common over the coming decades, motivating continued monitoring.
- Article
(12912 KB) - Full-text XML
-
Supplement
(22266 KB) - BibTeX
- EndNote


Glaciers on the Antarctic Peninsula have undergone large changes in ice motion and geometry on seasonal to decadal timescales that are driven by a range of atmospheric and oceanic processes. Notable glacier dynamic changes have included the retreat, disintegration and loss of ice shelves principally due to rising air temperature (Cook and Vaughan, Rott et al., 1996; Doake and Vaughan, 1991, Cooper, 1997, MacAyeal et al., 2003; Rack and Rott, 2004, Braun et al., 2009) and the consequent short-lived (approximately one year) acceleration, thinning then long-term (decadal) deceleration of their tributary glaciers (Rignot et al., 2004; Scambos et al., 2004; Wuite et al., 2015; Rott et al., 2018; Seehaus et al., 2018). Following their response to the disintegration of the Larsen-B Ice Shelf in 2002, several glaciers in the Larsen-B Embayment underwent a second phase of acceleration in 2022. This renewed speed-up was linked to the evacuation of 11-year-old landfast sea ice, which occurred during a period of anomalously high air temperatures and strong offshore winds (Ochwat et al., 2024; Surawy-Stepney et al., 2024; Sun et al., 2023). On the east coast of the Antarctic Peninsula, atmospheric rivers can drive extreme melt events (Gorodetskaya et al., 2023) even during (austral) winter (Kuipers Munneke et al., 2018). Surface meltwater access to the ice bed may cause short-lived (i.e. lasting less than two weeks) grounded ice acceleration (Tuckett et al., 2019), although this is debated and surface-to-bed meltwater connections through grounded ice have yet to be demonstrated (Rott et al., 2020; Tuckett et al., 2020). Some glaciers, particularly those along the west coast, undergo notable speed-ups during the (austral) summer (Wallis et al., 2023a; Boxall et al., 2022), which in many cases closely follow changes in glacier terminus position, although the drivers remain debated (Boxall et al., 2024). Many glaciers along the west coast have undergone substantial retreat since at least the 1980s (Cook et al., 2005; Cook and Vaughan, 2010; Cook et al., 2016) and exhibited widespread acceleration due to warm ocean water incursions (Hogg et al., 2017) particularly since 2020 (Wallis et al., 2023b; Davison et al., 2024). Thus, Antarctic Peninsula glaciers display a wide range of dynamic behaviours due to their summertime exposure to positive air temperatures, contrasting oceanic settings on the east coast compared to the west coast, significant changes to ice shelf extent and associated buttressing, and variable sea ice conditions.
Surge-type glaciers are characterised by phases of rapid ice flow and advance that are separated by much longer periods of quiescence, during which ice flow is typically an order of magnitude slower than the surge phase (Jiskoot, 2011; Guillet et al., 2025). Many theories seeking to explain the timing and mechanism for glacier surging have been proposed (Kamb et al., 1985; Fowler et al., 2001; Murray et al., 2003; Dunse et al., 2015). The enthalpy balance theory for glacier surging proposes that all surge cycles reflect imbalances between the rates that heat and water (enthalpy) are produced at, and are evacuated from, glacier beds (Benn et al., 2019a, 2023; Terleth et al., 2024). This model is consistent with clustering of surge behaviour in regions with climatic conditions intermediate between cold/dry and warm/humid end members; under intermediate climatic conditions, frictional heating from ice flow can increase enthalpy too fast to be balanced by slow evacuation processes such as heat conduction through cold ice, but too slow to sustain fast processes, such as meltwater evacuation through efficient subglacial conduits (Sevestre and Benn, 2015; Guillet et al., 2025). As a result, glaciers oscillate between fast and slow modes of ice flow in order to achieve steady-state mass balance over multi-annual timescales. In the enthalpy balance model of surging, glacier geometry and physical setting play a secondary but important role in dictating the distribution of surge-type glaciers, meaning that climate conditions alone are not expected to be prognostic of surge occurrence – many glaciers exposed to conditions typical of surge-type glacier settings do not surge, presumably because their geometry or underlying geology permit steady-state mass and enthalpy fluxes (Benn et al., 2019a, 2023).
Based on glacial geomorphology, Carrivick et al. (2012) questioned why no surge-type behaviour seemed to occur on James Ross Island (JRI), off the north-east coast of the Antarctic Peninsula, and Sevestre and Benn (2015) postulated that glacier surging could occur on the Antarctic Peninsula given that the post-2000 climatic conditions were similar to those observed at other surge-type glaciers globally. Recognition that parts of the Antarctic Peninsula experience a climate typical of surge-type glaciers was reiterated in a more recent review (Lovell et al., 2026). One surge of Kotick Glacier on JRI has been identified based on an observed tripling of ice velocity in 2015 along with frontal thickening and advance (Stringer et al., 2025).
Here, we present satellite observations of three glaciers on JRI that show each glacier has surged at least once since 2000. We visually interpret the geomorphological record and glacier terminus position change visible in satellite and aerial imagery to provide evidence of surging in the 20th century and discuss the behaviour of these glaciers in the context of the globally-defined optimal climatic envelope for surge-type glaciers (Sevestre and Benn, 2015; Guillet et al., 2025).
We used existing (Gardner et al., 2025) and new measurements of ice surface velocity across the Antarctic Peninsula from 1985 to 2025 to identify potential surging behaviour. Candidate surges were confirmed where possible using elevation change and terminus position change measurements (Cook et al., 2005). The combination of these measurements allowed us to characterise surges from three glaciers – Kotick Glacier, Gourdon Glacier and Whisky Glacier – on JRI (Fig. 1). The quality and comprehensiveness of the observations generally improved over time as more satellite images became available, which could have resulted in missed surging behaviour prior to, or early in, the observational record. To identify potential 20th century surging behaviour, we supplemented our measurements with visual interpretation of glacial geomorphology, ice margin position and ice surface characteristics using space- and airborne imagery. Finally, we placed the observations of surging behaviour in the context of climatic changes over JRI and the wider region from 1940 to 2150 using ERA5 reanalyses and CMIP6 projections under moderate (Shared Socioeconomic Pathway (SSP) 2-4.5) and extreme (SSP5-8.5) warming scenarios.
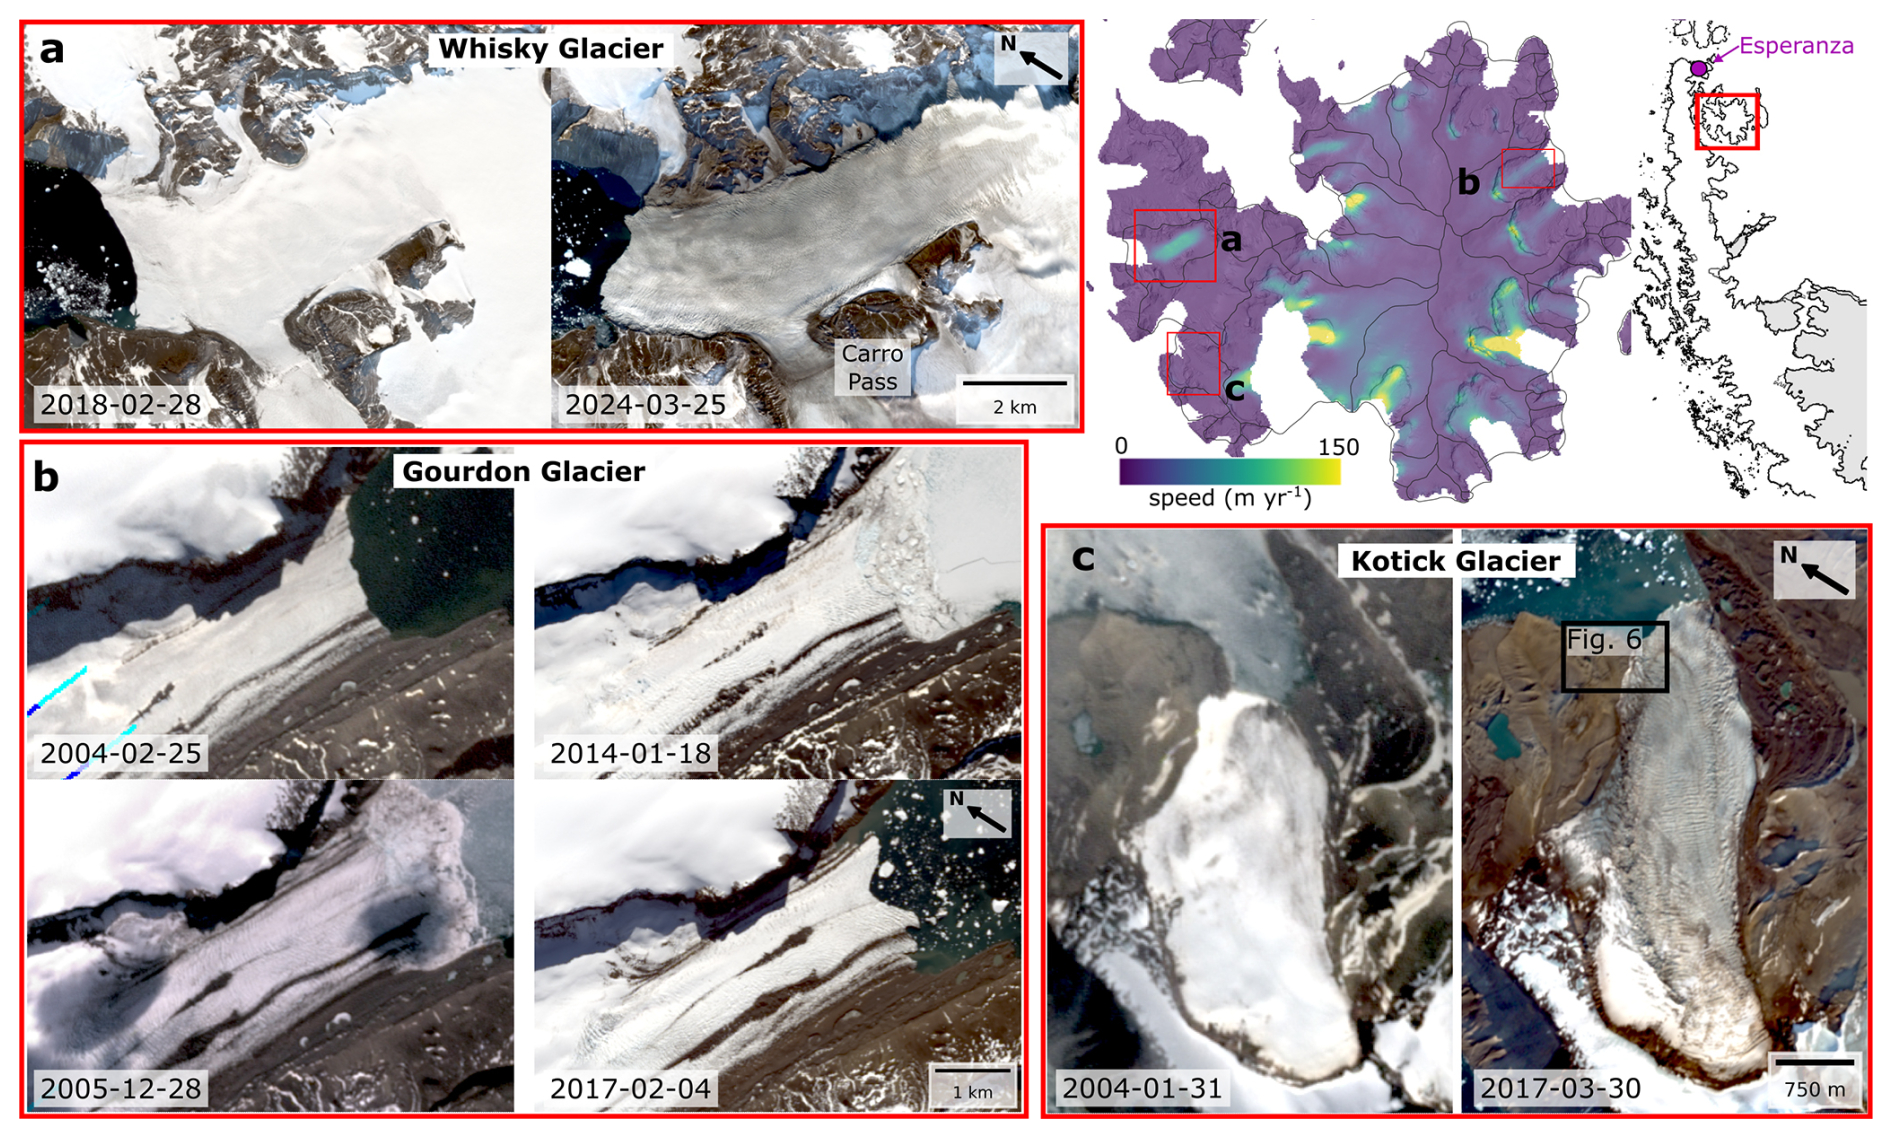
Figure 1Study area and overview of terminus position change at (a) Whisky Glacier, (b) Gourdon Glacier, and (c) Kotick Glacier. The satellite images in (a), (b) and (c) labelled 2018-02-28, 2024-03-25 and 2017-03-30 are true-colour Sentinel-2 images; those labelled 2014-01-18 and 2017-02-04 are true-colour Landsat 8 images; the remainder are true-colour pan-sharpened Landsat 7 images. The upper right panel shows the 2014 to 2025 average ice surface speed on James Ross Island, overlaid on a 10 m Reference Elevation Model of Antarctica (REMA) hillshade (Howat et al., 2022a), with the locations of panels (a)–(c) marked and glacier basins (Cook et al., 2014) delineated in black. The inset map shows the outline of the Antarctic Peninsula (Gerrish et al., 2024) with ice shelves (Mouginot et al., 2017) shaded grey and Esperanza Station labelled in magenta. Sentinel-2 data courtesy of ESA Copernicus. Landsat 7 and 8 data courtesy of USGS/NASA. REMA data courtesy of the Polar Geospatial Center.
2.1 Ice velocity
Ice velocity was estimated from feature and speckle tracking of Landsat 8 and 9 (January 2013 to present) and Sentinel-2 (January 2016 to present) optical image pairs, and Sentinel-1a (April 2014 to present), Sentinel-1b (October 2016 to December 2021) and Sentinel-1c (December 2024 to present) Interferometric Wide swath mode Single-Look Complex Synthetic Aperture Radar (SAR) amplitude image pairs. We supplement our feature tracking with velocity estimates derived from Landsat 7 image pairs from February 2000 to September 2013 generated as part of the ITS_LIVE project (Gardner et al., 2025). Prior to tracking, the SAR images were focused and co-located using the Generic Mapping Toolbox for SAR imagery (GMTSAR; Sandwell et al., 2011a, b) and the optical images were co-registered by cross-correlating the images over bedrock areas.
We oversampled the SAR images in the azimuth direction by a factor of four and used image patch sizes of 128 × 512 single-look oversampled azimuth and range pixels, with a step size of 32 and 64 pixels, respectively between patches (Davison et al., 2023). For the optical image pairs, we used an iterative cross-correlation approach with two passes, shifting and deforming the image using information in the first pass before performing the second pass. We varied the image patch size depending on the satellite image resolution. For Landsat image pairs, we used image patch sizes of 64 pixel × 64 pixel with a step of 16 pixels in the first pass, then a patch size of 42 pixel × 42 pixel and a step of 6 pixels in the second pass. For Sentinel-2 image pairs, we used image patch sizes of 96 pixel × 96 pixel with a step of 24 pixels in the first pass, then a patch size of 56 pixel × 56 pixel and a step of 8 pixels in the second pass. Tracking of each image patch was undertaken in MATLAB, within a version of PIVsuite (Thielicke and Stamhuis, 2014; https://uk.mathworks.com/matlabcentral/fileexchange/45028-pivsuite last access: 15 July 2026) adapted for ice flow (Tuckett et al., 2019; Davison et al., 2020). Computationally efficient subpixel displacement estimates were made by obtaining an initial estimate of the cross-correlation peak using a fast Fourier transform and then upsampling by a factor of 50 the discrete Fourier transform using matrix multiplication of a small neighbourhood (1.5 pixel × 1.5 pixel) around the original peak location (Guizar-Sicairos et al., 2008).
The resulting velocity estimates were filtered in several stages. Correlations with a signal-to-noise ratio (defined as the ratio of the primary cross-correlation peak to the average of the remaining cross-correlation field) less than 5.8 for Sentinel-1 derived data (de Lange et al., 2007) and 11 for Landsat and Sentinel-2 data were removed. Remaining spurious estimates were removed primarily using an image segmentation filter with segment difference thresholds approximating realistic strain values (Rosenau et al., 2015), and a kernel density filter based on the paired displacements in the range and azimuth directions (Adrian and Westerweel, 2011). The filtered Sentinel-1 velocity fields were transformed from radar to map coordinates using the Reference Elevation Model of Antarctica (REMA) 100 m × 100 m Digital Elevation Model (Howat et al., 2019, 2022a) and were posted on a 150 m × 150 m grid.
Ice velocity data from all coincident image pairs from each mission were mosaicked, co-located and stacked. The stacked data were smoothed using a 3 pixel × 3 pixel moving median kernel and resampled to 200 m. Additional filtering of the stacked data based on temporal variations in velocity magnitude and flow direction removed remaining outliers, defined as those with a velocity magnitude more than three scaled median absolute deviations from those in a 24 d moving window or a flow direction more than 15° different from the time average (Davison et al., 2025).
Time series of ice motion were created by taking the mean value from within 1000 m × 1000 m (Whisky Glacier) or 500 m × 500 m (Gourdon Glacier and Kotick Glacier) regions of interest (ROI), ignoring pixels in lower and upper 25th percentiles values at each epoch. Where the ROI contained data gaps and had more than 33 % finite values, we estimated the values of missing pixels through a robust linear fit between the finite values and those from a multi-year average of the stacked data – we did this in order to avoid aliasing velocity gradients within the ROI as temporal changes in ice speed. The resulting time-series from within each ROI were smoothed using a second degree 24 d Savitsky–Golay filter. Analysis of apparent motion over non-moving bedrock areas indicates average errors of 10 to 20 m yr−1, though in the terminal zone, glacier margin position changes and sea ice motion can contaminate the velocity retrievals, resulting in greater noise (e.g. Fig. 2a). We expect these values to underestimate the true error in ice-covered areas, especially where the ice surface profile has changed significantly because we assume a fixed ice surface for the geocoding, and because our image patch sizes are similar to (0.5 to 1 times) the width of the glaciers. Tests using a range of DEMs did not significantly affect the retrieved ice speed.
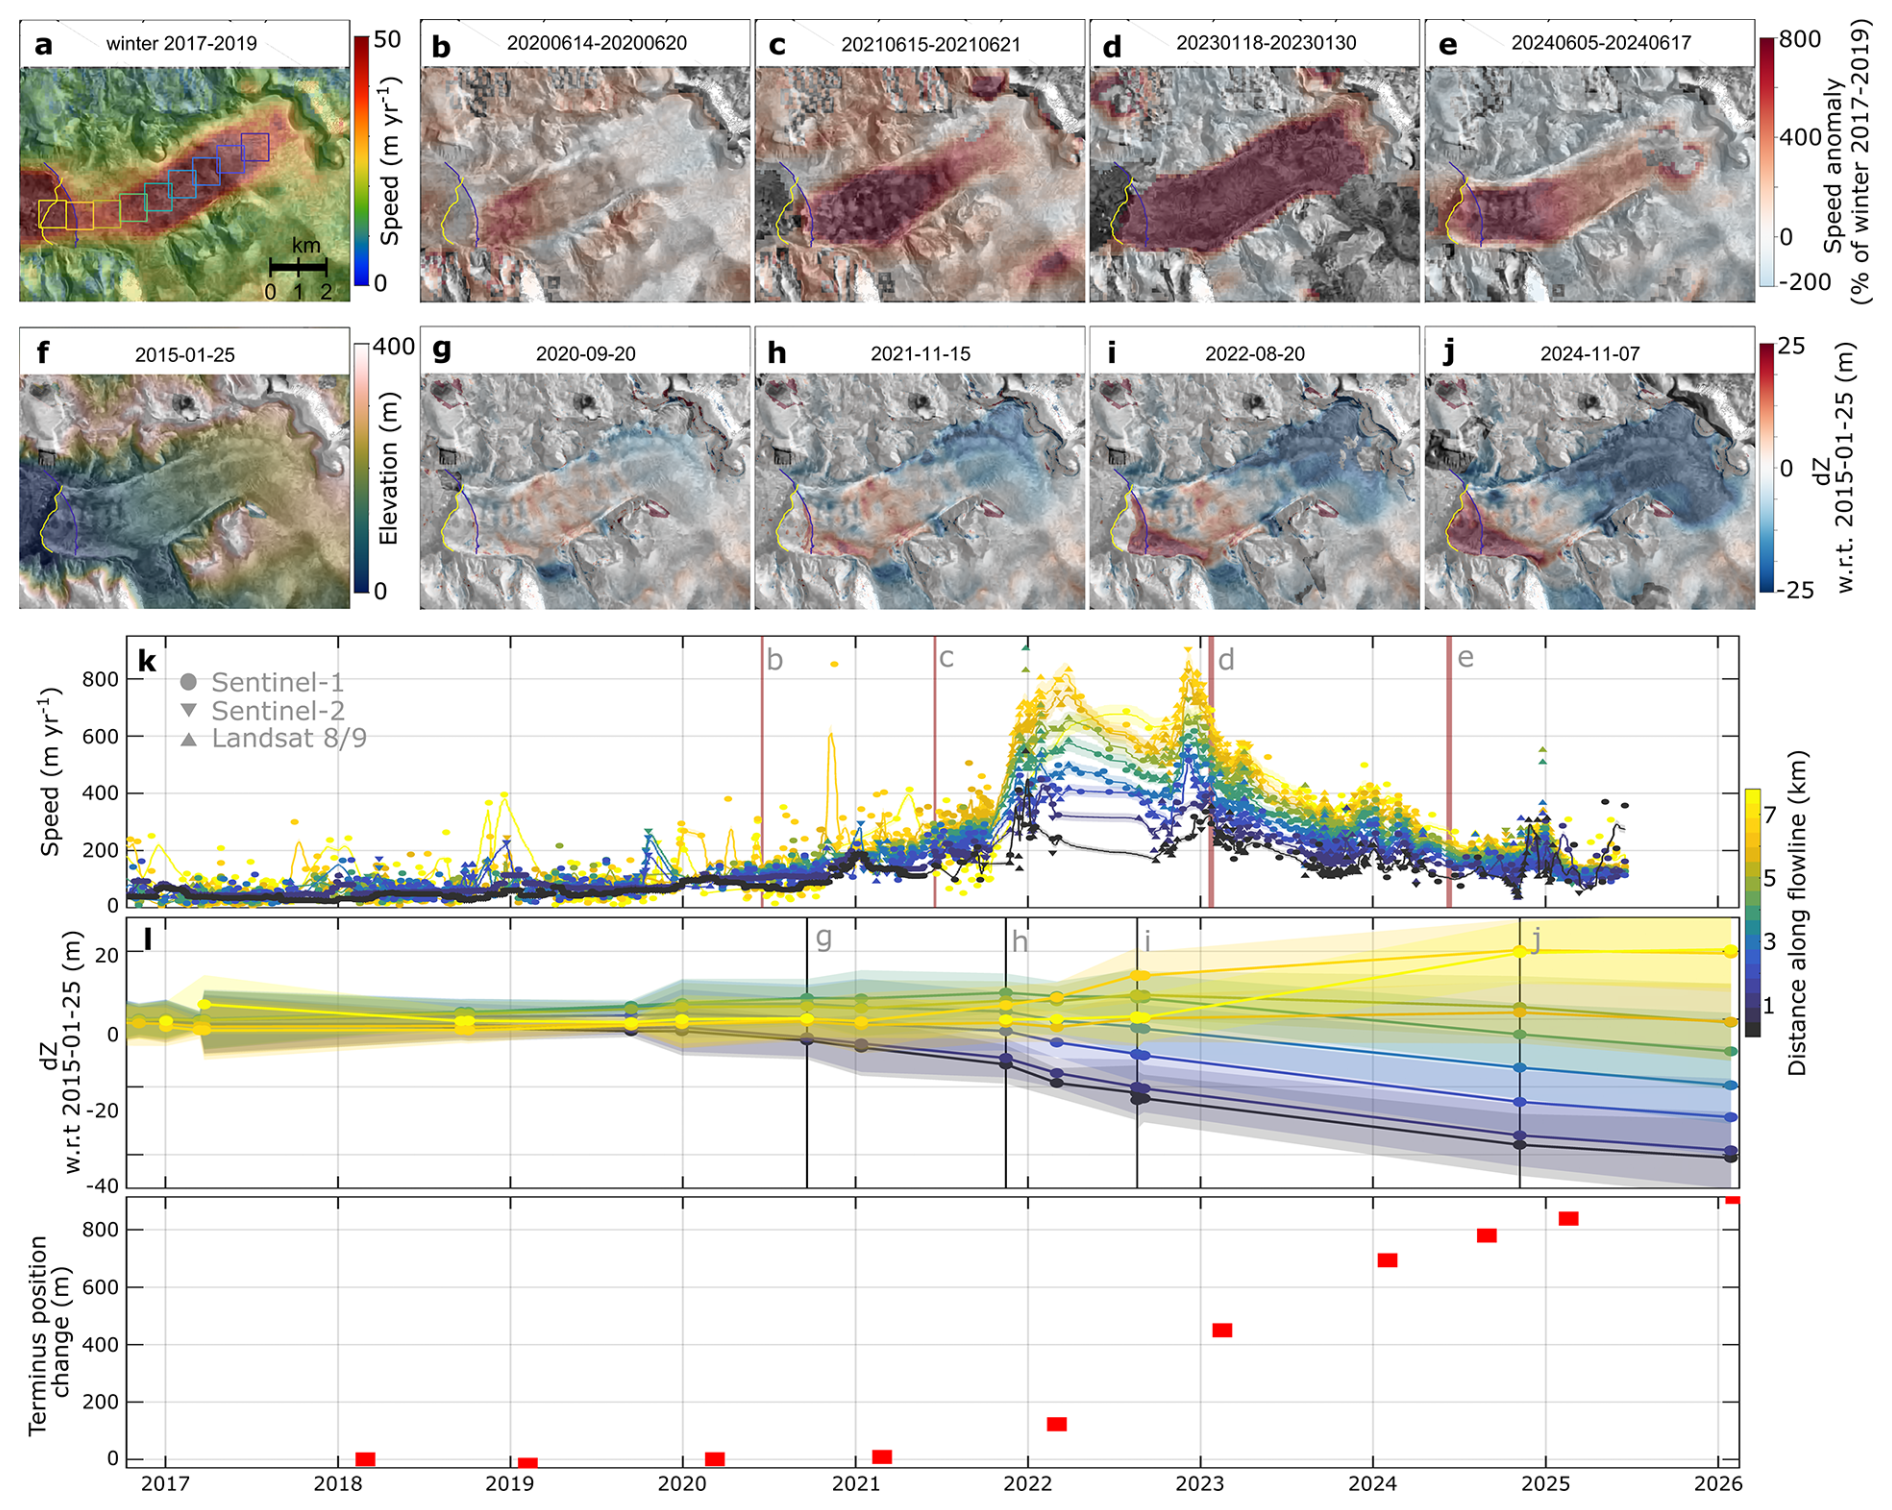
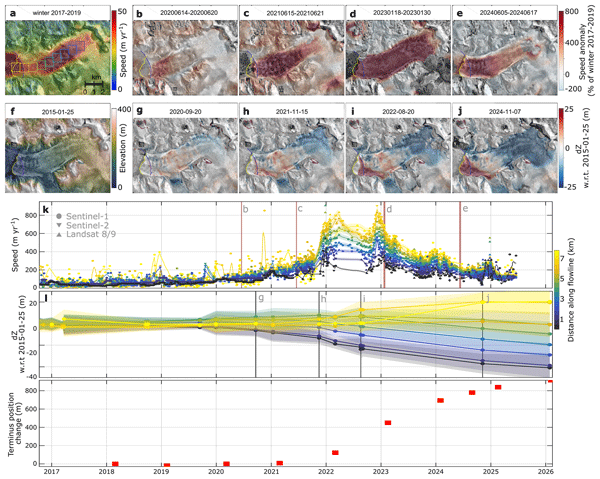
Figure 2Whisky Glacier surge dynamics. (a) speed and (b–e) speed anomalies relative to the 2017–2019 winter mean overlaid on corresponding Sentinel-1 backscatter images. (f) Elevation and (g–j) elevation anomalies relative to the 25 January 2015 ice surface from 2 m × 2 m REMA strips (Howat et al., 2022b). The most retreated and advanced terminus positions are also shown in panels (a) and (f). (k) Speed and (l) elevation time-series along the flowline shown in (a). (m) Width-averaged terminus position change. Contains modified Copernicus Sentinel-1 data. REMA data courtesy of the Polar Geospatial Center.
2.2 Surface elevation change
We calculated surface elevation change between 2 m × 2 m REMA DEM strips (Howat et al., 2022b) over irregular time-periods from November 2012 to August 2024. Prior to DEM differencing, individual strips were co-registered in pDEMtools (Chudley and Howat, 2024) to the 2 m × 2 m REMA mosaic over bedrock areas identified using the Scientific Committee on Antarctic Research (SCAR) Antarctic Digital Database (ADD) rock outcrops mask extracted from Landsat 8 imagery (Burton-Johnson et al., 2016; Gerrish, 2020). We supplement the REMA DEM strips over Whisky Glacier with a single 2 m × 2 m Digital Surface Model derived from Pléiades stereo imagery acquired on 28 January 2026 (Berthier et al., 2024). Errors in the elevation change time-series are estimated as the root-mean-square-difference between DEM strips over rock outcrops; the median error is 5.5 m.
2.3 Terminus position change
We manually delineated glacier termini in sufficiently clear Landsat 7, Landsat 8 and Sentinel-2 optical imagery from 2000 to present using the Google Earth Engine Digitisation Tool (GEEDiT) and calculated width-averaged terminus position change using the multi-centreline method in the Margin change Quantification Tool (MaQiT), both of which are described in more detail by Lea (2018). To examine terminus position changes over longer time periods, we utilised the terminus position dataset described in Cook et al. (2005). Since we are focused on the impact of surges on terminus position, we did not attempt to capture any seasonal terminus position fluctuations. Given that changes in terminus position during surges are typically much greater than seasonal fluctuations, we do not expect this choice to affect our ability to identify surge-driven terminus position changes.
2.4 Auxiliary images
To support our investigation of potential surging behaviour in the 20th century we visually examined the glacial geomorphological features, ice margin position and ice surface characteristics in one historical aerial image and three high-resolution WorldView images of Kotick Glacier. The aerial image is a 1:95 000 Vinten 70 image acquired by the British Antarctic Survey (BAS) on 18 January 1979 (British Antarctic Survey, 1979), which we manually georeferenced in ArcGIS Pro using exposed bedrock areas. The WorldView images are ∼ 0.6 m resolution and were acquired on 5 February 2015, 11 October 2019 and 31 October 2025. The 2015 image is a single-band image from WorldView-1 and the other two are WorldView-2 RGB images pan-sharpened with an associated panchromatic image (Imagery © 2026 Vantor). We supplemented the WorldView images with a 2 m × 2 m REMA strip acquired on the 9 December 2024 (Howat et al., 2019, 2022b).
2.5 The surging climatic envelope and climate reanalyses
We used the global climatic envelope for surge-type glaciers (henceforth referred to as the Surging Climatic Envelope, SCE) produced by Guillet et al. (2025), updated from Sevestre and Benn (2015). This global dataset was produced using the January 2000 to December 2023 mean of monthly ERA5-Land climate reanalysis (Muñoz-Sabater et al., 2021) of the median winter total precipitation and the median summer temperature, sampled at the centroid of each Randolph Glacier Inventory polygon using bi-cubic interpolation. The SCE was defined by the climate conditions covering the x % highest density climatic region (in temperature-precipitation space) of all glaciers that surged in between 1990 and 2024 (Guillet et al., 2025); here we consider values of x from 20 to 99.
To compare climatic conditions on JRI to the SCE, we calculated median winter total precipitation and median summer temperature during 10-year periods in 1-year increments from 1940 to 2025 using daily ERA5 reanalysis outputs (Hersbach et al., 2020). To assess whether our study glaciers fall within the optimum climatic envelope for surging during each 10-year averaging period, we interpolate each climatology to the centroid of each glacier – mimicking the approach used to generate the SCE – allowing us to examine changes in winter precipitation and summer temperature over each glacier with respect to the global climatic envelope. To assess the validity of the ERA5 temperature changes over JRI, we also examined reconstructed (RECON) monthly near-surface temperature anomalies from 1958 to 2022 (Bromwich and Wang, 2024; Bromwich et al., 2025) and in-situ measurements of monthly-mean two metre air temperature at Esperanza Station (−63.4° N, −56.98° W; Fig. 1 inset; Turner et al., 2004). RECON provides only temperature anomalies; to enable comparisons with the climatic envelope, we summed the RECON anomalies with our 1950–1960 climatology from ERA5. We smoothed the monthly RECON and Esperanza summer median temperatures with a 10-year moving mean filter for comparison to the SCE.
To identify the spatial distribution of the SCE over time, we also identified all ERA5 pixels located within the optimal climatic envelope during each 10-year averaging period from 1940 to 2024. To identify glaciers that could in future fall within the SCE, we examined year 2100 projections of near-surface air temperature and precipitation from the Coupled Model Intercomparison Project Phase 6 (CMIP6) (O'Neill et al., 2016). We incorporated 31 models forced by SSP 2-4.5 and 34 models forced by SSP5-8.5 (see Table S1 in the Supplement for model details and citations). For each of these model outputs, we determined all locations within the SCE in the same manner as performed for ERA5 during recent decades. These spatial analyses of the climatic envelope location over time allowed us to examine which regions and glacier basins around the Antarctic peninsula have been, are, and will be exposed to surge-conducive climatic conditions.
Our observations of changes in glacier terminus position, ice surface velocity and elevation in combination reveal that three glaciers on JRI surged between 2000 and 2025.
3.1 Whisky Glacier
The long-term terminus position record (Cook et al., 2005), indicates sustained retreat of Whisky Glacier since 1945, within the resolution of the measurements (Fig. S1 in the Supplement). Whisky Glacier was flowing at 45 ± 19 m yr−1 approximately 2 km from the terminus between 2017 and 2019 (Fig. 2a), but the whole glacier began to accelerate in the 2019/2020 summer, reaching speeds of up to 200 m yr−1 in the terminal zone by the following autumn. During the 2021/2022 summer, the whole glacier rapidly accelerated, reaching speeds of up to 800 m yr−1 in the terminal zone (Fig. 2k). Although the acceleration was more pronounced and more sustained in the terminal zone (Fig. 2b–e and k), the entire glacier reached speeds greater than 800 % of the 2017 to 2019 average speed (Fig. 2d). Clear seasonal speed changes are superimposed on the longer-term acceleration, resulting in peak speeds during the 2021/2022 and 2022/2023 summers; the latter summer in particular was characterised by a sudden, large speed-up to over 900 m yr−1 from November to December 2022. After the 2022/2023 summer, ice surface speeds decreased (with superimposed summer speed-ups) and along-glacier speed gradients diminished. Since approximately mid-2024, ice-surface speeds have stabilised at around four times pre-event values. During and following this period of dramatic speed change, the Whisky Glacier terminus advanced by more than 800 m between 2021 and 2026 (Fig. 2m).
Concurrent with the changes in speed and terminus position of Whisky Glacier, we observed a redistribution of mass from the upper to lower parts of the glacier (Fig. 2g–j and l). The uppermost reaches lowered by approximately 40 m between 2020 and 2026, with the greatest rates of lowering during the 2021/2022 summer through 2022. Drawdown rates diminished down-glacier and the lowest few kilometres of the glacier increased in elevation by over 20 m from 2022 onwards. Surface elevation increases were concentrated downstream of the tributary (Carro Pass) (Fig. 2i and j), where there was a coincident drainage of a likely subglacial lake (Fig. 3). Evidence that meltwater was stored in the subglacial lake and perhaps elsewhere beneath Whisky Glacier is provided by observations of extensive turbid meltwater plumes at the glacier terminus during the period of anomalously high flow speeds (Fig. S2).
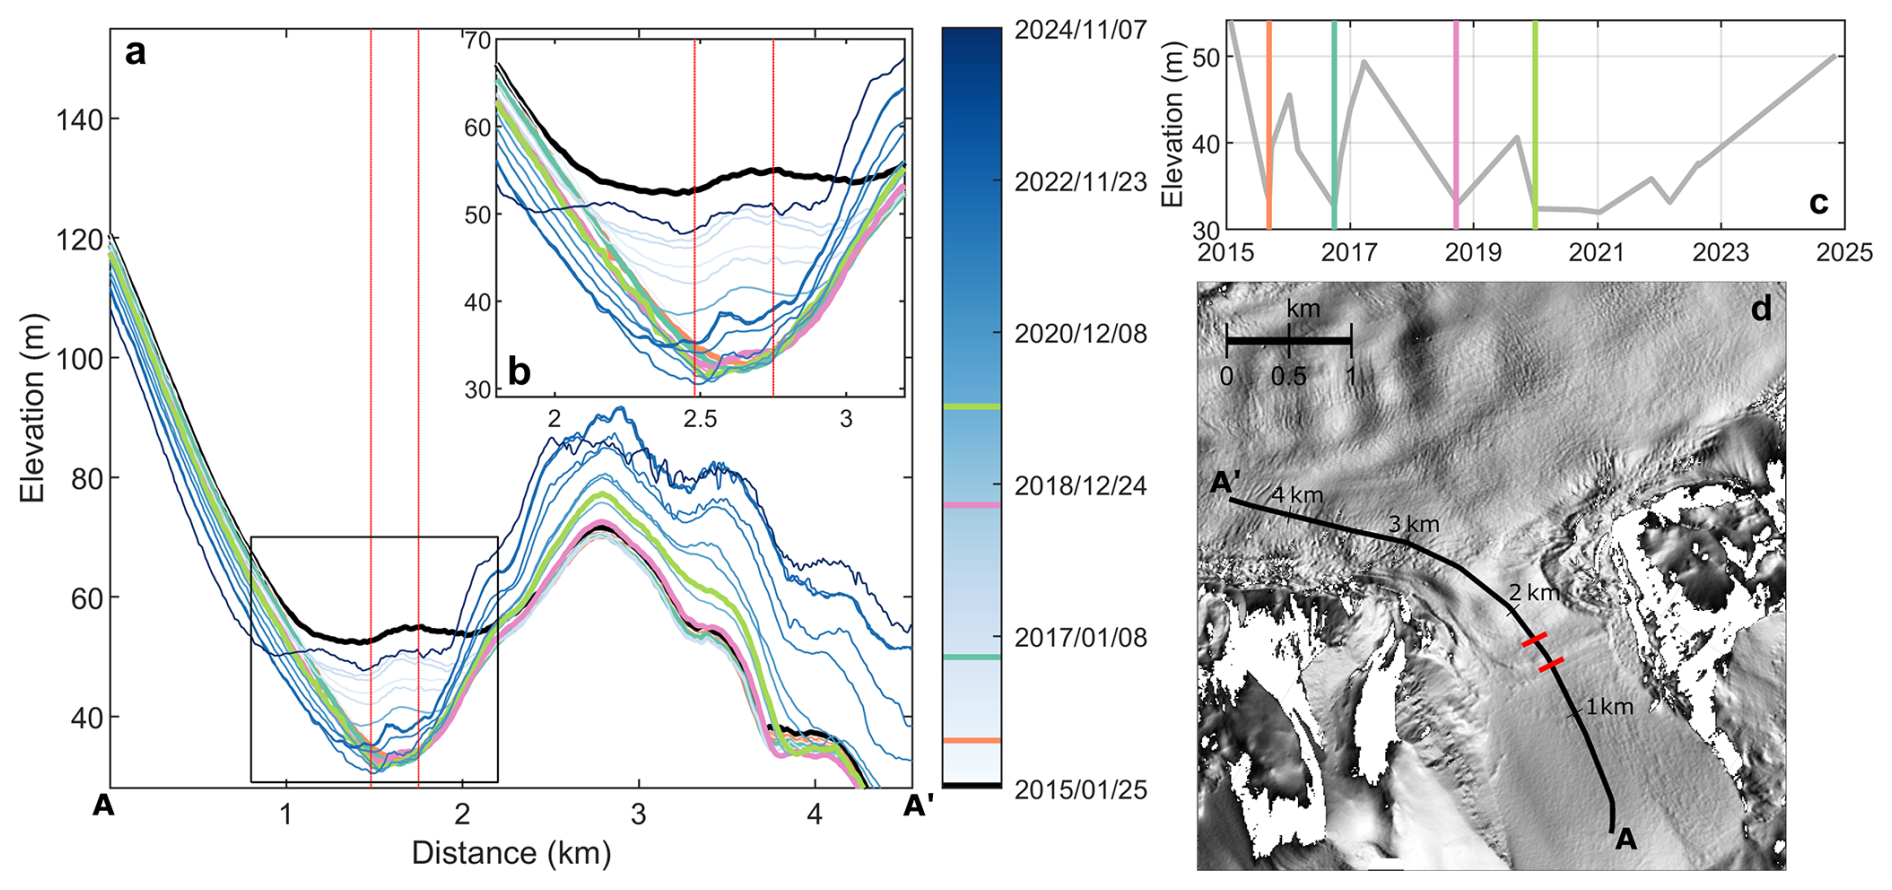
Figure 3Surface elevation changes over a subglacial lake in Carro Pass (location in Fig. 1), Whisky Glacier. (a, b) Show profiles of ice surface elevation along the black line in panel (d), with the elevation low stands coloured. (c) Elevation time-series extracted over the potential subglacial lake – extracted between the red lines in (d) – with the low stands marked by coloured vertical lines. (d) The flowline is overlain on a hillshade of a 2 m × 2 m REMA strip (2022-09-03) (Howat et al., 2022b). REMA data courtesy of the Polar Geospatial Centre. REMA data courtesy of the Polar Geospatial Center.
3.2 Gourdon Glacier
The terminus position dataset of Cook et al. (2005), derived in part from georeferenced aerial imagery, shows a ∼ 900 m advance of Gourdon Glacier from 1964 to 1974 (Fig. S1). There are no uncertainty estimates for these traces and no measurements between 1964 and 1974. The next trace (1977) indicates the terminus had by this time returned to around the 1964 position. Thus, we cannot determine whether the 1974 trace represents an advancing or retreating terminus, or if apparent advance from 1964 to 1974 occurred steadily during the 10-year period or rapidly during a short period prior to 1974, or if the 1974 trace is erroneous.
Between 2000 and 2005, Gourdon Glacier was flowing at ∼ 25 m yr−1 near the terminus and the terminus was relatively stationary – it retreated 170 m between 2000 and 2003 before readvancing to within 55 m of its initial position by 2005. Between January 2005 and January 2006, the terminus advanced 560 m on average and then a further 130 m by February 2007 (Fig. 4m). The glacier terminus then steadily retreated until 2014, at which point its location was similar to that in 2000 (Fig. 4m). The only velocity measurement during that time is from 2006 when the velocity was almost quadruple (90 m yr−1) the speed measured in 2000 (Fig. 4k).
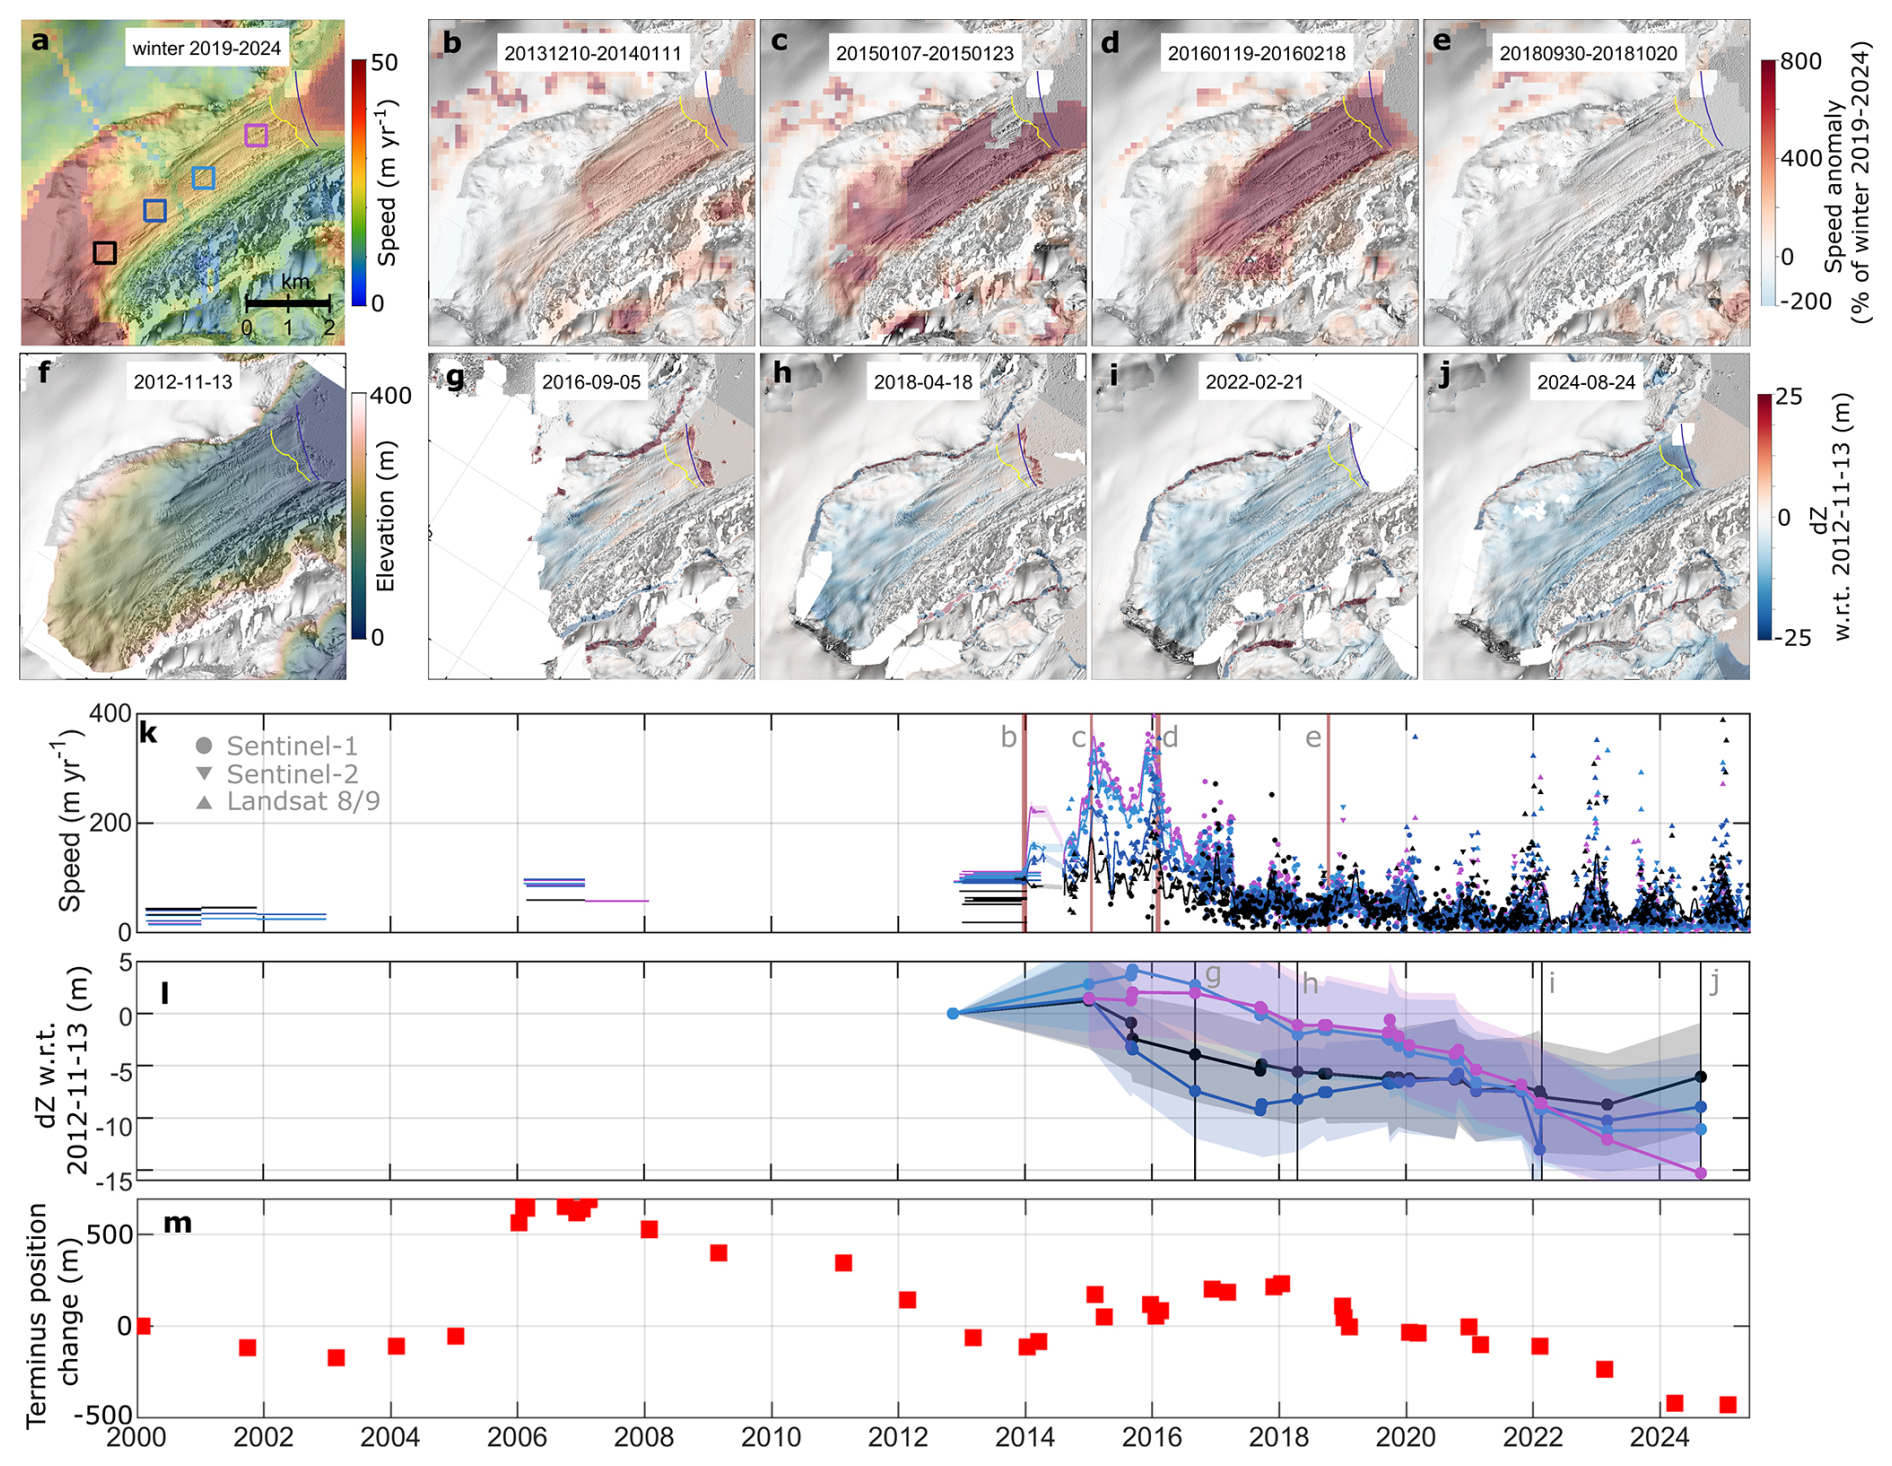
Figure 4Gourdon Glacier surge dynamics. (a) speed and (b–e) speed anomalies relative to the 2019–2024 winter mean overlaid on corresponding Sentinel-1 backscatter images. (f) Elevation and (g–j) elevation anomalies relative to the 13 November 2012 ice surface from 2 m × 2 m REMA strips (Howat et al., 2022b). The most retreated and advanced terminus positions are also shown in panels (a) and (f). (k) Speed and (l) elevation time-series along the flowline shown in (a). (m) Width-averaged terminus position change. Contains modified Copernicus Sentinel-1 data. REMA data courtesy of the Polar Geospatial Center.
Gourdon Glacier underwent a phase of acceleration, ice surface elevation change and terminus position change between 2013 and 2020. Ice surface speed across the whole tongue increased between 2013 and 2016, reaching peak speeds near the terminus of 325 m yr−1 in 2015 (13 times the average speed during 2000 to 2005), before speeds returned to ∼ 25 m yr−1 by 2020 (Fig. 4k). Our velocity data may capture the beginning of this acceleration as it propagated upstream – speeds were already four times greater near the terminus in 2013 than those observed in 2000, but speeds near the glacier headwall were less than 50 m yr−1, similar to those observed in the years following the period of elevated speed (Fig. 4k). Clear summertime speed-ups across most of the glacier in 2014/2015 and 2015/2016 were superimposed on the period of elevated speeds. Interestingly, flow speed decreased in a step-wise manner, interrupted by periods of a few months to over a year in which flow speed was relatively constant. From November 2012 to September 2015, Gourdon Glacier thinned by 2.4 to 3.4 m in its upper reaches (dark blue and black lines in Fig. 4i) whilst the central and lower portions of the tongue thickened by 2.0 to 4.2 m (light blue and purple lines in Fig. 4i). Thinning of the entire glacier occurred from 2017 to 2023, with thinning of up to 15.2 m in the lowest part of the glacier. Since March 2023, the upper reaches of the glacier have been thickening by 2.7 m yr−1 and, if those rates continue, the glacier will regain its pre-surge ice thickness in September 2029 (Figs. 4i and S3). The terminus advanced by 180 m from March 2015 to January 2018, before retreating ∼ 700 m through to 2025 (Fig. 4m).
3.3 Kotick Glacier
Our measurements show a phase of synchronous speed, elevation and terminus position changes at Kotick Glacier between 2014 and 2018 (Fig. 5). Speed measurements for Kotick Glacier are only available from late-2013 onwards. In 2014, ice surface speed near the terminus was 100 to 150 m yr−1, which then increased to 300 m yr−1 in 2015 before decelerating to 25 m yr−1 between 2015 and 2018. This temporal pattern of speed change was similar across the entire glacier and ice flow speed remained steady at 25 m yr−1 from 2018 to the end of our observation period (Fig. 5k). Peak speeds during 2015 diminished with distance upstream of the terminus, but remained over 200 % greater than those observed since 2018 (Fig. 5b–e and k). We observed terminus advance of 1000 m from 2013 to 2016, when a calving event disrupted the advance that continued through 2019 (Fig. 5m). As with Whisky Glacier, we observed surface lowering of over 35 m in the upper reaches of the glacier, though we note that lowering across the glacier continued at a rate of 2.2 to 3.3 m yr−1 even after ice speeds dropped and stabilised (Fig. 5g–j and l). The apparent thickening in the lower reaches of the glacier shown in Fig. 5g–j is due to terminus advance.
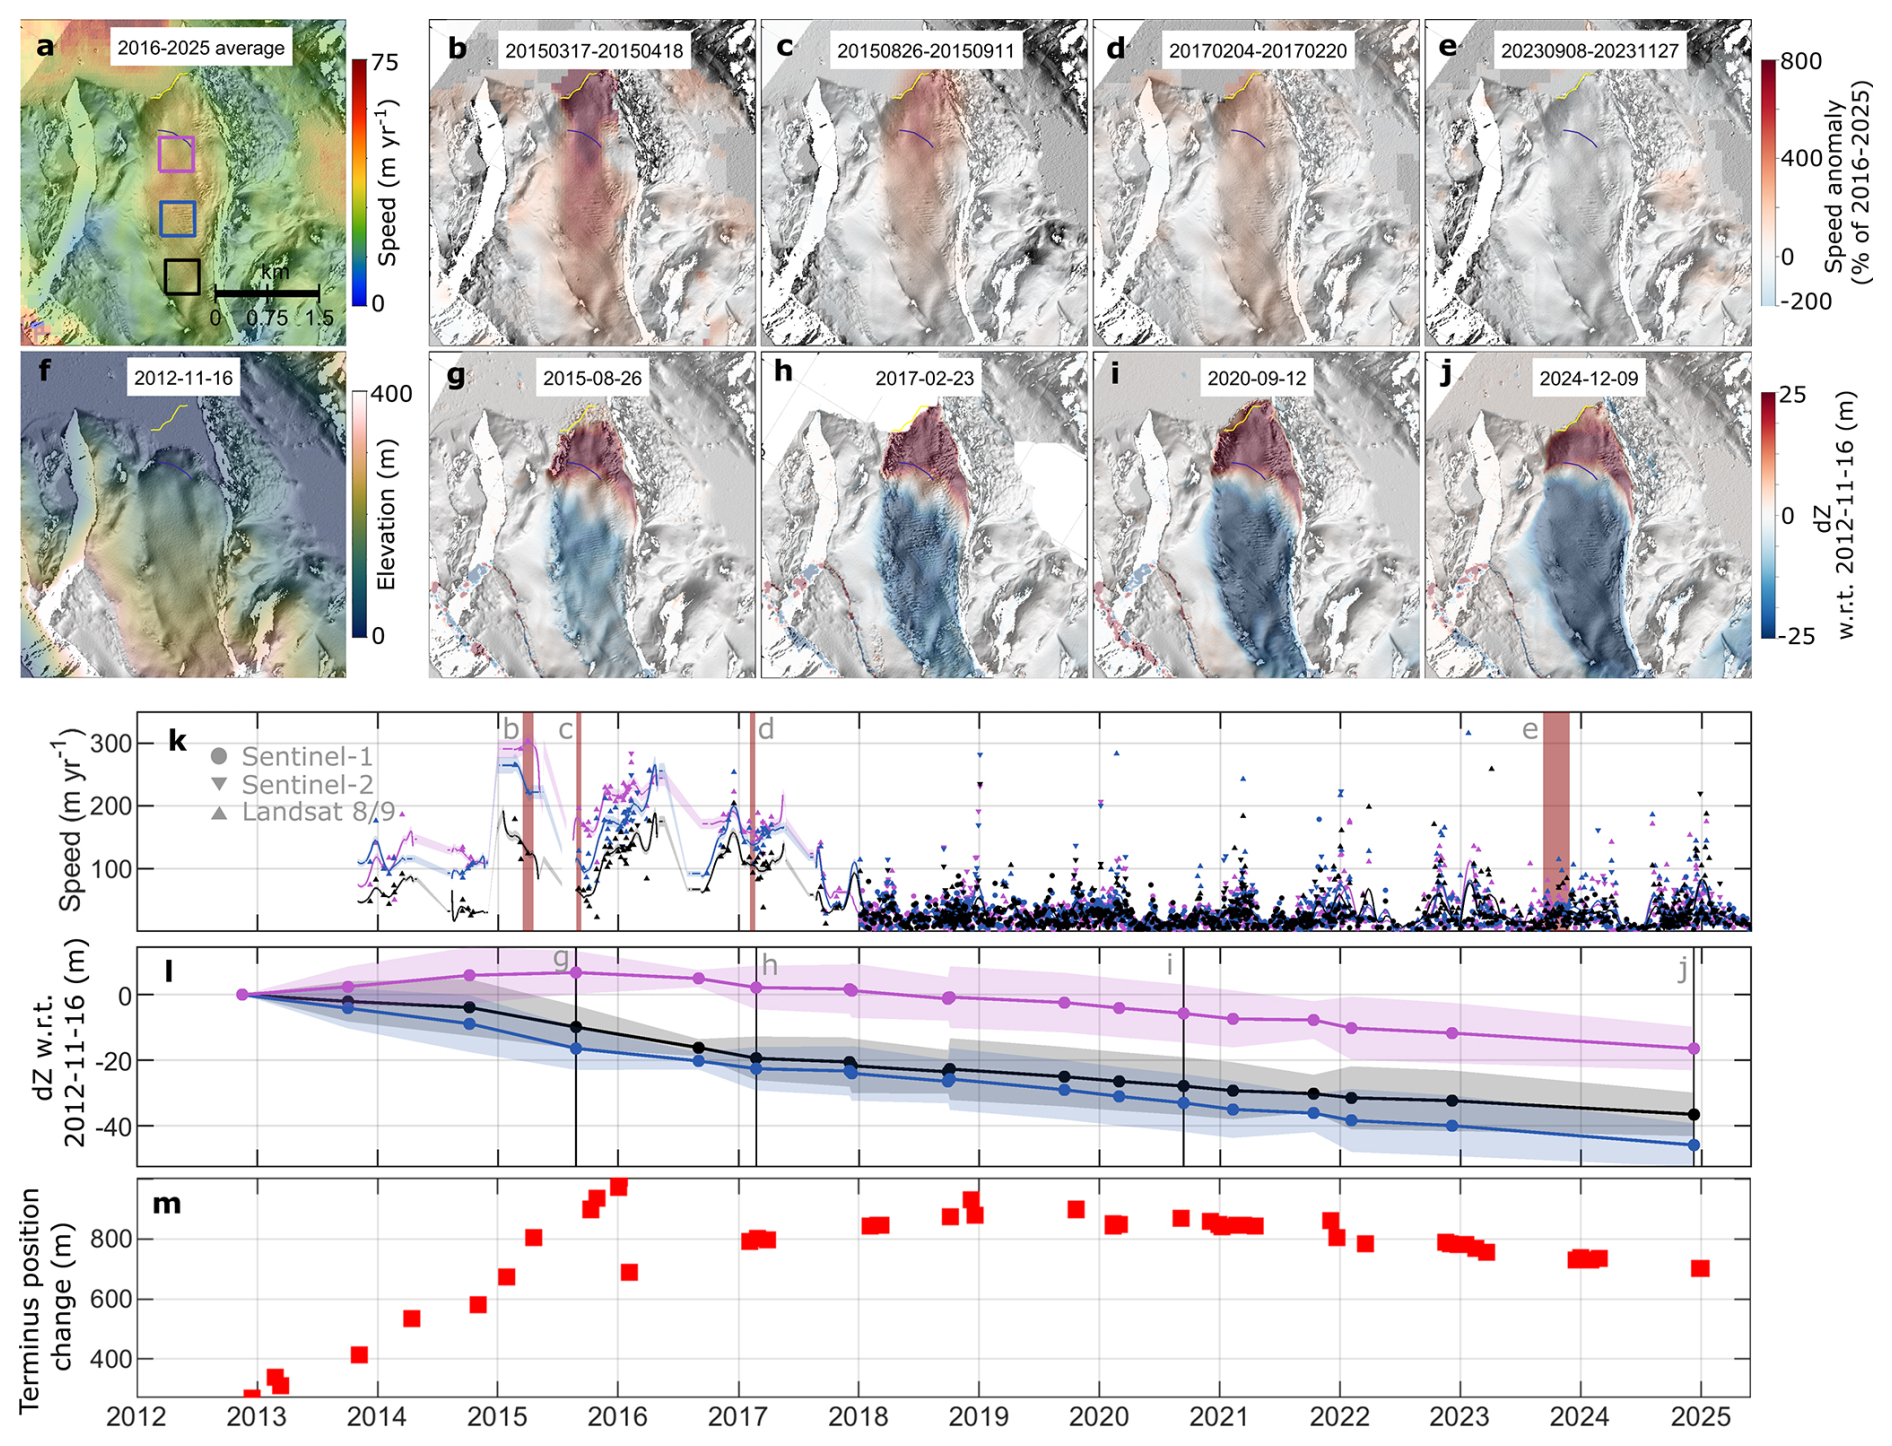
Figure 5Kotick Glacier surge dynamics. (a) speed and (b–e) speed anomalies relative to the 2016–2025 trimmed mean speed (excluding the lower and upper 25th percentiles) overlaid on corresponding Sentinel-1 backscatter images. (f) Elevation and (g–j) elevation anomalies relative to the 16 November 2012 ice surface from 2 m × 2 m REMA strips (Howat et al., 2022b). The most retreated and advanced terminus positions are also shown in panels (a) and (f). (k) Speed and (l) elevation time-series along the flowline shown in (a). (m) Width-averaged terminus position change. Contains modified Copernicus Sentinel-1 data. REMA data courtesy of the Polar Geospatial Center.
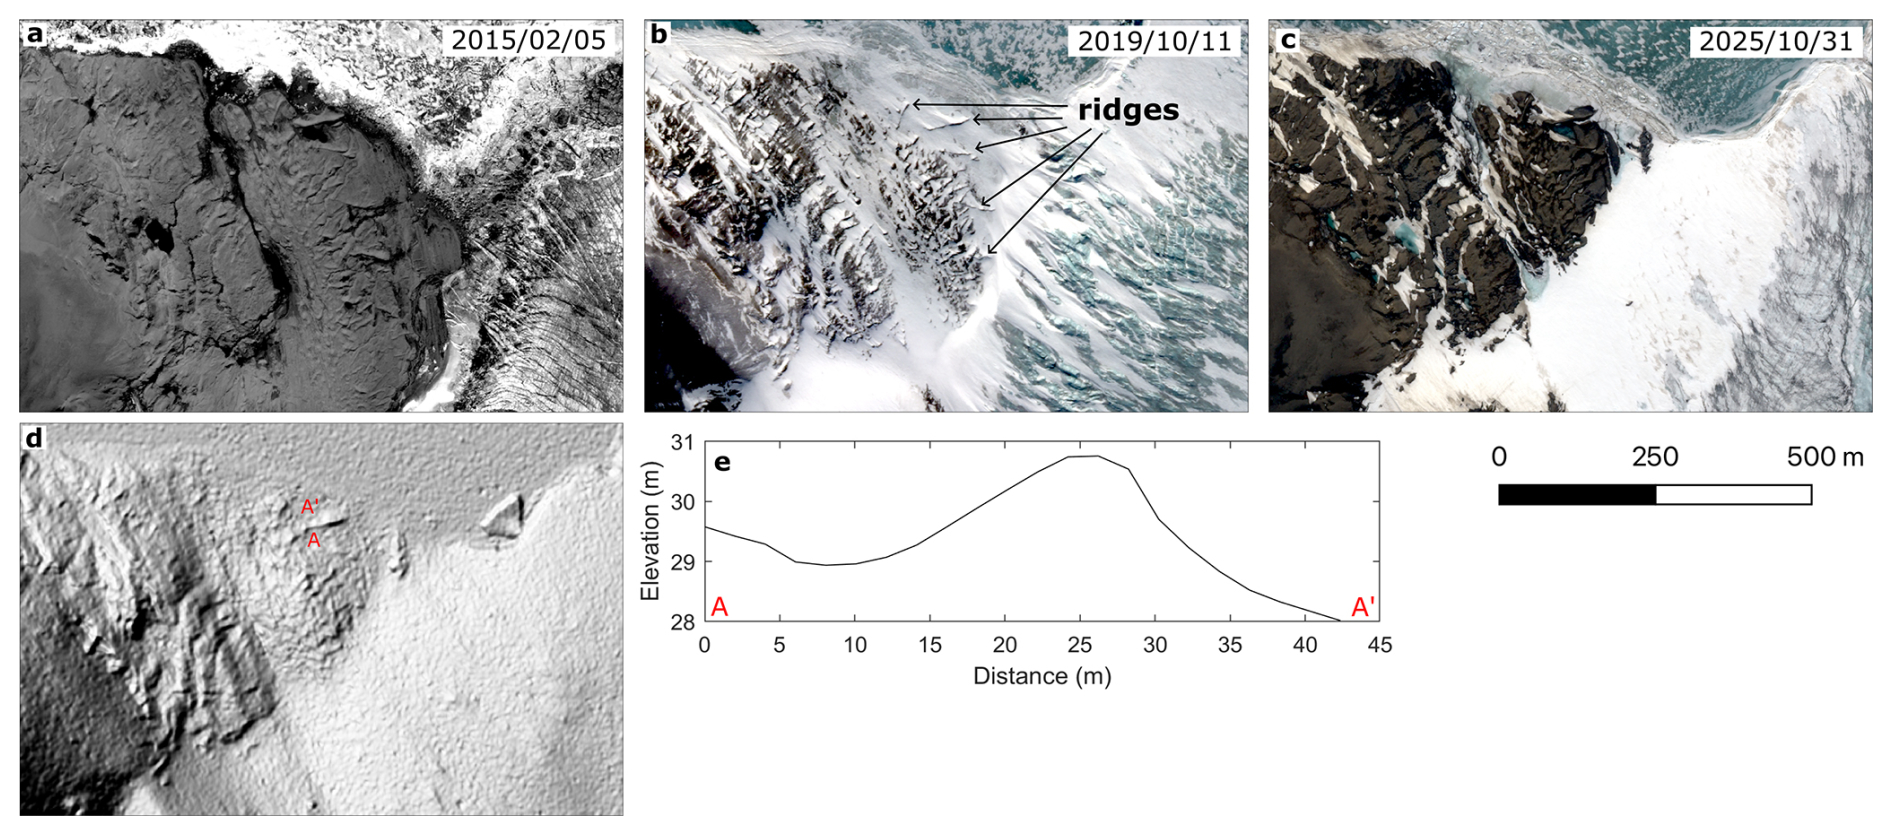
Figure 6Candidate crevasse-squeeze ridges (CSRs) adjacent to Kotick Glacier (location in Fig. 1c). Panel (a) shows a WorldView-1 image and panels (b) and (c) show WorldView-2 images with candidate CSRs labelled. Panel (d) shows a hillshade (three times vertical exaggeration) of a Reference Elevation Model of Antarctica (REMA) strip (9 December 2024) with the location of the elevation transect shown in panel (e). REMA data courtesy of the Polar Geospatial Center. Imagery © 2026 Vantor.
Unlike Gourdon Glacier and Whisky Glacier, the terrain around Kotick Glacier hosts many landforms from an earlier period of glaciation (Figs. 1c and 6). We examined these landforms and glacier geometry in aerial and satellite imagery to investigate glacier geometry and behaviour prior to our observations of ice surface elevation and velocity. A WorldView image acquired on 5 February 2015 shows a series of short (∼ 70 m), narrow (< 25 m) linear ridges oriented at a range of angles obliquely to ice flow to the true-left of Kotick Glacier (Fig. 6). These ridges are approximately symmetrical in cross-section with an amplitude of 2 m (Fig. 6d). The ridges were visible prior to the 2013 to 2017 advance of Kotick Glacier, though two of the ridges were partially overridden during that advance. A georeferenced aerial image acquired in January 1979 (Fig. S4) provides indirect evidence that the area hosting these ridges was overridden at the time: the image does not directly capture the area hosting the ridges, but it clearly shows Kotick Glacier approximately 350 m from the present-day ridges (Fig. S4). Based on the geometry of the visible part of Kotick Glacier in 1979 and the elevation difference (40 m) between the edge of the imaged glacier and the ridges, it is plausible that Kotick Glacier occupied the location of the ridges in January 1979. Based on these observations, it seems likely that the ridges formed between 1979 and 2000, when our terminus position observations show the area hosting the ridges was not ice covered.
4.1 Glacier surge characteristics
Our observations of change in glacier terminus position, ice surface velocity and elevation in combination reveal that three glaciers on JRI surged between 2005 and 2025. The surge phase of each glacier was characterised by greater than 500 m of glacier terminus advance, acceleration of the whole glacier and a redistribution of mass from the upper to lower portions of each glacier, visible from a drawdown and surface lowering of the upper glacier and thickening lower down. The surge phase of these glaciers lasted approximately four years, with a progressive acceleration to peak speeds that persisted for approximately one year or two summers, followed by a comparatively prolonged deceleration in which speeds remained substantially greater than pre-surge values for more than 3 years. These characteristics of the surge phase are typical of tidewater glacier surges and differ from typical land-terminating surge phases, which generally have shorter deceleration phases lasting less than two years (Guillet et al., 2025). In comparison to specific, well-known glacier surges: the duration of the surge phases observed here are longer than those observed on the land-terminating Variegated Glacier, Alaska (1–2 years) (Kamb et al., 1985; Eisen et al., 2001), but comparable to those of the marine-terminating Monacobreen and Morsnevbreen, Svalbard (Benn et al., 2019b, 2023).
Our observational record is generally too short to robustly determine the duration of the quiescent phase of these glaciers; our data suggest that Gourdon Glacier surged twice since 2005 with a 7-year quiescent phase, implying that another surge may be imminent. However, the upper reaches of the glacier did not begin to regain mass until 2023, and the observed thickening rate (2.7 m yr−1) implies that pre-surge thicknesses will not be reached again until September 2029 (Figs. 4i and S3). Across the upper reaches of Whisky Glacier, surface lowering rates decreased in 2025 but there was no evidence of high-elevation mass gain by the end of our elevation change observations (January 2026), likely because ice flow speeds were still elevated relative to the pre-surge quiescent values (Fig. 2k and l). We note that the entirety of Kotick Glacier continued to thin even after slowing to quiescent speeds (Fig. 5l). Based on a compilation of observations, Stringer et al. (2025) estimate the modern-day equilibrium-line altitude on JRI is higher than 300 m above sea level; Kotick Glacier has no ice above this elevation and has a much smaller area of ice above 200 m than either Gourdon Glacier or Whisky Glacier (Fig. S5). This implies that Kotick Glacier now has no accumulation area and cannot build up to another surge; therefore, we suggest that Kotick Glacier is now senescent, rather than quiescent, like several small, formerly surging glaciers in Svalbard (Benn et al., 2023).
Our observations suggest that the surge of Whisky Glacier was initiated at or a short distance upstream of the terminus. During the rising limb of the surge, the acceleration of Whisky Glacier was clearly greater in the lower reaches of the glacier than in the upper reaches (Fig. 2). We also observed frequent and increasingly extensive turbid plumes at the Whisky Glacier terminus from 2020 through 2023 (during the surge) as well as a large calving event near the plume in December 2021 (Fig. S2). These observations highlight the role of basal enthalpy, supplemented by efficient surface-to-bed meltwater connections associated with more extensive crevassing and enhanced generation of basal meltwater through rapid ice motion (Dunse et al., 2015; Sevestre et al., 2018).
We note that a likely subglacial lake in Carro Pass drained between 14 September 2019 and 30 December 2019 (Fig. 3), which coincides approximately with the onset of the Whisky Glacier surge (ice velocity tripled during 2020). This may have contributed to the greater acceleration of the lower reaches of Whisky Glacier; however, given that this lake drained approximately annually during our observational period, and because the late-2019 drainage was smaller than in previous years (Fig. 3), it seems unlikely that the lake drainage was the primary cause of the surge. There are, however, clear indications that the surge affected the subglacial hydrological connections between the subglacial lake and Whisky Glacier. Ice surface elevation over the lake did not begin to recover until the 2021/2022 summer, indicating that the evacuation of stored basal meltwater during the surge seemed to prevent lake refilling throughout 2020. Ice surface elevations over the lake have since returned to pre-surge levels, indicating complete or partial refill of the lake (Fig. 3).
4.2 Spatial extent of surging on the Antarctic Peninsula and neighbouring islands
To our knowledge, only the surge of Kotick Glacier has previously been described as an unambiguous surge (Stringer et al., 2025). The higher resolution velocity data used here allows us to substantially revise the estimated tripling in speed to a 12-fold increase (Fig. 5). Stringer et al. (2025) also reported the recent advance of Whisky Glacier but lacked the auxiliary data to confirm surging behaviour. Earlier work (Nichols, 1973) proposed that Northeast Glacier, flowing into Marguerite Bay, may be a surge-type glacier based on observations (Nichols, 1960) of coherent iceberg and sea ice motion adjacent to the advancing glacier terminus. Our velocity data do not reveal any surging behaviour at Northeast Glacier (not shown) and the ice delta described by Nichols (1960) appears to reform in most years, so may reflect sea ice conditions and retention of icebergs near the seasonally-advancing terminus, rather than a sudden increase in calving activity associated with a surge.
We conducted a preliminary exploration for other glacier surges on the Antarctic Peninsula by exploring ice speed time-series to identify candidate surges. Of the hundreds of glaciers examined, we found only two glaciers (Fig. S6) with speed time-series characterised by very slow motion followed by a substantial increase in velocity lasting more than 1 year. These may constitute surging behaviour, but we have not examined terminus position or elevation change measurements, which would allow us to rule out other processes, such as temporary ungrounding or retreat. Both of the glaciers that exhibit surge-like ice velocity variations are located on islands surrounding the northern tip of the Antarctic Peninsula (Fig. S6). We did not find evidence of surging elsewhere on the Antarctica Peninsula, but acknowledge that the sparsity of velocity data prior to 2016 could result in missed surges and future studies could incorporate a larger range of observations to produce a comprehensive inventory of Antarctic glacier surges.
4.3 Onset and frequency of surging on James Ross Island in relation to 20th century climate change
Given that glacier surges are a recently identified phenomenon in Antarctica, we discuss the potential influence of climate change on their occurrence. This discussion is motivated in part by several published examples of apparent changes in surge frequency that were temporally associated with changes in climate or mass balance. The most striking of these examples is the cessation of surging at Vernagtferner in the Ötztal Alps, which surged from the 17th to the 19th century but has not surged since; this senescence was attributed to both rising atmospheric temperatures and glacier mass loss (Hoinkes, 1969). More recent works have examined changes in surge frequency over comparatively shorter periods that were not always significantly longer than the quiescent phase. Putting aside the potential observation bias inherent in those (and any) attempts, they indicate a cessation of surging activity of small glaciers in Svalbard due to thinning since the Little Ice Age (Dowdeswell et al., 1995; James et al., 2012; Benn et al., 2019a) and increasing surge frequency in the late-20th century in the Karakoram, associated with a period of anomalously high modelled precipitation (Copland et al., 2011). Several other examples are discussed in a comprehensive review (Lovell et al., 2026). When viewed under the lens of statistical analyses showing that surge-type glaciers occupy a distinct (though broad) climatic envelope (Sevestre and Benn, 2015; Guillet et al., 2025) and the theoretical basis by which those conditions encourage the build-up of a mass and enthalpy imbalance that culminates in a surge (Benn et al., 2019a, 2023), these examples of apparent changes in surge frequency globally begin to build up a picture of how the surging behaviour of glaciers on JRI might have changed in response to changing climatic conditions over the last century.
To evaluate how climatic changes over the last century might have affected the surging behaviour of JRI glaciers, we compared ERA5 reanalysis of two-metre air temperature and precipitation over JRI in 10-year averaging periods to the globally defined SCE (Guillet et al., 2025; Fig. 7a). This analysis indicates that these glaciers have been exposed to conditions at the cooler end of the SCE since at least the beginning of the reanalysis period (1940) and have pushed further into the SCE as atmospheric temperatures have risen and precipitation has increased (Fig. 7a). Comparisons with air temperature measurements at Esperanza Station (100 km from JRI; location in Fig. 1) and an Antarctic-specific near-surface air temperature reconstruction (RECON; Bromwich et al., 2025) confirm the approximate magnitude and timing of the air temperature trend shown in ERA5 (Fig. 7a). Thus, as predicted by Sevestre and Benn (2015), glacier surging on JRI at any time since 1940 is consistent with the enthalpy balance theory of glacier surging (Benn et al., 2019a, 2023), because the climate appears to have been conducive to the development of a mass and basal enthalpy imbalance since the beginning of the reanalysis period. Further progression of these glaciers into the SCE (i.e. towards warmer, more humid conditions; Fig. 7a) implies a greater rate of basal enthalpy accumulation and increased surge activity. Enthalpy balance theory predicts that basal hydrological processes may hinder a smooth transition to higher velocities, forcing the glaciers to undergo velocity fluctuations to discharge mass over longer cycles.
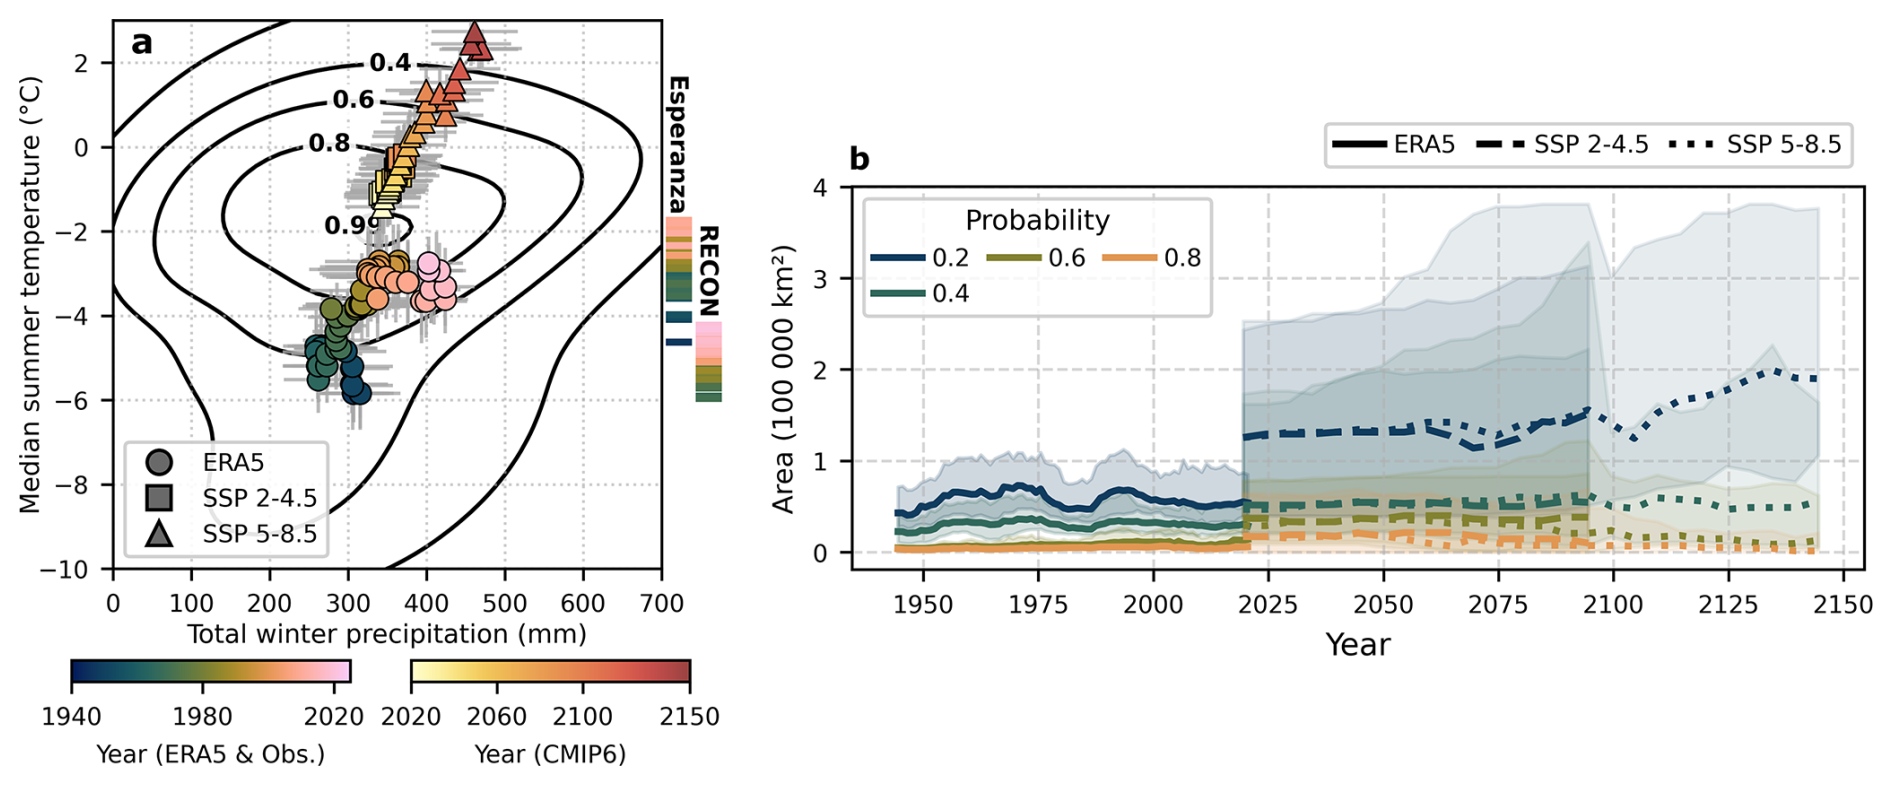
Figure 7(a) The trajectory of the climate of James Ross Island (JRI) with respect to the optimal envelope for glacier surging (SCE). The black contours show the boundaries of the SCE at each probability level. The coloured circles show the climate of JRI in 10-year periods from 1940 to 2025, in 1-year increments, from ERA5. The coloured squares and triangles show the ensemble mean climate of JRI in 10-year periods from 2020 to 2100 (SSP2-4.5) and 2150 (SSP5-8.5) from a suite of CMIP6 simulations (detailed in Table S1). The bars on the right-hand side, show the observed (Esperanza Station) and reconstructed (RECON) 10-year median summer temperature over time. Note the RECON data include only temperature anomalies from 1956 onwards – we have added them to the ERA5 data here to illustrate the potential range of temperatures on JRI over time. (b) The area of grounded ice exposed to the SCE on the Antarctic Peninsula.
There is therefore a theoretical basis on which to expect an increase in the prevalence of surging on JRI over the last century. As with previous work, this study suffers from observation bias due to the increase in observations over time, which limits our ability to evaluate changes in surge frequency over the last century. Two of our observations (glacial landforms at Kotick Glacier and terminus advance of Gourdon Glacier) suggest that surging may have occurred on JRI in the second half of the 20th century. The first piece of evidence for 20th century surging on JRI comes from the glacial geomorphological record adjacent to Kotick Glacier. We observed a group of five short (∼ 70 m), low amplitude (2 m) ridges on the true-left of Kotick Glacier (Fig. 6). These ridges are oriented obliquely to the present-day ice flow direction. Two of the ridges were partially overridden during the 2013 to 2017 surge of Kotick Glacier (Fig. 6). Based on these characteristics, we suggest they are crevasse-squeeze ridges (CSRs) (Rea and Evans, 2011; Evans et al., 2016; Rivers et al., 2023), which are thought to be the infills of basal crevasses preserved at the termination of a surge (e.g. Benediktsson et al., 2009). A single BAS aerial image acquired in January 1979 shows the upper reaches of the glacier in a geometry that strongly indicates the area hosting the CSRs was covered by Kotick Glacier in January 1979 (Fig. S4). Given the poor preservation potential of CSRs in terrestrial environments, we argue that the candidate CSRs therefore likely formed in a surge during or after 1979, but prior to the 2013 to 2017 surge. The surface of Kotick Glacier in the 1979 aerial image does not appear to be heavily crevassed in its upper reaches, which would be expected during and immediately following a surge. If a surge did occur between 1979 and 2000, it was not apparent from the 1988 terminus position trace of Cook et al. (2005). We note that if surging of JRI tidewater glaciers occurred in the past, then the landform record would predominantly be submarine. To our knowledge there is no suitably high-resolution bathymetric data adjacent to these glaciers with which to interrogate the submarine landform record but future studies could acquire this information to help to clarify the surge history of JRI glaciers.
The second piece of evidence for 20th century surging on JRI is provided by observations of the terminus position of Gourdon Glacier (Cook et al., 2005; Fig. S1). The terminus of Gourdon Glacier advanced by 900 m from 1964 to 1974, which could be indicative of a surge. We treat this inference with caution, however, because we do not have corresponding ice surface elevation or velocity measurements to confirm this advance was caused by a surge. The long duration between these terminus position observations and the lack of terminus position uncertainty estimates further limit our ability to attribute this apparent advance to a surge of Gourdon Glacier. This advance could, amongst other factors, have been caused instead by interannual variations in sea ice extent or simply errors in the georectification of the oblique aerial imagery used to delineate the glacier terminus.
Overall, it is clear that four surges at three glaciers on JRI have occurred since 2005 (Figs. 2, 4 and 5) and there is some, albeit inconclusive, evidence that two of these glaciers may have surged in the second half of the 20th century. The glaciers on JRI have been exposed to the SCE since at least the 1940s but have progressed further into the SCE over time (Fig. 7a). From a theoretical and statistical perspective, surging was therefore possible in the 20th century and the probability of surging has increased as the climate has become warmer and wetter (Benn et al., 2019a, 2023; Guillet et al., 2025). Our observations are consistent with the hypothesis that changes in climate over the past century have increased the likelihood or frequency of surging on JRI. However, we have few constraints on the timing and frequency of surging during the 20th century and a more detailed reconstruction of 20th century Antarctic Peninsula surging, derived from archive aerial imagery and field observations of the submarine and subaerial landform record, would be required to confirm a change in surge frequency over the last century, which would provide an informative test case for theories seeking to explain surging behaviour.
4.4 Changes to the locations exposed to the surging climatic envelope through the 20th and 21st centuries
Although the location of the SCE is not a definitive predictor of surging behaviour, we examine how climate change through the 20th century and projected climate changes over the 21st century have affected and will affect the locations exposed to climatic conditions conducive to glacier surging (Fig. 8; videos S1–S15 in the Supplement). We preface this discussion by noting that the SCE is defined at surge-type glacier centroids, which approximate the equilibrium line altitude (e.g. Carrivick and Brewer, 2004), whereas surging is a whole-glacier phenomenon. Thus, the SCE provides the climate over a small subset of the area occupied by surge-type glaciers. In consequence, spatial maps of the SCE, such as those discussed here, will tend to underestimate the potential extent of surging and a given glacier may be susceptible to surging if the SCE encroaches into the ablation zone and towards the equilibrium line altitude, even if the entire basin is not encompassed by the SCE. The SCE was also defined for a population of predominantly valley glaciers up to a few tens of kilometres in length (Guillet et al., 2025) and glacier size exerts a strong secondary influence on the propensity for a glacier to surge (Benn et al., 2019a); we therefore restrict our discussion of the SCE to the Antarctic Peninsula, which hosts glaciers of similar dimensions to those on which the SCE was defined.
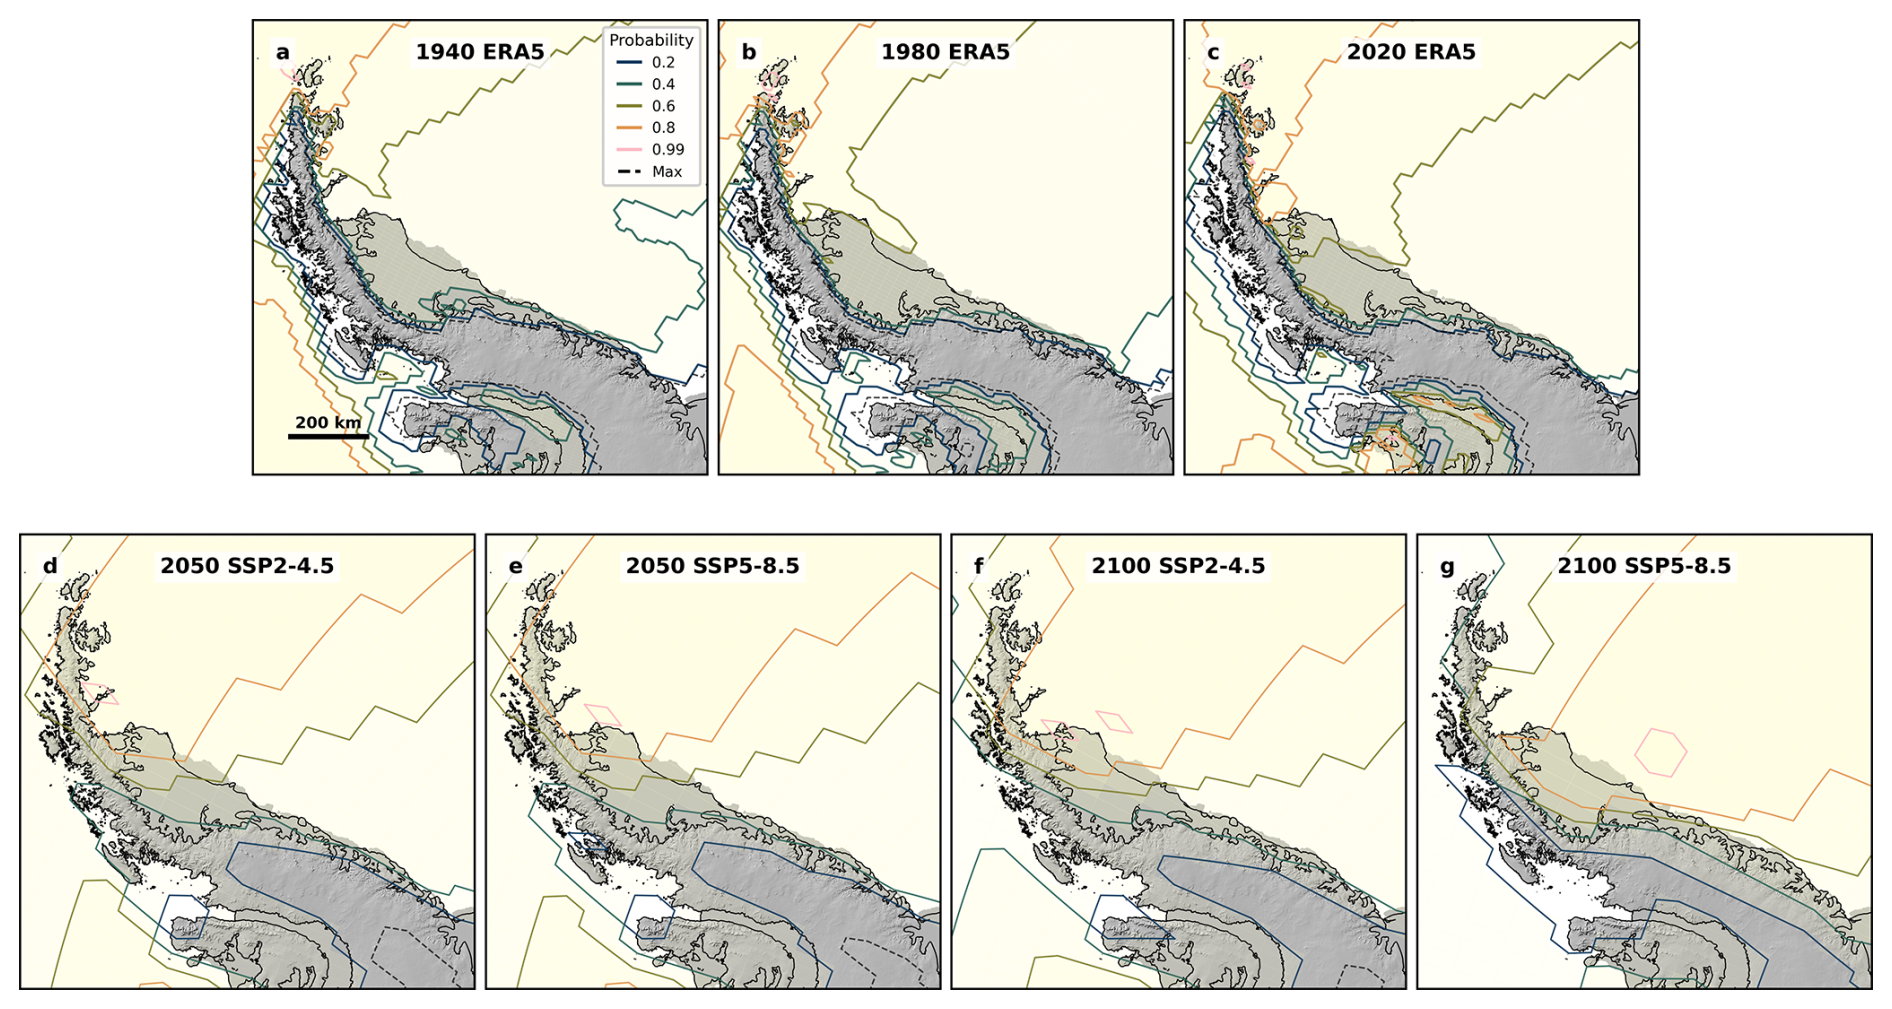
Figure 8Mapping the optimal surging climatic envelope (SCE) on the Antarctic Peninsula with ERA5 and the CMIP6 ensemble mean. Each panel shows the location of SCE for the labelled decade, overlaid on a 200 m Reference Elevation Model of Antarctica (REMA) mosaic (Howat et al., 2022a). The solid-coloured contours show the edge of the SCE for each probability level. The dashed contours show the maximum extent of the 0.2 probability SCE when the standard deviation of temperature and precipitation within the decade is considered alongside the decadal mean (ERA5) climate. REMA data courtesy of the Polar Geospatial Center.
With these caveats in mind, the restriction of observed surging behaviour to the warmest, northernmost parts of Antarctica and surrounding islands is broadly consistent with the present-day and historical spatial distribution of ERA5 temperature and precipitation with respect to the SCE (Figs. 7a and 8). ERA5 shows a steady southward migration of the areas exposed to the SCE from 1940 to 2020 (Fig. 8) and a corresponding increase (92 km2 yr−1, p < 0.05; Table S2) in the area of grounded ice on the Peninsula exposed to the SCE (Fig. 7c; videos S1–S5). In the 1940s, the SCE began to encroach on JRI at the 0.6 SCE probability level, though climate variability in the 1940s intermittently exposed JRI to conditions closer to the centre of the SCE (Fig. 7a) and lower probability SCE levels encompass JRI throughout the reanalysis period (Fig. 8). The SCE shifted southwards through the last quarter of the 20th century, encompassing JRI and the northernmost tip of the Peninsula, while extending along the eastern coastline as far south as Larsen-C Ice Shelf but with minimal transgression onto grounded ice (Fig. 8a; videos S1–S5). Low-to-moderate probability SCE transgression onto the Larsen, Wilkins and George VI ice shelves occurred in the late-20th or early-21st century (Fig. 8; videos S1–S3). For comparison, similar shifts in climate across Greenland have been associated with a change in spatial extent of surge envelopes and with the number of surge-type glaciers per sub-region (Lovell et al., 2023).
Analyses of CMIP6 model output allows us to briefly explore the potential for changes in surge occurrence around the Antarctic Peninsula throughout the 21st century under modest (SSP2-4.5) and extreme (SSP5-8.5) warming scenarios (Fig. 8; videos S6–S15). We note there is a positive temperature bias of 1.6 and 1.3 °C in the CMIP6 SSP2-4.5 and SSP5-8.5 ensemble means compared to ERA5 (Fig. S7), that hinders comparisons or the computation of long-term trends (Fig. 7). ERA5 is known to underestimate mid-20th century temperature and overestimate late-20th century temperature around Antarctica (Bromwich et al., 2024); however, the mismatch with temperature recorded at stations is smallest on the Peninsula (Bromwich et al., 2024). At three stations with long-term temperature records (Esperanza, Faraday/Vernadsky and Orcadas), ERA5 has a mean bias of −0.19 ± 1.42 °C at Faraday, −0.18 ± 1.60 °C at Orcadas and −1.02 ± 1.33 °C at Esperanza and the temperature trends are within 0.006 °C decade−1 at Orcadas and Esperanza and almost within error at Faraday (Fig. S8; Table S3). Thus, the offset between ERA5 and the CMIP6 ensemble mean is likely predominantly due to overestimation of temperature in CMIP6. This could be due to the coarser resolution of the CMIP6 simulations, which will resolve the effects of steep topography less effectively than ERA5.
Keeping in mind the temperature offset between ERA5 and CMIP6, the CMIP6 output shows a continuation of the spatiotemporal trends in SCE exposure exhibited by ERA5 throughout the 20th century (Figs. 7 and 8, video S1; video S1). Over JRI, the combination of ERA5 and CMIP6 output show a climate trajectory pushing deeper into, through then further from the SCE core from 1940 through 2150 (Fig. 7). When variability amongst CMIP6 ensemble members is considered, there is little divergence between emissions scenarios in projections of the SCE extent up to the middle of the 21st century. In both emission scenarios, both east and west coasts of the Antarctic Peninsula as far south as the Larsen-B Embayment enter the SCE at the 0.6 probability level before 2050 (Fig. 8; videos S8 and S13). Many more glaciers further south on the Peninsula have complete or partial exposure to the SCE at lower probability levels in the first half of the 21st century (videos S6, S7, S11 and S12). Beyond 2050, changes to the areas of the Antarctica Peninsula exposed to the SCE are relatively minor in SSP2-4.5 (Figs. 7b and 8f). Under extreme warming (SSP5-8.5), JRI and much of the Peninsula warm sufficiently to lower their exposure to the SCE (Figs. 7 and 8; video S1).
The historical and projected changes to the parts of the Antarctic Peninsula exposed to the SCE provide a crude indication of how surge occurrence and frequency have and may continue to change in response to climate change. The historical changes to climate through the 20th and early-21st century, resulting in greater exposure of JRI and surrounding islands to the SCE and increased likelihood of surging (Figs. 7 and 8), is broadly consistent with the timing and location of glacier surges observed here. Analysis of CMIP6 model output with respect to the SCE suggests that we might expect an increase in the number of surge-type glaciers on the Antarctic Peninsula throughout the remainder of the 21st century in moderate warming scenarios (Fig. 8). If atmospheric warming continues unabated, the climate of the Antarctic Peninsula is likely to become less conducive to surging beyond 2050, which may result in a reduction in surge frequency and extent.
We present observations of surging between 2005 and 2025 at Whisky Glacier, Gourdon Glacier and Kotick Glacier on James Ross Island, Antarctica. The surges exhibit all the characteristics typical of tidewater glacier surges, particularly a rapid acceleration over the course of a year, peak speeds lasting up to two summers, redistribution of mass from higher to lower elevations along with terminus advance, and a prolonged deceleration phase lasting several years. Gourdon Glacier has likely surged twice since 2005 with a 10-year quiescent phase. There is reasonable, yet inconclusive, evidence that Kotick Glacier and perhaps Gourdon Glacier surged between the 1970s and 2000s. The occurrence and timing of the surges observed and inferred here are consistent with the enthalpy balance theory for glacier surges because these glaciers have occupied and pushed deeper into the optimal climatic envelope for glacier surging since at least the 1940s. Based on examination of the historical and projected spatial distribution of atmospheric conditions associated with surging, we hypothesise that surging will become more prevalent on the Antarctic Peninsula over the coming decades. Under extreme warming, however, surge occurrence on the Antarctic Peninsula may decline in the second half of the 21st century. We suggest that continued monitoring of Antarctic Peninsula ice surface elevation and speed change will enable detection, and perhaps prediction, of surging in the coming decades. Finally, surge behaviour should not be ignored when interpreting observations of glacier geometry change and the landform record in future studies of northern Antarctic Peninsula glacier dynamics.
The code required to reproduce the analyses presented in this paper is available from https://doi.org/10.5281/zenodo.21276597 (Davison et al., 2026). The open-source GMTSAR code is available from https://topex.ucsd.edu/gmtsar/ (last access: 15 July 2026). PIVsuite, which provided the basis for our feature tracking software, is available from https://uk.mathworks.com/matlabcentral/fileexchange/45028-pivsuite (last access: 15 July 2026). pDEMtools is documented in https://pdemtools.readthedocs.io/en/v1.2.3/ (last access: 15 July 2026).
The data required to reproduce the analyses presented in this paper is available from https://doi.org/10.5281/zenodo.21276597 (Davison et al., 2026). Sentinel-1 images are freely available from https://dataspace.copernicus.eu/data-collections/copernicus-sentinel-missions/sentinel-1 (last access: 15 July 2026) and https://asf.alaska.edu/ (last access: 15 July 2026). Sentinel-2 images are freely available from https://dataspace.copernicus.eu/data-collections/copernicus-sentinel-missions/sentinel-2 (last access: 15 July 2026) and https://browser.dataspace.copernicus.eu/ (last access: 15 July 2026). Landsat 7 and 8 images are freely available from https://earthexplorer.usgs.gov/ (last access: 15 July 2026). REMA DEM strips and mosaics are freely available from https://www.pgc.umn.edu/data/rema/ (last access: 15 July 2026). The BAS aerial image used in this study is available through the BAS Archives with reference code BAS: ES2/2/9/1979/JR/1/18 and the projected image presented in Fig. S4 is available from https://doi.org/10.5281/zenodo.21276597 (Davison et al., 2026). ERA5 monthly gridded temperature and precipitation fields are freely available from https://doi.org/10.24381/cds.f17050d7 (Copernicus Climate Change Service, 2023). CMIP6 model output is freely available from https://doi.org/10.24381/cds.c866074c (Copernicus Climate Change Service, Climate Data Store, 2021). Temperature observations from Esperanza Station, Orcadas and Faraday/Vernadsky are freely available from http://www.nerc-bas.ac.uk/icd/gjma/ (last access: 15 July 2026). RECON data are freely available from https://amrdcdata.ssec.wisc.edu/dataset/reconstruction-of-antarctic-near-surface-air-temperatures-at-monthly-intervals-since-1958 (last access: 15 July 2026).
The supplement related to this article is available online at https://doi.org/10.5194/tc-20-4293-2026-supplement.
The contributions of all authors are described in the CRediT table below.
| CRediT matrix | BJD | AJS | GG | DIB | JK | JE | SJL | CDS | JC | AEH |
|---|---|---|---|---|---|---|---|---|---|---|
| Conceptualization | 1 | 1 | 1 | 1 | 1 | 1 | 1 | |||
| Data curation | 1 | 1 | ||||||||
| Formal analysis | 1 | |||||||||
| Funding acquisition | 1 | 1 | 1 | 1 | ||||||
| Investigation | 1 | 1 | ||||||||
| Interpretation | 1 | 1 | 1 | 1 | 1 | 1 | 1 | 1 | 1 | 1 |
| Methodology | 1 | 1 | ||||||||
| Project administration | 1 | 1 | ||||||||
| Resources | ||||||||||
| Software | 1 | 1 | ||||||||
| Supervision | ||||||||||
| Validation | 1 | |||||||||
| Visualization | 1 | |||||||||
| Writing (pre-submission) | 1 | 1 | 1 | 1 | 1 | 1 | 1 | 1 | 1 | 1 |
| Writing (revisions) | 1 | 1 | 1 | 1 | 1 | 1 | 1 | 1 | 1 |
At least one of the (co-)authors is a member of the editorial board of The Cryosphere. The peer-review process was guided by an independent editor, and the authors also have no other competing interests to declare.
Publisher's note: Copernicus Publications remains neutral with regard to jurisdictional claims made in the text, published maps, institutional affiliations, or any other geographical representation in this paper. The authors bear the ultimate responsibility for providing appropriate place names. Views expressed in the text are those of the authors and do not necessarily reflect the views of the publisher.
We acknowledge IT Services at The University of Sheffield for the provision of services for High Performance Computing. Geospatial support for this work was provided by the Polar Geospatial Center under NSF-OPP award 2053169. The authors gratefully acknowledge the European Space Agency and the European Commission for the acquisition, generation, and availability of Copernicus Sentinel-1 and Sentinel-2 data. The Pléiades satellite data used in this study were provided by the Pléiades Glacier Observatory (Berthier et al., 2024), funded by DINAMIS, the French national infrastructure for shared access to very high-resolution satellite imagery.
This work was funded by NSFGEO-NERC Grant Number #2053169, “Investigating the Direct Influence of Meltwater on Antarctic Ice Sheet Dynamics”. A.E.H. was supported by the European Space Agency (ESA) 5D Antarctica project (grant no. 4000146702/24/I-KE).
This paper was edited by Christine Batchelor and reviewed by Ellyn Enderlin and one anonymous referee.
Adrian, R. J. and Westerweel, J.: Particle image velocimetry, Cambridge University Press, Cambridge, ISBN 978-0-521-44008-0, 2011.
Benediktsson, Í.Ö., Ingolfsson, O., Schomacker, A., and Kjaer, K. H.: Formation of submarginal and proglacial end moraines: implications of ice-flow mechanism during the 1963–64 surge of Brúarjökull, Iceland, Boreas, 38, 440–457, 2009.
Benn, D. I., Fowler, A. C., Hewitt, I., and Sevestre, H.: A general theory of glacier surges, J. Glaciol., 65, 701–716, 2019a.
Benn, D. I., Jones, R. L., Luckman, A., Fürst, J. J., Hewitt, I., and Sommer, C.: Mass and enthalpy budget evolution during the surge of a polythermal glacier: a test of theory, J. Glaciol., 65, 717–731, 2019b.
Benn, D. I., Hewitt, I. J., and Luckman, A. J.: Enthalpy balance theory unifies diverse glacier surge behaviour, Ann. Glaciol., 63, 88–94, 2023.
Berthier, E., Lebreton, J., Fontannaz, D., Hosford, S., Belart, J. M.-C., Brun, F., Andreassen, L. M., Menounos, B., and Blondel, C.: The Pléiades Glacier Observatory: high-resolution digital elevation models and ortho-imagery to monitor glacier change, The Cryosphere, 18, 5551–5571, https://doi.org/10.5194/tc-18-5551-2024, 2024.
Boxall, K., Christie, F. D. W., Willis, I. C., Wuite, J., and Nagler, T.: Seasonal land-ice-flow variability in the Antarctic Peninsula, The Cryosphere, 16, 3907–3932, https://doi.org/10.5194/tc-16-3907-2022, 2022.
Boxall, K., Christie, F. D., Willis, I. C., Wuite, J., Nagler, T., and Scheiblauer, S.: Drivers of seasonal land-ice-flow variability in the Antarctic Peninsula, J. Geophys. Res.-Earth, 129, e2023JF007378, https://doi.org/10.1029/2023JF007378, 2024.
Braun, M., Humbert, A., and Moll, A.: Changes of Wilkins Ice Shelf over the past 15 years and inferences on its stability, The Cryosphere, 3, 41–56, https://doi.org/10.5194/tc-3-41-2009, 2009.
British Antarctic Survey: BAS/JR/1/79 January 1979, 1:95000 Vertical air photograph of James Ross Island item 18, British Antarctic Survey, Cambridge, 1979.
Bromwich, D. and Wang, S.-H.: Reconstruction of Antarctic Near-Surface Air Temperatures at Monthly Intervals Since 1958, AMRDC Data Repository [data set], https://doi.org/10.48567/efwt-jw56, 2024.
Bromwich, D., Wang, S.-H., Zou, X., and Ensign, A.: An updated reconstruction of Antarctic near-surface air temperatures at monthly intervals since 1958, Earth Syst. Sci. Data, 17, 2953–2962, https://doi.org/10.5194/essd-17-2953-2025, 2025.
Bromwich, D. H., Ensign, A., Wang, S. H., and Zou, X.: Major artifacts in ERA5 2-m air temperature trends over Antarctica prior to and during the modern satellite era, Geophys. Res. Lett., 51, e2024GL111907, https://doi.org/10.1029/2024GL111907, 2024.
Burton-Johnson, A., Black, M., Fretwell, P. T., and Kaluza-Gilbert, J.: An automated methodology for differentiating rock from snow, clouds and sea in Antarctica from Landsat 8 imagery: a new rock outcrop map and area estimation for the entire Antarctic continent, The Cryosphere, 10, 1665–1677, https://doi.org/10.5194/tc-10-1665-2016, 2016.
Carrivick, J. L. and Brewer, T. R.: Improving local estimations and regional trends of glacier equilibrium line altitudes, Geogr. Ann. A, 86, 67–79, 2004.
Carrivick, J. L., Davies, B. J., Glasser, N. F., Nývlt, D., and Hambrey, M. J.: Late-Holocene changes in character and behaviour of land-terminating glaciers on James Ross Island, Antarctica, J. Glaciol., 58, 1176–1190, https://doi.org/10.3189/2012JoG11J148, 2012.
Chudley, T. R. and Howat, I. M.: pDEMtools: conveniently search, download, and process ArcticDEM and REMA products, Journal of Open Source Software, 9, 7149, https://doi.org/10.21105/joss.07149, 2024.
Cook, A. J. and Vaughan, D. G.: Overview of areal changes of the ice shelves on the Antarctic Peninsula over the past 50 years, The Cryosphere, 4, 77–98, https://doi.org/10.5194/tc-4-77-2010, 2010.
Cook, A. J., Fox, A. J., Vaughan, D. G., and Ferrigno, J. G.: Retreating glacier fronts on the Antarctic Peninsula over the past half-century, Science, 308, 541–544, 2005.
Cook, A. J., Vaughan, D. G., Luckman, A. J., and Murray, T.: A new Antarctic Peninsula glacier basin inventory and observed area changes since the 1940s, Antarct. Sci., 26, 614–624, https://doi.org/10.1017/S0954102014000200, 2014.
Cook, A. J., Holland, P. R., Meredith, M. P., Murray, T., Luckman, A., and Vaughan, D. G.: Ocean forcing of glacier retreat in the western Antarctic Peninsula, Science, 353, 283–286, https://doi.org/10.1126/science.aae0017, 2016.
Cooper, A. P. R.: Historical observations of Prince Gustav ice shelf, Polar Rec., 33, 285–294, https://doi.org/10.1017/S0032247400025389, 1997.
Copernicus Climate Change Service: ERA5 monthly averaged data on single levels from 1940 to present, Copernicus Climate Change Service (C3S) Climate Data Store (CDS) [data set], https://doi.org/10.24381/cds.f17050d7, 2023.
Copernicus Climate Change Service, Climate Data Store: CMIP6 climate projections, Copernicus Climate Change Service (C3S) Climate Data Store (CDS) [data set], https://doi.org/10.24381/cds.c866074c, 2021.
Copland, L., Sylvestre, T., Bishop, M. P., Shroder, J. F., Seong, Y. B., Owen, L. A., Bush, A., and Kamp, U.: Expanded and recently increased glacier surging in the Karakoram, Arct. Antarct. Alp. Res., 43, 503–516, 2011.
Davison, B. J., Sole, A. J., Cowton, T. R., Lea, J. M., Slater, D. A., Fahrner, D., and Nienow, P. W.: Subglacial drainage evolution modulates seasonal ice flow variability of three tidewater glaciers in southwest Greenland, J. Geophys. Res.-Earth, 125, e2019JF005492, https://doi.org/10.1029/2019JF005492, 2020.
Davison, B. J., Hogg, A. E., Gourmelen, N., Jakob, L., Wuite, J., Nagler, T., Greene, C. A., Andreasen, J., and Engdahl, M. E.: Annual mass budget of Antarctic ice shelves from 1997 to 2021, Science Advances, 9, eadi0186, https://doi.org/10.1126/sciadv.adi0186, 2023.
Davison, B. J., Hogg, A. E., Moffat, C., Meredith, M. P., and Wallis, B. J.: Widespread increase in discharge from west Antarctic Peninsula glaciers since 2018, The Cryosphere, 18, 3237–3251, https://doi.org/10.5194/tc-18-3237-2024, 2024.
Davison, B. J., Hogg, A. E., Slater, T., Rigby, R., and Hansen, N.: Antarctic Ice Sheet grounding line discharge from 1996–2024, Earth Syst. Sci. Data, 17, 3259–3281, https://doi.org/10.5194/essd-17-3259-2025, 2025.
Davison, B., Sole, A., Guillet, G., Benn, D., Kingslake, J., Ely, J., Livingstone, S., Stringer, C. D., Carrivick, J., and Hogg, A.: Glacier surges on James Ross Island, Antarctica, and their relationship with climate: code and data, Zenodo [data set] and [code], https://doi.org/10.5281/zenodo.21276597, 2026.
de Lange, R., Luckman, A., and Murray, T.: Improvement of satellite radar feature tracking for ice velocity derivation by spatial frequency filtering, IEEE T. Geosci. Remote, 45, 2309–2318, https://doi.org/10.1109/TGRS.2007.896615, 2007.
Doake, C. S. M. and Vaughan, D. G.: Breakup of Wordie Ice Shelf, Antarctica, IAHS Publ, 208, 161–165, 1991.
Dowdeswell, J. A., Hodgkins, R., Nuttall, A. M., Hagen, J. O., and Hamilton, G. S.: Mass balance change as a control on the frequency and occurrence of glacier surges in Svalbard, Norwegian High Arctic, Geophys. Res. Lett., 22, 2909–2912, 1995.
Dunse, T., Schellenberger, T., Hagen, J. O., Kääb, A., Schuler, T. V., and Reijmer, C. H.: Glacier-surge mechanisms promoted by a hydro-thermodynamic feedback to summer melt, The Cryosphere, 9, 197–215, https://doi.org/10.5194/tc-9-197-2015, 2015.
Eisen, O., Harrison, W. D., and Raymond, C. F.: The surges of Variegated Glacier, Alaska, USA, and their connection to climate and mass balance, J. Glaciol., 47, 351–358, 2001.
Evans, D. J., Storrar, R. D., and Rea, B. R.: Crevasse-squeeze ridge corridors: diagnostic features of late-stage palaeo-ice stream activity, Geomorphology, 258, 40–50, https://doi.org/10.1016/j.geomorph.2016.01.017, 2016.
Fowler, A. C., Murray, T., and Ng, F. S. L.: Thermally controlled glacier surging, J. Glaciol., 47, 527–538, https://doi.org/10.3189/172756501781831792, 2001.
Gardner, A. S., Fahnestock, M. A., and Scambos, T. A.: MEaSUREs ITS_LIVE Landsat Image-Pair Glacier and Ice Sheet Surface Velocities: Version 1, National Snow and Ice Data Center [data set], https://doi.org/10.5067/IMR9D3PEI28U, 2025.
Gerrish, L.: Automatically extracted rock outcrop dataset for Antarctica (Version 7.2) [Data set], UK Polar Data Centre, Natural Environment Research Council, UK Research & Innovation [data set], https://doi.org/10.5285/9DF510E3-EA1C-450B-9950-D742DB1EFD96, 2020.
Gerrish, L., Ireland, L., Fretwell, P., and Cooper, P.: High resolution vector polylines of the Antarctic coastline – VERSION 7.9 (Version 7.9), NERC EDS UK Polar Data Centre [data set], https://doi.org/10.5285/45c3cc90-098b-45e3-a809-16b80eed4ec2, 2024.
Gorodetskaya, I. V., Durán-Alarcón, C., González-Herrero, S., Clem, K. R., Zou, X., Rowe, P., Rodriguez Imazio, P., Campos, D., Leroy-Dos Santos, C., Dutrievoz, N., and Wille, J. D.: Record-high Antarctic Peninsula temperatures and surface melt in February 2022: a compound event with an intense atmospheric river, npj Clim. Atmos. Sci., 6, 202, https://doi.org/10.1038/s41612-023-00529-6, 2023.
Guillet, G., Benn, D. I., King, O., Shean, D., Mannerfelt, E. S., and Hugonnet, R.: Global detection of glacier surges from surface velocities, elevation change and SAR backscatter data between 2000 and 2024: a test of surge mechanism theories, J. Glaciol., 71, e88, https://doi.org/10.1017/jog.2025.10065, 2025.
Guizar-Sicairos, M., Thurman, S. T., and Fienup, J. R.: Efficient subpixel image registration algorithms, Opt. Lett., 33, 156, https://doi.org/10.1364/OL.33.000156, 2008.
Hersbach, H., Bell, B., Berrisford, P., Hirahara, S., Horányi, A., Muñoz-Sabater, J., Nicolas, J., Peubey, C., Radu, R., Schepers, D., Simmons, A., Soci, C., Abdalla, S., Abellan, X., Balsamo, G., Bechtold, P., Biavati, G., Bidlot, J., Bonavita, M., De Chiara, G., Dahlgren, P., Dee, D., Diamantakis, M., Dragani, R., Flemming, J., Forbes, R., Fuentes, M., Geer, A., Haimberger, L., Healy, S., Hogan, R. J., Hólm, E., Janisková, M., Keeley, S., Laloyaux, P., Lopez, P., Lupu, C., Radnoti, G., de Rosnay, P., Rozum, I., Vamborg, F., Villaume, S., and Thépaut, J. N.: The ERA5 global reanalysis, Q. J. Roy. Meteor. Soc., 146, 1999–2049, https://doi.org/10.1002/qj.3803, 2020.
Hogg, A. E., Shepherd, A., Cornford, S. L., Briggs, K. H., Gourmelen, N., Graham, J. A., Joughin, I., Mouginot, J., Nagler, T., Payne, A. J., and Rignot, E.: Increased ice flow in Western Palmer Land linked to ocean melting, Geophys. Res. Lett., 44, 4159–4167, https://doi.org/10.1002/2016GL072110, 2017.
Hoinkes, H. C.: Surges of the Vernagtferner in the Otztal Alps since 1599, Can. J. Earth Sci., 6, 853–861, 1969.
Howat, I. M., Porter, C., Smith, B. E., Noh, M.-J., and Morin, P.: The Reference Elevation Model of Antarctica, The Cryosphere, 13, 665–674, https://doi.org/10.5194/tc-13-665-2019, 2019.
Howat, I., Porter, C., Noh, M-J., Husby, E., Khuvis, S., Danish, E., Tomko, K., Gardiner, J., Negrete, A., Yadav, B., Klassen, J., Kelleher, C., Cloutier, M., Bakker, J., Enos, J., Arnold, G., Bauer, G., and Morin, P.: The Reference Elevation Model of Antarctica – Mosaics, Version 2, Harvard Dataverse [data set], V1, https://doi.org/10.7910/DVN/EBW8UC, 2022a.
Howat, I., Porter, C., Noh, M-J., Husby, E., Khuvis, S., Danish, E., Tomko, K., Gardiner, J., Negrete, A., Yadav, B., Klassen, J., Kelleher, C., Cloutier, M., Bakker, J., Enos, J., Arnold, G., Bauer, G., and Morin, P.: The Reference Elevation Model of Antarctica – Strips, Version 4.1, Harvard Dataverse [data set], V1, https://doi.org/10.7910/DVN/X7NDNY, 2022b.
James, T. D., Murray, T., Barrand, N. E., Sykes, H. J., Fox, A. J., and King, M. A.: Observations of enhanced thinning in the upper reaches of Svalbard glaciers, The Cryosphere, 6, 1369–1381, https://doi.org/10.5194/tc-6-1369-2012, 2012.
Jiskoot, H.: Glacier Surging, in: Encyclopedia of Snow, Ice and Glaciers, Encyclopedia of Earth Sciences Series, edited by: Singh, V. P., Singh, P., and Haritashya, U. K., Springer, Dordrecht, https://doi.org/10.1007/978-90-481-2642-2_559, 2011
Kamb, B., Raymond, C. F., Harrison, W. D., Engelhardt, H., Echelmeyer, K. A., Humphrey, N., Brugman, M. M., and Pfeffer, T.: Glacier surge mechanism: 1982-1983 surge of Variegated Glacier, Alaska, Science, 227, 469–479, 1985.
Kuipers Munneke, P., Luckman, A. J., Bevan, S. L., Smeets, C. J. P. P., Gilbert, E., Van Den Broeke, M. R., Wang, W., Zender, C., Hubbard, B., Ashmore, D., and Orr, A.: Intense winter surface melt on an Antarctic ice shelf, Geophys. Res. Lett., 45, 7615–7623, https://doi.org/10.1029/2018GL077899, 2018.
Lea, J. M.: The Google Earth Engine Digitisation Tool (GEEDiT) and the Margin change Quantification Tool (MaQiT) – simple tools for the rapid mapping and quantification of changing Earth surface margins, Earth Surf. Dynam., 6, 551–561, https://doi.org/10.5194/esurf-6-551-2018, 2018.
Lovell, H., Carrivick, J. L., King, O., Sutherland, J. L., Yde, J. C., Boston, C. M., and Małecki, J.: Surge-type glaciers in Kalaallit Nunaat (Greenland): distribution, temporal patterns and climatic controls, J. Glaciol., 69, 1785–1802, 2023.
Lovell, H., Benn, D. I., Jiskoot, H., Stokes, C. R., Flowers, G. E., Guillet, G., Mannerfelt, E. S., Falaschi, D., Kääb, A., King, O., and Benediktsson, Í.Ö.: Glacier surging and surge-related hazards in a changing climate, Nat. Rev. Earth Environ., 1–19, https://doi.org/10.1038/s43017-025-00757-9, 2026.
MacAyeal, D. R., Scambos, T. A., Hulbe, C. L., and Fahnestock, M. A.: Catastrophic ice-shelf break-up by an ice-shelf-fragment-capsize mechanism, J. Glaciol., 49, 22–36, https://doi.org/10.3189/172756503781830863, 2003.
Mouginot, J., Scheuchl, B., and Rignot, E.: MEaSUREs Antarctic Boundaries for IPY 2007–2009 from Satellite Radar, (NSIDC-0709, Version 2), NASA National Snow and Ice Data Center Distributed Active Archive Center [data set], Boulder, Colorado USA, https://doi.org/10.5067/AXE4121732AD, 2017.
Muñoz-Sabater, J., Dutra, E., Agustí-Panareda, A., Albergel, C., Arduini, G., Balsamo, G., Boussetta, S., Choulga, M., Harrigan, S., Hersbach, H., Martens, B., Miralles, D. G., Piles, M., Rodríguez-Fernández, N. J., Zsoter, E., Buontempo, C., and Thépaut, J.-N.: ERA5-Land: a state-of-the-art global reanalysis dataset for land applications, Earth Syst. Sci. Data, 13, 4349–4383, https://doi.org/10.5194/essd-13-4349-2021, 2021.
Murray, T., Strozzi, T., Luckman, A., Jiskoot, H., and Christakos, P.: Is there a single surge mechanism? Contrasts in dynamics between glacier surges in Svalbard and other regions, J. Geophys. Res.-Sol. Ea., 108, https://doi.org/10.1029/2002JB001906, 2003.
Nichols, R. L.: Geomorphology of Marguerite Bay area, Palmer Peninsula, Antarctica, Geol. Soc. Am. Bull., 71, 1421–1450, 1960.
Nichols, R. L.: Antarctic glacial surges?, J. Glaciol., 12, 524–525, https://doi.org/10.3189/S0022143000031981, 1973.
Ochwat, N. E., Scambos, T. A., Banwell, A. F., Anderson, R. S., Maclennan, M. L., Picard, G., Shates, J. A., Marinsek, S., Margonari, L., Truffer, M., and Pettit, E. C.: Triggers of the 2022 Larsen B multi-year landfast sea ice breakout and initial glacier response, The Cryosphere, 18, 1709–1731, https://doi.org/10.5194/tc-18-1709-2024, 2024.
O'Neill, B. C., Tebaldi, C., van Vuuren, D. P., Eyring, V., Friedlingstein, P., Hurtt, G., Knutti, R., Kriegler, E., Lamarque, J.-F., Lowe, J., Meehl, G. A., Moss, R., Riahi, K., and Sanderson, B. M.: The Scenario Model Intercomparison Project (ScenarioMIP) for CMIP6, Geosci. Model Dev., 9, 3461–3482, https://doi.org/10.5194/gmd-9-3461-2016, 2016.
Rack, W. and Rott, H.: Pattern of retreat and disintegration of the Larsen B ice shelf, Antarctic Peninsula, Ann. Glaciol., 39, 505–510, https://doi.org/10.3189/172756404781814005, 2004.
Rea, B. R. and Evans, D. J.: An assessment of surge-induced crevassing and the formation of crevasse squeeze ridges, J. Geophys. Res.-Earth, 116, https://doi.org/10.1029/2011JF001970, 2011.
Rignot, E., Casassa, G., Gogineni, P., Krabill, W., Rivera, A. U., and Thomas, R.: Accelerated ice discharge from the Antarctic Peninsula following the collapse of Larsen B ice shelf, Geophys. Res. Lett., 31, https://doi.org/10.1029/2004GL020697, 2004.
Rivers, G. E., Storrar, R. D., Jones, A. H., and Ojala, A. E.: 3D morphometry of De Geer Moraines and Crevasse-Squeeze Ridges: Differentiating between pushing and squeezing mechanisms from remotely sensed data, Quaternary Sci. Rev., 321, 108383, https://doi.org/10.1016/j.quascirev.2023.108383, 2023.
Rosenau, R., Scheinert, M., and Dietrich, R.: A processing system to monitor Greenland outlet glacier velocity variations at decadal and seasonal time scales utilizing the Landsat imagery, Remote Sens. Environ., 169, 1–19, https://doi.org/10.1016/j.rse.2015.07.012, 2015.
Rott, H., Skvarca, P., and Nagler, T.: Rapid collapse of northern Larsen ice shelf, Antarctica, Science, 271, 788–792, https://doi.org/10.1126/science.271.5250.788, 1996.
Rott, H., Abdel Jaber, W., Wuite, J., Scheiblauer, S., Floricioiu, D., van Wessem, J. M., Nagler, T., Miranda, N., and van den Broeke, M. R.: Changing pattern of ice flow and mass balance for glaciers discharging into the Larsen A and B embayments, Antarctic Peninsula, 2011 to 2016, The Cryosphere, 12, 1273–1291, https://doi.org/10.5194/tc-12-1273-2018, 2018.
Rott, H., Wuite, J., De Rydt, J., Gudmundsson, G. H., Floricioiu, D., and Rack, W.: Impact of marine processes on flow dynamics of northern Antarctic Peninsula outlet glaciers, Nat. Commun., 11, 2969, https://doi.org/10.1038/s41467-020-16658-y, 2020.
Sandwell, D., Mellors, R., Tong, X., Wei, M., and Wessel, P.: GMTSAR: An InSAR processing system based on generic mapping tools, https://escholarship.org/uc/item/8zq2c02m (last access: 15 July 2026), 2011a.
Sandwell, D., Mellors, R., Tong, X., Wei, M., and Wessel, P.: Open radar interferometry software for mapping surface deformation, Eos T. Am. Geophys. Un., 92, 234, https://doi.org/10.1029/2011EO280002, 2011b.
Scambos, T. A., Bohlander, J. A., Shuman, C. A., and Skvarca, P.: Glacier acceleration and thinning after ice shelf collapse in the Larsen B embayment, Antarctica, Geophys. Res. Lett., 31, https://doi.org/10.1029/2004GL020670, 2004.
Seehaus, T., Cook, A. J., Silva, A. B., and Braun, M.: Changes in glacier dynamics in the northern Antarctic Peninsula since 1985, The Cryosphere, 12, 577–594, https://doi.org/10.5194/tc-12-577-2018, 2018.
Sevestre, H. and Benn, D. I.: Climatic and geometric controls on the global distribution of surge-type glaciers: implications for a unifying model of surging, J. Glaciol., 61, 646–662, https://doi.org/10.3189/2015JoG14J136, 2015.
Sevestre, H., Benn, D. I., Luckman, A., Nuth, C., Kohler, J., Lindbäck, K., and Pettersson, R.: Tidewater glacier surges initiated at the terminus, J. Geophys. Res.-Earth, 123, 1035–1051, https://doi.org/10.1029/2017JF004358, 2018.
Stringer, C. D., Macfee, M. W., Carrivick, J. L., Láska, K., Engel, Z., Matějka, M., Harpur, C., Nývlt, D., Quincey, D. J., and Davies, B. J.: Accelerated glacier changes on the James Ross Archipelago, Antarctica, from 2010 to 2023, J. Glaciol., 71, e102, https://doi.org/10.1017/jog.2025.10075, 2025.
Sun, Y., Riel, B., and Minchew, B.: Disintegration and buttressing effect of the landfast sea ice in the Larsen B embayment, Antarctic Peninsula, Geophys. Res. Lett., 50, e2023GL104066, https://doi.org/10.1029/2023GL104066, 2023.
Surawy-Stepney, T., Hogg, A. E., Cornford, S. L., Wallis, B. J., Davison, B. J., Selley, H. L., Slater, R. A. W., Lie, E. K., Jakob, L., Ridout, A., Gourmelen, N., Freer, B. I. D., Wilson, S. F., and Shepherd, A.: The effect of landfast sea ice buttressing on ice dynamic speedup in the Larsen B embayment, Antarctica, The Cryosphere, 18, 977–993, https://doi.org/10.5194/tc-18-977-2024, 2024.
Terleth, Y., Bartholomaus, T. C., Enderlin, E., Mikesell, T. D., and Liu, J.: Glacier surges and seasonal speedups integrated into a single, enthalpy-based model framework, Geophys. Res. Lett., 51, e2024GL112514, https://doi.org/10.1029/2024GL112514, 2024.
Thielicke, W. and Stamhuis, E. J.: PIVlab – Towards user-friendly, affordable and accurate digital particle image velocimetry in MATLAB, Journal of Open Research Software, 2, e30, https://doi.org/10.5334/jors.bl, 2014.
Tuckett, P. A., Ely, J. C., Sole, A. J., Livingstone, S. J., Davison, B. J., Melchior van Wessem, J., and Howard, J.: Rapid accelerations of Antarctic Peninsula outlet glaciers driven by surface melt, Nat. Commun., 10, 4311, https://doi.org/10.1038/s41467-019-12039-2, 2019.
Tuckett, P. A., Ely, J. C., Sole, A. J., Livingstone, S. J., Davison, B. J., and Melchior van Wessem, J.: Reply to: “Impact of marine processes on flow dynamics of northern Antarctic Peninsula outlet glaciers” by Rott et al., Nat. Commun., 11, 2970, https://doi.org/10.1038/s41467-020-16685-9, 2020.
Turner, J., Colwell, S. R., Marshall, G. J., Lachlan-Cope, T. A., Carleton, A. M., Jones, P. D., Lagun, V., Reid, P. A., and Iagovkina, S.: The SCAR READER project: toward a high-quality database of mean Antarctic meteorological observations, J. Climate, 17, 2890–2898, https://doi.org/10.1175/1520-0442(2004)017%3C2890:TSRPTA%3E2.0.CO;2, 2004.
Wallis, B. J., Hogg, A. E., van Wessem, J. M., Davison, B. J., and van den Broeke, M. R.: Widespread seasonal speed-up of west Antarctic Peninsula glaciers from 2014 to 2021, Nat. Geosci., 16, 231–237, https://doi.org/10.1038/s41561-023-01131-4, 2023a.
Wallis, B. J., Hogg, A. E., Meredith, M. P., Close, R., Hardy, D., McMillan, M., Wuite, J., Nagler, T., and Moffat, C.: Ocean warming drives rapid dynamic activation of marine-terminating glacier on the west Antarctic Peninsula, Nat. Commun., 14, 7535, https://doi.org/10.1038/s41467-023-42970-4, 2023b.
Wuite, J., Rott, H., Hetzenecker, M., Floricioiu, D., De Rydt, J., Gudmundsson, G. H., Nagler, T., and Kern, M.: Evolution of surface velocities and ice discharge of Larsen B outlet glaciers from 1995 to 2013, The Cryosphere, 9, 957–969, https://doi.org/10.5194/tc-9-957-2015, 2015.