
the Creative Commons Attribution 4.0 License.
the Creative Commons Attribution 4.0 License.
 | 06 Aug 2026
Current morphodynamics and subsurface structure of thrust moraines and rock glaciers connected to three Little Ice Age glacier forefields in the Swiss Alps
Julius Kunz
Sebastian Buchelt
Tim Wiegand
Tobias Ullmann
Christof Kneisel
Glacier-permafrost interactions significantly influenced geomorphological processes in several glacier forefields in the European Alps during the Little Ice Age glacier advances. The resulting landforms, thrust moraine complexes, and glacier-forefield-connected rock glaciers, no longer show any active glacier-permafrost interaction today, but their internal structure – e.g., incorporated sedimentary ice – and recent morphodynamics are still influenced by the former interaction. Since these landforms are highly sensitive to changes in external climatic conditions due to their high ice content, it is essential to understand the relationships between underground structures and surface morphodynamics in order to assess landscape development under the influence of climate change. This study investigates the internal structure (e.g., ground ice distribution and characteristics) and surface morphodynamics (kinematic behavior) of both landform types aiming to determine the relationship between both. We combined electrical resistivity tomography (ERT) for assessing subsurface resistivity with Differential Interferometric Synthetic Aperture Radar (DInSAR) to derive surface displacement patterns. The study focuses on three glacier forefields in two valleys in the Valais region (Swiss Alps), analyzing spatial movement patterns and their correlation with subsurface properties through regression analysis. ERT revealed distinct differences between the ice-rich thrust moraine complexes and the more heterogeneous internal structure of the investigated rock glaciers. DInSAR-derived displacement patterns showed that the investigated moraine complexes exhibit predominantly vertical subsidence with high seasonal variability, while the rock glaciers display more consistent horizontal movement. Regression analysis confirmed strong correlations between high-resistivity zones and surface movement rates in thrust moraine complexes, with the maximum electrical resistivity of the subsurface correlating with absolute horizontal displacement (R2=0.75) and elevation change (R2=0.76). Instead, rock glaciers exhibited weaker correlations (R2≤0.3), likely due to heterogeneous internal structures and more complex creep processes, which differ from the subsidence-dominated movements in the ice-rich moraines. These findings underscore the importance of distinguishing between thrust moraines and rock glaciers in permafrost studies and climate change assessments, since the different landform types might react morphologically differently to changing climate conditions.
- Article
(11518 KB) - Full-text XML
- BibTeX
- EndNote


Due to higher temperatures and changed precipitation patterns with lower amounts of snow and higher proportions of rain throughout the year, glaciers in the European Alps are shrinking (Huss et al., 2015; Sommer et al., 2020; Vincent et al., 2017), while rising temperatures result in permafrost warming and degradation in many places (Biskaborn et al., 2019; Buckel et al., 2023; Noetzli et al., 2024). These climatological changes lead to morphological adjustments in the corresponding areas, such as increasing or decreasing creep rates of rock glaciers (e.g., Fleischer et al., 2021; Kellerer-Pirklbauer et al., 2024; Marcer et al., 2019), higher frequencies of rockfall events (e.g. Hartmeyer and Otto, 2024; Pfluger et al., 2025) or thermokarst phenomena (e.g. Cusicanqui et al., 2023). Especially in areas where permafrost and glaciers have interacted in the past, high amounts of sedimentary ice are incorporated in thrust moraines and other glacial and periglacial landforms like hummocky moraines or rock glaciers (Waller, 2024). In the European Alps, the last intense interactions between glaciers and permafrost took place during the glacial advance of the Little Ice Age (LIA) around 1850 CE, when especially small cirque glaciers advanced into proglacial areas partly underlain by permafrost (Haeberli, 2005; Kneisel, 2003). Most of the larger glaciers in the Alps advanced far below the local lower altitudinal limit of permafrost at this time, so interactions could mostly only take place in higher-elevated glacier forefields of smaller cirque glaciers. The often polythermal character of these smaller glaciers – especially the cold-based margins – enabled transmission of glacial stress into the frozen proglacial debris masses overridden by the glacier or in contact at its front and resulted in large-scale morphological overprinting in the proglacial areas (Haeberli, 1979). During this overprinting, thrust moraine complexes – also termed push moraines (e.g. Haeberli, 1979) or glacitectonized frozen landforms (e.g., Wee and Delaloye, 2022) – were built up. Whereas these landforms are mainly known from polar regions (e.g., Waller et al., 2012), only few studies focus on thrust moraine complexes in alpine environments (e.g., Evin, 1992; Kneisel and Kääb, 2007; Lugon et al., 2004; Monnier et al., 2011; Reynard et al., 2003; Ribolini et al., 2010), even though in mountain areas like the European Alps, these structures can be particularly large compared to the size of the advancing glacier. Thereby, not only displacement and deformation of frozen sediment took place but also incorporation of massive sedimentary ice might have occured (e.g., Etzelmüller and Hagen, 2005; Gärtner-Roer et al., 2022; Kääb et al., 1997; Kneisel et al., 2000; Kunz et al., 2022; Wee and Delaloye, 2022, Wee, 2025). The insulating debris cover ensured that the structures remained comparatively stable in the subsequent retreat phase of the glaciers and changed less from a morphological point of view compared to the retreating glaciers (cf. Etzelmüller and Hagen, 2005; Harris and Murton, 2005). Nevertheless, some of these landforms show high sensitivity to further increasing temperatures, and once ice melting is initialized, due to high ice contents, subsidence or thermokarst processes occur. A few studies observed the recent surface morphodynamics in glacier forefields using in situ or remote sensing-based approaches (Cusicanqui et al., 2023; Kneisel and Kääb, 2007; Kunz et al., 2022; Wee et al., 2024; Wee and Delaloye, 2022) and assumed direct relationships between morphodynamics and the distribution and type of ground ice. All these studies have confirmed that thrust moraines can contain large quantities of sedimentary ice and that these moraines often develop their own movement in response to pressure relief during and after deglaciation, but also due to glacial-periglacial/paraglacial transformation or due to potential ice degradation. However, the specific relationships between the observed surface morphodynamics and the subsurface structures have not yet been sufficiently investigated in detail. Movements in this context can have various causes: subsidence due to ice melt, internal deformation in massive ice, or permafrost creep. The extent to which the dominant process is influenced by the type and distribution of ground ice, and the extent to which it in turn affects the magnitude and characteristics of the resulting surface movement, is not yet clear. However, systematic information on causal relationships between the recent surface movement and the existing subsurface properties (ice content and ice type) are still scarce for thrust moraine complexes, as well as for glacier-forefield-connected rock glaciers.
Therefore, we aim to investigate the following research questions in this study: (i) What is the current internal structure of selected thrust moraine complexes in the Swiss Alps and are there differences to neighbouring glacier forefield-connected rock glaciers? (ii) Which characteristics describe the surface morphodynamics in the area of the respective landforms? (iii) Are there any linkages between subsurface structure and current surface morphodynamics, and do these relationships differ between the investigated landform types in a way that allows distinguishing between their dominant geomorphic processes and present-day evolution (e.g. permafrost creep, subsidence and thermokarst, or gravitational processes)?
To address these questions, we use a combined approach of electrical resistivity tomography (ERT) surveying and remote-sensing-based surface displacement analysis using Differential Interferometric Synthetic Aperture Radar (DInSAR). The integration of both methods enables a direct comparison of subsurface properties and recent surface dynamics, providing a framework to evaluate how internal structure influences contemporary morphodynamics and whether such relationships differ between glacial and periglacial landforms. ERT has already demonstrated its suitability for detecting permafrost and differentiating between types of ice in the past (Haeberli and Vonder Mühll, 1996; Hauck, 2013; Herring et al., 2023; Kneisel, 2006; Kneisel et al., 2008). Therefore, two- (2D) and quasi-three-dimensional (q3D) approaches are used in this study to obtain multidimensional, larger-scale information about the internal structures of the thrust moraines and adjacent rock glaciers. In addition, DInSAR – a method that has been applied in alpine environments for several decades (Kenyi and Kaufmann, 2003; Rott et al., 1999), and is now frequently used to study alpine periglacial geomorphology and morphodynamics (e.g., Bertone et al., 2022; Strozzi et al., 2020; Villarroel et al., 2022) – is here implemented to detect surface displacement patterns and their seasonal variations, following the appraoch of Buchelt et al. (2023, 2024). While satellite-based DInSAR measures displacement in the satellite line-of-sight (LOS) direction and is therefore only weakly sensitive to north–south movements in near-polar orbit configurations, its application in alpine environments is generally restricted to snow-free periods. Nevertheless, it provides data at high temporal resolution and large spatial coverage, allowing seasonal variations in surface displacement to be assessed more systematically (Buchelt et al., 2023, 2024), whereas UAV-based feature tracking approaches (Blöthe et al., 2021; Vivero et al., 2022) or direct kinematic measurements (Cicoira et al., 2022; Kenner et al., 2017) are spatio-temporally restricted and often time-consuming.
The investigated glacier forefields are all located in the Valais, Swiss Alps, a region well known for the continental climate and the coexistence of glaciers and permafrost. Nevertheless, the region is characterized by strong gradients, particularly due to the pronounced relief, which is reflected in a clear regional precipitation pattern besides the normal altitudinal thermal gradient. The northern part of the Valais, where the Oberferden glacier forefield is located, shows higher precipitation than the southern part, where the Pipji and the Barrwang glacier forefields are located (MeteoSwiss, 2023a). In the following a brief overview of the three study sites is given.
2.1 Pipji and Barrwang Glacier Forefields
The Pipji Valley (Fig. 1a, c, and e) is an eastern tributary of the Turtmann Valley at its southern terminus. The valley is surrounded by the Längi Egga crest (3079 m a.s.l., meter above sea level) in the north, and by the continuous, encircling crest on to the major north-facing walls of the Üssers Barrhorn (3610 m a.s.l.) in the south. The flanks of the mountain slopes and the valley floor are characterized by the former glaciation and the periglacial overprint. The Pipji Glacier, the main glacier of the valley, as well as the distinctly smaller Barrwang Glacier created large moraine structures during their LIA advances but also in previous Holocene advances, which provided the debris for rock glacier formation in the Pipji glacier forefield. Due to several glacial advances and successive phases of rock glacier formation, the Pipji rock glacier (PI_RG) consists of three different units (Units I–III, see Fig. 2a) (Tatenhove and Dikau, 1990). The orographically right side of the Pipji forefield, including the former lateral moraine and parts of the rlock glacier, shows clear signs of back-creeping processes today. These are morphologically discernible in the forefield and are also evident when examining high-resolution orthoimages (Swisstopo). Further south, towards the Barrhorn, the Barrwang Glacier formed a thrust moraine complex (BW_TM), which is situated 2650–2720 m a.s.l. Close by, to the west, a smaller rock glacier complex can also be found (Nyenhuis, 2005; Otto, 2006). The geology in the valley is dominated by gneiss and mica shists of the Siviez-Mischabel-Nappe in the north and by dolomites and marble in the south (Bearth, 1980). Climatic stations in the vicinity and especially at a comparable altitude are rare in the area, but Otto (2006) reported an average annual temperature of −1.2 °C in the period 2002–2005 in the neighbouring Hungerlitälli at a comparable altitude (2770 m a.s.l.) and aspect. This also matches the values provided by (MeteoSwiss, 2023a, b), which indicate a mean annual air temperature of between −1 and −2 °C and annual precipitation between 900 and 1100 mm (1991–2020) for the Pipji Valley.
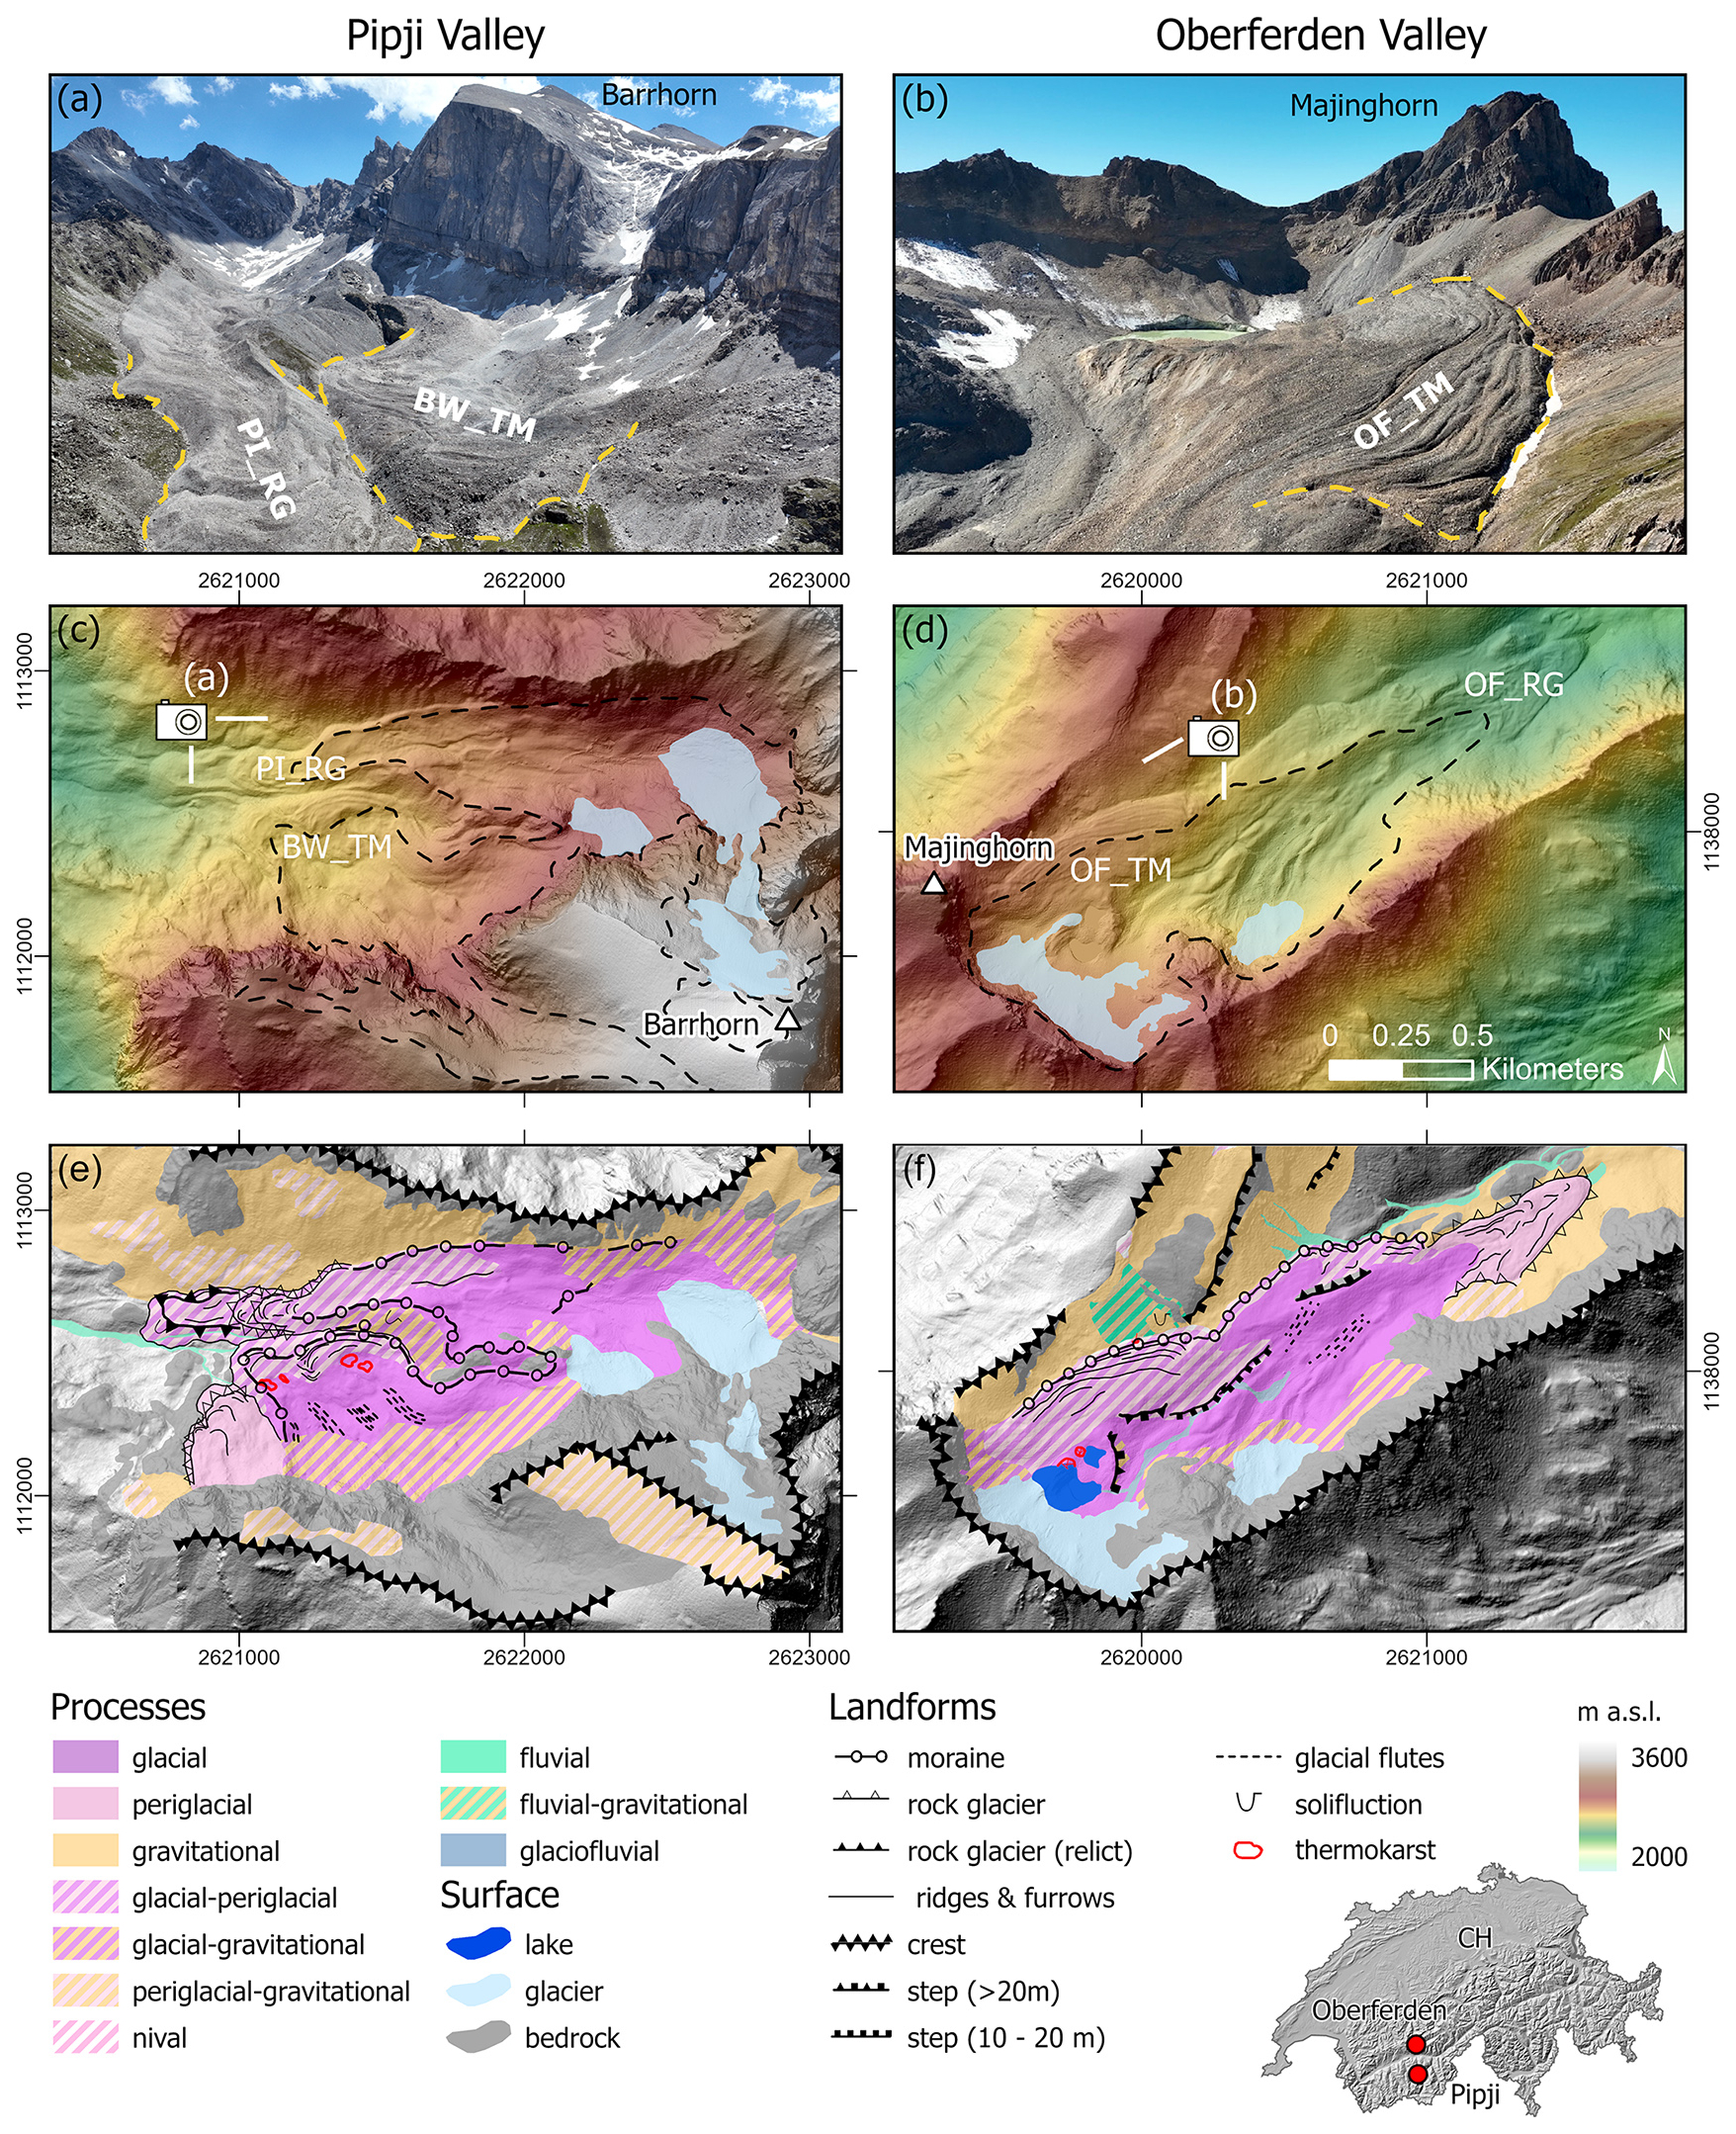
Figure 1Overview of the Pipji Valley (left column) and Oberferden Valley (right column). Aerial images of the study sites are shown in (a, b). The middle panels (c, d) present the relief of the study sites including the glacial extent of the Little Ice Age (1850 AD) and the image positions of (a, b). Geomorphological maps of the sites are shown in the lower panels (e, f). Mapping was conducted based on aerial images, digital elevation models and field observations in summer 2023 and 2024. Basemaps provided by © swisstopo.
2.2 Oberferden Glacier Forefield
The Oberferden Glacier forefield (Fig. 1b, d, and f) is located at the northwestern edge of the Lötschen Valley, northwest of the municipality of Ferden. The valley is surrounded by the summits of Schwarz- and Mauerhorn (2930 and 2943 m a.s.l.) in the south, the Majinghorn (3053 m a.s.l.) in the west as well as the Ferdenrothorn (3179 m a.s.l.) in the north. The climate is characterized by mean annual air temperatures between −3 and −1 °C (MeteoSwiss, 2023b) and mean annual precipitation between 1300 and 1500 mm (MeteoSwiss, 2023a). The morphology of the valley is distinctly shaped by glacial and periglacial processes and is dominated by a large thrust moraine complex (OF_TM) in the upper part and a rock glacier (OF_RG) in the central part (cf. Fig. 1d). The investigated thrust moraine complex was formed north of the former Oberferden glacier at 2640 and 2810 m a.s.l. It measures about 850 m in length and about 300 m in width, and typical parallel or subparallel ridge structures characterize its surface due to glaciotectonic deformation. In addition, the thrust moraine complex shows clear signs of back-creep towards the glacier forefield, which is evident today in a distinct terrain step. A second thrust moraine complex developed further down in the valley between 2580 and 2600 m a.s.l., where the former glacier has overridden a bedrock ridge in the middle of the valley. The glacier-forefield-connected rock glacier is located at the eastern and lower end of the glacier forefield between 2400 and 2580 m a.s.l. It is about 700 m long, max. 250 m wide and northeast exposed. The source of the material embedded in the rock glacier seems to be polygenetic. The orographic left side seems to be moraine-derived from a former end moraine of the Oberferden glacier. In contrast, the orographic right part appears to be talus-derived and originates from the north-exposed talus slopes between Schwarzhorn and Mandlischfurgga. Due to this, there is also a difference in substrate properties with rather medium-grained sediments on the left and rather coarse blocky material on the right half of the rock glacier.
3.1 Electrical Resistivity Tomography
Electrical resistivity tomography (ERT) was used to investigate the subsurface structure within the different thrust moraine complexes and rock glaciers. The method is common in the field of periglacial morphology and uses electrical current to determine the subsurface resistivity, which is affected by the presence of permafrost and the amount and kind of ice within the subsurface (Hauck, 2013; Herring et al., 2023; Kneisel et al., 2008). To get a comprehensive overview of the ground structure within the investigated landforms, several reconnaissance profiles were measured using a Syscal Pro Switch 72 (IRIS Instruments, Orléans, France) device, 36 electrodes, and an electrode spacing of 5 m. On both rock glaciers and the Oberferden thrust moraine complex, a roll-along approach was conducted to cover larger areas. A q3D approach comprising several parallel measurement profiles was performed at the two thrust moraine complexes to generate comparatively large multidimensional subsurface models covering areas of 175 m×120 m and 175 m×180 m. The setup of the q3D grids was adapted to the research question and the local conditions. Fourfold electrode spacing was used as interline spacing, which is higher than recommended by Gharibi and Bentley (2005) or Rödder and Kneisel (2012b), for example, but seems to be enough to detect the differences in the large-scale structure of the thrust moraine complexes. Profiles were only measured in parallel, as perpendicular profiles could be omitted due to the good consistency of the profiles and the expected subsurface structures. The grid positions as well as the locations of all reconnaissance profiles are shown in the respective result figures.
All measurements were conducted during the late summer seasons (late August to early October) in 2023 and 2024. Weather conditions during the measurements and throughout the days prior to measurements were rather dry, except for the large three-dimensional (3D) model in the Oberferden forefield which was measured under moist conditions. The coarse-grained materials, as common on rock glaciers and alpine thrust moraine complexes, affect the ground coupling of the electrodes especially in dry periods due to the lack of fine-grained, conductive sediments. Therefore, ground coupling was enhanced in necessary cases using water-soaked sponges as recommended for such environments (Herring et al., 2023; Vonder Mühll, 1993).
The subsequent data (pre-) processing included filtering by stack deviation (<5 %), incorporation of coordinates and elevation derived from DGPS and high-resolution digital elevation models (SwissALTI3D DEM), as well as an iterative inversion using the software Boundless Electrical Resistivity Tomography (BERT, v. 2.3.0.) according to Günther et al. (2006) and Rücker et al. (2006). The misfit between the generated models and the measured data is given as root-mean-square error (RMSE) for each ERT profile in the respective figure.
3.2 Differential Interferometry Synthetic Aperture Radar
The surface displacement in both study areas was investigated using the Differential Interferometry Synthetic Aperture Radar (DInSAR) approach developed by Buchelt et al. (2023) and C-band SAR data of the Sentinel-1 Copernicus satellite constellation (Sentinel-1 A and B). We used Single Look Complex (SLC) data in Interferometric Wide swath (IW) mode from two different orbits (relative orbit nr.: 139 – descending orbit; 088 – ascending orbit) with a temporal baseline of 6 d. The investigated period was from January 2017–December 2021, limited by the failure of Sentinel-1B in December 2021, resulting in 298 acquisitions from descending orbit and 295 acquisitions from ascending orbit. The individual methodological steps are shortly described in the following (see Buchelt et al., 2023 for details), starting with SAR image processing in esa_snappy (python wrapper for ESA SNAP functionalities): (i) applying a recent orbit files; (ii) splitting the bursts of interest; (iii) coregistering of two consecutive SAR images; (iv) correcting for enhanced spectral diversity; (v) generation of differential interferograms with topographic phase removal using the SwissALTI3D DEM; (vi) debursting; (vii) phase filtering with a weak Goldstein Phase Filter; (viii) phase unwrapping using snaphu (Chen and Zebker, 2002); (ix) projection and resampling into Cartesian coordinates with a 5 m ground sampling distance. Interferograms with mean coherence below 0.5 were excluded to avoid decorrelation issues. Resulting gaps from occasional snowfall during the snow-free summer months were filled using interferograms with longer baselines (12–18 d).
Continuous time series stacks were then processed using pyrate (v0.5) by Geoscience Australia for additional corrections: (i) low-coherence (<0.3) pixel masking; (ii) stable reference phase identification and subtraction; (iii) orbit error correction; (iv) atmospheric phase screen adjustments. The final output was a 6 d Line-of-Sight (LOS) displacement rate time series, used for displacement decomposition and seasonal surface movement analysis. Areas affected by radar shadow or layover were masked using the SwissALTI3D DEM to ensure data reliability. However, these limitations are minimal for the investigated landforms.
For calculating annual LOS displacement, the time series was first stacked to minimize atmospheric artifacts (e.g., Rouyet et al., 2019; Sandwell and Price, 1998), then divided by the number of years covered with the time series (five) and multiplied by three in order to account for DInSAR's reduced temporal coverage (Buchelt et al., 2023), which is limited to roughly one third of the year (snow-free summer months). As previous studies (e.g., Wirz et al., 2016; Cicoira et al., 2022) have shown slower winter velocities, this extrapolation might partially overestimate annual surface movement, particularly in areas with high seasonal variability. Displacement decomposition was then applied to convert annual LOS displacement into east–west (E–W) and up–down (U–D) components, using a simplified geometry that excluded the north–south component. Even though the predominant orientation of the landforms follows an east–west direction, north–south surface movement is also expected in proximal zones of the thrust moraine complexes due to the known back-creep of such landforms toward the glacier forefield (cf. Kneisel and Kääb, 2007; Wee and Delaloye, 2022), but cannot be resolved solely by the DInSAR approach. Besides, U–D displacement reflects not just elevation changes but also slope-parallel movement on inclined slopes. To determine true elevation change, the vertical displacement was corrected for slope-induced effects using local inclination of the surface topography and E–W movement rates (e.g., Buchelt et al., 2024; Crippa et al., 2020; Eriksen et al., 2018). For determining the seasonal dynamics (i.e. movement variations between early and late summer), the following parameter was derived from the 6 d LOS displacement time series (Buchelt et al., 2023): Absolute seasonality is defined as the difference between median movement rates in June/July (early snow-free summer) and September (late snow-free summer) in (6 d=the observation window of one interferogram). The orbit with higher sensitivity in LOS was used for the respective site (Pipji: descending; Oberferden: ascending). The DInSAR-derived seasonality captures only the variability within the snow-free months, missing early acceleration during snowmelt when water infiltrates shear horizons (Kenner et al., 2017, 2020; Wirz et al., 2016).
3.3 Flowfield analysis
To provide additional information on the flowfield of the surface movements within the investigated areas, a basic feature tracking approach was conducted using the SAGA-GIS based image correlation (IMCORR) approach (Bremer, 2012). Using high-resolution orthoimages from 2017 and 2023 (both provided by Swisstopo), a search chip size of 64×64 pixels, a reference chip size of 32×32 pixels and a grid spacing of 25 m, the approach delivered detailed data about the orientation of the surface movement. Due to the limited availability and the comparatively large timestep of the orthoimages, there are no information on annual variability or seasonal behaviour and the result should only be viewed as information about the direction of the surface movements. They essentially serve to supplement the missing information regarding the north–south component of surface movements.
3.4 Quantitative analysis of subsurface resistivities and surface movement parameters
To investigate the relationship between surface movement and subsurface properties, the morphodynamic parameters of elevation change, horizontal displacement and seasonality are compared to the inverted resistivity values of the respective landform units, since resistivity is directly affected by the ice content and ice type. A direct derivation of ice contents is not possible without further information, but different resistivity ranges are characteristic for different permafrost properties and ice contents (Haeberli and Vonder Mühll, 1996; Kneisel, 2006). To carry out a statistical evaluation, the maximum resistivity per remote sensing pixel was determined. For this purpose, the pixel boundaries of the SAR data were transferred to the ERT profile lengths (profiles Figs. 2c, d, 3b, c and 4a, b) and the maximum value over the entire depth column in the area of the respective pixel was determined. The active layer, that can have high-resistive cells due to, e.g., air-filled voids, was excluded from the analysis to ensure that the resistivity values reflect frozen ground. This confirmed that the highest values were always in deeper layers and are therefore representative. Since the wide range of the resistivity values within the individual landforms might affect a correlation, the data points were grouped depending on the maximum resistivity value in a second step. The threshold values of the groups were set based on geomorphologic-geophysical knowledge from former studies (Bosson et al., 2014; Haeberli and Vonder Mühll, 1996; Kneisel, 2006): (1) permafrost unlikely (<10 kΩ m), (2) low-resistive permafrost (probably ice-poor) (), (3) high-resistive permafrost (probably ice-rich) () and (4) sedimentary/massive ice (>1 MΩ m). These four classes represent the main subsurface characteristics of the glacier forefields and should be investigated separately concerning the surface morphodynamics in the respective areas.
Regression analysis was conducted using Pearson's correlation coefficient (R) to assess the linear relationships between variables. Additionally, the coefficient of determination (R2), derived from squared Pearson's R, was used to evaluate the proportion of explained variance. A simple linear relationship was assumed in the absence of better knowledge on this issue, providing a first-order assessment of the association between surface displacement, resistivity, and morphometric parameters. A root-mean-square error (RMSE) was calculated to obtain a measure of the quality of the fit. In addition, a significance test was performed for each correlation, assuming a confidence level (α) of 5 %. Correspondingly, significant correlations are marked with an “*” in the following.
4.1 Internal structure of the different landforms
In Fig. 2, a 3D ERT model and a 2D cross profile of the BW_TM, as well as a longitudinal profile along the neighbouring rock glacier (PI_RG) are shown. The cross profile (Fig. 2c) presents a two-layered structure of the thrust moraine complex, with a low resistive (<15 kΩ m), about 5 m thick surface-parallel upper layer and a large, high-resistive structure below. The upper layer is interpreted as the active layer, whereas the very high-resistive structure with resistivity values of up to 6 MΩ m is interpreted as a massive, sedimentary ice core of the BW_TM. In the first 25 m of the profile, the high-resistive structure is missing as it represents the area outside the thrust moraine complex. Towards the end of the profile (>130 m profile length), spanning across a thermokarst depression adjacent to the proximal flank of the thrust moraine complex, a two-layered structure is present, but the resistivities in the deeper layer are distinctly lower than in the central part and are in a range between 40 and 50 kΩ m. This structure is also confirmed by the ERT grid (Fig. 2b), which covers large parts of the thrust moraine complex. Below the main ridge structures, resistivity values are above 1 MΩ m for the entire area and reach up to more than 6 MΩ m. Therefore, it is assumed that most of the complex is underlain by a massive ice core consisting of sedimentary ice, which is confirmed by massive ice exposures due to thermokarst processes during the last decades, which are visible also in remote sensing data (e.g., Planet Scope, Swisstopo). In the area of a thermokarst depression, the 3D model is able to delineate the area wherein the massive ice has already melted. In the western part of the thrust moraine complex, the presence of massive sedimentary ice is further confirmed due to exposure by an active layer detachment and following thermokarst processes in summer 2024 (cf. Fig. A1a and c).
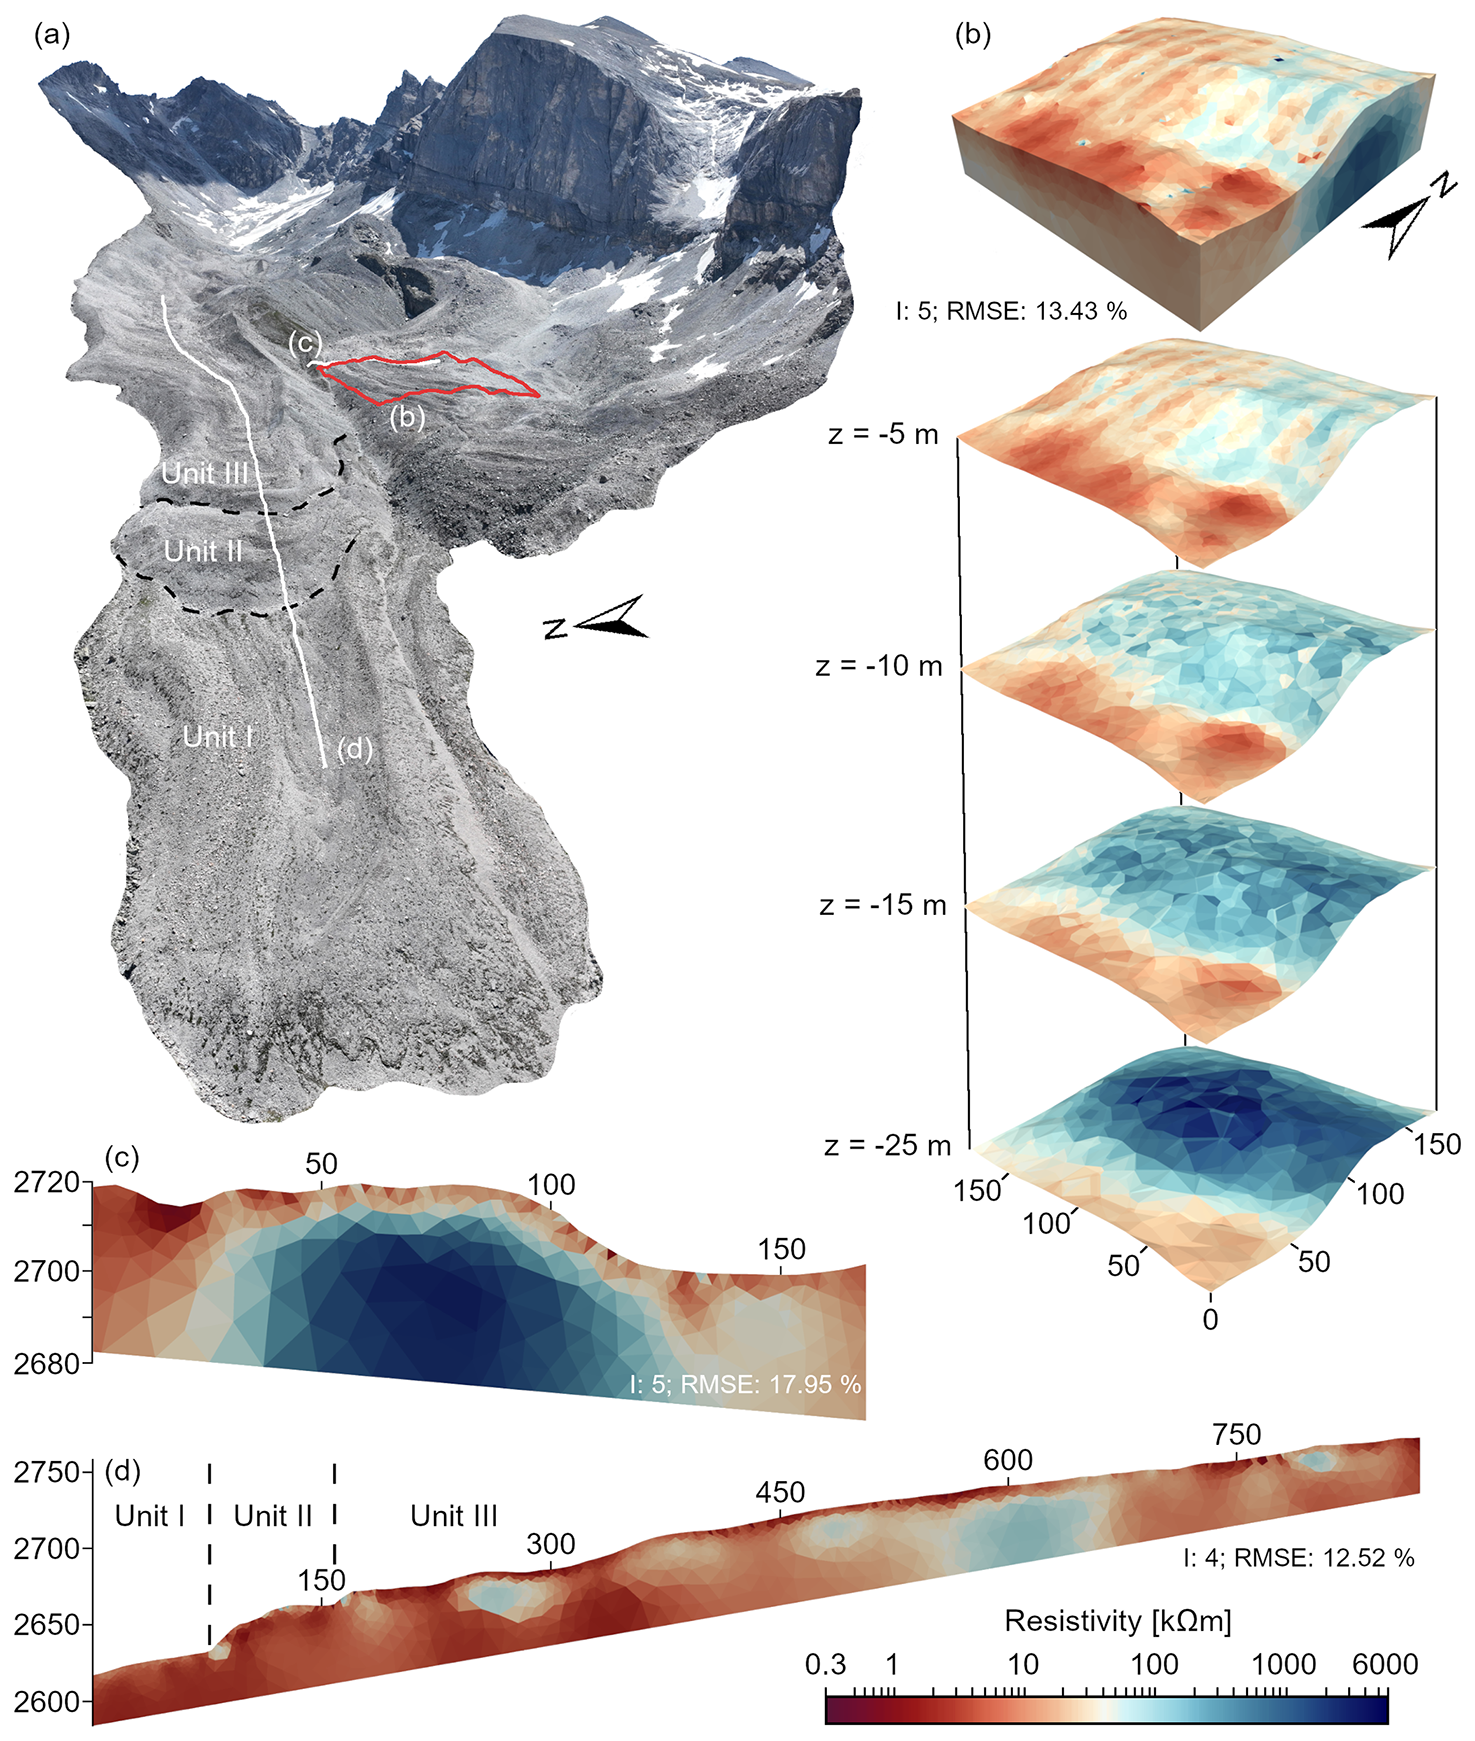
Figure 2ERT surveys in the Pipji and Barrwang glacier forefields. An overview of the survey location is given in (a). A q3D ERT grid is shown in (b), whereas a 2D cross profile of the thrust moraine complex and a longitudinal profile along the rock glacier are shown in (c, d).
In comparison to the BW_TM, a 2D ERT profile along the PI_RG to the north shows differing subsurface structures within its subunits (Fig. 2d). The profile reveals a more heterogeneous resistivity distribution within the rock glacier. Larger high-resistive zones are detected between 240 and 300 m, 350 and 410 m, as well as between 460 and 670 m of the profile. These structures start in depths between 5 and 10 m below the surface and are about 20–25 m thick. Only the larger one between 550 and 670 m of the profile reaches greater depth and its lower boundary can not be detected. Resistivities in these structures are between 50 kΩ m and 110 kΩ m, and therefore more than one order of magnitude lower than in the area of the BW_TM. The resistivity range suggests the presence of permafrost within the subsurface of the rock glacier; however, the type and quantity of ground ice likely differ from those in the thrust moraine. While resistivities above 1 MΩ m are indicative of sedimentary or glacial ice, resistivities around 100 kΩ m indicate ice-rich permafrost but the absence of buried glacier ice (cf. Haeberli and Vonder Mühll, 1996; Kneisel, 2006).
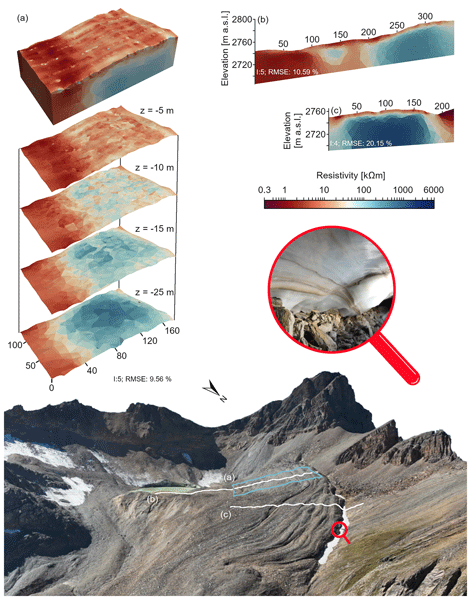
In the Oberferden Valley, a similar setup was chosen, meaning that a cross profile, as well as a q3D grid were measured on the thrust moraine complex (OF_TM) and a longitudinal profile on the rock glacier (OF_RG). In the OF_TM, ERT measurements (Fig. 3) reveal a two- or three-layered internal structure. The upper part of the thrust moraine complex shown in Fig. 3a and b is underlain by an about 5 m thick, low-resistive surface-parallel layer (<10 kΩ m) and a high-resistive core (100–300 kΩ m) below. The high resistivities indicate the presence of probably ice-rich permafrost. As visible in the 3D model, this high-resistive zone starts at about 10 m depth and reaches down to the lower boundary of the model (30 m depth) and beyond. Especially in the 15 m depth layer, some structures are more resistive compared to the surrounding. They are aligned parallel to the dominant ridge at the surface. Further downslope, in the proximal flank of the OF_TM, resistivity values drop to a lower level and are in a range between 7 and 10 kΩ m also at greater depth, indicating the absence of permafrost. However, a further but smaller high-resistive anomaly is notable in the lower area of the thrust moraine flank (profile Fig. 3b, 120–160 m), which is characterized by resistivity values between 50 and 100 kΩ m and therefore also probably indicates frozen conditions. The overlying low-resistivity layer is slightly thicker in the lower part of the thrust moraine flank and is around 6 m deep. The area between the two glacial lakes seems to be unfrozen, which is indicated by the low electrical resistivity values (<5 kΩ m) in all depth levels (see Fig. 3b). The eastern part of the OF_TM is characterized by a more distinct surface morphology with a higher number of ridges. In this area, the ERT measurements reveal a zone of very high resistivities about one order of magnitude higher than in the upper, central and western parts of the complex (Fig. 3c). Resistivities of more than 1 MΩ m indicate the presence of sedimentary ice within the OF_TM. This detected structure fits well with observations made in the field in late summer 2022, where massive sedimentary ice could be observed in a thermo-erosional cave in the distal flank of the OF_TM (see also Figs. 3 and A1b and d).
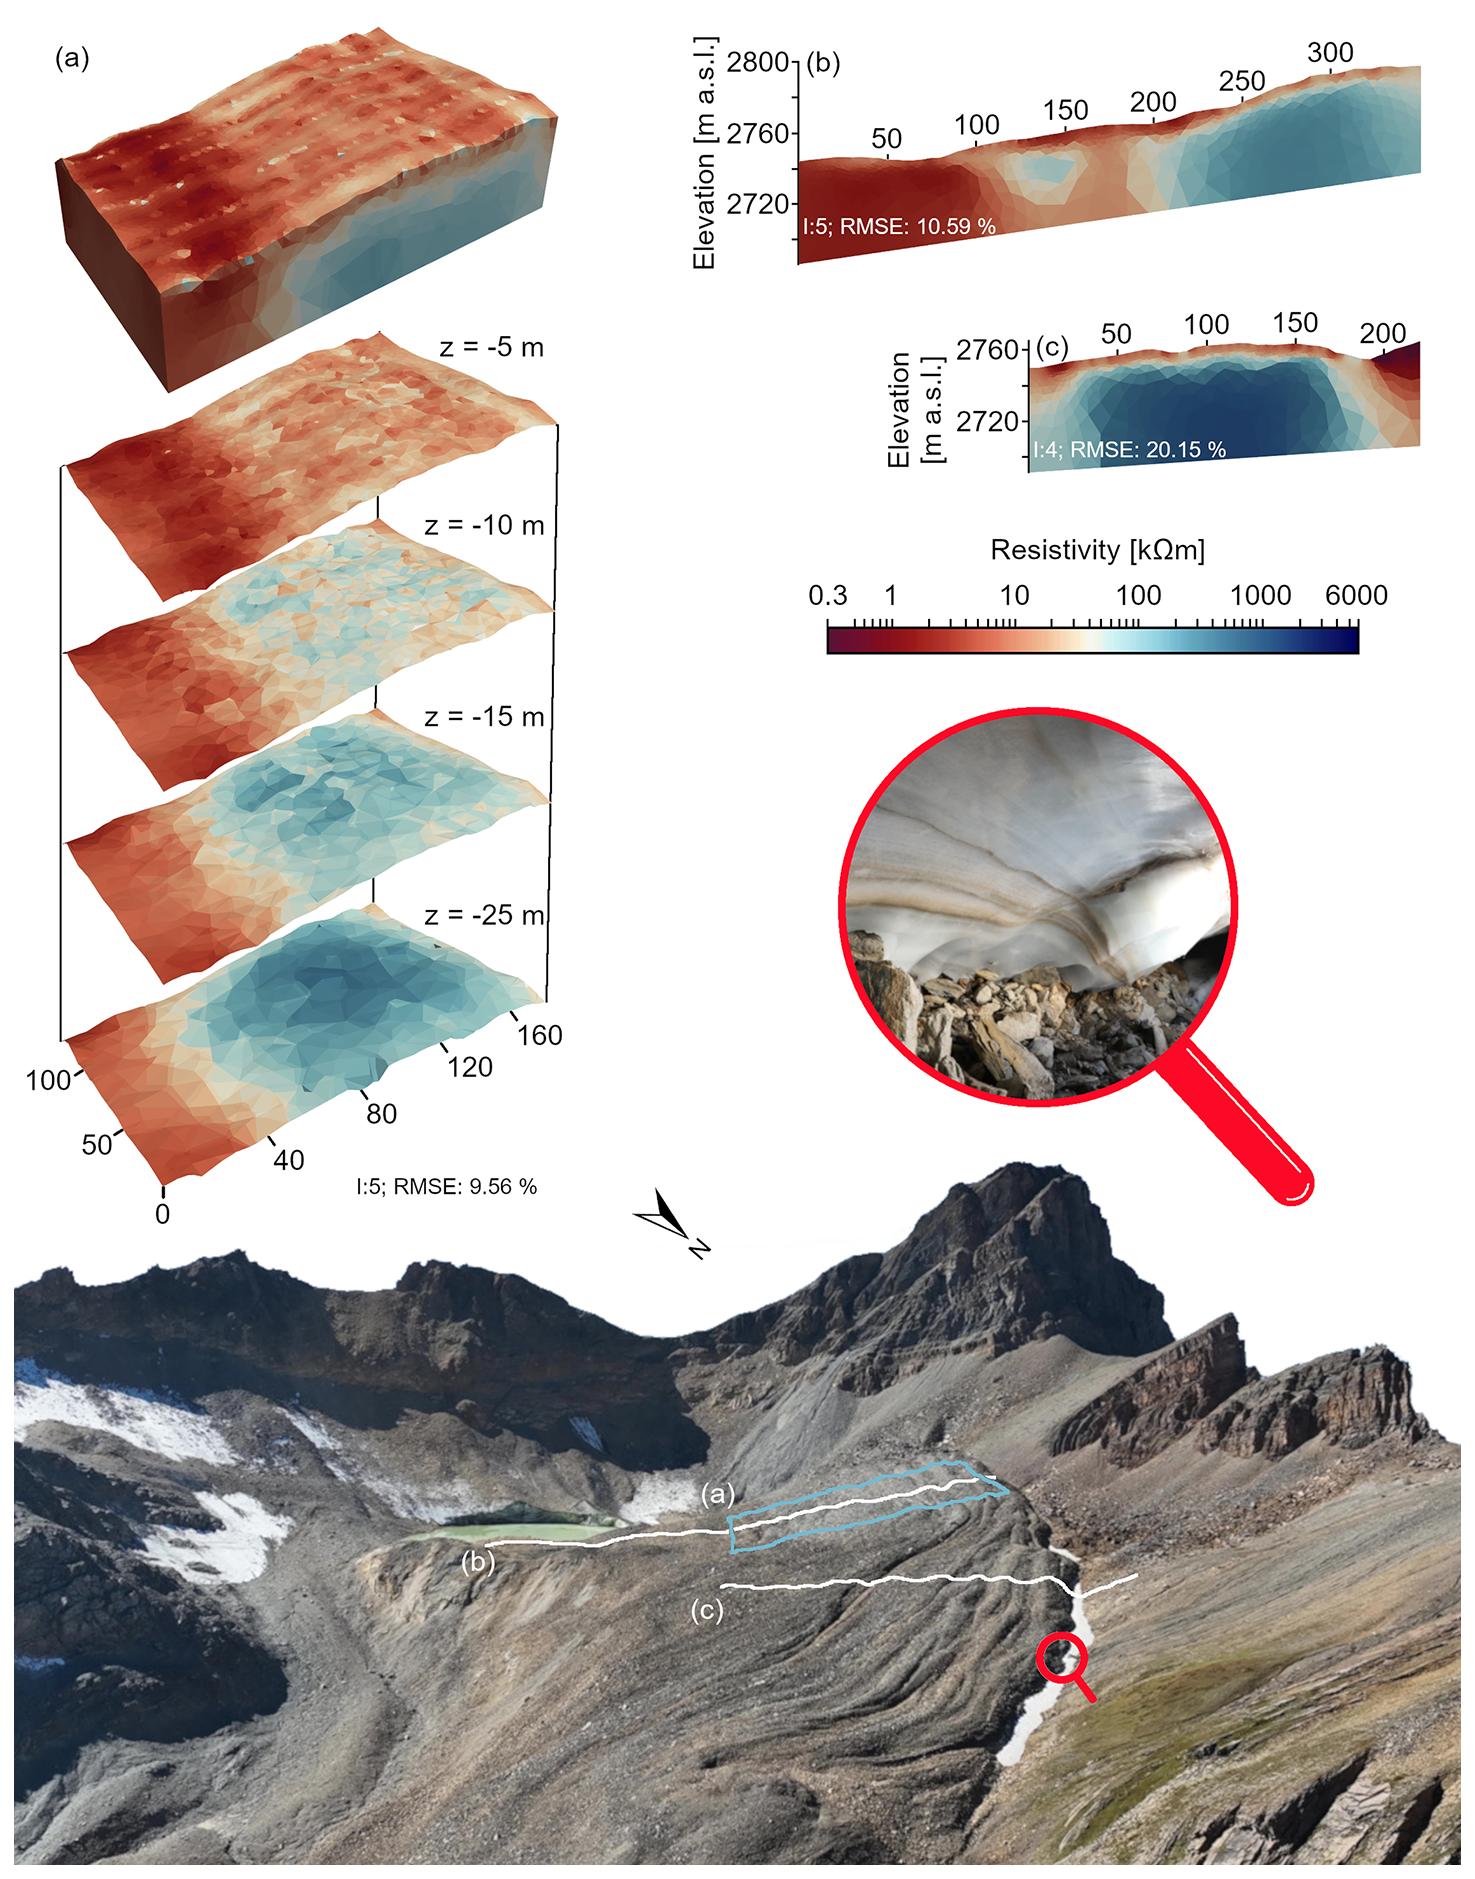
Figure 3ERT surveys on the Oberferden thrust moraine complex. A q3D model is shown in (a), whereas two 2D cross profiles are shown in (b, c). The locations of the ERT surveys are shown in the background image. The magnifier shows an outcrop of massive ice in a thermo-erosional cave in the distal moraine flank (see also Fig. A1b and d).
In comparison to this, two ERT profiles were conducted also on the neighbouring rock glacier (OF_RG) further down the valley (see Fig. 4). The two cross profiles of the rock glacier show comparable structures in the upper and lower parts of the OF_RG. In both profiles, a low-resistive upper layer (5–6 m thick) and high resistivity values (100–200 kΩ m) below are detected within the orographic right (southern) half of the rock glacier. In contrast to this, the orographic left (northern) side is underlain by resistivities lower than 3.5 kΩ m in the upper and 7 kΩ m in the lower part of the rock glacier. These results indicate that today permafrost is only present in the right half of the rock glacier. The boundary between the two different subsurface structures fits well with the substrate boundary at the surface. The coarse-grained, talus-derived material seems to be underlain by permafrost, whereas the finer-grained moraine material in the left half seems to be free of permafrost.
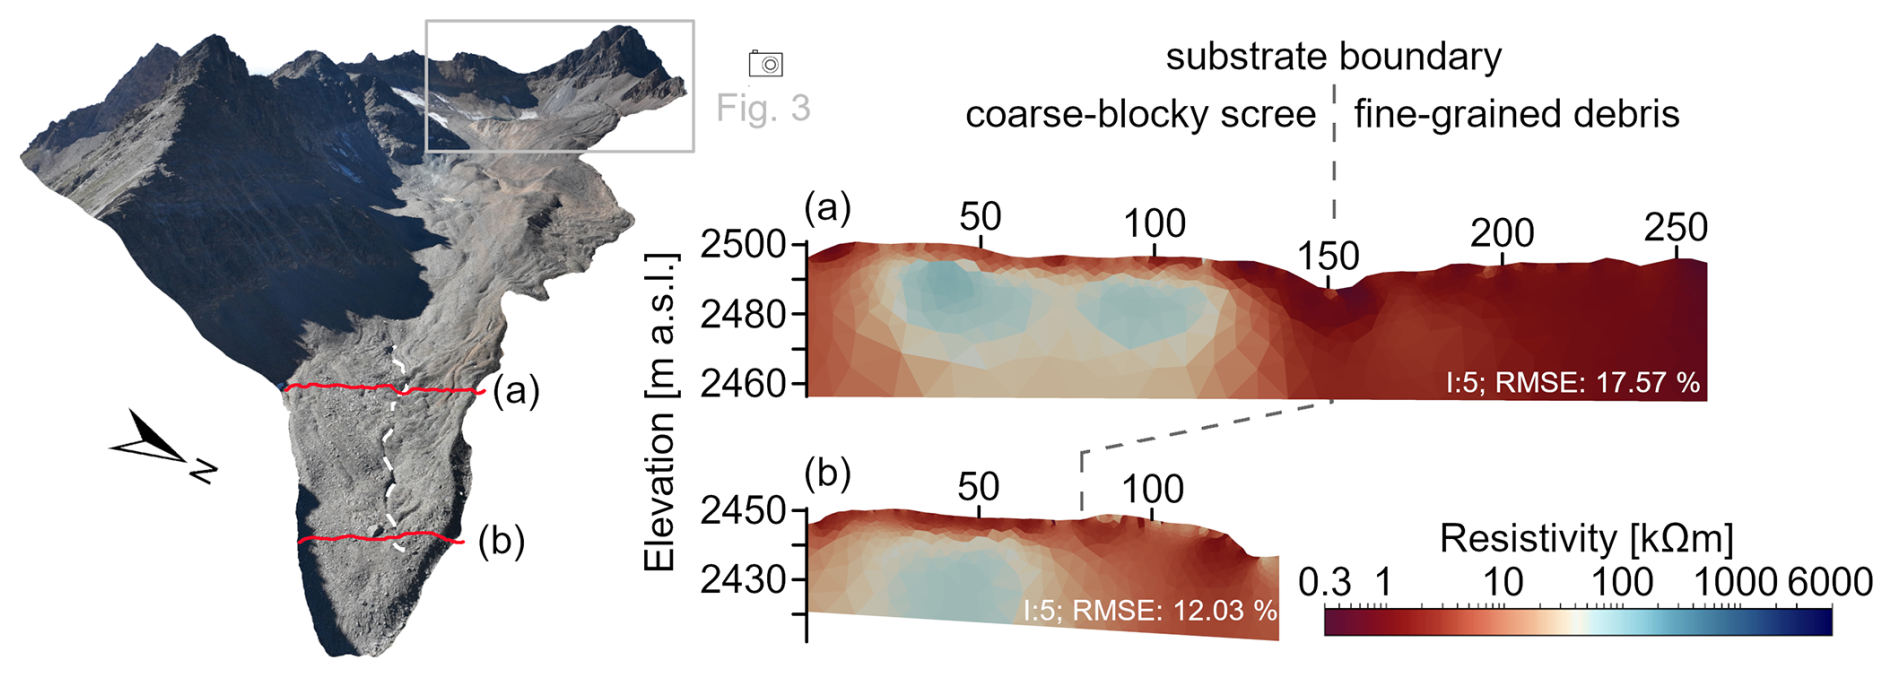
Figure 4ERT surveys on the Oberferden rock glacier. Position of the substrate boundary is highlighted by the dashed white line on the rock glacier surface. Image extent of Fig. 3 is also marked for orientation by the grey box.
4.2 Surface dynamics
Looking at the surface displacements derived from the DInSAR approach (Fig. 5), distinct displacement patterns are visible in both study areas. These are clearly linked to the geomorphological landform units of the individual rock glaciers and thrust moraine complexes. Areas affected by layover or shadow in one of the orbits were masked out and are shown in grey. In Pipji Valley it is obvious that the rock glacier and the thrust moraine complex are characterized by different displacement rates. The rock glacier in the north is mainly dominated by a westward displacement of up to 0.5 m a−1 (Fig. 5a), whereas elevation changes are relatively low (Fig. 5c). These vertical changes are patchier than the horizontal displacement pattern and do not exceed except for an area of uplift in the central area of rock glacier unit III, which might be affected by convergent flow that is not resolved by the DInSAR approach due to the missing north–south component, but is indicated by the flowfield analysis (Fig. 5g).
In contrast to this, the BW_TM is characterized by only small horizontal displacement in the east–west direction (), but by intense, negative elevation changes of up to . These are detectable nearly over the entire thrust moraine complex and the spatial pattern is comparatively homogeneous. Looking at the seasonal variation of the surface displacement – derived from early and late season displacement rates – also distinct differences between the two landforms are visible. The BW_RG is characterized by a high seasonality (bright blue to turquoise colours), which means that there is only low or even no surface movement in the early snow-free summer season and a medium to high surface movement during the late snow-free summer season. This characteristic is an areawide phenomenon of the thrust moraine complex with only some isolated spots of lower seasonality, characterized by generally low displacement rates. Conversely, the PI_RG only shows a high seasonality in its orographic right part, which is also part of the former lateral moraine. Besides, the PI_RG shows lower seasonality, which is indicated by the dark blue and magenta colours. Thus, rock glacier surface movement exhibits notably less seasonal variation compared to the surface movement of the neighbouring BW_TM.
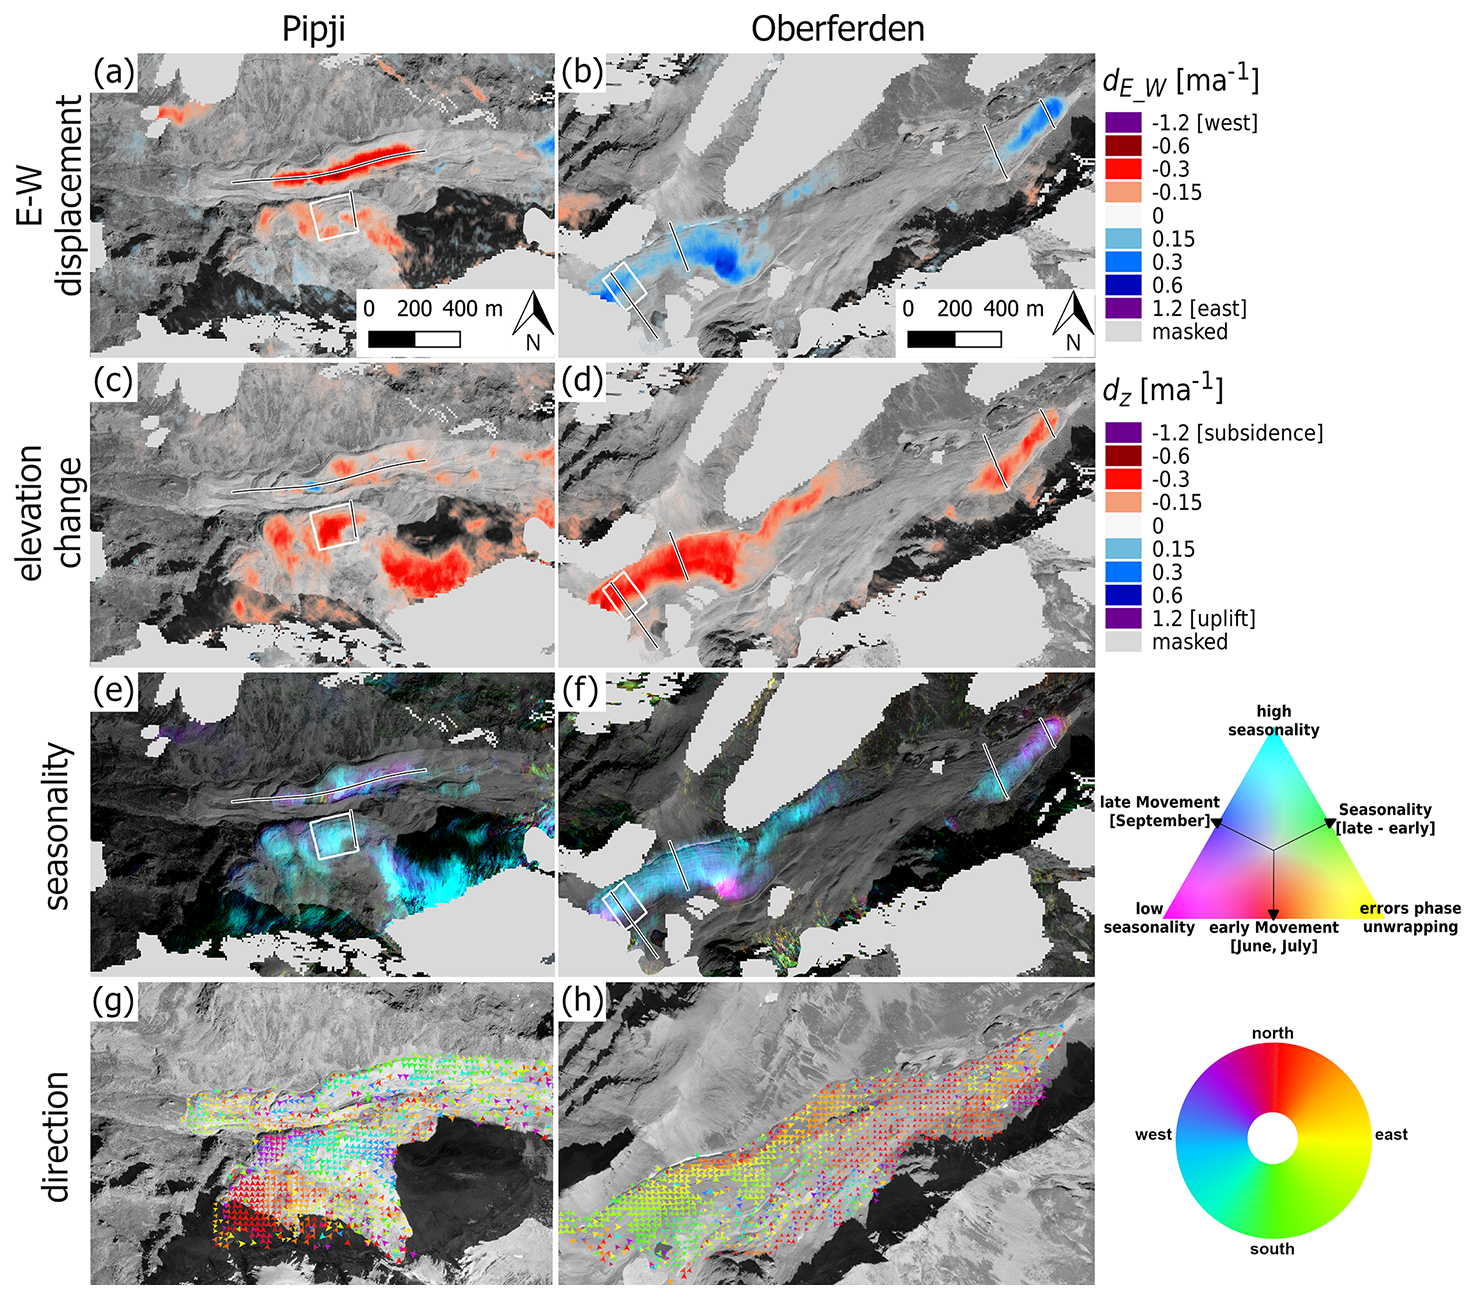
Figure 5InSAR-based analysis of surface morphodynamics in the Pipji and Barrwang (left column) as well as Oberferden (right column) glacier forefields for the period 2017–2021. The panels show the surface displacement in the east–west direction, the vertical displacement, the seasonality derived from early and late season movements, and the movement direction direved from IMCORR. The locations of all ERT surveys are also shown in the maps.
Similar spatial patterns in displacement rates are evident in the Oberferden glacier forefield. Similarly, the OF_TM is characterized by negative elevation changes ranging from −0.2 to , affecting nearly the entire complex. The spatial pattern of horizontal displacements shows some differences with higher horizontal displacement rates (up to 0.5 m a−1) in the steeper eastern section of the complex but only lower horizontal displacements () in flatter areas. The flowfield analysis also revealed the slight backward creep towards the glacier forefield, which also includes a north–south component. In most cases, this is in a similar range as the east–west component resulting in a south-east oriented movement. Also, regarding the seasonality (Fig. 5f) the OF_TM shows similar characteristics as the BW_TM and is characterized by comparatively high seasonality, so low early snow-free season and intense late snow-free season surface movement. An exception is the very steep section in the east (magenta-colored area), where higher displacements are observed early in the summer season, leading to reduced seasonal variation. Further down the valley, the OF_RG exhibits spatially heterogeneous displacement patterns, with detectable surface movement occurring only in the orographic right half of the rock glacier. In this area, both horizontal as well as negative elevation change are detectable in a similar range (0.1–0.35 m a−1) with increasing horizontal displacement towards the front. In the upper part, close to the source area of the OF_RG, almost only elevation changes occurred during the investigated period. Lateral surface movement is in a range of up to 0.1 m a−1 in this area and therefore at the lower detection limit of the method. The OF_RG is also characterized by different seasonal patterns. While the upper part with only vertical displacement shows rather high seasonality, the lower part with horizontal displacement shows a more balanced behaviour and less seasonality throughout the summer.
4.3 Relationship between subsurface properties and surface movement
Comparing the detected spatial surface movement patterns and seasonal dynamics with subsurface information from ERT highlights notable consistencies. Therefore, a statistical analysis was conducted for all data points across all 2D profiles. In Fig. 6a, c, and e, maximum resistivity values are plotted against three morphodynamic parameters, categorized by landform type. For all three parameters, correlations are notably stronger within thrust moraine complexes (red) compared to rock glaciers (grey). This suggests that the morphodynamics of the investigated thrust moraines are more consistently influenced by internal structures and, consequently, by ice content, whereas rock glaciers exhibit greater variability. In Fig. 6b, d, and f, the distributions of vertical elevation change (b), horizontal displacement (d) and seasonality (f) are shown for all four classes as violin plots. This enables a direct comparison of the morphodynamics for the respective subunits of the individual landforms and should reveal some linkages with ground ice distribution and properties for the investigated thrust moraine complexes and rock glaciers. Looking at a general comparison of the rock glaciers (grey) and thrust moraine complexes (red), it is striking that the morphodynamic parameters for sample points on the moraine features are characterized by a lower scattering within each class. Especially in the two low- or lower-resistive groups representing no or probably ice-poor permafrost, thrust moraines are less affected by morphodynamics than the rock glaciers. Only some points on the rock glaciers appear to be subject to considerable surface movement, although they are underlain by no or very ice-poor permafrost. Striking is the bimodal distribution of horizontal displacement in the second class (low-resistive, probably ice-poor permafrost) for the rock glacier data points, indicating two different dominating displacement regimes within this class. On the thrust moraine complexes in general, the relationship follows an expected pattern in which higher resistivities (probably also higher ice contents) mean higher morphodynamics and seasonal variation. This is valid, especially for the vertical movement and the seasonality, but also concerning the horizontal displacement in parts. In inclined areas characterized by surface subsidence, the horizontal movement might be affected by lateral shift during the subsidence process, which is why the surface movement cannot be distinctly related to permafrost creep and is therefore more independent from subsurface properties.
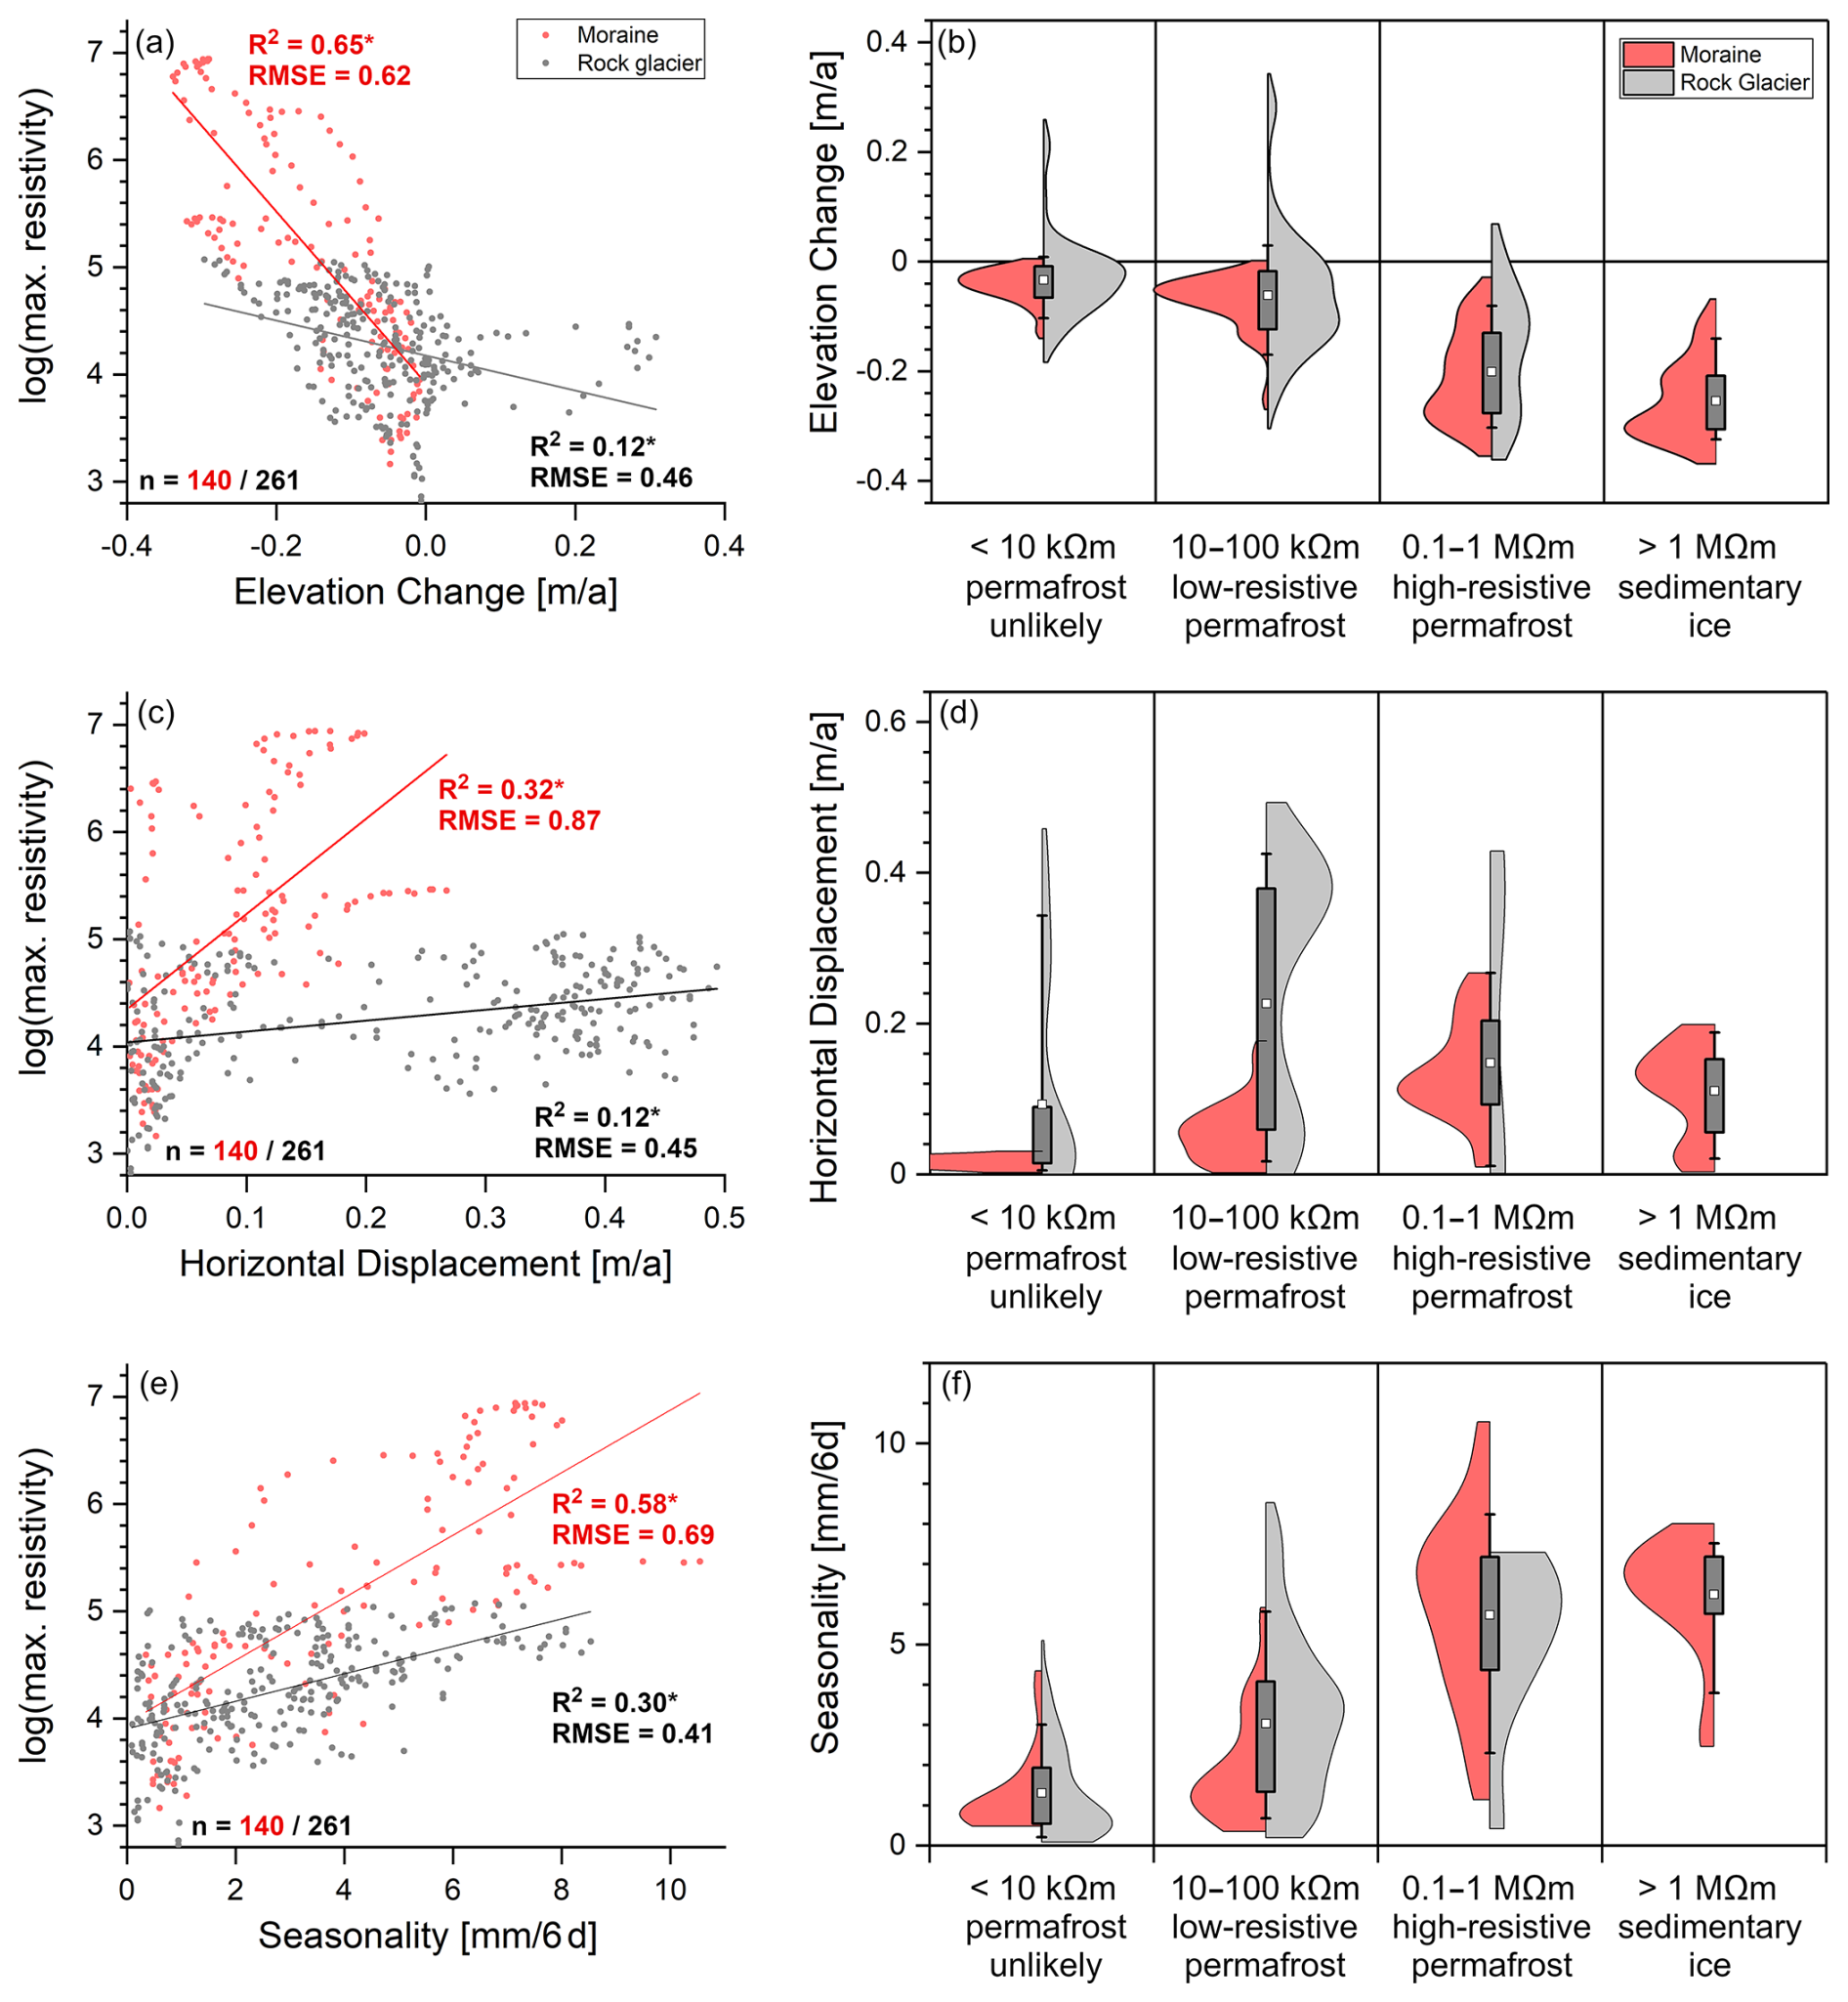
Figure 6Comparison of InSAR-detected elevation change, horizontal displacement and seasonality with the logarithm of maximum resistivity (in Ω m) below each respective pixel along all 2D ERT profiles. In the left column, the logarithm of the maximum resistivity is plotted against the elevation change (a), horizontal displacement (c) and seasonality (e), while in the right column, the distribution of each parameter is shown for four different resistivity classes (b, d, f). “*” indicates the significance of the respective correlation (α=5 %).
When analyzing individual profiles, a strong correlation is evident between surface displacement (in both directions) and the maximum resistivity beneath each pixel. Along the long cross-profile of the OF_TM (Fig. 7b and d), the correlation between the logarithm of maximum resistivity and absolute displacement in the east–west direction reaches a coefficient of determination (R2) of 0.75* (Fig. 7j), while its correlation with elevation change results in an R2 of 0.76* (Fig. 7f). Similar trends are observed in the BW_TM when considering individual profiles. However, along the longitudinal profile of the PI_RG, correlations between these parameters are notably weak (R2<0.25) and, moreover, not all significant (cf. Fig. 7a, c, e, g, and h).
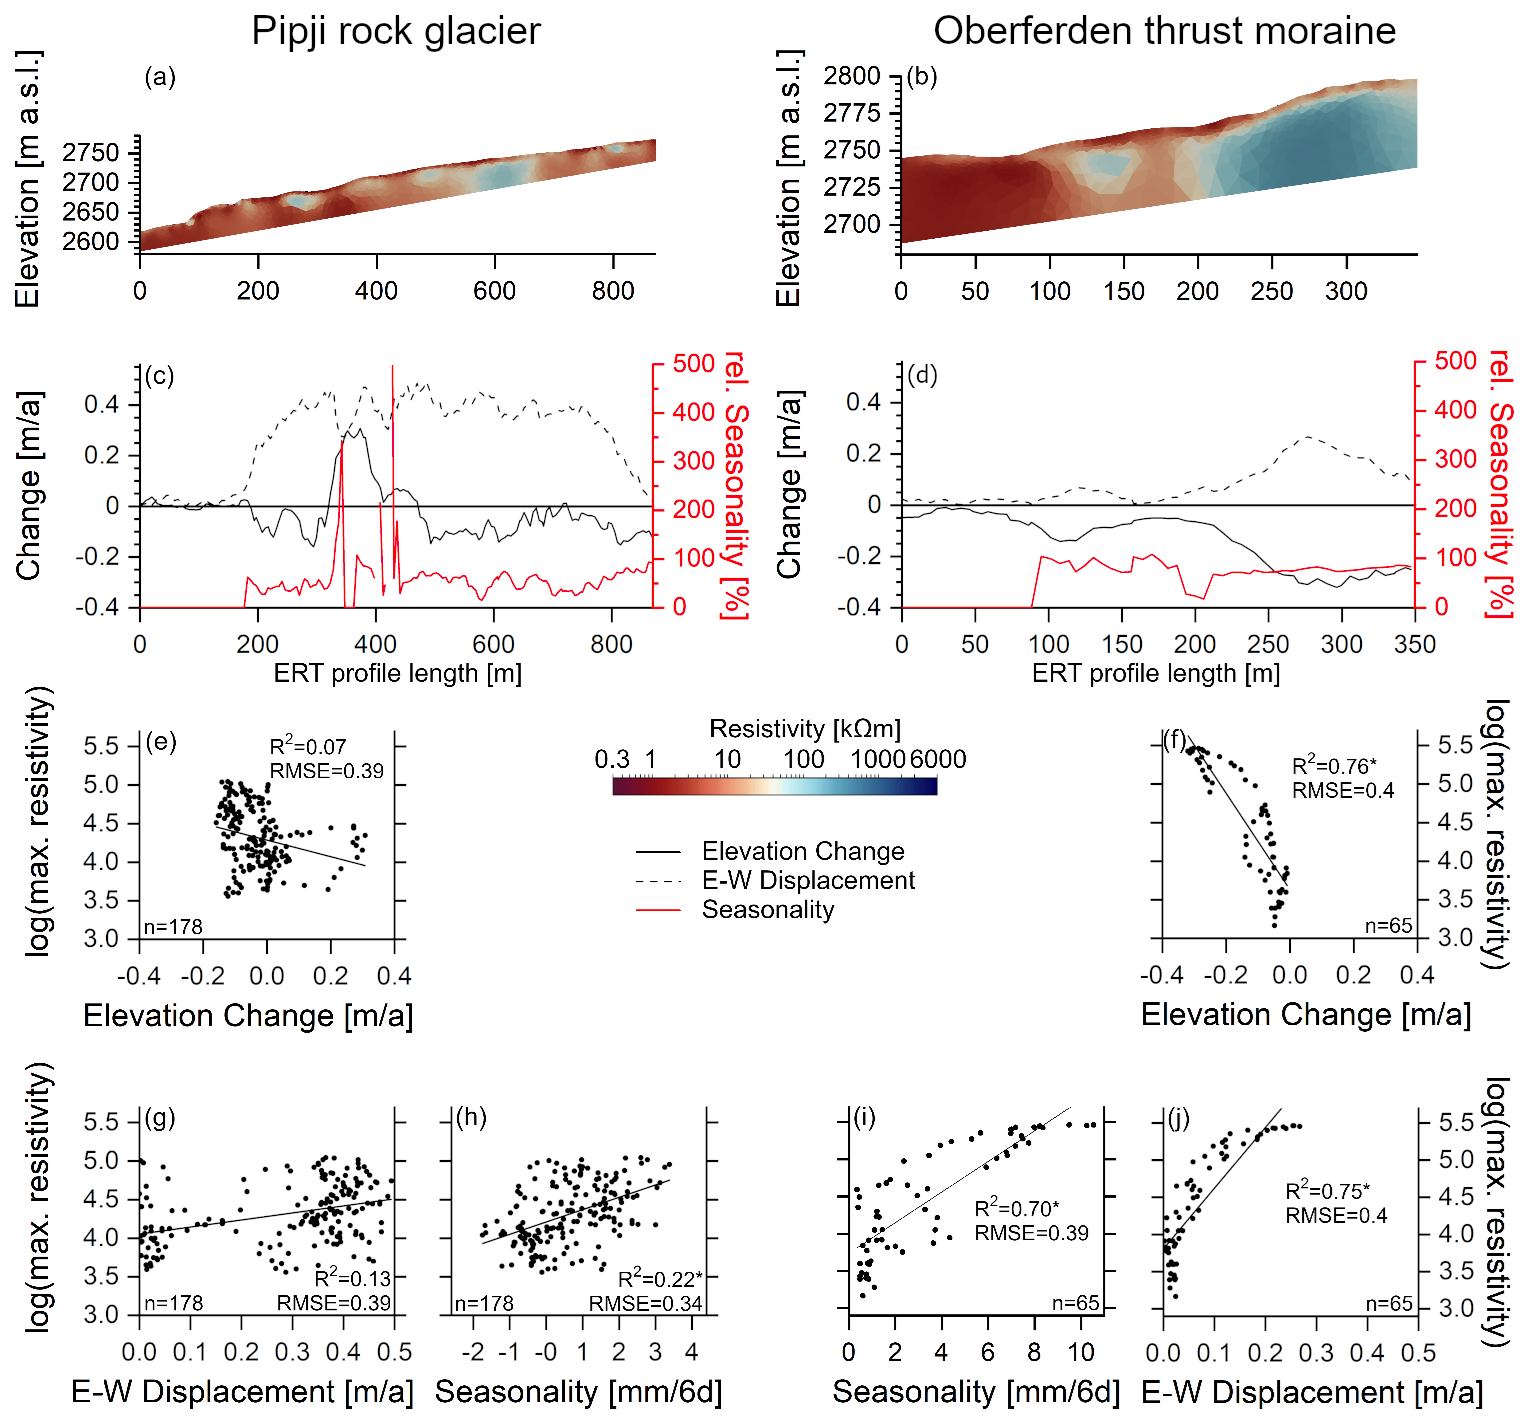
Figure 7Comparison of the ERT pseudo sections (a, b) with DInSAR-derived elevation change, horizontal displacement and seasonality (c, d) along the longitudinal profile of the Pipji rock glacier (a, c) and the cross profile of the Oberferden thrust moraine complex (b, d). In the subplots (e–j), the individual scatterplots for the relationships are shown. “*” indicates the significance of the respective correlation (α=5 %). Please note the different scalings of x- and y-axis for the two columns.
5.1 Methodological approach
ERT has been widely used in this field of research for more than 20 years; however, its application to coarse-blocky landforms and ice-rich environments remains challenging and requires further discussion. Due to partly bad ground coupling of the electrodes, measured quadrupoles had to be checked regarding their stack deviation and bad datum points (deviation>5 %) were deleted prior to inversion. Raw data quality was generally acceptable, but in total about 10 % of the data points had to be deleted. In the Oberferden glacier forefield, data quality remained relatively consistent across profiles, with approximately 8 % of datum points removed. In contrast, data quality in the Pipji and Barrwang glacier forefields was more variable, with a maximum of 23 % and an average of 12 % of datum points removed per profile. In addition to the limitation due to the ground coupling, there are also the very heterogeneous subsurface properties and the extreme range of resistivity values due to the different materials (<300 Ω m to >6 MΩ m), which make modelling difficult and lead to comparatively high RMS errors. Also, the absolute resistivity values within very high-resistive structures (>1 MΩ m) should be interpreted with caution due to the lower sensitivity resulting from low electric currents within the high-resistive zones (e.g. Hilbich et al., 2009; Marescot et al., 2003). However, since the results focus primarily on the relative differences among the individual sub-areas, the limitations mentioned are not critical to the overall interpretation and are of no overarching significance.
Regarding the delineation of different ice types and ground ice distributions described in chapter 3.4, it should be noted that the thresholds are based on literature (e.g., Bosson et al., 2014; Haeberli and Vonder Mühll, 1996) and own field experience and measurements at comparable sites (cf. Kneisel, 2003, 2006; Kneisel and Kääb 2007; Kneisel et al., 2000; Kunz et al., 2022). So far unpublished borehole and GPR data from our investigated sites support this differentiation between the various zones in our study areas. However, it should be noted that the resistivity thresholds given are only approximate values that may vary locally.
With regard to the DInSAR approach, phase unwrapping errors, which typically limit the accuracy of velocity measurements in fast-moving areas, were not detected in the investigated regions, except for a very small area on the Pipji rock glacier, where they cannot be ruled out. Nevertheless, the mentioned general limitations of the approach should be considered. To reduce the uncertainty about the missing north–south component, we provided the respective information derived from feature tracking based on high-resolution orthoimages.
The integration of remote sensing and geophysical measurements to analyze interactions between surface and subsurface processes has been rarely applied in Alpine permafrost research. However, as the results demonstrate, this combination offers valuable advantages, enabling the high-resolution spatial measurement of surface parameters while simultaneously providing multi-dimensional subsurface information. This can contribute to a better understanding of the morphodynamics of landforms and the associated processes, both recent and in the future. It is therefore important to note that this combined approach of geophysical and DInSAR data is still relatively new and little comparable data is available so far.
5.2 Glacier-permafrost interactions and related recent morphodynamics
The coexistence of glaciers and permafrost distinctly shaped the geomorphology of the investigated glacier forefields and their adjacent areas. Especially the thrust moraine complexes investigated in the current study indicate not only a coexistence but also an interaction between glaciers and permafrost. The geoelectrical surveys conducted on both complexes revealed similar internal structures and enabled a delineation of different morphological subunits, confirming the glacier-permafrost interaction. Especially the incorporated blocks of massive ice of sedimentary origin within both thrust moraines, revealed by very high electrical resistivity values>1 MΩ m, are a distinct hint of that (Haeberli and Vonder Mühll, 1996; Kneisel et al., 2000; Kneisel, 2003, Wee, 2025). In addition, high-resistive zones (0.1–1 MΩ m) indicate the presence of ice-rich permafrost but potentially the absence of massive, sedimentary ice or a polygenetic type of ground ice in the upper part of the OF_TM. Additional GPR measurements conducted in this area (not shown) reveal the presence of shear planes resulting from glacial thrusting within these high-resistive and probably ice-rich permafrost zones. Similar internal structures were already reported from other thrust moraine complexes by Kunz et al. (2022), Kunz and Kneisel (2020) and Wee (2025). The recent morphodynamics on the investigated landforms seem to be dominated by negative vertical changes indicating a thinning due to deformation but also degradation of ice-rich permafrost and melt-out of massive ice as also described by Wee (2025), Wee and Delaloye (2022) and Wee et al. (2024). This is also supported by the strong seasonality, which states larger surface movement only during the warm summer months and not during the early summer season when energy from heat fluxes is used for melting snow and seasonal ice in the active layer (Amschwand et al., 2025; Scherler et al., 2014). Horizontal surface movement is less intense and restricted to the steeper parts, although the missing north–south component in the DInSAR approach should not be ignored. Especially the morphological orientation of the two thrust moraine complexes and the former ice flow direction and therefore the direction of glacial thrusting suggest that at least the backward creep described in the few available studies (cf. Kneisel and Kääb, 2007; Kunz et al., 2022; Wee and Delaloye, 2022, Wee, 2025) could also have a north–south component. This is confirmed by the IMCORR analysis, but the results also confirm that the lateral movement is comparatively low.
The two investigated rock glaciers dominate the lower elevated parts of the late-glacial and LIA glacier forefields and at least partly originate from moraine deposits of the respective glaciers. In the Pipji Valley, the PI_RG evolved entirely from the former glacier and its moraine deposits (Tatenhove and Dikau, 1990), but the surface morphology indicates different development stages and phases of activities, as also reported by Otto et al. (2009). The OF_RG is only partly moraine-derived, and the different origins of the host materials seem to have a major impact on the recent state of the rock glacier. Within the moraine-derived orographic left half, low resistivity values indicate the absence of permafrost and the DInSAR approach could not detect any surface movement either. In contrast, the orographic right side of the rock glacier, which was formed from coarse blocky scree, shows high electrical resistivity and also distinct surface movement that indicate the presence of ground ice in the subsurface. The main reason for this internal disbalance might be the substrate characteristics and the related favourable thermal conditions within the coarse-blocky material (Amschwand et al., 2024; Harris and Pedersen, 1998; Rödder and Kneisel, 2012a), but also shading could strengthen the effect at this site (microclimate). The different behaviour in the upper and lower part of this rock glacier might indicate the typically steadier permafrost creep within the lower part of the lobe and rather mass loss during the warm summer months in the upper part. The area of uplift on the PI_RG (cf. Fig. 5c) indicates compressive flow (cf. Haeberli et al., 2006) due to a convergence of the flowfield as well as higher rock glacier velocities in the upper part and lower velocities in the lower units (Unit I and II). However, values are probably partially altered by phase unwrapping artefacts in descending orbit as this is the fastest moving part of the rock glacier. The different velocities, in turn, are likely due to the different ice contents indicated by the ERT measurements.
When comparing the thrust moraines and the neighbouring rock glaciers, the differences regarding their internal structure are prominent. Both rock glaciers show more heterogeneous structures with higher variabilities of the electrical resistivities and smaller, more isolated high-resistive zones. In contrast, the thrust moraines are both underlain by large, very high-resistive, more coherent zones indicating a more homogeneous internal structure. Besides, the DInSAR-derived surface displacement shows some distinct differences in the morphodynamics of the two landform types: Negative elevation change dominates the thrust moraines, whereas the horizontal displacement component predominates the rock glaciers. Also, the thrust moraine complexes are characterized by distinctly higher seasonality than the neighbouring rock glaciers, meaning that surface displacement varies stronger throughout the snow-free summer months. These different behaviours are probably indicative for the different landform development stages in recent times. While the thrust moraines are in a paraglacial transition, the glacier-forefield-connected rock glaciers represent a periglacial process regime. These findings fit well with recent observations by Haeberli et al. (2024), Wee (2025), Wee et al. (2024) in the European Alps, but also by e.g., Harrison et al. (2025) in other mountain environments, that report different morphodynamics of landforms depending on ice content and involved ice type. The differences between the two landform types, which are highlighted by the statistical differences presented in Fig. 7, might be mainly caused by the different processes of movement. Within rock glaciers, internal deformation and shearing result in permafrost creep (Arenson et al., 2002; Cicoira et al., 2021; Gärtner-Roer et al., 2022). These processes can also take place in less ice-rich areas or at least be transferred to them and are mainly driven by permafrost temperatures near the shear horizon (hence, low seasonality). This results in lower correlations between surface movement parameters and subsurface resistivity. In the area of the thrust moraines – at least in the areas that are no longer subject to back-creep – the movement is mainly due to the melting of the ice (cf. Wee et al., 2024; Wee and Delaloye, 2022), which is characterized by less horizontal displacement, primarily negative elevation changes that increase with higher ice contents and higher seasonality due to the strongest thaw subsidence during the late summer. This would explain why the morphodynamics of the moraines correlate stronger with the electrical resistivity than in the area of the rock glaciers. The effect of melt-subsidence is highest in ice-rich environments, which in turn are characterized by the highest electrical resistivity values. Within the rock glacier, permafrost creep is affected but not totally dependent on the ice content, which is why the relationship between surface morphodynamics and subsurface resistivity is considerably weaker. However, it should be noted that the processes can also take place in the other respective landform, but they are not dominant there.
5.3 Landform classification and its significance for monitoring Rock Glacier Velocity
These previously described findings highlight the importance of correct distinction between thrust moraine complexes and glacier-forefield-connected rock glaciers, even if this is sometimes very complex to accomplish. Despite their often similar morphological appearance and their occurrence in the same environment, the internal structures and the morphodynamical characteristics can be different based on our presented data. Hence, our methodological approach and findings based on this could be used to better differentiate between these often adjacent landforms:
DInSAR-derived surface movement patterns can be used to differentiate landforms and subunits based on their varying movement dynamics at a larger spatial scale, whereas geophysical surveys could help to clarify internal structures. This is of special importance, as so far thrust moraines and rock glaciers were not strictly distinguished in many rock glacier inventories (e.g., Bertone et al., 2022; Nyenhuis, 2005). Following the guidelines of the RGIK (2023a), thrust moraines (push moraines) can only be included in the class of glacier-forefield-connected rock glaciers, if they exhibit typical morphological structures resulting from postglacial creep (outward or backward). However, a strictly differentiation would be of high importance as the primary underlying process driving the morphodynamics might be different depending on the ground ice type and content (melting of ice vs. permafrost creep). As morphodynamical parameters such as Rock Glacier Velocity (RGV) are derived as essential climate variable (ECV) based on such inventories (Hu et al., 2025; Streletskiy et al., 2021; World Meteorological Organization (WMO), 2022), a lack of distinction between the different landforms and landform units may lead to a distortion of the RGV quantity. As this approach is used to detect climate signals in the context of climate change, it is especially important to minimize such sources of interference, which is why a careful selection of reference areas is of particular importance. Therefore, it is important to follow the recommendations of the RGIK (2023b) and Hu et al., 2025 for the selection of representative areas and to exclude areas dominated by melt-subsidence, a phemonenon to which areas underlain by buried ice are particularly susceptible.
The combined approach of geophysical surveying and remote-sensing-based surface displacement analysis enabled the investigation of relationships and linkages between the subsurface structures of thrust moraine complexes and glacier-forefield-connected rock glaciers with their recent morphodynamics. The use of 2D and q3D electrical resistivity tomography (ERT) revealed the recent distribution of ground ice and permafrost occurrences, respectively, but also enabled the differentiation of different kinds of ground ice within the two investigated glacier forefields. The use of Differential Interferometry Synthetic Aperture Radar (DInSAR) enabled a high-resolution derivation of surface displacements on both landform types, thrust moraines and rock glaciers. The main findings of the combined approach are as follows: (i) Glacier-permafrost interactions resulted partially in the incorporation of large blocks of massive ice of sedimentary origin into the thrust moraine complexes. Resistivity distribution and, therefore, probably the ground ice distribution within the investigated rock glaciers is much more heterogeneous and characterized by rather small-scale structures. Different resistivity ranges indicate the presence of different ground ice types within the two investigated landform types. (ii) Both landforms are characterized by distinct recent surface morphodynamics in both study areas. On the thrust moraine complexes, negative vertical changes and high seasonality predominate, leading to seasonal fluctuations in movement rates during the summer months. On the adjacent investigated rock glaciers, they are more balanced between vertical and horizontal changes and lower seasonality was detected. (iii) There is a strong correlation between electrical resistivity – representing subsurface structure such as ice content and type – and recent morphodynamics in the area of the thrust moraine complexes. The dominance of negative elevation changes and high seasonality indicate that surface displacements result mainly from top-down melt of massive ice within the thrust moraine complexes. The significantly lower correlation between the subsurface properties and the morphodynamic parameters in the area of the rock glaciers has to be interpreted as a result of the more complex internal rock glacier dynamics compared to those of the thrust moraines, which is not entirely controlled by the ice content and also not fully understood yet.
Conclusively, distinguishing between thrust moraines and rock glaciers is essential due to their – at least at the investigated landforms – distinct internal structures and morphodynamic processes, despite their sometimes similar appearance and shared environmental settings in alpine environments. DInSAR-derived surface movement patterns support large-scale identification, while geophysical surveys provide critical clarification regarding the internal structure and origin of glacial and periglacial landforms. Since many rock glacier inventories do not yet differentiate between these landforms, this omission may lead to inaccuracies in assessing morphodynamic changes, particularly when rock glacier velocity is used as an essential climate variable. These findings from our combined methodological approach could enhance our understanding of past, present, and future landscape evolution in high-alpine environments. The clear differences between the investigated rock glaciers and thrust moraines emphasize the need for morphological distinction, particularly when evaluating movement rates in climate-related studies. Methodologically, this study underscores the advantages of integrating geophysical and remote-sensing-based approaches to analyze complex interactions between surface and subsurface characteristics. This combined approach is especially valuable in the context of climate change, enabling a more precise assessment of evolving periglacial landscapes.
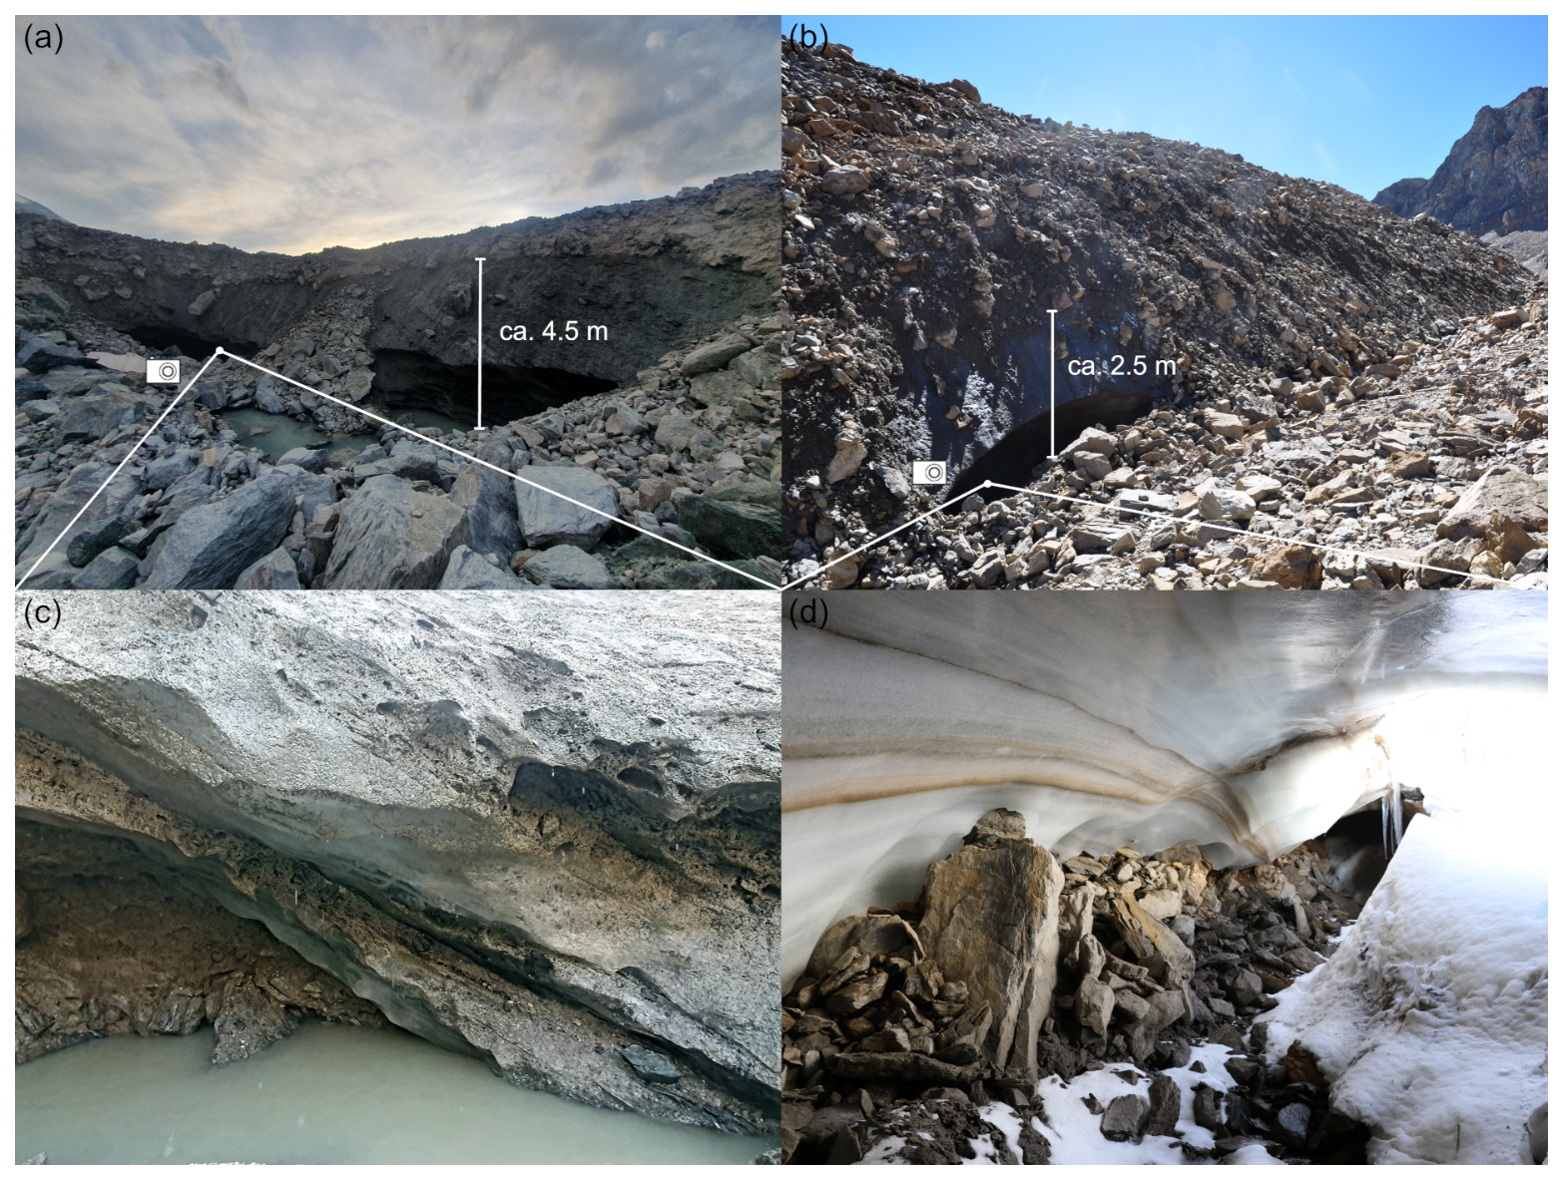
Figure A1Sedimentary ice outcrops in the investigated thrust moraine complexes. In (a, c), an ice outcrop in the proximal flank of the Barrwang thrust moraine complex is shown. In (c), internal shear planes with incorporated sediments are visible. Images were taken in July 2024 by Antje Verheyen. (b, d) present an ice outcrop in the distal flank of the Oberferden thrust moraine complex. In (d), the sedimentary structures of the ice are visible. Images were taken in September and October 2022 by Christof Kneisel and Julius Kunz.
All data are available upon request.
CK and JK designed the research concept, while CK, TW, SB, and JK conducted the associated field measurements. SB, TW, and JK carried out data processing and analysis. JK prepared the manuscript with contributions from all co-authors. CK and TU provided funding and logistics.
The contact author has declared that none of the authors has any competing interests.
Publisher's note: Copernicus Publications remains neutral with regard to jurisdictional claims made in the text, published maps, institutional affiliations, or any other geographical representation in this paper. The authors bear the ultimate responsibility for providing appropriate place names. Views expressed in the text are those of the authors and do not necessarily reflect the views of the publisher.
Acquiring the geophysical data sets in such an environment is quite labour-intensive and exhausting. Therefore, we thank our field assistants Jannik Schönfeld, Antje Verheyen, Judith Hartwich, Severin Scheib as well as the participants of the field courses 04-Geo-MPG 2 (2023 and 2024) and the EAGLE master's field course 2023 for their tireless efforts; this study would not have been possible without their help. Thanks to the EU and the Copernicus Program for making Sentinel-1 data freely available.
We would also like to thank the editor and the two anonymous reviewers for their detailed and constructive reviews.
This research has been supported by the Deutsche Forschungsgemeinschaft (grant-no. 506183115).
This paper was edited by Ian Delaney and reviewed by two anonymous referees.
Amschwand, D., Scherler, M., Hoelzle, M., Krummenacher, B., Haberkorn, A., Kienholz, C., and Gubler, H.: Surface heat fluxes at coarse blocky Murtèl rock glacier (Engadine, eastern Swiss Alps), The Cryosphere, 18, 2103–2139, https://doi.org/10.5194/tc-18-2103-2024, 2024.
Amschwand, D., Tschan, S., Scherler, M., Hoelzle, M., Krummenacher, B., Haberkorn, A., Kienholz, C., Aschwanden, L., and Gubler, H.: Seasonal ice storage changes and meltwater generation at Murtèl rock glacier (Engadine, eastern Swiss Alps): estimates from measurements and energy budgets in the coarse blocky active layer, Hydrol. Earth Syst. Sci., 29, 2219–2253, https://doi.org/10.5194/hess-29-2219-2025, 2025.
Arenson, L., Hoelzle, M., and Springman, S.: Borehole deformation measurements and internal structure of some rock glaciers in Switzerland, Permafrost and Periglac., 13, 117–135, https://doi.org/10.1002/ppp.414, 2002.
Bearth, P.: Geologischer Atlas der Schweiz 1:25000, Erläuterungen zum Atlasblatt 71 (1308 St. Niklaus), Schweizer Geologische Kommission, Basel, https://prod-swishop-s3.s3.eu-central-1.amazonaws.com/product-documents/GA25-ERL-71.pdf (last access: 13 July 2026), 1980.
Bertone, A., Barboux, C., Bodin, X., Bolch, T., Brardinoni, F., Caduff, R., Christiansen, H. H., Darrow, M. M., Delaloye, R., Etzelmüller, B., Humlum, O., Lambiel, C., Lilleøren, K. S., Mair, V., Pellegrinon, G., Rouyet, L., Ruiz, L., and Strozzi, T.: Incorporating InSAR kinematics into rock glacier inventories: insights from 11 regions worldwide, The Cryosphere, 16, 2769–2792, https://doi.org/10.5194/tc-16-2769-2022, 2022.
Biskaborn, B. K., Smith, S. L., Noetzli, J., Matthes, H., Vieira, G., Streletskiy, D. A., Schoeneich, P., Romanovsky, V. E., Lewkowicz, A. G., Abramov, A., Allard, M., Boike, J., Cable, W. L., Christiansen, H. H., Delaloye, R., Diekmann, B., Drozdov, D., Etzelmüller, B., Grosse, G., Guglielmin, M., Ingeman-Nielsen, T., Isaksen, K., Ishikawa, M., Johansson, M., Johannsson, H., Joo, A., Kaverin, D., Kholodov, A., Konstantinov, P., Kröger, T., Lambiel, C., Lanckman, J.-P., Luo, D., Malkova, G., Meiklejohn, I., Moskalenko, N., Oliva, M., Phillips, M., Ramos, M., Sannel, A. B. K., Sergeev, D., Seybold, C., Skryabin, P., Vasiliev, A., Wu, Q., Yoshikawa, K., Zheleznyak, M., and Lantuit, H.: Permafrost is warming at a global scale, Nat. Commun., 10, 264, https://doi.org/10.1038/s41467-018-08240-4, 2019.
Blöthe, J. H., Halla, C., Schwalbe, E., Bottegal, E., Trombotto Liaudat, D., and Schrott, L.: Surface velocity fields of active rock glaciers and ice-debris complexes in the Central Andes of Argentina, Earth Surf. Proc. Land., 46, 504–522, https://doi.org/10.1002/esp.5042, 2021.
Bosson, J., Deline, P., Bodin, X., Schoeneich, P., Baron, L., Gardent, M., and Lambiel, C.: The influence of ground ice distribution on geomorphic dynamics since the Little Ice Age in proglacial areas of two cirque glacier systems, Earth Surf. Proc. Land., 40, 666–680, https://doi.org/10.1002/esp.3666, 2014.
Bremer, M.: Tool IMCORR – Feature Tracking. SAGA Module Reference, http://www.saga-gis.org (accessed on 9 December 2025), 2012.
Buchelt, S., Blöthe, J. H., Kuenzer, C., Schmitt, A., Ullmann, T., Philipp, M., and Kneisel, C.: Deciphering Small-Scale Seasonal Surface Dynamics of Rock Glaciers in the Central European Alps Using DInSAR Time Series, Remote Sens.-Basel, 15, 2982, https://doi.org/10.3390/rs15122982, 2023.
Buchelt, S., Kunz, J., Wiegand, T., and Kneisel, C.: Dynamics and internal structure of a rock glacier: Inferring relationships from the combined use of differential synthetic aperture radar interferometry, electrical resistivity tomography and ground-penetrating radar, Earth Surf. Proc. Land., 49, 4743–4758, https://doi.org/10.1002/esp.5993, 2024.
Buckel, J., Mudler, J., Gardeweg, R., Hauck, C., Hilbich, C., Frauenfelder, R., Kneisel, C., Buchelt, S., Blöthe, J. H., Hördt, A., and Bücker, M.: Identifying mountain permafrost degradation by repeating historical electrical resistivity tomography (ERT) measurements, The Cryosphere, 17, 2919–2940, https://doi.org/10.5194/tc-17-2919-2023, 2023.
Chen, C. W. and Zebker, H. A.: Phase unwrapping for large SAR interferograms: statistical segmentation and generalized network models, IEEE T. Geosci. Remote, 40, 1709–1719, https://doi.org/10.1109/TGRS.2002.802453, 2002.
Cicoira, A., Marcer, M., Gärtner-Roer, I., Bodin, X., Arenson, L. U., and Vieli, A.: A general theory of rock glacier creep based on in-situ and remote sensing observations, Permafrost and Periglac., 32, 139–153, https://doi.org/10.1002/ppp.2090, 2021.
Cicoira, A., Weber, S., Biri, A., Buchli, B., Delaloye, R., Da Forno, R., Gärtner-Roer, I., Gruber, S., Gsell, T., Hasler, A., Lim, R., Limpach, P., Mayoraz, R., Meyer, M., Noetzli, J., Phillips, M., Pointner, E., Raetzo, H., Scapozza, C., Strozzi, T., Thiele, L., Vieli, A., Vonder Mühll, D., Wirz, V., and Beutel, J.: In situ observations of the Swiss periglacial environment using GNSS instruments, Earth Syst. Sci. Data, 14, 5061–5091, https://doi.org/10.5194/essd-14-5061-2022, 2022.
Crippa, C., Franzosi, F., Zonca, M., Manconi, A., Crosta, G. B., Dei Cas, L., and Agliardi, F.: Unraveling Spatial and Temporal Heterogeneities of Very Slow Rock-Slope Deformations with Targeted DInSAR Analyses, Remote Sens.-Basel, 12, 1329, https://doi.org/10.3390/rs12081329, 2020.
Cusicanqui, D., Bodin, X., Duvillard, P., Schoeneich, P., Revil, A., Assier, A., Berthet, J., Peyron, M., Roudnitska, S., and Rabatel, A.: Glacier, permafrost and thermokarst interactions in Alpine terrain: Insights from seven decades of reconstructed dynamics of the Chauvet glacial and periglacial system (Southern French Alps), Earth Surf. Proc. Land., 48, 2595–2612, https://doi.org/10.1002/esp.5650, 2023.
Eriksen, H. Ø., Rouyet, L., Lauknes, T. R., Berthling, I., Isaksen, K., Hindberg, H., Larsen, Y., and Corner, G. D.: Recent Acceleration of a Rock Glacier Complex, Ádjet, Norway, Documented by 62 Years of Remote Sensing Observations, Geophys. Res. Lett., 45, 8314–8323, https://doi.org/10.1029/2018GL077605, 2018.
Etzelmüller, B. and Hagen, J. O.: Glacier-permafrost interaction in Arctic and alpine mountain environments with examples from southern Norway and Svalbard, Special Publications, Geological Society, London, 242, 11–27, https://doi.org/10.1144/GSL.SP.2005.242.01.02, 2005.
Evin, M.: Une moraine de refoulement au Viso (Italie) Zeitschr. für Gletscherkunde und Glazialgeologie 27/28, 11–24, 1992.
Fleischer, F., Haas, F., Piermattei, L., Pfeiffer, M., Heckmann, T., Altmann, M., Rom, J., Stark, M., Wimmer, M. H., Pfeifer, N., and Becht, M.: Multi-decadal (1953–2017) rock glacier kinematics analysed by high-resolution topographic data in the upper Kaunertal, Austria, The Cryosphere, 15, 5345–5369, https://doi.org/10.5194/tc-15-5345-2021, 2021.
Gärtner-Roer, I., Brunner, N., Delaloye, R., Haeberli, W., Kääb, A., and Thee, P.: Glacier–permafrost relations in a high-mountain environment: 5 decades of kinematic monitoring at the Gruben site, Swiss Alps, The Cryosphere, 16, 2083–2101, https://doi.org/10.5194/tc-16-2083-2022, 2022.
Gharibi, M. and Bentley, L. R.: Resolution of 3-D Electrical Resistivity Images from Inversions of 2-D Orthogonal Lines, JEEG, 10, 339–349, https://doi.org/10.2113/JEEG10.4.339, 2005.
Günther, T., Rücker, C., and Spitzer, K.: Three-dimensional modelling and inversion of dc resistivity data incorporating topography – II. Inversion, Geophys. J. Int., 166, 506–517, https://doi.org/10.1111/j.1365-246X.2006.03011.x, 2006.
Haeberli, W.: Holocene Push-Moraines in Alpine Permafrost, Geogr. Ann. A, 61, 43–48, https://doi.org/10.2307/520513, 1979.
Haeberli, W.: Investigating glacier-permafrost relationships in high-mountain areas: historical background, selected examples and research needs, Special Publications, 242, Geological Society, London, 29–37, https://doi.org/10.1144/GSL.SP.2005.242.01.03, 2005.
Haeberli, W. and Vonder Mühll, D. S.: On the characteristics and possible origins of ice in rock glacier permafrost, Z. Geomorphol., Supplementband, 104, 43–57, 1996.
Haeberli, W., Hallet, B., Arenson, L., Elconin, R., Humlum, O., Kääb, A., Kaufmann, V., Ladanyi, B., Matsuoka, N., Springman, S., and Mühll, D. V.: Permafrost creep and rock glacier dynamics, Permafrost Periglac., 17, 189–214, https://doi.org/10.1002/ppp.561, 2006.
Haeberli, W., Arenson, L. U., Wee, J., Hauck, C., and Mölg, N.: Discriminating viscous-creep features (rock glaciers) in mountain permafrost from debris-covered glaciers – a commented test at the Gruben and Yerba Loca sites, Swiss Alps and Chilean Andes, The Cryosphere, 18, 1669–1683, https://doi.org/10.5194/tc-18-1669-2024, 2024.
Harris, C. and Murton, J. B.: Interactions between glaciers and permafrost: an introduction, in: Cryospheric Systems: Glaciers and Permafrost, edited by: Harris, C. and Murton, J. B., Geological Society, London, Special Publications, 242, 1–9, https://doi.org/10.1144/GSL.SP.2005.242.01.01, 2005.
Harris, S. A. and Pedersen, D. E.: Thermal regimes beneath coarse blocky materials, Permafrost Periglac., 9, 107–120, 1998.
Harrison, S., Racoviteanu, A., Shannon, S., Jones, D., Anderson, K., Glasser, N., Knight, J., Ranger, A., Mandal, A., Vishwakarma, B. D., Kargel, J. S., Shugar, D., Haritashya, U., Li, D., Koutroulis, A., Wyser, K., and Inglis, S.: Will landscape responses reduce glacier sensitivity to climate change in High Mountain Asia?, The Cryosphere, 19, 4113–4124, https://doi.org/10.5194/tc-19-4113-2025, 2025.
Hartmeyer, I. and Otto, J.-C.: Rockfall, glacier recession, and permafrost degradation: long-term monitoring of climate change impacts at the Open-Air-Lab Kitzsteinhorn, Hohe Tauern, DEUQUA Spec. Pub., 5, 3–12, https://doi.org/10.5194/deuquasp-5-3-2024, 2024.
Hauck, C.: New Concepts in Geophysical Surveying and Data Interpretation for Permafrost Terrain: Geophysical Surveying in Permafrost Terrain, Permafrost Periglac., 24, 131–137, https://doi.org/10.1002/ppp.1774, 2013.
Herring, T., Lewkowicz, A. G., Hauck, C., Hilbich, C., Mollaret, C., Oldenborger, G. A., Uhlemann, S., Farzamian, M., Calmels, F., and Scandroglio, R.: Best practices for using electrical resistivity tomography to investigate permafrost, Permafrost and Periglac., 34, 494–512, https://doi.org/10.1002/ppp.2207, 2023.
Hilbich, C., Marescot, L., Hauck, C., Loke, M. H., and Mäusbacher, R.: Applicability of electrical resistivity tomography monitoring to coarse blocky and ice-rich permafrost landforms, Permafrost Periglac., 20, 269–284, https://doi.org/10.1002/ppp.652, 2009.
Hu, Y., Arenson, L. U., Barboux, C., Bodin, X., Cicoira, A., Delaloye, R., Gärtner-Roer, I., Kääb, A., Kellerer-Pirklbauer, A., Lambiel, C., Liu, L., Pellet, C., Rouyet, L., Schoeneich, P., Seier, G., and Strozzi, T.: Rock Glacier Velocity: An Essential Climate Variable Quantity for Permafrost, Rev. Geophys., 63, e2024RG000847, https://doi.org/10.1029/2024RG000847, 2025.
Huss, M., Dhulst, L., and Bauder, A.: New long-term mass-balance series for the Swiss Alps, J. Glaciol., 61, 551–562, https://doi.org/10.3189/2015JoG15J015, 2015.
Kääb, A., Haeberli, W., and Gudmundsson, G. H.: Analysing the creep of mountain permafrost using high precision aerial photogrammetry: 25 years of monitoring Gruben rock glacier, Swiss Alps, Permafrost Periglac., 8, 4, 409–426, 1997.
Kellerer-Pirklbauer, A., Bodin, X., Delaloye, R., Lambiel, C., Gärtner-Roer, I., Bonnefoy-Demongeot, M., Carturan, L., Damm, B., Eulenstein, J., Fischer, A., Hartl, L., Ikeda, A., Kaufmann, V., Krainer, K., Matsuoka, N., Morra Di Cella, U., Noetzli, J., Seppi, R., Scapozza, C., Schoeneich, P., Stocker-Waldhuber, M., Thibert, E., and Zumiani, M.: Acceleration and interannual variability of creep rates in mountain permafrost landforms (rock glacier velocities) in the European Alps in 1995–2022, Environ. Res. Lett., 19, 034022, https://doi.org/10.1088/1748-9326/ad25a4, 2024.
Kenner, R., Phillips, M., Beutel, J., Hiller, M., Limpach, P., Pointner, E., and Volken, M.: Factors Controlling Velocity Variations at Short-Term, Seasonal and Multiyear Time Scales, Ritigraben Rock Glacier, Western Swiss Alps, Permafrost and Periglac., 28, 675–684, https://doi.org/10.1002/ppp.1953, 2017.
Kenner, R., Pruessner, L., Beutel, J., Limpach, P., and Phillips, M.: How rock glacier hydrology, deformation velocities and ground temperatures interact: Examples from the Swiss Alps, Permafrost and Periglac., 31, 3–14, https://doi.org/10.1002/ppp.2023, 2020.
Kenyi, L. and Kaufmann, V.: Measuring rock glacier surface deformation using SAR Interferometry, Proceedings of the Eighth International Conference on Permafrost, Zürich, Switzerland, 21–25 July 2003, Balkema, 1, 537–541, ISBN 90 5809 582 7, 2003.
Kneisel, C.: Permafrost in recently deglaciated glacier forefields – measurements and observations in the eastern Swiss Alps and northern Sweden, zfg, 47, 289–305, https://doi.org/10.1127/zfg/47/2003/289, 2003.
Kneisel, C.: Assessment of subsurface lithology in mountain environments using 2D resistivity imaging, Geomorphology, 80, 32–44, https://doi.org/10.1016/j.geomorph.2005.09.012, 2006.
Kneisel, C. and Kääb, A.: Mountain permafrost dynamics within a recently exposed glacier forefield inferred by a combined geomorphological, geophysical and photogrammetrical approach, Earth Surf. Proc. Land., 32, 1797–1810, https://doi.org/10.1002/esp.1488, 2007.
Kneisel, C., Haeberli, W., and Baumhauer, R.: Comparison of spatial modelling and field evidence of glacier/permafrost relations in an Alpine permafrost environment, Ann. Glaciol., 31, 269–274, https://doi.org/10.3189/172756400781820093, 2000.
Kneisel, C., Hauck, C., Fortier, R., and Moorman, B.: Advances in geophysical methods for permafrost investigations, Permafrost Periglac., 19, 157–178, https://doi.org/10.1002/ppp.616, 2008.
Kunz, J. and Kneisel, C.: Glacier–Permafrost Interaction at a Thrust Moraine Complex in the Glacier Forefield Muragl, Swiss Alps, Geosciences, 10, 205, https://doi.org/10.3390/geosciences10060205, 2020.
Kunz, J., Ullmann, T., and Kneisel, C.: Internal structure and recent dynamics of a moraine complex in an alpine glacier forefield revealed by geophysical surveying and Sentinel-1 InSAR time series, Geomorphology, 398, 108052, https://doi.org/10.1016/j.geomorph.2021.108052, 2022.
Lugon, R., Delaloye, R., Serrano, E., Reynard, E., and Lambiel, C.: Permafrost and Little Ice Age Glaciers Relationships: a Case Study in the Posets Massif, Central Pyrenees, Spain, Permafrost Periglac., 15, 207–220, https://doi.org/10.1002/ppp.494, 2004.
Marcer, M., Serrano, C., Brenning, A., Bodin, X., Goetz, J., and Schoeneich, P.: Evaluating the destabilization susceptibility of active rock glaciers in the French Alps, The Cryosphere, 13, 141–155, https://doi.org/10.5194/tc-13-141-2019, 2019.
Marescot, L., Loke, M. H., Chapellier, D., Delaloye, R., Lambiel, C., and Reynard, E.: Assessing reliability of 2D resistivity imaging in mountain permafrost studies using the depth of investigation index method, Near Surf. Geophys., 1, 57–67, https://doi.org/10.3997/1873-0604.2002007, 2003.
MeteoSwiss: Mean precipitation 1991–2020, https://data.geo.admin.ch/browser/index.html#/collections/ch.meteoschweiz.klimanormwerte-niederschlag_aktuelle_periode/items/klimanormwerte-niederschlag_aktuelle_periode?.language=en (last access: 7 April 2025), 2023a.
MeteoSwiss: Mean temperature 1991–2020, https://data.geo.admin.ch/browser/index.html#/collections/ch.meteoschweiz.klimanormwerte-temperatur_aktuelle_periode/items/klimanormwerte-temperatur_aktuelle_periode?.language=en (last access: 7 April 2025), 2023b.
Monnier, S., Camerlynck, C., Rejiba, F., Kinnard, C., Feuillet, T., and Dhemaied, A.: Structure and genesis of the Thabor rock glacier (Northern French Alps) determined from morphological and ground-penetrating radar surveys, Geomorphology, 134, 269–279, https://doi.org/10.1016/j.geomorph.2011.07.004, 2011.
Noetzli, J., Isaksen, K., Barnett, J., Christiansen, H. H., Delaloye, R., Etzelmüller, B., Farinotti, D., Gallemann, T., Guglielmin, M., Hauck, C., Hilbich, C., Hoelzle, M., Lambiel, C., Magnin, F., Oliva, M., Paro, L., Pogliotti, P., Riedl, C., Schoeneich, P., Valt, M., Vieli, A., and Phillips, M.: Enhanced warming of European mountain permafrost in the early 21st century, Nat. Commun., 15, 10508, https://doi.org/10.1038/s41467-024-54831-9, 2024.
Nyenhuis, M.: Permafrost und Sedimenthaushalt in einem alpinen Geosystem, PhD thesis, Rheinische Friedrich-Wilhelms-Universität Bonn, Germany, 228 pp., https://hdl.handle.net/20.500.11811/2309 (last access: 13 July 2026), 2005.
Otto, J.-C.: Paraglacial sediment storage quantification in the Turtmann Valley, Swiss Alps, PhD thesis, Rheinische Friedrich-Wilhelms-Universität Bonn, Germany, https://hdl.handle.net/20.500.11811/2694 (last access: 13 July 2026), 2006.
Otto, J.-C., Schrott, L., Jaboyedoff, M., and Dikau, R.: Quantifying sediment storage in a high alpine valley (Turtmanntal, Switzerland), Earth Surf. Proc. Land., 34, 1726–1742, https://doi.org/10.1002/esp.1856, 2009.
Pfluger, F., Weber, S., Steinhauser, J., Zangerl, C., Fey, C., Fürst, J., and Krautblatter, M.: Massive permafrost rock slide under a warming polythermal glacier deciphered through mechanical modeling (Bliggspitze, Austria), Earth Surf. Dynam., 13, 41–70, https://doi.org/10.5194/esurf-13-41-2025, 2025.
Reynard, E., Delaloye, R., Baron, L., Chapellier, D., Devaud, G., Lambiel, C., Marescot, L., and Monnet, R.: Glacier/permafrost relationships in forefields of small glaciers (Swiss Alps), Proceedings of the 8th International Conference on Permafrost, Zurich, 21–25 July 2003, vol. 1, 947–952, https://iris.unil.ch/handle/iris/52162 (last access: 13 July 2026), 2003.
Ribolini, A., Guglielmin, M., Fabre, D., Bodin, X., Marchisio, M., Sartini, S., Spagnolo, M., Schoeneich, P.: The internal structure of rock glaciers and recently deglaciated slopes as revealed by geoelectrical tomography: insights on permafrost and recent glacial evolution in the Central and Western Alps (Italy–France), Quaternary Sci. Rev., 29, 3–4, https://doi.org/10.1016/j.quascirev.2009.10.008, 2010.
Rock Glacier Inventories and Kinematics (RGIK): Guidelines for inventorying rock glaciers: Baseline and practical concepts (Version 1.0), IPA Action Group Rock glacier inventories and kinematics, https://doi.org/10.51363/unifr.srr.2023.002, 2023a.
Rock Glacier Inventories and Kinematics (RGIK): Rock Glacier Velocity as associated product of ECV Permafrost: practical concepts (version 1.2), IPA Action Group Rock glacier inventories and kinematics, 17 pp., https://www.rgik.org/wp-content/uploads/2025/03/Current_RGV_PC.pdf (last access: 13 July 2026), 2023b.
Rödder, T. and Kneisel, C.: Influence of snow cover and grain size on the ground thermal regime in the discontinuous permafrost zone, Swiss Alps, Geomorphology, 175–176, 176–189, https://doi.org/10.1016/j.geomorph.2012.07.008, 2012a.
Rödder, T. and Kneisel, C.: Permafrost mapping using quasi-3D resistivity imaging, Murtèl, Swiss Alps, Near Surf. Geophys., 10, 117–127, https://doi.org/10.3997/1873-0604.2011029, 2012b.
Rott, H., Scheuchl, B., Siegel, A., and Grasemann, B.: Monitoring very slow slope movements by means of SAR interferometry: A case study from a mass waste above a reservoir in the Ötztal Alps, Austria, Geophys. Res. Lett., 26, 1629–1632, 1999.
Rouyet, L., Lauknes, T. R., Christiansen, H. H., Strand, S. M., and Larsen, Y.: Seasonal dynamics of a permafrost landscape, Adventdalen, Svalbard, investigated by InSAR, Remote Sens. Environ., 231, 111236, https://doi.org/10.1016/j.rse.2019.111236, 2019.
Rücker, C., Günther, T., and Spitzer, K.: Three-dimensional modelling and inversion of dc resistivity data incorporating topography – I. Modelling, Geophys. J. Int., 166, 495–505, https://doi.org/10.1111/j.1365-246X.2006.03010.x, 2006.
Sandwell, D. T. and Price, E. J.: Phase gradient approach to stacking interferograms, J. Geophys. Res., 103, 30183–30204, https://doi.org/10.1029/1998JB900008, 1998.
Scherler, M., Schneider, S., Hoelzle, M., and Hauck, C.: A two-sided approach to estimate heat transfer processes within the active layer of the Murtèl–Corvatsch rock glacier, Earth Surf. Dynam., 2, 141–154, https://doi.org/10.5194/esurf-2-141-2014, 2014.
Sommer, C., Malz, P., Seehaus, T. C., Lippl, S., Zemp, M., and Braun, M. H.: Rapid glacier retreat and downwasting throughout the European Alps in the early 21st century, Nat. Commun., 11, 3209, https://doi.org/10.1038/s41467-020-16818-0, 2020.
Streletskiy, D., Noetzli, J., Smith, S. L., Vieira, G., Schoeneich, P., Hrbacek, F., and Irrgang, A. M.: Strategy and Implementation Plan for the Global Terrestrial Network for Permafrost (GTN-P) 2021–2024, https://doi.org/10.5281/ZENODO.6075468, 31 December 2021.
Strozzi, T., Caduff, R., Jones, N., Barboux, C., Delaloye, R., Bodin, X., Kääb, A., Mätzler, E., and Schrott, L.: Monitoring Rock Glacier Kinematics with Satellite Synthetic Aperture Radar, Remote Sens.-Basel, 12, 559, https://doi.org/10.3390/rs12030559, 2020.
Tatenhove, F. V. and Dikau, R.: Past and Present Permafrost Distribution in the Turtmanntal, Wallis, Swiss Alps, Arctic Alpine Res., 22, 302–316, https://doi.org/10.1080/00040851.1990.12002794, 1990.
Villarroel, C. D., Ortiz, D. A., Forte, A. P., Tamburini Beliveau, G., Ponce, D., Imhof, A., and López, A.: Internal structure of a large, complex rock glacier and its significance in hydrological and dynamic behavior: A case study in the semi-arid Andes of Argentina, Permafrost and Periglac., 33, 78–95, https://doi.org/10.1002/ppp.2132, 2022.
Vincent, C., Fischer, A., Mayer, C., Bauder, A., Galos, S. P., Funk, M., Thibert, E., Six, D., Braun, L., and Huss, M.: Common climatic signal from glaciers in the European Alps over the last 50 years, Geophys. Res. Lett., 44, 1376–1383, https://doi.org/10.1002/2016GL072094, 2017.
Vivero, S., Hendrickx, H., Frankl, A., Delaloye, R., and Lambiel, C.: Kinematics and geomorphological changes of a destabilising rock glacier captured from close-range sensing techniques (Tsarmine rock glacier, Western Swiss Alps), Front. Earth Sci., 10, 1017949, https://doi.org/10.3389/feart.2022.1017949, 2022.
Vonder Mühll, D.: Geophysikalische Untersuchungen im Permafrost des Oberengadins, PhD thesis, ETH Zurich, Switzerland, https://doi.org/10.3929/ETHZ-A-000891391, 1993.
Waller, R. I.: Glacier-permafrost interactions, Wiley, Hoboken, NJ, 306 pp., ISBN 978-1-118-62098-4, 2024.
Waller, R. I., Murton, J. B., and Kristensen, L.: Glacier–permafrost interactions: Processes, products and glaciological implications, Sediment. Geol., 255–256, 1–28, https://doi.org/10.1016/j.sedgeo.2012.02.005, 2012.
Wee, J.: Glacier-permafrost interactions and interrelation: dynamics of Little Ice Age glacier forefields in alpine permafrost environments, Doctoral thesis, University Fribourg, https://doi.org/10.51363/unifr.sth.2025.065. 2025.
Wee, J. and Delaloye, R.: Post-glacial dynamics of an alpine Little Ice Age glacitectonized frozen landform (Aget, western Swiss Alps), Permafrost and Periglac., 33, 370–385, https://doi.org/10.1002/ppp.2158, 2022.
Wee, J., Vivero, S., Mathys, T., Mollaret, C., Hauck, C., Lambiel, C., Beutel, J., and Haeberli, W.: Characterizing ground ice content and origin to better understand the seasonal surface dynamics of the Gruben rock glacier and the adjacent Gruben debris-covered glacier (southern Swiss Alps), EGUsphere [preprint], https://doi.org/10.5194/egusphere-2024-1283, 2024.
Wirz, V., Gruber, S., Purves, R. S., Beutel, J., Gärtner-Roer, I., Gubler, S., and Vieli, A.: Short-term velocity variations at three rock glaciers and their relationship with meteorological conditions, Earth Surf. Dynam., 4, 103–123, https://doi.org/10.5194/esurf-4-103-2016, 2016.
World Meteorological Organization (WMO) (Ed.): The 2022 GCOS ECVs Requirements, Geneva, https://library.wmo.int/idurl/4/58111 (last access: 13 July 2026), 2022.