the Creative Commons Attribution 4.0 License.
the Creative Commons Attribution 4.0 License.
 | 06 Jan 2026
The influence of snow cover on gross primary productivity of cultivated land in Northeast China
Lue Li
Qian Yang
Meng Cui
Huanjun Liu
Xiaohua Hao
Yiyang Peng
Junyi Chang
Snow cover is a critical regulator of hydrological cycles and vegetation productivity in temperate ecosystems, yet its multifaceted impact on cultivated lands remains poorly quantified, especially across diverse geographical regions. This study elucidates the spatially heterogeneous by which snow cover dynamics regulate Gross Primary Productivity (GPP) on cultivated land in Northeast China, a vital grain production base. By integrating 20 years of remote sensing observations, climate records, and soil data, we employed partial correlation, ridge regression, and Partial Least Squares Structural Equation Model (PLS-SEM) to isolate the effects of snow cover parameters, including Snow Water Equivalent (SWE), Snow Cover Duration (SCD), and Snow Cover End Date (SCED). Our results reveal a distinct geographical zoning of snow cover influences: SWE dominated GPP variability in the arid Western Sand Area and Liaohe Plain, whereas SCD was the primary driver in the Songnen Plain, and SCED exerted the strongest control in the colder Changbai Mountain and Xing'an Mountain. The PLS-SEM further quantified that these impacts are mediated primarily through snow-induced modifications to spring soil moisture and temperature, with the dominant pathway shifting from hydrological benefits in water-limited plains to thermal limitations in colder high-latitude areas. These findings suggest a significant correlation between changes in snow cover and GPP of cultivated land, providing insights into the potential role of snow cover in modulating GPP dynamics.
- Article
(8897 KB) - Full-text XML
- BibTeX
- EndNote


Cultivated land is a critical natural resource for ensuring food security, ecological stability, and economic sustainability. Under the pressure of intensifying soil erosion and climate change, understanding trends in gross primary productivity (GPP) variation on cultivated land and the associated environmental response mechanisms has become imperative for sustainable development and enhanced cropland conservation. GPP represents vegetation's photosynthetic carbon fixation capacity per unit time and serves as a critical metric of carbon assimilation through photosynthesis (Beer et al., 2010; Sjöström et al., 2013). Cropland ecosystems play a pivotal role in terrestrial carbon cycling (Wang et al., 2022), where GPP directly governs crop growth dynamics, carbon sequestration potential, and agricultural productivity, making it an essential indicator of agroecosystem productivity (Wagle et al., 2015). As an important component of terrestrial ecosystems, snow cover significantly affects the carbon cycle by altering ecosystem functioning. In recent decades, amid global warming, significant changes in snow cover have been observed (Mudryk et al., 2020; Pulliainen et al., 2020), which subsequently influence vegetation dynamics and GPP through altered environmental conditions (Meredith et al., 2019).
Previous studies demonstrated that snow cover and its phenological changes regulate the surface energy balance and hydrological cycles, while directly affecting the timing of the growing season and photosynthetic efficiency on cultivated land, thereby modulating GPP. GPP is a comprehensive indicator of the complex interactions among climatic, topographic, edaphic, botanical, and anthropogenic factors. Winter Snow Water Equivalent (SWE) and Snow Cover Duration (SCD) largely determine Soil Moisture (SM) availability and thermal regimes (Blankinship and Hart, 2012). These regulatory effects prove particularly crucial during spring sowing periods, with lasting impacts on annual carbon uptake efficiency (Chen et al., 2019). Meanwhile, SCD decreases are associated with advanced vegetation phenology and subsequent increases in productivity (Pulliainen et al., 2017). SWE primarily affects GPP by altering SM and nitrogen dynamics, with a thick snow layer additionally protecting root systems from winter freeze injury (Brooks et al., 2011; Knowles et al., 2017). A delayed Snow Cover End Date (SCED) can enhance early-growing-season GPP in arid lands and grassland ecosystems, while often exerting a suppressive effect on forest GPP (Wang et al., 2024). These effects are further modulated by climate change drivers, including temperature rise and precipitation variability (Peng et al., 2010). In summary, snow cover and its phenological changes significantly influence ecosystem GPP by regulating hydrothermal conditions and vegetation growth.
The mechanisms by which snow cover influences GPP, however, exhibit significant heterogeneity across vegetation types and geographic contexts. Li et al. (2022) revealed that the influence of snow cover parameters on spring soil moisture is most pronounced in farmland among different land-use types. The positive hydrological effect of snow cover on SM is more pronounced in relatively arid regions, resulting in a greater enhancement of GPP. In contrast, in energy-limited or humid systems where water is not the primary limiting factor, the contribution of snowmelt to GPP becomes marginal. Previous work by Wang et al. (2024) shows that the relationship between snow cover and vegetation productivity in Northeast China varies by underlying surface type and is further modulated by local environmental conditions. A knowledge gap exists in previous work regarding how multi-metric snow characteristics interact with snow-vegetation productivity relationships simultaneously across agricultural regions in Northeast China. This limited understanding hinders our ability to accurately predict how ongoing climate-driven changes in snow cover will affect the regional carbon budgets and the ecosystem functioning of cultivated land, particularly in snow-dependent regions.
Northeast China hosts a vital grain production base, crucial to national food security. Due to a growing population and intensifying climate change, understanding regional GPP responses across geographical conditions has become increasingly urgent. This study integrates multi-source data, including 20 years of remote sensing observations, climate records, and agricultural statistics, to systematically analyze spatiotemporal patterns of snow cover variation and their mechanistic impacts on GPP of cultivated land in Northeast China. The objectives include (1) examining the spatiotemporal variations in snow cover (e.g., SWE, SCD, and SCED); (2) elucidating the spatiotemporal heterogeneity of snow cover's effects on GPP of cultivated land; and (3) exploring the mechanisms underlying the regulatory roles of snow cover on GPP.
2.1 Study area
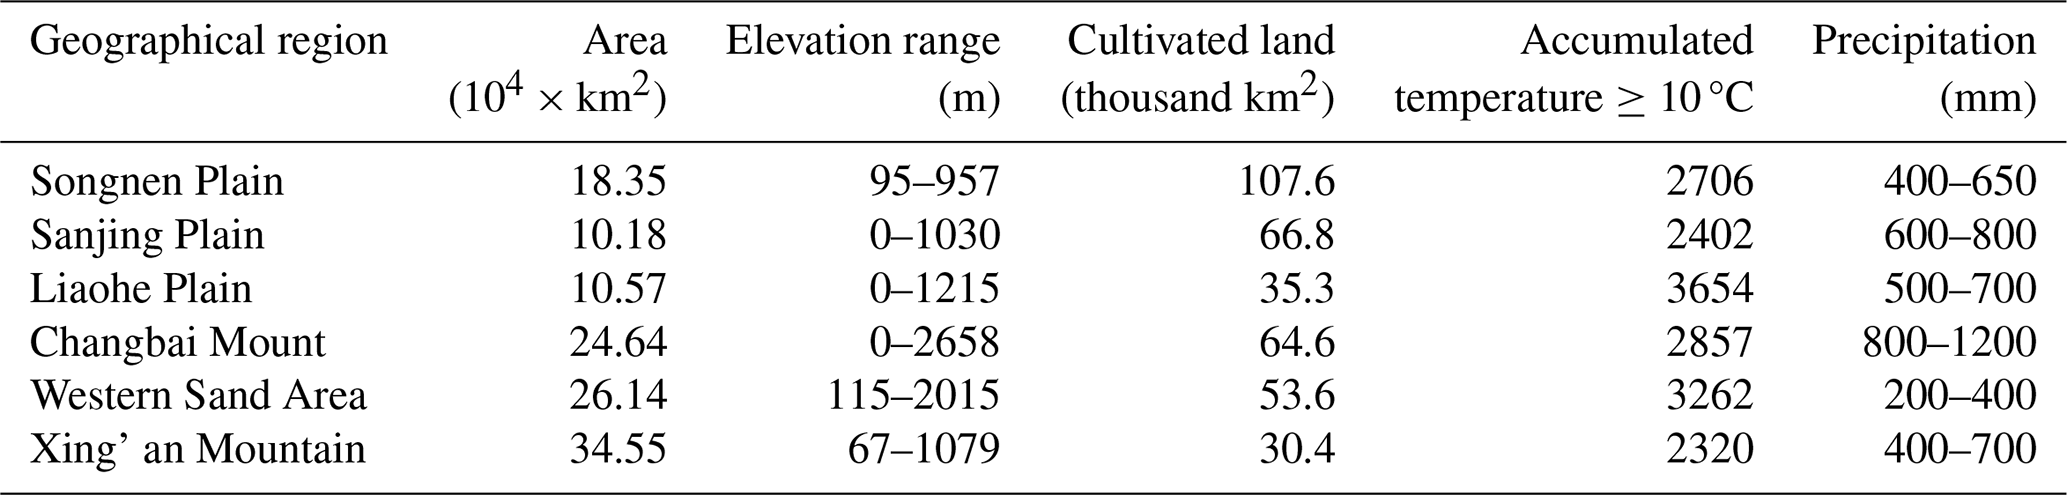
Northeast China is a high-latitude region (38°72′ to 53°56′ N, 115°52′ to 135°09′ E) comprising Heilongjiang, Jilin, and Liaoning provinces, as well as the eastern four leagues of the Inner Mongolia Autonomous Region. The region covers approximately 1.25×10⁶ km2 and hosts 358 700 km2 of cultivated land, accounting for 26.6 % of China's total cultivated area (Wang et al., 2023a). The topography exhibits distinct regional differentiation, with mountainous peripheries on three sides and extensive plains in the interior. Six major geographical regions exist in the region: the Songnen Plain, Sanjiang Plain, Liaohe Plain, Xing'an Mountain, and Changbai Mountain as shown in Fig. 1.
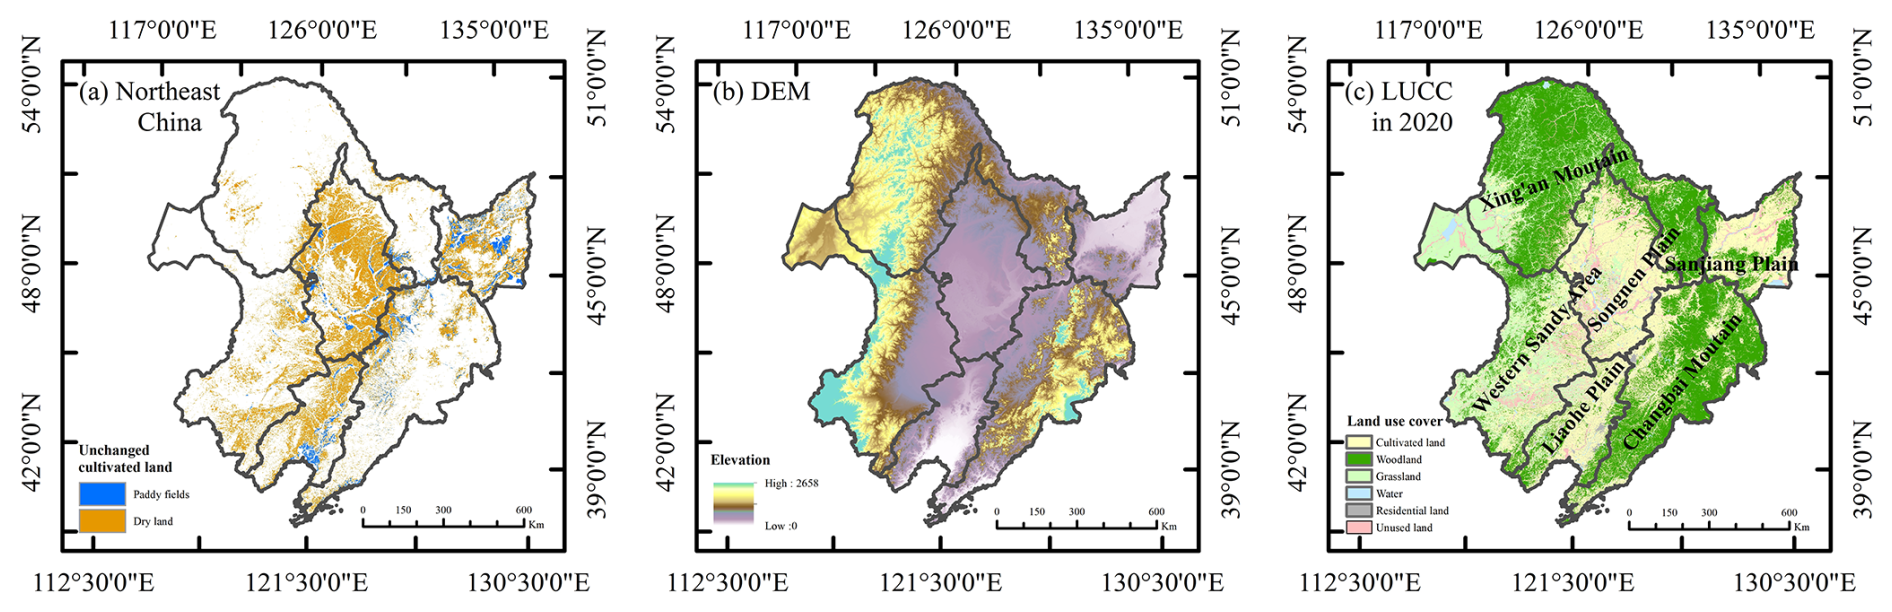
Figure 1The overview of the study area: (a) cultivated land in Northeast China; (b) digital elevation model (DEM) provided by SRTM; (c) land use cover provided by LUCC.
Table 1 compares the climatic characteristics across the six sub-regions. The region features a temperate monsoon climate characterized by winter snowfall (Xue et al., 2022), low evaporation rates, and high humidity. However, as shown in Table 1, there are pronounced climatic gradients across the six sub-regions. The effective accumulated temperature (≥10 °C) ranges from 2320 °C in the cooler Xing'an Mountain area to 3654 °C in the warmer Liaohe Plain (Xu et al., 2023; Wang et al., 2023b). Similarly, annual precipitation exhibits stark contrasts, from a mere 200–400 mm in the arid Western Sand Area to 800–1200 mm in the humid Changbai Mountain. These geographic and climatic differentiations are crucial for understanding regional ecosystem responses.
Table 1The details of six geographic divisions in Northeast China.
2.2 Materials
2.2.1 Snow cover products
Three snow cover parameters were utilized in this study: SWE, SCD, and SCED from hydrological year (HY) 2001 to HY 2000. The hydrological year is defined as the duration from September to August. Daily SWE data were sourced from the National Cryosphere Desert Data Center's fusion product with the spatial resolution of 0.25° across China for the period 1980–2020 (Jiang et al., 2022). This dataset integrated the advantages of existing SWE data products with topographic and temporal covariates and was validated using ground observations from 647 monitoring stations. The validation results demonstrated correlation coefficients (R2) of 0.84, with overall unbiased root mean square error (unRMSE) and bias values of 5.09 cm and −0.65 cm, respectively.
The SCD and SCED data were obtained from the MODIS-based Chinese Snow Phenology Dataset (Zhao et al., 2022). This China-wide dataset (2000–2020) has a 500 m spatial resolution, and its accuracy has been rigorously validated against ground stations. The dataset demonstrates high accuracy, with R2, RMSE, and MAE values of 0.94, 12.09 d, and 7.60 d for SCD, and 0.56, 19.89 d, and 7.74 d for SCED, respectively.
2.2.2 GPP data
This study utilized the MOD17A2H Version 6 GPP product (Running et al., 2021). The data encompassed the growing seasons (April–September) from HY2001 to HY2020. This product provides 8 d composite data at 500 m spatial resolution, offering cumulative measurements of vegetation photosynthetic activity. MODIS products have been extensively validated and widely adopted in terrestrial carbon cycle research (Endsley et al., 2023; Wang et al., 2017). Existing studies have validated the MOD17A2 GPP data product across various ecosystems in China, demonstrating a strong agreement with in-situ eddy covariance flux tower observations (R2=0.76) (Zhu et al., 2016).
2.2.3 Climate data
Precipitation, air temperature, and solar radiation data were used to analyze the domain factors influencing snow cover. The monthly precipitation and temperature data were obtained from the 1 km-resolution monthly precipitation dataset (Peng, 2020) and the 1 km-resolution monthly mean temperature dataset for China (Peng, 2019). These datasets provide monthly records from 1901 to 2021 across China at a spatial resolution of 1 km, comprehensively covering various climatic variables. A comprehensive evaluation under diverse environmental conditions demonstrated that the ERA5-LAND product accurately represents actual solar radiation patterns, making it highly suitable for various ecological and climatological applications (Mihalevich et al., 2022; Muñoz-Sabater et al., 2021).
2.2.4 Soil data
Soil temperature (ST) and soil moisture (SM) data were obtained from the Famine Early Warning Systems Network (FEWS NET) Land Data Assimilation System (FLDAS) (McNally, 2018). The FLDAS data are generated using the Noah Land Surface Model (LSM) version 3.6.1, with a spatial resolution of 0.1°×0.1° and monthly temporal resolution, providing 28 surface variables from 1982 to the present. This comprehensive dataset includes the 0–10 cm SM and ST used in this study, which are particularly relevant for analyzing vegetation dynamics and ecosystem processes.
The FLDAS data have been validated against multiple in-situ soil observation networks and demonstrated superior accuracy to the Global Land Data Assimilation System (GLDAS) (Li et al., 2021). The validation involved extensive comparisons with ground-based measurements, confirming the reliability of FLDAS outputs for estimating soil parameters. This high-quality dataset enables robust analysis of soil-vegetation-atmosphere interactions, supporting various applications in ecological modeling and climate studies.
2.2.5 Land use type
Northeast China lost 6694 km2 of cultivated land between 2000 and 2020, primarily due to urban expansion and the Grain for Green Program. The land use data were obtained from the 1 km-resolution China Land Use Dataset (1980–2020) (Xu et al., 2018). Pixel-wise screening of land-use distribution data from 2001 to 2020 identified cultivated land that remained unchanged over the 20 years for analysis. Figure 1a shows the spatial distribution of unchanged cultivated land, including 87.83 % dryland and 12.63 % paddy land. Paddy land typically requires substantial irrigation and is heavily influenced by human activities. Therefore, to more accurately examine the impact of snow cover changes, the study excludes paddy land and focuses solely on dryland as a representative of cultivated land.
2.3 Methods
2.3.1 Trend analysis
The long-term trends in the annual time series of SCD, SWE, and GPP (2001–2020) were analyzed using the Theil–Sen slope method (Sen,1968). The statistical significance of these trends was evaluated with the Mann–Kendall test (Kendall, 1948; Mann, 1945). In the Mann–Kendall test, a monotonic trend is considered statistically significant at the 90 %, 95 %, and 99 % confidence levels if the absolute value of the computed Z statistic exceeds 1.65, 1.96, and 2.58, respectively (Abebe et al., 2022; Xu et al., 2017).
2.3.2 Partial correlation
All datasets were resampled to a consistent spatial resolution of 0.05°×0.05° using the nearest neighbor method to facilitate subsequent pixel-by-pixel analysis. Then, a partial correlation analysis was employed to statistically quantify the relationship between two variables while controlling for the effects of one or more covariates (Gonzalez, 2003; Kashyap and Kuttippurath, 2024; Wei et al., 2022). Specifically, we applied pixel-wise partial correlation to examine the impacts of SCD, SWE, and SCED on GPP across various land-use types, while controlling for concurrent temperature, precipitation, and solar radiation to isolate the direct effects of snow cover.
2.3.3 Ridge regression
Given the potential multicollinearity among snow cover indicators, we used ridge regression rather than ordinary least squares to ensure stable coefficient estimates (Zhao et al., 2023). This approach was applied pixel-wise to quantify the relative contributions of SCD, SWE, and SCED to GPP across the study area. This method identified the dominant snow-cover indicators influencing GPP on cultivated land in each zone, providing valuable insights into the spatial heterogeneity of snow cover's effects on vegetation productivity.
2.3.4 Partial least squares structural equation model
To decipher the complex causal pathways through which snow affects GPP, we employed a Partial Least Squares Structural Equation Model (PLS-SEM). Two latent variables were created during model construction, including Snow and Climate. Snow included SCD, SWE, and SCED, whereas Climate included precipitation, air temperature, and solar radiation. The PLS-SEM also included SM, ST, and GPP data for different vegetation types. All variables were normalized before the analysis to facilitate comparison of path coefficients.
The path coefficients in PLS-SEM analysis represent the magnitude and direction of direct effects between two variables. Positive and negative path coefficients correspond to the positive and negative effects of the independent variable on the dependent variable, respectively, with their values quantifying the respective effects (Hair et al., 2019; Luo et al., 2017). The goodness-of-fit (GOF) index globally evaluates the quality of the path models and determines their validity. A GOF above 0.36 indicates applicable model results (Wetzels et al., 2009).
3.1 The spatiotemporal distribution of snow cover
Figure 2 displays the spatial distribution of mean SWE in Northeast China from HY2001 to HY2020. Among the six sub-regions, the Sanjiang Plain had the highest mean SWE at 9.66 mm. The high SWE values were observed in the Xing'an Mountain-Nenjiang conjunction and the Sanjiang Plain. The Xing'an Mountain had the second-highest mean value of 9.05 mm and the second-highest maximum value of 20.10, followed by Songnen Plain. The Changbai Mountain also had a relatively high mean SWE of 6.26 mm. The semi-arid Western Sand Area had the second-lowest mean SWE but the highest maximum SWE. The mountainous areas (Changbai Mountain an Xing'an Mountains) had greater snowfall than the other four sub-regions, explaining the high SWE levels. The Liaohe Plain had the lowest SWE among these six sub-regions due to its lower latitude. The negative slope of the SWE fitting line in Fig. 2c indicates a slight decreasing trend from HY2001 to HY2020.
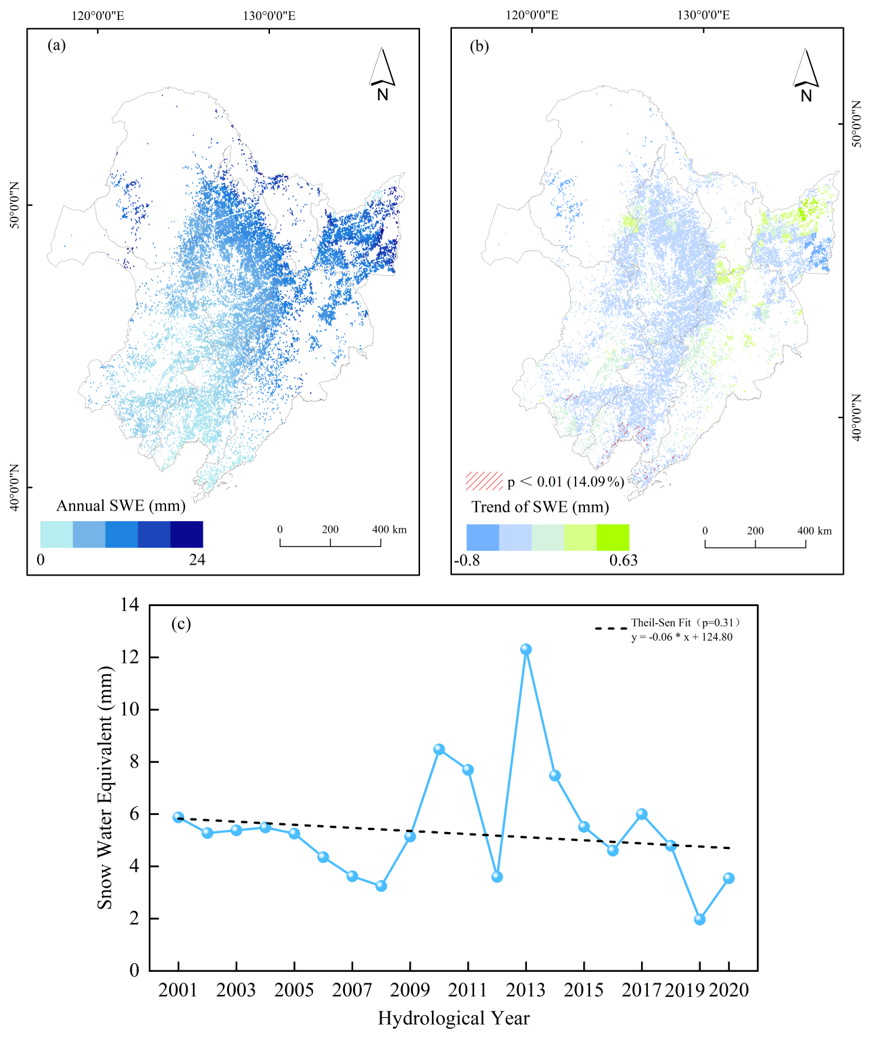
Figure 2The spatial and temporal changes of SWE in Northeast China from HY2001 to HY2020: (a) spatial distribution of mean SWE; (b) changing trend of SWE, the green areas represent positive impacts, while the blue areas indicate negative impacts; and the shaded regions denote pixels that were significant at the 90 % confidence level; (c) annual changes of SWE.
Figure 3 shows the spatial distribution of mean SCD in Northeast China from HY2001 to HY2020, and Table 2 lists the corresponding statistical results. The SCD had an average value of 80.79 d. High SCD values were primarily observed in the northeastern and mountainous areas, while low SCD values were distributed in the southwest and the low-altitude regions. Overall, a decreasing trend was observed from the northeast to the southwest. Noticeable differences were observed in Changbai Mountain. Its northeastern area, closer to the Sanjiang Plain, showed significantly higher SCD than the southwestern area near the Liaohe Plain. The Xing'an Mountain had the highest mean SCD of 1119.57 d and the highest maximum SCD of 162.44 d, higher than the Changbai Mountain. The Sanjiang Plain had the second-highest mean SCD of 110.85 d, followed by the Songnen Plain. The negative slope of the fitting line in Fig. 3c indicates a decreasing trend in SCD, with significant fluctuations between 2008 and 2014. Meanwhile, 54.1 % of the cultivated land in the northeastern area experienced extended SCD, primarily distributed in the Songnen Plain. Areas with shortened SCD accounted for 45.9 % of the total area. Areas with significant SCD declines were mainly concentrated in the Liaohe Plain, similar to the spatial distribution of interannual SWE variation.
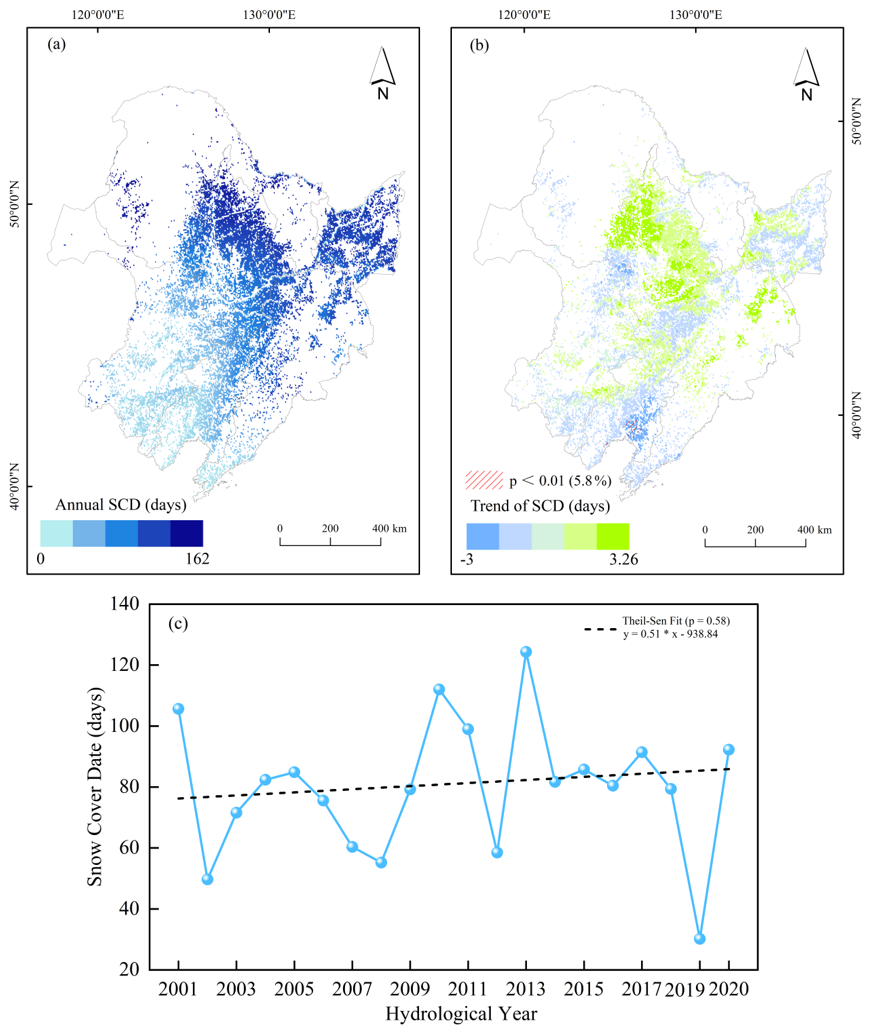
Figure 3The spatial and temporal changes of SCD in Northeast China from HY2001 to HY2020: (a) spatial distribution of mean SCD; (b) changing trend of SCD, the green areas represent positive impacts, while the blue areas indicate negative impacts; and the shaded regions denote pixels that were significant at the 90 % confidence level; (c) annual changes of SCD.
Table 2Statistics of SWE, SCD and SCED in six geographical regions in Northeast China.
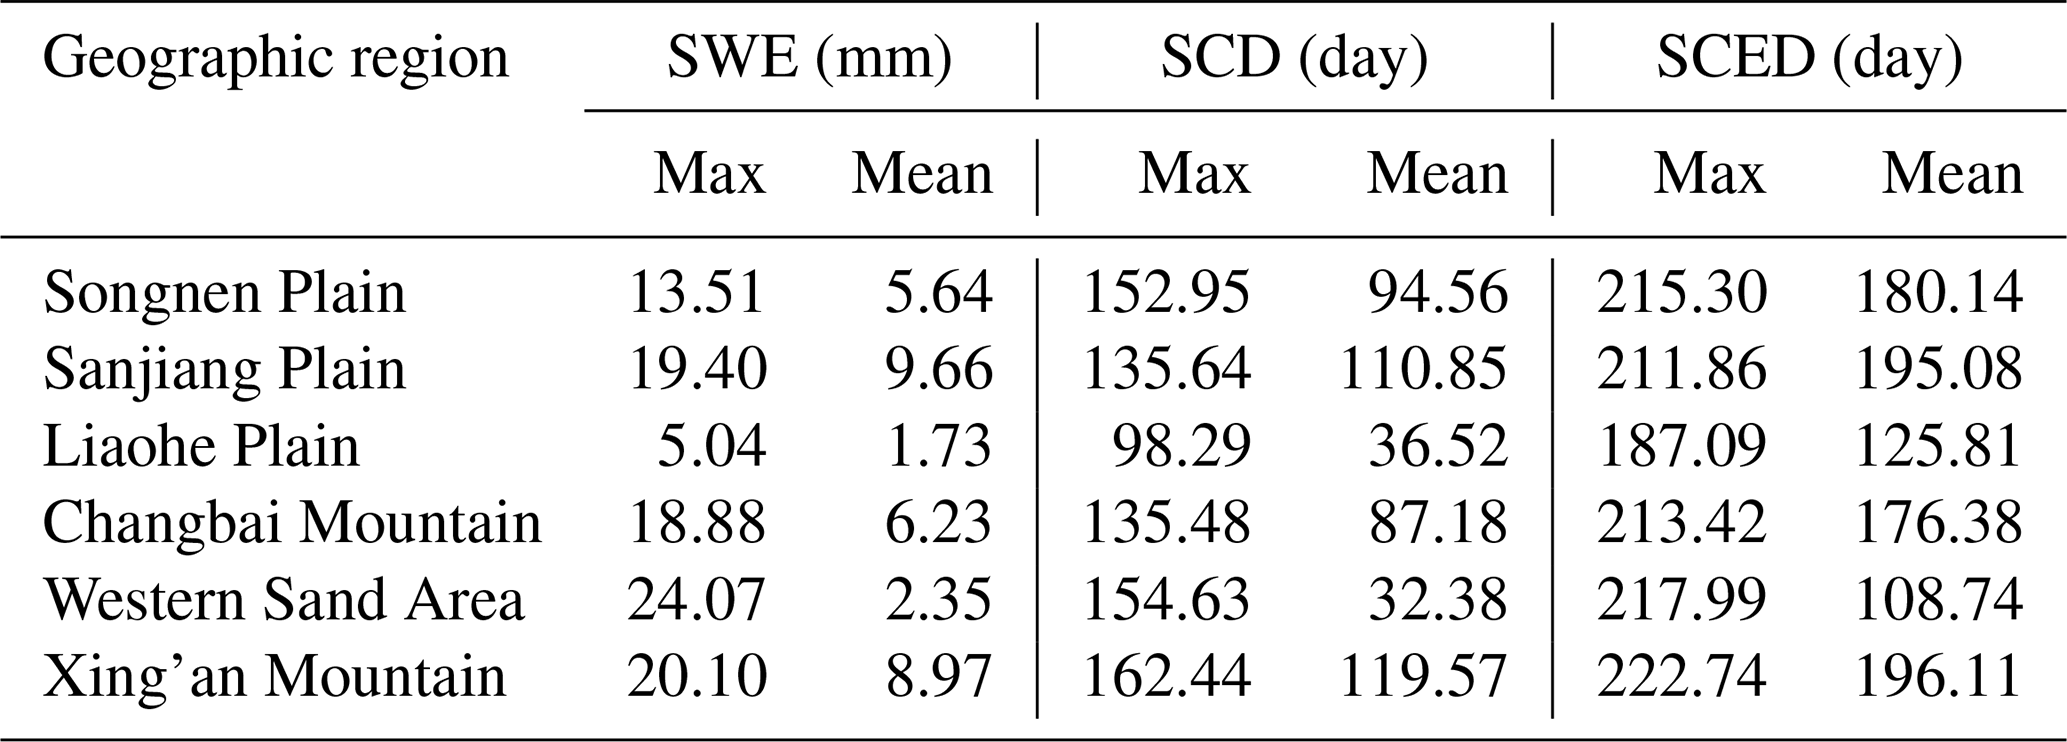
Figure 4 displays the spatial distribution of mean SCED in Northeast China from HY2001 to HY2020. The SCED distribution pattern was similar to that of SWE and SCD. Higher SCEDs were still primarily observed in the northeastern and mountainous areas, while lower SCEDs were distributed in the southwest and low-altitude regions. The statistical results showed that the SCE had an average of approximately 163.99 d. About 49 % of the pixels had SCEDs ranging from 180 to 210 d, while 49 % had SCEDs extending into March of the following year. Such pixels were concentrated in the Changbai Mountain, Sanjiang Plain, and the northeastern Songnen Plain. Pixels with SCEDs above 210 d accounted for only about 3 % and were mainly distributed in the Xing'an Mountain. The average SCED in the Sanjiang Plain and Xing'an Mountain were approximately 195.08 and 196.11 d, respectively. According to Fig. 4, the slope of the SCED fitting line in Fig. 4c indicates a slight advancing trend. The SCED trend was relatively stable between 2005 and 2007, whereas fluctuations of 10 to 30 d were observed in other years. Delayed SCEDs were observed in 56.15 % of the areas. Such regions were primarily distributed in the Songnen Plain, Sanjiang Plain, and Changbai Mountain. Only 43.85 % of the regions exhibited earlier SCEDs, mainly concentrated in the Liaohe Plain.
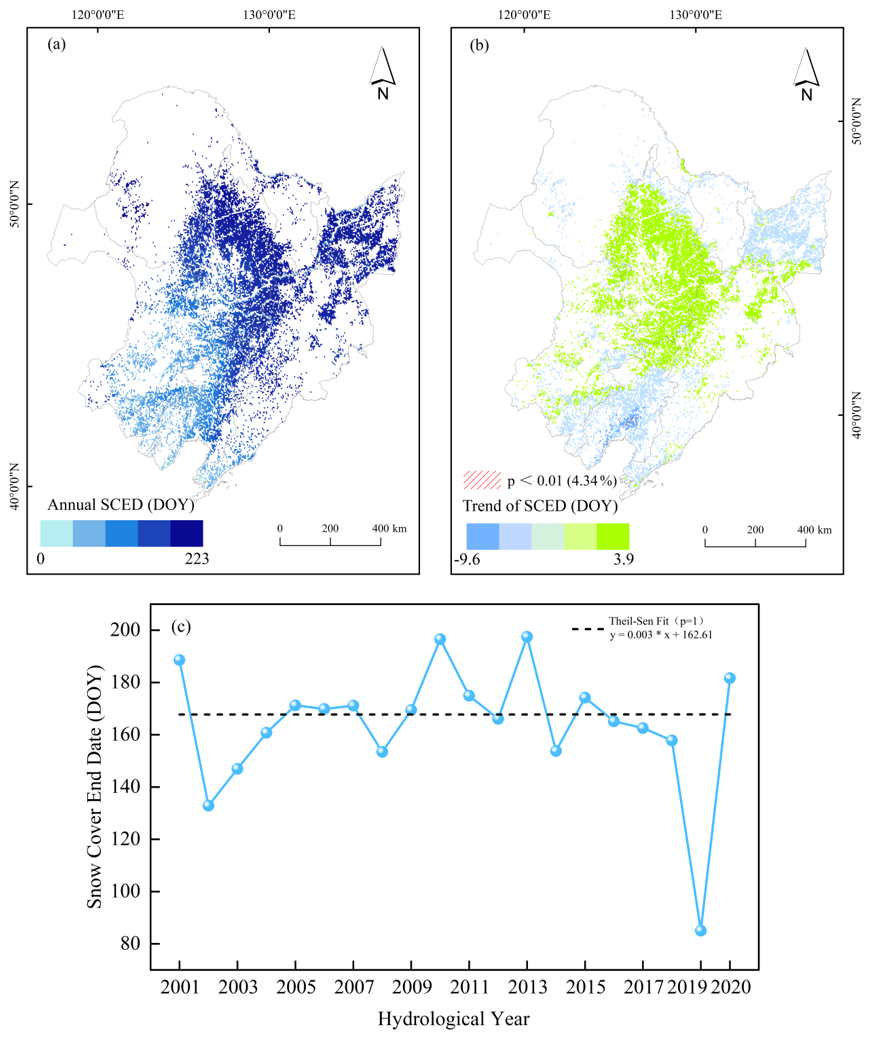
Figure 4The spatial and temporal changes of SCED in Northeast China from HY2001 to HY2020: (a) spatial distribution of mean SCED; (b) changing trend of SCED, the green areas represent positive impacts, while the blue areas indicate negative impacts; and the shaded regions denote pixels that were significant at the 90 % confidence level; (c) annual changes of SCED.
3.2 Effects of Snow Cover on Soil Properties
Figure 5 illustrates the spatial distribution of correlation coefficients between winter SWE and the subsequent year's ST and SM. As shown in Fig. 5a, the correlation coefficient between SWE and ST ranges from −0.6 to 0.72. Areas with negative correlations accounted for approximately 62.97 % of the total cultivated land, which indicates predominantly negative influences of SWE on the ST in the subsequent year. The regions with significantly negative correlations are concentrated in the Songnen Plain and Sanjiang Plain. A small area with positive correlation was found in the Western Sand Area and the northern part of Changbai Mountain. According to Fig. 5b, the correlation coefficient between SWE and SM ranges from −0.74 to 0.86. Areas with positive correlations accounted for about 70.45 % of the total cultivated land, indicating a primarily positive impact of SWE on the SM in the subsequent year. The areas with significantly positive correlations are mainly concentrated in the Sanjiang Plain and Changbai Mountain. Areas with negative correlations between SWE and SM accounted for approximately 29.55 %, concentrated primarily on the Songnen Plain and Liaohe Plain.
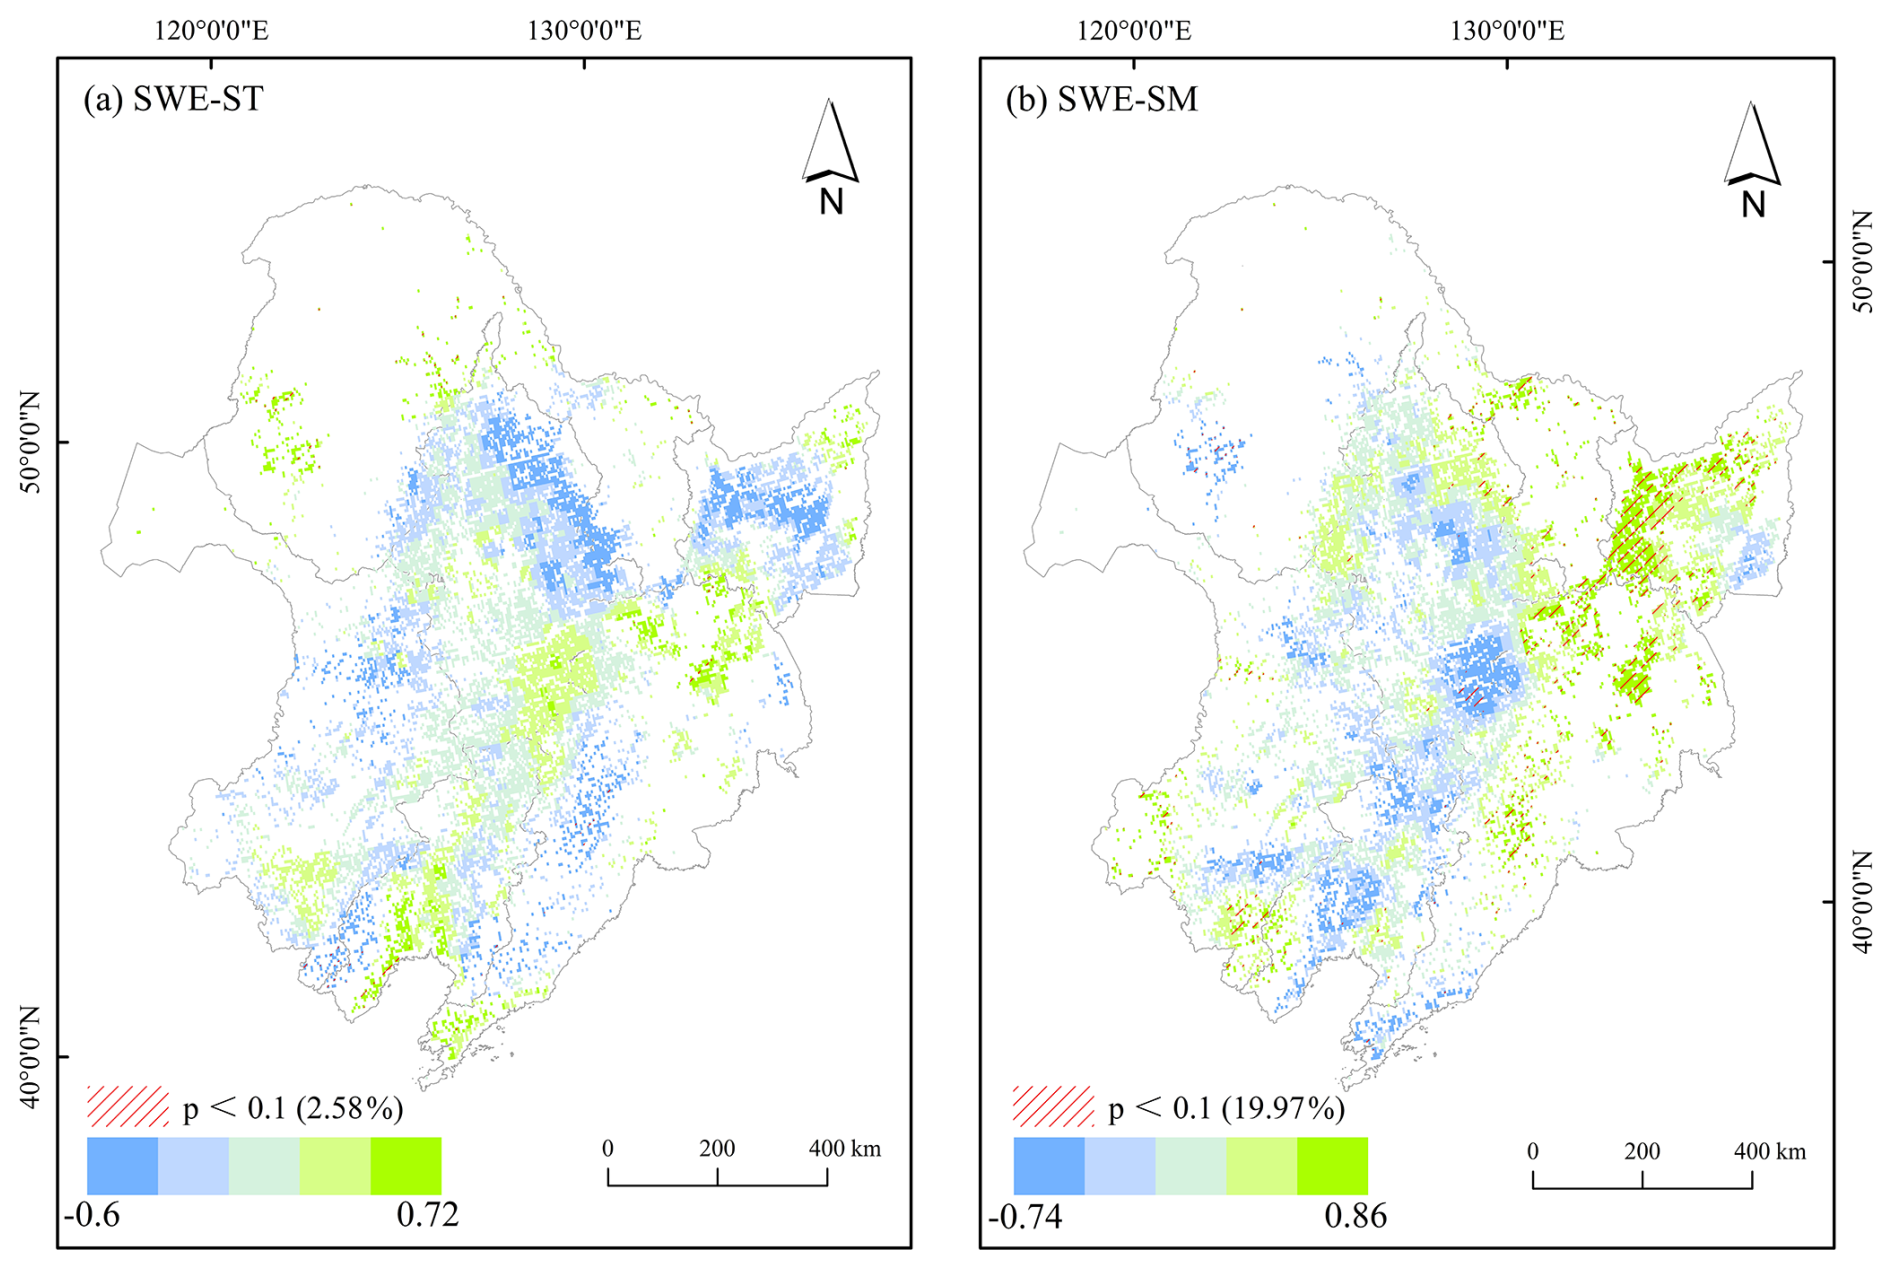
Figure 5The correlation coefficients between SWE and soil properties: (a) soil temperature; (b) soil moisture. Blue and green pixels represent negative and positive correlations respectively. The shaded regions denote pixels that were significant at the 90 % confidence level.
Figure 6 illustrates the spatial distribution of correlation coefficients between winter SCD and soil parameters of the subsequent year. As shown in Fig. 6a, the correlation coefficient between SCD and ST ranges from −0.64 to 0.72. Areas with negative correlations accounted for approximately 54.8 % of the total cultivated land, indicating that the influence of SCD on the subsequent year's ST is predominantly negative. Areas with significantly negative correlations are primarily concentrated in the Songnen and Sanjiang Plains. These results suggest that a longer SCD is associated with slower soil warming the following spring. Only a small number of areas with positive correlations were found in the northern part of Changbai Mountain and the Western Sand Area. Thus, a longer SCD in these areas may, to some extent, promote ST recovery through insulating effects. According to Fig. 6b, the correlation coefficient between SCD and SM ranges from −0.66 to 0.61. Areas with positive correlations accounted for 64.36 %, indicating a primarily positive impact of SCD on the subsequent year's SM. The areas with significantly positive correlations are mainly concentrated in the Songnen Plain and Changbai Mountain. Areas with negative correlations accounted for only 35.64 %, and SCD's moderating effect on SM transitions from positive to negative from northeast to southwest. The pixels with SCD negatively affecting SM were primarily concentrated in the Liaohe Plain.
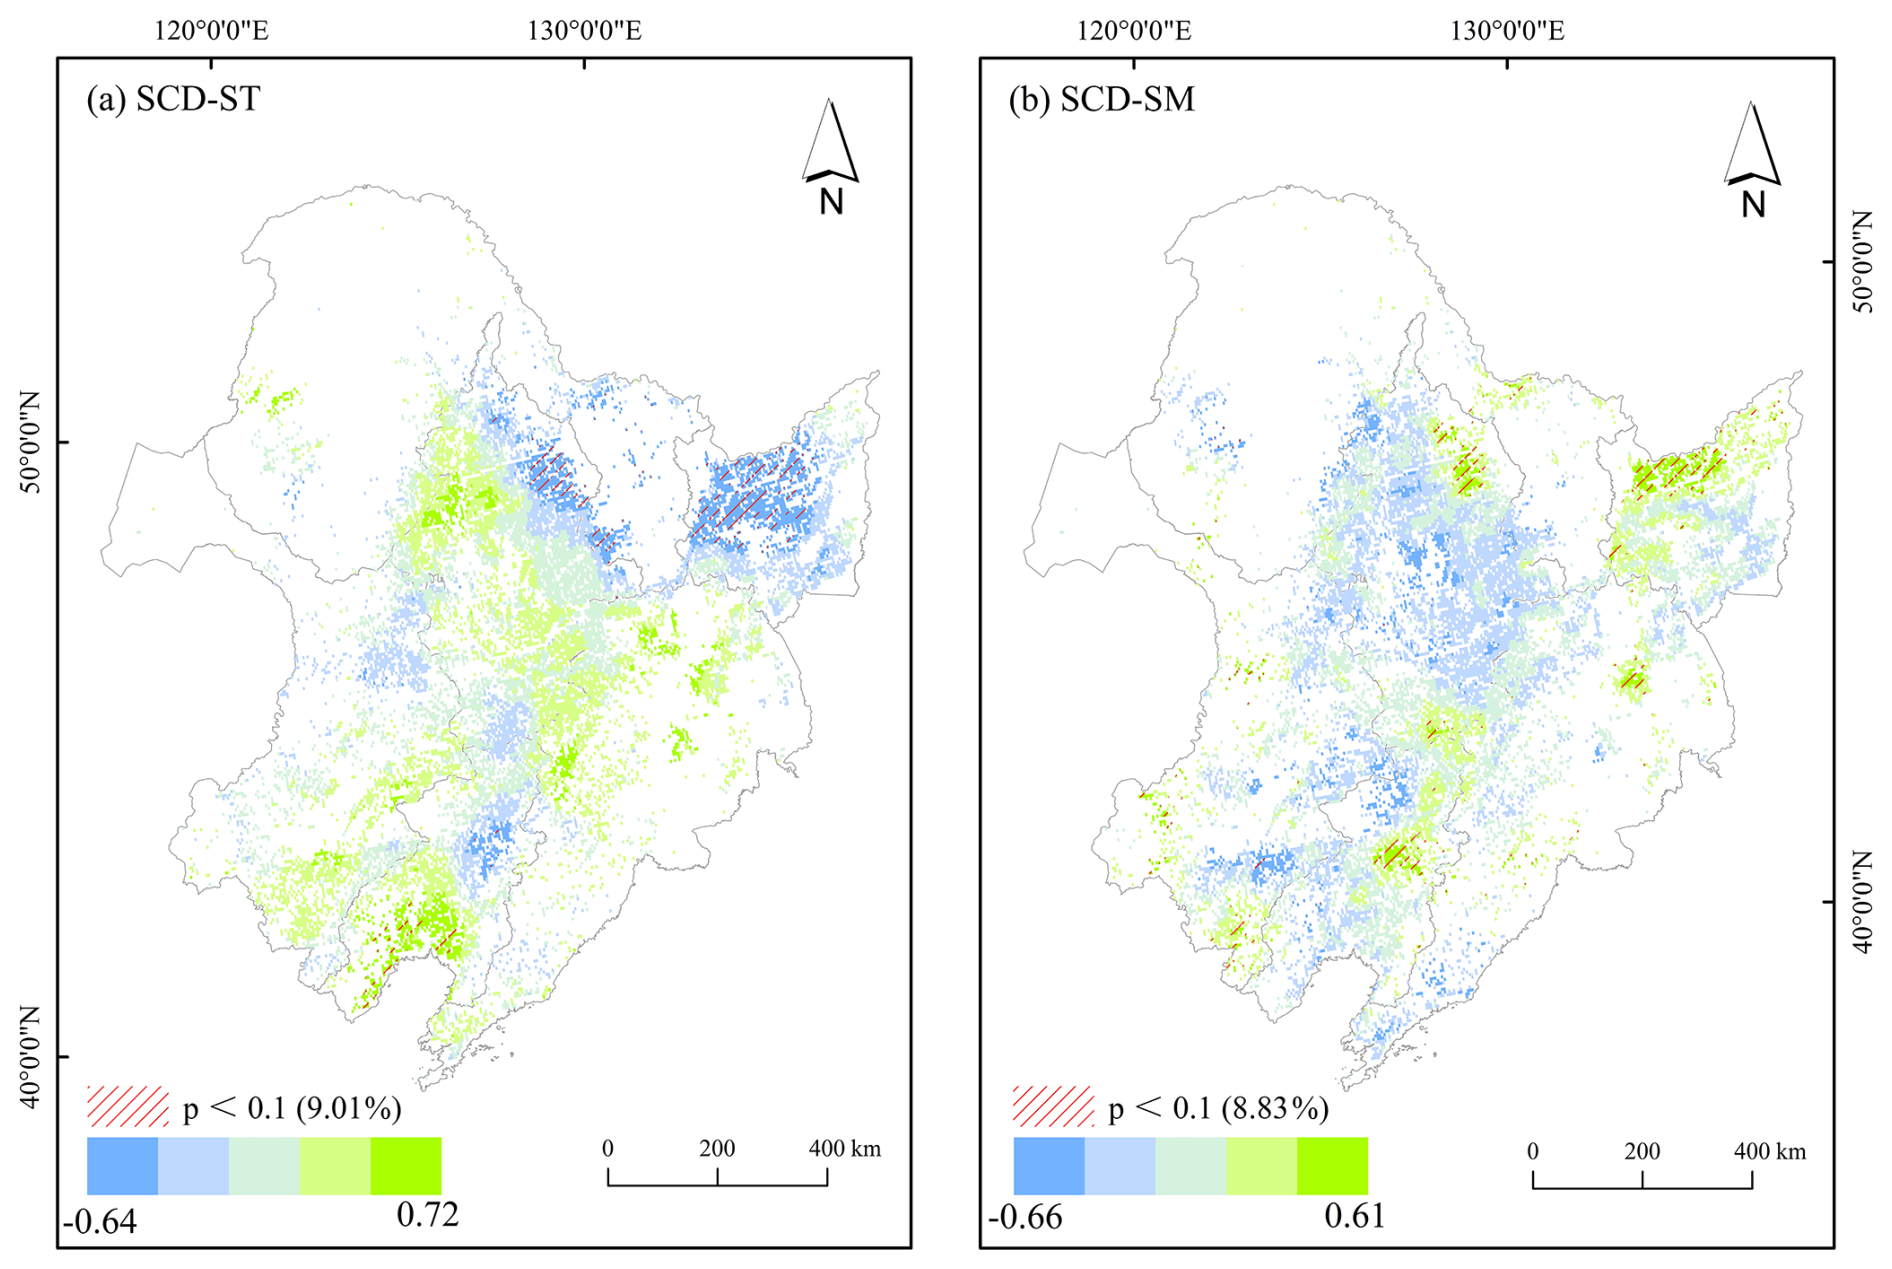
Figure 6The correlation coefficients between SCD and soil properties: (a) soil temperature; (b) soil moisture. Blue and green pixels represent negative and positive correlations, respectively. The shaded regions denote pixels that were significant at the 90 % confidence level.
Figure 7 illustrates the spatial distribution of correlation coefficients between winter SCED and soil parameters of the subsequent year. Figure 7a shows that the correlation coefficient between SCED and SM ranges from −0.64 to 0.72. The areas with negative correlations accounted for approximately 62.97 % of the total cultivated land, indicating a primarily negative impact of SCED on ST. The areas with significant negative correlations are mainly concentrated in the Songnen Plain and Sanjiang Plain. A small number of areas with positive correlations were primarily found in the northern part of Changbai Mountain and the Western Sand Area. According to Fig. 7b, the correlation coefficient between SCED and SM ranges from −0.66 to 0.61. Areas with positive correlations accounted for approximately 70.45 % of the total cultivated land, indicating a mainly positive impact of SCED on the subsequent year's SM. The pixels with negative SCED effects on SM were primarily concentrated in the Sanjiang, Songnen, and Liaohe Plains.
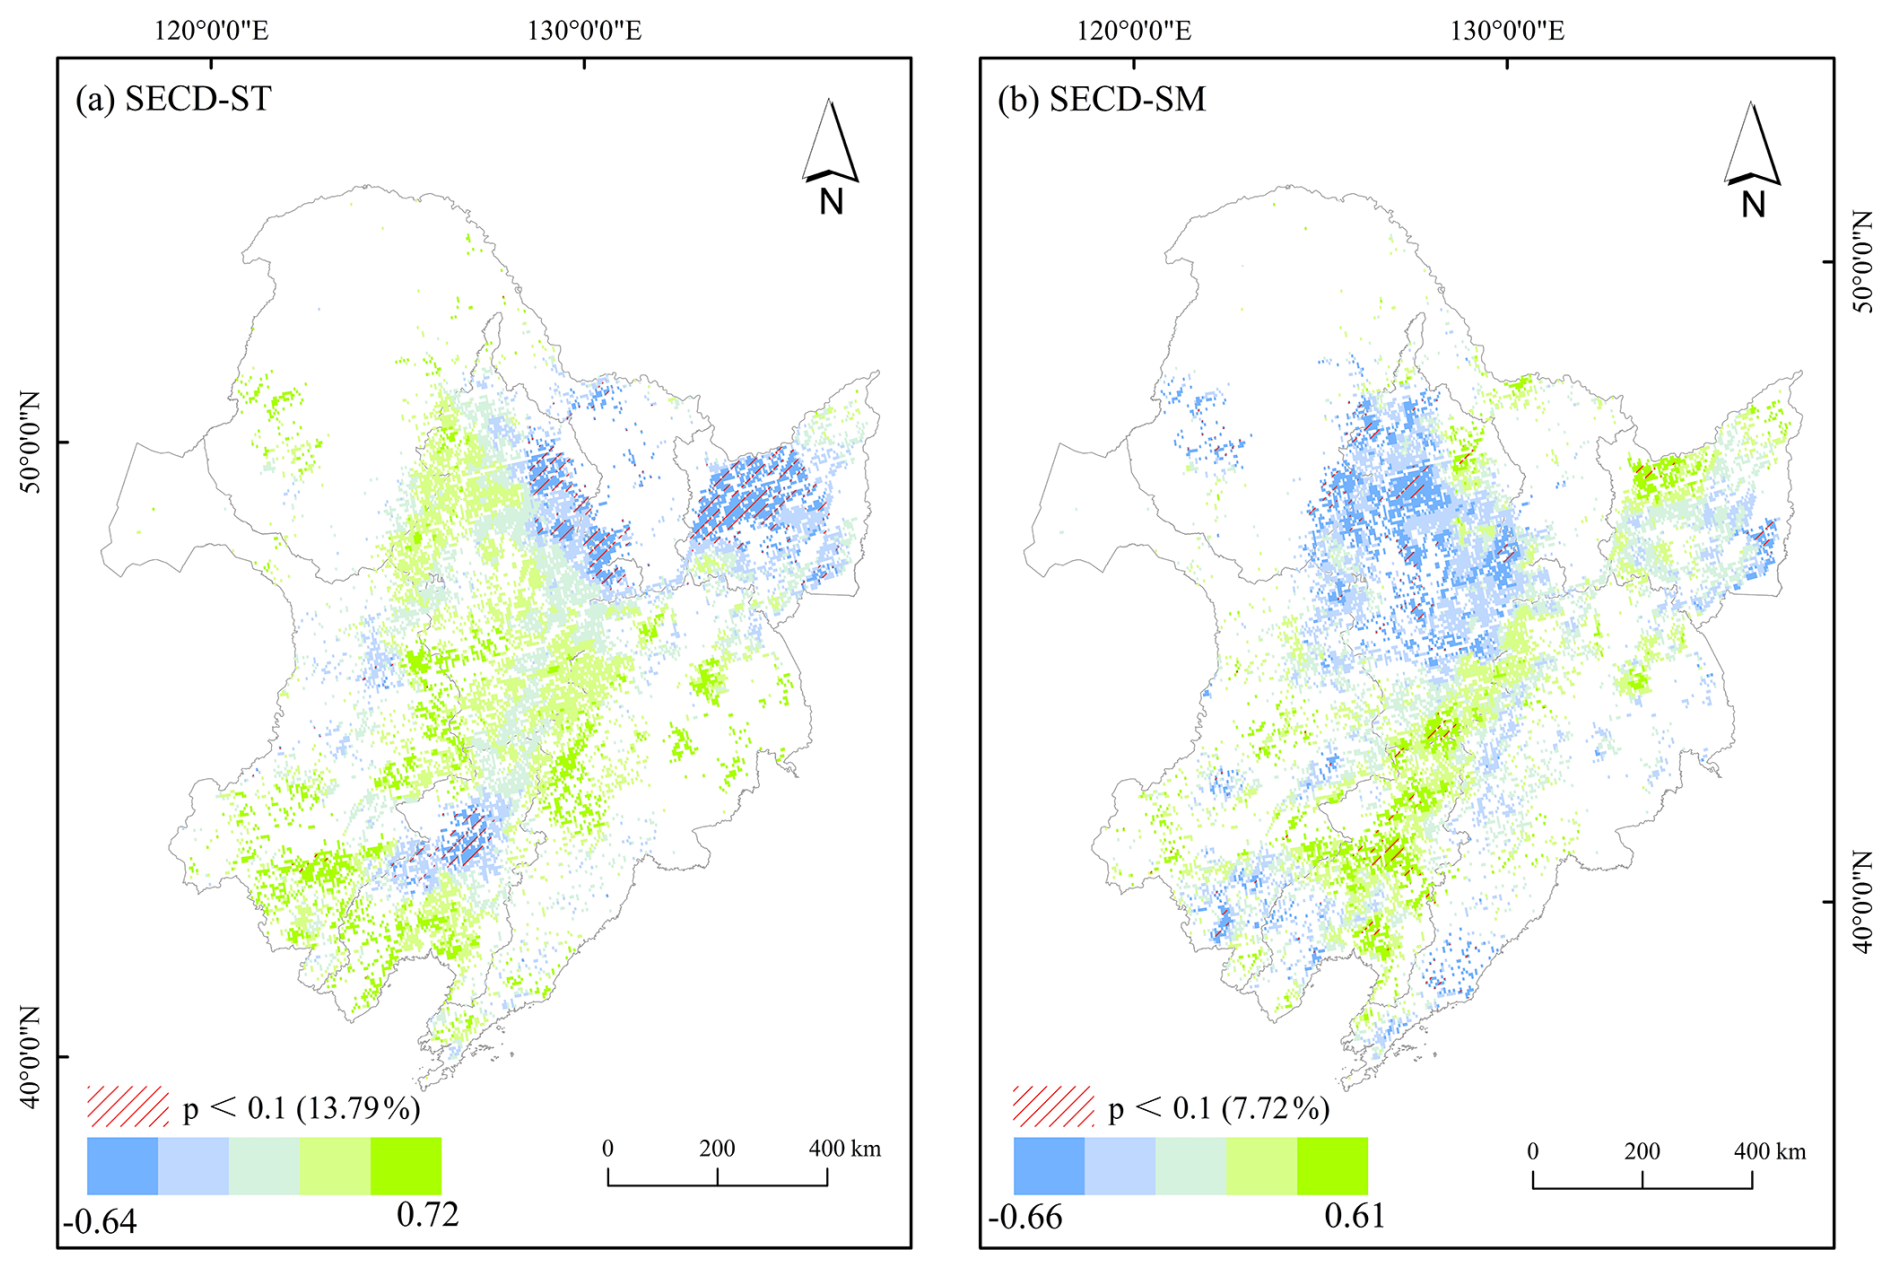
Figure 7Spatial pattern distribution results of the relationship between SCED and soil properties: (a) soil temperature; (b) soil moisture. Blue and green pixels represent negative and positive correlations, respectively. The shaded regions denote pixels that were significant at the 90 % confidence level.
3.3 The influence of Snow Cover on GPP
Figure 8 displays the spatial distribution of GPP in Northeast China from HY2001 to HY2020, and Table 3 presents the statistical results for GPP across the six sub-regions. The GPP of cultivated land generally shows a relatively uniform distribution pattern, as shown in Fig. 8a. The Changbai Mountain, Sanjiang Plain, and Xing'an Mountain had relatively high GPP, followed by Songnen Plain and Liaohe Plain, while the Western Sand Area had the lowest GPP during the past 20 years. The interannual variation trends in Fig. 8b indicate that over the past 20 years, 98 % of the cultivated land shows an increasing trend in GPP, with significant GPP growth in 74 % of the areas. Furthermore, the growth rates varied across different regions, with the GPP in the Western Sand Area increasing the fastest at an average of approximately 9.04 g C m−2 per year.
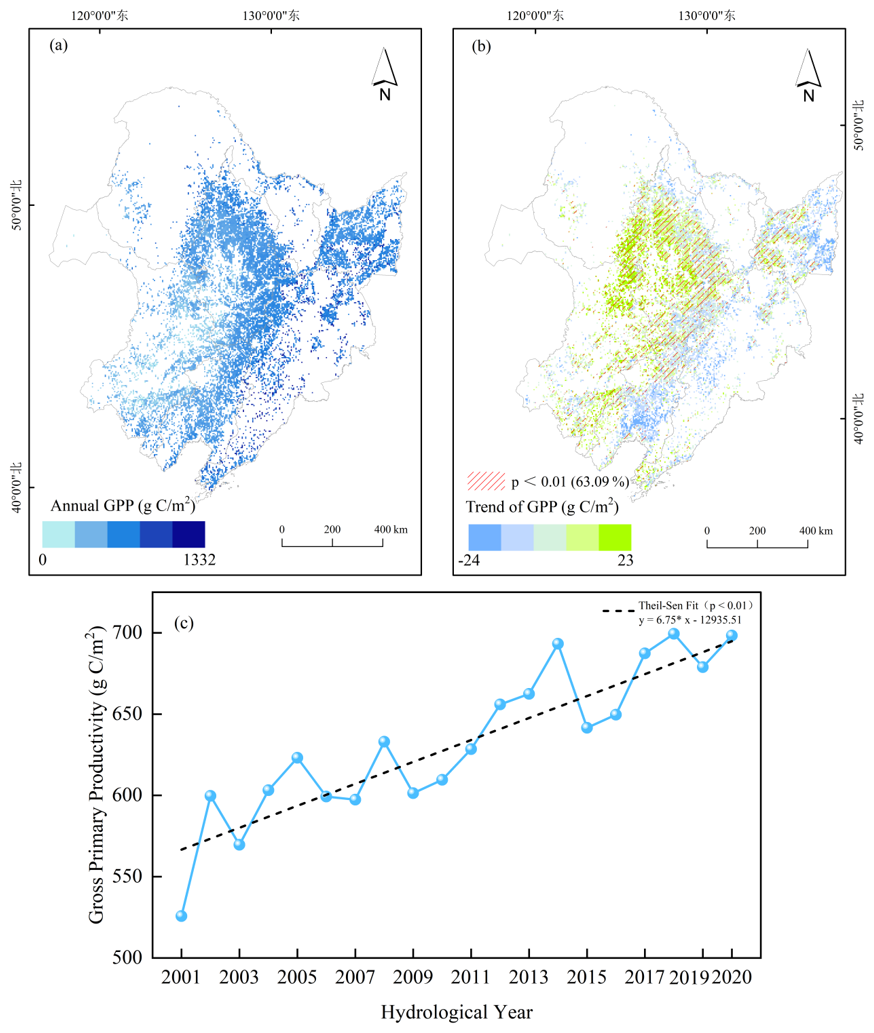
Figure 8The spatial and temporal changes of GPP in Northeast China from HY2001 to HY2020: (a) spatial distribution of mean GPP; (b) changing trend of GPP the green areas represent positive impacts, while the blue areas indicate negative impacts; and the shaded regions denote pixels that were significant at the 90 % confidence level; (c) annual changes of GPP.
Table 3GPP statistics of six geographic regions in Northeast China. Max. and SD represent the maximum value and standard deviation, respectively.
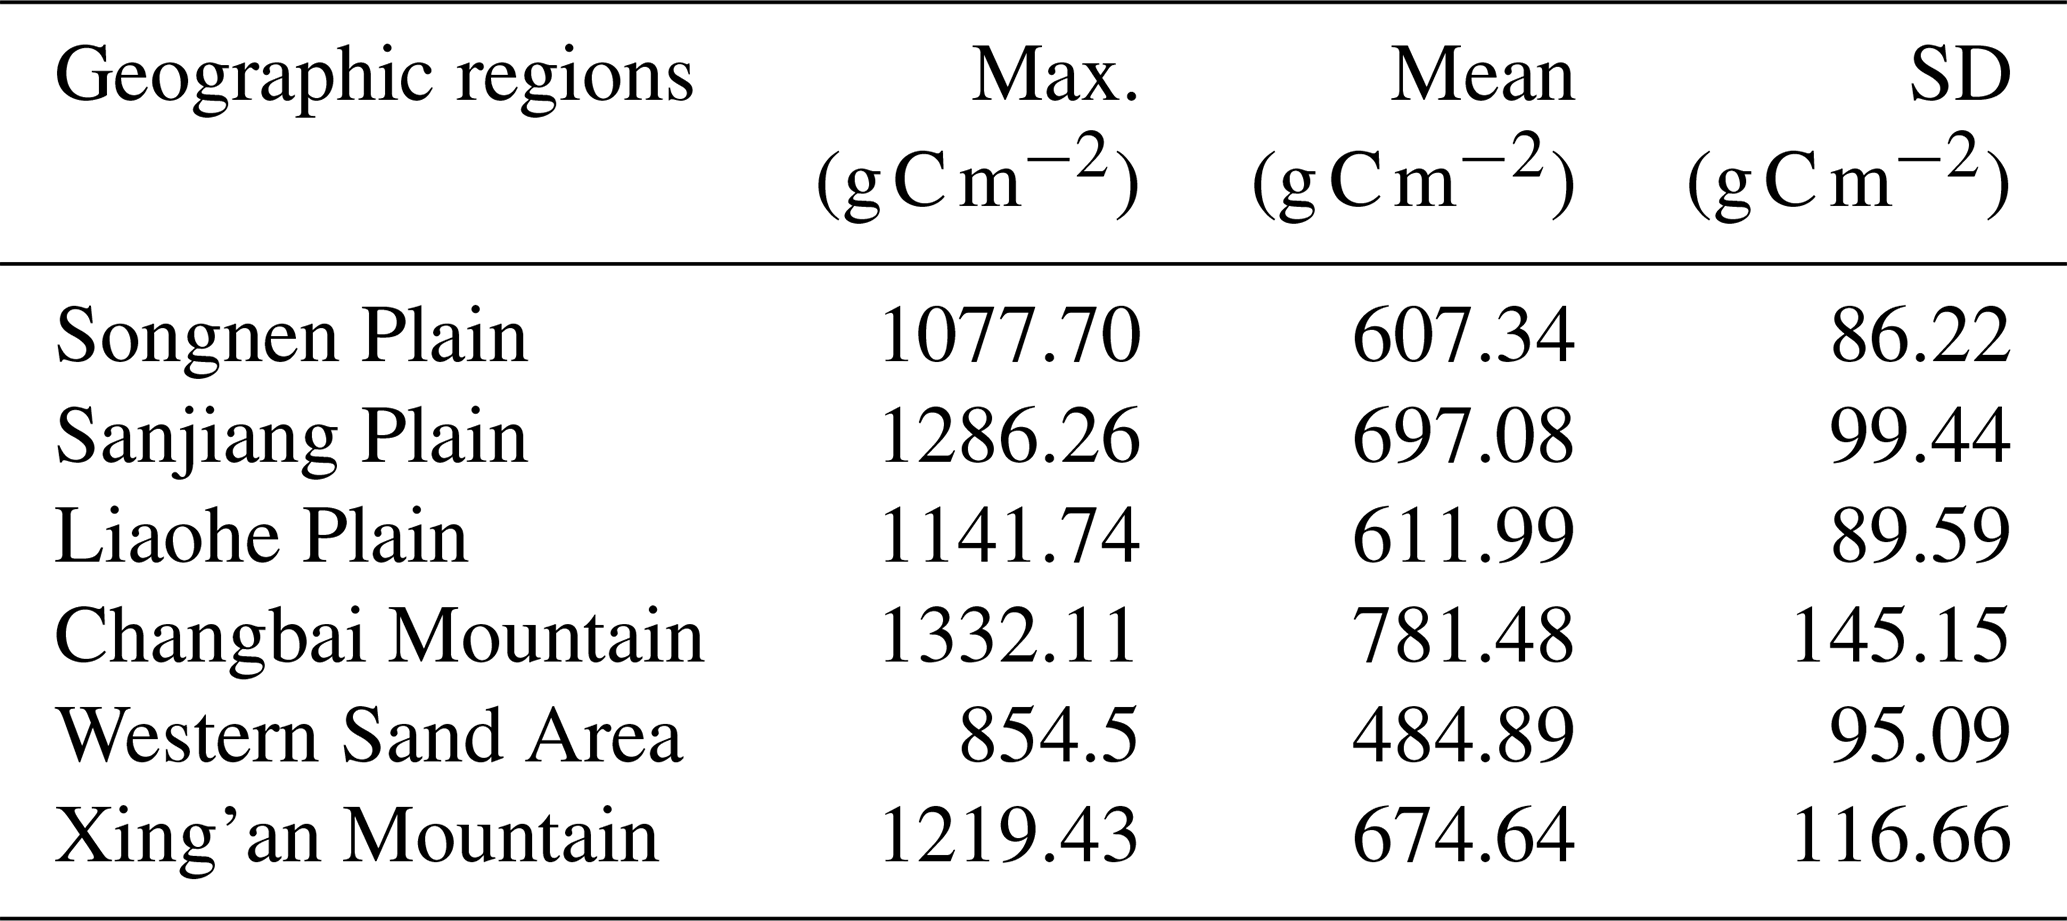
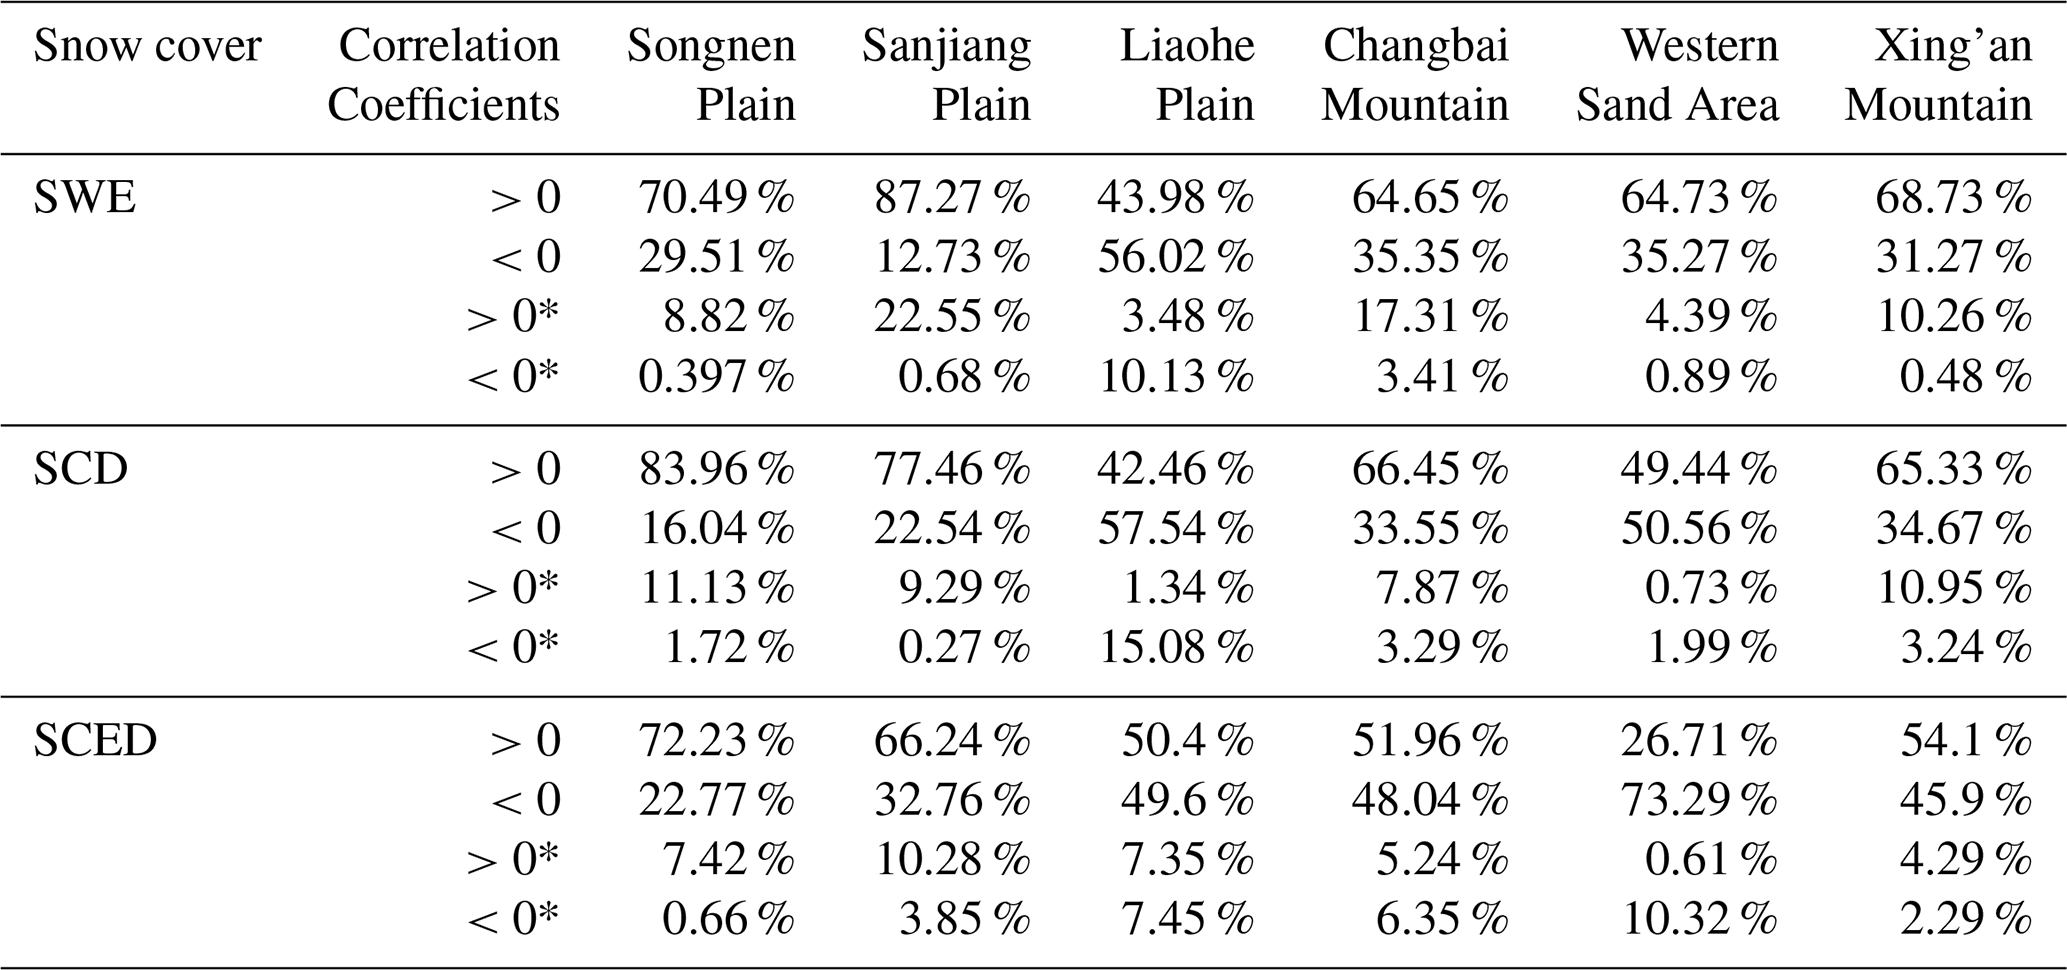
Figure 9 reveals distinct spatial patterns in the partial correlations between snow cover and GPP over cultivated land in Northeast China, and Table 4 lists the corresponding statistical results. The correlation between SWE and GPP was nearly balanced, with 67.01 % of the area showing positive and 32.99 % negative correlations for the whole Northeast China; however, only 13.2 % of the total area passed the significance test (p<0.1). The correlation coefficients ranged widely from −0.77 to 0.83. Significant positive correlations were predominantly located in the northern Sanjiang Plain and the central-western Songnen Plain, where snowmelt likely acts as a critical hydrological subsidy for early crop growth (Li et al., 2025; Pan et al., 2022). In contrast, significant negative correlations clustered in the southern Liaohe Plain, suggesting that excessive SWE may lead to spring soil saturation and root-zone anoxia. For SCD, 67.02 % of the cultivated area exhibited a positive correlation with 11.02 % significant at the 90 % level. And the values ranged from −0.73 to 0.75, showing a clear latitudinal gradient in the Songnen Plain where the protective insulating effect of long-lasting snowpack is most beneficial. A smaller area (32.68 %) showed a non-significant negative correlation. 56.18 % of SCED is negatively correlated with 10.75 % being significant, and reveals that SCED was predominantly positively correlated with GPP, particularly in the Sanjiang and Songnen Plains, indicating that a delayed melt can favorably align water availability with the crop growth calendar (Wang et al., 2024). Collectively, the impact of snow on agricultural productivity is a function of its dual roles as a source of water and as insulation, as well as its potential to cause waterlogging and phenological misalignment.
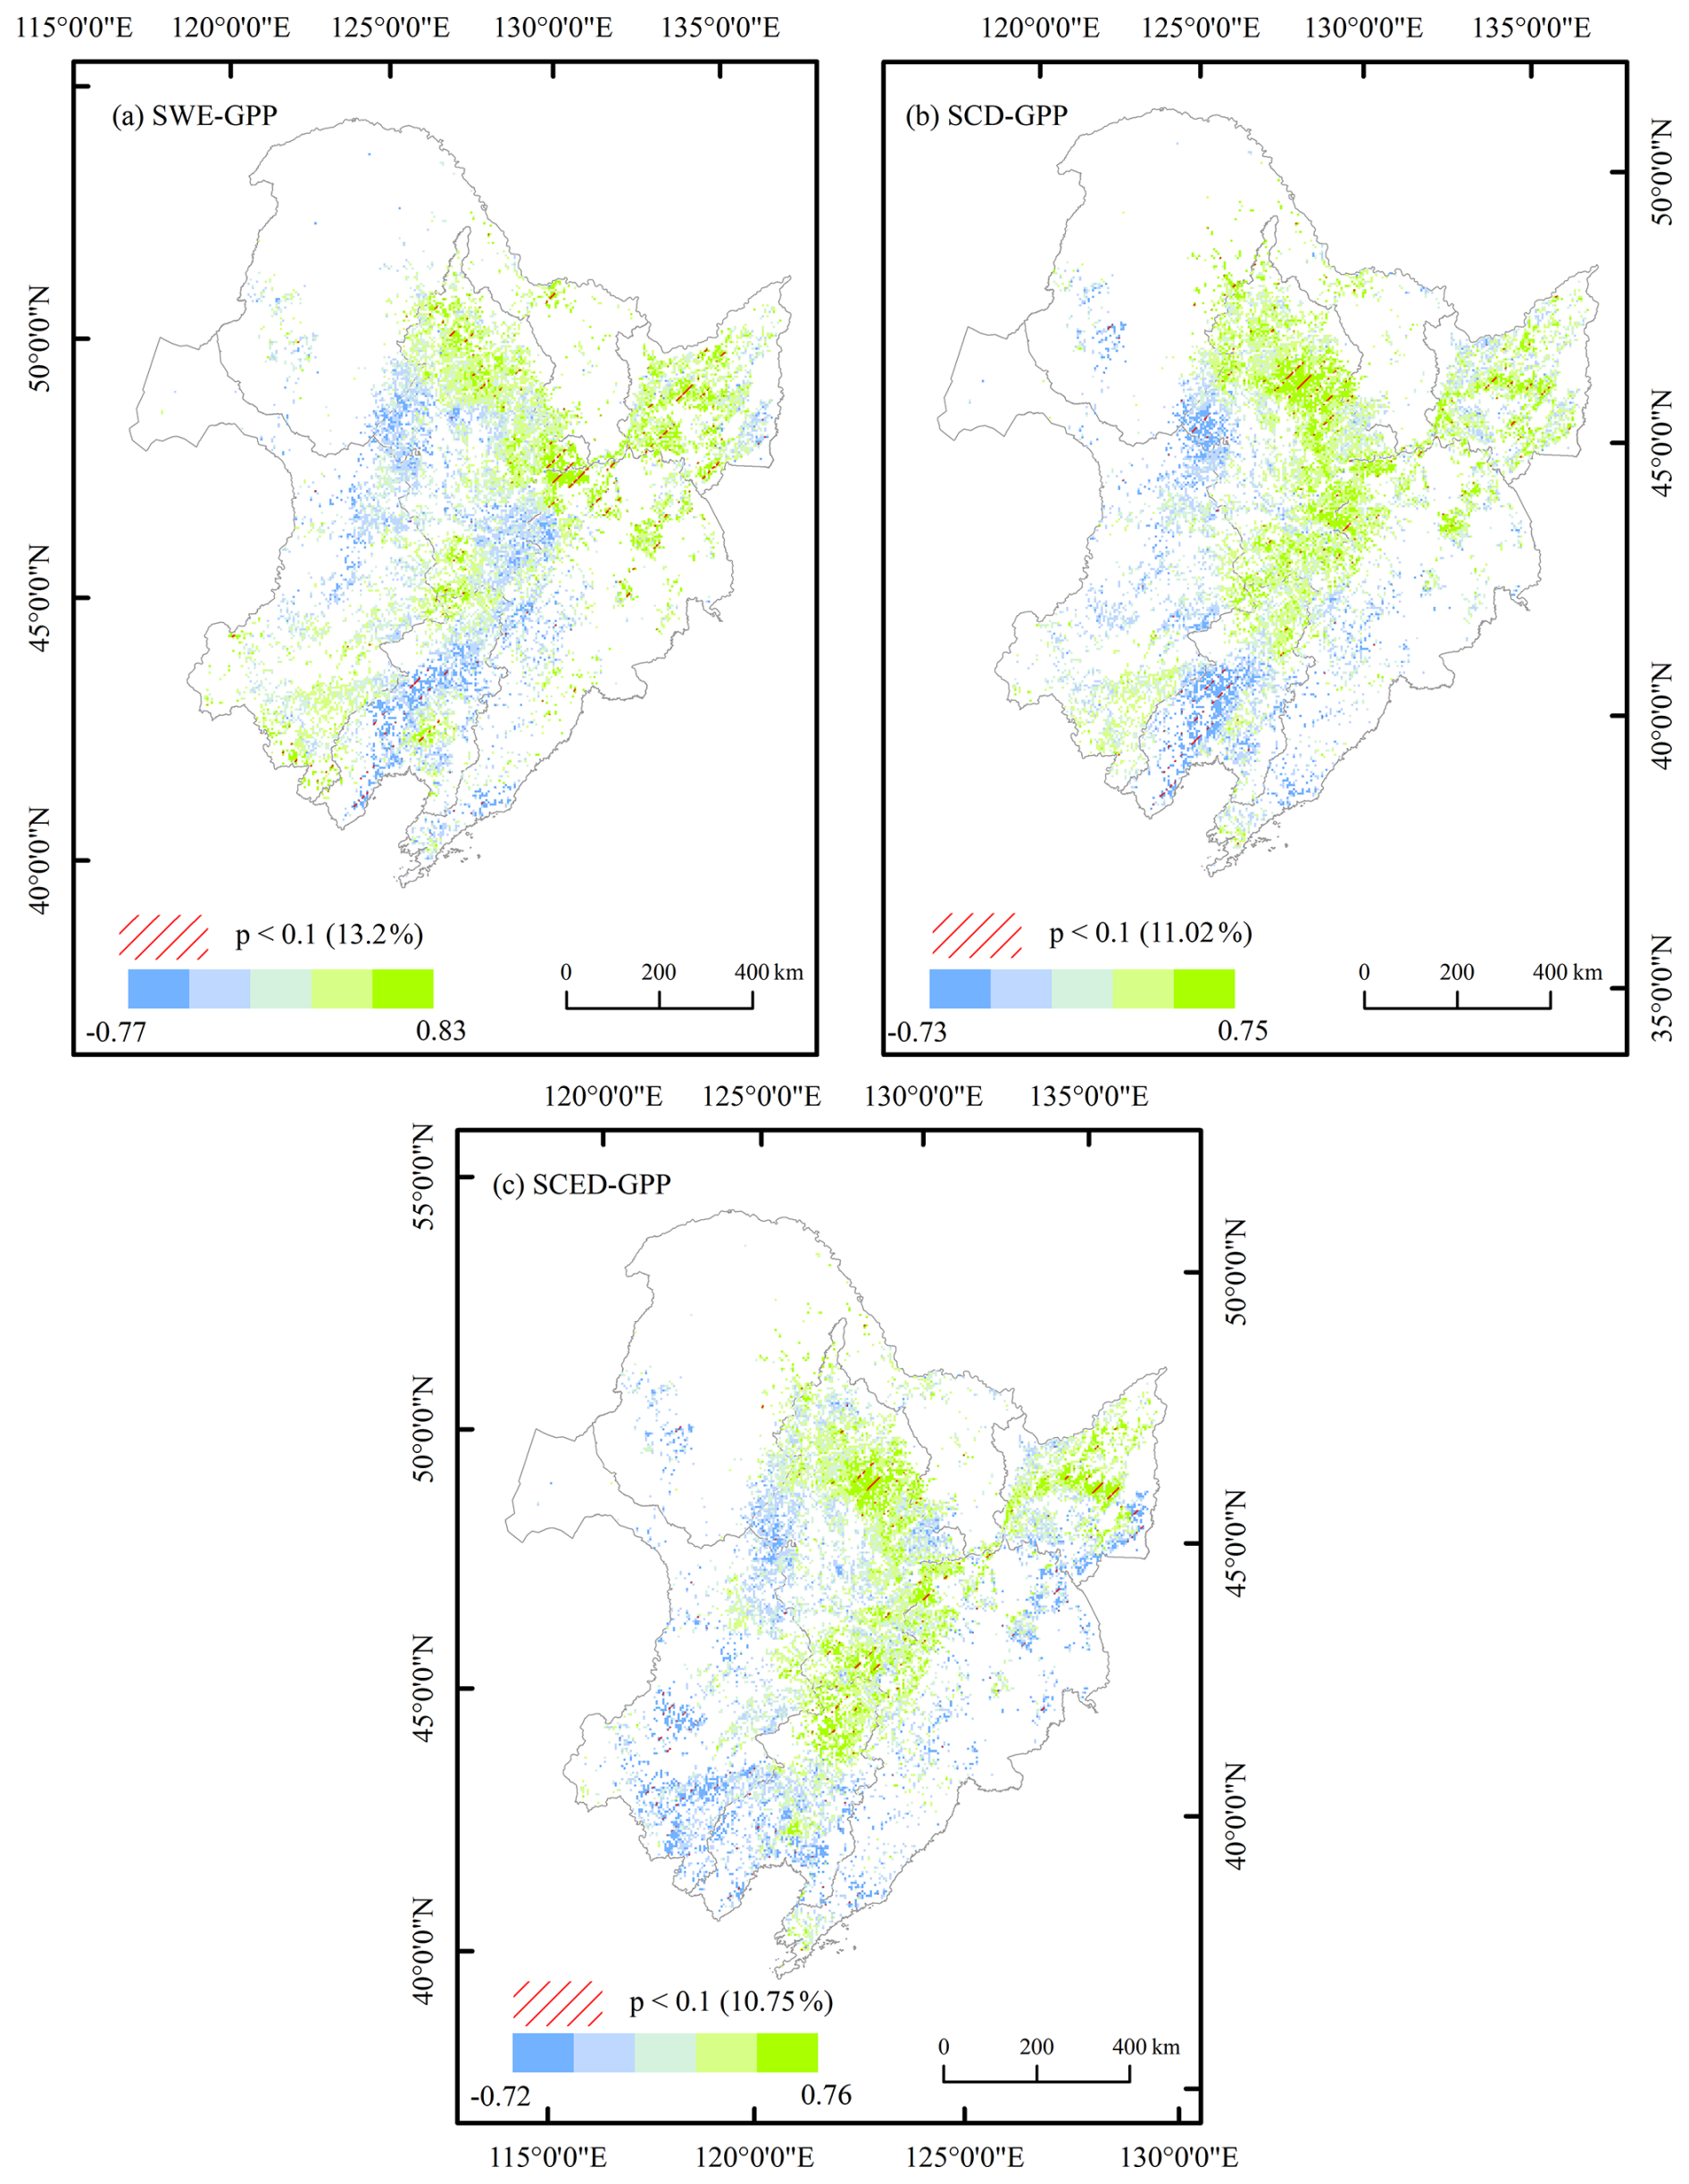
Figure 9Spatial distribution of partial correlation between snow parameters and GPP of cultivated land from HY2001 to HY2020: (a) SWE; (b) SCD; (c) SCED.
Table 4The summary of partial correlation coefficients between snow cover and GPP in the six sub-regions. * indicate significance at the 90 % confidence level.
3.4 Dominant Controls of Snow Cover on Cropland GPP
Figure 10 presents the spatial distribution and area proportions of the relative contributions of different snow cover indicators to GPP of cultivated land in Northeast China. SWE predominantly drove GPP variations in the Western Sand Area and the Liaohe Plain, accounting for approximately 50 % of the GPP changes, significantly higher than the contributions of SCD and SCED. In contrast, SCED emerged as the primary driver in the Changbai Mountains, Sanjiang Plain, and Xing'an Mountains, with contribution rates of 45.19 %, 49.52 %, and 38.63 %, respectively. The Songnen Plain demonstrated a distinct pattern, with SCD dominating within 39.59 % of the total area, substantially higher than SWE (31.29 %) and SCED (29.12 %). This regional analysis elucidated spatial heterogeneity in the relative contributions of snow cover indicators to GPP variations across Northeast China. The findings demonstrated distinct geographical zoning characteristics, providing a theoretical foundation for understanding the differential impacts of snow cover changes on agricultural productivity across regions. SWE exerted greater influence in relatively arid areas, while SCED had a stronger effect in colder regions.
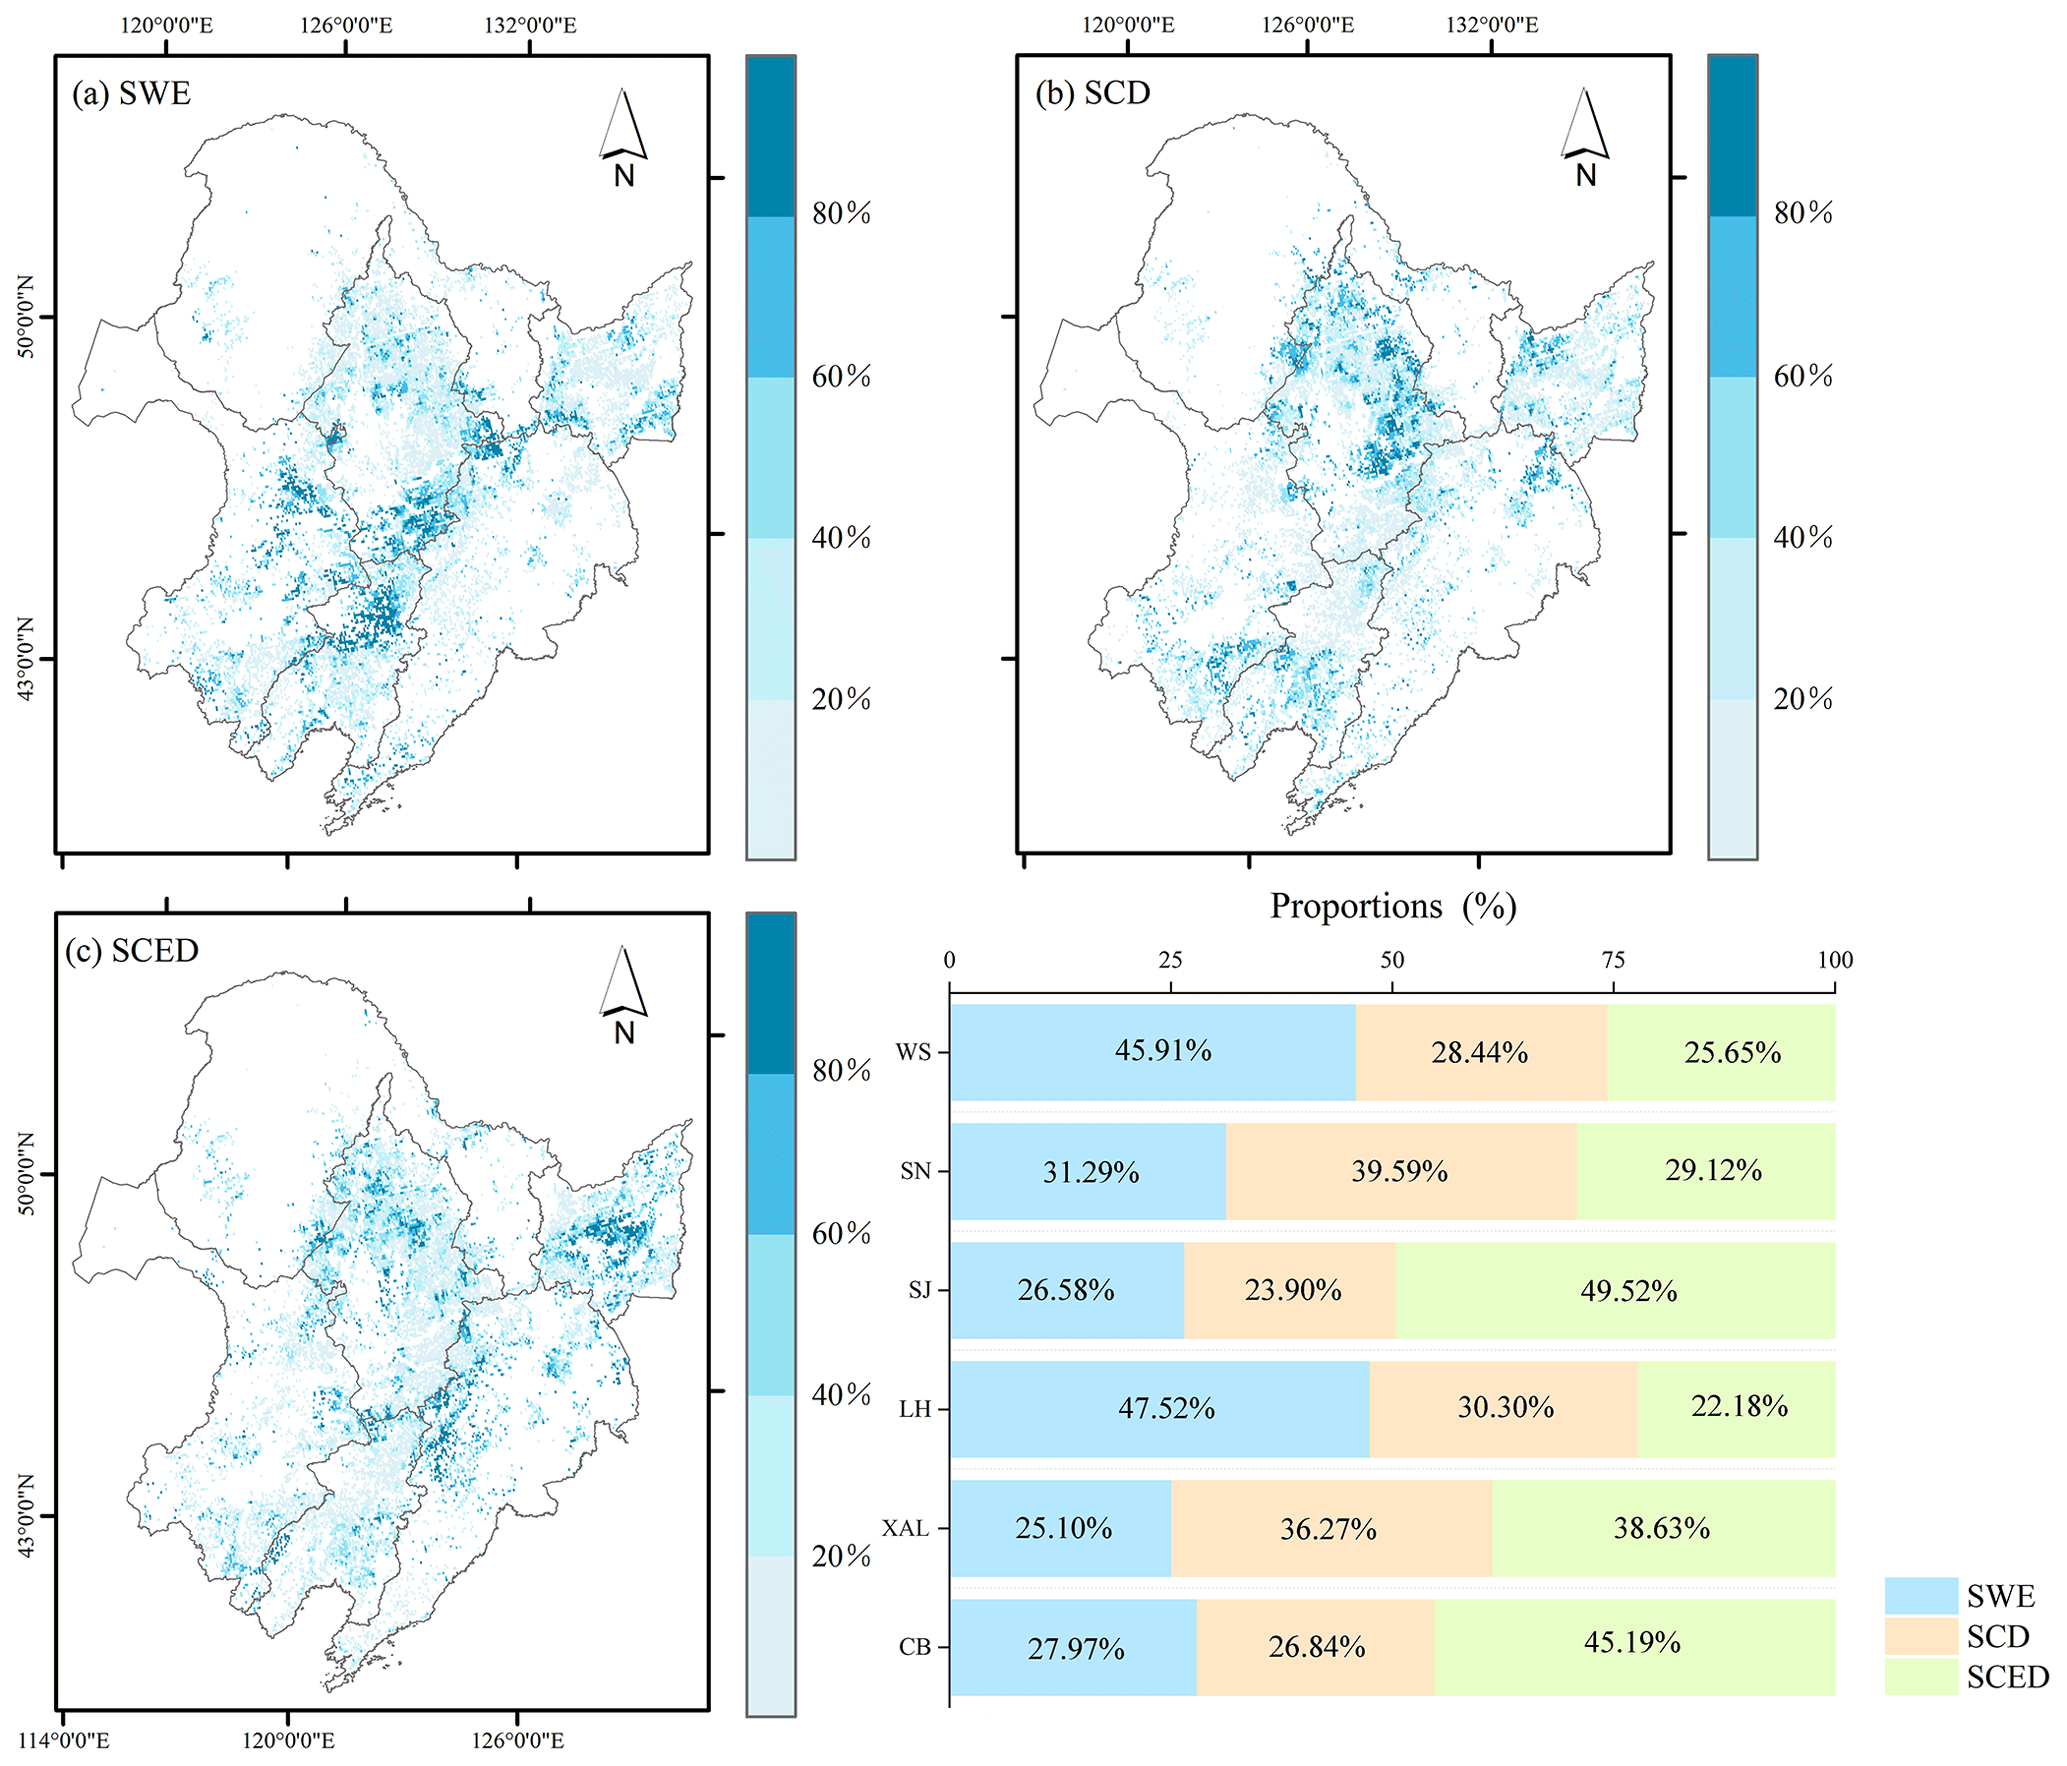
Figure 10Spatial distribution and area percentage of snow-related indicators driving GPP variation of cultivated land in different regions of Northeast China from HY2001 to HY2020.
Notably, SWE dominates GPP variability in moisture-limited areas, like the Western Sand Area and the Liaohe Plain, accounting for ∼50 % of the observed fluctuations. Its contribution was 1.6- to 1.7-fold greater than those of SCD and SCED. These results aligned with hydrological theory positing that SWE is a critical drought-mitigating reservoir in arid ecosystems through delayed meltwater release (Barnett et al., 2005). Conversely, SCED emerged as the principal driver in colder high-latitude areas (Changbai Mountain, Sanjiang Plain, Xing'an Mountain), accounting for 38.63 % to 49.52 % of GPP variation. Such spatial patterns likely reflect SCED's bidirectional effects in regulating growing season onset via albedo modulation and frost protection through insulation effects (Pulliainen et al., 2020). The Songnen Plain exhibited hybrid behavior, with SCD predominance (39.59 %), suggesting intermediate sensitivity to SCD and hydrologic inputs.
3.5 Mechanisms of Snow Cover Impacts on GPP
Figure 11 systematically quantifies the influence of snow cover on GPP across six agroecological regions, revealing pronounced spatial heterogeneity in snow cover-GPP causal networks. The influence of snow cover on GPP is characterized by spatially contrasting effects, ranging from promotion to inhibition across regions. In regions such as the Sanjiang Plain, the Xing'an Mountains, and the Songnen Plain, snow cover demonstrates a promotional effect (β=0.47, 0.29, 0.26). Spring soil moisture is replenished by snowmelt, alleviating water stress during the early growing season in arid areas. In contrast, in the Liaohe Plain, the Western Sandy Area, and the Changbai Mountain region, snow cover shows an inhibitory effect (, −0.16, −0.10). This is primarily attributed to nutrient leaching driven by snowmelt runoff, especially in areas with lighter soil texture or steeper slopes, where runoff leads to the loss of key nutrients such as nitrogen and phosphorus, thereby weakening vegetation productivity.
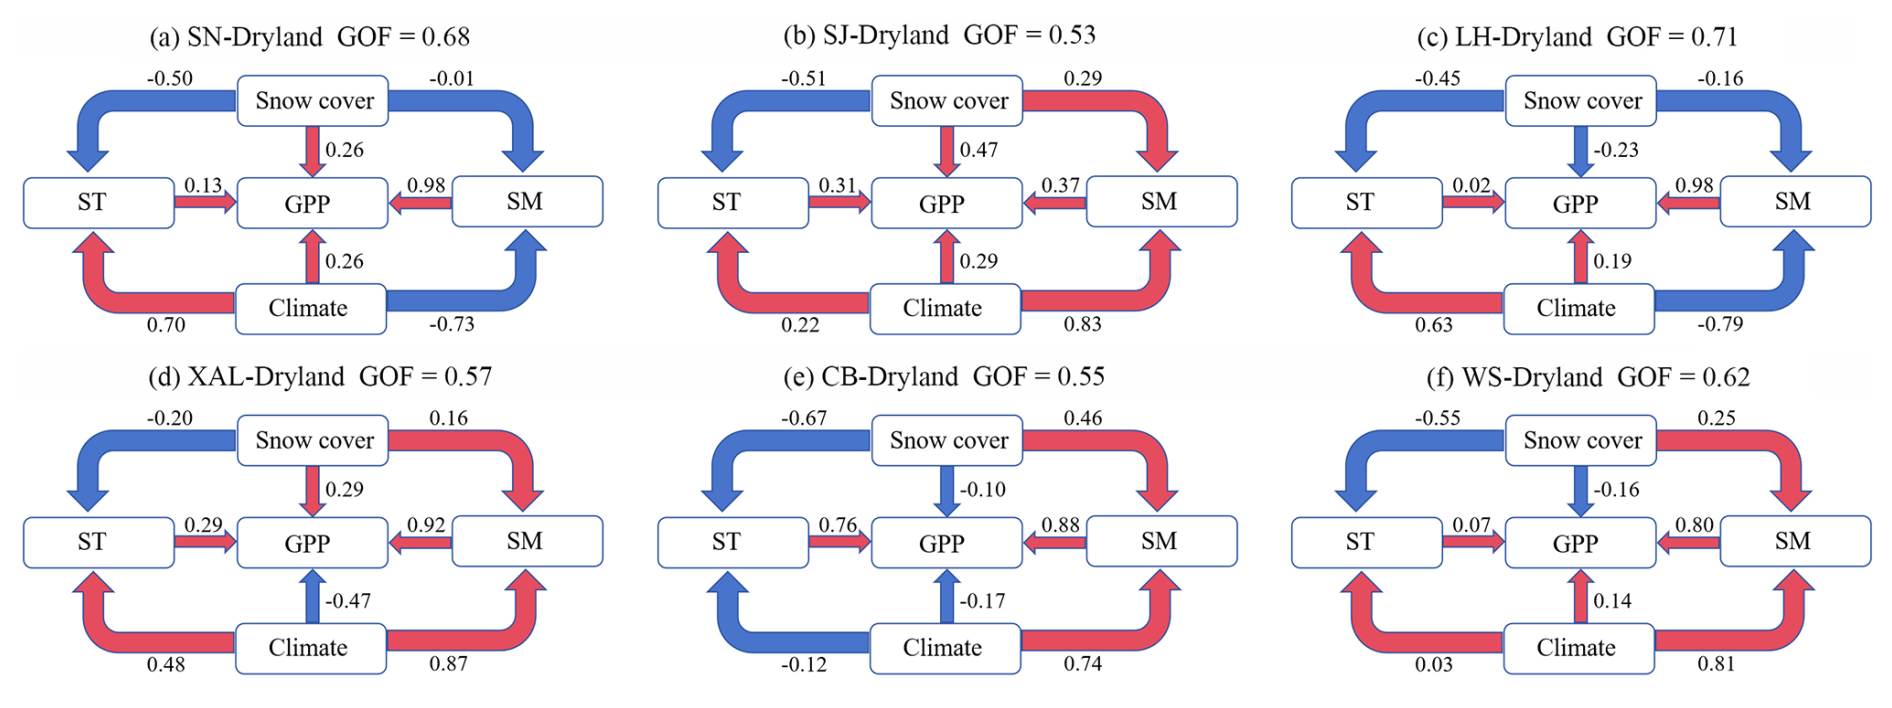
Figure 11The standardized path coefficients between snow cover and GPP via soil properties. The model was validated through goodness-of-fit (GOF), demonstrating acceptable parameter estimation accuracy. Blue arrows denote inhibitory effects, whereas red pathways indicate facilitative relationships. Arrowhead orientation specifies causal pathways from exogenous to endogenous variables. ST and SM stand for soil temperature and soil moisture. SN, SJ, LH, XAL, CB and WS stands for Songnen Plain, Sanjiang Plain, Liaohe Plain, Xing'an Mountains, Changbai Mountains and West Sand Area.
A widespread finding is that snow cover consistently reduces soil temperature (ST) (mean ). This indicates that although snow cover provides an insulating effect during winter, its persistence or melting process in the early growing season significantly lowers soil temperature, delays phenology, and thereby creates a thermal limitation. This pathway is particularly pronounced in the Changbai Mountain ecosystem, where the indirect inhibitory effect of snow cover on GPP, through reduced ST, reaches . This suggests that, in certain regions, thermal limitation may outweigh hydrological effects in determining the ultimate impact of snow cover on productivity.
The relationship between snow cover and SM exhibits complex spatial variation, which, in turn, triggers distinct cascading effects. In the Songnen and Liaohe Plains, snow cover shows a negative correlation with SM ( and −0.16, respectively). Combined with the strong positive effect of SM on GPP (β=0.98), this forms an inhibitory pathway that begins with reduced snow cover, leading to soil moisture deficit, and ultimately results in decreased ecosystem productivity by limiting vegetation growth. In contrast, in other regions such as the Sanjiang Plain (β=0.29), snow cover may replenish SM through meltwater, creating a positive feedback loop. This divergence profoundly reflects the regulatory role of region-specific hydrological mechanisms, such as groundwater levels, soil water retention capacity, and snowmelt timing.
This study aimed to elucidate the spatiotemporal variations in snow cover parameters (SWE, SCD, and SCED) and their heterogeneous impacts on GPP of cultivated land across six subregions in Northeast China, while uncovering the underlying regulatory mechanisms through soil properties. By integrating long-term satellite and reanalysis products with partial correlation analyses and a PLS-SEM framework, we show that snow cover exerts strong but spatially heterogeneous controls on cropland GPP via its effects on spring ST and SM, with distinct response patterns among major agricultural plains. These findings demonstrate that snow is not merely a passive climatic background factor but an active regulator of agricultural carbon uptake in a region that is both snow-dominated and critical for national food security.
4.1 Changes in snow cover and GPP
The principal findings demonstrate a 63 % decrease in SWE across cultivated lands, contrasted by a 54 % increase in SCD and delayed SCED in 61 % of areas, which collectively correlated with significant GPP enhancements in 74 % of regions, underscoring snow cover's pivotal role in modulating agricultural carbon assimilation under climatic shifts. Our results are broadly consistent with recent large-scale assessments showing that snow cover changes exert strong and spatially heterogeneous influences on vegetation productivity across the Northern Hemisphere (Liu et al., 2023; Mudryk et al., 2020). Similar to Liu et al. (2023), we find that both the direction and magnitude of snow–GPP relationships depend on background climate, and that failing to consider lagged hydrothermal pathways can underestimate the true influence of snow on growing-season productivity. However, whereas Liu et al. (2023) emphasized lagged snow effects in natural ecosystems, our study focuses specifically on cultivated land, where management practices and soil manipulation modulate snow–soil–GPP linkages.
Within Northeast China, our findings complement and extend previous analyses that examined snow–vegetation interactions across all underlying surface types. Wang et al. (2024) showed that in this region, increases in SWE tend to favor GPP in dryland and grassland, while snow phenology metrics such as SCED and SCD are more influential in forests. Our results refine this picture by isolating cropland and demonstrating that: (1) SWE dominates GPP variability in moisture-limited cultivated systems; (2) SCD and SCED become critical where cold stress and drainage limitations are prominent; and (3) the relative dominance of these metrics shifts systematically.
4.2 Linkages of snow, soil, and GPP
The spatial patterns of SWE, SCD, and SCED reveal a clear north–south and east–west organization of snow re0gimes over cultivated land. Areas with deeper snowpacks and longer snow duration are concentrated at higher latitudes and elevations, while low-lying southern and coastal croplands experience shallower and shorter-lasting snow. Against this backdrop, our correlation analyses show that snow metrics affect GPP primarily by altering soil hydrothermal conditions, consistent with the notion that vegetation responds to hydrothermal states rather than snow itself (Liu et al., 2023).
In cold, energy-limited subregions, thicker and more persistent snow tends to enhance GPP by moderating winter and early-spring stress. Increased SWE and longer SCD insulate the soil, maintaining higher near-surface temperatures and reducing freeze–thaw damage, which promotes higher early-season GPP through improved root activity and reduced winter mortality (Mudryk et al., 2020; Liu et al., 2023). In these areas, our PLS-SEM results indicate that the dominant pathway from snow to GPP is temperature-driven: SWE and SCD warm the soil profile, advance favorable thermal conditions for crop emergence, and indirectly raise GPP by shortening the period of severe cold stress.
By contrast, in relatively warm but moisture-limited croplands, SWE emerges as the primary control on interannual GPP variability. Here, snow acts as a critical seasonal water reservoir. Higher SWE increases spring soil moisture, alleviating early-season water stress and supporting more vigorous canopy development, consistent with prior work highlighting the role of snow-derived water in spring soil moisture and subsequent crop performance in Northeast China (Li et al., 2022; Wang et al., 2024). In these zones, the structural paths in the PLS-SEM are dominated by SWE, soil moisture, and GPP, underscoring a moisture-mediated mechanism akin to the broader link between water availability and global GPP.
4.3 Limitations and projections
Several limitations should be acknowledged when interpreting these findings. First, despite using recent high-quality products, uncertainties remain in the underlying datasets. The SWE fields used here, although tailored for China (Jiang et al., 2022), are derived from passive microwave retrievals and data assimilation, which can underestimate SWE in complex terrain and under deep, dense snow (Mihalevich et al., 2022). Similarly, ERA5-Land ST and SM, while widely validated (Muñoz-Sabater et al., 2021), inevitably smooth sub-grid heterogeneity associated with microtopography, tillage practices, and irrigation. MODIS GPP products also carry known uncertainties in cropland, especially under mixed-pixel conditions and heterogeneous management. These uncertainties are unlikely to overturn the main regional patterns identified here. Still, they could affect estimates of effect magnitude, particularly in transition zones where snow–GPP relationships are weak or mixed. Additionally, the spatial and temporal resolution of our analysis limits generalizability. Aggregating to moderate-resolution grid cells inevitably mixes different soil types, management regimes, and microclimates, which may lead to conservative estimates of snow impacts where fields are strongly heterogeneous.
Furthermore, our analytical framework is observational and relies on correlation and PLS-SEM to infer dominant pathways rather than process-based simulation. Although PLS-SEM is designed to disentangle direct and indirect effects within complex variable networks, it cannot fully resolve causal mechanisms, and its results depend on the specified model structure and variable selection. For example, we did not explicitly represent snow metamorphism, subsurface runoff, or crop management practices, all of which can modulate how snow-induced hydrothermal changes translate into GPP responses (Bodner et al., 2015). We just discussed the dryland of cultivated land in this paper, and future work will consider the paddy land. Incorporating these factors in future structural models, or coupling our observational analysis with process-based land–surface or crop models, would help test the robustness of the inferred pathways.
In summary, this study demonstrates that multiple dimensions of snow cover jointly structure the soil hydrothermal environment and GPP of cultivated land in Northeast China, with the dominant control shifting from SWE in moisture-limited areas to SCD and SCED in colder or poorly drained regions. This research provides a process-based framework for understanding snow-vegetation coupling in cold-region agroecosystems, moving beyond simple correlative analyses. The novel application of ridge regression to identify the dominant snow indicator for GPP in each subregion offers a powerful tool for regional-scale assessment and prediction. From an application perspective, these findings can directly inform climate-adaptive agricultural management. For example, in the Western Sand Area, practices that enhance snow harvesting and retention could be prioritized to bolster spring soil moisture. In contrast, in the Changbai Mountain, selecting crop varieties with lower base temperatures for growth or developing strategies to accelerate snowmelt (where feasible) could mitigate the negative impacts of a delayed SCED.
This study used multi-source remote sensing data to clarify how snow cover dynamics regulate cultivated land GPP in Northeast China from HY2001 to HY2020. By jointly analyzing SWE, SCD, SCED, and GPP, we revealed pronounced regional heterogeneity in snow cover–crop interactions: snow cover reductions in the Liaohe Plain and Western Sand Area contrasted with prolonged snow duration and delayed melt in the Songnen and Sanjiang Plains, where GPP increased most strongly.
By controlling for temperature, precipitation, and radiation, we isolated the intrinsic snow–GPP relationships for different cropping systems. SCD was identified as the dominant snow metric for dryland GPP. Ridge regression further showed that SWE primarily regulates GPP in the Western Sand Area and Liaohe Plain, while SCD dominates in the Songnen and Sanjiang Plains, and SCED is most important in the Changbai Mountain and Xing'an Mountain.
Finally, the PLS-SEM framework quantified both the direct effects of snow cover indicators on GPP and their indirect effects via SM and ST, elucidating the snow-soil–vegetation coupling mechanism in cold-region agroecosystems. Snow cover generally exerts a negative impact on gross primary productivity through its thermal influence. In the Liaohe and Songnen Plains, snow cover indirectly suppresses cropland GPP through its water-mediated effects. In the Sanjiang Plain, Xing'an Mountains, Changbai Mountain, and Western Sandy Area, snow cover indirectly increases cropland GPP through its water-mediated effects.
Future work should integrate field experiments and higher-resolution data on crop types and management practices to disentangle these complex interactions and validate the proposed mechanisms at a finer scale.
The data is available on request.
Conceptualization, Yang, Q. and Liu, H.; Data curation, Hao, X. H.; Methodology, Cui M.; validation, Li, L. and Yang, Q.; Formal analysis, Li, L., Hao, X. H.; Investigation, Peng, Y.; Writing – original draft preparation, Li, L.; Writing – review and editing, Yang, Q., and Liu, H.; Funding acquisition, Yang, Q. All authors have read and agreed to the published version of the manuscript.
The contact author has declared that none of the authors has any competing interests.
Publisher's note: Copernicus Publications remains neutral with regard to jurisdictional claims made in the text, published maps, institutional affiliations, or any other geographical representation in this paper. While Copernicus Publications makes every effort to include appropriate place names, the final responsibility lies with the authors. Views expressed in the text are those of the authors and do not necessarily reflect the views of the publisher.
This research is an output of Cropland Degradation Monitoring. The anonymous reviewers to improve the quality of this manuscript are greatly appreciated. The efforts of Mr. Wendi Luo are also appreciated for responding to the comments.
This research was jointly supported by the National Key Research and Development Program of China (grant no. 2024YFD1500602-4) and the National Natural Science Foundation of China (grant no. 42201435).
This paper was edited by Alexandre Langlois and reviewed by two anonymous referees.
Abebe, S. A., Qin, T., Zhang, X., and Yan, D.: Wavelet transform-based trend analysis of streamflow and precipitation in Upper Blue Nile River basin, Journal of Hydrology, Regional Studies, 44, https://doi.org/10.1016/j.ejrh.2022.101251, 2022.
Barnett, T. P., Adam, J. C., and Lettenmaier, D. P.: Potential impacts of a warming climate on water availability in snow-dominated regions, Nature, 438, 303–309, https://doi.org/10.1038/nature04141, 2005.
Beer, C., Reichstein, M., Tomelleri, E., Ciais, P., Jung, M., Carvalhais, N., Rödenbeck, C., Arain, M. A., Baldocchi, D., Bonan, G. B., Bondeau, A., Cescatti, A., Lasslop, G., Lindroth, A., Lomas, M., Luyssaert, S., Margolis, H., Oleson, K. W., Roupsard, O., Veenendaal, E., Viovy, N., Williams, C., Woodward, F. I., and Papale, D.: Terrestrial gross carbon dioxide uptake: global distribution and covariati on with climate, Science, 329, 834–838, https://doi.org/10.1126/science.1184984, 2010.
Blankinship, J. C. and Hart, S. C.: Consequences of manipulated snow cover on soil gaseous emission and N retention in the growing season: a meta-analysis, Ecosphere, 3, 1–20, 2012.
Bodner, G., Nakhforoosh, A., Kaul, H.-P. 0: Management of crop water under drought: a review, Agronomy for Sustainable Development, 35, 401–442, 2015.
Brooks, P. D., Grogan, P., Templer, P. H., Groffman, P., Öquist, M. G., and Schimel, J.: Carbon and nitrogen cycling in snow-covered environments, Geography Compass, 5, 682–699, 2011.
Chen, S., Huang, Y., and Wang, G.: Response of vegetation carbon uptake to snow-induced phenological and physiological changes across temperate China, Science of the Total Environment, 692, 188–200, 2019.
Endsley, K. A., Zhao, M., Kimball, J. S., and Devadiga, S.: Continuity of Global MODIS Terrestrial Primary Productivity Estimates in the VIIRS Era Using Model-Data Fusion, Journal of Geophysical Research, Biogeosciences, 128, https://doi.org/10.1029/2023JG007457, 2023.
Gonzalez, R.: Applied Multivariate Statistics for the Social Sciences, The American Statistician, 57, 68–69, https://doi.org/10.1198/tas.2003.s213, 2003
Hair, J. F., Risher, J. J., Sarstedt, M., and Ringle, C. M.: When to use and how to report the results of PLS-SEM, European Business Review, 31, 2–24, 2019.
Jiang, L., Yang, J., Zhang, C., Wu, S., Li, Z., Dai, L., Li, X., and Qiu, Y.: Daily snow water equivalent product with SMMR, SSM/I and SSMIS from 1980 to 2020 over China, Big Earth Data, 6, 420–434, 2022.
Kashyap, R. and Kuttippurath, J.: Warming-induced soil moisture stress threatens food security in India, Environmental Science and Pollution Research, 31, 59202–59218, 2024.
Kendall, M. G.: Rank Correlation Methods, 1st edn., Charles Griffin & Company, London, 160 pp., 1948.
Knowles, J. F., Lestak, L. R., and Molotch, N. P.: On the use of a snow aridity index to predict remotely sensed forest productivity in the presence of bark beetle disturbance, Water Resources Research, 53, 4891–4906, 2017.
Li, D., Ouyang, W., Wang, L., Chen, J., Zhang, H., Sharkhuu, A., Tseren-Ochir, S.-E., and Yang, Y.: Revisiting snowmelt dynamics and its impact on soil moisture and vegetation in mid-high latitude watershed over four decades, Agric. Forest Meteorol., 362, https://doi.org/10.1016/j.agrformet.2024.110353, 2025.
Li, W., Perera, S., Linstead, E., Thomas, R., El-Askary, H., Piechota, T., and Struppa, D.: Investigating decadal changes of multiple hydrological products and land-cover changes in the Mediterranean Region for 2009–2018, Earth Systems and Environment, 5, 285–302, 2021.
Li, Y., Liu, D., Li, T., Fu, Q., Liu, D., Hou, R., Meng, F., Li, M., and Li, Q.: Responses of spring soil moisture of different land use types to snow cover in Northeast China under climate change background, Journal of Hydrology, 608, https://doi.org/10.1016/j.jhydrol.2022.127610, 2022.
Liu, H., Xiao, P., Zhang, X., Chen, S., Wang, Y.,Wang, W.: Winter snow cover influences growing-season vegetation productivity non-uniformly in the Northern Hemisphere, Communications Earth and Environment, 4, 487, https://doi.org/10.1038/s43247-023-01167-9, 2023.
Luo, Z., Feng, W., Luo, Y., Baldock, J., and Wang, E.: Soil organic carbon dynamics jointly controlled by climate, carbon inputs, soil properties and soil carbon fractions, Global Change Biology, 23, 4430–4439, 2017.
Mann, H. B.: Nonparametric tests against trend, Econometrica: Journal of the econometric society, 13, 245–259, 1945.
McNally, A.: FLDAS noah land surface model L4 global monthly 0.1×0.1° (MERRA-2 and CHIRPS), Atmos. Compos, Water Energy Cycles Clim, Var, 2018.
Meredith, M., Sommerkorn, M., Cassotta, S., Derksen, C., Ekaykin, A., Hollowed, A., Kofinas, G., Mackintosh, A., Melbourne-Thomas, J., Muelbert, M. M. C., Ottersen, G., Pritchard, H., and Schuur, E. A. G.: Polar Regions, in: IPCC Special Report on the Ocean and Cryosphere in a Changing Climate, edited by: Pörtner, H.-O., Roberts, D. C., Masson-Delmotte, V., Zhai, P., Tignor, M., Poloczanska, E., Mintenbeck, K., Alegría, A., Nicolai, M., Okem, A., Petzold, J., Rama, B., and Weyer, N. M., Cambridge University Press, Cambridge, UK, and New York, NY, USA, 203–320, https://doi.org/10.1017/9781009157964.005, 2019.
Mihalevich, B. A., Neilson, B. T., and Buahin, C. A.: Evaluation of the ERA5-land reanalysis data set for process-based river temperature modeling over data sparse and topographically complex regions, Water Resources Research, 58, https://doi.org/10.1029/2021WR031294, 2022.
Mudryk, L., Santolaria-Otín, M., Krinner, G., Ménégoz, M., Derksen, C., Brutel-Vuilmet, C., Brady, M., and Essery, R.: Historical Northern Hemisphere snow cover trends and projected changes in the CMIP6 multi-model ensemble, The Cryosphere, 14, 2495–2514, https://doi.org/10.5194/tc-14-2495-2020, 2020.
Muñoz-Sabater, J., Dutra, E., Agustí-Panareda, A., Albergel, C., Arduini, G., Balsamo, G., Boussetta, S., Choulga, M., Harrigan, S., Hersbach, H., Martens, B., Miralles, D. G., Piles, M., Rodríguez-Fernández, N. J., Zsoter, E., Buontempo, C., and Thépaut, J.-N.: ERA5-Land: a state-of-the-art global reanalysis dataset for land applications, Earth Syst. Sci. Data, 13, 4349–4383, https://doi.org/10.5194/essd-13-4349-2021, 2021.
Pan, M., Zhao, F., Ma, J., Zhang, L., Qu, J., Xu, L., and Li, Y.: Effect of snow cover on spring soil moisture content in key agricultural areas of Northeast China, Sustainability, 14, https://doi.org/10.3390/su14031527, 2022.
Peng, S.: 1 km monthly mean temperature dataset for china (1901–2022), National Tibetan Plateau Data Center: Beijing, China, 2019.
Peng, S.: 1 km monthly precipitation dataset for China (1901–2022), National Tibetan Plateau Data Center: Beijing, China, 2020.
Peng, S., Piao, S., Ciais, P., Fang, J., and Wang, X.: Change in winter snow depth and its impacts on vegetation in China, Global Change Biology, 16, 3004–3013, 2010.
Pulliainen, J., Aurela, M., Laurila, T., Aalto, T., Takala, M., Salminen, M., Kulmala, M., Barr, A., Heimann, M., Lindroth, A., Laaksonen, A., Derksen, C., Mäkelä, A., Markkanen, T., Lemmetyinen, J., Susiluoto, J., Dengel, S., Mammarella, I., Tuovinen, J., and Vesala, T.: Early snowmelt significantly enhances boreal springtime carbon uptake, Proceedings of the National Academy of Sciences, 114, 11081–11086, 2017.
Pulliainen, J., Luojus, K., Derksen, C., Mudryk, L., Lemmetyinen, J., Salminen, M., Ikonen, J., Takala, M., Cohen, J., Smolander, T., and Norberg, J.: Patterns and trends of Northern Hemisphere snow mass from 1980 to 2018, Nature, 581, 294–298, 2020.
Running, S., Mu, Q., and Zhao, M.: MODIS/Terra Gross Primary Productivity 8-Day L4 Global 500 m SIN Grid V061, no title, 2021.
Sen, P. K.: Estimates of the regression coefficient based on Kendall's tau, Journal of the American statistical association, 63, 1379–1389, 1968.
Sjöström, M., Zhao, M. Archibald, S., Arneth, A., Cappelaere, B., Falk, U., Grandcourt, A. D., Hanan, N., Kergoat, L., Kutsch, W., Merbold, L., Mougin, E., Nickless, A., Nouvellon, Y., Scholes, R. J., Veenendaal, E. M., and Ardö, J.: Evaluation of MODIS gross primary productivity for Africa using eddy covariance data, Remote Sensing of Environment, 131, 275–286, 2013.
Wagle, P., Xiao, X., and Suyker, A. E.: Estimation and analysis of gross primary production of soybean under various management practices and drought conditions, ISPRS Journal of Photogrammetry and Remote Sensing, 99, 70–83, 2015.
Wang, L., Zhu, H., Lin, A., Zou, L., Qin, W., and Du, Q.: Evaluation of the latest MODIS GPP products across multiple biomes using global eddy covariance flux data, Remote Sensing, 9, https://doi.org/10.3390/rs9050418, 2017.
Wang, L., Faye, B., Li, Q., and Li, Y.: A spatio-temporal analysis of the ecological compensation for cultivated land in northeast China, Land, 12, https://doi.org/10.3390/land12122179, 2023a.
Wang, W., Yin, S., Yu, J., He, Z., and Xie, Y.: Long-term trends of precipitation and erosivity over Northeast China during 1961–2020, International Soil and Water Conservation Research, 11, 743–754, 2023b.
Wang, X., Feng, L., Qi, W., Cai, X., Zheng, Y., Gibson, L., Tang, J., Song, X., Liu, J., Zheng, C., and Bryan, B. A.: Continuous Loss of Global Lake Ice Across Two Centuries Revealed by Satellite Observations and Numerical Modeling, Geophysical Research Letters, 49, 2022.
Wang, Y., Xiao, P., Zhang, X., Liu, H., Wu, Y., and Sun, L.: Unraveling the effects of snow cover change on vegetation productivity: Insights from underlying surface types, Ecosphere, 15, https://doi.org/10.1002/ecs2.4855, 2024.
Wei, X., Yang, J., Luo, P., Lin, L., Lin, K., and Guan, J: Assessment of the variation and influencing factors of vegetation NPP and carbon sink capacity under different natural conditions, Ecological Indicators, 138, https://doi.org/10.1016/j.ecolind.2022.108834, 2022.
Wetzels, M., Odekerken-Schröder, G., and Van Oppen, C.: Using PLS path modeling for assessing hierarchical construct models: Guidelines and empirical illustration, MIS Quarterly, 33, 177–195, https://doi.org/10.2307/20650284, 2009.
Xu, X., Liu, J., Zhang, S., Li, R., Yan, C., and Wu, S.: China many periods of land use land cover remote sensing monitoring data set (CNLUCC), Chinese Academy of Sciences, Resources and Environment Science Data Center Data Registration and Publication System [data set], https://doi.org/10.12078/2018070201 (in Chinese), 2018.
Xu, Y., Xu, Y., Wang, Y., Wu, L., Li, G., and Song, S.: Spatial and temporal trends of reference crop evapotranspiration and its influential variables in Yangtze River Delta, eastern China, Theoretical and Applied Climatology, 130, 945–958, 2017.
Xu, Y., Pei, J., Li, S., Zou, H. T., Wang, J. K., and Zhang, J. B.: Main Characteristics and Utilization Countermeasures for Black Soils in Different Regions of Northeast China, Chinese Journal of Soil Science, 54, 495–504, 2023.
Xue, L., Kappas, M., Wyss, D., and Putzenlechner, B.: Assessing the drought variability in northeast china over multiple temporal and spatial scales, Atmosphere, 13, https://doi.org/10.3390/atmos13091506, 2022.
Zhao, Q., Hao, X., Wang, J., Sun, X., and Li, H.: A dataset of snow cover phenology in China based on MODIS during 2000–2020, National Cryosphere Desert Date Center, [data set] (in Chinese), https://doi.org/10.12072/ncdc.I-SNOW.db0011.2021, 2022.
Zhao, Y., Chen, Y., Wu, C., Li, G., Ma, M., Fan, L., Zheng, H., Song, L., and Tang, X.: Exploring the contribution of environmental factors to evapotranspiration dynamics in the Three-River-Source region, China, Journal of Hydrology, 626, https://doi.org/10.1016/j.jhydrol.2023.130222, 2023.
Zhu, H., Lin, A., Wang, L., Xia, Y., and Zou, L.: Evaluation of MODIS gross primary production across multiple biomes in China using eddy covariance flux data, Remote Sensing, 8, https://doi.org/10.3390/rs8050395, 2016.