the Creative Commons Attribution 4.0 License.
the Creative Commons Attribution 4.0 License.
 | 16 Jan 2026
Characterizing near-surface permafrost in Utqiaġvik, Alaska, using Electrical Resistivity Tomography and Ground Penetrating Radar
Valentina Ekimova
MacKenzie A. Nelson
Taylor Sullivan
Thomas A. Douglas
Howard E. Epstein
Matthew G. Jull
Permafrost degradation in Arctic lowlands is a critical geomorphic process, increasingly driven by climate warming and infrastructure development. This study applies an integrated geophysical and surveying approach – Electrical Resistivity Tomography (ERT), Ground Penetrating Radar (GPR), and thaw probing – to characterize near-surface permafrost variability across four land use types in Utqiaġvik, Alaska: gravel road, snow fence, residential building and undisturbed tundra (with intact vegetation cover and natural drainage). Results reveal pronounced heterogeneity in thaw depths (0.2 to >1 m) and ice content, shaped by both natural features such as ice wedges and frost heave and anthropogenic disturbances. Roads and snow fences altered surface drainage and snow accumulation, promoting differential thaw, deeper active layers, and localized ground deformation. Buildings in permafrost regions alter the local thermal regime through multiple interacting factors – for example, solar radiation, thermal leakage, snow cover dynamics, and surface disturbance, among others. ERT identified high-resistivity zones (>1000 Ω m) interpreted as ice-rich permafrost and low-resistivity features (<5 Ω m) likely associated with cryopegs or thaw zones. GPR delineated subsurface stratigraphy and supported interpretation of ice-rich layers and permafrost features. These findings underscore the strong spatial coupling between surface infrastructure and subsurface thermal and hydrological regimes in ice-rich permafrost. Geophysical methods revealed subsurface features and thaw depth variations across different land use types in Utqiaġvik, highlighting how infrastructure alters permafrost conditions. These findings support localized assessment of ground stability in Arctic environments.
- Article
(8946 KB) - Full-text XML
- BibTeX
- EndNote


Permafrost – frozen earth material such as soil, sediment, organic matter, or rock persisting below 0 °C for at least two consecutive years – provides the physical foundation of Arctic landscapes and infrastructure, but its long-term stability is tightly linked to surface thermal conditions that are now being disrupted by climate change and land use (Grosse et al., 2011; Kudryavtsev, 1978; Popov, 1967).
These disruptions are particularly evident in the Arctic, which has warmed at more than twice the global average over the past century (∼2.7 °C), with Alaskan permafrost warming by 1.5–2 °C in upper layers since the late 1980s and up to 3 °C in some areas (Moon et al., 2024; Romanovsky et al., 2010). Warming is also evident at depth, with rates of 0.4–0.6 °C per decade recorded at 15–20 m since the early 2000s, including a 0.05 °C rise at 16 m in Utqiaġvik between 2003 and 2023. Infrastructure-induced changes in snow accumulation, surface hydrology, and thaw dynamics threaten to locally accelerate such permafrost warming (EPA, 2024; Spero et al., 2025).
For infrastructure planning and monitoring, it is important to recognize that permafrost does not respond uniformly to warming. Its behavior is strongly shaped by subsurface heterogeneity – including ice-rich zones (>20 %–30 % ice), taliks (unfrozen nonsaline zones), and cryopegs (saline unfrozen layers) – which significantly contribute to the thermal regime and structural stability of frozen sediments (Shumsky, 1959; Yershov, 2004). This heterogeneity means that the impacts of climate warming are expressed in multiple ways. Warming promotes thaw of frozen sediments and increases active layer thickness – the seasonally thawed layer above permafrost (Hinkel and Nelson, 2003; Jorgenson et al., 2001; Shiklomanov et al., 2010). It also triggers phase transitions of pore ice and pore water redistribution, which reduce the strength and bearing capacity of permafrost, increasing the risk of settlement, frost heave, structural failure, and generating significant financial losses for Arctic communities and regional economies (Biskaborn et al., 2019; Chuvilin et al., 2022; Frolov, 2016; Hjort et al., 2022).
As Hjort et al. (2022) showed, nearly 70 % of Arctic infrastructure is at risk of permafrost thaw by 2050 for Utqiaġvik specifically. Moderate to high ground subsidence was projected under future climate scenarios (Streletskiy et al., 2023). These projections highlight Utqiaġvik as an area of concern where detailed, site-specific characterization of near-surface permafrost is needed to understand how different infrastructure types affect permafrost conditions. To address this need, noninvasive geophysical techniques provide effective tools for investigating subsurface heterogeneity, offering insights that are critical both for assessing site conditions prior to construction and for monitoring infrastructure performance over time (Hauck and Kneisel, 2008).
A range of methods – including Ground Penetrating Radar (GPR), Electrical Resistivity Tomography (ERT), seismic surveys, Electromagnetic Induction (EMI), and Nuclear Magnetic Resonance (NMR) – enable larger-scale and dynamic monitoring (Kneisel et al., 2008; Tourei et al., 2024; Yoshikawa et al., 2006). In Alaska, geophysical surveys were first applied during WWII (Hopkins and Karlstrom, 1955) and have since become standard tools, with GPR and ERT particularly widespread (Kim et al., 2021).
GPR has been applied in Arctic permafrost research since the 1970s to image cryostructures (Annan et al., 1975). It detects subsurface contrasts in dielectric permittivity, which is sensitive to water content, using electromagnetic pulses (Daniels, 2004). Typical GPR systems include a transmitter, receiver, and control unit (Jol, 2008). GPR is well-suited for identifying active layer thickness and structures such as ice lenses and wedges (Brandt et al., 2007; Edemsky et al., 2024; Hinkel et al., 2001; Moorman et al., 2007; Munroe et al., 2007). Frequencies range from ∼12.5 MHz to >2 GHz; 200–400 MHz antennas provide shallow imaging (∼10 m), and <100 MHz enables deeper, lower-resolution surveys (Daniels, 2004; Hauck and Kneisel, 2008). Resolutions can reach 0.2 m in ideal settings (Gusmeroli et al., 2015; Westermann et al., 2010; Wollschläger et al., 2010). However, conductive or saline soils limit signal penetration (Dafflon et al., 2013; Daniels, 2004). Gravel pads and other coarse materials reduce permittivity contrast, underscoring the benefits of combining GPR with ERT (Annan et al., 1975; Moorman et al., 2003).
ERT, first used in Arctic permafrost studies in the 1970s (Hoekstra et al., 1975), was adapted for tomographic applications by Kneisel et al. (2000). ERT measures resistance via electrodes in surface or borehole arrays to create 2D or 3D resistivity images (Kneisel et al., 2014; Loke et al., 2021). High ice-content soils typically exhibit 400–2000 Ω m, while unfrozen or saline zones are 10–20 Ω m (Herring et al., 2023; Tourei et al., 2024). Dry, coarse-grained materials and saline cryopegs obscure resistivity contrasts, complicating interpretation (Fortier et al., 2023; Kvon et al., 2019). Advances in systems and inversion algorithms now allow 15–30 m depth imaging with vertical resolution ∼25 % of electrode spacing (Kneisel et al., 2014). Saturated active layers reduce penetration, and field deployment in Arctic terrain remains logistically demanding (Dafflon et al., 2013; Kneisel et al., 2008).
Coupled GPR–ERT interpretation enhances reliability in identifying subsurface features such as ice lenses, cryopegs, taliks, and wedge structures (Bobrov et al., 2018; Dafflon et al., 2013; Leger et al., 2017; Saintenoy et al., 2020). Numerous examples of independent GPR and ERT surveys in Utqiaġvik exist (Dafflon et al., 2020; Hinkel et al., 2001; Jafarov et al., 2017). Combined use is less common; Leger et al. (2017) applied GPR (500 MHz) and ERT (0.5 m dipole–dipole) in polygonal tundra. Kim et al. (2025) employed GPR (250/500 MHz) and ERT (Wenner, 1 m spacing) to assess snow-fence impacts, showing snow-enhanced insulation deepens thaw and triggers subsidence. Other Arctic studies using this integration span Alaska (Yoshikawa et al., 2006), Canada (Kneisel et al., 2008; Moorman et al., 2003), Russia (Bobrov et al., 2018; Buddo et al., 2024; Olenchenko et al., 2017), Sweden (Sjöberg et al., 2015), Norway (Pace et al., 2024) and Greenland (Ingeman-Nielsen et al., 2012).
To extend these geophysical approaches to a local context, we conducted GPR and ERT surveys during peak seasonal thaw in 2021–2023 in Utqiaġvik, Alaska. Our guiding question is how common infrastructure types in Utqiaġvik modify near-surface permafrost features and active layer thickness relative to a local tundra reference with unchanged vegetation and drainage, and whether combined ERT, GPR, and thaw probing can reliably resolve these differences for site assessment. Our focus on residential buildings, raised gravel roads, and snow fences reflects the most widespread infrastructure types in the Arctic, with undisturbed tundra (with intact vegetation and unchanged drainage) included as a natural reference. Together, these settings allow evaluation of how both natural conditions and human disturbance shape near-surface permafrost. Geophysical profiles were interpreted alongside 3 m resolution satellite imagery (ESRI/QGIS) to provide site-specific insight into permafrost–infrastructure interactions.
Utqiaġvik (formerly Barrow), Alaska (71.290558, −156.788605) lies within the zone of continuous permafrost at the northernmost tip of the state. The region experiences a mean annual air temperature of °C, with ground temperatures around −9 to −9.5 °C at 20–30 m depth (Jorgenson et al., 2008; Liu, 2020). Permafrost extends 200–400 m deep and underpins sensitive ecosystems and infrastructure (Bunnell et al., 1975; Hinkel et al., 2001; Osterkamp and Payne, 1981).
The area is underlain by Quaternary nearshore marine, alluvial, and eolian sediments forming the Gubik Formation, divided into the Barrow Unit (organic-rich sands, silts, and gravels) and the Skull Cliff Unit (marine, clay-to-cobble materials). The Barrow Unit forms a roughly 8–15 m thick surficial veneer that overlies finer grained Skull Cliff sediments and Cretaceous bedrock at about 15–30 m depth (Black, 1964; Sellmann and Brown, 1973). Ice-rich permafrost is common, with segregated ice reaching 40 %–80 % by volume and massive ice wedges several meters deep (Jorgenson et al., 2008; Kanevskiy et al., 2017; Munroe et al., 2007; Zhang et al., 1999). Cryopegs occur at ∼10–30 m depth (Brown, 1969; Iwahana et al., 2021).
Thermokarst features and ground subsidence are widespread due to ice content and thaw sensitivity (Farquharson et al., 2016; Hinkel and Hurd, 2006; Hinkel and Nelson, 2003; McCarthy, 1994). Active layer thickness generally ranges from ∼0.3 to 1.0 m, influenced by vegetation, soil, and climate variability (Hinkel and Nelson, 2003; Shiklomanov et al., 2010), with deepening trends observed in recent decades (Nyland et al., 2021; Victor, 2022).
Surveys were conducted at four sites (Fig. 1): (a) a Taġiuġmiullu Nunamiullu Housing Authority (TNHA) residential area with localized thermokarst; (b) the old section of Cakeeater Road that crosses an ice-wedge polygonal landscape; (c) a snow fence with delayed melt and frost heave (Hinkel and Hurd, 2006); and (d) the Barrow Environmental Observatory (BEO), representing undisturbed tundra (with unchanged vegetation and drainage) (Hinkel and Nelson, 2003). These sites represent a range of infrastructure and land use conditions relevant to permafrost degradation and geophysical monitoring.
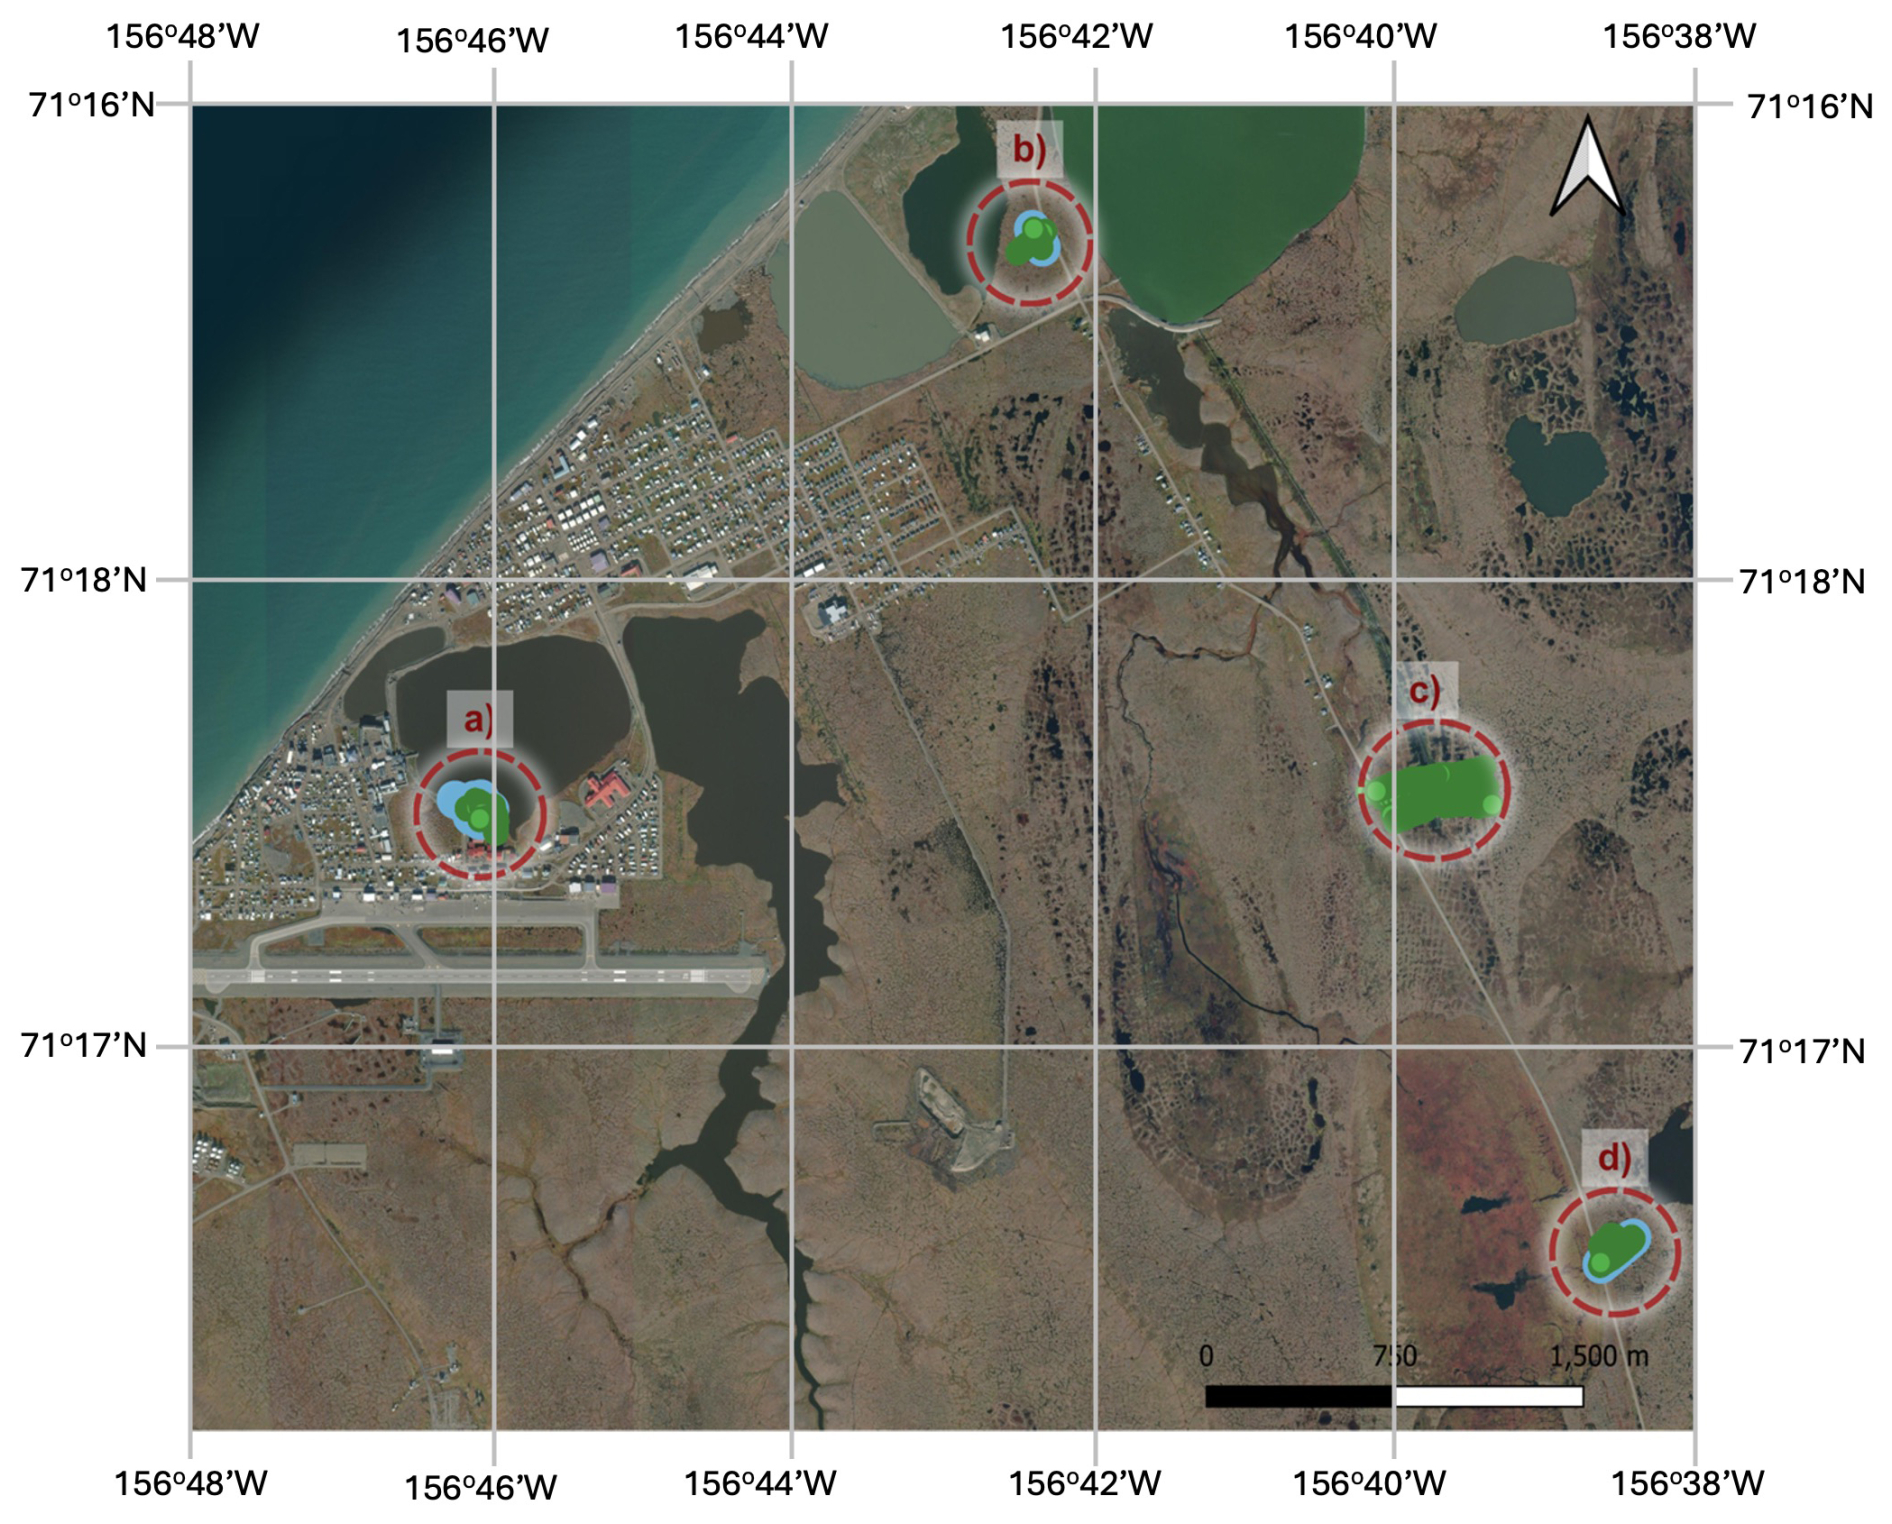
Figure 1Location of geophysical survey (ERT: blue dots, GPR: green dots) sites in Utqiaġvik, Alaska, shown on ESRI satellite imagery (© ESRI) in QGIS. Sites include (a) the Taġiuġmiullu Nunamiullu Housing Authority (TNHA) residential facility, (b) the old section of Cakeeater Road, (c) a snow fence location near Cakeeater Road, and (d) the Barrow Environmental Observatory (BEO).
Field data were collected near peak thaw conditions in late summer (late August–early September) in 2021, 2022, and 2023. ERT data were collected using a SuperSting R8 system (AGI, Inc.) with 84 stainless steel electrodes. Electrode spacing ranged from 1 to 5 m depending on the survey design, targeting both near-surface and deeper permafrost features. All measurements were conducted in a dipole–dipole array configuration, which provides high resolution of lateral resistivity contrasts and is commonly used in permafrost investigations (Douglas et al., 2016, 2025). The SuperSting R8 is capable of resolving a wide range of apparent resistivity values, though measurement precision can decrease at the extreme ends of the detectable range. Raw apparent resistivity data were reviewed and filtered to remove values with noise levels exceeding 3 % or with poor reciprocal error statistics. Inversion was performed using ResIPy (Blanchy et al., 2020), a Python-based interface for the R2 resistivity modeling engine, which allows flexible constraint testing and model optimization. Regularization parameters were adjusted iteratively based on data misfit and model smoothness. Topographic data were incorporated into the inversion. The resulting 2D resistivity cross-sections were interpreted in the context of known permafrost resistivity ranges to infer thaw depth, cryopegs, and ice-rich zones.
GPR data were collected using a GSSI system with 200 and 400 MHz shielded antennas and processed using GPRPy (Plattner, 2020), an open-source Python-based package designed for reproducible radargram analysis. Processing steps included high-pass filtering of the low-frequency drift, mean subtraction, time-zero correction, and manual gain control. Horizontal scaling was performed using GPS-referenced distances. Data were further processed with background removal and bandpass filtering to enhance reflection continuity. Two-way travel time was converted to depth as . We used a constant ν=0.050 m ns−1, obtained by aligning the permafrost-table reflector with active-layer thickness at co-located thaw-probe points. This value is consistent with published velocities for thawed, fine-grained (silt-dominated) active-layer sediments. Within 0–1 m, the absolute difference between GPR-derived depths and probe measurements was ≤0.08 m. Interpretation of thaw depth and ice-rich features was based on reflection strength, geometry (e.g., hyperbolas), and signal attenuation, following best practices established in Arctic GPR surveys (Munroe et al., 2007; Shein et al., 2022).
Thaw probing served as the primary ground validation technique, involving the insertion of a metal probe into the ground until reaching the point of refusal, which corresponds to the depth of the permafrost table. At each measurement point, the metal rod (probe) was pushed vertically through the thawed active layer until a sharp increase in resistance of sediments was encountered, interpreted as contact with ice-bonded, compacted sediments (permafrost). The probe was then withdrawn, the position of the ground surface on the metal probe was marked, and the penetration depth was measured with a measuring tape to obtain local thaw depth. This method is highly effective for identifying the depth to permafrost but is less reliable in rocky terrain due to probe obstruction (Boike et al., 2022).
Following field data acquisition (Ekimova et al., 2025), transect locations were mapped in QGIS using high-resolution ESRI World Imagery (ESRI, 2024; QGIS Development Team, 2024). Satellite-based interpretation of surface features – such as ice-wedge polygons, thaw ponds, and infrastructure effects – supported the analysis of ERT and GPR results. Many surface observations corresponded with geophysical anomalies, underscoring the complementary role of remote imagery in subsurface interpretation.
Our sites include infrastructure-affected areas (TNHA, Cakeeater Road, Snow Fence) and relatively undisturbed tundra (BEO), selected to capture variability in permafrost conditions across different land use types. Most profiles yielded interpretable data; some were excluded due to signal loss or environmental noise. While time-series comparisons were limited, representative datasets were selected for analysis.
Each site is discussed individually, focusing on thaw depth variability, distribution of subsurface ice, and infrastructure-related effects. For large-scale ERT profiles, interpretation relied on approximate resistivity ranges commonly used in Arctic permafrost studies, including Tourei et al. (2024). These include: (A) very low resistivity (0.5–10 Ω m), typically associated with cryopegs; (B) low resistivity (10–100 Ω m), characteristic of the active layer; (C) moderate to high resistivity (400–1000 Ω m), representing transition zones between frozen and unfrozen ground; (D) high resistivity (>1000 Ω m), indicating ice-rich permafrost; and (E) very high resistivity (∼10 000 Ω m or greater), suggesting excess ice features such as ice lenses and ice wedges. These ranges are used as interpretive guides rather than fixed thresholds. A cross-site synthesis follows, comparing patterns in permafrost response and dominant influencing factors.
4.1 Taġiuġmiullu Nunamiullu Housing Authority (TNHA)
Ground surveys were conducted at the Taġiuġmiullu Nunamiullu Housing Authority (TNHA) site in August 2021, including two intersecting transects of ERT and GPR data, as well as thaw probing. These measurements – covering both the area beneath the building and the surrounding terrain – form the basis of the analysis presented here.
The west–east trending ERT profile (W–E blue line, Fig. 2a, top) at the TNHA site extended 83 m with 1 m electrode spacing and covered areas both beneath and adjacent to the building. GPR (W–E green line, Fig. 2a, top) was conducted along the same transect, spanning 53 m, but did not extend beneath the structure. Thaw probing was performed along the ERT line as well (Fig. 2b), which also includes the area beneath the building, but does not cover the gravel pad near the building. The building is elevated on pillars to reduce the structure's thermal impact on the underlying permafrost (Fig. 3a, left).
The north–south ERT survey (Fig. 2a, N–S blue line) was conducted with electrodes spaced at 1 m intervals along an 83 m transect, crossing beneath the building at the midpoint. The GPR survey (Fig. 2a, N–S green line) was conducted alongside the ERT for the first 20 m of the transect (north of the building).
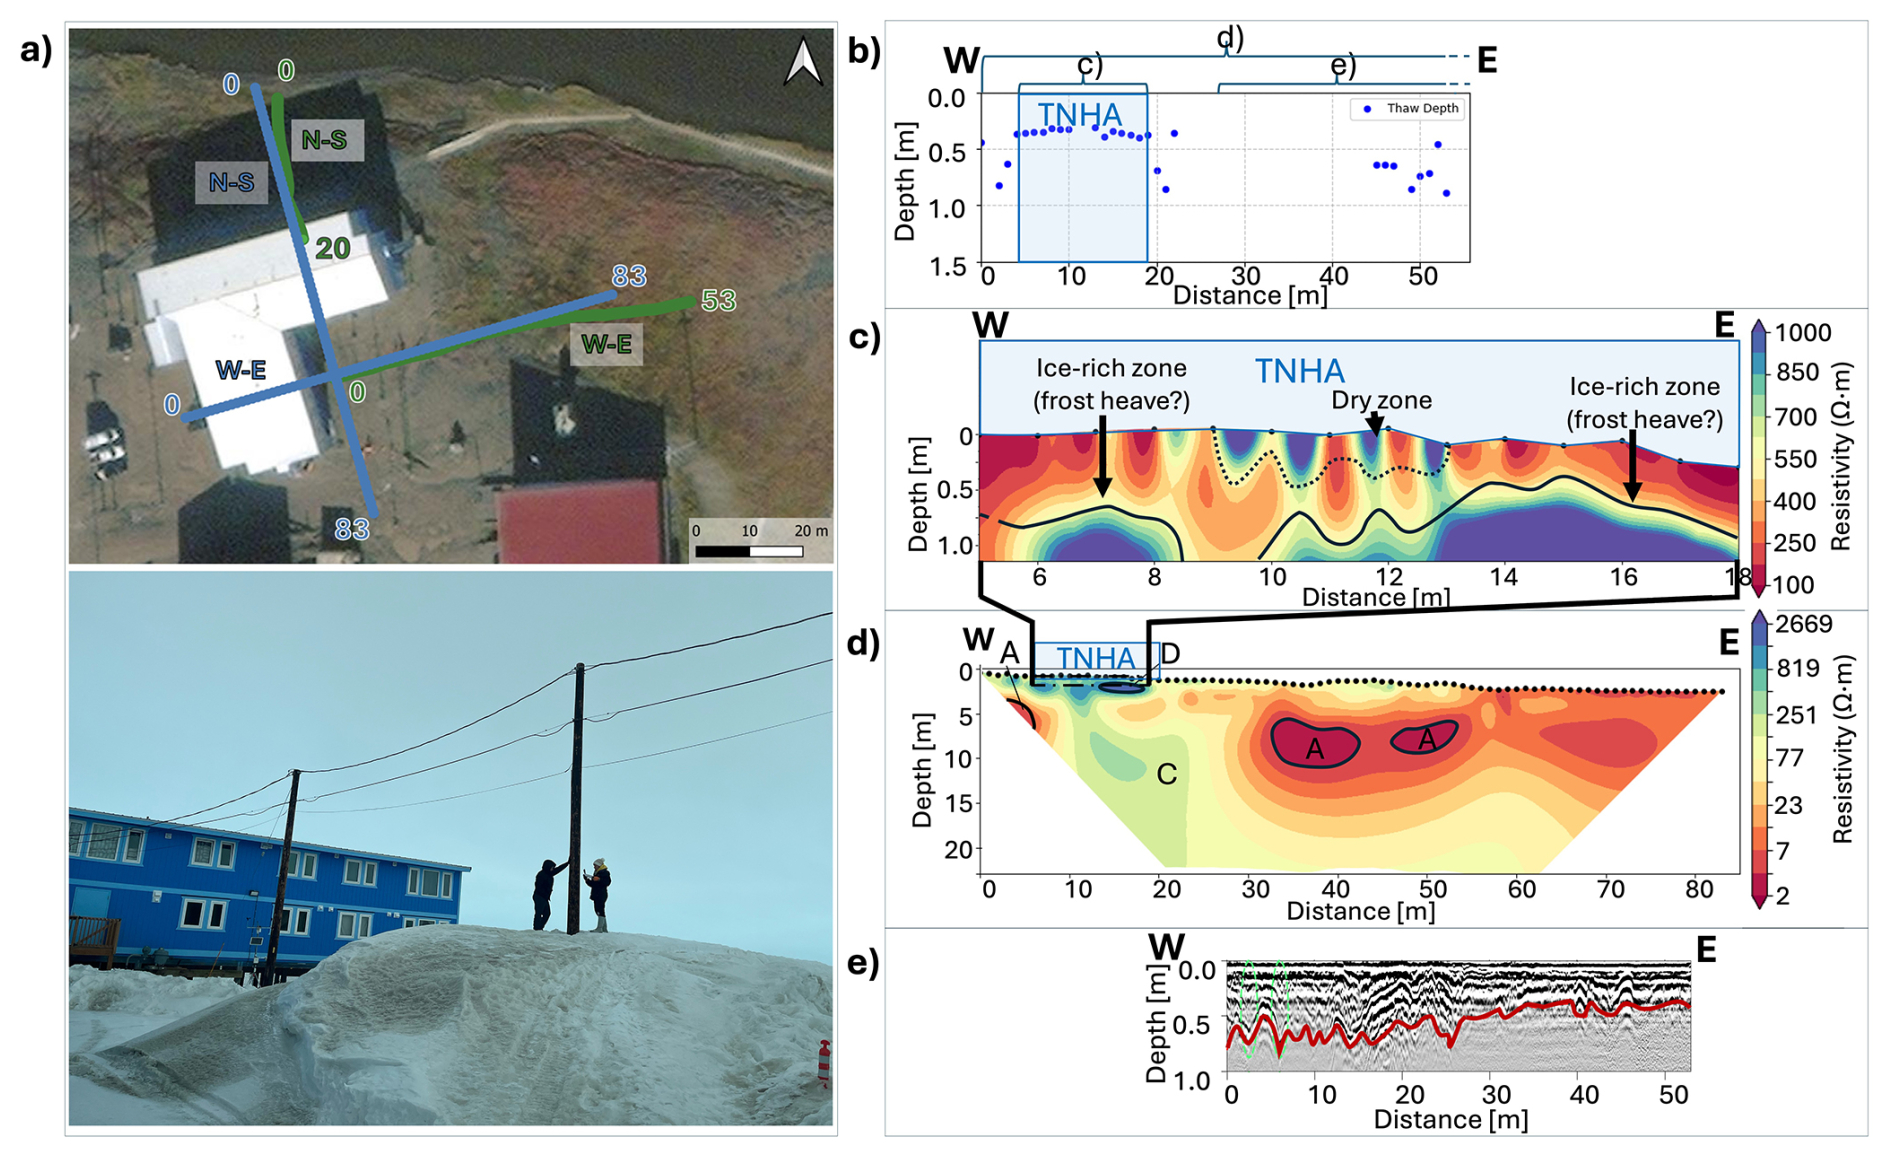
Figure 2Geophysical survey results along the west–east (W–E) transect at the Taġiuġmiullu Nunamiullu Housing Authority (TNHA) site, Utqiaġvik, Alaska. (a) Top: Survey layout showing the ERT profile (blue) and the GPR profile (green) overlaid on an ESRI basemap, © ESRI (QGIS). Bottom: Photograph of a >3 m snow pile at the TNHA site, located along the W–E transect during winter–spring (May 2025). Photo: Hannah Bradley; (b) Thaw probe measurements along the ERT transect; (c) Fine-scale ERT view of upper 1.3 m below the building showing thaw depth (solid black line) and dry zone (dotted line); (d) Large-scale ERT cross-section (∼0–15 m depth) with approximate interpretive resistivity zones: A: cryopegs (0.5–10 Ω m), C: transition zone (400–1000 Ω m), D: ice-rich permafrost (>1000 Ω m); (e) GPR profile with thaw depth (red line) and potential ice-rich zones (green dashed circles).
The 83 m ERT cross-section (Fig. 2d) reveals several zones of very low resistivity (<5 Ω m), notably on the west side of the building (∼5 m depth) and near the center of the transect (∼7.5 m depth). These zones likely correspond to cryopegs (Zone A) – saline, unfrozen, water-saturated regions within permafrost. High-resistivity areas (>1000 Ω m, Zone D) beneath the building suggest the presence of ice-rich permafrost, possibly including ice lenses. Much of the remaining transect displays intermediate resistivity values (400–1000 Ω m, Zone C), which may indicate frozen ground with variable ice content.
Based on prior studies (e.g., Herring et al., 2023; Tourei et al., 2024) and supported by thaw probing results (Fig. 2b), sediments below ∼1 m depth are predominantly frozen. A detailed view beneath the building is shown in Fig. 2c, highlighting vertical resistivity variation due to thaw depth changes (0.2–0.7 m) with shallowing of thaw depth on the east side, and lateral contrasts likely related to ice content differences.
Buildings on elevated pilings can reduce summer ground warming by avoiding direct contact between the ground and the structure and limiting direct solar radiation through shading. This design often also reduces snow accumulation or limits snow thickness compared to surrounding undeveloped areas, enhancing winter cooling. In contrast, adjacent areas without structures tend to retain thicker snow cover, which insulates the ground and leads to higher subnivean temperatures. During spring, melting snow and roof runoff can saturate soils near the building perimeter, promoting localized thaw. While the area directly beneath the building typically remains shaded and ventilated, increased active layer thickness immediately adjacent to the building may result from ponding or increased water runoff from the roof, which enhances heat transfer to the ground through solar exposure. The slightly shallower thaw observed on the east side (∼0.2 m) relative to the west (∼0.4 m) likely reflects differences in solar exposure, wind patterns, or snow accumulation. Just beyond the building footprint (starting at 18 m along the transect), thaw depths increase to greater than 0.5 m.
The high-resistivity zones beneath the structure in Fig. 2d coincide with shallower active layer depths measured by probing, suggesting the presence of underlying frozen material, potentially ice-rich permafrost. A photo taken beneath the building on 28 June 2024 (Fig. 3a, right) shows raised surface features that may reflect seasonal frost heaving within the active layer, caused by the formation of segregated ice lenses during freezing. The specific source of moisture for this process beneath the building remains uncertain – particularly given the absence of direct snow accumulation or roof runoff – and may involve lateral subsurface water movement from surrounding areas.
An additional high-resistivity zone near the surface in the middle of the building footprint was identified (Fig. 2c, dotted line). While high resistivity often indicates frozen ground, temperature and moisture data suggest otherwise. Temperature profiles from HOBO sensors installed beneath the building show that this zone thawed by mid-July, with temperatures exceeding 0 °C, followed by a sharp decline in moisture content by August. These observations indicate that the high-resistivity signature likely corresponds to dry upper soils. Below this zone, a decrease in resistivity is observed between 8.5 and 9.8 m along the transect. This feature may correspond to increased thaw depth, but it could also reflect noise in the ERT measurements caused by the overlying dry sediments and reduced current penetration.
The W–E GPR profile (Fig. 2e), aligned with the easternmost 50 m segment of the ERT profile (Fig. 2d), shows thaw depths (solid red line) ranging from 0.5 to 0.8 m – deeper than those beneath the building, as inferred from ERT. On the eastern end of the profile, reflections from frozen ground are unreliable due to signal interference, likely from a nearby metal pipe. On the western end, two zones of potential high ice content are observed, though these were not independently verified.
A physical thaw probe survey was conducted along the ERT transect (Fig. 2b), including the area beneath the building but excluding the gravel-covered area near the building. Measurements revealed thaw depths ranging from 0.3 to >1 m (the measurement limit of the probe), with the shallowest values occurring beneath the building. Thaw depth increased immediately adjacent to the building, consistent with ERT and GPR interpretations.
The N–S ERT inversion profile is shown in Fig. 3c–d, featuring a coarse-scale view extending to ∼15 m depth across the full transect (Fig. 3d), and a fine-scale view focusing on the upper 3 m from 30 to 50 m along the profile, including the area beneath the building (Fig. 3c).
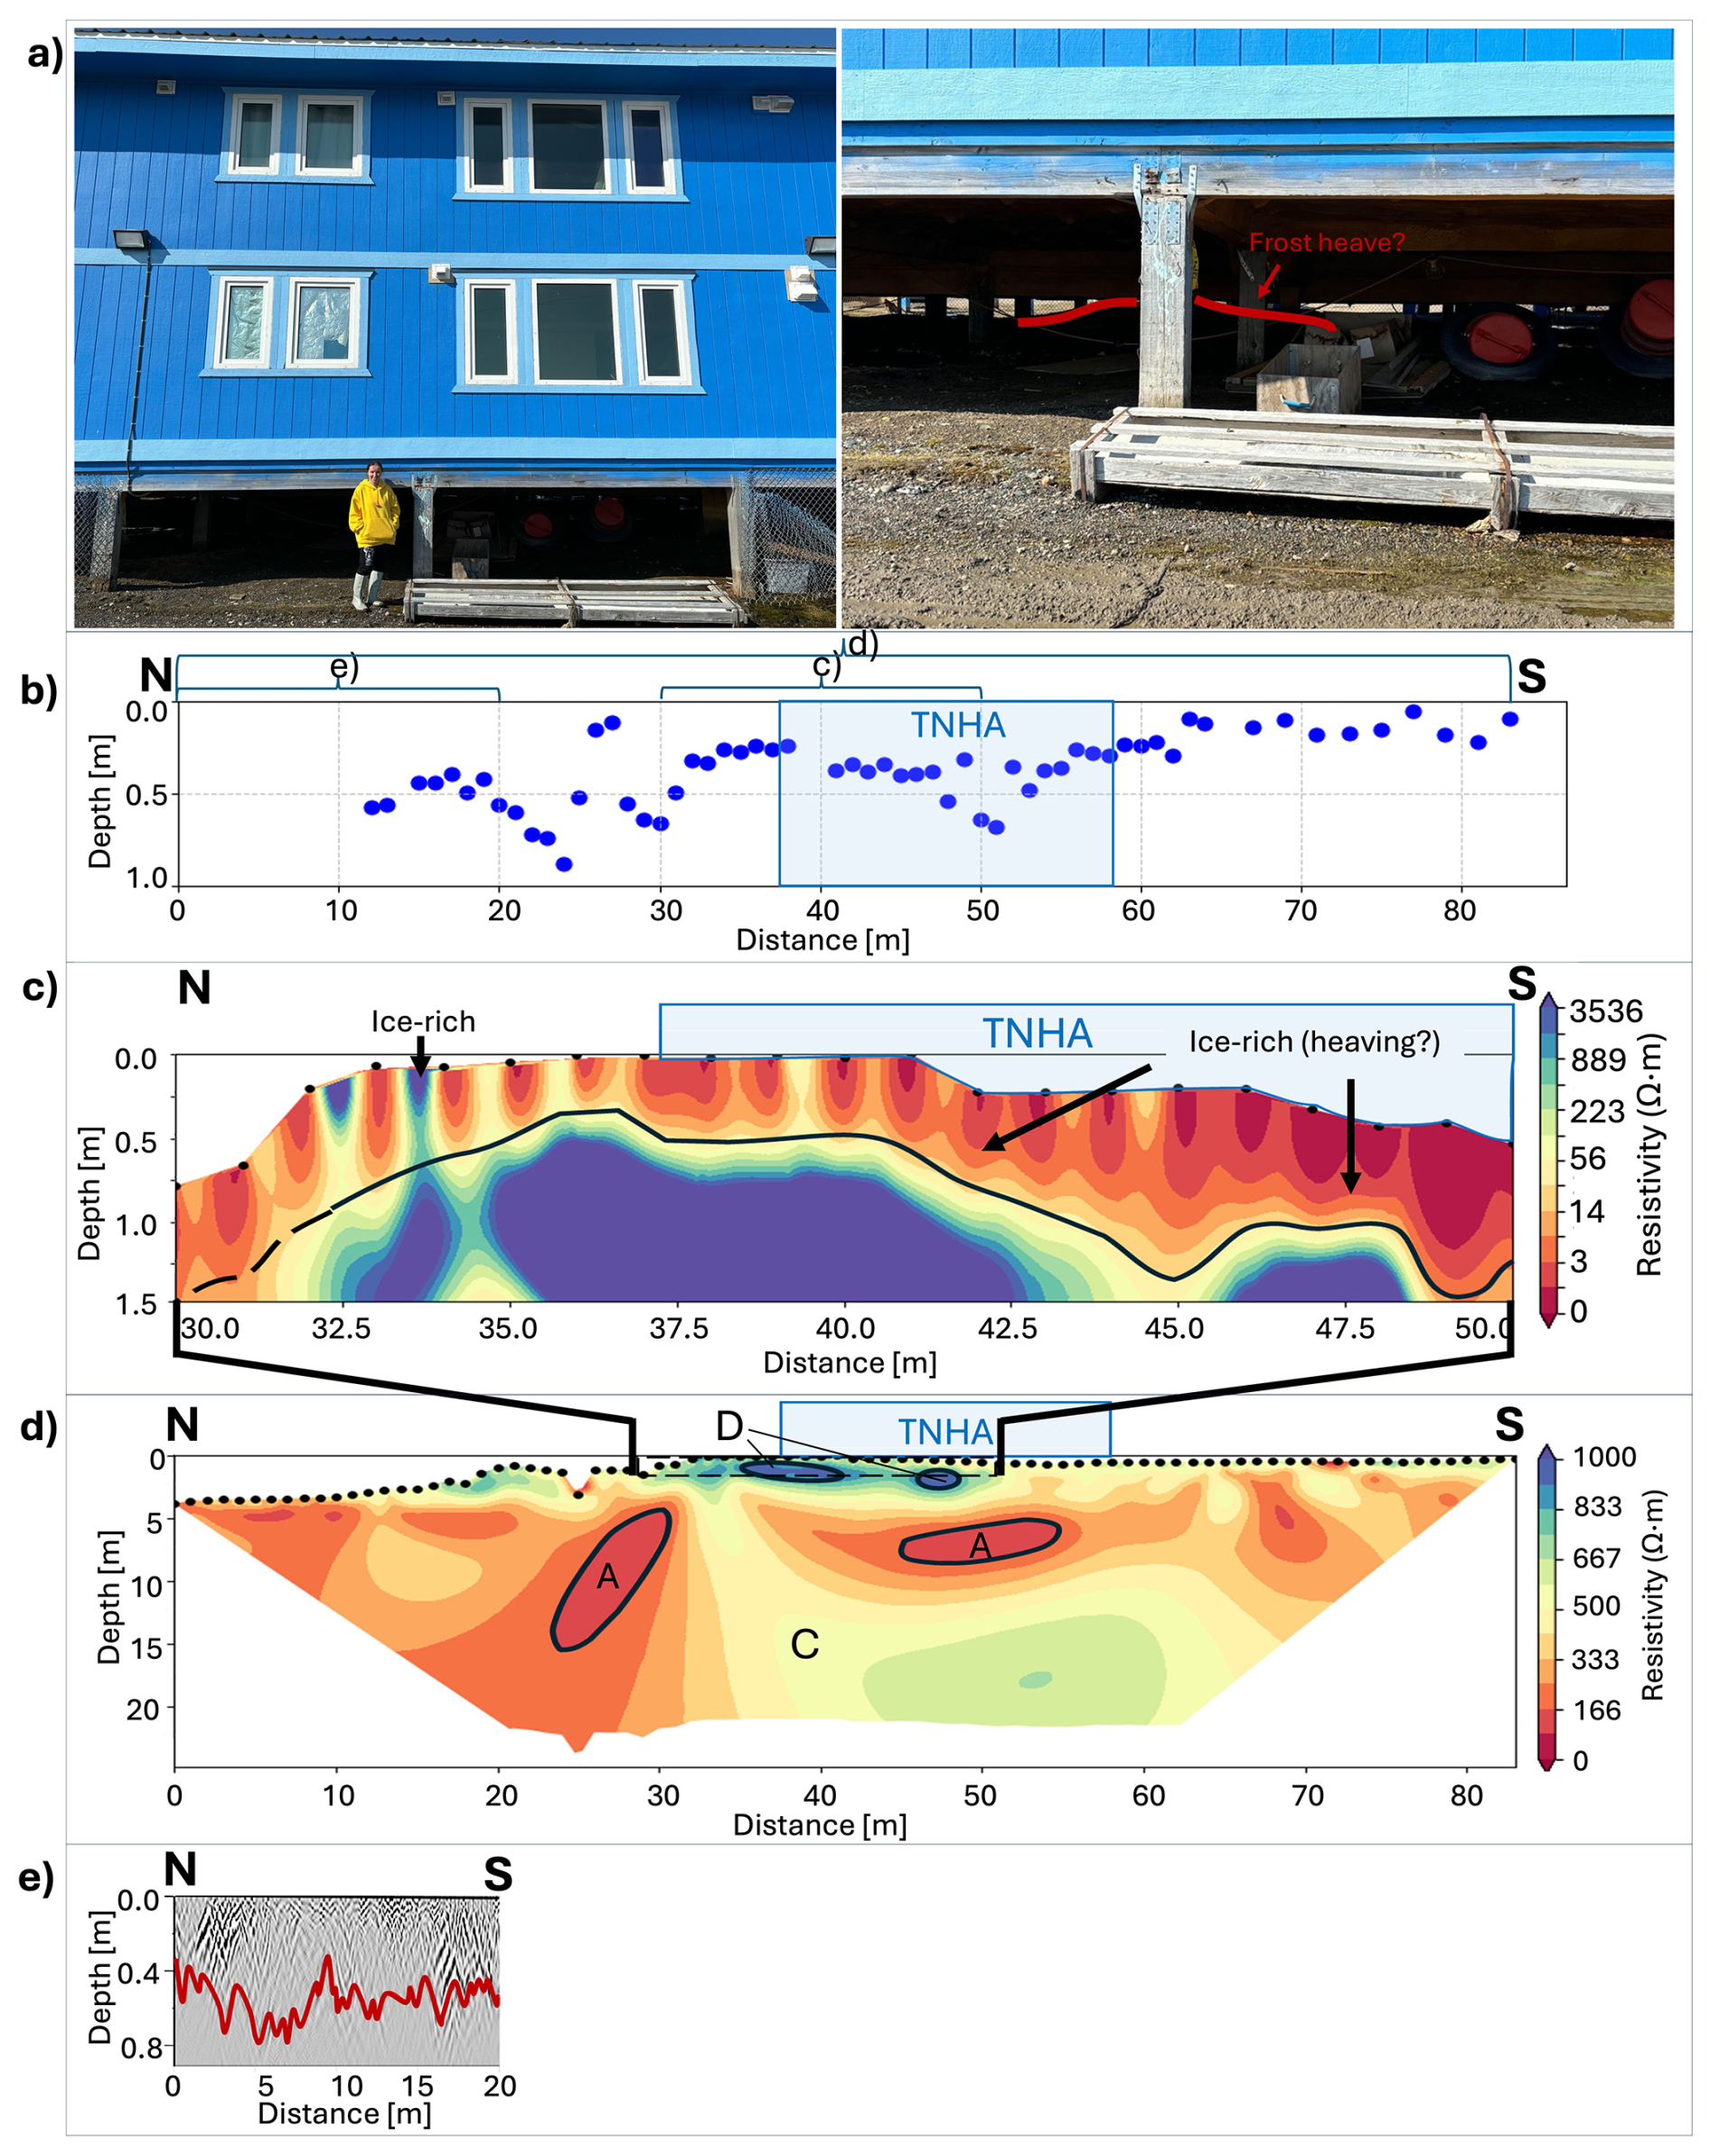
Figure 3(a) Left: Photograph of the TNHA building (June 2024). Photo: MacKenzie Nelson. Right: Surface elevation beneath the building at the TNHA site, outlined by the red line, indicating possible frost heave features (28 June 2024); (b) Thaw probe measurements along the N–S ERT transect at the TNHA site; (c) Small-scale view of the upper 3 m between 30–50 m profile distance, including the building footprint, with thaw depth indicated by solid black line; (d) N–S coarse-scale resistivity cross-section (∼0–15 m depth), showing approximate interpretive zones A–D: A: cryopegs (0.5–10 Ω m), C: transition zone (400–1000 Ω m), D: ice-rich permafrost (>1000 Ω m); (e) N–S GPR profile, showing thaw depths (red line).
In the full profile view of the N–S ERT profile (Fig. 3d), we observe approximate zones of low resistivity (<5 Ω m) in the center of the profile (at depths of ∼10 m and ∼7.5 m), which may correspond to cryopegs (Zone A). High-resistivity zones (>1000 Ω m) beneath the building (Zone D) at depths below ∼1–5 m are likely indicative of ice-rich permafrost with potential ice lenses. The remainder of the profile, between depths of ∼8–12 m and from 35 to 70 m along the transect, is interpreted as a transitional zone (Zone C) situated between two cryopeg-bearing sections of Zone A. The thickness and depth of this zone vary laterally. In the ERT results, Zone C shows resistivities of 400–1000 Ω m, likely reflecting a mixture of frozen and unfrozen material with variable ice content and salinity, and marking the gradual shift between frozen ground and cryopeg-containing sediments.
The fine-scale view (Fig. 3c) shows inferred thaw depths (black line) ranging from ∼0.3 to >1 m. The shallowest thaw (∼0.3 m) occurs beneath the northern part of the building while thaw depths on the southern side reach ∼0.5 m. Beyond the building footprint, thaw depths increase, consistent with the W–E profile results. The ice-rich zones below the building, as seen in both profiles, may be associated with observed surface elevation changes potentially resulting from frost heaving.
The N–S GPR profile, corresponding to the northernmost 20 m of the ERT transect, is shown in Fig. 3e. Inferred thaw depths (red line) range from ∼0.5 to 0.9 m – deeper than those inferred from ERT beneath the northern side of the building (∼0.3 m).
A physical thaw-probe survey was conducted along the ERT profiles (Fig. 3b). Measured thaw depths ranged from 0.2 to >1 m. Beneath the building, thaw depths were consistently ∼0.4–0.6 m, deeper than the ∼0.3 m inferred from ERT on the northern side but similar to ERT values (∼0.5 m) on the southern side (Fig. 3c). To the north of the building, probe measurements indicated deeper thaw, while shallower values on the south likely reflect contact with compacted gravel rather than frozen soil. In general, probe results correspond more closely with GPR-inferred depths than with ERT, particularly beneath the northern side of the building.
Based on the combined dataset, the following interpretations are proposed for the TNHA site. The building is elevated ∼1.5 m on wood pilings (Fig. 3a, left), consistent with standard design practices in permafrost regions (Kudryavtsev, 1978), which reduces heat transfer by promoting airflow beneath the structure, and limiting solar radiation and snow accumulation. In winter, this exposure allows for enhanced ground cooling, while in summer, shading and limited solar penetration delay thaw, maintaining sub-zero conditions beneath the building until mid-July (as confirmed by temperature sensors).
Moisture sensors indicate high volumetric water content (40 %–50 %) below the building due to delayed thaw. This moisture promotes frost heave during refreezing. Although surface drying occurs late in the summer, sediments remain moisture-rich (∼40 %) below. These conditions may support permafrost aggradation rather than degradation. Field observations suggest that frost heaving is most pronounced on the north and east sides, while the west shows less activity. Thaw depths on the south side align with site averages.
Adjacent areas show deeper thaw, reaching ∼1 m, especially near the west-side parking lot, where geophysical and probe measurements record ∼0.9 m. The comparison of ERT, GPR, and thaw-probe results at the TNHA site shows strong overall agreement in the spatial pattern of thaw, yet each method contributes unique detail. ERT delineates subsurface features and active layer thickness, including the area beneath the building where the active layer is shallower directly under the structure and deeper along its sides; deeper thaw is also identified in the GPR data, and thaw depths from both geophysical methods are confirmed by the thaw-probe survey. While the north and east building margins appear stable, the south and west sides are more vulnerable to thaw-related subsidence. Continued monitoring is recommended to assess both frost heave beneath the building and degradation risks at its periphery.
4.2 Permafrost Conditions and Cryoturbation Near the Old Section of Cakeeater Road
ERT and GPR surveys were conducted in early September 2021 near an old spur of Cakeeater Road (a short side road perpendicular to the main Cakeeater Road; see Fig. 4a, between green GPR transects #11 and #10). One ERT transect was collected perpendicular to this spur (and parallel to the main road), accompanied by a parallel GPR profile. Two additional GPR profiles were oriented longitudinally along the spur.
The SE–NW ERT profile (Fig. 4a, blue line) spans 83 m, with electrodes spaced at 1 m intervals. GPR profile #12 (Fig. 4a, green line) is aligned with the ERT transect and extends 80 m. The additional GPR profiles – #10 (140 m) and #11 (120 m) – follow the road alignment. The site is located within an ice-wedge polygon landscape, and the geophysical lines intersect several polygon boundaries (Fig. 4a).
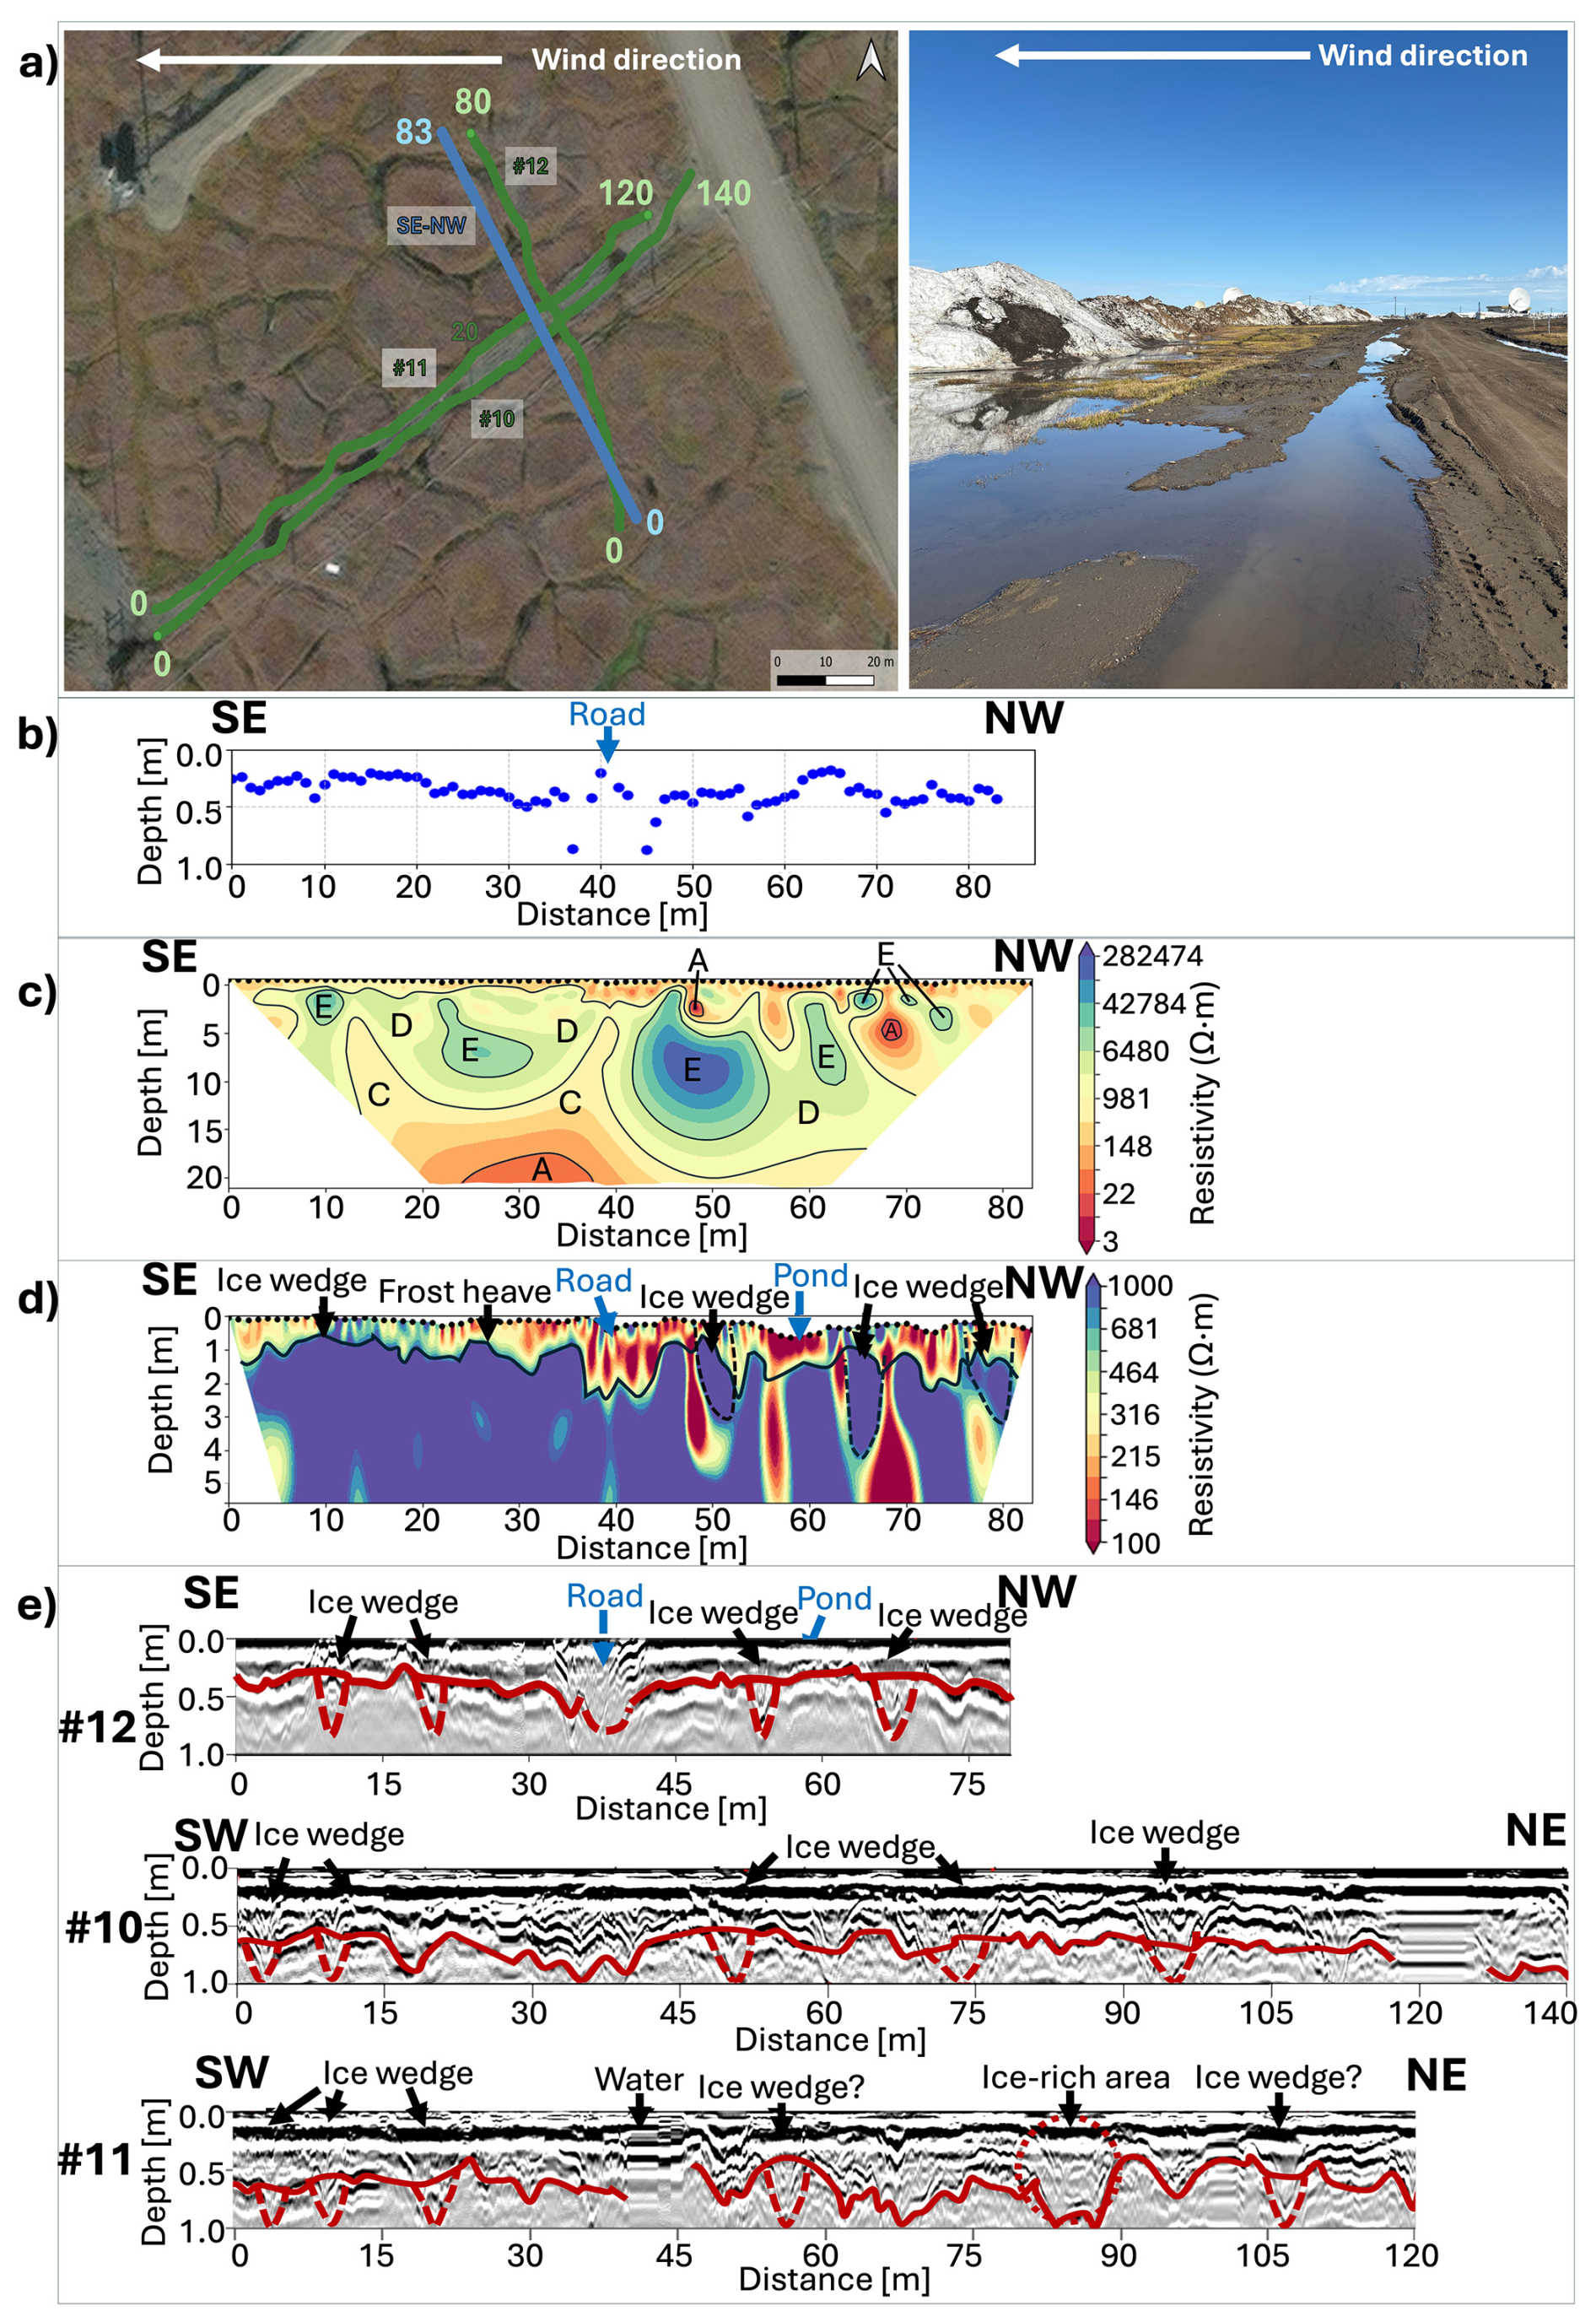
Figure 4(a) Left: Location of ERT (blue, SE–NW) and GPR (green) profiles near the old section of Cakeeater Road, shown on ESRI satellite imagery, © ESRI (QGIS). Right: Photo of a similar site with snow accumulation and melt water ponding along the Imaiqsaun Road (photo by Valentina Ekimova, May 2025); (b) Thaw probe measurements along the ERT profile and GPR profile #12; (c) Coarse-scale SE–NW ERT resistivity cross-section (∼0–20 m depth), with black dots indicating electrode positions and zones A–E denoting approximate permafrost features based on resistivity values; (d) Fine-scale SE–NW ERT profile (∼ top 5.7 m), showing thaw depth variability; (e) GPR profiles: #12 (aligned with the ERT transect) shows thaw depths (red line) and hyperbolic reflections interpreted as ice wedges (red dashed lines), while profiles #10 and #11 (parallel to the road) show similar features, with #11 also indicating a possible ice-rich zone (red dashed circle).
The SE–NW ERT inversion profile provides a coarse-scale view to ∼20 m depth along the transect (Fig. 4c). Several high-resistivity zones are evident. One prominent feature, centered at ∼10 m depth in the middle of the profile, exceeds 10,000 Ω m and is interpreted as excess ice (Zone E), likely associated with ice lenses or wedges. Additional ice-rich zones (Zone D, >1000 Ω m) are distributed at ∼2.5, 7.5, and 12 m depths. In contrast, three very low-resistivity zones (<5 Ω m, Zone A) may indicate cryopegs; however, their small size (∼1 m) approaches the resolution limit of ERT, adding uncertainty to this interpretation.
The fine-scale resistivity inversion (Fig. 4d), focused on the upper ∼5.7 m and resistivity values between 100–1000 Ω m, resolves shallow permafrost structure and highlights spatial variability in thaw depth. The deepest thaw zone (>1 m) is observed where the SE–NW transect crosses the gravel spur road – even when accounting for its ∼60 cm elevation above the surrounding tundra, the thaw beneath the road is deeper than in adjacent tundra. While elevated surfaces might reduce thaw by exposing the ground to cooler air, the thermal properties of the gravel pad – specifically its high conductivity and low albedo – enhance heat absorption and transfer into the ground. These effects likely contribute to the observed deepening of the thaw layer beneath the road (Chen et al., 2020; Qi et al., 2012; Walker et al., 2022). This interpretation aligns with modeling and field studies by Schneider von Deimling et al. (2021), who demonstrated that gravel embankments can intensify subsurface warming by replacing insulating peat, clearing snow from the road center, and facilitating greater summer heat penetration.
The shallowest thaw (∼0.2 m) is observed on the southeast (right) side of the road, where polygonal ground appears relatively undisturbed and surface conditions remain intact. In contrast, the northwest (left) side lies between two spur roads – one of which is actively used – and shows visibly smaller polygons and more densely spaced ice-wedge cracks in satellite imagery. This pattern aligns with findings from Walker et al. (2022), who reported that areas within 25 m of gravel roads often experience increased thermokarst activity, altered polygon morphology, and ecological change. The more disturbed surface on the northwest side of the spur road in our study likely reflects similar infrastructure-driven impacts. Here, deeper thaw (∼0.5 m) may result from a combination of altered drainage, surface compaction, and localized warming. Low-resistivity zones detected in this area may correspond to ice wedges, although their signatures are less distinct – possibly due to increased moisture content, reduced ice volume, or recent thermal degradation. These variations in thaw depth are consistent with thaw probe measurements collected along the profile (Fig. 4b).
GPR profile #12, which follows the SE–NW ERT transect (Fig. 4e), further supports the interpretation of thaw depth variability and subsurface structure. It displays multiple vertical hyperbolic reflections – characteristic of ice wedges – resulting from strong dielectric contrasts between ice and surrounding soil. These features align spatially with polygon boundaries visible in satellite imagery (Fig. 4a), reinforcing their interpretation as wedge ice. Thaw depths inferred from this profile range from ∼0.2 m on the southeast and northwest flanks of the road to >1 m directly beneath it, corroborating the ERT results (Fig. 4d) and emphasizing the enhanced thaw associated with the gravel surface.
Additional GPR profiles #10 and #11, which follow the alignment of the spur road but are located outside the raised gravel section (Fig. 4e), reveal thaw depths ranging from ∼0.5 to 1.0 m. These measurements indicate that the thermal influence of gravel infrastructure extends beyond the elevated portion of the road. Both profiles also exhibit hyperbolic reflections characteristic of ice wedges, supporting the presence of ice-rich features throughout the area. Notably, GPR profile #11 shows two anomalies: one near +40 m, marked by minimal reflections and likely corresponding to a ponded or saturated zone with low dielectric contrast; and another near +85 m, where strong reflections suggest the presence of an ice-rich body – possibly an ice wedge or another frozen feature. Thaw depths inferred from these profiles, including areas exceeding 1 m, are consistent with the enhanced thaw previously identified in the SE–NW ERT transect (Fig. 4d).
Thaw probe measurements collected along the SE–NW ERT and GPR #12 profiles (Fig. 4b) ranged from 0.2 m to just under 1 m, closely aligning with geophysical results. The shallowest thaw was found on the south side of the road, where surface disturbance was minimal, while slightly deeper thaw occurred on the north side, adjacent to more visibly altered polygonal ground. Probes placed immediately beside the elevated gravel surface recorded even greater thaw depths, and those inserted directly on the road surface exceeded the penetration limit of the probe – reinforcing ERT and GPR evidence of substantial thaw beneath the road despite its elevation above the surrounding tundra.
Interpretation of the combined datasets indicates clear infrastructure-related impacts at the old spur of Cakeeater Road, even though this section is no longer actively used. ERT and GPR profiles consistently show deeper thaw beneath the road, attributable to the thermal behavior of gravel fill in permafrost regions. While gravel can sometimes offer insulation, in this context it typically enhances heat transfer into the ground due to its high thermal conductivity, low albedo, and tendency to retain moisture (Fortier et al., 2011). Compared to vegetated tundra, gravel absorbs more solar radiation, promoting surface warming. Although gravel can improve drainage and allow cold air infiltration through pore spaces, these cooling effects are often outweighed in compacted roadbeds by enhanced heat absorption and conductive transfer – ultimately deepening the active layer (Schneider von Deimling et al., 2021).
Gravel roads also alter natural hydrology by impeding surface water flow and concentrating meltwater along their margins (Schneider von Deimling et al., 2021). In addition, the raised gravel surface promotes snow drifting and accumulation on the leeward (northwest) side, driven by prevailing ENE winds. A photograph from a nearby site illustrates snow accumulation and meltwater ponding along Imaqsaun Road in May 2025 (Fig. 4a, right). Snow accumulation along road shoulders has been shown to increase winter ground temperatures and active layer thickness (Fortier et al., 2011; Schneider von Deimling et al., 2021), a pattern reflected in our observations near the spur road. The nearby second spur road to the north likely amplifies wind disruption and snow deposition, intensifying these effects. The resulting increase in ground insulation and soil moisture promotes thaw and degradation near road margins – a pattern also observed near snow fences and confirmed by our geophysical and thaw probe data.
Additionally, snowmelt and runoff frequently lead to surface ponding along the road edges, particularly on the leeward side. This ponded water, with its high thermal capacity and conductivity, further enhances ground heat flux and accelerates thaw. These processes are consistent with our field observations of meltwater accumulation near the road edge.
Although the gravel road alters local thermal and moisture regimes, ERT and GPR profiles still detect well-preserved ice-rich features, such as ice-wedge polygons, in the adjacent tundra. Thaw depths between 0.2 and 0.5 m outside the immediate road margins imply that infrastructure-related impacts have not yet propagated more widely into the landscape.
The preservation of ice wedges in the surrounding tundra, despite adjacent disturbance, may indicate that early-stage ecological feedbacks are active. Although not specifically quantified in this study, mechanisms such as plant regrowth, accumulation of organic matter, and drainage improvements – outlined by Jorgenson et al. (2022) – have been shown to promote surface stabilization and ice reformation in disturbed permafrost environments.
Taken together, thaw depth estimates at the Cakeeater spur site derived from ERT, GPR, and thaw-probe measurements are in good agreement and show a consistent pattern of deeper thaw beneath and adjacent to the road and shallower thaw in tundra with undisturbed vegetation. GPR helps to distinguish ice wedges, while ERT resolves deeper subsurface features in the area.
4.3 Permafrost Conditions and Cryoturbation Near the Snow Fence along Cakeeater Road
In 2022, one ERT transect was sampled at the snow fence site along Cakeeater Road, accompanied by a parallel GPR survey. Data collection occurred on 29 August 2022. The ERT profile (Fig. 5a, blue line) spans 163 m with 1 m electrode spacing and crosses the snow fence perpendicularly. The GPR profile (Fig. 5a, green line), acquired along the same alignment, extends 250 m with measurements taken at 1 m intervals, providing broader spatial coverage of the study area.
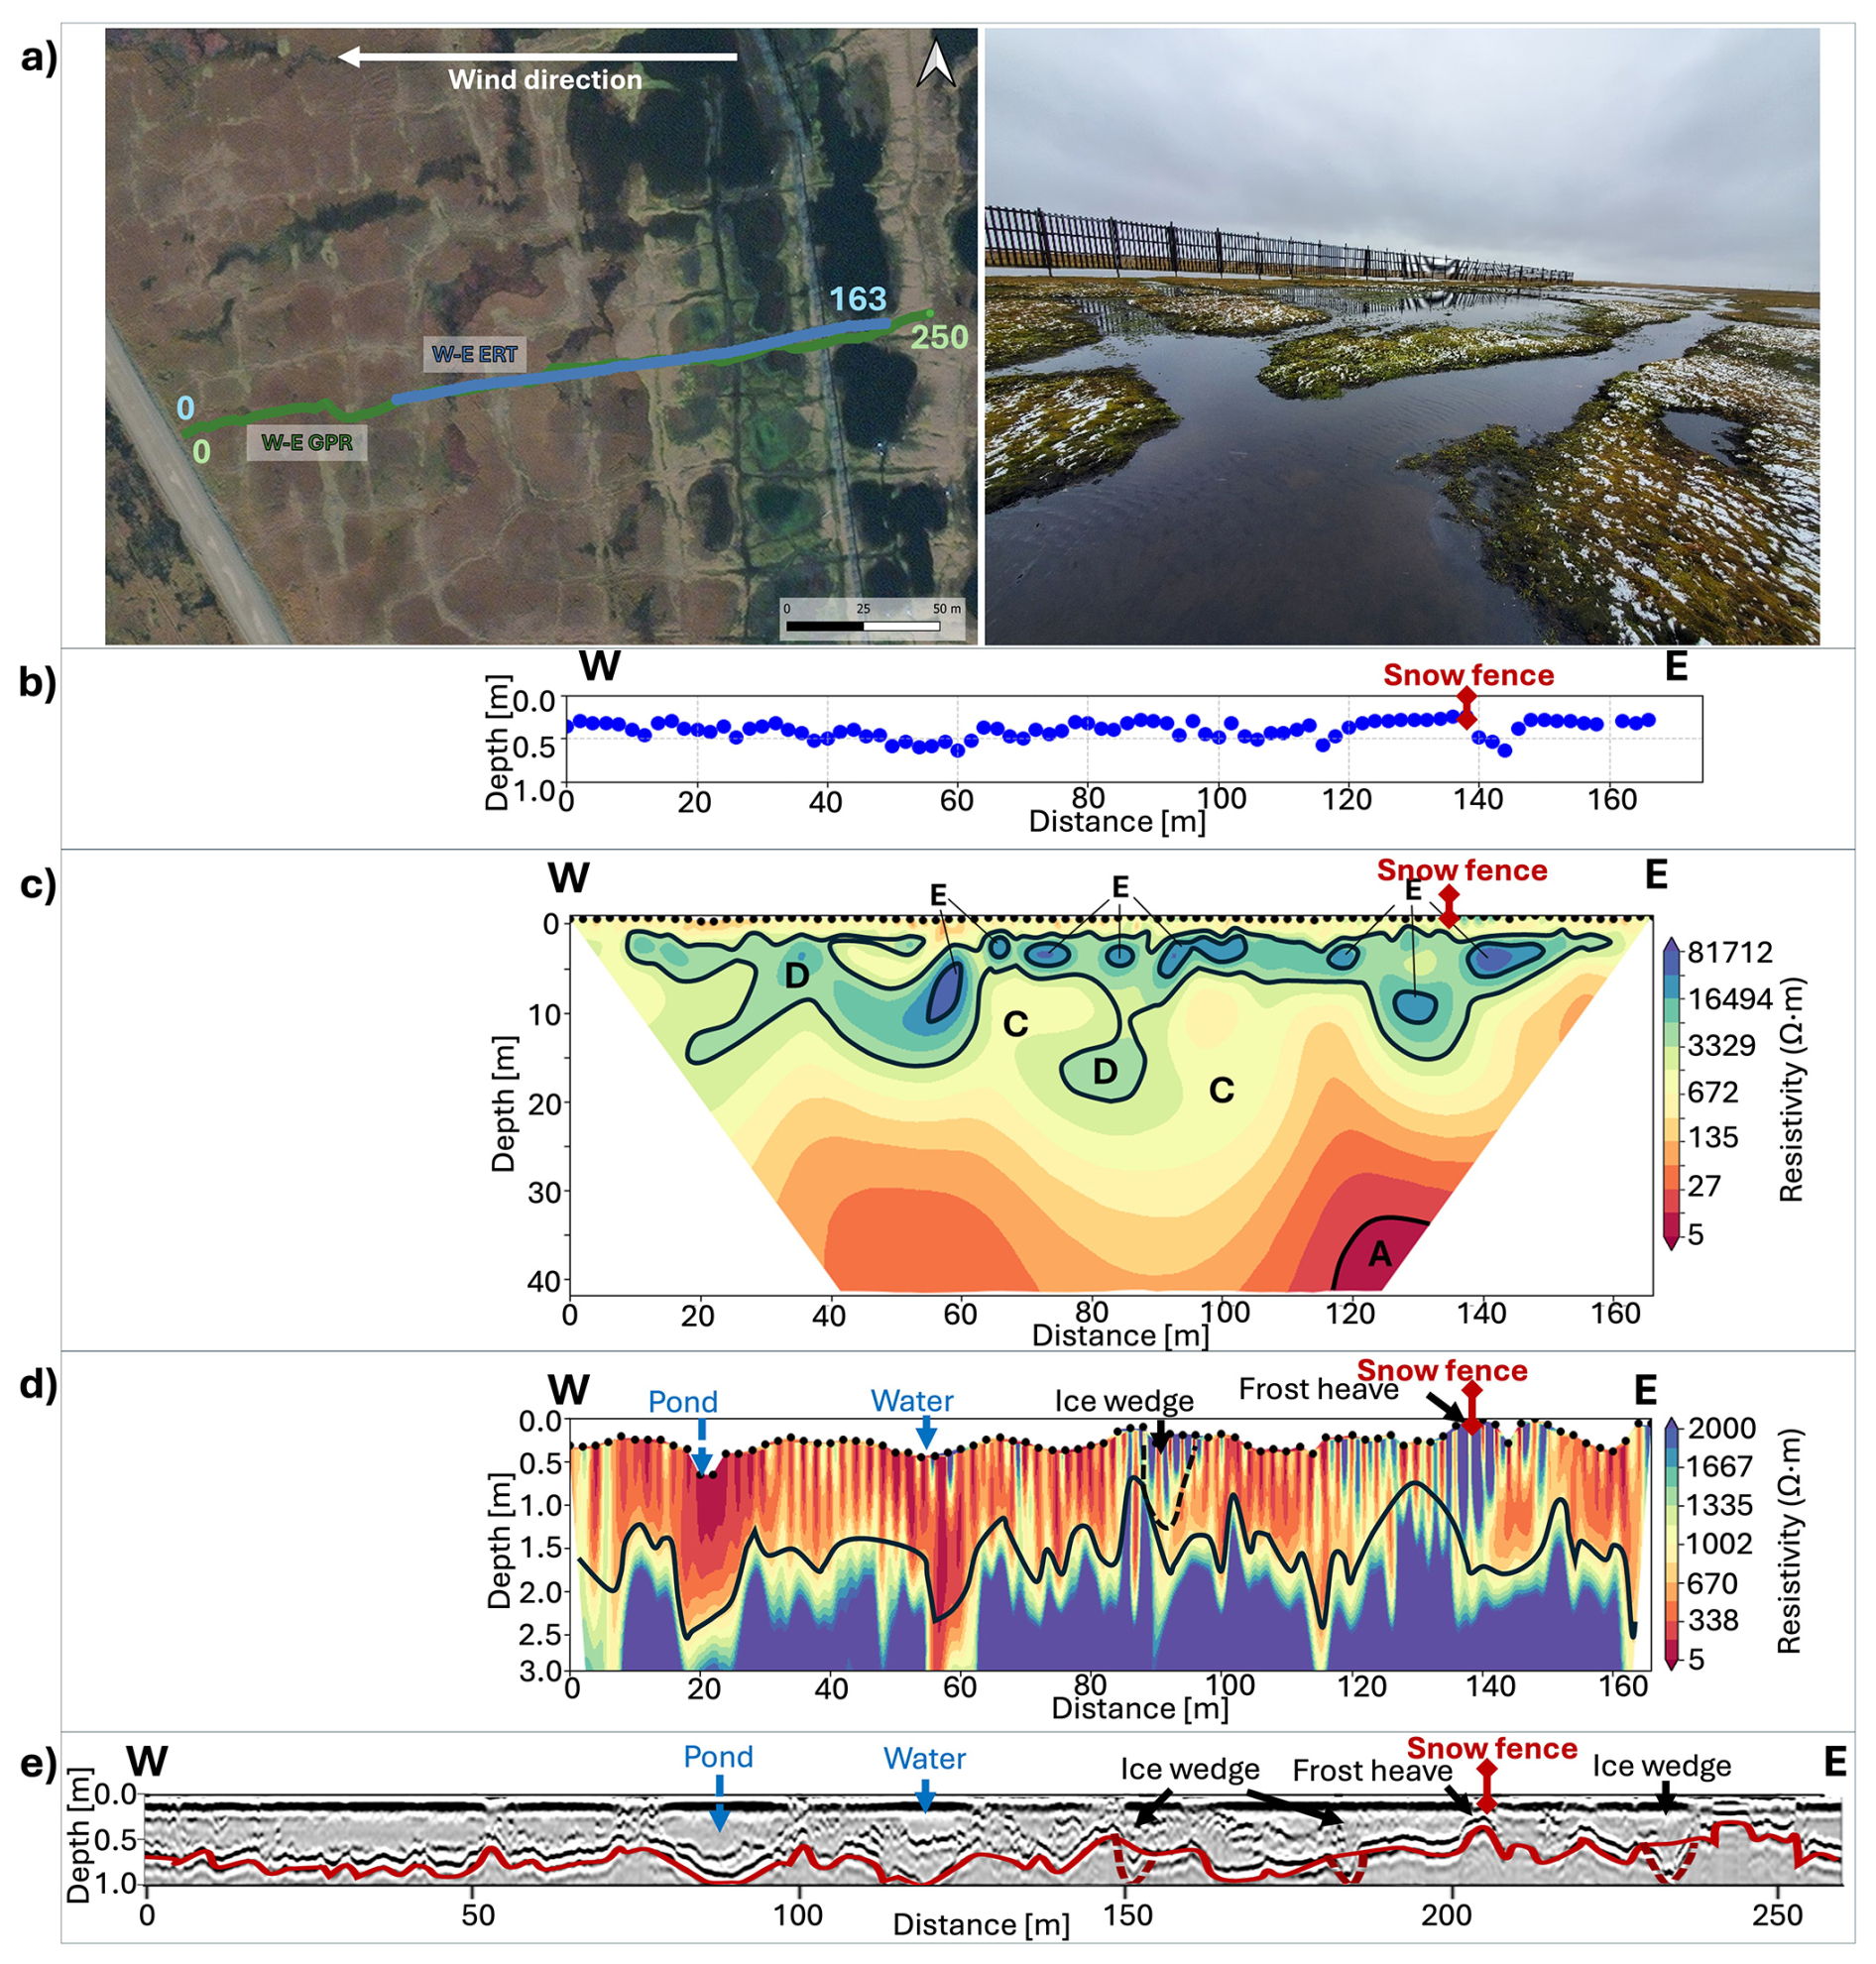
Figure 5(a) Map showing locations of W–E ERT (blue) and GPR (green) profiles at the snow fence site near Cakeeater Road (ESRI satellite imagery, © ESRI), with an inset photograph illustrating site conditions and surroundings; (b) Thaw probe measurements along the ERT profile; (c) Coarse-scale W–E ERT profile (∼0–40 m depth); (d) Fine-scale ERT profile (∼0–3 m depth); (e) GPR profile showing thaw depths (red line) and hyperbolic reflections indicative of ice wedges (red dashed lines).
The W–E ERT inversion profile provides a coarse-scale view to ∼40 m depth along the full transect (Fig. 5c). Several high-resistivity zones (>10 000 Ω m) appear within the upper 10 m and are interpreted as highly ice-rich features, likely representing excess ice such as ice lenses (Zone E). In addition, resistivity values exceeding 1,000 Ω m (Zone D) occur almost continuously between 2 and 10 m depth, indicating widespread ice-rich permafrost.
At depths >30 m, a low-resistivity anomaly (<5 Ω m, Zone A) appears near 120 m along the profile and may suggest the presence of a cryopeg. However, interpretation at this depth remains uncertain due to the reduced resolution and sensitivity of ERT in deeper layers – particularly beneath overlying frozen ground.
The fine-scale ERT profile (∼ top 3 m; Fig. 5d), with resistivity capped at 2000 Ω m, highlights spatial variability in the near-surface permafrost structure. Thaw depths reach ∼0.8 m near 20 m and exceed 1 m around 60 m along the profile – both areas coinciding with surface depressions interpreted as thaw ponds, likely resulting from ice-wedge degradation. A vertical high-resistivity anomaly at ∼90 m may represent an intact ice wedge, while another zone centered beneath the snow fence at ∼140 m shows consistently elevated resistivity throughout the upper profile. This feature, coupled with a slightly raised surface at this location, supports interpretation of localized frost heaving, likely caused by upward ice segregation in a moisture-rich active layer.
The GPR profile (Fig. 5e) similarly indicates deep thaw beneath the thaw ponds, with depths approaching 1 m – consistent with ERT interpretations. The potential ice wedge identified at ∼150 m in the ERT data is clearly resolved as a strong hyperbolic reflection. Additional hyperbolic features near ∼180 and ∼230 m further suggest the presence of wedge ice within the surrounding polygonal tundra.
The shallowest thaw depths were observed on the leeward side of the snow fence and may be associated either with frost heave from localized ice accumulation or with a shallower permafrost table caused by reduced snow insulation near the fence. This interpretation is supported by high resistivity values, elevated surface topography, and hyperbolic GPR reflections. Thaw depths generally increase from the road toward the snow fence and beyond. Between the road and ∼60 m along the transect, average probe depths are deeper, followed by a shallower interval, and then a further increase approaching and extending past the fence. Between the road and the fence, thaw depths range from ∼0.5 to 1 m in the geophysical profiles, while probe measurements range from 0.25 to 0.6 m. In the first thaw pond (∼20 m), the probe indicated ∼0.5 m depth – shallower than the >0.8 m depths inferred from both ERT and GPR. In the second pond (∼60 m), the probe measured ∼0.8 m, closer to geophysical estimates, though ERT and GPR indicated slightly greater depths, possibly reflecting the influence of high water content on the geophysical response. Beyond the snow fence, probe depths generally range between 0.2 and 0.7 m, with the deepest values immediately east of the fence.
Based on the geophysical results, the Snow Fence site is underlain by high-resistivity permafrost, consistent with ice-rich ground. However, several other zones with resistivity >10 000 Ω m are located along the transect, likely indicating excess ice features such as lenses and wedges. The GPR profile corroborates this interpretation, revealing multiple hyperbolic reflections typical of ice wedges within polygonal tundra.
Thaw depths exhibit clear spatial variability influenced by microtopography and surface conditions. Between the road and the snow fence, thaw depths reach ∼1 m beneath degraded polygons and thaw ponds, with an average of ∼ 0.7 m. Beyond the snow fence, depths decrease to ∼0.5 m on average and remain <0.7 m. These observations align with field notes showing ponding and sparse vegetation – hallmarks of polygon degradation – in the section between the road and snow fence (Fig. 5a).
Snow fences trap wind-blown snow by disrupting airflow and causing deposition, which produces asymmetrical drifts typically shaped like a skewed bell curve, with maximum accumulation forming a few meters downwind of the fence (Hinkel and Hurd, 2006). These thick drifts develop after the active layer has refrozen in early winter and reduce heat loss from the ground during the coldest months. The resulting insulation leads to warmer winter ground temperatures and can promote increases in the active layer depth in summer; however, this effect may be offset by the higher albedo of snow and the later melt associated with thicker drifts (Yershov, 2004). Meltwater from accumulated snow can saturate the active layer and promote surface ponding during the thaw season.
At this site, the shallowest thaw depths were observed immediately to the west of the snow fence. Snow depth measurements from May 2025 indicate that the deepest accumulation – up to ∼2 m – occurred west of the fence, while snow depths dropped sharply upwind. This pattern likely reflects prolonged, high-albedo snow cover west of the fence reducing spring insolation, while meltwater from the thickest part of the drift flowed eastward and ponded, increasing thermal uptake of the exposed tundra and deepening the active layer.
These melt-season effects – especially increased moisture from deeper snowpack – can enhance ground thaw in adjacent permafrost due to the higher thermal conductivity and heat capacity of water. Saturated soils, combined with freeze–thaw cycling, may also promote frost heave through the formation of seasonal ice lenses and localized surface uplift. Elevated resistivity zones and slight topographic rises observed in the geophysical data near the fence are consistent with these processes.
The thermal effects of snow are seasonally complex. Snow acts as an effective insulator, reducing ground heat loss in winter despite its high reflectivity. In spring, thick snowpacks delay ground warming by impeding the transfer of air temperatures to the surface, which – combined with persistent high albedo – can slow the onset of thaw. As melting progresses, however, deep snowdrifts become sustained sources of meltwater, and in adjacent exposed tundra this increased soil moisture can promote thaw through the high thermal conductivity and heat capacity of water. These combined effects contribute to pronounced spatial variability in thaw depth, particularly where snow distribution is modified by infrastructure such as roads and fences. Prior studies in Utqiaġvik have demonstrated that snowdrift accumulation near fences alters ground temperatures and promotes localized thaw and subsidence (Hinkel and Hurd, 2006; Kim et al., 2025). The degradation observed over the ∼130 m between the road and the snow fence likely reflects infrastructure-modified snow and meltwater regimes. Less-intense degradation is also evident on the east side, most likely resulting from the smaller snow drift that typically forms upwind of the fence. While these findings are based on one season of data, the mechanisms observed – such as increased snow accumulation and meltwater effects – are expected to intensify under projected trends of rising cold-season precipitation in a warming Arctic.
The adjacent gravel-surfaced road likely further contributes to permafrost degradation by impeding natural drainage, resulting in surface ponding and elevated soil moisture. Increased water content raises the soil thermal conductivity, enabling more efficient penetration of temperature fluctuations into the ground. Similar effects were observed near the old spur of Cakeeater Road, underscoring the consistent influence of gravel infrastructure on subsurface thermal regimes. On average, thaw depth decreases from the road – where the maximum thaw is observed – toward the snow fence. In the zone between the road and the fence, thick snow drifts and disrupted drainage appear to promote permafrost degradation. Altogether, the combined effects of snow redistribution, meltwater accumulation, and altered drainage explain the heterogeneous thaw pattern, with marked degradation between the road and the fence, and less intense degradation near and beyond the fence.
These findings indicate that the Snow Fence site is influenced by a combination of natural processes and infrastructure-induced changes. While areas windward of the fence appear less degraded, the zone between the road and the fence exhibits clear signs of ice-wedge degradation, deeper thaw, and modified surface and subsurface conditions. Overall, thaw depths inferred from ERT and GPR broadly agree with probe measurements, especially in the undisturbed tundra (with natural vegetation cover and water flow) and east of the fence, but ERT indicates somewhat greater depths in the thaw ponds, where elevated moisture content affects resistivity values. Taken together, ERT, GPR, and thaw probing provide a coherent picture of spatial thaw variability, with ERT also resolving deeper ice-rich zones and GPR capturing near-surface thaw and the locations of ice wedges.
4.4 Barrow Environmental Observatory (BEO) Site: Natural Polygonal and Frost-Heave Terrain
ERT and GPR surveys were conducted at the Barrow Environmental Observatory (BEO) site on 9 August 2023. Both ERT (blue line) and GPR (green line) profiles extended for 163 m with 1 m electrode and measurement spacing, as shown in Fig. 6a.
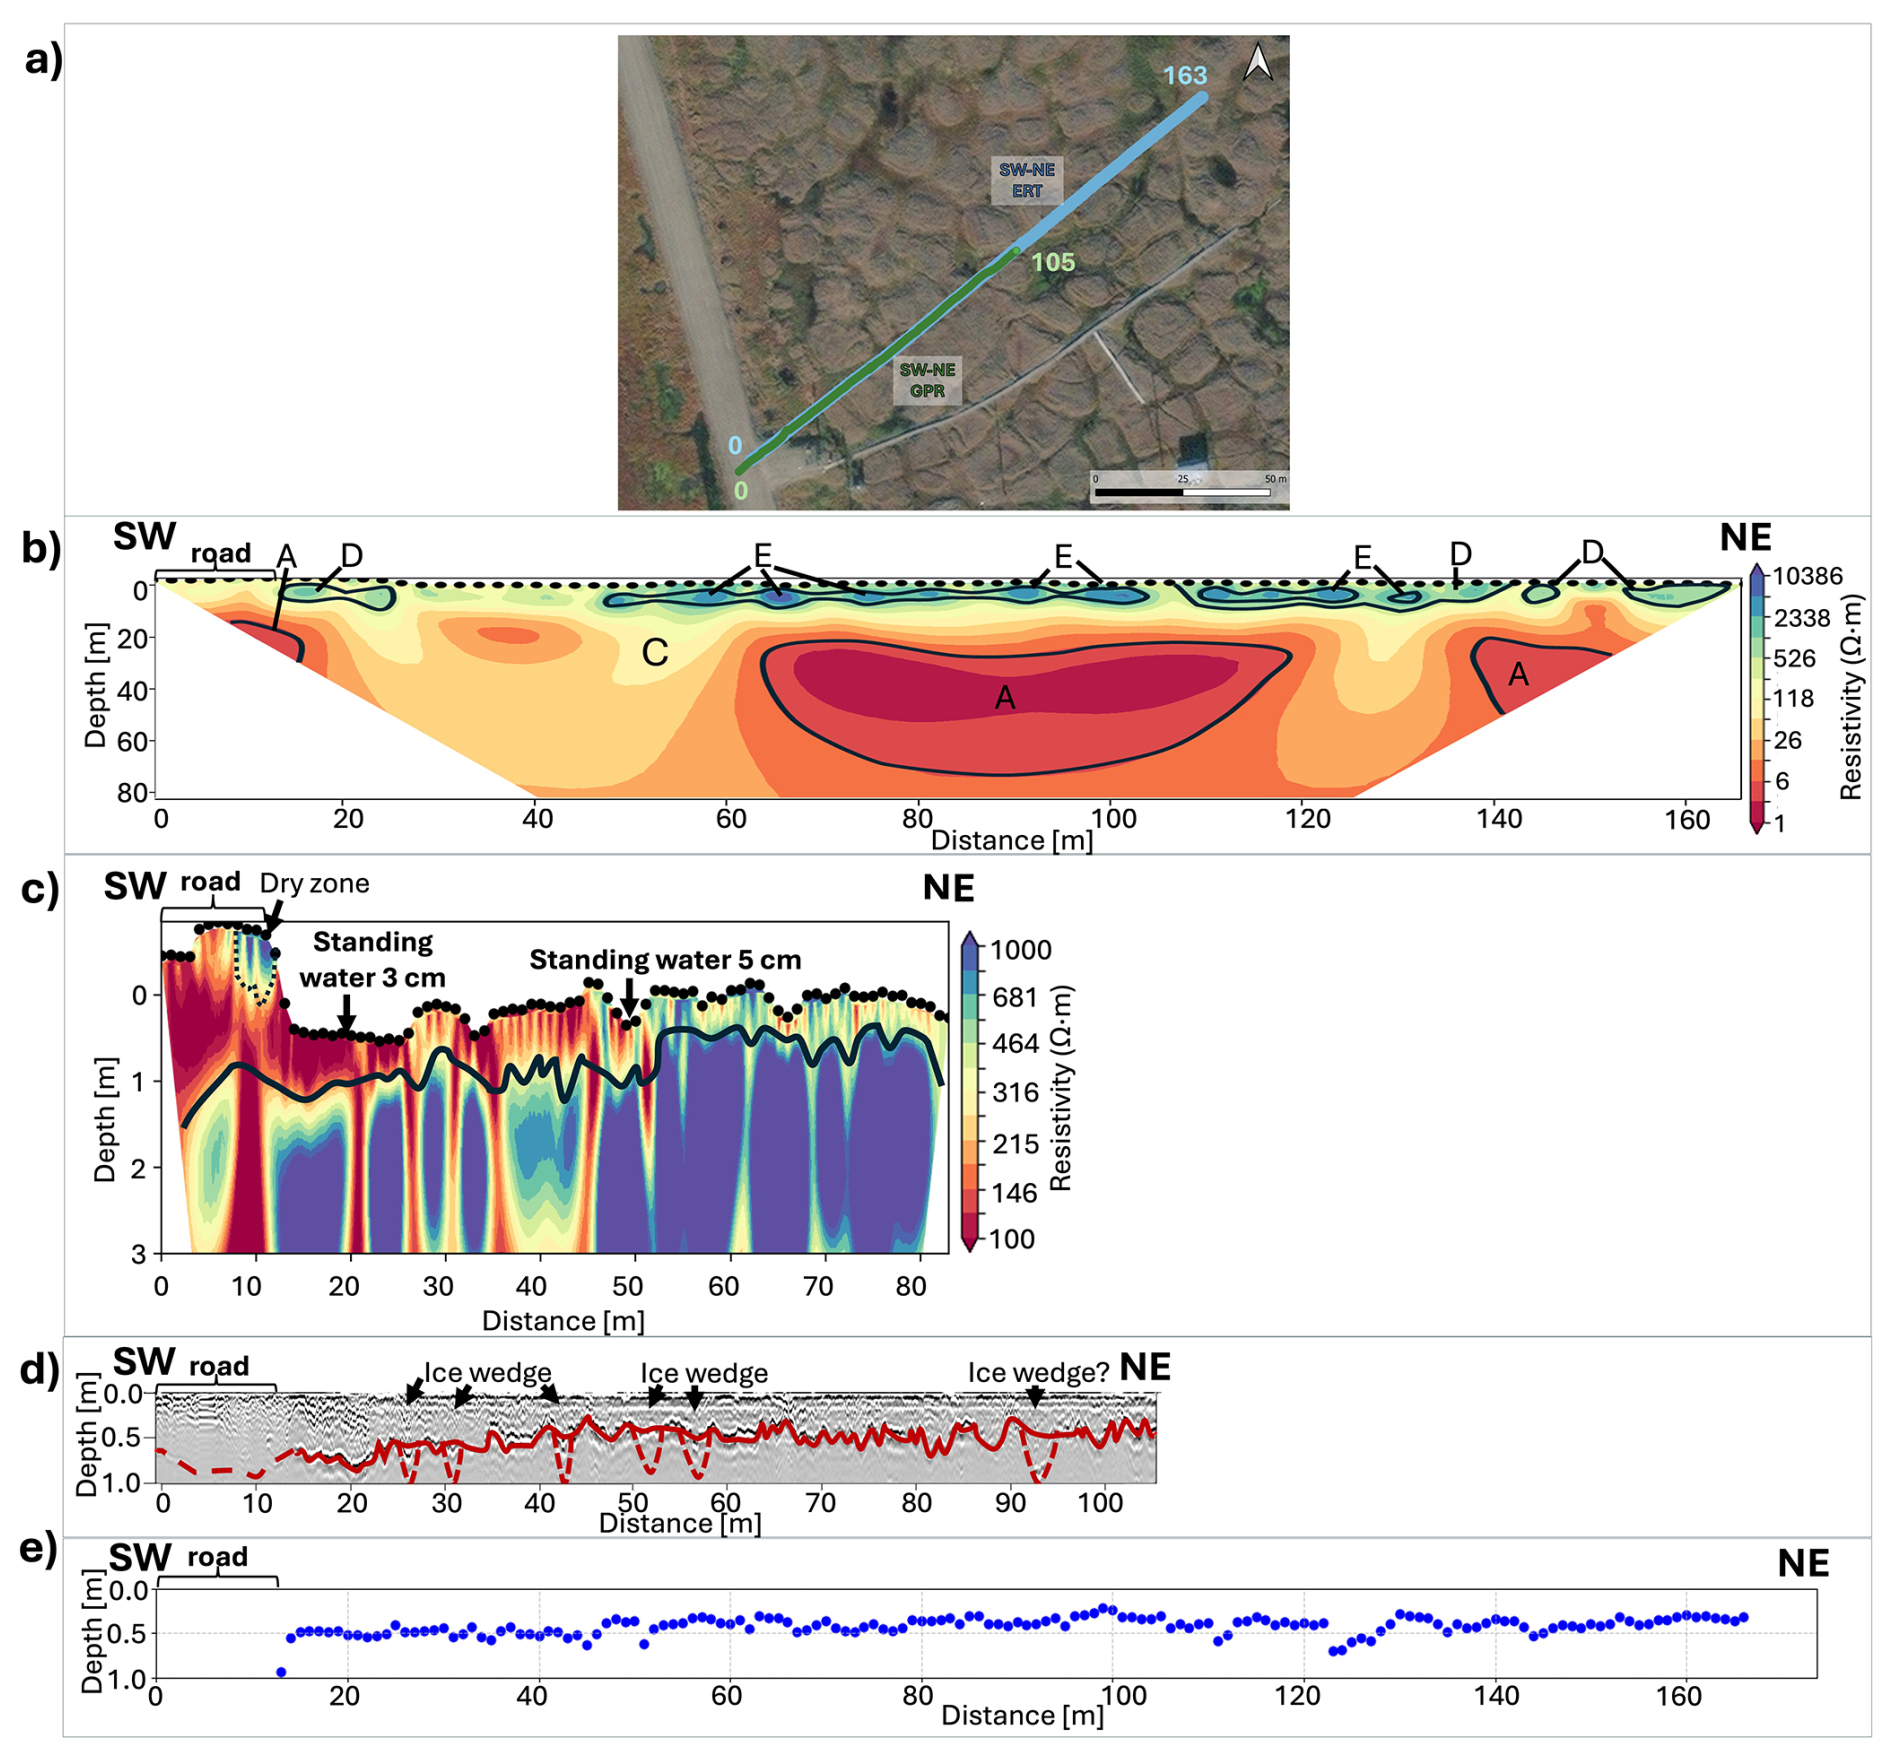
Figure 6(a) Location of SW–NE ERT (blue) and GPR (green) profiles at the BEO site in Utqiaġvik, Alaska (ESRI satellite imagery, © ESRI); SW–NE ERT profile: (b) Coarse-scale view (∼0–40 m depth along the entire profile); (c) Fine-scale view (∼0–2 m depth, from 0 to 82 m distance along the profile); (d)SW–NE GPR profile showing thaw depths (solid red line) and hyperbolic reflections interpreted as ice wedges (red dashed lines); (e) Thaw probe measurements along the ERT profile.
The SW–NE ERT inversion profile (Fig. 6b–c) includes a coarse-scale view (∼40 m depth, Fig. 6b) and a small-scale view (∼3 m from 0 to 82 m, Fig. 6c). In the coarse-scale cross-section, the upper 5 m shows consistently high resistivity values (1000–10 000 Ω m), with localized zones exceeding 10 000 Ω m – interpreted as ice-rich permafrost (Zone D) and excess ice features such as ice lenses (Zone E).
Very low resistivity zones (<5 Ω m) are also present and may represent cryopegs. One circular anomaly (∼5 m diameter) is located at ∼10 m along the transect and ∼15 m depth. A broader zone between 65 and 120 m extends from ∼ 10 to 30 m depth, spanning ∼55 m horizontally and ∼20 m vertically. Another low-resistivity feature is located between 135 and 155 m at 10–25 m depth.
The depth-focused ERT section (Fig. 6c) highlights thaw variability across the site. The deepest thaw (>1 m) occurs beneath and adjacent to the road, which is raised ∼0.8 m above the surrounding tundra. The roadbed shows elevated resistivity, likely due to dry gravel. Near the road, low-resistivity zones reflect standing water observed during fieldwork. From the road to ∼50 m, the profile crosses degrading ice-wedge polygons. These polygon boundaries are also visible in satellite imagery (Fig. 6a), aligning with low-resistivity zones interpreted as thawing ice wedges and thaw ponds.
Thaw depths in this segment range from ∼0.6 to >1 m, indicating advanced permafrost degradation. Beyond 50 m, the landscape transitions into frost-heave-dominated terrain with shallower thaw depths (0.2–0.6 m).
The SW–NE GPR profile (Fig. 6d) confirms deep thaw near the road, though signal quality is reduced by gravel and ponded surface water. Strong reflections are lacking in this section, but several hyperbolic reflections – indicative of ice wedges – are evident up to 40 m along the profile and correspond well with features seen in the ERT profile. In this zone, thaw depths range from ∼0.5 to 1 m. Beyond 45 m, the thaw depth drops to 0.2–0.7 m, consistent with the frost-heave terrain and ERT results. A distinct hyperbolic reflection near 90 m may correspond to an additional ice wedge, not clearly resolved in ERT but aligned with polygonal surface cracking visible in satellite imagery (Fig. 6a).
Physical thaw probing (Fig. 6e) reveals substantial variability in thaw depth across the BEO site. Within the first 50 m of the transect – corresponding to the ice-wedge polygon zone – thaw depths ranged from 0.4 to >1 m, with the deepest values near thaw ponds and degraded wedges. Beyond 50 m, in the frost-heave-dominated section, thaw depths generally decrease to 0.2–0.5 m, with only isolated spots exceeding 0.5 m (∼0.7 m max). This spatial pattern aligns closely with ERT and GPR observations (Fig. 6c–d).
Interpretation of geophysical and probe data indicates that the site is underlain by ice-rich permafrost, including ice lenses and ice wedges. The transition from ice-wedge polygon terrain near the road to frost-heave terrain further away is confirmed by field observations and satellite imagery (Fig. 6a). Strong hyperbolic reflections in the first 40 m of the GPR profile (Fig. 6d) confirm the presence of ice wedges, while a single potential wedge appears farther along the transect – possibly a relict feature from earlier polygonal development. Overall, thaw depths inferred from ERT and GPR broadly agree with probe measurements across both the polygonal and frost-heave segments, with the greatest depths consistently associated with ponded and degraded polygon areas near the road. Taken together, ERT, GPR, and thaw probing provide a coherent picture of thaw variability at the BEO site, with ERT resolving deeper ice-rich zones, GPR highlighting near-surface thaw and ice-wedge locations, and probing providing point-scale ground truth for thaw depth.
Thaw depth variability reflects multiple interacting factors. In the polygonal zone, wedge degradation and pond formation increase surface water coverage, which enhances ground heat transfer due to the high thermal conductivity of water. Loss of surface vegetation further reduces insulation, accelerating thaw. Conversely, frost-heave terrain is drier, elevated, and retains vegetation, which supports shallower thaw by maintaining lower surface energy fluxes.
Additionally, the nearby gravel road influences local permafrost. As at the Snow Fence and Cakeeater Road sites, road-induced changes to surface hydrology likely cause ponding and deeper thaw in adjacent areas. This underscores how both natural features and infrastructure shape subsurface thermal and hydrological conditions. Together, these observations illustrate the complex interactions among permafrost landforms, seasonal processes, and infrastructure in governing permafrost response to environmental change in Arctic landscapes.
This study provides an integrated geophysical assessment of near-surface permafrost characteristics within an Arctic city and examines how contrasting land use types (residential buildings, gravel roads, snow fences, and a local tundra reference site) alter near-surface permafrost structure and active layer thickness. By integrating ERT, GPR, and thaw probing surveys across contrasting land use types at four sites, we developed a unique dataset that reveals the structural variability of permafrost in Utqiaġvik, Alaska, and how infrastructure and local environmental conditions can jointly influence the active layer depth through a complex interplay of surface process that affect the thermal balance at the ground surface.
At all four sites, variations in active layer depth were consistently linked to land use and surface characteristics. Ice-wedge polygon terrain near infrastructure – particularly roads and snow fences – showed the deepest thaw (>0.5–1.0 m), with low to moderate resistivity in ERT (10–1000 Ω m) and disrupted GPR reflections, indicating wedge degradation and water-saturated soils. In contrast, frost-heave-dominated terrain with intact vegetation and natural drainage maintained shallower thaw (0.2–0.5 m) and high resistivity (>1000 Ω m), consistent with stable, ice-rich permafrost. Snow thickness variations, and pooling of meltwater caused by infrastructure emerged as a key driver of active layer depth variability, producing sharp contrasts between zones of enhanced thaw and frost-heave development. Our data showed that not only do elevated buildings decouple anthropogenic heat impacts on underlying permafrost, but they can also foster permafrost aggradation through self-shading – but could also promote degradation at their margins through meltwater accumulation from roofs and snow accumulation.
Building on these results, repeat or real-time ERT–GPR monitoring combined with thaw probing can form the foundation of a robust permafrost monitoring strategy. Across all sites, thaw depths inferred from ERT and GPR generally agreed with ground truth thaw-probe measurements, with the largest differences in water-saturated thaw ponds and dry gravel pads where geophysical sensitivity is reduced. Taken together, these methods provide a consistent yet complementary view of near-surface permafrost, where ERT constrains subsurface features, GPR resolves the geometry of thaw and ice wedge location, and thaw probing supplies point-scale ground truth for thaw depth. Other methods – such as borehole observations, snow depth measurements, and remote sensing – can complement these efforts to track thaw fronts, frost heave, and other near-surface permafrost changes over time. Integrating these datasets will help identify ice-rich zones and thaw-prone areas, supporting risk-informed siting, maintenance, and adaptation. Achieving this vision will require strong partnerships with local communities, as demonstrated in Utqiaġvik, where collaboration with tribal and private landowners was essential for access and sustained observation.
The raw electrical resistivity tomography (ERT), ground-penetrating radar (GPR), and thaw-probe datasets collected in Utqiaġvik, Alaska (2021–2023) are archived at Zenodo (https://doi.org/10.5281/zenodo.17096203; Ekimova et al., 2025). GPR data were processed with GPRPy and ERT data were inverted with ResIPy (both open-source Python packages).
Conceptualization: VE; Methodology: TS, VE; Investigation: VE, MAN, TS; Formal analysis: VE; Data curation: MAN; Visualization: VE, MAN, TS; Writing – original draft: VE; Writing – review & editing: MAN, TS, TAD, HEE, MGJ, VE; Supervision: TAD, HEE, MGJ; Funding acquisition/Project administration: HEE, MGJ.
The contact author has declared that none of the authors has any competing interests.
Publisher's note: Copernicus Publications remains neutral with regard to jurisdictional claims made in the text, published maps, institutional affiliations, or any other geographical representation in this paper. The authors bear the ultimate responsibility for providing appropriate place names. Views expressed in the text are those of the authors and do not necessarily reflect the views of the publisher.
We gratefully acknowledge the support of the tribal and private landowners in Utqiaġvik, Alaska, whose collaboration was essential for site access and long-term geophysical monitoring. We thank the staff of UIC Science, LLC, for logistical support and assistance during fieldwork and for access to local research infrastructure. Fieldwork benefited from geophysical equipment and survey support provided by the Cold Regions Research and Engineering Laboratory (CRREL). Special thanks to Lauren Bosche, Stephanie Saari, and Arthur Gelvin for their expertise and assistance. We also thank the anonymous reviewers for constructive feedback that improved the manuscript.
This research was supported by the National Science Foundation (award no. 2022639) and by the University of Virginia Environmental Institute through the Strategic Investment Fund.
This paper was edited by Adam Booth and reviewed by two anonymous referees.
Annan, A. P., Davis, J. L., and Scott, W. J.: Impulse radar wide angle reflection and refraction sounding in permafrost, Geological Survey of Canada Paper, 75, 335–341, 1975.
Biskaborn, B. K., Smith, S. L., Noetzli, J., Matthes, H., Vieira, G., Streletskiy, D. A., Schoeneich, P., Romanovsky, V. E., Lewkowicz, A. G., Abramov, A., Allard, M., Boike, J., Cable, W. L., Christiansen, H. H., Delaloye, R., Diekmann, B., Drozdov, D., Etzelmüller, B., Grosse, G., Guglielmin, M., Ingeman-Nielsen, T., Isaksen, K., Ishikawa, M., Johansson, M., Johannsson, H., Joo, A., Kaverin, D., Kholodov, A., Konstantinov, P., Kröger, T., Lambiel, C., Lanckman, J.-P., Luo, D., Malkova, G., Meiklejohn, I., Moskalenko, N., Oliva, M., Phillips, M., Ramos, M., Sannel, A. B. K., Sergeev, D., Seybold, C., Skryabin, P., Vasiliev, A., Wu, Q., Yoshikawa, K., Zheleznyak, M., and Lantuit, H.: Permafrost is warming at a global scale, Nat. Commun., 10, 264, https://doi.org/10.1038/s41467-018-08240-4, 2019.
Black, R. F.: Gubik formation of Quaternary age in northern Alaska, in: Exploration of naval petroleum reserve No. 4 and adjacent areas, Northern Alaska, 1944–53. Part 2. Regional studies, US Government Printing Office, Washington, US, 1964.
Blanchy, G., Saneiyan, S., Boyd, J., McLachlan, P., and Binley, A.: ResIPy, an intuitive open source software for complex geoelectrical inversion/modeling, Comput. Geosci., 137, 104423, https://doi.org/10.1016/j.cageo.2020.104423, 2020.
Bobrov, N., Titov, A., and Krekhov, A.: Delineation of underbed talik in the Lena River delta with the use of geophysics – results of GPR, TEM and ERT measurements, in: Theory and Methods of Polar Science: Proceedings of International youth scientific conference on the polar geodesy, glaciology, hydrology and geophysics, edited by: Popov, S. V., Gavrilkina, S. A., and Pryakhina, G. V., St. Petersburg State University, St. Petersburg, Russia, 60–68, ISBN 978-5-9651-1154-1, 2018.
Boike, J., Chadburn, S., Martin, J., Zwieback, S., Althuizen, I. H. J., Anselm, N., Cai, L., Coulombe, S., Lee, H., Liljedahl, A. K., Schneebeli, M., Sjöberg, Y., Smith, N., Smith, S. L., Streletskiy, D. A., Stuenzi, S. M., Westermann, S., and Wilcox, E. J.: Standardized monitoring of permafrost thaw: a user-friendly, multiparameter protocol, Arct. Sci., 8, 153–182, https://doi.org/10.1139/as-2021-0007, 2022.
Brandt, O., Langley, K., Kohler, J., and Hamran, S. E.: Detection of buried ice and sediment layers in permafrost using multi-frequency Ground Penetrating Radar: A case examination on Svalbard, Remote Sens. Environ., 111, 212–227, https://doi.org/10.1016/j.rse.2007.03.025, 2007.
Brown, J.: Ionic concentration gradients in permafrost, Barrow, Alaska, Corps of Engineers, US Army, Cold Regions Research and Engineering Laboratory, Hanover, US, Research Report 272, 25 pp., 1969.
Buddo, I., Misyurkeeva, N., Shelokhov, I., Shein, A., Sankov, V., Rybchenko, A., Dobrynina, A., Nezhdanov, A., Parfeevets, A., Lebedeva, M., Kadetova, A., Smirnov, A., Gutareva, O., Chernikh, A., Shashkeeva, L., and Kraev, G.: Modeling of Explosive Pingo-like Structures and Fluid-Dynamic Processes in the Arctic Permafrost: Workflow Based on Integrated Geophysical, Geocryological, and Analytical Data, Remote Sens. (Basel), 16, 2948, https://doi.org/10.3390/rs16162948, 2024.
Bunnell, F. L., MacLean Jr., S. F., and Brown, J.: Barrow, Alaska, USA, Ecological Bulletins, 73–124, 1975.
Chen, L., Fortier, D., McKenzie, J. M., and Sliger, M.: Impact of heat advection on the thermal regime of roads built on permafrost, Hydrol. Process., 34, 1647–1664, https://doi.org/10.1002/hyp.13688, 2020.
Chuvilin, E., Sokolova, N., and Bukhanov, B.: Changes in Unfrozen Water Contents in Warming Permafrost Soils, Geosciences (Basel), 12, 253, https://doi.org/10.3390/geosciences12060253, 2022.
Dafflon, B., Hubbard, S. S., Ulrich, C., Peterson, J. E., Wainwright, H., and Wu, Y.: Estimating active layer, ice-wedge, and permafrost property distributions in Arctic ecosystem using electrical conductivity imaging, in: SEG Technical Program Expanded Abstracts 2013, 4444–4449, https://doi.org/10.1190/segam2013-0787.1, 2013.
Dafflon, B., Soom, F., Peterson, J., and Hubbard, S.: Frost Table Elevation across a Low-Centered and a High-Centered Polygon, Mapped using Ground Penetrating Radar, Utqiagvik (Barrow), Alaska, 2015, https://doi.org/10.5440/1575055, 2020.
Daniels, D.: Ground Penetrating Radar, 2nd edn., edited by: Daniels, D. J., Institution of Engineering and Technology, London, UK, 752 pp., https://doi.org/10.1049/PBRA015E, 2004.
Douglas, T. A., Torre Jorgenson, M., Brown, D. R. N., Campbell, S. W., Hiemstra, C. A., Saari, S. P., Bjella, K., and Liljedahl, A. K.: Degrading permafrost mapped with electrical resistivity tomography, airborne imagery and LiDAR, and seasonal thaw measurements, Geophysics, 81, WA71–WA85, https://doi.org/10.1190/GEO2015-0149.1, 2016.
Douglas, T. A., Jorgenson, M. T., Sullivan, T., and Zhang, C.: Comparing thaw probing, electrical resistivity tomography, and airborne lidar to quantify lateral and vertical thaw in rapidly degrading boreal permafrost, The Cryosphere, 19, 3991–4009, https://doi.org/10.5194/tc-19-3991-2025, 2025.
Edemsky, D. E., Tumskoy, V. E., and Prokopovich, I. V.: Ground Penetrating Radar Survey of Arctic Polygonal Wedge Structures, Russian Geology and Geophysics, 65, 767–778, https://doi.org/10.2113/RGG20234628, 2024.
Ekimova, V., Sullivan, T., Nelson, M., Epstein, H., Douglas, T., and Jull, M.: Utqiaġvik permafrost geophysics datasets (2021–2023), Zenodo [data set], https://doi.org/10.5281/zenodo.17096203, 2025.
EPA: Climate Change Indicators: Permafrost, https://permafrost.gi.alaska.edu/sites/default/files/TSP_manual.pdf (last access: 29 July 2025), December 2024.
ESRI: Satellite imagery basemap, ArcGIS Online (accessed via QGIS), https://www.arcgis.com/home/item.html?id=30e5fe3149c34df1ba922e6f5bbf808f (last access: 20 December 2024), 2024.
Farquharson, L. M., Mann, D. H., Grosse, G., Jones, B. M., and Romanovsky, V. E.: Spatial distribution of thermokarst terrain in Arctic Alaska, Geomorphology, 273, 116–133, https://doi.org/10.1016/j.geomorph.2016.08.007, 2016.
Fortier, P., Young, N. L., Lemieux, J., Walvoord, M. A., and Fortier, R.: Long-Term, High-Resolution Permafrost Monitoring Reveals Coupled Energy Balance and Hydrogeologic Controls on Talik Dynamics Near Umiujaq (Nunavik, Québec, Canada), Water Resour. Res., 59, https://doi.org/10.1029/2022WR032456, 2023.
Fortier, R., LeBlanc, A.-M., and Yu, W.: Impacts of permafrost degradation on a road embankment at Umiujaq in Nunavik (Quebec), Canada, Canadian Geotechnical Journal, 48, 720–740, https://doi.org/10.1139/t10-101, 2011.
Frolov, V.: Some Problems of Buildings and Structures Service Within Permafrost Area, Procedia Eng., 165, 385–393, https://doi.org/10.1016/j.proeng.2016.11.714, 2016.
Grosse, G., Romanovsky, V., Jorgenson, T., Anthony, K. W., Brown, J., and Overduin, P. P.: Vulnerability and Feedbacks of Permafrost to Climate Change, Eos, Transactions American Geophysical Union, 92, 73–74, https://doi.org/10.1029/2011EO090001, 2011.
Gusmeroli, A., Liu, L., Schaefer, K., Zhang, T., Schaefer, T., and Grosse, G.: Active Layer Stratigraphy and Organic Layer Thickness at a Thermokarst Site in Arctic Alaska Identified Using Ground Penetrating Radar, Arct. Antarct. Alp. Res., 47, 195–202, https://doi.org/10.1657/AAAR00C-13-301, 2015.
Hauck, C. and Kneisel, C.: Applied Geophysics in Periglacial Environments, edited by: Hauck, C. and Kneisel, C., Cambridge University Press, 248 pp., https://doi.org/10.1017/CBO9780511535628, 2008.
Herring, T., Lewkowicz, A. G., Hauck, C., Hilbich, C., Mollaret, C., Oldenborger, G. A., Uhlemann, S., Farzamian, M., Calmels, F., and Scandroglio, R.: Best practices for using electrical resistivity tomography to investigate permafrost, Permafr. Periglac. Process., 34, 494–512, https://doi.org/10.1002/ppp.2207, 2023.
Hinkel, K. and Nelson, F.: Spatial and temporal patterns of active layer thickness at Circumpolar Active Layer Monitoring (CALM) sites in northern Alaska, 1995–2000, J. Geophys. Res.-Atmos., 108, https://doi.org/10.1029/2001JD000927, 2003.
Hinkel, K. M. and Hurd, J. K.: Permafrost Destabilization and Thermokarst Following Snow Fence Installation, Barrow, Alaska, U.S.A., Arct. Antarct. Alp. Res., 38, 530–539, https://doi.org/10.1657/1523-0430(2006)38[530:PDATFS]2.0.CO;2, 2006.
Hinkel, K. M., Doolittle, J. A., Bockheim, J. G., Nelson, F. E., Paetzold, R., Kimble, J. M., and Travis, R.: Detection of subsurface permafrost features with ground-penetrating radar, Barrow, Alaska, Permafr. Periglac. Process., 12, 179–190, https://doi.org/10.1002/ppp.369, 2001.
Hjort, J., Streletskiy, D., Doré, G., Wu, Q., Bjella, K., and Luoto, M.: Impacts of permafrost degradation on infrastructure, Nat. Rev. Earth Environ., 3, 24–38, https://doi.org/10.1038/s43017-021-00247-8, 2022.
Hoekstra, P., Sellmann, P. V., and Delaney, A.: Ground and airborne resistivity surveys of permafrost near Fairbanks, Alaska, Geophysics, 40, 641–656, https://doi.org/10.1190/1.1440555, 1975.
Hopkins, D. M. and Karlstrom, T. N.: Permafrost and ground water in Alaska, U.S. Geological Survey Professional Paper (264-F), US Government Printing Office, Washington, DC, US, 1955.
Ingeman-Nielsen, T., Tomaškovičo vá, S., Larsen, S. H., Aparício, S. F., and Gori, P.: Surface Geophysical Measurements for Locating and Mapping Ice-Wedges, in: Cold Regions Engineering 2012: Sustainable Infrastructure Development in a Changing Cold Environment, American Society of Civil Engineers, Reston, VA, 634–643, https://doi.org/10.1061/9780784412473.063, 2012.
Iwahana, G., Cooper, Z. S., Carpenter, S. D., Deming, J. W., and Eicken, H.: Intra-ice and intra-sediment cryopeg brine occurrence in permafrost near Utqiaġvik (Barrow), Permafr. Periglac. Process., 32, 427–446, https://doi.org/10.1002/ppp.2101, 2021.
Jafarov, E. E., Parsekian, A. D., Schaefer, K., Liu, L., Chen, A. C., Panda, S. K., and Zhang, T.: Estimating active layer thickness and volumetric water content from ground penetrating radar measurements in Barrow, Alaska, Geosci. Data J., 4, 72–79, https://doi.org/10.1002/gdj3.49, 2017.
Jol, H. M.: Ground Penetrating Radar Theory and Applications, edited by: Jol, H. M., Elsevier, Slovenia, 544 pp., ISBN 9780444533487/0444533486, 2008.
Jorgenson, M. T., Racine, C. H., Walters, J. C., and Osterkamp, T. E.: Permafrost degradation and ecological changes associated with a warming climate in central Alaska, Clim. Change, 48, 551–579, https://doi.org/10.1023/A:1005667424292, 2001.
Jorgenson, M. T., Yoshikawa, K., Kanevskiy, M., Shur, Y., Romanovsky, V., Marchenko, S., Jones, B., Brown, J., and Jones, B.: Permafrost characteristics of Alaska, in: Ninth international conference on permafrost, 29 June–3 July 2008, Fairbanks, Alaska, edited by: Kane, D. L. and Hinkel, K. M., vol. 3, 121–122, ISBN 978-0-9800179-2-2, 2008.
Jorgenson, M. T., Kanevskiy, M. Z., Jorgenson, J. C., Liljedahl, A., Shur, Y., Epstein, H., Kent, K., Griffin, C. G., Daanen, R., Boldenow, M., Orndahl, K., Witharana, C., and Jones, B. M.: Rapid transformation of tundra ecosystems from ice-wedge degradation, Glob Planet Change, 216, 103921, https://doi.org/10.1016/j.gloplacha.2022.103921, 2022.
Kanevskiy, M., Shur, Y., Jorgenson, T., Brown, D. R. N., Moskalenko, N., Brown, J., Walker, D. A., Raynolds, M. K., and Buchhorn, M.: Degradation and stabilization of ice wedges: Implications for assessing risk of thermokarst in northern Alaska, Geomorphology, 297, 20–42, https://doi.org/10.1016/j.geomorph.2017.09.001, 2017.
Kim, K., Lee, J., Ju, H., Jung, J. Y., Chae, N., Chi, J., Kwon, M. J., Lee, B. Y., Wagner, J., and Kim, J.-S.: Time-lapse electrical resistivity tomography and ground penetrating radar mapping of the active layer of permafrost across a snow fence in Cambridge Bay, Nunavut Territory, Canada: correlation interpretation using vegetation and meteorological data, Geosciences Journal, 25, 877–890, https://doi.org/10.1007/s12303-021-0021-7, 2021.
Kim, K., Ju, H., Chi, J., Jung, J. Y., Nam, S., Park, S.-J., Dafflon, B., Lee, J., and Kim, W.-K.: Determination of Ground Subsidence Around Snow Fences in the Arctic Region, Lithosphere, 2025, https://doi.org/10.2113/2025/lithosphere_2024_215, 2025.
Kneisel, C., Hauck, C., and Mühll, D. V.: Permafrost below the Timberline Confirmed and Characterized by Geoelectrical Resistivity Measurements, Bever Valley, Eastern Swiss Alps, Permafr. Periglac. Process., 11, 295–304, https://doi.org/10.1002/1099-1530(200012)11:4<295::AID-PPP353>3.0.CO;2-L, 2000.
Kneisel, C., Hauck, C., Fortier, R., and Moorman, B.: Advances in geophysical methods for permafrost investigations, Permafr. Periglac. Process., 19, 157–178, https://doi.org/10.1002/ppp.616, 2008.
Kneisel, C., Emmert, A., and Kästl, J.: Application of 3D electrical resistivity imaging for mapping frozen ground conditions exemplified by three case studies, Geomorphology, 210, 71–82, https://doi.org/10.1016/j.geomorph.2013.12.022, 2014.
Kudryavtsev, V. A.: Obshcheye merzlotovedeniye (geokriologiya) [General permafrost science], 2nd edn., Moscow State University Press, Moscow, Russia, 464 pp., 1978 (in Russian).
Kvon, D. A., Modin, I. N., Shevnin, V. A., Makarov, D. V., and Skobelev, A. D.: Electrical resistivity tomography for identification of frozen and cold saline rocks, Earth`s Cryosphere, XXIII, 3–10, https://doi.org/10.21782/EC2541-9994-2019-3(3-10), 2019.
Leger, E., Dafflon, B., Soom, F., Peterson, J., Ulrich, C., and Hubbard, S.: Quantification of Arctic Soil and Permafrost Properties Using Ground-Penetrating Radar and Electrical Resistivity Tomography Datasets, IEEE J. Sel. Top. Appl. Earth Obs., 10, 4348–4359, https://doi.org/10.1109/JSTARS.2017.2694447, 2017.
Liu, Z.: The Variation Characteristics of Temperature in Barrow Alaska During 1925–2018, IOP Conf. Ser. Earth Environ. Sci., 546, 032056, https://doi.org/10.1088/1755-1315/546/3/032056, 2020.
Loke, M. H., Rucker, D. F., Chambers, J. E., Wilkinson, P. B., and Kuras, O.: Electrical Resistivity Surveys and Data Interpretation, in: Encyclopedia of solid earth geophysics, 344–350, https://doi.org/10.1007/978-3-030-58631-7_46, 2021.
McCarthy, K. A.: Overview of environmental and hydrogeologic conditions at Barrow, Alaska, Open-File Report 94-322, Open-File Report, Anchorage, Alaska, US, 21 pp., https://doi.org/10.3133/ofr94322, 1994.
Moon, T. A., Druckenmiller, M. L., and Thoman, R. L.: Arctic Report Card 2024, 116 pp., https://doi.org/10.25923/b7c7-6431, 2024.
Moorman, B., Robinson, S., and Burgess, M.: Imaging near-surface permafrost structure and characteristics with Ground-Penetrating Radar, CSEG Recorder, 32, 1–8, 2007.
Moorman, B. J., Robinson, S. D., and Burgess, M. M.: Imaging periglacial conditions with ground-penetrating radar, Permafr. Periglac. Process., 14, 319–329, https://doi.org/10.1002/ppp.463, 2003.
Munroe, J. S., Doolittle, J. A., Kanevskiy, M. Z., Hinkel, K. M., Nelson, F. E., Jones, B. M., Shur, Y., and Kimble, J. M.: Application of ground-penetrating radar imagery for three-dimensional visualisation of near-surface structures in ice-rich permafrost, Barrow, Alaska, Permafr. Periglac. Process., 18, 309–321, https://doi.org/10.1002/ppp.594, 2007.
Nyland, K. E., Shiklomanov, N. I., Streletskiy, D. A., Nelson, F. E., Klene, A. E., and Kholodov, A. L.: Long-term Circumpolar Active Layer Monitoring (CALM) program observations in Northern Alaskan tundra, Polar Geography, 44, 167–185, https://doi.org/10.1080/1088937X.2021.1988000, 2021.
Olenchenko, V. V., Gagarin, L. A., Khristoforov, I. I., Kolesnikov, A. B., and Efremov, V. S.: The structure of a site with thermo-suffosion processes within Bestyakh terrace of the Lena River, according to geophysical data, Earth's Cryosphere, XXI, 14–23, https://doi.org/10.21782/EC1560-7496-2017-5(14-23), 2017.
Osterkamp, T. E. and Payne, M. W.: Estimates of permafrost thickness from well logs in northern Alaska, Cold Reg. Sci. Technol., 5, 13–27, https://doi.org/10.1016/0165-232X(81)90037-9, 1981.
Pace, F., Vergnano, A., Godio, A., Romano, G., Capozzoli, L., Baneschi, I., Doveri, M., and Santilano, A.: A new repository of electrical resistivity tomography and ground-penetrating radar data from summer 2022 near Ny-Ålesund, Svalbard, Earth Syst. Sci. Data, 16, 3171–3192, https://doi.org/10.5194/essd-16-3171-2024, 2024.
Plattner, A. M.: GPRPy: Open-source ground-penetrating radar processing and visualization software, The Leading Edge, 39, 332–337, https://doi.org/10.1190/tle39050332.1, 2020.
Popov, A. I.: Merzlotnyye yavleniya v zemnoy kore (kriolitologiya) [Permafrost phenomena in the earth's crust], Moscow State University Publishing House, Moscow, 304 pp., 1967 (in Russian).
QGIS Development Team: QGIS Geographic Information System, Open Source Geospatial Foundation Project, http://qgis.osgeo.org (last access: 29 July 2025), 2024.
Qi, J., Yao, X., Yu, F., and Liu, Y.: Study on thaw consolidation of permafrost under roadway embankment, Cold Reg. Sci. Technol., 81, 48–54, https://doi.org/10.1016/j.coldregions.2012.04.007, 2012.
Romanovsky, V. E., Smith, S. L., and Christiansen, H. H.: Permafrost thermal state in the polar Northern Hemisphere during the international polar year 2007–2009: a synthesis, Permafr. Periglac. Process., 21, 106–116, https://doi.org/10.1002/ppp.689, 2010.
Saintenoy, A., Pessel, M., Grenier, C., Léger, E., Danilov, K., Bazhin, K., Khristoforov, I., Séjourné, A., and Konstantinov, P.: Coupling GPR and ERT data interpretation to study the thermal imprint of a river in Syrdakh (Central Yakutia, Russia), in: 18th International Conference on Ground Penetrating Radar, Golden, Colorado, 14–19 June 2020, 93–96, https://doi.org/10.1190/gpr2020-025.1, 2020.
Schneider von Deimling, T., Lee, H., Ingeman-Nielsen, T., Westermann, S., Romanovsky, V., Lamoureux, S., Walker, D. A., Chadburn, S., Trochim, E., Cai, L., Nitzbon, J., Jacobi, S., and Langer, M.: Consequences of permafrost degradation for Arctic infrastructure – bridging the model gap between regional and engineering scales, The Cryosphere, 15, 2451–2471, https://doi.org/10.5194/tc-15-2451-2021, 2021.
Sellmann, P. V. and Brown, J.: Stratigraphy and diagenesis of perennially frozen sediments in the Barrow, Alaska region, in: The North American Contribution to the Second International Conference on Permafrost, Yakutsk, U.S.S.R., 13–28 July 1973, 171–181, 1973.
Shein, A. N., Kraev, G. N., and Kamnev, Ya. K.: Geophysical research for organization and service of the regional permafrost monitoring network in the Yamalo-Nenets Autonomous District (Published in Russian), Inter Expo Geo-Siberia, 2, 321–327, 2022.
Shiklomanov, N. I., Streletskiy, D. A., Nelson, F. E., Hollister, R. D., Romanovsky, V. E., Tweedie, C. E., Bockheim, J. G., and Brown, J.: Decadal variations of active-layer thickness in moisture-controlled landscapes, Barrow, Alaska, J. Geophys. Res.-Biogeo., 115, https://doi.org/10.1029/2009JG001248, 2010.
Shumsky, P. A.: Podzemnyye l'dy [Ground Ices], in: Osnovy geokriologii (merzlotovedenija). Obshchaya geokriologiya [Fundamentals of geocryology, ðt 1, General geocryology], Academy of Sciences of the USSR, Moscow, Russia, 274–326, 1959 (in Russian).
Sjöberg, Y., Marklund, P., Pettersson, R., and Lyon, S. W.: Geophysical mapping of palsa peatland permafrost, The Cryosphere, 9, 465–478, https://doi.org/10.5194/tc-9-465-2015, 2015.
Spero, T. L., Briggs, N. L., and Boldrick, L.: Environmental Impacts from Projected Permafrost Thaw in Alaska: Defining Knowledge Gaps, Data Needs, and Research Priorities, Weather, Climate, and Society, 17, 325–337, https://doi.org/10.1175/WCAS-D-24-0150.1, 2025.
Streletskiy, D. A., Clemens, S., Lanckman, J.-P., and Shiklomanov, N. I.: The costs of Arctic infrastructure damages due to permafrost degradation, Environ. Res. Lett., 18, 015006, https://doi.org/10.1088/1748-9326/acab18, 2023.
Tourei, A., Ji, X., Rocha dos Santos, G., Czarny, R., Rybakov, S., Wang, Z., Hallissey, M., Martin, E. R., Xiao, M., Zhu, T., Nicolsky, D., and Jensen, A.: Mapping Permafrost Variability and Degradation Using Seismic Surface Waves, Electrical Resistivity, and Temperature Sensing: A Case Study in Arctic Alaska, J. Geophys. Res.-Earth Surf., 129, e2023JF007352, https://doi.org/10.1029/2023JF007352, 2024.
Victor, S.: Detection of increase in air temperature in Barrow, AK, USA, through the use of extreme value indices and its impact on the permafrost active layer thickness, Theor. Appl. Climatol., 148, 79–89, https://doi.org/10.1007/s00704-021-03919-z, 2022.
Walker, D. A., Raynolds, M. K., Kanevskiy, M. Z., Shur, Y. S., Romanovsky, V. E., Jones, B. M., Buchhorn, M., Jorgenson, M. T., Šibík, J., Breen, A. L., Kade, A., Watson-Cook, E., Matyshak, G., Bergstedt, H., Liljedahl, A. K., Daanen, R. P., Connor, B., Nicolsky, D., and Peirce, J. L.: Cumulative impacts of a gravel road and climate change in an ice-wedge-polygon landscape, Prudhoe Bay, Alaska, Arct. Sci., 8, 1040–1066, https://doi.org/10.1139/as-2021-0014, 2022.
Westermann, S., Wollschläger, U., and Boike, J.: Monitoring of active layer dynamics at a permafrost site on Svalbard using multi-channel ground-penetrating radar, The Cryosphere, 4, 475–487, https://doi.org/10.5194/tc-4-475-2010, 2010.
Wollschläger, U., Gerhards, H., Yu, Q., and Roth, K.: Multi-channel ground-penetrating radar to explore spatial variations in thaw depth and moisture content in the active layer of a permafrost site, The Cryosphere, 4, 269–283, https://doi.org/10.5194/tc-4-269-2010, 2010.
Yershov, E. D.: General Geocryology, edited by: Williams, P. J., Cambridge university press, Cambridge, UK, 608 pp., 2004.
Yoshikawa, K., Leuschen, C., Ikeda, A., Harada, K., Gogineni, P., Hoekstra, P., Hinzman, L., Sawada, Y., and Matsuoka, N.: Comparison of geophysical investigations for detection of massive ground ice (pingo ice), J. Geophys. Res.-Planets, 111, https://doi.org/10.1029/2005JE002573, 2006.
Zhang, T., Barry, R. G., Knowles, K., Heginbottom, J. A., and Brown, J.: Statistics and characteristics of permafrost and ground-ice distribution in the Northern Hemisphere, Polar Geography, 23, 132–154, https://doi.org/10.1080/10889379909377670, 1999.
- Abstract
- Introduction
- Site Description and Survey Locations
- Geophysical and Ground Truth Methods
- Results and Discussion: Integrated Geophysical Investigation of Permafrost Degradation in Utqiaġvik
- Conclusions
- Data availability
- Author contributions
- Competing interests
- Disclaimer
- Acknowledgements
- Financial support
- Review statement
- References