the Creative Commons Attribution 4.0 License.
the Creative Commons Attribution 4.0 License.
 | 25 Mar 2026
The terrestrial ice margin morphology in Kalaallit Nunaat (Greenland)
Jakob Abermann
Rainer Prinz
The Greenland Ice Sheet (GrIS) and its peripheral glaciers and ice caps (PGIC) have received a lot of attention with respect to its marine-terminating margin, where ice discharge contributes a significant amount to ice mass loss. However, a similar fraction of the mass loss is caused by surface melt, leaving the ice predominately via the less studied terrestrial margins. Using existing ice masks and a lake dataset we extract the actual land-terminating sections, making up 93.1 % of the total GrIS (70 900 km) and PGIC (170 600 km) margin. The study provides evidence for the ability of the ice mask and ArcticDEM to capture margin morphologies across approximately 84 % of the land-terminating margin correctly, even able to identify very steep margin morphologies at a regional scale. We identify 28.4 % as near-vertical features over shallow terrain and a further 13.4 % as steep (∼ 20–45°), which roughly corresponds to an earlier estimate of 45 % for ice cliffs. 17.3 % of the land-terminating margin are identified as shallow ramps (< 20°). With geolocated morphologies, future studies will be able to identify to what degree past presence of lakes, bed topography or ice dynamics and past climate at and upstream of the margin can explain under which conditions the ice margin terminates in steep or shallow slopes.
- Article
(11840 KB) - Full-text XML
-
Supplement
(51035 KB) - BibTeX
- EndNote


While a large part of the ice margin of the Greenland Ice Sheet (GrIS) and peripheral glaciers and ice caps (PGIC) is land-terminating, this fraction has so far never been quantified and has received much less attention than the marine-terminating margin. Most of the ice discharge in Greenland originates from marine-terminating outlet glaciers (Mankoff et al., 2021; Mouginot et al., 2019; Shepherd et al., 2020), but approximately one half of the total mass loss can be attributed to surface mass balance change, which predominantly leaves the ice as meltwater over the surface to proglacial rivers and streams (van den Broeke et al., 2016; Lewis and Smith, 2009; Mankoff et al., 2021; Shepherd et al., 2020). GrIS margins have experienced widespread thinning in recent decades (Hanna et al., 2020; Kjeldsen et al., 2015; Shepherd et al., 2020) and marine-terminating tongues generally thin at higher rates than land-terminating ones (Sole et al., 2008) and have seen widespread retreat (Goliber et al., 2022; Howat and Eddy, 2011). 75 % of land-terminating drainage contributes to surface flow directly, while the rest drains into marginal lakes (Lewis and Smith, 2009).
Mouginot et al. (2019) provide an assessment of GrIS mass loss between 1972 and 2018, partitioning the ice sheet into 260 basins and regions. 217 basins have a marine-terminating outlet and 43 are completely land-terminating, with no (or negligible) mass loss due to dynamic discharge at the terminus. Mass loss and change of dynamics were found to be temporally variable, with periods of near-balance before the 1990s. Areas that are found to be stable in southwest Greenland, coincide with parts of the GrIS where previously an advancing margin was identified (Knight et al., 2000; Weidick, 1991, 1994). As marine-terminating glaciers retreat, a large part of their terminus becomes land-terminating, suggesting a potential future increase of land-terminating drainage (Mouginot et al., 2019).
Several studies have previously focused on the Holocene fluctuations of the land-terminating ice margin or on its hydrological impacts (Carrivick et al., 2018; Davison et al., 2019; Koziol and Arnold, 2018; Lesnek and Briner, 2018; Sole et al., 2008; Tedstone et al., 2015; Weidick, 1968). Some field studies show stable or advancing ice margins of land-terminating glaciers and ice caps in North Greenland throughout parts of the 20th and 21st century (Abermann et al., 2020; Davies and Krinsley, 1962; Dawes and van As, 2010; Farnsworth et al., 2018; Goldthwait, 1971). At the Nunatarssuaq Ice Cap, a net ice margin advance on a centennial scale was postulated based on dated organic material (Goldthwait, 1961) and phases of advance, retreat and re-advance during the past six decades were recently quantified (Abermann et al., 2020), coinciding with the presence of vertical ice cliffs. Stability (or even advance) was found to go in line with thinning of the ice margin. In West Greenland similar advances have been observed but generally associated with a thickening due to presumed increased precipitation with increasing temperatures and moisture (Dawes and van As, 2010; Tatenhove et al., 1995; Weidick, 1991).
Davison et al. (2019) and Koziol and Arnold (2018) note, that the understanding of ice dynamics on the terrestrial margin (including land- and lake-terminating sections when looking at larger domains) is still confounded by an inadequate understanding of feedbacks between runoff and ice dynamics, but predict a slowdown of the margin with increasing melt. This has previously been observed, suggesting that the land-terminating margin is more resilient to dynamic impacts of enhanced melt (Tedstone et al., 2015). Other studies on the ice margin in Central-West Greenland emphasize an important link between understanding margin dynamics, lake evolution and sediment evacuation from the GrIS (Carrivick et al., 2018; Knight et al., 2000). Beyond the interest in contemporary ice sheet health, the terrestrial margin in North Greenland has also received some attention in studies investigating paleo-climate, with a link between margin characteristics and recent Holocene climatic change (Farnsworth et al., 2018; Lesnek and Briner, 2018; Osterberg et al., 2015; MacGregor et al., 2020; Reeh et al., 1987, 2002).
Studies specifically describing the very steep land-terminating margin sections have been conducted in the Antarctic Dry Valleys (Levy et al., 2013) and North Greenland (Abermann et al., 2020). Ice cliffs along the margin of glaciers and ice sheets are a widespread but rarely investigated feature (Weidick, 1994), that could potentially shed some light on the role of atmospheric drivers or ice dynamics along the margin. Goldthwait (1960) estimates that approximately 45 % of the ice sheet in Northwest Greenland terminates as cliffs on land. A small number of studies in Antarctica have investigated land-terminating ice cliffs on the glacier margin in the Dry Valleys (Fountain et al., 2004; Levy et al., 2013; Swanger et al., 2017). A recent advance of the margin, with pronounced vertical cliffs has been associated to recent warming periods, with a corresponding thinning of the ice mass. They can significantly contribute to ablation, where the cliff makes up only 2 % of the ablation area, but constitutes for up to 20 % of total ablation (Lewis et al., 1999).
The most comprehensive analysis of land-terminating margin morphologies to date was accomplished in West Greenland (Nobles, 1961; Weidick, 1963, 1968). Investigating five localities along the Western coast between Thule in the North and Iviangerquitit Tasiat in the South, Weidick (1963) finds ice cliffs (vertical or near-vertical following Nobles (1961), who investigated different types of ice margin in the Thule region), steep (steep ramps, 20–45°) and gently sloped margins (gentle ramps, < 5°). Steep ramps have been described as an intermediary stage between a decaying ice cliff into a gentle ramp (Nobles, 1961), while the evolution of vertical faces was explained as the result from overriding of stagnant by active ice (Goldthwait, 1961; Rausch, 1958), solar radiation (Chamberlin, 1895) or wind erosion (Bishop, 1957). To date no universal explanation exists for morphological developments of steep to vertical ice margins (Steiner et al., 2022). Following initial observations (Weidick, 1963) a number of characteristics can be noted that seem to apply for many steep sections along the margin in Greenland, sorted by order of prevalence across sites: (a) ice cliffs are generally 10 to 40 m high; (b) steep sections appear on the inland margin proper rather than on glacier lobes; (c) terrain adjacent to steep margin is defined by presence of shear moraines and undulating ground moraines with round boulders rather than marginal or terminal moraines; (d) this topography may favor strong local winds contributing to morphology, potential erosional effect of snow; (e) limited recession during the first half of the 20th century, at times even advance; (f) steep ramps are occasionally bordered by melt water streams or lakes; (g) ice cliffs potentially form at the maximum limit of glaciation in a specific region; (h) mean ice temperatures are slightly above mean annual air temperatures.
While a number of topics relating to the land-terminating ice margin in Greenland are of interest to understand past, present and future changes of the GrIS itself, there is yet no comprehensive assessment of the margin’s location and morphology that would allow for a discussion of Weidick's observations on a larger scale. As Weidick (1963) notes, morphologies vary between locations and therefore suggests to analyse larger parts of the margin. With recent delineations of the complete margin (Citterio and Ahlstrøm, 2013; Rastner et al., 2012) as well as high resolution data of elevation (Morlighem et al., 2017; Porter et al., 2023) such an investigation becomes now possible. Therefore, this study uses existing ice masks in Greenland to identify where steep and gentler sections of the land-terminating margin are located (Fig. 1), to provide a baseline for future studies to further investigate the characteristics of the margin as described in Weidick (1963).
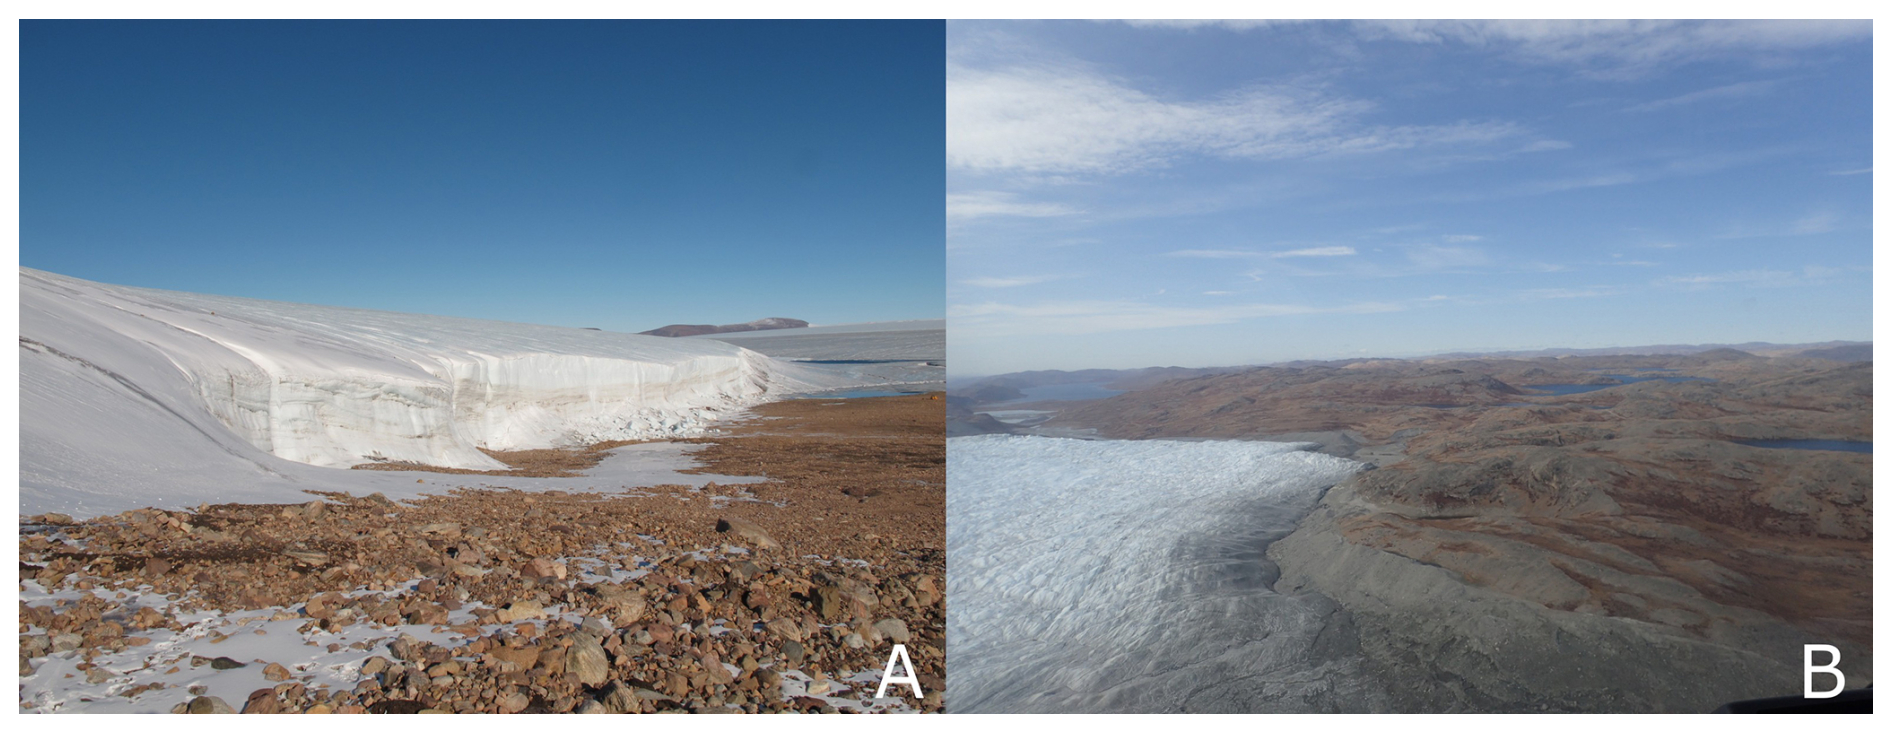
Figure 1(A) Transition from a steep ramp to a vertical ice cliff back to a steep ramp (what we define as 20 to 45°) within a few 100s of meters at the Nunatarssuaq Ice Cap. The surrounding terrain is generally flat. Photo: Authors, 2017. (B) The ice margin at Russel Glacier, typical for an outlet glacier with reworked periglacial terrain, with predominately shallow to steep ramp margin features. Photo: Authors, 2019.
A number of large spatial datasets have become available for Greenland in recent years that allow for an analysis of the ice margin, following openly available resources.
Ice masks for the GrIS include a product from the 1980s (Citterio and Ahlstrøm, 2013), a product for the PGIC (Rastner et al., 2012), which also produced a mask for the ice sheet, corresponding to the year 2000 (1999–2002), and a mask for the year 2022 (Luetzenburg et al., 2026). Visual inspection of these products suggest similar quality across Greenland. We rely on the product by Rastner et al. (2012), as it provides masks for both GrIS and PGIC and while produced more than a decade earlier than the topographic data we rely on, is expected to capture most of the actual margin morphology within the mask, considering both ice sheet and peripheral glaciers are predominately receding in Greenland. The ice masks where manually corrected where obvious artifacts existed or where the mask for GrIS and PGIC overlapped. For ease of processing and analysis, the margin is separated into the basins of the GrIS (Mouginot et al., 2019). An overview over these basins and the regions they are associated to is provided in Supplement Fig. S14. To distinguish between marine- and land-terminating margin we relied on the BedMachine Greenland version 5 (Morlighem et al., 2017). To identify ice margin potentially in contact with lakes we intersected with the existing lake inventory (How et al., 2021), which was manually corrected to align with the 2000 time stamp. All input data reprocessed for this study is available in the corresponding data repository (Steiner et al., 2025).
ArcticDEM provided surface elevation data, specifically the Mosaics version 4.1, which are available at 2 m resolution (Porter et al., 2023). Mosaics are produced from image composites between 2012 and 2022, implying a potential mismatch with margin products and imagery. As it is not feasible to produce new margin outlines corresponding to the DEM time stamps, nor are DEMs available around the year 2000, we overcome this challenge by working with a 100 m buffer within the margins (see Methods). Sections where the margin outline does not correspond to the actual margin are flagged and not used to extract margin morphologies. A total of 448 ArcticDEM tiles (see Fig. S1) are used and converted into slope maps using the terra::terrain() function (Hijmans, 2025) in R with 8 neighbor cells. Slope values below 5° are ignored for identifying the eventual margin morphology to avoid including too much flat terrain adjacent to the actual margin, either on land or ice. The Pléiades stereo-pairs, with processed DEMs, used in this study for two validation sites in North and East Greenland, respectively, were provided by the Pléiades Glacier Observatory initiative of the French Space Agency (CNES, Berthier et al., 2024).
The process to delineate the ice margin and extract the slope from the terrestrial margin is visualized in Fig. 2. The margin is separated into 260 basins, of which 40 have no or negligible margin that was merged into other subbasins, 204 are connected to the GrIS, while the remaining 16 are associated to PGIC (step A, Fig. 2). A buffer of 100 m is placed on the inside of the mask to avoid including off-glacier terrain (step B). Instances where the margin mask is smaller than the actual ice extent are found to be rare upon visual inspection. Python scripts to obtain the buffer are documented in the Supplement. During this step, the margin is intersected with polygons of lakes, ocean and any directly adjacent ice bodies, like PGICs connected to the GrIS. To determine the actual terrestrial margin, the BedMachine DEM (Morlighem et al., 2017) is used at its resolution (150 m). Any part of the margin located above 10 m a.s.l. is considered terrestrial, and the rest marine-terminating (step C). This margin allows for a conservative estimate of the terrestrial margin, rather than overestimating it, in cases where the ice mask is not accurately placed. The product is compared manually against the Landsat orthomosaic for validation, and any erroneous classification was manually corrected in the vicinity of marine outlets. This introduces a level of subjectivity and no reproducible methodology to correct for errors in the transition from land- to marine-terminating margins exist. However, we do identify margin sections where from visual inspection their position (whether over land or over water) seems unclear and do not extract morphologies in these locations.
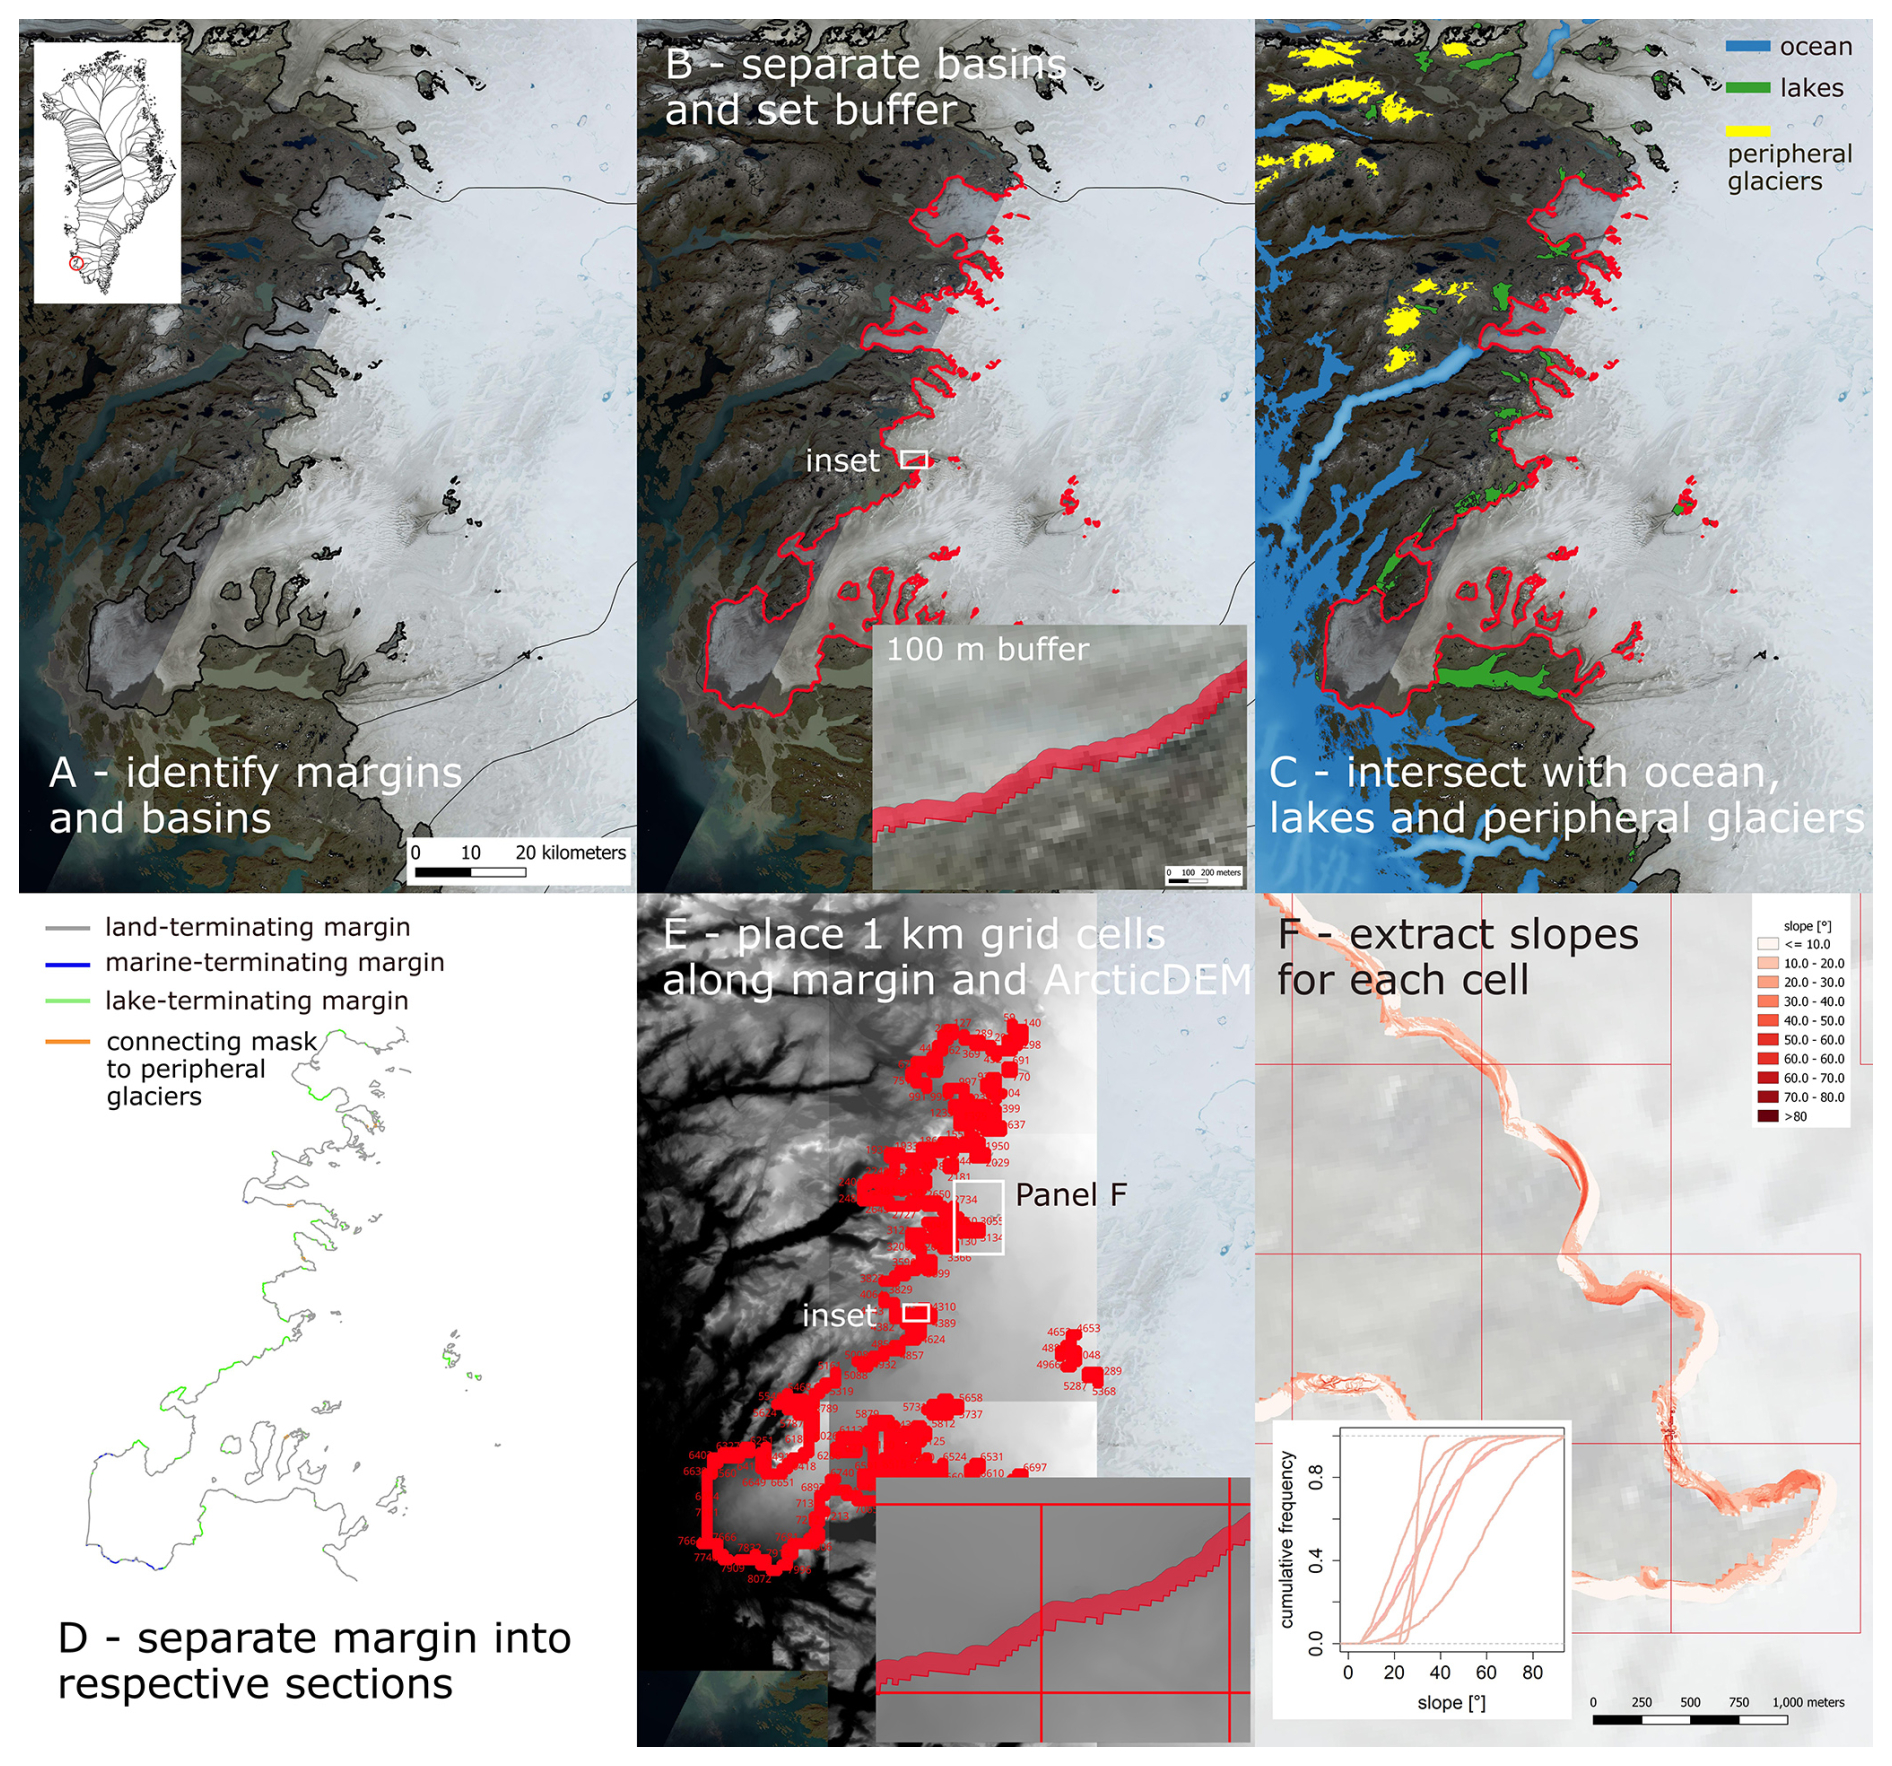
Figure 2Workflow to extract margin morphologies across the complete ice margin (example basin no. 70). (A) Basin outlines and ice masks are intersected to produce margins for all subbasins. (B) A 100 m buffer is placed along each margin section. (C) The margin is intersected with the Bedmachine DEM to identify marine-terminating, and lake polygons to identify lake-terminating margin. Margin intersecting with other glacier ice (e.g. ice sheet with a peripheral glacier) is also stored separately. (D) Relative margin lengths for each subbasin are saved separately for each subbasin, and only land-terminating margin is retained for final steps. (E) A 1 km grid is placed over the terrestrial margin polygon, to extract data from underlying ArticDEM tiles. (F) Slope values are extracted for each grid cell from the slope maps, resulting in slope distributions (inset) for each grid cell.
Parts of the margin that intersect with a lake are considered lake-terminating. Due to the later time stamp of the lake inventory (2017, How et al., 2021), all marginal ice contact lakes were checked with the imagery, missing lakes added (n=302) and lakes not present in 2000 removed (n=1151). The updated lake inventory is available with the data repository (see code and data availability section). Note that we did not remap the margin and hence, due to their ephemeral nature, changing rapidly sometimes even within one year, the absolute lengths of marine- and lake-terminating margins provided here should be interpreted with caution. Margin outlines were only corrected where erroneous outlines appeared on ice (obvious processing errors rather than misclassifications), and margins that were duplicated between the GrIS and PGIC mask (predominately in East Greenland) were removed from one of the two. Lengths of terminus types are calculated for each subbasin (step D). We include margins along nunataks (i.e. closed polygons within the respective margin), but report statistics with, and without considering these sections for the GrIS. For the final step of slope extraction, only terrestrial margin buffers are retained, along which 1 km grid cells are placed (step E). Slope maps are produced for each ArcticDEM tile and used to then extract slope values for the buffer within each grid cell (step F), stored as individual text files.
Because the ice margin is not derived from the ArcticDEM, three issues need clarification to allow validity of the presented method of investigating the ice margin morphology. The first question is whether the existing margin masks represent the actual margin. This issue poses a general challenge in glacier ice delineation, faced by any larger dataset covering more than a few individual glaciers, and can not be comprehensively assessed here. However, visual inspection of the margin on the mosaic produced from Landsat images from around the year 2000, indicates that the GrIS land-terminating margin is captured well in most cases, and only diverges visibly in regions with very winding margin sections or for cases where the shallow margin is loaded with debris. This being generally regions with very shallow slopes, we believe that it does not significantly impact our results. The margins of PGICs are of poorer quality, with more misclassifications of (perennial) snow fields as ice. To avoid the inclusion of snow fields and very small glaciers, where margin morphology is arguably of no more interest to understand glacier dynamics, we have removed all separate ice bodies with an area smaller than 5 km2, amounting to a total of 12 429 km2 or, 3.5 % of the total area of all PGICs. Furthermore, any grid cell that contained margins that was visually obviously misplaced, either due to misclassification or a consistent offset between margin outline and actual ice margin was marked manually and morphology was not considered in these cases.
The second question is whether a 100 m buffer inside the margin is sufficient for slope detection analysis. As the DEM is obtained from imagery after 2000, with a horizontal accuracy of 4 m and with a predominately retreating margin, setting such a wide buffer inside the margin allows us to capture the margin also in the DEM. Since, however, we are predominately interested in the slope of the very front of ice sheet or glaciers, it is important applying a buffer size reducing the number of pixels of flat ice surfaces. Visual inspection across the GrIS suggests that ice masks rarely intersect the actual ice, hence excluding any area outside the margin is warranted and further reduces misclassifying pixels. The time stamp of the ArcticDEM, produced from imagery between 2008 and 2022, differs by more than a decade from the time stamp of the margin. Margin recession rates of 4 to 13 m yr−1 within this period would hence be still covered within a 100 m buffer, which seems reasonable given approximate rates of ca. 10–30 m yr−1 in very active regions (Mernild et al., 2012). Especially around the termini of peripheral glacier tongues, frontal change rates have increased in recent decades, exceeding 10 m yr−1 after 2010 (Larocca et al., 2023), suggesting that our product may be more prone to error in these regions.
Finally, we need to ascertain that the quality of the ArcticDEM suffices to capture steep margin sections. For two sites in Greenland, the Nunatarssuaq area (Abermann et al., 2020) and the Mittivakkat Glacier, high resolution Pléiades imagery is available (see Supplement for details) allowing for a comparison to the ArcticDEM. The aim of this comparison was not whether the margin outline matches with the DEM, but rather if the resolution of the ArcticDEM is able to capture relatively steep morphologies. To do so we mapped steep sections in both regions, placed a 100 m buffer around the delineation and compared the respective slope values.
To identify near-vertical margin sections, steep and shallow ramps from the DEM, we extracted cumulative distribution functions of slope values for well known margin sections across field sites in Nunatarssuaq (Abermann et al., 2020), Inglefield Land (Kjær et al., 2018), Freya Glacier (Hynek et al., 2024) and Qaamarujup Sermia (Abermann et al., 2023). The slope distributions for all cells are then evaluated with the DTS test, a version of the Wasserstein metric, which essentially provides a least squares of the slope distributions (Eq. 1, Dowd, 2020).
The theoretical slope distribution that fits the sample distribution for grid cell i best determines whether the margin section is most likely near-vertical, steep or shallow. is the variance of the sample. This method avoids misinterpreating periglacial terrain that has similarly steep slopes as the ice margin, and which would hence have similar average slope values. Although this approach does not allow us to identify the type of margin for each pixel of the margin, it identifies a dominant margin type for each 1 km grid cell. We do not extract slope distributions for parts of the margin earlier identified as erroneous, nor for grid cells where the bed topography is on average steeper than 30°. This avoids the inclusion of margins especially prevalent around mountain glaciers, where the distinction between steep terrain and ice margin is difficult and temporal changes in ice margin arguably faster than elsewhere, hence making our assumption of the suitability of ArcticDEM mosaics for this method questionable.
4.1 Absolute and relative margin lengths
The total length of the GrIS margin is 76 154 km, 93.1 % of which is land-terminating, 3.6 % marine-terminating and 3.3 % lake-terminating (Table 1, Fig. 3). The land-terminating fraction is generally higher in East (between 93.2 % and 97.9 %) than in West Greenland (85.1 % to 90.8 %), but varies widely between basins (Table S1 in the Supplement, 24.1 % to 100 % in 5 basins). Marine-terminating fractions range from 0 % (in 21 basins) to 71.3 %, while lake-terminating fractions range from 0 % (72 basins) to 21.6 %. In SW the lake-terminating fraction of the margin is larger than the marine-terminating fraction. 4160 km of the ice sheet is connected to peripheral glaciers and ice caps. These segments are not included in any of the following statistics. The margin around PGIC at 174 425 km is nearly twice as long as the GrIS margin, with 97.8 % land-terminating (Table 1, Fig. 3). Depending on the existence or absence of marine-terminating outlet glaciers and ice streams, the relative fraction also varies widely within regions (Fig. 3, Table S1).
Table 1Lengths of margins for all regions on the GrIS as well as the PGICs, including the relative fraction of the margin ending on land (land-terminating), in the ocean (marine-terminating) and in a lake (lake-terminating). In brackets are values when ignoring margins along nunataks (i.e. closed polygons within the respective margin), only calculated for the GrIS. The number in italics in brackets denotes the fraction of the land-terminating margin that is considered of insufficient quality to extract margin morphologies. See Table S1 for details on each individual subbasin.
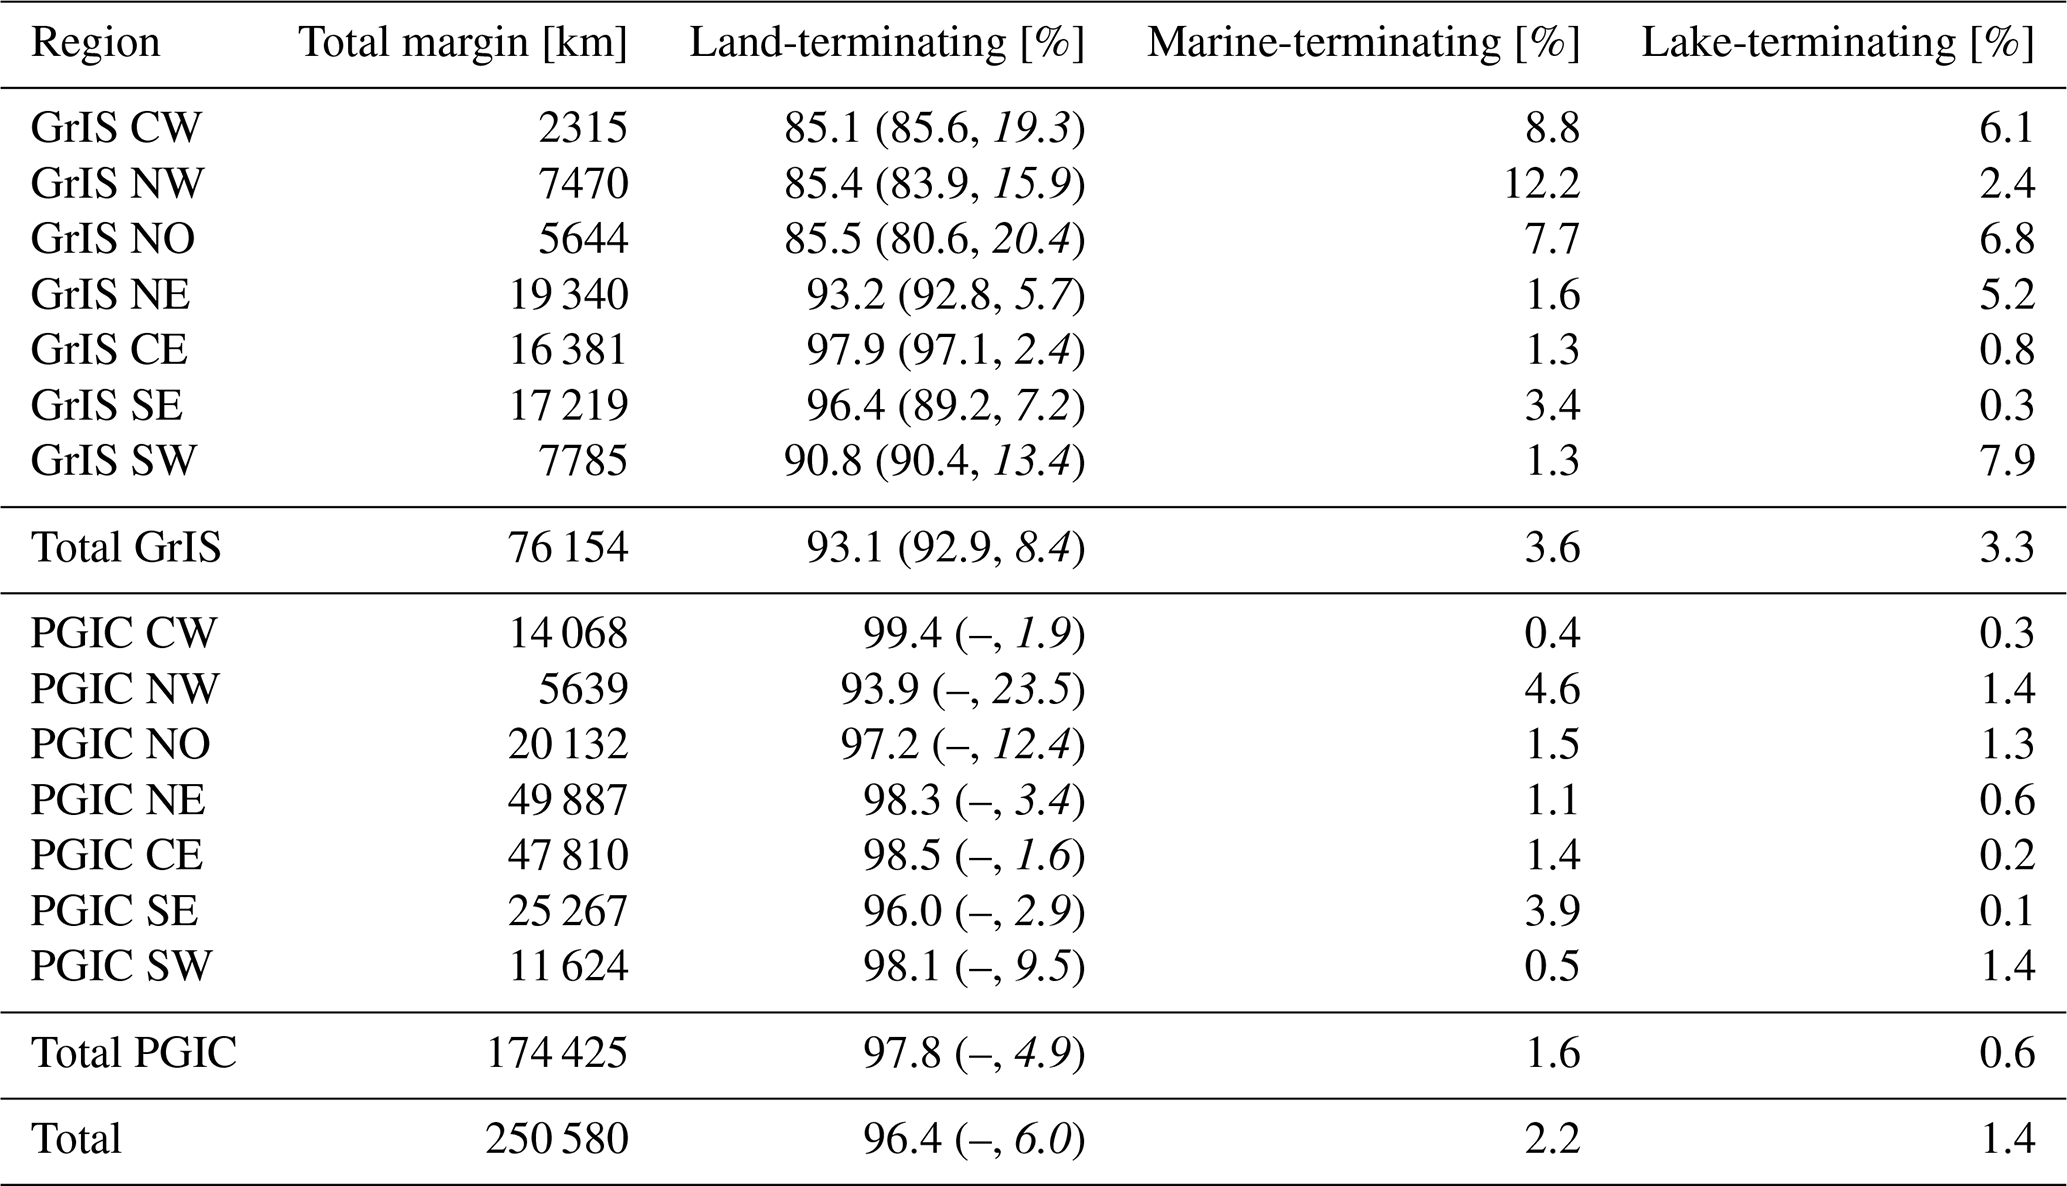
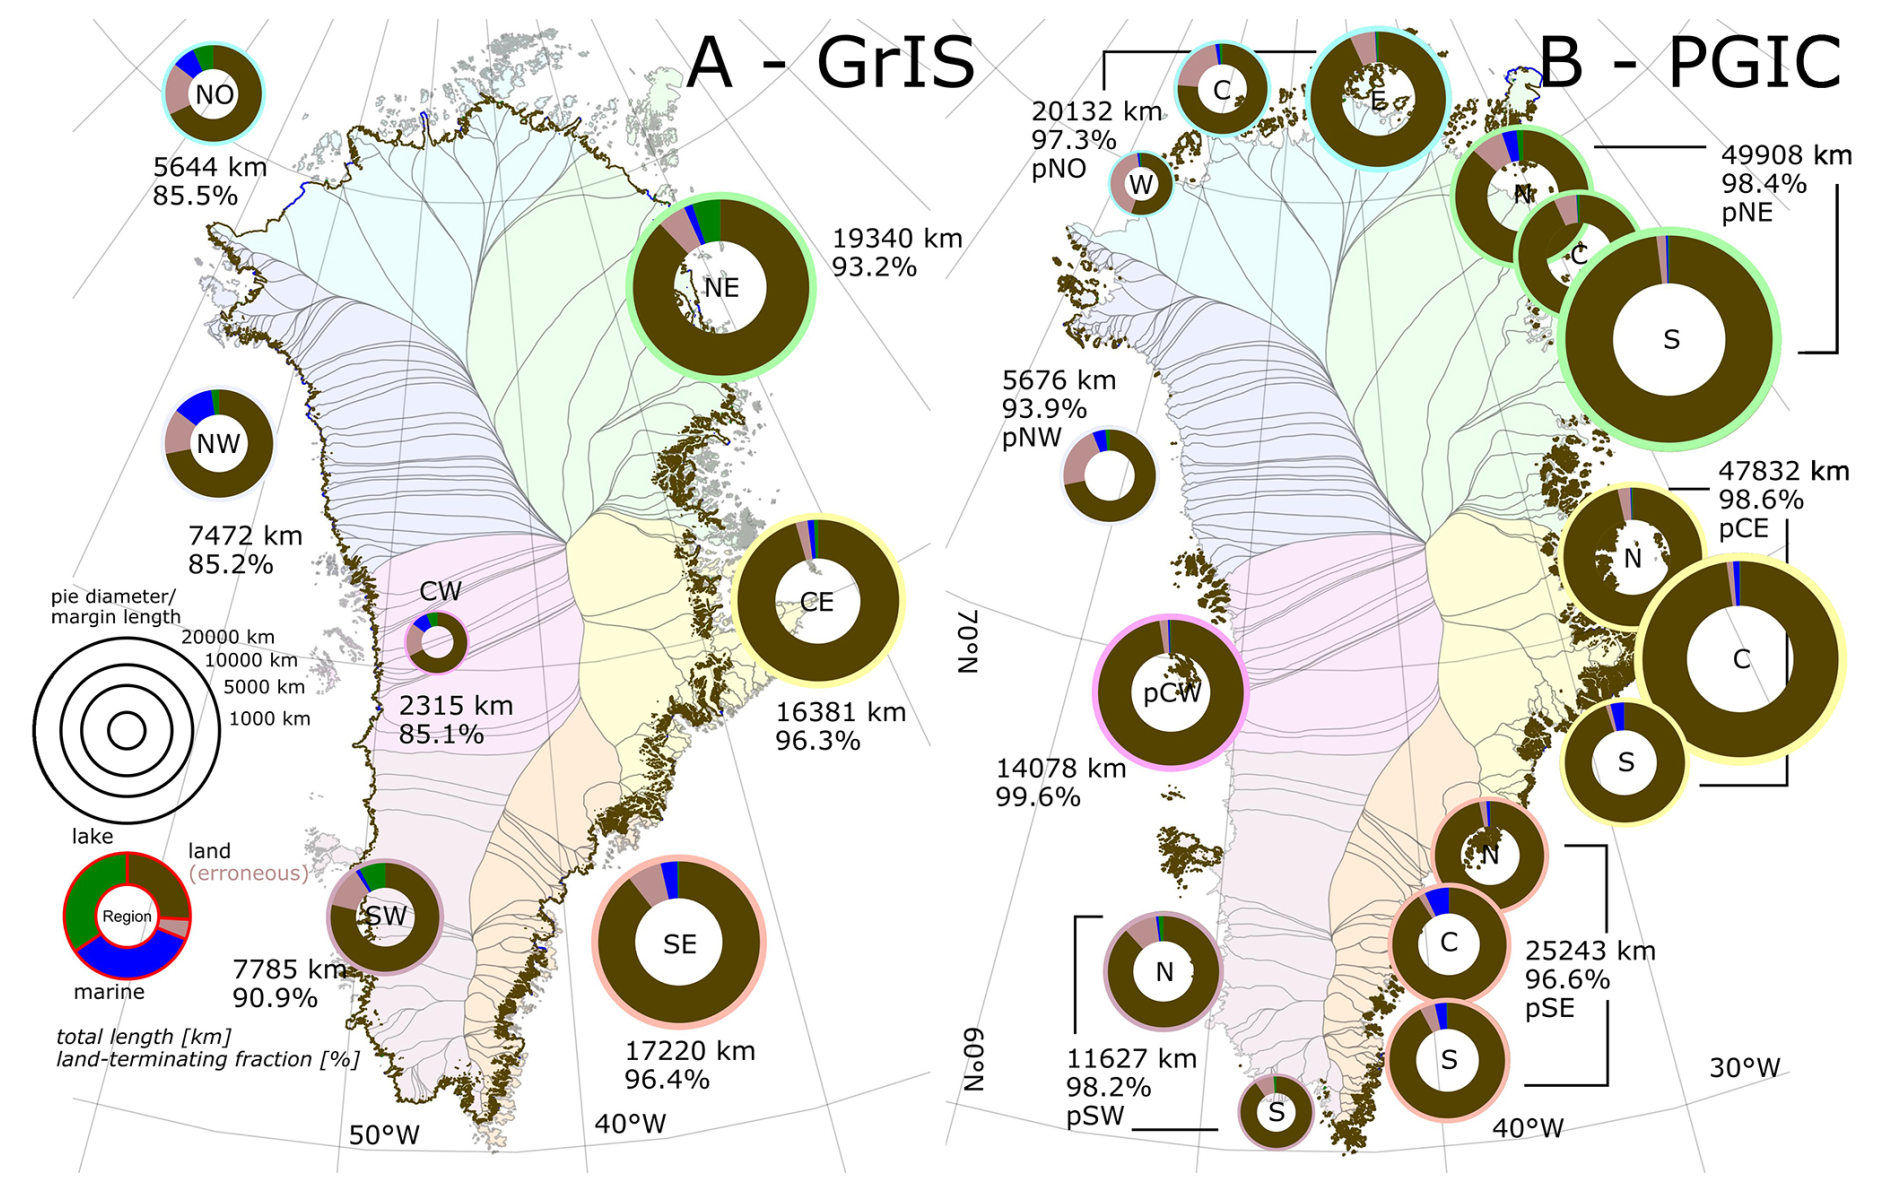
Figure 3Margin lengths and respective land-, marine- and lake-terminating fractions for the GrIS (A) and PGIC (B). The numbers adjacent to the pie plots refer to total length and relative fraction of the land-terminating margin. Note that for PGIC the lengths are shown separately for subsections of the pNO, pNE, pCE, pSE and pSW regions, corresponding to data shown in Table S1, to avoid excessive size of pies (for pNE, pCE, pSE) and due to the disconnected nature of ice masses (pNO, pSW). Values of individual subbasins for the GrIS regions for PGICs are shown in Table S1.
4.2 Ability to capture margin morphology
The ability to capture the morphology of the margin with the methods used is defined by (a) the accuracy of the margin outline, (b) the adequacy of the ArcticDEM resolution and quality to distinguish between steep and shallow sections and (c) the created buffer’s ability to actually capture the ice margin rather than any adjacent terrain off or stretches on the ice. The first aspect we can not definitely quantify here, but it becomes apparent from visual inspection across Greenland, that especially along shallow ramps of the GrIS in South Greenland as well as at the margin of a number of PGICs (Fig. 4), there are non-negligible sections of the ice masks that do not match with the actual ice margin visible from imagery. After removing margin sections that are nonsensical (Fig. 4A), we manually identified those grid cells that cover visibly erroneous margin. 8.4 % of the GrIS and 4.9 % of the PGIC margins are potentially erroneous (Table 1) and are not considered to investigate the morphology further.
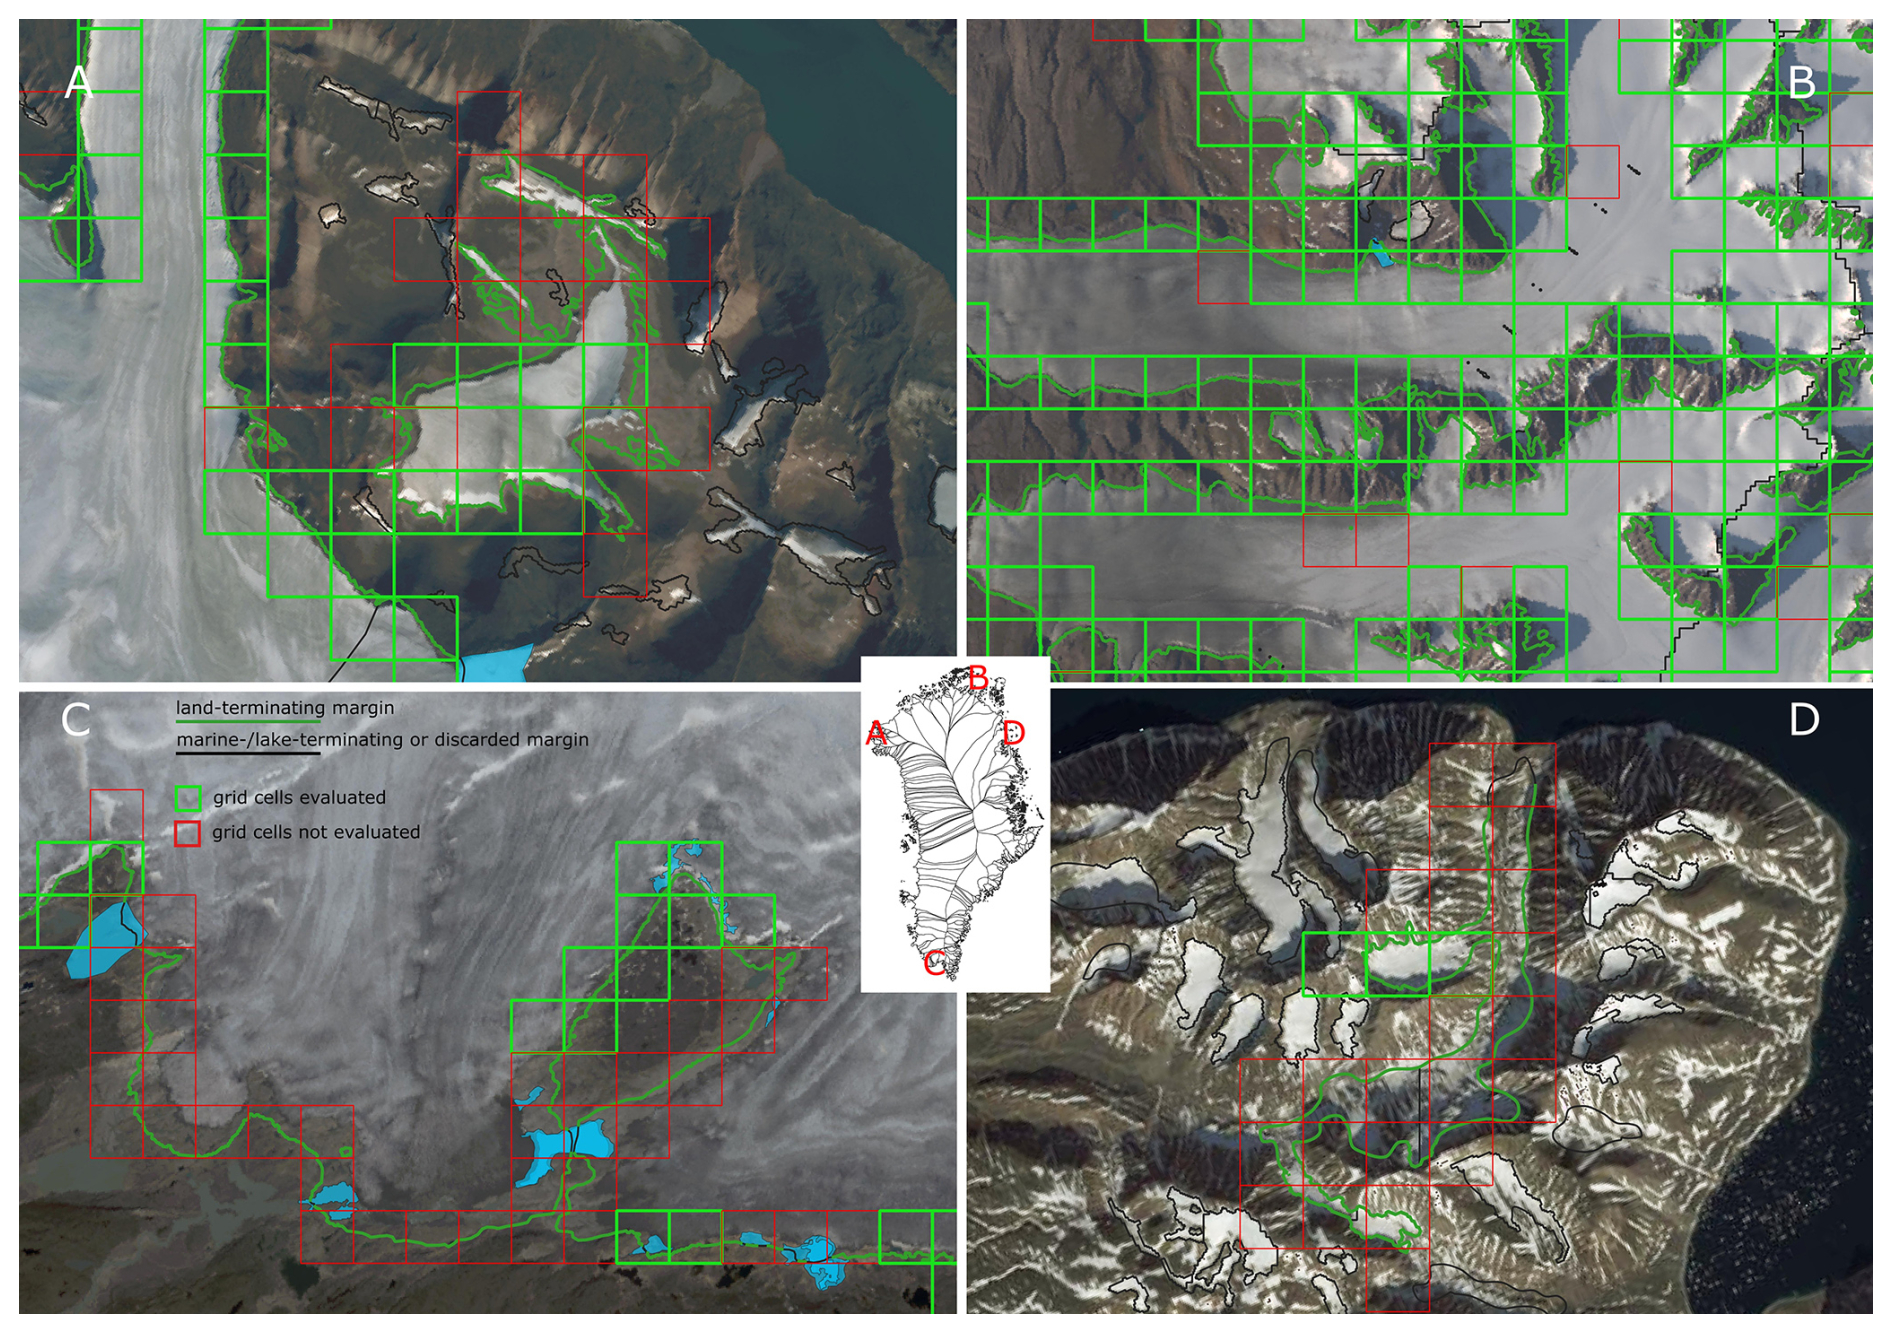
Figure 4Examples of incorrectly mapped terrestrial margin outlines. Green is the already extracted terrestrial margin, black is margin that was not considered in any of the analysis (e.g. discarded obvious artefacts as the black dots in panel B, margins of individual disconnected glaciers that fall below the size threshold as in panel D or any part of ice masks that connects GrIS directly to PGIC). Red grid cells are discarded in the analysis of margin morphology, after manual identification of ice mask mismatch with actual margin in imagery. (B) Erroneous margin pixels on an outlet glacier. Two small glaciers in the West of the extent were discarded due to their size. (A) Margin in northwest Greenland (PGIC), where snowfields or ice debris from dry calving were included in the ice mask in many locations. (D) Margin in northeast Greenland (PGIC) with potentially inconsistent mapping methodology. The southern part shows a meticulous mapping at pixel scale, whereas the northern part is highly generalized. (C) Margin in South Greenland (GrIS) with a systematic offset, possibly pointing to a temporal difference between image and margin detection.
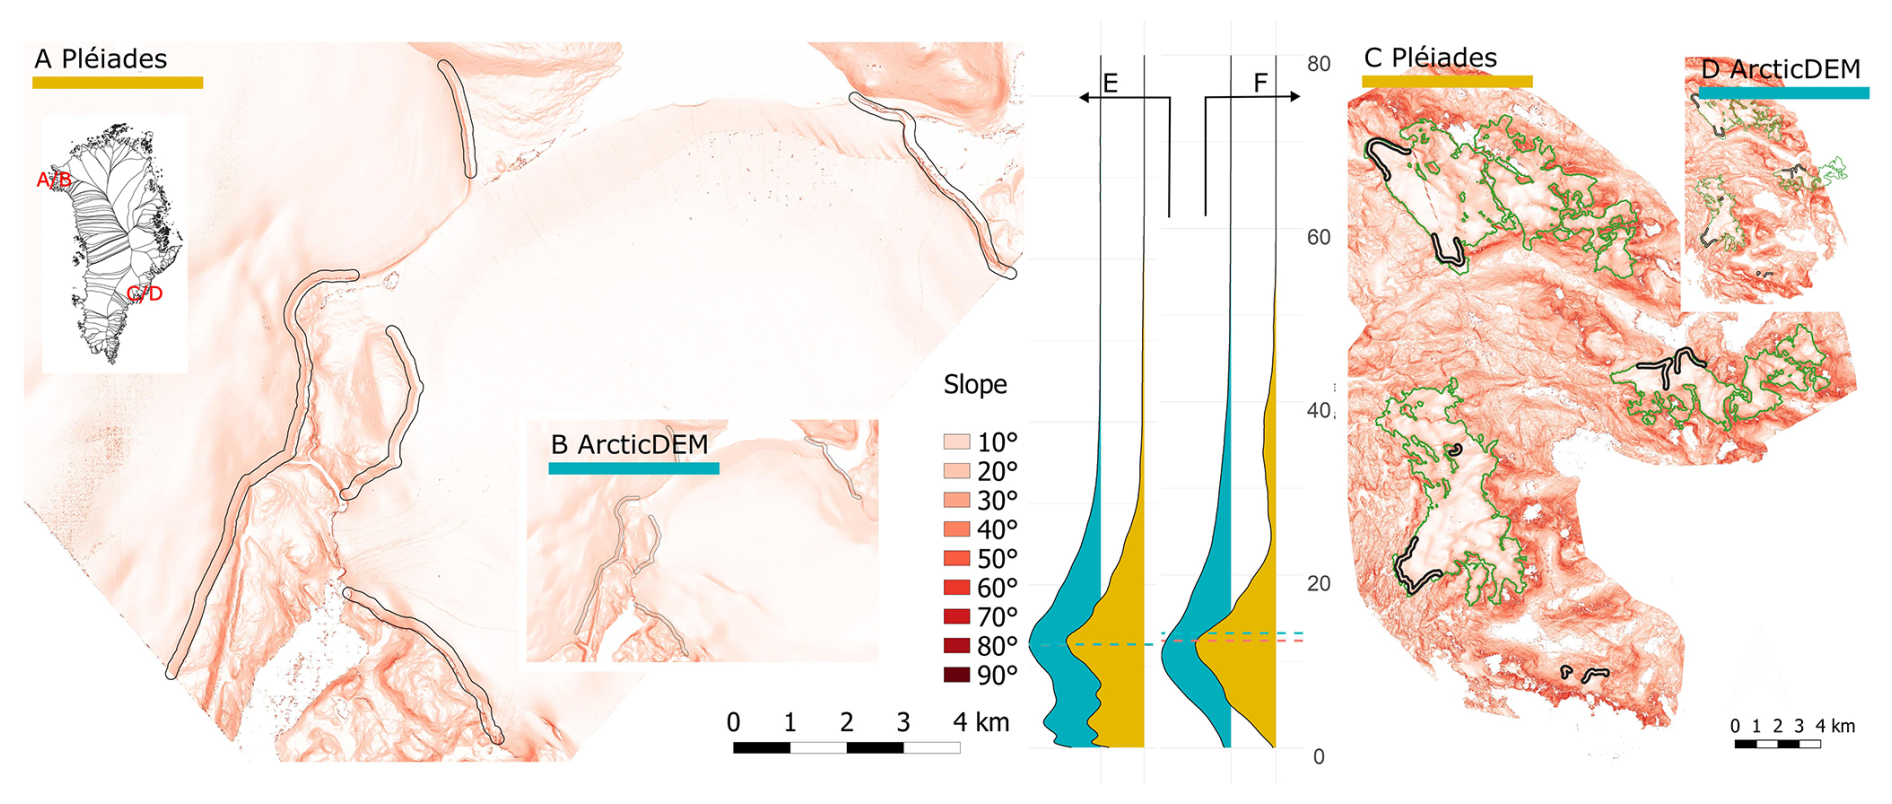
Figure 5Comparison of slopes at the Nunatarssuaq ice cap (A, B) and Mittivakkat glacier area (C, D; see inset for location in Greenland) derived from the Pléiades and ArcticDEM, respectively. The slope distributions (E, F) show the distribution of slope values within the buffer around the margin, shown in the map panels.
The second requirement we ascertain by a comparison to Pléiades imagery with the same 2 m resolution as the ArcticDEM. Figure 5 and Table 2 show slopes in both products in two field sites (see Supplement for details on data). While neither timing nor native resolution of the DEMs are the same, slope maps match well, with Spearman correlation higher than 0.75. Both products retain maximum slope values beyond 60° in known vertical sections of the margin, suggesting that the ArcticDEM is able to catch (near-)vertical sections of the ice margin. This supports the hypothesis that the ArcticDEM is suitable to derive margin morphologies at a larger scale.
Table 2Statistical comparison between slope values extracted from a buffer around the margin of two focus areas (see also insets in Fig. 5). n is the total number of pixels that are overlapping in both products.
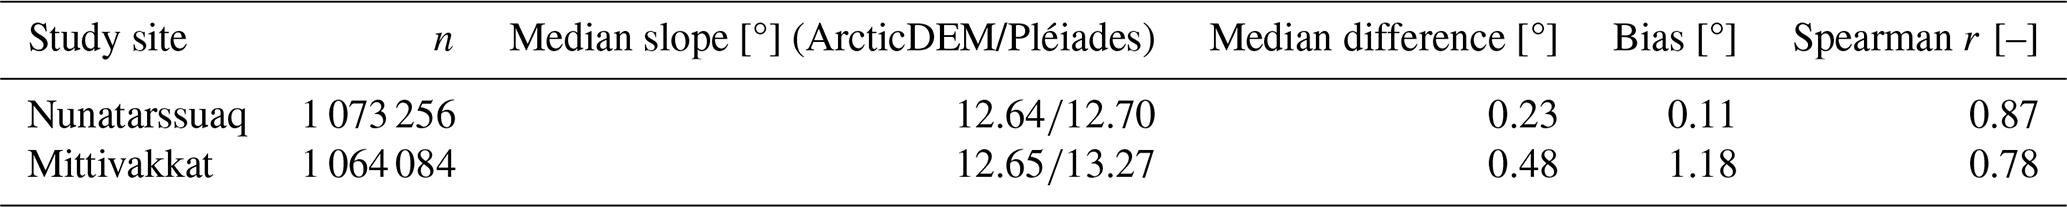
The final criterion to evaluate whether the available data can potentially identify margin morphologies is whether the margin buffer is able to capture the actual ice margin. To test this, we placed transects across a total of 152 locations of the buffer (Fig. 6, see Supplement for locations and process as well as the data repository, where all transects are provided). 43 of the locations were selected from regions known to the authors, to allow for a better interpretation of the results. An additional 109 locations were placed randomly across the island, without any prior knowledge of the respective regions. Across the margin there are two types of clear misclassifications, when the actual margin is missed by the buffer, which makes up 5 % of the samples taken (cases G and H in Fig. 6) in the first subset of transects (n=43) and 16 % in the larger randomized set (n=109). The values correspond to the overall fraction of erroneous margin identified for all of Greenland (6.0 %, Table 1), for which we however do not extract morphology statistics. We use the more conservative approach and therefore suggest that 16 % of all morphology values presented are erroneous, representing the slope of adjacent land or ice rather than the margin itself. In 10 % of the cases more than half of the margin buffer based on the ice masks captures periglacial terrain with different slope than the ice (cases I and J). Cases A and B show typical transects at shallow margins. While here ice-free terrain is often included in the buffer, it does not lead to misclassifications if the ice-free terrain has similar steepness. In many regions the buffer may only sample a limited section of the ice margin, but it represents the dominant slope (I, J). To not bias samples towards shallow proglacial terrain or shallow sections of the ice behind the margin, slopes below 5° are discarded from the morphological analysis. Similarly, cases C and D are typical steep sections, where always some shallower terrain (on or off-ice) will be included.
Figure 6Example profiles intersecting perpendicular to the margin, the line representing the surface. The red part marks the surface that intersects the margin buffer, the blue shade indicates ice cover and green shade the position of the actual ice margin. Panels (G) and (H) are considered misclassifications, panels (I) and (J) represent considerable offsets with large parts of ice-free terrain captured by the buffer, while all others capture the actual ice margin well. Note that with the exception of panel (H), all vertical axis have the same range, while the horizontal range differs depending on the necessity to show surrounding topographies.
4.3 Identifying spatial margin morphology
It is apparent from above that calculating the average slope across a certain section would not return a useful metric for describing margin morphology. It would be impossible to tell when the data in case of steep margins are biased towards shallow parts of the proglacial terrain or the ice surface included in the buffer or when shallow segments are misclassified as steep due to the inclusion of steep ice-free terrain adjacent to the ice. We therefore establish exemplary cumulative distribution functions (CDF) for four types of margin from a total of 40 1 km grids (with a total of 741 225 individual 2 m cells), namely near-vertical margin on shallow terrain (21 %, example Cb in Fig. 7), near-vertical margin on steep terrain (5 %, example D in Fig. 7), steep ramps (26 %, Ca) and shallow ramps, both around ice caps (31 %, A) and a mountain glacier (17 %, B). We use the term “near-vertical” to include margin sections that are vertical as well as very steep (roughly > 45°), and “shallow” vs. the term “gentle” used previously only for ramps < 5° (Nobles, 1961). These distributions were obtained from grid cells where margins are well known from field studies (Fig. 7). Shallow margins are predominately below 20°. However, ramps located along margins with relatively flat proglacial terrain (as in Inglefield, Fig. 7), still have a distinctly different slope distribution than those with adjacent mountain slopes. Slopes on steep ramps are clustered below 20° and upper quantiles are similar to shallow ramps, but the median is distinctly higher. Near-vertical sections on shallow terrain can be distinguished by higher fraction in upper quantiles, while those over steep terrain – common around outlet and mountain glaciers but often less distinctly vertical than their counterparts on shallow terrain – have a higher median, which can be largely explained by the slope of the terrain rather than the ice margin itself. We consider this specific type of near-vertical margin over steep terrain separately for two reasons. It becomes difficult to identify whether margin in these regions is predominately steep because of ice morphology or underlying terrain, and sections may be vertical ice falls while others may be steep ramps. These parts generally also do not include vertical ice cliffs that motivated previous investigations into the terrestrial margin (Goldthwait, 1960; Weidick, 1963; Steiner et al., 2022).
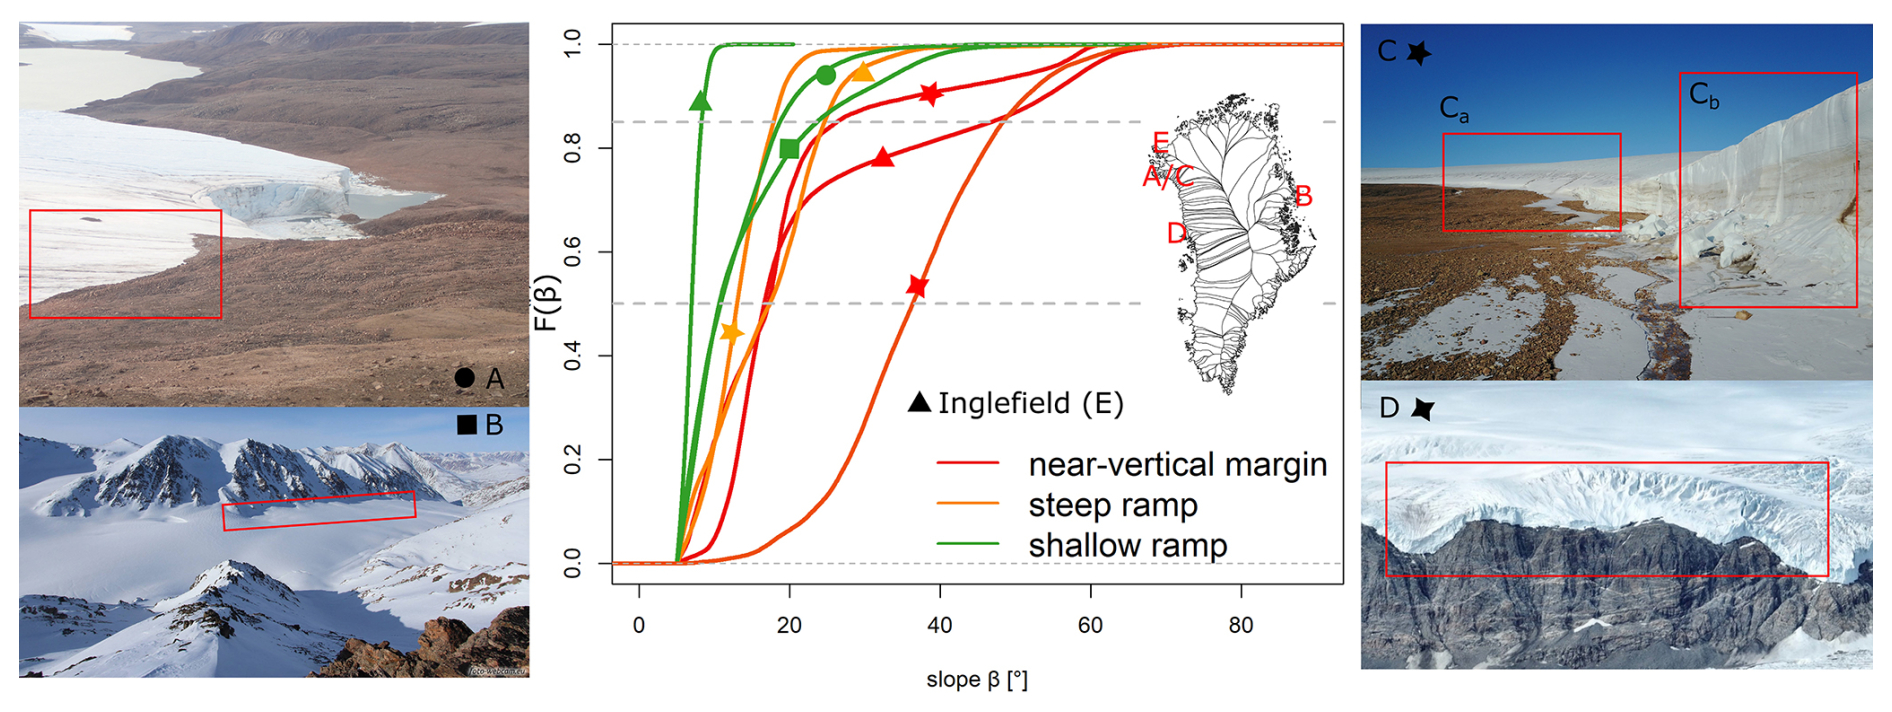
Figure 7Cumulative distribution functions for selected margin sections, identifying near-vertical cliffs (red), steep (orange) and shallow ramps (green). Symbols refer to regions where margin types were sampled, shown in the four photos. Horizontal dashed lines are the 50th and 85th quantile. Red squares in the photos denote the approximate margin areas selected. Locations A and C are at the Nunatarssuaq ice cap (Abermann et al., 2020), B is Freya Glacier, and D is located in West Greenland (Abermann et al., 2023, photo: Fauland/Wally). Locations in Inglefield Land are documented in Kjær et al. (2018) and Esenther et al. (2023).
A detailed presentation of grid cells used for the CDFs used for classification is provided in the Supplement. The CDFs have a median of 8° for shallow ramps, 14° for steep ramps and 17°36° for near-vertical margin on shallow and steep terrain, respectively. The small difference between median values illustrates how a clear distinction would become difficult, using those alone. The 85th quantile however (18, 22°) corresponds to the rough definition of shallow ramps (< 20°) and steep ramps (20–45°) by Nobles (1961). Figure 8 shows examples of the margin with the predominant margin morphologies identified. The algorithm is able to capture relatively swift transitions between shallow ramps, to steep cliff sections across a terminus (Fig. 8A). On the larger scale, sections well known as continuous cliffs for example along the Hiawatha crater, eventually transitioning to steep ramps and much more shallow ramps in Inglefield Land are captured by this approach (Fig. 8B).
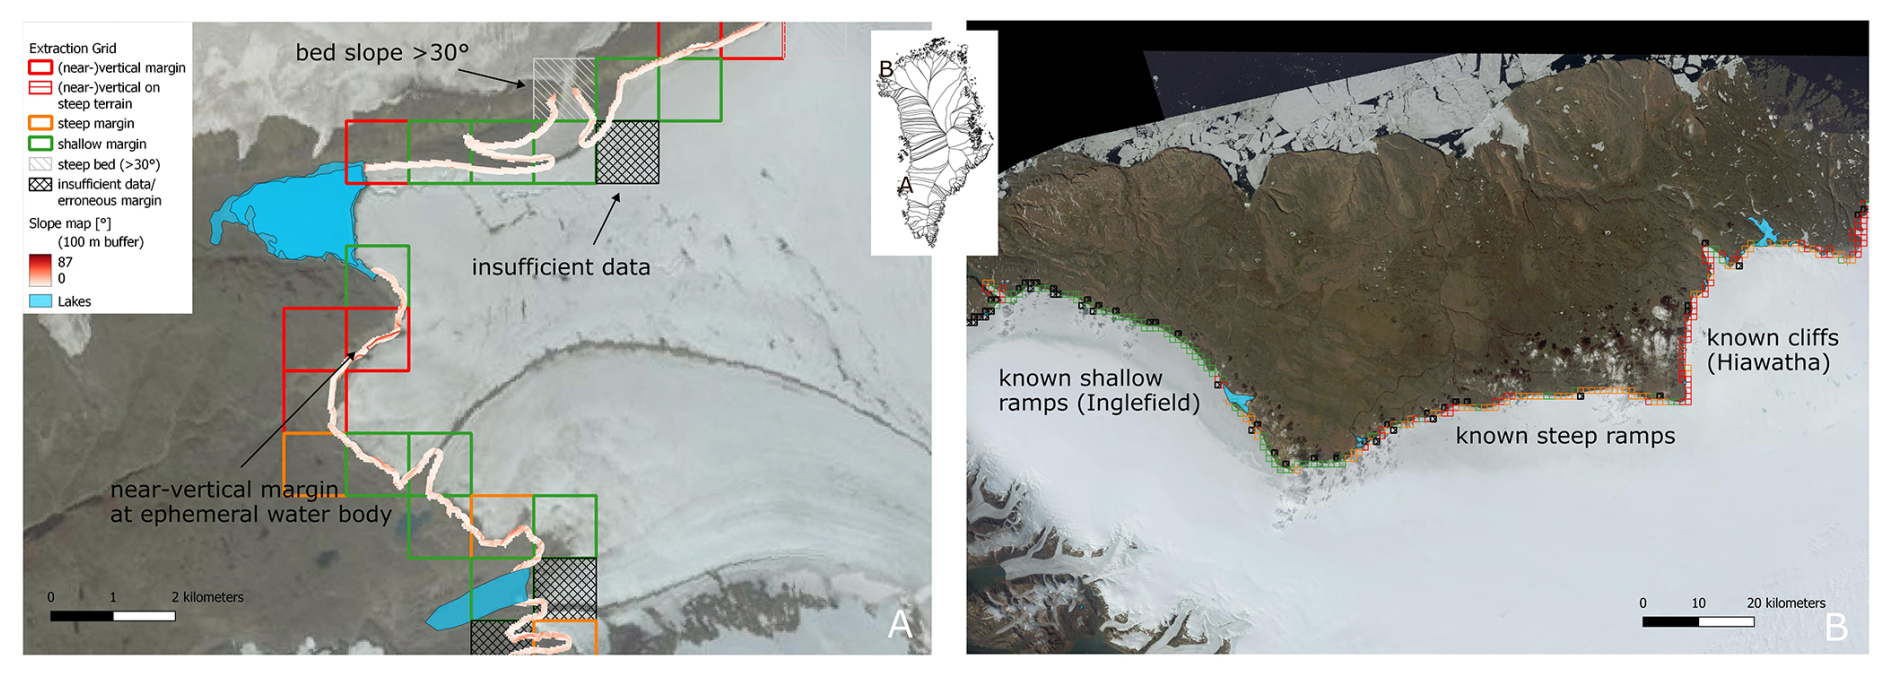
Figure 8Examples of identified predominant margin morphologies in southwest (A, catchment 4) and northwest Greenland (B, catchment 176).
Across Greenland we find that along the land-terminating margin of the GrIS 24.8 % are near-vertical cliffs on shallow terrain (another 16.1 % over steep terrain), 9.5 % steep and 20.2 % shallow ramps (while the remaining 29.4 % were not evaluated, due to erroneous margin masks or bed topography steeper than 30°, Table 3). There are however large differences between regions, with one third of the margin in West and North Greenland ending in shallow ramps, but only about 10 % in Central and South East Greenland, where instead near-vertical margins on steep terrain are more common. Individual basins have up to 50 % near-vertical margins on shallow terrain, while others have more than 70 % shallow margins. Shallow ramps are especially prevalent across the northern margin and in southwest Greenland and largely absent in the more complex eastern basins (Fig. 9A). Near-vertical margins are also prevalent on PGICs in East Greenland (Table 3, Fig. 9B), while more rare in North Greenland where shallow ramps are more common. Across all regions 19.2 % of the land-terminating margin morphology was not assessed due to the steep bed topography (13.2 %) or erroneous ice masks (6 %, Tables 1 and 3). In 16 of the 220 basins less than 10 % and in 3 basins more than 90 % of the land-terminating margin was not classified.
Table 3Fractions of the terrestrial margin respectively classified as “near-vertical” (in brackets values for near-vertical sections on steep terrain, see Fig. 7D), “steep” or “shallow” ramps. NA refers to margin sections where the morphology was not investigated, either due to erroneous margin (see also Table 1) or steep bed topography.

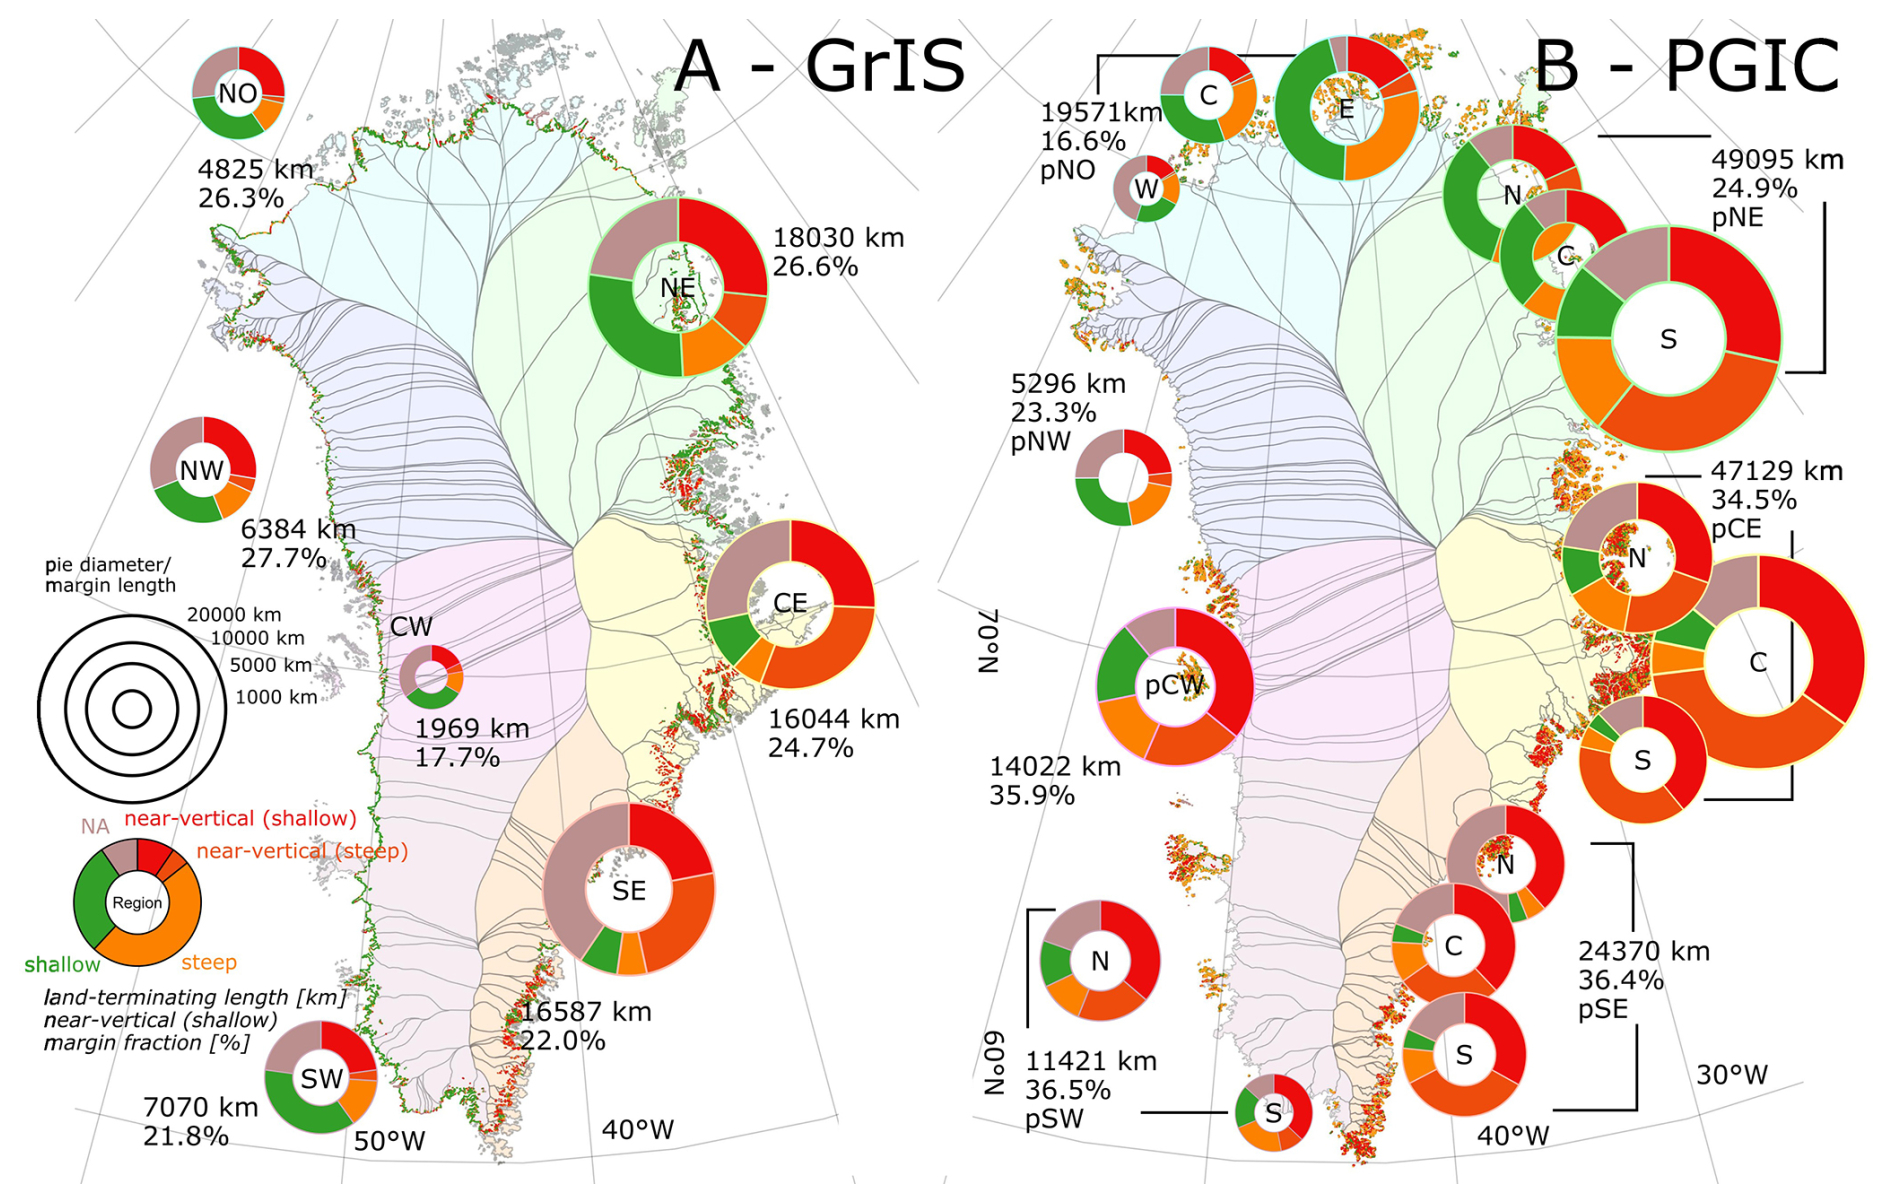
Figure 9Distribution of margin morphologies along the land-terminating ice margin on the GrIS (A) and the PGIC (B). Morphologies include near-vertical margin over shallow as well as over steep terrain, steep margin sections as well as shallow ramps.
5.1 Interpretation of margin types
Locations and extents of marine termini in Greenland have been mapped in great detail for PGIC (Kochtitzky and Copland, 2022) and the GrIS (Greene et al., 2024; Ryan et al., 2024) and for both cases (Carrivick et al., 2022), all with different approaches and data. Kochtitzky and Copland (2022) and Carrivick et al. (2022) provide estimates of 697 km and 615 km, respectively, for marine termini on PGIC, considerably less than our estimates (Table 1), which can be explained by their focus on flux gates specifically for outlet glaciers. More comparable are estimates of ice-water interfaces across the ice sheet by Carrivick et al. (2022) (1698 km, 2016–2019) and Ryan et al. (2024) (1438.6 km, 2003–2007), roughly two thirds and one half, respectively, of the 2738.5 km mapped with our approach. These differences can be explained, because we consider any part of the ice mask located where the DEM is < 10 m a.s.l. as marine-terminating, and subsequently also include lateral sections along fjords or convoluted margin polygons at the marine terminus. For the 84 subbasins on the ice sheet, where the marine-terminating margin was larger than 10 km, we manually calculated the marine-terminating margin actually in contact with water and find that this reduces our margin estimate by 33 %, bringing our comparable estimate to just 1834.8 km. The remaining overestimation can be explained by our use of the actual ice mask, which oftentimes has winding shapes in locations where manually mapped margins by other studies draw relatively smooth lines. While our margin length should therefore not be used to estimate ice flux, these much larger margin segments describe the locations where the ice is in potential dynamic contact with the ocean or conversely is not based on solid rock. Lake margins mapped by Carrivick et al. (2022) for the GrIS are 3176 km (compared to 2738.5 km mapped in our study) and for the PGIC 795 km (952.8 km), respectively, while Ryan et al. (2024) find 531.3 km for GrIS. The large variability between all three studies, shows the sensitivity of these estimates to choice of ice mask, with Carrivick et al. (2022) relying on a buffer, also including lakes that do not directly intersect with the margin, while Ryan et al. (2024) draw relatively smooth lines. In our study the margin is relatively long as the ice mask in lake locations is winding, also including closed polygons inside the mask. This is further visualized by the relatively low estimate of the total ice sheet perimeter in Ryan et al. (2024) (29 269 km, where nunataks are excluded), well below the total length of any of the available ice masks (70–80 000 km). The choice of underlying data and especially resolution of the highly complex margin remains crucial when deriving regional estimates of the relative importance of the respective margin types.
Our study highlights the importance of the land-terminating margin when considering the total area where ice interacts with surrounding terrain. The high total lengths for land-terminating margin as well as their relative fractions of consistently above 93 % in the NE, CE and SE regions (both on the GrIS as well as PGIC, Table 1) reflect the much more fractured and winding character of the margin in these regions. However, the land-terminating margin also dominates elsewhere and is above 85 % in all regions.
5.2 Interpretation of margin morphologies
We rely on mosaics of the ArcticDEM product here, produced from imagery over multiple years, to assure a continuous coverage and comparable quality of the tiles across Greenland. Relying on these data ignores changes along the margin that happen within a few years. Due to the resolution of 2 m and the steep nature of large sections of the margin, the product is also not able to definitely distinguish vertical sections from near-vertical sections of the margin. However, a comparison to higher resolution Pléiades data suggests that the ArcticDEM is able to capture the margin morphology, with differences in slope less than half a degree (Table 2). Chudley et al. (2021), relying on the same ArcticDEM mosaics to detect crevasses, have similarly noted the product's quality to capture such features, with an even more ephemeral nature. With the rapid development of high resolution elevation data, especially with the inclusion of repeat ICESat-2 and CryoSat data (Winstrup et al., 2024), investigations of the margin, including its temporal change can be further refined.
Having identified approximately 25 % of the land-terminating margin as near-vertical on shallow terrain in NW, NO and NE Greenland, respectively, suggests that the initial estimate of 45 % of the margin in North Greenland being dominated by ice cliffs (Goldthwait, 1961), was overestimated. Photographic evidence across North Greenland also suggests that likely much less than half of the ice margin is actually ending in cliffs. It is possible that he understood this number to include cliffs as well as very steep sections, which could not be accessed unaided, an initial interest of their research. The additional 11.6 % to 12.6 % found to be such ramps in the region, as well as 2.3 % to 9.9 % of near-vertical margin over steep terrain are already much closer to his initial proposition.
Near-vertical margin sections over steep terrain were on average located at highest elevations across all 14 regions (μ=1129 m a.s.l., σ=402 m a.s.l.), with near-vertical sections over shallow terrain (870, 301 m), steep (750, 228 m) and shallow margins (695, 198 m) following. This provides a first indication that margin morphology is not randomly distributed and follows patterns that can be associated to either ice dynamics or climate. However, the high standard deviations point to the strong variability between regions, which requires further scrutiny. With the present data, we are also able to show that with the exception of central east and southeast Greenland, where lake-terminating margins are especially limited, near-vertical margins over shallow terrain are more frequently directly adjacent to mapped lakes than other parts of the margin. 2.9 % of near-vertical margin on shallow terrain directly connect to lakes present in the inventory, while only 2.1 % of the rest of the margin do so. This points towards one of the original hypotheses, that ice cliffs are potentially formed when water bodies are present next to the margin. However, to further investigate this, lake inventories from multiple years before the acquisition of the DEMs and a more detailed analysis of margins with ice-lake interfaces are required.
To investigate whether the different margin types vary in their extent, we investigated all margin sections longer than 30 m that are connected without any interruption (Fig. 10). As for the distribution in elevation, there are regional differences, with uninterrupted sections in the North of Greenland with relatively shallow terrain (e.g. Peary or Inglefield Land, NO in Fig. 10) much longer than elsewhere and in the mountainous terrain in East Greenland and some ice caps, uninterrupted sections are especially short. It is also clear that shallow margins tend to be longer, with a median of 620 m on the ice sheet, with steep margins just 540 m and near-vertical margins 475 m long. Maximum connected shallow margin lengths are above 33 km with steep and near-vertical margins never longer than 22 km. We suggest that this higher number of shorter margin sections for steep or near-vertical morphologies, which corresponds to our observations of these morphologies in the field, is due to them being possibly more dynamically active, with heterogeneous recession or even partial advance, while shallow margins generally indicate a retreating margin. Still, approximately one third of all near-vertical margins on GrIS and PGIC are longer than 1 km.
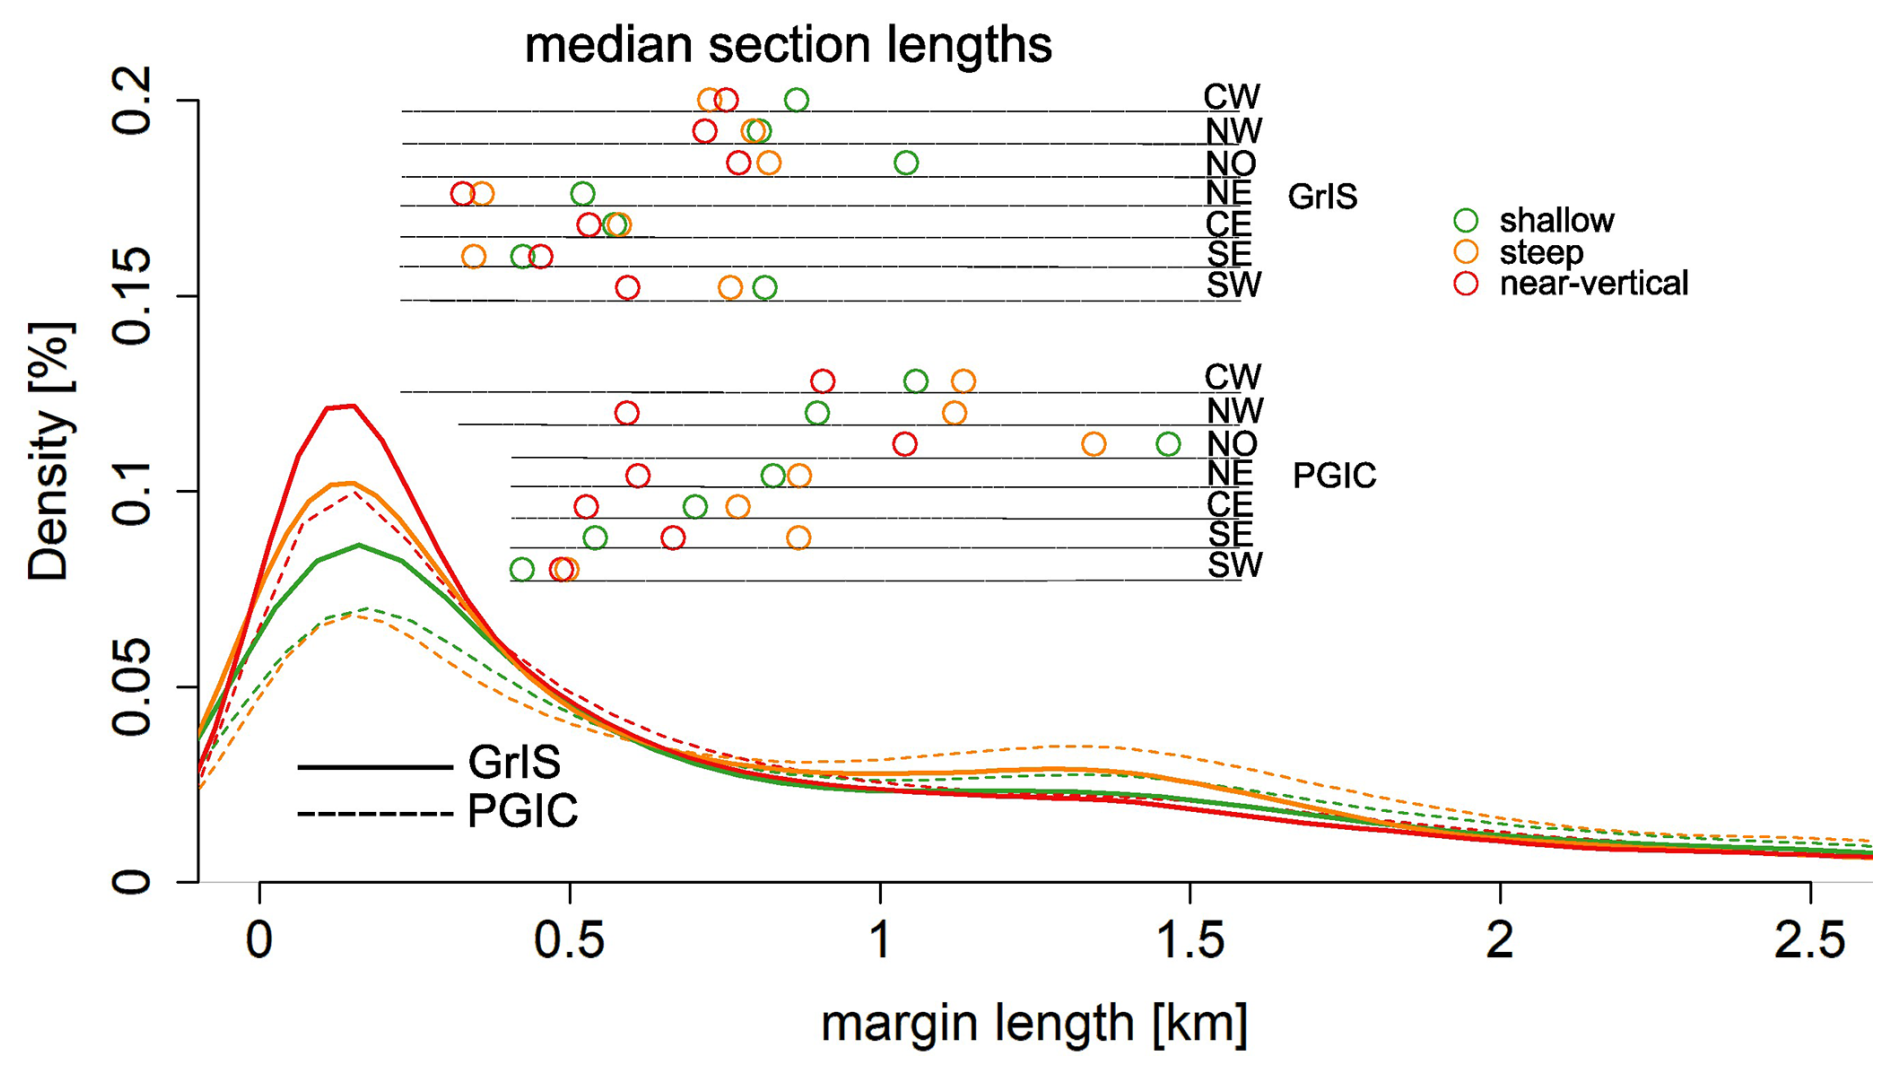
Figure 10Density of individual connected margin sections according to their morphology, with shallow (green), steep (orange) and near vertical (red) margin sections. Data points longer than 2.5 km are not shown. Circles show median lengths across all margin sections for each subregion on both GrIS and PGIC.
There is a large difference in morphology between the Western and Eastern margins of GrIS as well as PGIC (Table 3). Why this is the case cannot be conclusively answered here, but we find that many near-vertical and steep sections in the eastern subbasins and along eastern PGICs are located along bedrock outcrops at higher elevations. In North Greenland (with much smaller numbers in mountain and outlet glaciers) near-vertical sections generally appear along straight sections of the GrIS margin, as has been documented in field studies (Abermann et al., 2020; Kjær et al., 2018), while in West and South Greenland they are more scattered along glacier lobes. This is further underlined by the generally longer connected near-vertical margin sections in the North compared to the South. The dominance and above average length of continuously connected shallow ramps in the far North (Peary Land) and the northeast (around the outlet of Zachariæ Isstrøm, Fig. 9) correspond to the abundance of relatively shallow ice caps (e.g. Hans Tausen Ice Cap, Zekollari et al., 2017) and vast expanses of land-terminating margins in generally shallow terrain.
5.3 Future application of the dataset
Relying on available distributed data on bed topography (Morlighem et al., 2017), surface mass balance (Mankoff et al., 2021), ice velocity (Solgaard et al., 2021) as well as climate (Noël et al., 2018) potentially allows to investigate which variables determine the margin morphology, or inversely how the margin morphology potentially affects local ice dynamics and mass change. As we have evidence that margin morphology is changing over time, with vertical sections having turned into ramps over recent decades (Abermann et al., 2020), future work should also investigate the temporal evolution of steep sections across the margin, to elucidate the potential of margin morphology informing about the state of the ice sheet and ice caps and their climatic drivers. Previous research suggested that 1 %–10 % of local mass loss of a glacier in Antarctica can be attributed to dry calving when a vertical margin is present (Fountain et al., 2006). Considering the large steep fraction of the margin in some subbasins on the GrIS as well as PGIC, a reassessment of the role of dry calving in local mass loss is desirable.
Numerical simulations of steep land-terminating ice margins have been attempted (Leysinger Vieli and Gudmundsson, 2010; Wirbel and Jarosch, 2020). Our dataset provides a sample of existing margin types that could serve as a morphology baseline. To do so, a first step would be to establish idealized margin morphologies drawn from the data, including height, slopes and associated bed topography. Paired with knowledge about past and present (Løkkegaard et al., 2023) and potential future ice temperatures this would allow for improvements in numerical simulations of ice margin retreat and advance and answer to what degree the slope of the margin is an indicator of ice dynamics (Steiner et al., 2022).
5.4 Limitations and future improvements
The results of our analysis heavily rely on the underlying quality of the ice masks as well as the DEMs, their temporal match as well as our ability to correctly identify where the margin transitions from land to water. As we rely on consistent products across Greenland, we accept errors in individual locations, which we believe comes with such regional approaches. Our most conservative estimate suggests that 16 % of the final morphology data is erroneous, i.e. represents slopes adjacent to the margin rather than of the margin itself. Beyond our ability to check from individual field locations whether the identified morphology is correct, we do not have other validation data available. As we have now identified hotspots of the occurrence of steep to very steep margin sections, future work can narrow in on those limited areas (making up roughly one third of the total land-terminating margin), allowing for a manual correction of available masks in these specific sections as well as manual quality control of the underlying DEMs. The results presented here only characterize the margin morphology in the decade after 2010, when the ArcticDEMs were produced. With the help of a newly available and consistent ice mask towards the end of this period (Luetzenburg et al., 2026), and timestamps for each pixel of the DEM mosaics, future work can further narrow down the precise location of the margin and investigate changing margin morphologies. This is especially true for parts of the margin where recession has been rapid (e.g. towards the snout of low-lying outlet and peripheral glaciers, Larocca et al., 2023), for which quality control in the present dataset remains limited.
Our study allows for an interpretation of morphologies along the land-terminating margin. Where the margin intersects lakes, confidence in the correct position of the ice masks decreases due to complex interactions and hence more dynamic conditions at the ice-water interface. We therefore refrain from a regional interpretation of margin morphologies along lake termini without manually delineating actual margin sections, as has been done before for marine termini (Kochtitzky and Copland, 2022) and any margins intersecting with water (Ryan et al., 2024). Future work should therefore consider mapping the more than 3000 km of lake-terminating margin across Greenland, including its temporal evolution at least a decade before the time stamp of the ArcticDEM. This would allow to determine how ice morphologies relate to the presence of lakes, or past occurrence of water bodies adjacent to the margin.
In this study we have provided a first comprehensive quantification of the relative length of the land-terminating margin in Greenland based on existing ice masks. We show that regionally between 85 % and 99 % of the ice margin is land-terminating, with values ranging from 24 % to 100 % considering individual catchments. Although ice flux along the land-terminating margin is smaller compared to the equivalent margin length ending in water, this large total length of 241 537 km underlines the importance of understanding associated processes, both for ice dynamics as well as the role the margin plays for peripheral hydrology, ecology, and geomorphology. At the same time we also show that on the GrIS, lake-terminating margins cover relatively similar stretches (3.3 % of a total of more than 76 000 km) as marine-terminating margins (3.6 %) while values are smaller for PGICs (0.6 % vs. 1.6 % of a total of more than 174 000 km), confirming the overall important role lakes play when considering marginal ice dynamics in Greenland.
Our study shows the potential of the ArcticDEM products to investigate complex morphological features. The median difference in slope across an area of 8.5 km2 along the margin at two study sites where a Pléiades DEM is available ranges only between 0.2 and 0.5°. While the ArcticDEM is not able to capture vertical sections as perfect 90° planes, the clear distinction in slope distribution between shallow ramps, steep ramps and actual vertical sections is clearly visible and suggests the DEMs to be suitable to detect regional morphological patterns. Relying on random samples across 109 locations on the land-terminating margin, we find that the approach we take is able to correctly identify the actual ice margin across 84 % of the margin, erroneously mapping adjacent terrain in the remaining cases.
Extracted margin morphologies suggest that between 17.7 % to 36.5 % of the land-terminating margin end in near-vertical sections, including vertical ice cliffs, over relatively shallow terrain in individual regions (and up to 50 % in some subbasins, especially frequent along the Northern GrIS margin and along PGICs in East Greenland). In general, more than half of the margin is composed of cliffs or steep ramps (> 25°). These individual steep sections are approximately 15 % shorter than continuous shallow sections but can still extend over multiple kilometers. More than half a century after Weidick (1963) noted the need to investigate the presence of ice cliffs at the regional scale in Greenland, we can show that this is now possible with relatively novel high resolution data. In contrast, shallow ramps are especially abundant along the northeast and southwest GrIS margin and on PGICs in North Greenland. Spatial variability is large and potentially driven by varying climate and underlying topography as well as upstream ice dynamics. The dataset produced in this study provides a basis for further investigations on the link between margin morphology, ice dynamics, bed topography and climate and can help to elucidate past and potential future patterns of the response of the ice margin at the interface with the proglacial terrain across Greenland.
All data generated and associated code, which allows to extract individual morphologies from raw ArcticDEM data as well as reproduce the uncertainty analysis for this study are available in Steiner et al. (2025, https://doi.org/10.5281/zenodo.15491607). Additional description of data is available in the Supplement associated to this manuscript.
The supplement related to this article is available online at https://doi.org/10.5194/tc-20-1797-2026-supplement.
All authors conceived the study. JS performed the analysis and wrote the manuscript, with input from JA and RP.
The contact author has declared that none of the authors has any competing interests.
Publisher's note: Copernicus Publications remains neutral with regard to jurisdictional claims made in the text, published maps, institutional affiliations, or any other geographical representation in this paper. The authors bear the ultimate responsibility for providing appropriate place names. Views expressed in the text are those of the authors and do not necessarily reflect the views of the publisher.
The authors acknowledge the financial support by the University of Graz. The authors also acknowledge the Government of Greenland for support for an initial reconnaissance expedition in 2017 through the Tipps og Lottomidler Pulje C, that provided the basis for this study. The Pléiades stereo-pairs used in this study was provided by the Pléiades Glacier Observatory initiative of the French Space Agency (CNES). Greenlandic names were used where available, while the use of “Greenland” was retained when referring to standard terms like “Greenland Ice Sheet” or regional descriptions following previous studies. The authors are grateful to the constructive comments by reviewers Erin Pettit, Anders Anker Bjørk, Jonathan Ryan as well as the Editor Joseph MacGregor, that have considerably improved an earlier version of the manuscript.
This research has been supported in whole by the Austrian Science Fund (FWF) (grant no. 10.55776/P36306).
This paper was edited by Joseph MacGregor and reviewed by Erin Pettit and Anders Bjørk.
Abermann, J., Steiner, J. F., Prinz, R., Wecht, M., and Lisager, P.: The Red Rock ice cliff revisited – six decades of frontal, mass and area changes in the Nunatarssuaq area, Northwest Greenland, J. Glaciol., 1–10, https://doi.org/10.1017/jog.2020.28, 2020. a, b, c, d, e, f, g, h
Abermann, J., Vandecrux, B., Scher, S., Löffler, K., Schalamon, F., Trügler, A., Fausto, R., and Schöner, W.: Learning from Alfred Wegener’s pioneering field observations in West Greenland after a century of climate change, Sci. Rep., 13, 7583, https://doi.org/10.1038/s41598-023-33225-9, 2023. a, b
Berthier, E., Lebreton, J., Fontannaz, D., Hosford, S., Belart, J. M.-C., Brun, F., Andreassen, L. M., Menounos, B., and Blondel, C.: The Pléiades Glacier Observatory: high-resolution digital elevation models and ortho-imagery to monitor glacier change, The Cryosphere, 18, 5551–5571, https://doi.org/10.5194/tc-18-5551-2024, 2024. a
Bishop, B. C.: Shear moraines in the Thule area, northwest Greenland, Research Report 17, U.S. Army Snow, Ice, and Permafrost Research Establishment. Engineer Research and Development Center (U.S.), Wilmette, Illinois, https://erdc-library.erdc.dren.mil/items/81b728f7-5e7b-4ef8-e053-411ac80adeb3 (last access: 6 March 2026), 1957. a
Carrivick, J. L., Yde, J. C., Knudsen, N. T., and Kronborg, C.: Ice-dammed lake and ice-margin evolution during the Holocene in the Kangerlussuaq area of west Greenland, Arct. Antarct. Alp. Res., 50, S100005, https://doi.org/10.1080/15230430.2017.1420854, 2018. a, b
Carrivick, J. L., How, P., Lea, J. M., Sutherland, J. L., Grimes, M., Tweed, F. S., Cornford, S., Quincey, D. J., and Mallalieu, J.: Ice-Marginal Proglacial Lakes Across Greenland: Present Status and a Possible Future, Geophys. Res. Lett., 49, e2022GL099276, https://doi.org/10.1029/2022GL099276, 2022. a, b, c, d, e
Chamberlin, T. C.: Glacial Studies in Greenland. VIII, J. Geo., http://archive.org/details/jstor-30055074 (last access: 6 March 2026), 1895. a
Chudley, T. R., Christoffersen, P., Doyle, S. H., Dowling, T. P. F., Law, R., Schoonman, C. M., Bougamont, M., and Hubbard, B.: Controls on Water Storage and Drainage in Crevasses on the Greenland Ice Sheet, J. Geophys. Res.-Earth, 126, e2021JF006287, https://doi.org/10.1029/2021JF006287, 2021. a
Citterio, M. and Ahlstrøm, A. P.: Brief communication ”The aerophotogrammetric map of Greenland ice masses”, The Cryosphere, 7, 445–449, https://doi.org/10.5194/tc-7-445-2013, 2013. a, b
Davies, W. and Krinsley, A.: The recent regimen of the ice cap margin in North Greenland, Int. Assoc. Sci. Hydrol. Publ., 58, 119–130, 1962. a
Davison, B. J., Sole, A. J., Livingstone, S. J., Cowton, T. R., and Nienow, P. W.: The Influence of Hydrology on the Dynamics of Land-Terminating Sectors of the Greenland Ice Sheet, Front. Earth Sci., 7, https://doi.org/10.3389/feart.2019.00010, 2019. a, b
Dawes, P. R. and van As, D.: An advancing glacier in a recessive ice regime: Berlingske bræ, North-West Greenland, Geol. Surv. Den. Greenl., 20, https://doi.org/10.34194/geusb.v20.4986, 2010. a, b
Dowd, C.: A New ECDF Two-Sample Test Statistic, arXiv [preprint], https://doi.org/10.48550/arXiv.2007.01360, 2020. a
Esenther, S. E., Smith, L. C., LeWinter, A., Pitcher, L. H., Overstreet, B. T., Kehl, A., Onclin, C., Goldstein, S., and Ryan, J. C.: New proglacial meteorology and river stage observations from Inglefield Land and Pituffik, NW Greenland, Geosci. Instrum. Method. Data Syst., 12, 215–230, https://doi.org/10.5194/gi-12-215-2023, 2023. a
Farnsworth, L. B., Kelly, M. A., Bromley, G. R. M., Axford, Y., Osterberg, E. C., Howley, J. A., Jackson, M. S., and Zimmerman, S. R.: Holocene history of the Greenland Ice-Sheet margin in Northern Nunatarssuaq, Northwest Greenland, arktos, 4, 10, https://doi.org/10.1007/s41063-018-0044-0, 2018. a, b
Fountain, A. G., Neumann, T. A., Glenn, P. L., and Chinn, T.: Can climate warming induce glacier advance in Taylor Valley, Antarctica?, J. Glaciol., 50, 556–564, https://doi.org/10.3189/172756504781829701, 2004. a
Fountain, A. G., Nylen, T. H., MacClune, K. L., and Dana, G. L.: Glacier mass balances (1993–2001), Taylor Valley, McMurdo Dry Valleys, Antarctica, J. Glaciol., 52, 451–462, https://doi.org/10.3189/172756506781828511, 2006. a
Goldthwait, R.: Study of Ice Cliff in Nunatarssuaq, Greenland, Tech. Rep. 39, U.S. Army Cold Regions Research and Engineering Laboratory, Corps of Engineers, Wilmette, Illinois, https://erdc-library.erdc.dren.mil/items/81b728f7-6c6e-4ef8-e053-411ac80adeb3 (last access: 6 March 2026), 1960. a, b
Goldthwait, R.: Regimen of an Ice Cliff on Land in Northwest Greenland, Folia Geographica Danica. Tom. IX, 1961. a, b, c
Goldthwait, R.: Restudy of Red Rock Ice Cliff Nunatarssuaq, Greenland, Corps of Engineers, U.S. Army Cold Regions Research and Engineering Laboratory, https://apps.dtic.mil/sti/html/tr/AD0732411/index.html (last access: 6 March 2026), 1971. a
Goliber, S., Black, T., Catania, G., Lea, J. M., Olsen, H., Cheng, D., Bevan, S., Bjørk, A., Bunce, C., Brough, S., Carr, J. R., Cowton, T., Gardner, A., Fahrner, D., Hill, E., Joughin, I., Korsgaard, N. J., Luckman, A., Moon, T., Murray, T., Sole, A., Wood, M., and Zhang, E.: TermPicks: a century of Greenland glacier terminus data for use in scientific and machine learning applications, The Cryosphere, 16, 3215–3233, https://doi.org/10.5194/tc-16-3215-2022, 2022. a
Greene, C. A., Gardner, A. S., Wood, M., and Cuzzone, J. K.: Ubiquitous acceleration in Greenland Ice Sheet calving from 1985 to 2022, Nature, 625, 523–528, https://doi.org/10.1038/s41586-023-06863-2, 2024. a
Hanna, E., Pattyn, F., Navarro, F., Favier, V., Goelzer, H., van den Broeke, M. R., Vizcaino, M., Whitehouse, P. L., Ritz, C., Bulthuis, K., and Smith, B.: Mass balance of the ice sheets and glaciers – Progress since AR5 and challenges, Earth-Sci. Rev., 201, 102976, https://doi.org/10.1016/j.earscirev.2019.102976, 2020. a
Hijmans, R.: terra: Spatial Data Analysis, GitHub [code], https://github.com/rspatial/terra, 2025. a
How, P., Messerli, A., Mätzler, E., Santoro, M., Wiesmann, A., Caduff, R., Langley, K., Bojesen, M. H., Paul, F., Kääb, A., and Carrivick, J. L.: Greenland-wide inventory of ice marginal lakes using a multi-method approach, Sci. Rep., 11, 4481, https://doi.org/10.1038/s41598-021-83509-1, 2021. a, b
Howat, I. M. and Eddy, A.: Multi-decadal retreat of Greenland’s marine-terminating glaciers, J. Glaciol., 57, 389–396, https://doi.org/10.3189/002214311796905631, 2011. a
Hynek, B., Binder, D., Citterio, M., Larsen, S. H., Abermann, J., Verhoeven, G., Ludewig, E., and Schöner, W.: Accumulation by avalanches as a significant contributor to the mass balance of a peripheral glacier of Greenland, The Cryosphere, 18, 5481–5494, https://doi.org/10.5194/tc-18-5481-2024, 2024. a
Kjeldsen, K. K., Korsgaard, N. J., Bjørk, A. A., Khan, S. A., Box, J. E., Funder, S., Larsen, N. K., Bamber, J. L., Colgan, W., van den Broeke, M., Siggaard-Andersen, M.-L., Nuth, C., Schomacker, A., Andresen, C. S., Willerslev, E., and Kjær, K. H.: Spatial and temporal distribution of mass loss from the Greenland Ice Sheet since AD 1900, Nature, 528, 396–400, https://doi.org/10.1038/nature16183, 2015. a
Kjær, K. H., Larsen, N. K., Binder, T., Bjørk, A. A., Eisen, O., Fahnestock, M. A., Funder, S., Garde, A. A., Haack, H., Helm, V., Houmark-Nielsen, M., Kjeldsen, K. K., Khan, S. A., Machguth, H., McDonald, I., Morlighem, M., Mouginot, J., Paden, J. D., Waight, T. E., Weikusat, C., Willerslev, E., and MacGregor, J. A.: A large impact crater beneath Hiawatha Glacier in northwest Greenland, Sci. Adv., 4, eaar8173, https://doi.org/10.1126/sciadv.aar8173, 2018. a, b, c
Knight, P. G., Waller, R. I., Patterson, C. J., Jones, A. P., and Robinson, Z. P.: Glacier advance, ice-marginal lakes and routing of meltwater and sediment: Russell Glacier, Greenland, J. Glaciol., 46, 423–426, https://doi.org/10.3189/172756500781833160, 2000. a, b
Kochtitzky, W. and Copland, L.: Retreat of Northern Hemisphere Marine-Terminating Glaciers, 2000–2020, Geophys. Res. Lett., 49, e2021GL096501, https://doi.org/10.1029/2021GL096501, 2022. a, b, c
Koziol, C. P. and Arnold, N.: Modelling seasonal meltwater forcing of the velocity of land-terminating margins of the Greenland Ice Sheet, The Cryosphere, 12, 971–991, https://doi.org/10.5194/tc-12-971-2018, 2018. a, b
Larocca, L. J., Twining-Ward, M., Axford, Y., Schweinsberg, A. D., Larsen, S. H., Westergaard-Nielsen, A., Luetzenburg, G., Briner, J. P., Kjeldsen, K. K., and Bjørk, A. A.: Greenland-wide accelerated retreat of peripheral glaciers in the twenty-first century, Nat. Clim. Change, 13, 1324–1328, https://doi.org/10.1038/s41558-023-01855-6, 2023. a, b
Lesnek, A. J. and Briner, J. P.: Response of a land-terminating sector of the western Greenland Ice Sheet to early Holocene climate change: Evidence from 10Be dating in the Søndre Isortoq region, Quaternary Sci. Rev., 180, 145–156, https://doi.org/10.1016/j.quascirev.2017.11.028, 2018. a, b
Levy, J. S., Fountain, A. G., Dickson, J. L., Head, J. W., Okal, M., Marchant, D. R., and Watters, J.: Accelerated thermokarst formation in the McMurdo Dry Valleys, Antarctica, Sci. Rep., 3, 2269, https://doi.org/10.1038/srep02269, 2013. a, b
Lewis, K. J., Fountain, A. G., and Dana, G. L.: How important is terminus cliff melt?: a study of the Canada Glacier terminus, Taylor Valley, Antarctica, Global Planet. Change, 22, 105–115, https://doi.org/10.1016/S0921-8181(99)00029-6, 1999. a
Lewis, S. M. and Smith, L. C.: Hydrologic drainage of the Greenland Ice Sheet, Hydrol. Process., 23, 2004–2011, https://doi.org/10.1002/hyp.7343, 2009. a, b
Leysinger Vieli, G. J.-M. C. and Gudmundsson, G. H.: A numerical study of glacier advance over deforming till, The Cryosphere, 4, 359–372, https://doi.org/10.5194/tc-4-359-2010, 2010. a
Luetzenburg, G., Korsgaard, N. J., Deichmann, A. K., Socher, T., Gleie, K., Scharffenberger, T., Fahrner, D., Nielsen, E. B., How, P., Bjørk, A. A., Kjeldsen, K. K., Ahlstrøm, A. P., and Fausto, R. S.: PROMICE-2022 ice mask: a high-resolution outline of the Greenland Ice Sheet from August 2022, Earth Syst. Sci. Data, 18, 411–427, https://doi.org/10.5194/essd-18-411-2026, 2026. a, b
Løkkegaard, A., Mankoff, K. D., Zdanowicz, C., Clow, G. D., Lüthi, M. P., Doyle, S. H., Thomsen, H. H., Fisher, D., Harper, J., Aschwanden, A., Vinther, B. M., Dahl-Jensen, D., Zekollari, H., Meierbachtol, T., McDowell, I., Humphrey, N., Solgaard, A., Karlsson, N. B., Khan, S. A., Hills, B., Law, R., Hubbard, B., Christoffersen, P., Jacquemart, M., Seguinot, J., Fausto, R. S., and Colgan, W. T.: Greenland and Canadian Arctic ice temperature profiles database, The Cryosphere, 17, 3829–3845, https://doi.org/10.5194/tc-17-3829-2023, 2023. a
MacGregor, J. A., Fahnestock, M. A., Colgan, W. T., Larsen, N. K., Kjeldsen, K. K., and Welker, J. M.: The age of surface-exposed ice along the northern margin of the Greenland Ice Sheet, J. Glaciol., 66, 667–684, https://doi.org/10.1017/jog.2020.62, 2020. a
Mankoff, K. D., Fettweis, X., Langen, P. L., Stendel, M., Kjeldsen, K. K., Karlsson, N. B., Noël, B., van den Broeke, M. R., Solgaard, A., Colgan, W., Box, J. E., Simonsen, S. B., King, M. D., Ahlstrøm, A. P., Andersen, S. B., and Fausto, R. S.: Greenland ice sheet mass balance from 1840 through next week, Earth Syst. Sci. Data, 13, 5001–5025, https://doi.org/10.5194/essd-13-5001-2021, 2021. a, b, c
Mernild, S. H., Malmros, J. K., Yde, J. C., and Knudsen, N. T.: Multi-decadal marine- and land-terminating glacier recession in the Ammassalik region, southeast Greenland, The Cryosphere, 6, 625–639, https://doi.org/10.5194/tc-6-625-2012, 2012. a
Morlighem, M., Williams, C. N., Rignot, E., An, L., Arndt, J. E., Bamber, J. L., Catania, G., Chauché, N., Dowdeswell, J. A., Dorschel, B., Fenty, I., Hogan, K., Howat, I., Hubbard, A., Jakobsson, M., Jordan, T. M., Kjeldsen, K. K., Millan, R., Mayer, L., Mouginot, J., Noël, B. P. Y., O'Cofaigh, C., Palmer, S., Rysgaard, S., Seroussi, H., Siegert, M. J., Slabon, P., Straneo, F., van den Broeke, M. R., Weinrebe, W., Wood, M., and Zinglersen, K. B.: BedMachine v3: Complete Bed Topography and Ocean Bathymetry Mapping of Greenland From Multibeam Echo Sounding Combined With Mass Conservation, Geophys. Res. Lett., 44, 11051–11061, https://doi.org/10.1002/2017GL074954, 2017. a, b, c, d
Mouginot, J., Rignot, E., Bjørk, A. A., Broeke, M. v. d., Millan, R., Morlighem, M., Noël, B., Scheuchl, B., and Wood, M.: Forty-six years of Greenland Ice Sheet mass balance from 1972 to 2018, P. Natl. Acad. Sci. USA, 116, 9239–9244, https://doi.org/10.1073/pnas.1904242116, 2019. a, b, c, d
Nobles, L. H.: Structure of the Ice Cap Margin, Northwestern Greenland, Folia Geographica Danica. Tom. IX, 1961. a, b, c, d, e
Noël, B., van de Berg, W. J., van Wessem, J. M., van Meijgaard, E., van As, D., Lenaerts, J. T. M., Lhermitte, S., Kuipers Munneke, P., Smeets, C. J. P. P., van Ulft, L. H., van de Wal, R. S. W., and van den Broeke, M. R.: Modelling the climate and surface mass balance of polar ice sheets using RACMO2 – Part 1: Greenland (1958–2016), The Cryosphere, 12, 811–831, https://doi.org/10.5194/tc-12-811-2018, 2018. a
Osterberg, E. C., Hawley, R. L., Wong, G., Kopec, B., Ferris, D., and Howley, J.: Coastal ice-core record of recent northwest Greenland temperature and sea-ice concentration, J. Glaciol., 61, 1137–1146, https://doi.org/10.3189/2015JoG15J054, 2015. a
Porter, C., Howat, I., Noh, M.-J., Husby, E., Khuvis, S., Danish, E., Tomko, K., Gardiner, J., Negrete, A., Yadav, B., Klassen, J., Kelleher, C., Cloutier, M., Bakker, J., Enos, J., Arnold, G., Bauer, G., and Morin, P.: ArcticDEM – Mosaics, Harvard Dataverse [data set], https://doi.org/10.7910/DVN/3VDC4W, 2023. a, b
Rastner, P., Bolch, T., Mölg, N., Machguth, H., Le Bris, R., and Paul, F.: The first complete inventory of the local glaciers and ice caps on Greenland, The Cryosphere, 6, 1483–1495, https://doi.org/10.5194/tc-6-1483-2012, 2012. a, b, c
Rausch, D. O.: Ice Tunnel, Tuto Area, Greenland, 1956, Technical Report 44, U.S. Army Snow Ice and Permafrost Research Establishment, Wilmette, Illinois, 1958. a
Reeh, N., Thomsen, H. H., and Clausen, H. B.: The Greenland ice-sheet margin – A mine of ice for paleo-environmental studies, Palaeogeogr. Palaeocl., 58, 229–234, https://doi.org/10.1016/0031-0182(87)90062-9, 1987. a
Reeh, N., Oerter, H., and Thomsen, H. H.: Comparison between Greenland ice-margin and ice-core oxygen-18 records, Ann. Glaciol., 35, 136–144, https://doi.org/10.3189/172756402781817365, 2002. a
Ryan, J., Ross, T., Cooley, S., Fahrner, D., Abib, N., Benson, V., and Sutherland, D.: Retreat of the Greenland Ice Sheet leads to divergent patterns of reconfiguration at its freshwater and tidewater margins, J. Glaciol., 1–9, https://doi.org/10.1017/jog.2024.61, 2024. a, b, c, d, e, f
Shepherd, A., Ivins, E., Rignot, E., Smith, B., van den Broeke, M., Velicogna, I., Whitehouse, P., Briggs, K., Joughin, I., Krinner, G., Nowicki, S., Payne, T., Scambos, T., Schlegel, N., A, G., Agosta, C., Ahlstrøm, A., Babonis, G., Barletta, V. R., Bjørk, A. A., Blazquez, A., Bonin, J., Colgan, W., Csatho, B., Cullather, R., Engdahl, M. E., Felikson, D., Fettweis, X., Forsberg, R., Hogg, A. E., Gallee, H., Gardner, A., Gilbert, L., Gourmelen, N., Groh, A., Gunter, B., Hanna, E., Harig, C., Helm, V., Horvath, A., Horwath, M., Khan, S., Kjeldsen, K. K., Konrad, H., Langen, P. L., Lecavalier, B., Loomis, B., Luthcke, S., McMillan, M., Melini, D., Mernild, S., Mohajerani, Y., Moore, P., Mottram, R., Mouginot, J., Moyano, G., Muir, A., Nagler, T., Nield, G., Nilsson, J., Noël, B., Otosaka, I., Pattle, M. E., Peltier, W. R., Pie, N., Rietbroek, R., Rott, H., Sandberg Sørensen, L., Sasgen, I., Save, H., Scheuchl, B., Schrama, E., Schröder, L., Seo, K.-W., Simonsen, S. B., Slater, T., Spada, G., Sutterley, T., Talpe, M., Tarasov, L., van de Berg, W. J., van der Wal, W., van Wessem, M., Vishwakarma, B. D., Wiese, D., Wilton, D., Wagner, T., Wouters, B., Wuite, J., and The IMBIE Team: Mass balance of the Greenland Ice Sheet from 1992 to 2018, Nature, 579, 233–239, https://doi.org/10.1038/s41586-019-1855-2, 2020. a, b, c
Sole, A., Payne, T., Bamber, J., Nienow, P., and Krabill, W.: Testing hypotheses of the cause of peripheral thinning of the Greenland Ice Sheet: is land-terminating ice thinning at anomalously high rates?, The Cryosphere, 2, 205–218, https://doi.org/10.5194/tc-2-205-2008, 2008. a, b
Solgaard, A., Kusk, A., Merryman Boncori, J. P., Dall, J., Mankoff, K. D., Ahlstrøm, A. P., Andersen, S. B., Citterio, M., Karlsson, N. B., Kjeldsen, K. K., Korsgaard, N. J., Larsen, S. H., and Fausto, R. S.: Greenland ice velocity maps from the PROMICE project, Earth Syst. Sci. Data, 13, 3491–3512, https://doi.org/10.5194/essd-13-3491-2021, 2021. a
Steiner, J., Abermann, J., and Prinz, R.: tIM – terrestrial ice margin in Greenland, Zenodo [code/data set], https://doi.org/10.5281/zenodo.15491607, 2025. a, b
Steiner, J. F., Buri, P., Abermann, J., Prinz, R., and Nicholson, L.: Steep ice – progress and future challenges in research on ice cliffs, Ann. Glaciol., 63, 132–136, https://doi.org/10.1017/aog.2023.41, 2022. a, b, c
Swanger, K. M., Lamp, J. L., Winckler, G., Schaefer, J. M., and Marchant, D. R.: Glacier advance during Marine Isotope Stage 11 in the McMurdo Dry Valleys of Antarctica, Sci. Rep., 7, 41433, https://doi.org/10.1038/srep41433, 2017. a
Tatenhove, F. G. M. V., Roelfsema, C. M., Blommers, G., and Voorden, A. V.: Change in position and altitude of a small outlet glacier during the period 1943–92: Leverett Glacier, West Greenland, Ann. Glaciol., 21, 251–258, https://doi.org/10.3189/S0260305500015901, 1995. a
Tedstone, A. J., Nienow, P. W., Gourmelen, N., Dehecq, A., Goldberg, D., and Hanna, E.: Decadal slowdown of a land-terminating sector of the Greenland Ice Sheet despite warming, Nature, 526, 692–695, https://doi.org/10.1038/nature15722, 2015. a, b
van den Broeke, M. R., Enderlin, E. M., Howat, I. M., Kuipers Munneke, P., Noël, B. P. Y., van de Berg, W. J., van Meijgaard, E., and Wouters, B.: On the recent contribution of the Greenland ice sheet to sea level change, The Cryosphere, 10, 1933–1946, https://doi.org/10.5194/tc-10-1933-2016, 2016. a
Weidick, A.: Some Observations on Steep Ramps, Medd. fra Dansk Geol. Forening, 13, https://2dgf.dk/xpdf/bull-1963-15-2-200-211.pdf (last access: 6 March 2026), 1963. a, b, c, d, e, f, g
Weidick, A.: Observations on some Holocene glacier fluctuations in West Greenland, vol. 165 of Meddelelser om Gronland, C.A. Reitzels Forlag, https://doi.org/10.34194/bullggu.v73.6611, 1968. a, b
Weidick, A.: Present-day expansion of the southern part of the inland ice, Rapp. Geol. Surv. Greenland, 152, 73–79, 1991. a, b
Weidick, A.: Historical fluctuations of calving glaciers in south and west Greenland, Rapp. Geol. Surv. Greenland, 161, 73–79, 1994. a, b
Winstrup, M., Ranndal, H., Hillerup Larsen, S., Simonsen, S. B., Mankoff, K. D., Fausto, R. S., and Sandberg Sørensen, L.: PRODEM: an annual series of summer DEMs (2019 through 2022) of the marginal areas of the Greenland Ice Sheet, Earth Syst. Sci. Data, 16, 5405–5428, https://doi.org/10.5194/essd-16-5405-2024, 2024. a
Wirbel, A. and Jarosch, A. H.: Inequality-constrained free-surface evolution in a full Stokes ice flow model (evolve_glacier v1.1), Geosci. Model Dev., 13, 6425–6445, https://doi.org/10.5194/gmd-13-6425-2020, 2020. a
Zekollari, H., Huybrechts, P., Noël, B., van de Berg, W. J., and van den Broeke, M. R.: Sensitivity, stability and future evolution of the world's northernmost ice cap, Hans Tausen Iskappe (Greenland), The Cryosphere, 11, 805–825, https://doi.org/10.5194/tc-11-805-2017, 2017. a