the Creative Commons Attribution 4.0 License.
the Creative Commons Attribution 4.0 License.
 | 23 Mar 2026
Active subglacial lakes in the Canadian Arctic identified by multi-annual ice elevation changes
Wesley Van Wychen
Tsutomu Yamanokuchi
Subglacial lakes influence glacier hydrology, dynamics, and mass balance; however, they are poorly documented outside the polar ice sheets. Here we use high-resolution digital elevation models during 2011–2021 and regression analysis to characterize subglacial lakes. We identified 37 subglacial lakes across the Canadian Arctic, 35 of which are newly identified. These lakes have an area of 0.3–48.5 km2 and can change surface elevation by 10–150 m, corresponding to a water volume of 0.003–4.5 km3. We classify these subglacial lakes into three types: (1) classic subglacial lakes, (2) terminal subglacial lakes at places where two glacier termini converge and coalesce, and (3) partial subglacial lakes with an area of open water at the ice margin. Types 2 and 3 are newly introduced in this study, there are 11 and 15 lakes classified as these two types, respectively. Lake activities negatively correlate with regional mass balance (, p-value =0.039), implying a need for fine-scale monitoring in the era of increased glacier loss.
- Article
(8652 KB) - Full-text XML
-
Supplement
(13184 KB) - BibTeX
- EndNote


Subglacial lakes have significant impacts on subglacial hydrology, ice dynamics, and glacier mass balance. Migration of subglacial lake water can change basal friction and temporarily accelerate ice flow (Magnússon et al., 2007; Stearns et al., 2008; Bell, 2008; Siegfried et al., 2016; Andersen et al., 2023). A subglacial lake can also connect to multiple subglacial channels and other lakes, forming an active hydrological system (Wingham et al., 2006; Fricker and Scambos, 2009; Flament et al., 2014; Fricker et al., 2014; Siegfried and Fricker, 2018; Hodgson et al., 2022; Andersen et al., 2023; Ehrenfeucht et al., 2025). The volume of water transported within the subglacial lake system can be up to 0.1–10 km3 within a year (Wingham et al., 2006; Stearns et al., 2008; Fricker and Scambos, 2009; Flament et al., 2014; Livingstone et al., 2022; Andersen et al., 2023). During subglacial lake drainage events, glacier speed can increase by 5 %–10 %, bringing more ice to the downstream area where surface and frontal ablations are strong (e.g., Stearns et al., 2008; Siegfried et al., 2016; Andersen et al., 2023). This acceleration can translate into a few additional gigatonnes of ice discharge, suggesting that subglacial floods can act as a controlling factor of glacier mass balance (Bell, 2008; Stearns et al., 2008).
Despite the importance of subglacial lakes, our understanding of these hidden water bodies is still very limited. This is mainly because our observational history for most glacierized areas is relatively short compared to the decadal evolution of subglacial systems (Fricker et al., 2014). Although the earliest records of subglacial drainage events date back to the twentieth century in Iceland and Antarctica (Björnsson et al., 2001; Wingham et al., 2006), regional-scale identification of subglacial lakes was not available until the advance of space-borne Interferometric Synthetic Aperture Radars (InSAR; e.g., ERS-2 and Radarsat) and satellite altimeters (e.g., ICESat and CryoSat-2) within the last twenty years (Livingstone et al., 2022). To date, regional subglacial lake inventories are available for the Greenland Ice Sheet (Bowling et al., 2019), Antarctica (Smith et al., 2009; Wright and Siegert, 2012; Siegfried and Fricker, 2021), and Iceland (Björnsson, 2003). The first global inventory was released in 2022 and contains 773 subglacial lakes (Livingstone et al., 2022), most of which are located in Antarctica (87 %) and Greenland (8 %). Hydrological model predictions suggest that thousands of subglacial lakes still remain to be detected outside the polar ice sheets, including the Canadian Arctic (Livingstone et al., 2013; MacKie et al., 2020; Livingstone et al., 2022).
The Canadian Arctic (Fig. 1) is a vast glacierized region that comprises ∼ 14 % of the Earth's glaciers and ice caps by area (Sharp et al., 2011). This region is one of the major contributors to global glacier mass loss at a rate of −53.6 Gt yr−1 (2000–2023), which is only preceded by Alaska among all of the global glacier (excluding ice sheets) regions (Zemp et al., 2025). Despite its recent mass loss, so far only two subglacial lakes have been identified in this area, yet with large uncertainties. For example, a potential subglacial lake was identified beneath the Devon Ice Cap in 2018 (Rutishauser et al., 2018), but later work showed that the hypothetical lake did not exist, and it is more likely to be a layer of frozen bedrock beneath the summit of the Ice Cap (Killingbeck et al., 2024, 2025). Beneath the Manson Icefield, a large (52 km2) active subglacial lake and a smaller one nearby were reported recently in 2024 from analysis of ICESat-2 data and digital elevation models (DEMs) (Gray et al., 2024b).
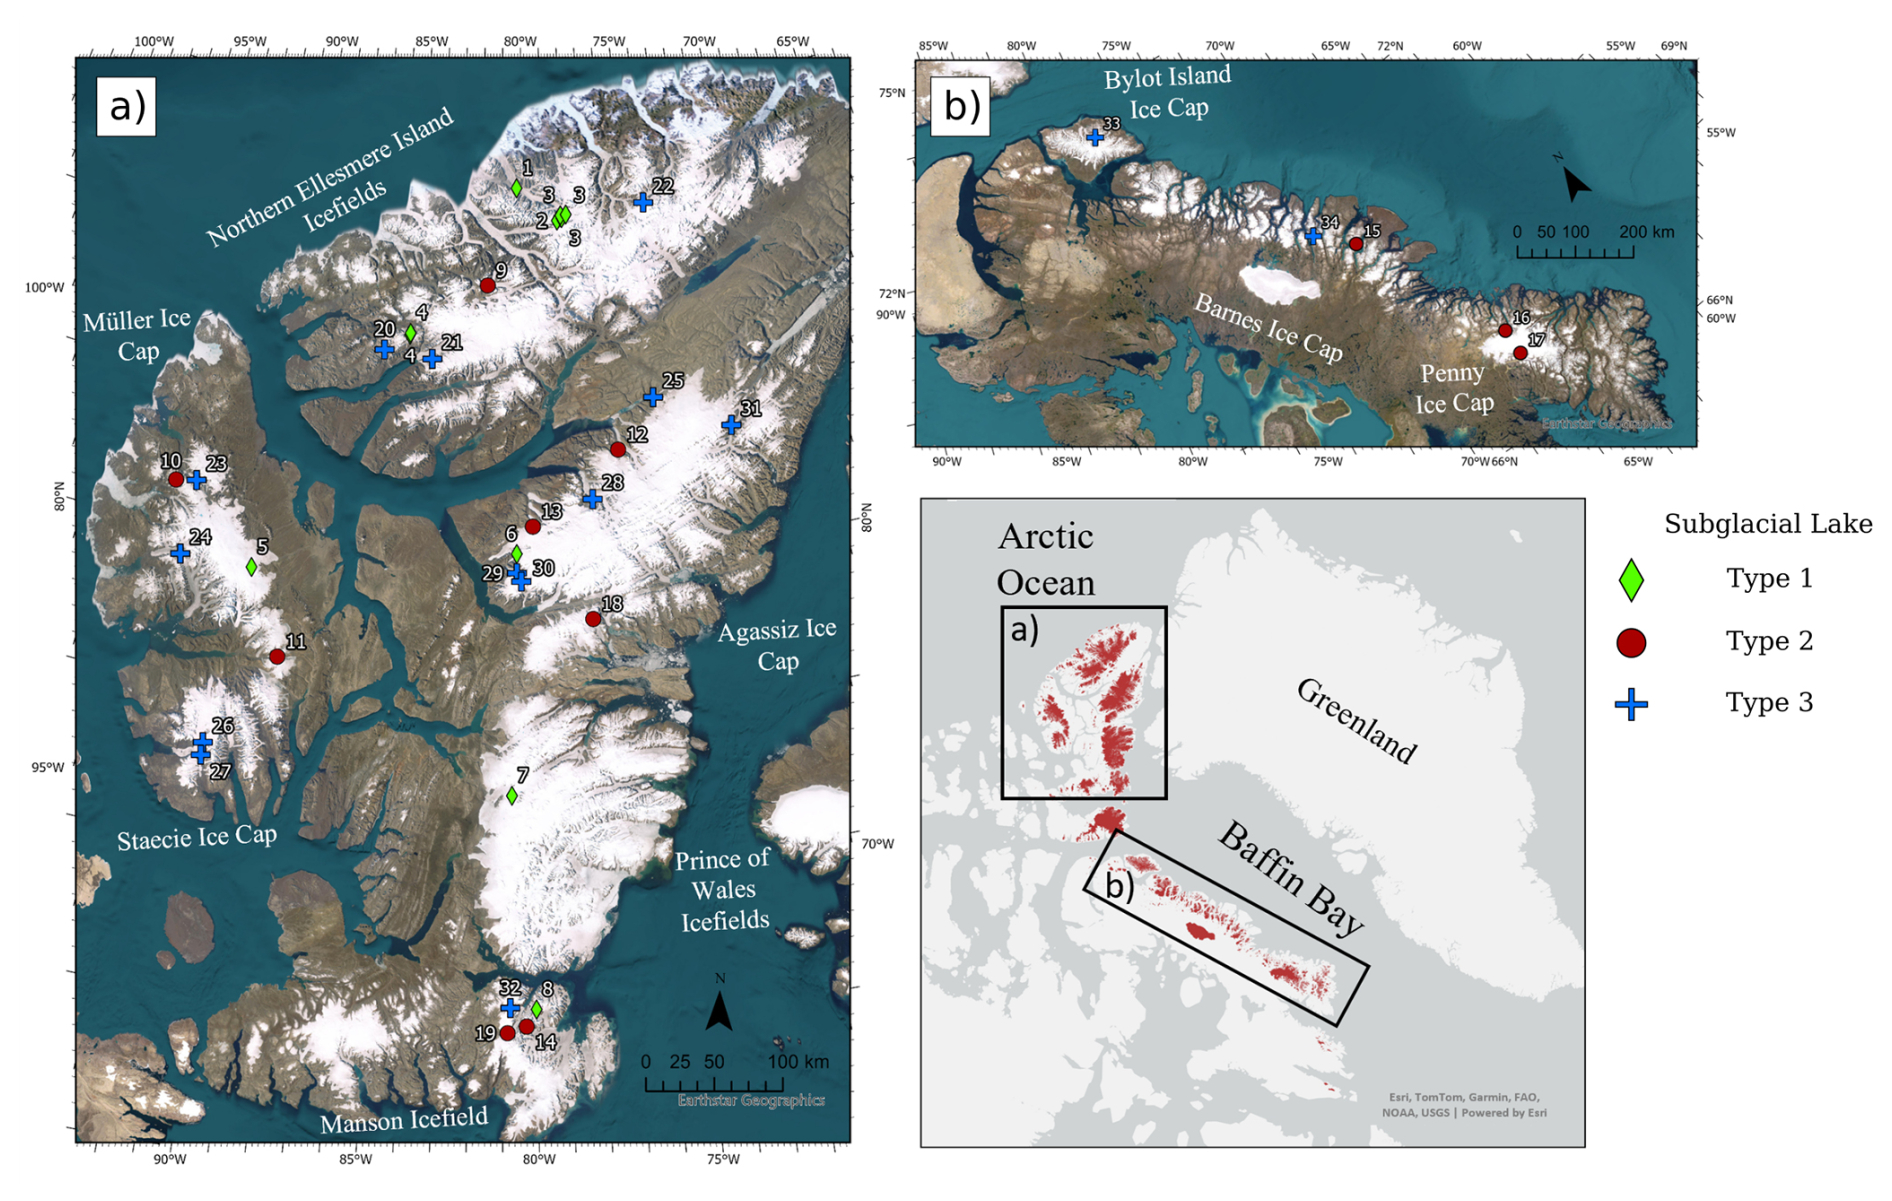
Figure 1The geographical locations of the active subglacial lakes in the Canadian Arctic. (a) Lakes in Ellesmere and Axel Heiberg Islands (within the RGI region ACN); (b) Lakes in Baffin Island (within the RGI region ACS). The marker styles correspond to the subglacial water types defined in Fig. 6: green diamonds are Type 1 lakes, red circles are Type 2 lakes, and blue crosses are Type 3 lakes. Lake numbers correspond to those in Table 1. Inset map shows the locations of (a) and (b) within the Canadian Arctic, with red areas indicating glacier mass.
When a subglacial lake recharges and drains, the overlying ice layer gains and loses support from subglacial water. This process results in vertical deflection of the ice surface, which can be detected by satellite geodesy (Björnsson et al., 2001; Björnsson, 2003; Willis et al., 2015; Gray et al., 2024a). Spaceborne altimeters such as ICESat-2 and CryoSat-2 have been used to identify numerous subglacial lakes beneath the Greenland and Antarctica Ice Sheets (Fan et al., 2023; Stubblefield et al., 2023; Siegfried et al., 2023). However, this method requires a satellite swath to pass over the lake area, limiting the potential discovery for kilometer-scaled lakes outside satellite swaths, despite the fact that the track density of satellite coverage increases with latitude for the polar regions (Khalsa et al., 2022; Sørensen et al., 2024). Recent public releases of high-resolution and multitemporal DEMs (Porter et al., 2022) provide a new opportunity to track the detailed 3D change in subglacial water volume (Arthur et al., 2025). To improve our understanding of subglacial lake systems in the Canadian Arctic, we develop a regression model to process the 2 m ArcticDEM strip product acquired between 2011 and 2021 (Porter et al., 2022). This regression model resolves the ice elevations constrained by multiple time-stamped DEMs. Compared to the traditional method that uses the elevation difference from two DEMs, this new method allows us to track the drainage and recharge events of active subglacial lakes in unprecedented detail.
In this study, the term “subglacial lake” is defined as a water body that is primarily located underneath a glacier (Capps et al., 2010). Besides the classical subglacial lakes confined below a single glacier, we describe two new types of subglacial lakes for the first time, as well as their hydrological characteristics. Our study creates the first decadal-long subglacial lake inventory for the Canadian Arctic. These high-resolution records of subglacial lake evolution can better constrain glacier dynamics and mass balance in this rapidly melting region, and contribute to improving sea-level projections from glacier models (Sharp et al., 2011; Noël et al., 2018; Hugonnet et al., 2021; Jakob and Gourmelen, 2023; Zemp et al., 2025).
2.1 ArcticDEM elevations
We focus on glacier and ice cap areas in the Arctic Canada North (ACN) and Arctic Canada South (ACS) subregions defined by the Randolph Glacier Inventory (RGI) version 7.0 (RGI 7.0 Consortium, 2023). We collect the time-stamped ArcticDEM strip Digital Elevation Models (DEMs) released in October 2022 (Porter et al., 2022), each with a spatial resolution of 2 m. A total of 23,691 DEM strips intersect with the RGI glacier outlines, with observations ranging from 2011 to 2021. We resample each strip into a 15 m raster using bilinear interpolation and stack all strips to form a 3D data cube. For each spatial pixel in the data cube, we perform the modified Elevation Verification from Multiple DEMs (EVMD) algorithm (Zheng et al., 2018) to flag potentially erroneous elevations. This modified algorithm adopts the Density-based spatial clustering of applications with noise (DBSCAN) method (Ester et al., 1996) to identify clusters in the elevation-time space, with units in meters and years, respectively. Elevation measurements outside any clusters are flagged as potentially erroneous elevations. We tested various DBSCAN parameters for the best performance. The final algorithm sets eps (radius of neighborhood search) to 20 on a time-elevation space with units of year and meter, respectively. The minPts parameter (minimum measurements to form a cluster) is set to 3. We also flag measurements with ArcticDEM bitmask labels indicating water, cloud, or edge as potentially erroneous elevations (Porter et al., 2022). We excluded all flagged elevations from the rest of the analysis.
2.2 ITS_LIVE glacier velocities
To compare ice elevation change with glacier dynamics, we analyzed the scene-pair ice velocity maps provided by the NASA MEaSUREs ITS_LIVE project (Gardner et al., 2018, 2019). The data are accessed using NASA's itslive-py Python client and are visualized in panel f of Figs. S1–S37.
2.3 ALOS-2 data
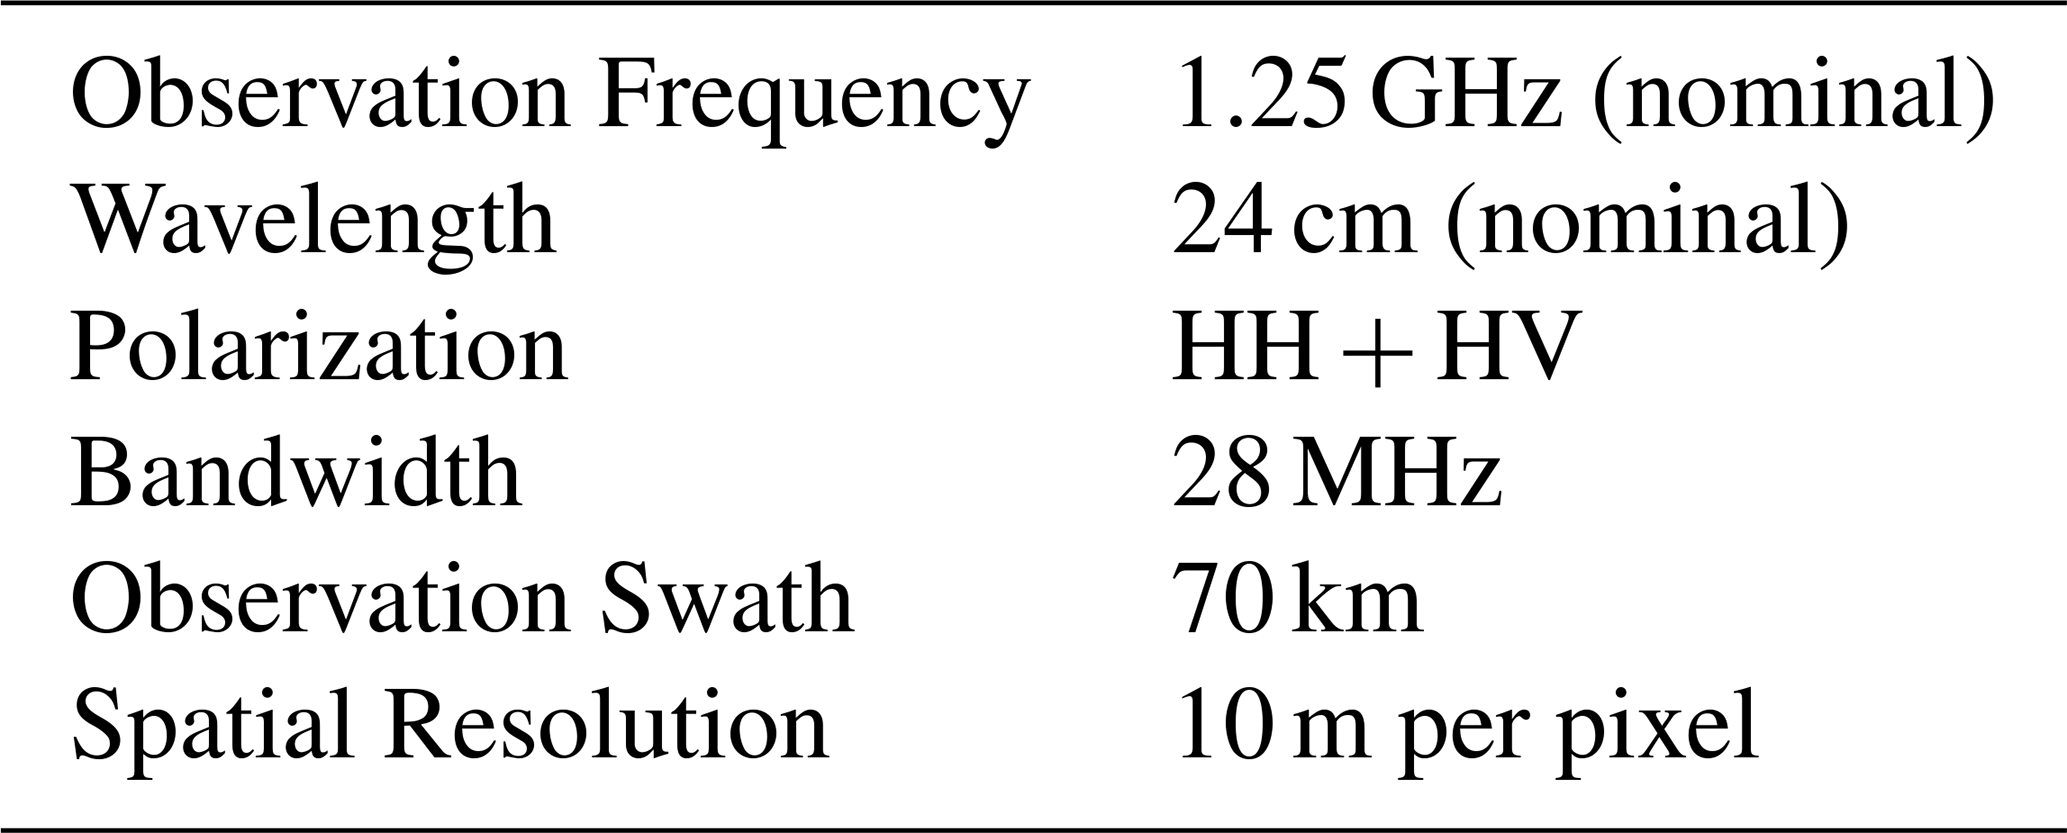
For a detailed case study, we use the Advanced Land Observing Satellite-2 (ALOS-2) PALSAR-2 sensor data for the interferometric synthetic aperture radar (InSAR) analysis. We select four PALSAR-2 images taken at the stripmap mode 3 (∼ 10 m spatial resolution) and form two interferograms for Milne Glacier, where Lakes 2, 3-a, 3-b, and 3-c are located. Other specifications of these PALSAR-2 images are available in Table A1. The first interferogram corresponds to the acquisition period between 20 October and 17 November 2015 (perpendicular baseline = 3.5 m), and the second corresponds to the period between 27 November and 25 December 2018 (perpendicular baseline = 11 m). The ArcticDEM mosaicked elevation data (Porter et al., 2023) is used to remove the phase change due to topography.
We use the Python-based Cryosphere And Remote Sensing Toolkit (CARST; Zheng et al., 2018, 2021) and the scikit-learn package (Pedregosa et al., 2011) for the entire analysis workflow unless otherwise specified.
3.1 Broad scan for unusual glacier elevation change
The remaining ArcticDEM measurements after initial filtering in Sect. 2.1 are fitted to a linear model pixel-by-pixel. We create a map of the long-term elevation change rate , which is the slope of the linear model for the entire Canadian Arctic (Fig. 2a–b). This map is available online (Zheng et al., 2024) as one of the data sets used in the Glacier Mass Balance Intercomparison Exercise (GlaMBIE) project (Zemp et al., 2025). We manually examine the map and mark areas with unusual patterns of elevation change, such as enhanced local thinning and thickening within a glacier basin. We further review these areas by checking the stacked elevations together with the optical images from the NASA/USGS Landsat 8, 9, and ESA Sentinel-2 satellites. Based on the spatial characteristics of the elevation change signals and the land cover at places where we observe unusual elevation changes, we classify these areas into one of the following four categories:
-
Active subglacial lake. This is the objective of this study. The is distinct from the surrounding area and is coherent on the kilometer scale. Surface crevassing may be present at the edge of the area with distinct signals, which are checked using optical satellite image data.
-
Glacier surge. Surging event is characterized by coupled thinning and thickening signals, thickening downstream and thinning upstream. Two zones must be adjacent to each other to be classified as a glacier surge signal.
-
Calving front. Calving front shows a distinct strong negative at the ice margin, adjacent to an ice-marginal or proglacial lake with surface elevation changing to lake level.
-
New bedrock exposure. is more neutral (closer to zero) than the surrounding area, and the new unglacierized surface can be recognized from optical images. We compare the images acquired after 2020 and during 2013–2015 to identify new unglacierized surfaces.
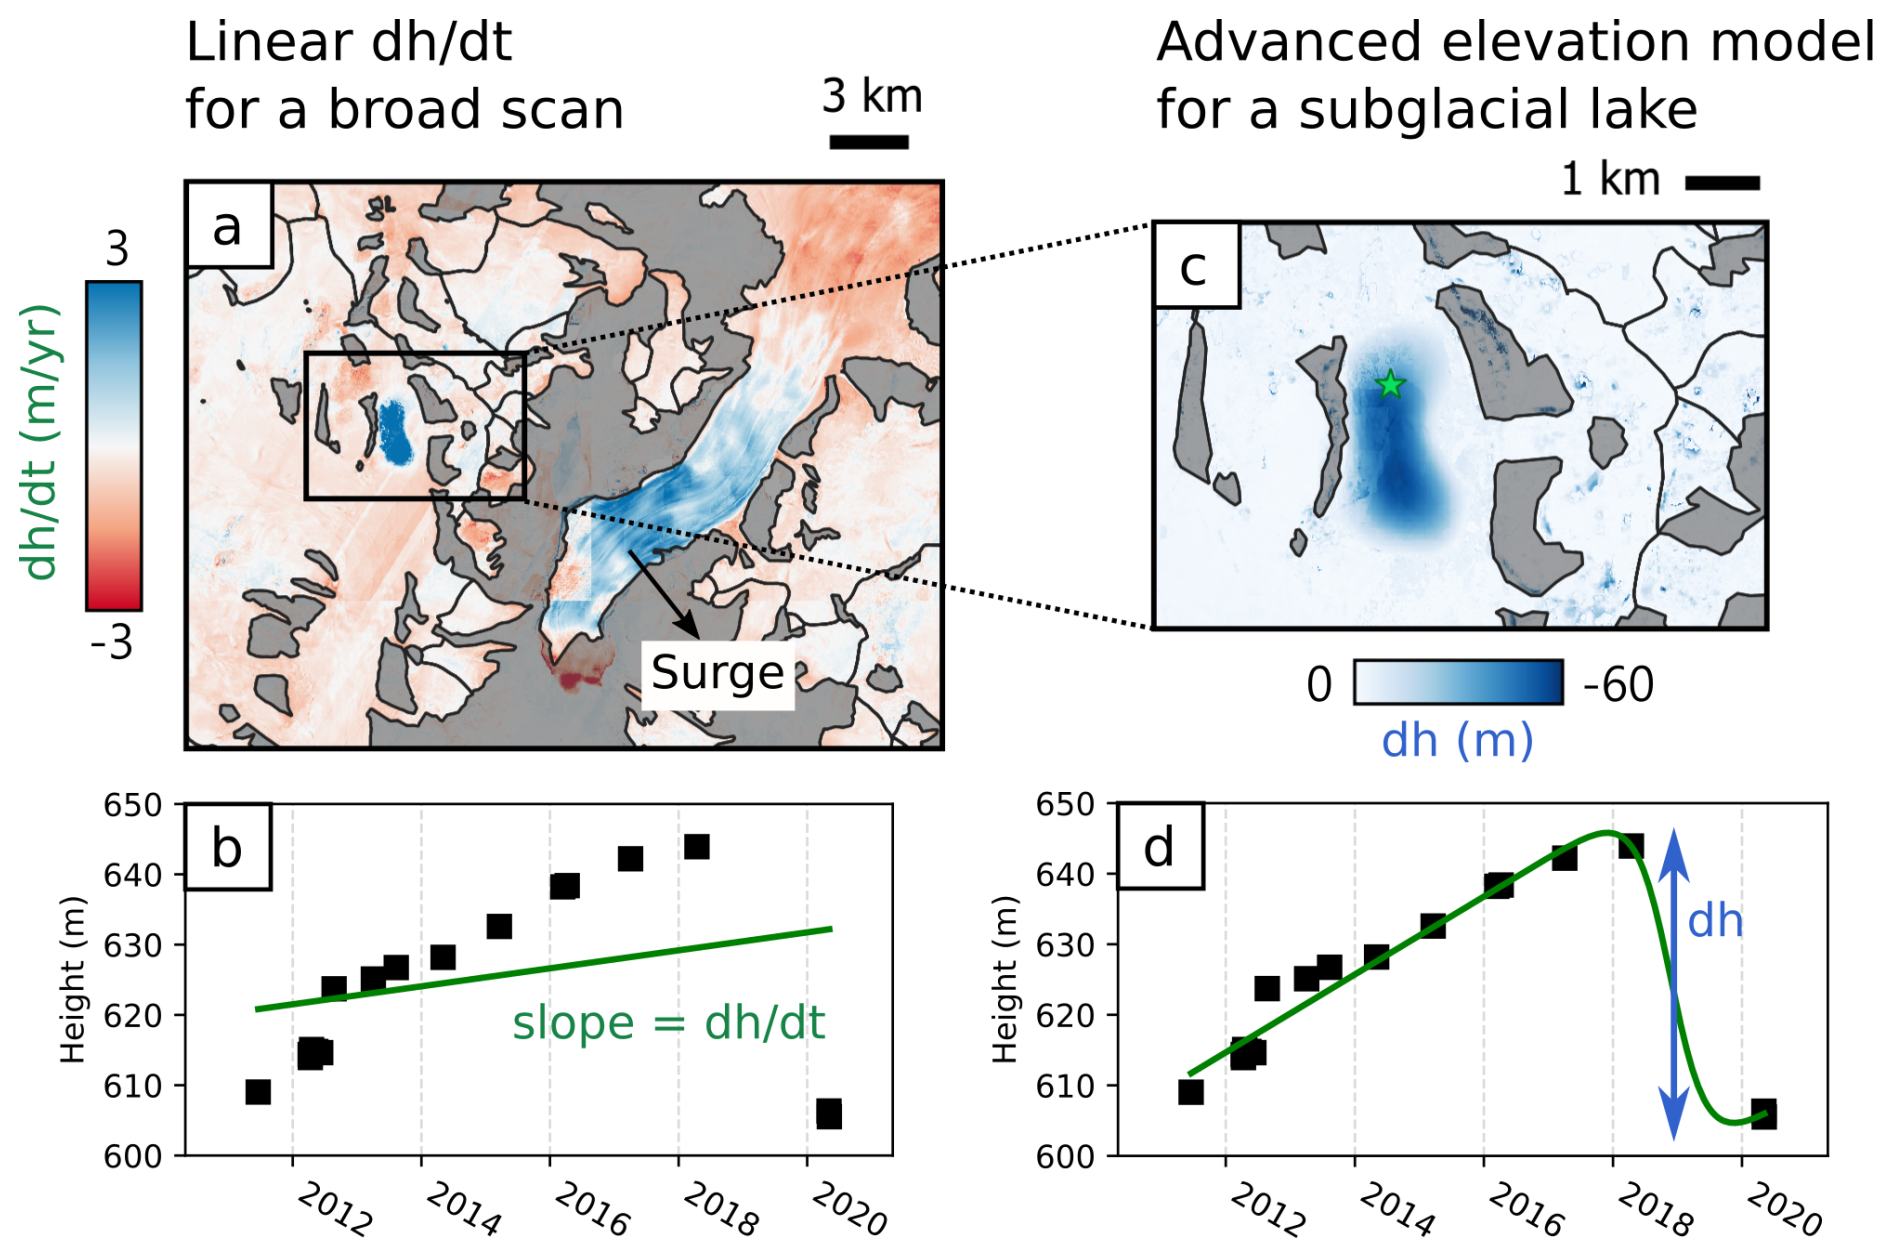
Figure 2Schematic of the analysis workflow. (a) A map of linear elevation change rate for subglacial lake 18 (Table 1), highlighting signals such as glacier surge and subglacial lake. Dark areas are unglacierized, defined by the RGI 7.0 glacier outlines (RGI 7.0 Consortium, 2023). (b) Example time series of the surface elevation at the subglacial lake site, fitted with a linear model. (c) The elevation data near the lake region are reprocessed using a sigmoid regression model. This map now shows the elevation change during a short-term event (dh, Eq. 4). The green star indicates the location of the example time series used in panels (b) and (d). (d) Same time series as panel (b) but fitted with a sigmoid model, with the indicated elevation change (dh) mapped in panel (c). See Sect. 3.1–3.2 for more details.
After the initial broad scan of all unusual elevation change signals, we focus on areas classified as active subglacial lakes (37 in total) and analyze ArcticDEM elevation data to extract and identify subglacial lake drainage events as described in the next section.
3.2 Elevation change model for subglacial lakes
We reanalyze the same ArcticDEM data used for identifying each subglacial lake location in Sect. 3.1. We first coregister a total of 2189 DEM strips over the lakes with the ICESat-2 ATL-6 measurements (Smith et al., 2023) over the neighboring off-ice land area using the Iterative Closest Point (ICP) algorithm provided by the NASA Ames Stereo Pipeline (Beyer et al., 2018). The vertical uncertainty for each coregistered DEM ( for the Nth DEM) is assigned as the root mean square error between the coregistered DEM and the reference ICESat-2 elevations (Zheng et al., 2018). The mean and median uncertainty of these coregistered DEMs are 1.24 and 0.68 m, respectively. The coregistered DEMs are again resampled into 15 m rasters, stacked, and verified using the EVMD algorithm described in the last section.
To model the ice elevation change due to lake activities, we manually review the temporal pattern of elevations for each lake and identify short-term elevation change events. Here, a short-term event is defined as the abrupt change (> 10 m) in ice surface elevation within one year relative to other times during 2011–2021. The regression model for the elevation change thus depends on how many short-term events we identify:
-
If a lake does not show short-term events, we use a linear model:
where h is ice surface elevation and t is time. The model parameters a0 and a1 are solved by the weighted least squares with weights set to .
-
If a lake has one short-term event, we add a sigmoid term to the linear model:
where L, k, and t0 are parameters that characterize the sigmoid. We normalize t and h prior to this nonlinear regression and solve the model parameters numerically with the weighted least squares. The reciprocal values of normalized uncertainty (, where σh is the standard deviation of h) are used as the weight of each data point.
-
If a lake has two or more short-term events, or the elevation change does not fit the above models well, we use the Gaussian Process (GP) regression (Rasmussen and Williams, 2005; Hugonnet et al., 2021; Pedregosa et al., 2011) to fit the elevations. Both t and h are normalized before regression. We use data from Lake 14 (Mittie glacier, Fig. 5e) to validate and fine-tune kernel and hyperparameter combinations by comparing the model predictions with the elevation change during Lake 14's drainage event in 2021. Finally, the selected GP model has a covariance matrix composed of the sum of the normalized data variance and a rational quadratic kernel:
where δij is a Kronecker delta that is 1 if i=j and 0 otherwise. The hyperparameters l (length scale) and α (scale mixture) are fixed at 0.4 and 0.01, respectively, for all lakes. The only tunable hyperparameter for each lake during the regression is the amplitude of the rational quadratic kernel c.
The selected regression model is applied to fit the elevation data pixel by pixel. To visualize lake extent, we derive a map of elevation change during a short-term event (dH) for each lake (Figs. 2c–d and 3). If the elevation change is fitted to a sigmoid model, dH is analytically expressed by the sum of the sigmoid height (L) and the height change from the linear component during the active event. We assume that the active event begins when the sigmoid term equals 0.01L for recharge and 0.99L for drainage, and ends when the sigmoid term equals 0.99L for recharge and 0.01L for drainage (Fig. 2d). Hence, dH can be written as:
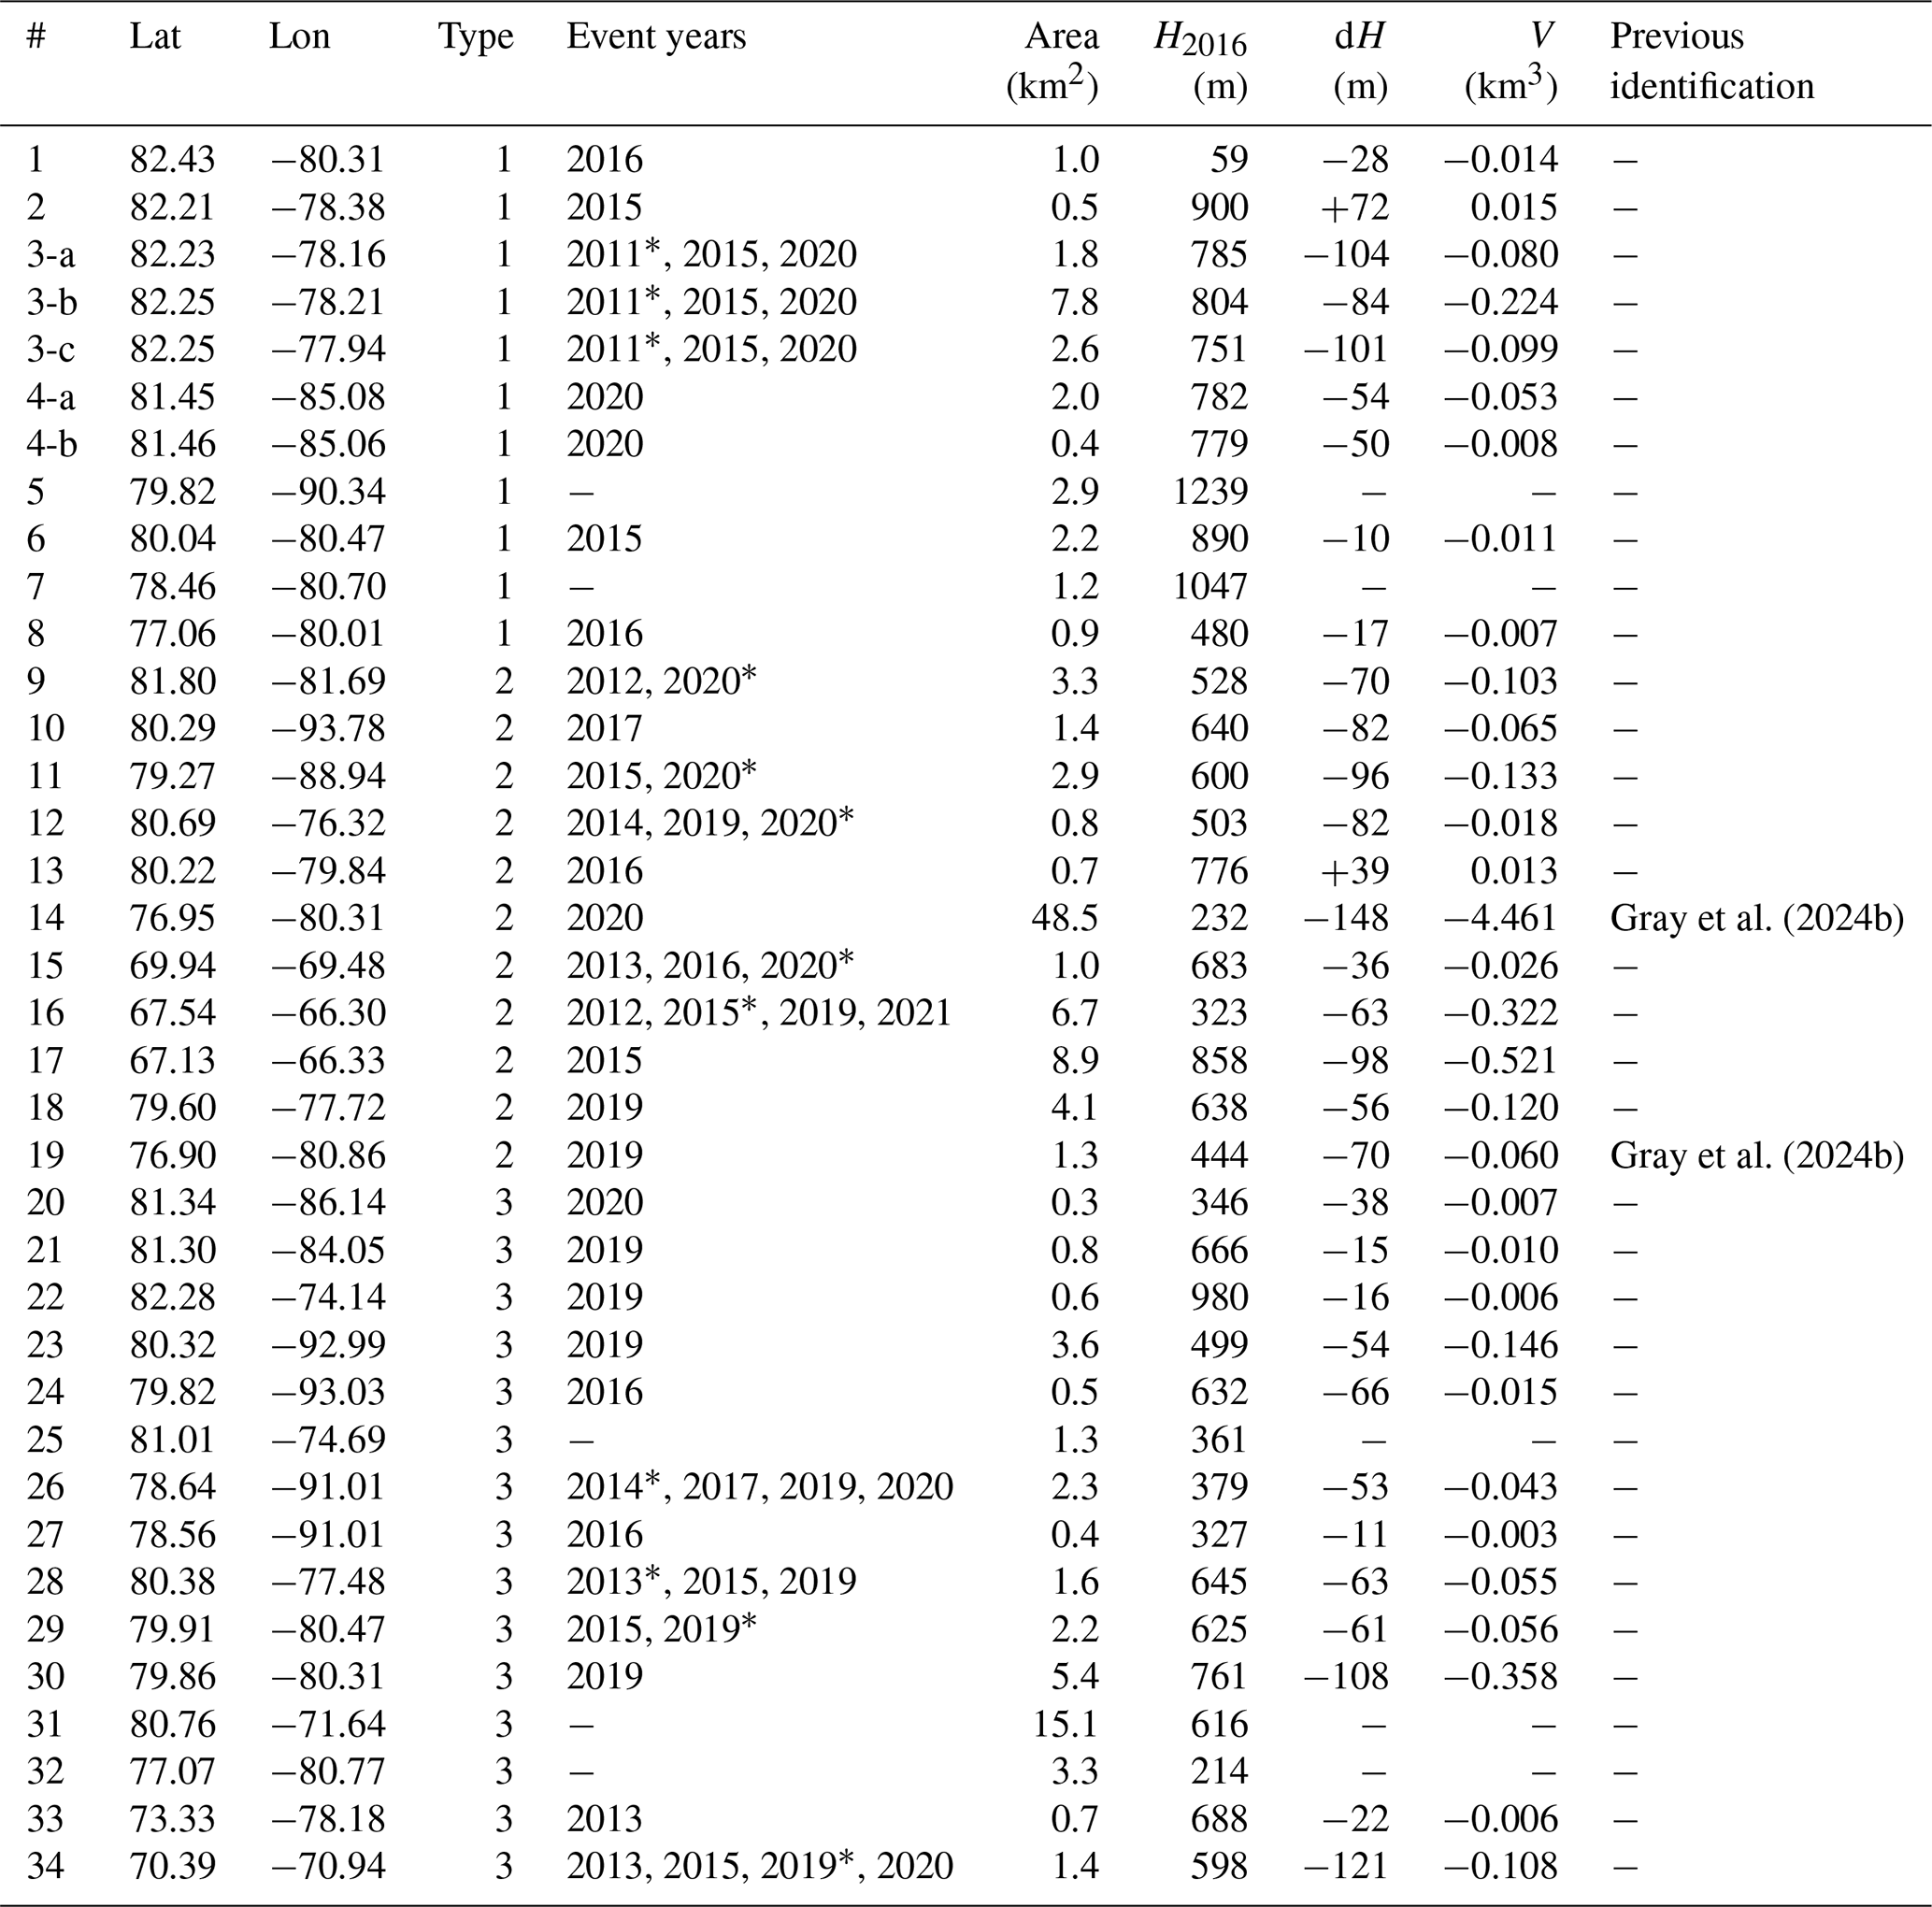
If the ice elevation is modeled by the Gaussian Process, we simply assign dH as the maximum height gain or loss within one year. We label the year for which the dH value is derived in Table 1 with an asterisk. The dH value is also reported in Table 1. This step is omitted if a lake does not have a short-term event during the survey period.
Gray et al. (2024b)Gray et al. (2024b)Table 1Active subglacial lakes identified in this study. For each lake, this table describes its latitude (Lat), longitude (Lon), type (see Fig. 6), years when a short-term drainage or recharge event took place, lake area (Area), ice surface elevation in 2016 (H2016), vertical elevation change during the selected short-term event (dH), and volume change during the selected short-term event (V). The selected events are marked with an asterisk.
3.3 Lake type classification
We classify the type for each subglacial lake using the modeled elevation data (dH map for lakes with short-term events; map for lakes without short-term events) and the optical satellite images described earlier based on the criteria below:
-
If the elevation change signal is confined within the glacier area, and the lake is not located in a valley topography where two glacier termini converge and coalesce, the lake is assigned as type 1 (classic subglacial lake).
-
If the elevation change signal is confined within the glacier area, and the lake is located in a valley topography where two glacier termini converge and coalesce, the lake is assigned as type 2 (terminal subglacial lake).
-
If the elevation change signal extends to the ice margin and connects to open water visible in optical images, the lake is assigned as type 3 (partial subglacial lake).
More descriptions about lake type classification can be found in Sect. 4.3 and Fig. 6.
3.4 Lake area and volume
We manually map lake areas using QGIS (https://www.qgis.org/, last access: 10 January 2026) based on dH or maps by tracking places where ice elevation is clearly influenced by subglacial lakes. For type 3 lakes, we only map the lake area beneath the glacier ice. For a short-term drainage or recharge event, we assume that all volumetric change observed by the DEM analysis is due to the change in water volume (V), which can be calculated by
where apixel= 225 m2 is the area of a single pixel on the dH map, and N is the number of pixels within the lake area. The lake area and V are both reported in Table 1.
4.1 Active subglacial lakes across the Canadian Arctic
We identified 37 active subglacial lakes across the Canadian Arctic (Figs. 1–3, Table 1). Among these 37 lakes, 32 have at least one short-term recharge or drainage event identified as an abrupt change (more than 10 m) in ice surface elevation within one year relative to the other time during the survey period of 2011–2021. For example, a short-term recharge event is identified for Lake 2 (at Milne Glacier, northern Ellesmere Island) when the ice surface elevation increased by more than 20 m in 2015 compared to relatively little elevation change during the pre- and post-event periods (Fig. 4e). Some lakes had multiple short-term drainage events during the survey period; the details of these drainage events are listed in Table 1. The other five subglacial lakes (Lakes 5, 7, 25, 31, and 32) do not experience short-term recharge or drainage, but are still considered active since the ice surface shows a significant and consistent decadal elevation change rate compared to the neighboring glacier region, which we attribute to slow lake recharge or drainage over the entire study period. We map the amount of elevation change (dH) during the selected short-term event (see Table 1); if a lake does not have one, we map the rate of elevation change (dH dt) instead (Fig. 3). These maps reveal the area with ice elevation change influenced by subglacial lakes, which we define as the lake area in this study (Table 1).
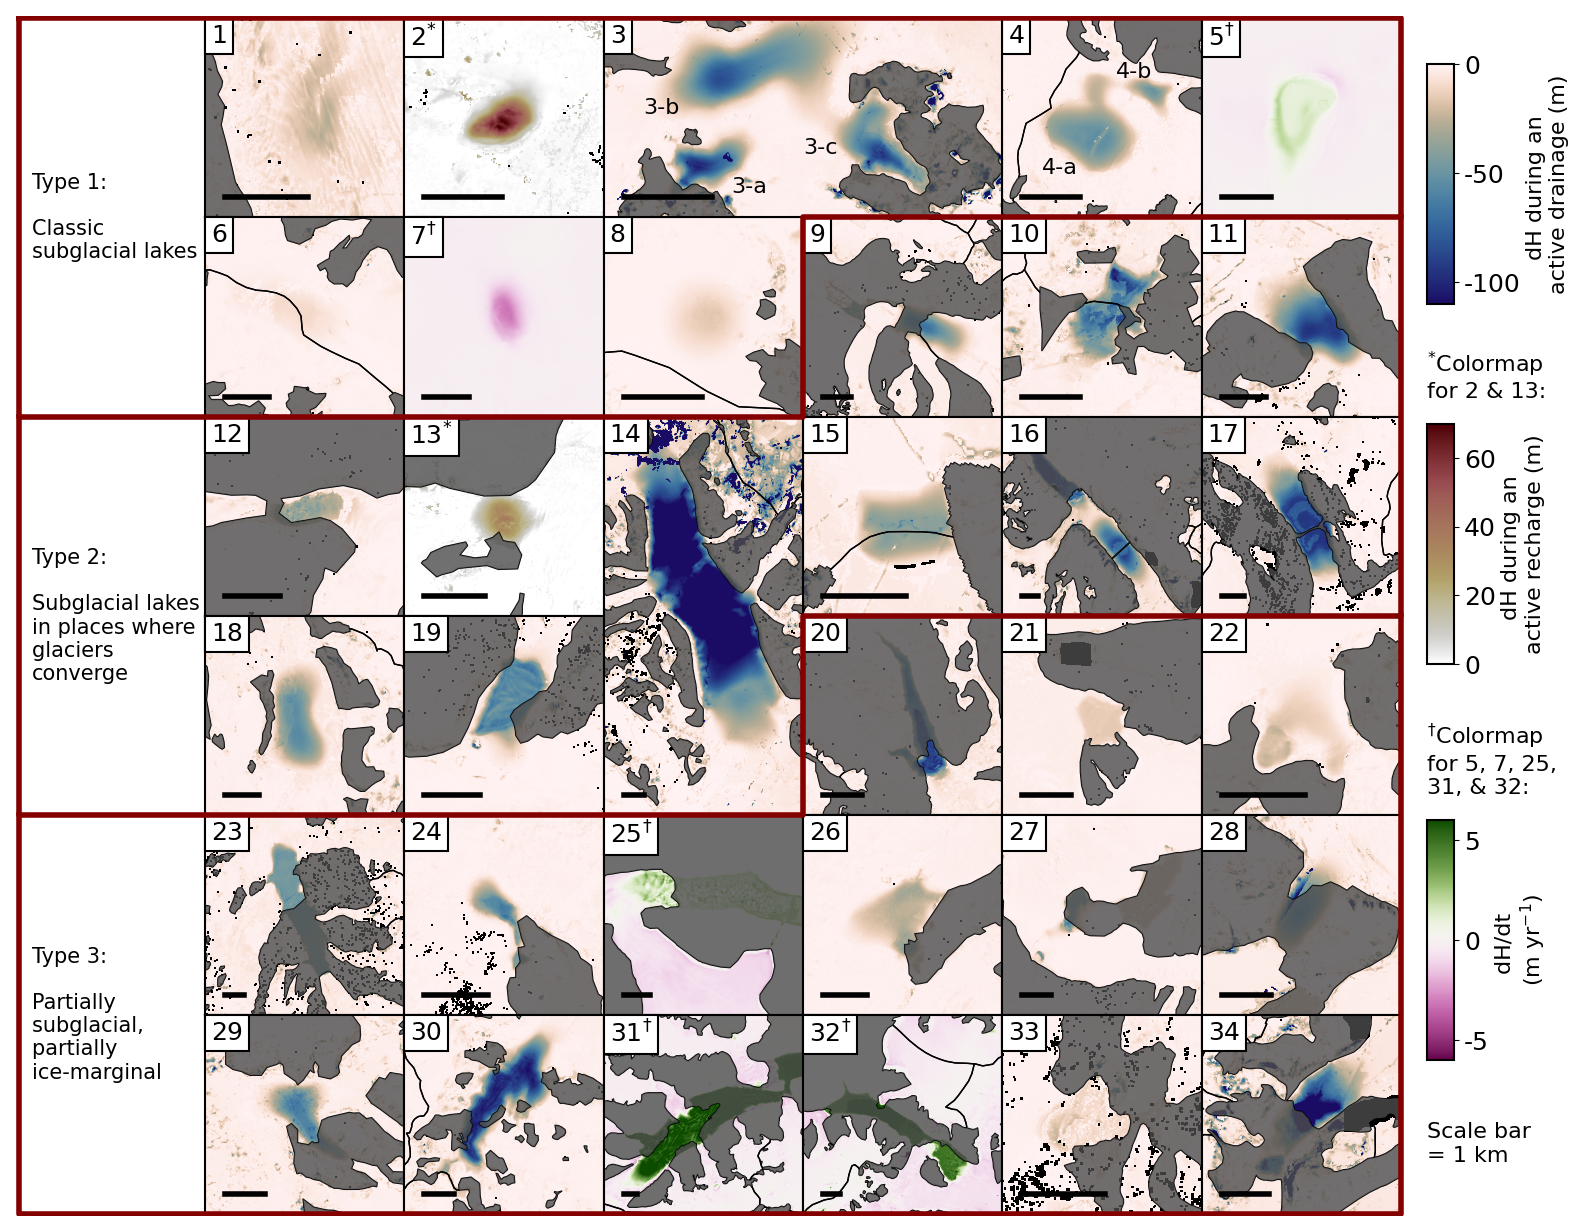
Figure 3Elevation change of the active subglacial lakes. The number of each panel corresponds to the lake number in Table 1. See Fig. 1 for their geographical locations. Each panel is color-coded by the ice elevation change (dH) during the most significant drainage event between 2011 and 2022. Exceptions are lakes 2 and 13, which are color-coded by the dH of a recharge event. Lakes 5, 7, 25, 31, and 32 do not have any short-term events and are thus visualized by the linear elevation change rate (dH dt) between 2011 and 2022. These lakes are classified into three types (Fig. 6), grouped by a thick red line with labels on the left. Dark area in each map panel is unglacierized, defined by the RGI 7.0 glacier outlines (RGI 7.0 Consortium, 2023).
The locations of these lakes are widespread across the Canadian Arctic, from 67° N (Penny Ice Cap, Baffin Island) to 82° N (Northern Ellesmere Island). However, only five (Lakes 15–17 and 33–34) are in the Arctic Canada South (Fig. 1). Of the other 32 lakes in the Arctic Canada North, 20 are located in the North Ellesmere Ice Field and the Agassiz Ice Cap. We do not observe any ice surface elevation change related to subglacial hydrology at the proposed hypersaline lake site in the Devon Ice Cap, indicating that the lake is stable or non-existent (Rutishauser et al., 2018; Killingbeck et al., 2024). The WGS84 ellipsoid height of the ice surface above the subglacial lake in 2016 varies from 59 m (Lake 1) to 1239 m (Lake 5; Table 1). We compare these numbers to the equilibrium line altitude (ELA) of the Meighen Ice Cap (∼ 500 m a.s.l.; Burgess and Danielson, 2022), the ELA of the Agassis Ice Cap (∼ 1100 m a.s.l.; Gray et al., 2015), the optical images in the summer (Supplement Figs. S1–S37, panel b), and a map of the average surface mass balance between 1958 and 2015 (Noël et al., 2018). The comparison shows that all lakes reported in this study are either within the ablation zone or close to the boundary of the accumulation-ablation zone. This geographical distribution is consistent with the active subglacial lakes in the neighboring Greenland Ice Sheet (Fan et al., 2023; Gray et al., 2024a). Note that our method is unable to detect stable subglacial lakes, and in the Greenland Ice Sheet, these lakes tend to be located above the ELA (Bowling et al., 2019; Fan et al., 2023).
All lakes and short-term events are reported for the first time, except Lakes 14 and 19 in Manson Icefield (Gray et al., 2024b). Lake 14 is the largest among the reported lakes. Our analysis shows that it has an area of 48.5 km2 and a drainage volume of 4.46 km3 between late 2020 and early 2021 (Figs. 3 and 5e). The glacier surface dropped vertically by up to 148 m during the drainage event. These estimates are consistent with the values reported in Gray et al. (2024b). In addition to the drastic drainage event in Lake 14, we identified four other lakes experiencing hydrological events that cause more than 100 m of elevation change during the study period. For comparison, only two subglacial lakes in Iceland (Grímsvötn and E-Skaftár Cauldron) have reached this scale of elevation change during a jökulhlaup event (Björnsson, 2003; Livingstone et al., 2013). The largest active subglacial lake in Greenland (below the Flade Isblink ice cap) caused ∼ 70 m of elevation change from its drainage (Willis et al., 2015; Lenaerts et al., 2013), and for Antarctica, active subglacial lakes are associated with a much smaller elevation change, usually below 20 m (Lenaerts et al., 2013). The subglacial lakes reported in this study usually have an area ranging from 0.3 to 15 km2, except Lake 14. Despite a smaller lake size, a short-term hydrological event can still cause a large change in surface elevations. All identified short-term events are associated with an elevation change of more than 10 m within one year, much higher than the average elevation change rate (< 1 m yr−1) of the Canadian Arctic (Hugonnet et al., 2021; Zemp et al., 2025). In addition to the drainage event in Lake 14, the other short-term events are associated with a change in water volume between 0.003 and 0.6 km3, or 0.003–0.6 Gt in mass assuming a water density of 1000 kg m−3.
4.2 Subglacial lake dynamics
Most of the reported lakes (30 of 37) undergo a slow recharge and fast drainage pattern (e.g., Fig. 5c–f, h). These lakes recharge over the course of multiple years and drain within a year. Since ArcticDEM data do not contain elevations for every season, we cannot determine the exact subannual timing of all lake drainage events. However, our results indicate that the drainage can only take a few months, such as Lakes 2, 3a–c, and 4a–b, located in northern Ellesmere Island (Figs. 4e–f and 5h). Three ArcticDEM observations of lakes 4a and 4b captured the short-term draining phase in July 2020 (Fig. 5h). Based on the sigmoid regression model, the entire event probably lasted only two to three months. For lakes 2 and 3a–c, although optical images (Landsat 8; Fig. 4a–b) show minimal surface change during the 2015 drainage (Lakes 3a–c) and recharge (Lake 2) event, the InSAR interferogram from ALOS-2 acquired between 20 October and 17 November 2015, shows decorrelated surface at Lakes 3a–c (Fig. 4c) possibly due to a vertical elevation change of more than tens of meters, much larger than the submeter radar wavelength of ALOS-2. Decorrelation makes phase unwrapping impossible for a quantitative surface deformation analysis. Still, their presence suggests that these lakes are rapidly draining in October and November 2015, compared to the other InSAR pair acquired during fall 2018 (Fig. 4d) when no short-term events are observed based on elevation data. These two examples are consistent with the observations of Lake 14 in Gray et al. (2024b), for which the ICESat-2 data suggested a drainage period of 30–60 d. Similarly, subglacial lakes in the peripheral regions of the Greenland Ice Sheet typically drain within three to four months (Livingstone et al., 2022; Fan et al., 2023).
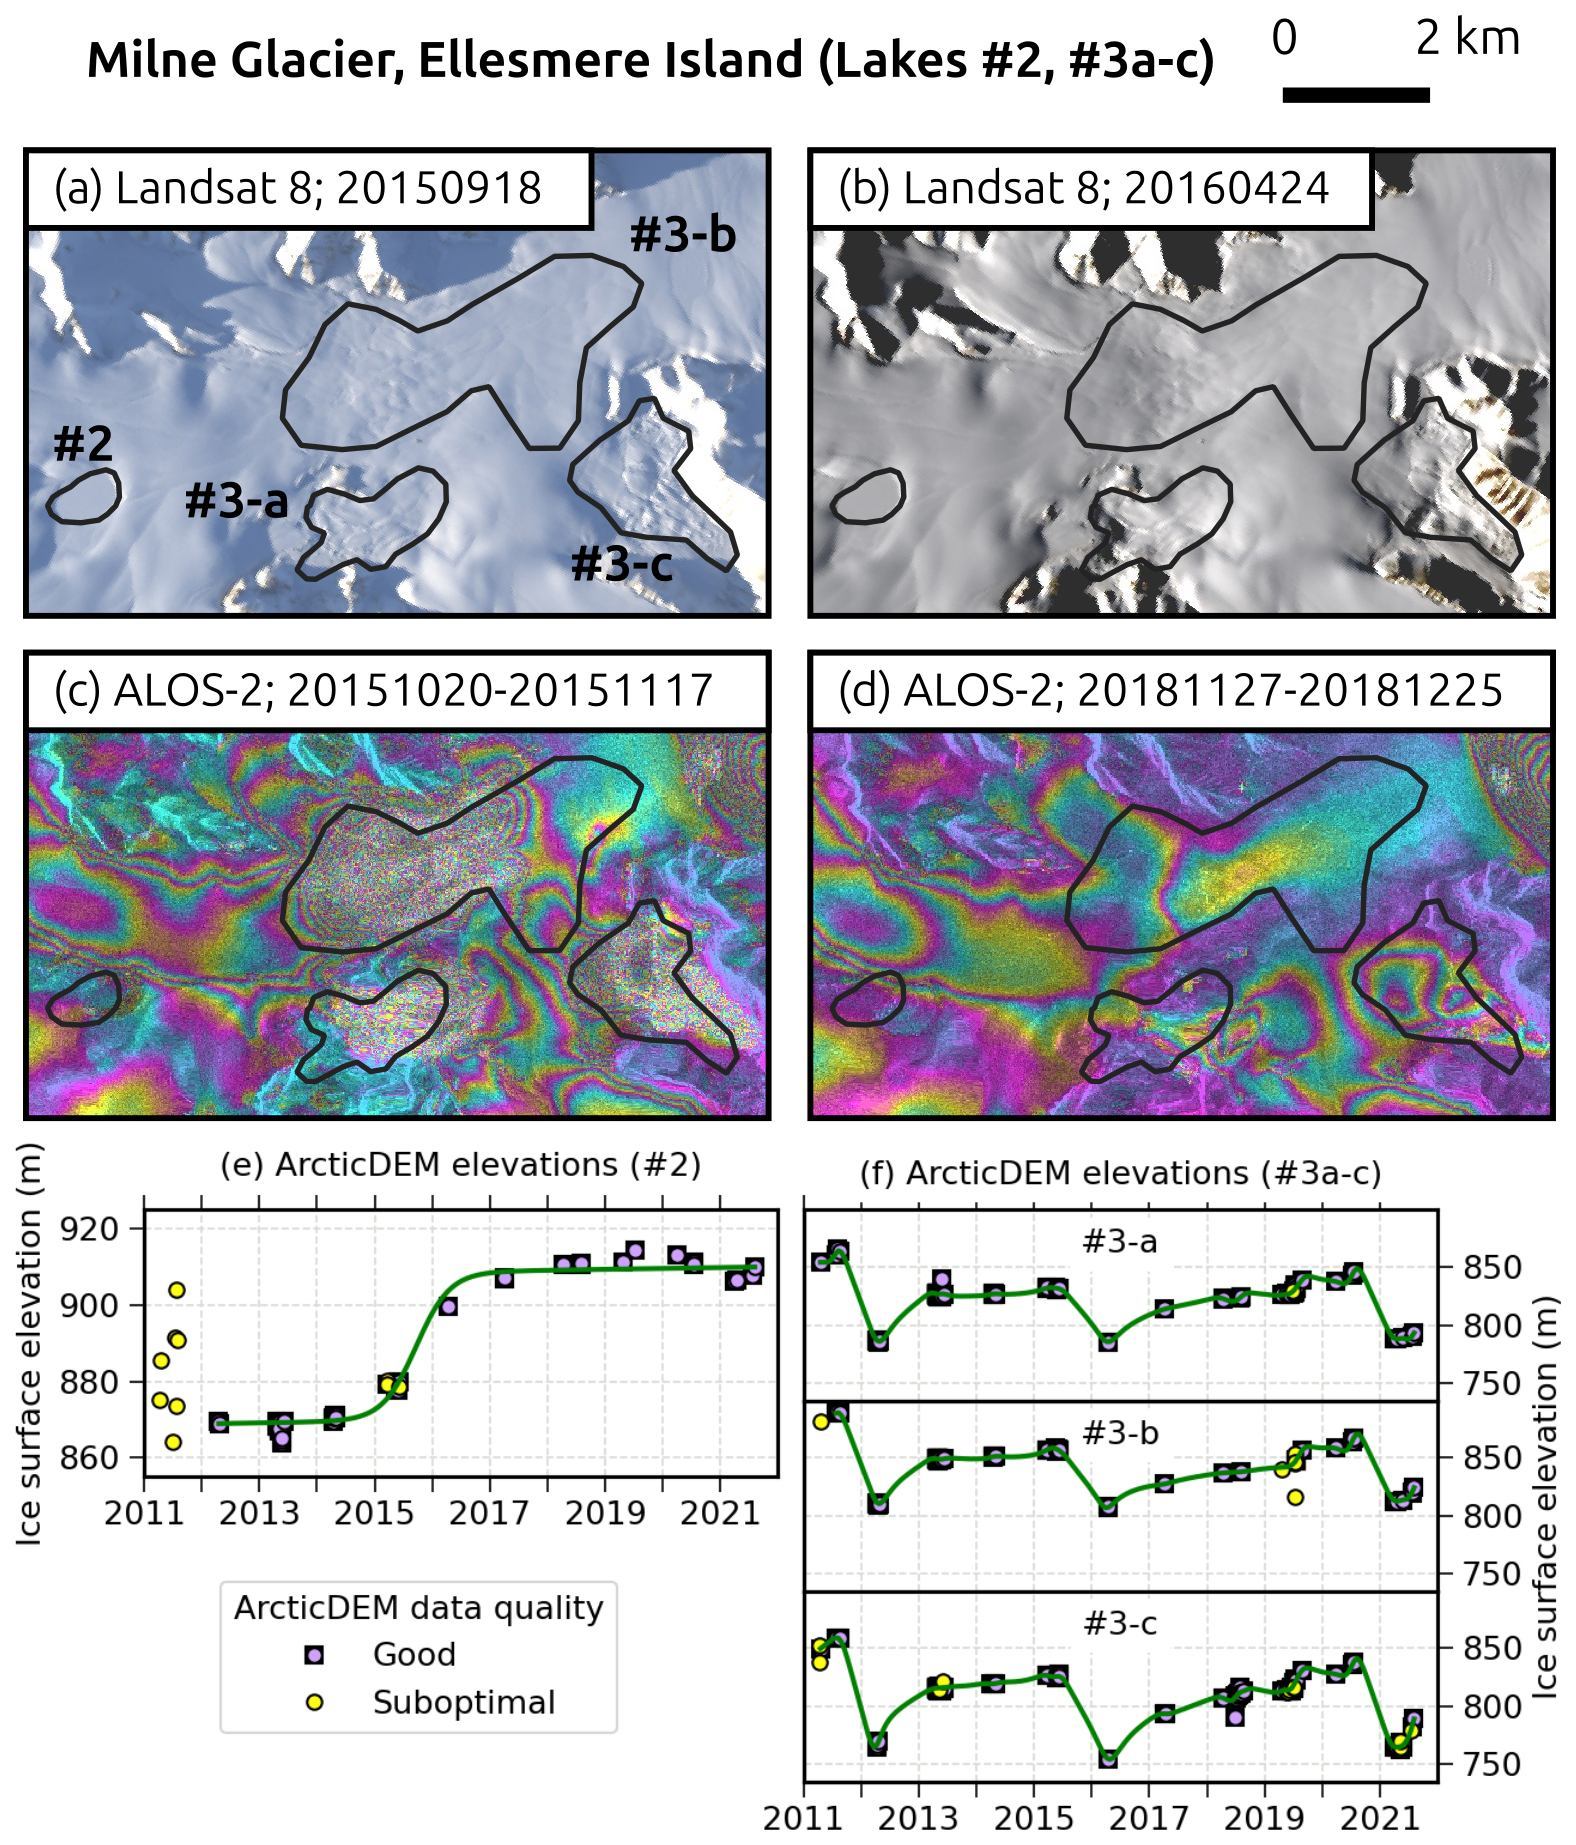
Figure 4Case study of four adjacent lakes. (a) Landsat image acquired on September 18, 2015, with locations of Lakes 2, 3-a, 3-b, and 3-c. (b) Landsat image acquired on April 4, 2016, after a drainage event took place in late 2015 at lakes 3-a to 3-c. (c) ALOS-2 interferogram between 20 October and 17 November 2015. The significant phase change at lakes 3-a to 3-c indicates an ongoing drainage event. (d) ALOS-2 interferogram between November 27 and December 25, 2018, showing only a little surface change compared to 2015. (e) Ice surface elevation change over time for Lake 2. Purple squares are observations used for the regression model (green curve), and yellow circles are the suboptimal elevations excluded from the regression model. Suboptimal elevations are flagged using the EVMD algorithm and the intrinsic ArcticDEM bitmask labels (see Sect. 2.1). (f) Ice surface elevation change over time for lakes 3-a to 3-c.
A short drainage duration may suggest the possible occurrence of a glacial lake outburst flood, but it is challenging to confirm with observations of subglacial pathways. Nevertheless, Gray et al. (2024b) identified an outflow channel connected to the eastern end of Lake 14 during its quick drainage in 2020–2021. Additionally, our analysis reveals two interconnected lake systems, Lakes 3a–c and 4a–b, as their drainage events are synchronized (Figs. 4f and 5h). No human settlements are close to any of the lakes reported in this study, and therefore the risk of infrastructure damage and loss of life due to the drainage of these lakes is very low.
The duration of the drain-recharge cycle varies within the reported lakes from almost every year (Fig. 5g) to once per decade (Fig. 5c). In fact, it is possible that the five subglacial lakes without identified short-term events simply have a drain-recharge cycle longer than our survey period. For example, the ice surface elevation at Lake 7 dropped approximately 10 m more than the prediction of the linear regression model in 2021 (Fig. 5b), implying a potential onset of short-term drainage after nine years of steady change. There are also cases with unclear or no cyclic behavior, such as short-term drainage without subsequent recharge (Lakes 4 and 6; Fig. 5d and h) and short-term recharge without subsequent drainage (Lake 2; Fig. 4e). These lakes may be associated with the formation of new inflow or outflow channels, which can transform a previously stable subglacial lake into an active one (Livingstone et al., 2022). Detailed analysis, with extended temporal data coverage, will still be necessary to confirm whether these lakes were once stable but have turned active.
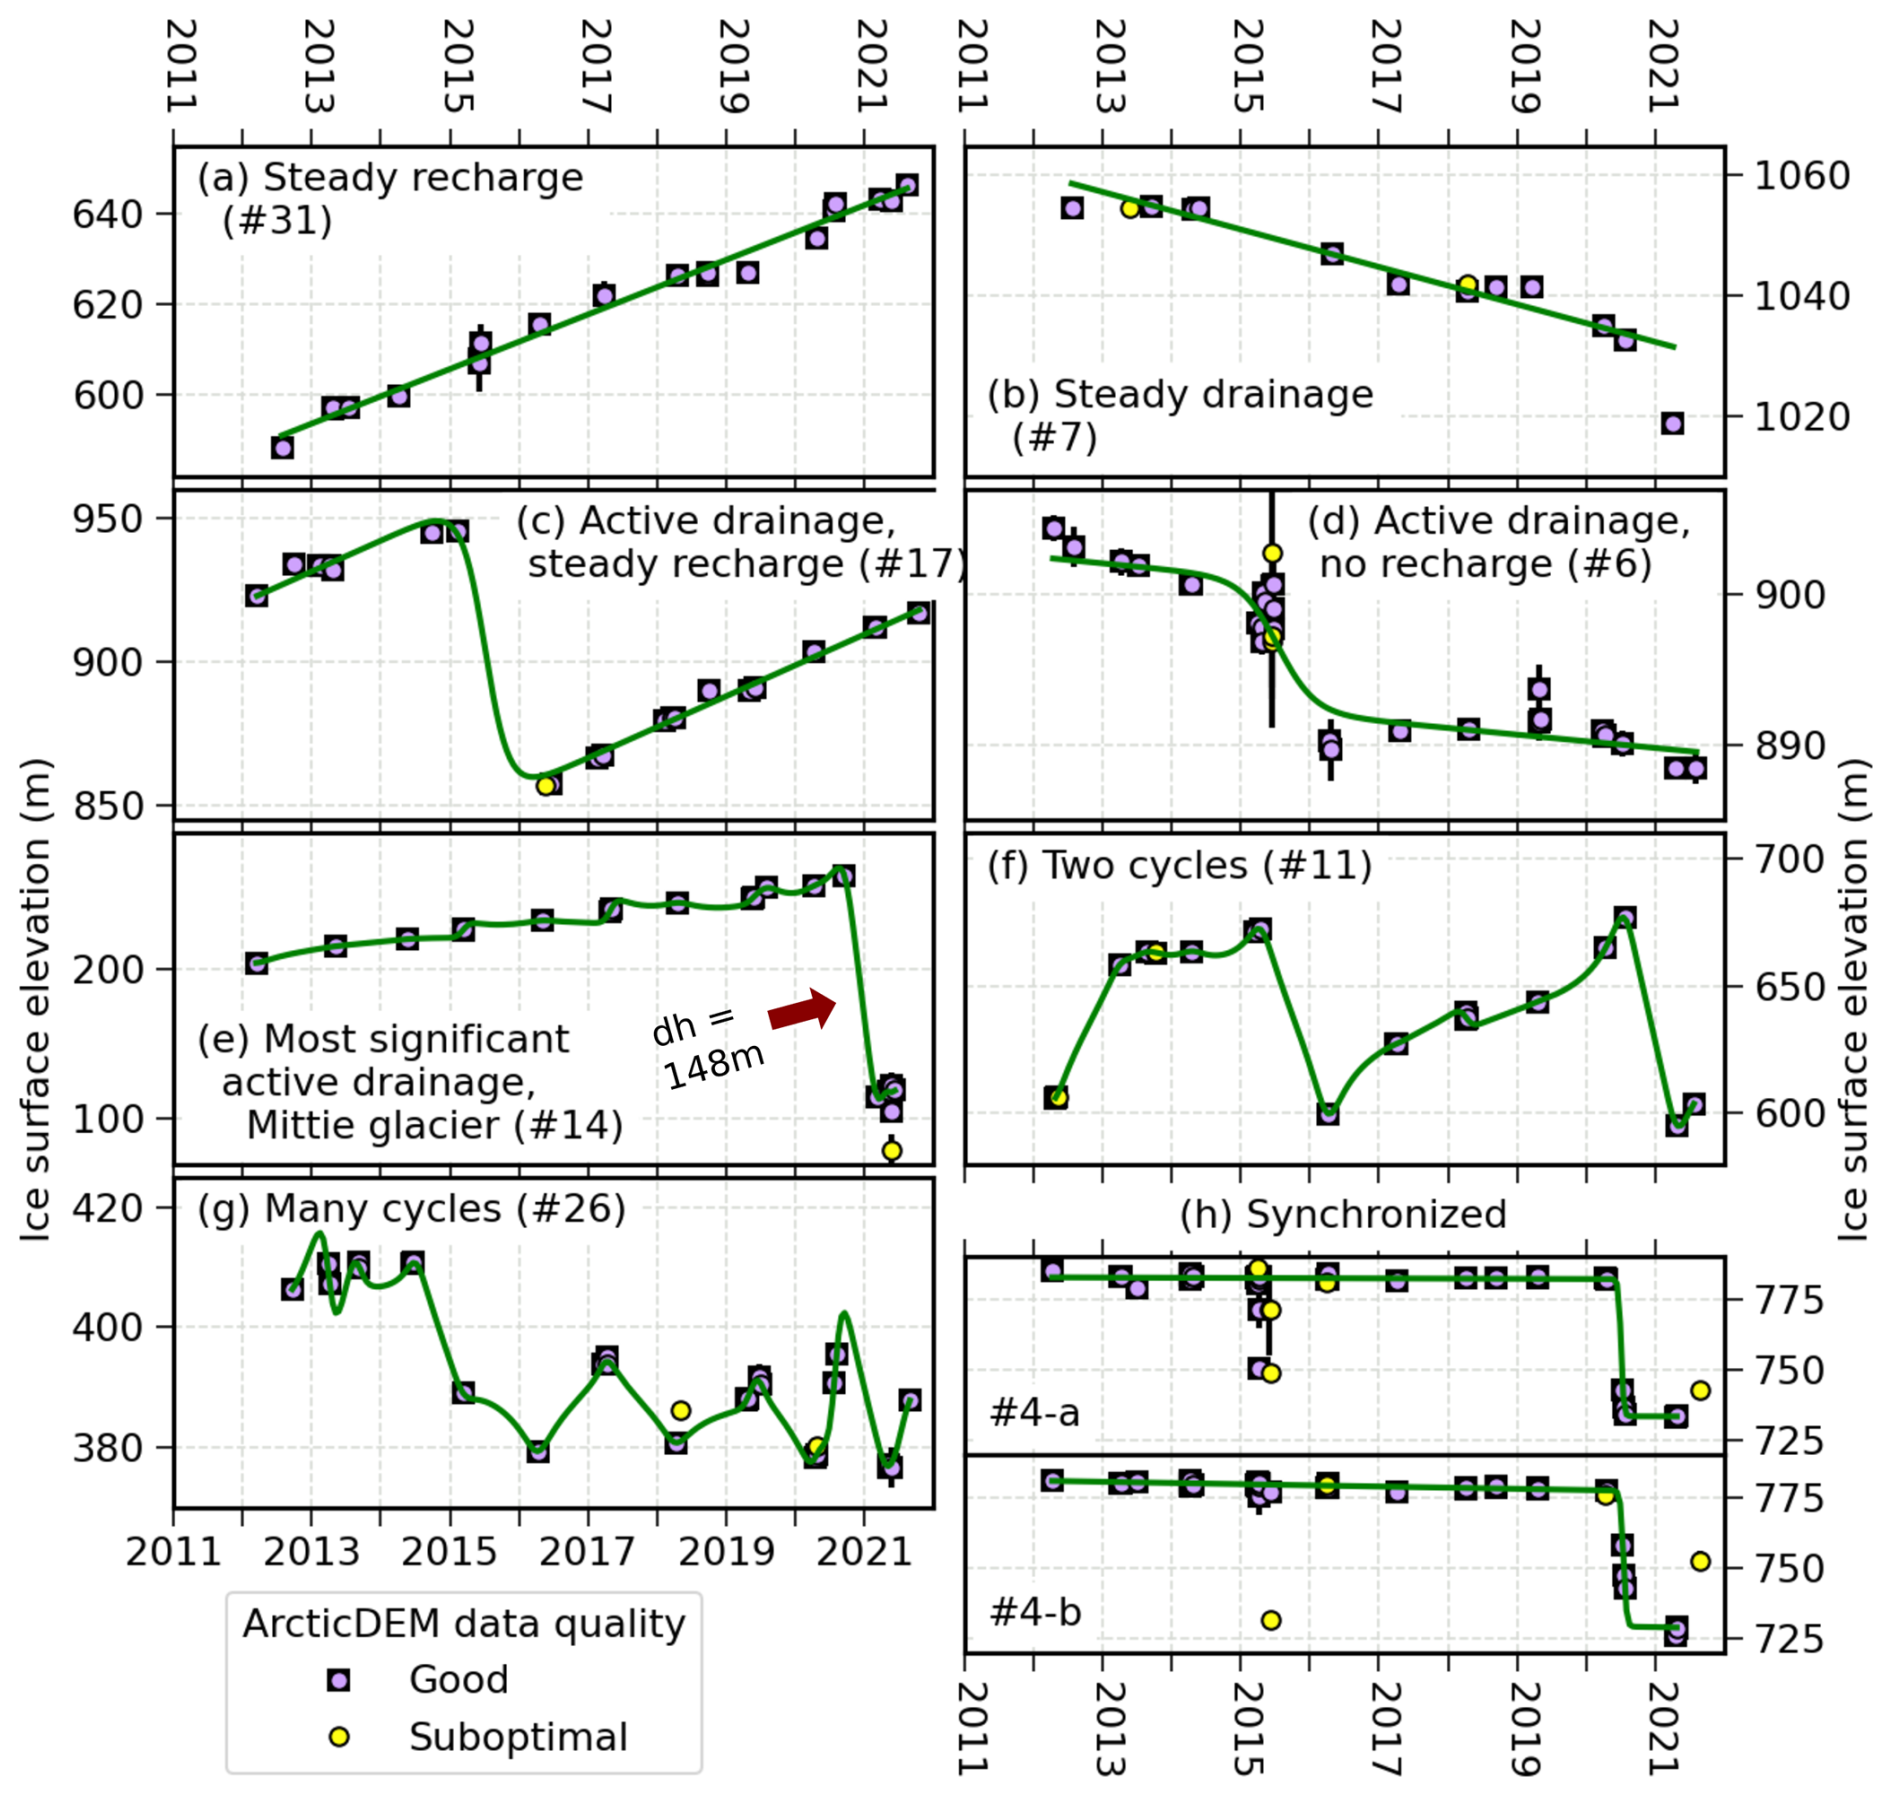
Figure 5Ice elevation change at the selected subglacial lake locations with various hydrological patterns. Lake numbers correspond to Figures 1–3 and Table 1. The ICESat-2-aligned ArcticDEM elevations are plotted based on their data quality: good (purple squares) and suboptimal (yellow circles). Suboptimal elevations are flagged using the EVMD algorithm and the intrinsic ArcticDEM bitmask labels (see Sect. 2.1). The regression model (green lines) uses all the good data as input and has three kinds based on the hydrological patterns: linear (a–b), sigmoid (c–d; h), and Gaussian processes (e–g). Panel (h) shows Lakes 4-a and 4-b with synchronous drainage patterns. Vertical bars indicate the 2σ error of the observations. Plots for other lakes are available in Figs. S1–S37.
Contrary to common observations from the past literature that lake drainage affects glacier velocity (Stearns et al., 2008; Siegfried et al., 2016; Andersen et al., 2023), the analysis of the ITS_LIVE ice surface velocities (Gardner et al., 2018, 2019) shows that these subglacial lakes and short-term events do not appear to influence ice movement (Figs. S1–S37, panel f). The only possible case is Lake 17 when the ice speed reaches ∼ 30 m yr−1 during drainage in the summer of 2015, compared to an ice speed of 0–20 m yr−1 in other years (Fig. S20f). This might suggest that most short-term drainage/recharge events are efficient through a channelized network, preventing the reduction of basal drag.
4.3 Subglacial lake classification
We classify these subglacial lakes into three types (Fig. 6). The first type represents a “classic” subglacial lake confined between a single glacier and the bedrock (Livingstone et al., 2022). The second type is found in locations where two glacier termini converge and coalesce within a valley topography. We introduce a new term “terminal subglacial lake” for this type, indicating its location at the coalesced glacier terminus. The type-3 subglacial lake, or a “partial subglacial lake”, includes an open water area at the ice margin as seen by joint analysis of optical images and elevation change. Among the 37 subglacial water bodies, eleven are classic subglacial lakes (Type 1), another eleven are terminal subglacial lakes (Type 2), and the remaining fifteen are partial subglacial lakes (Type 3).
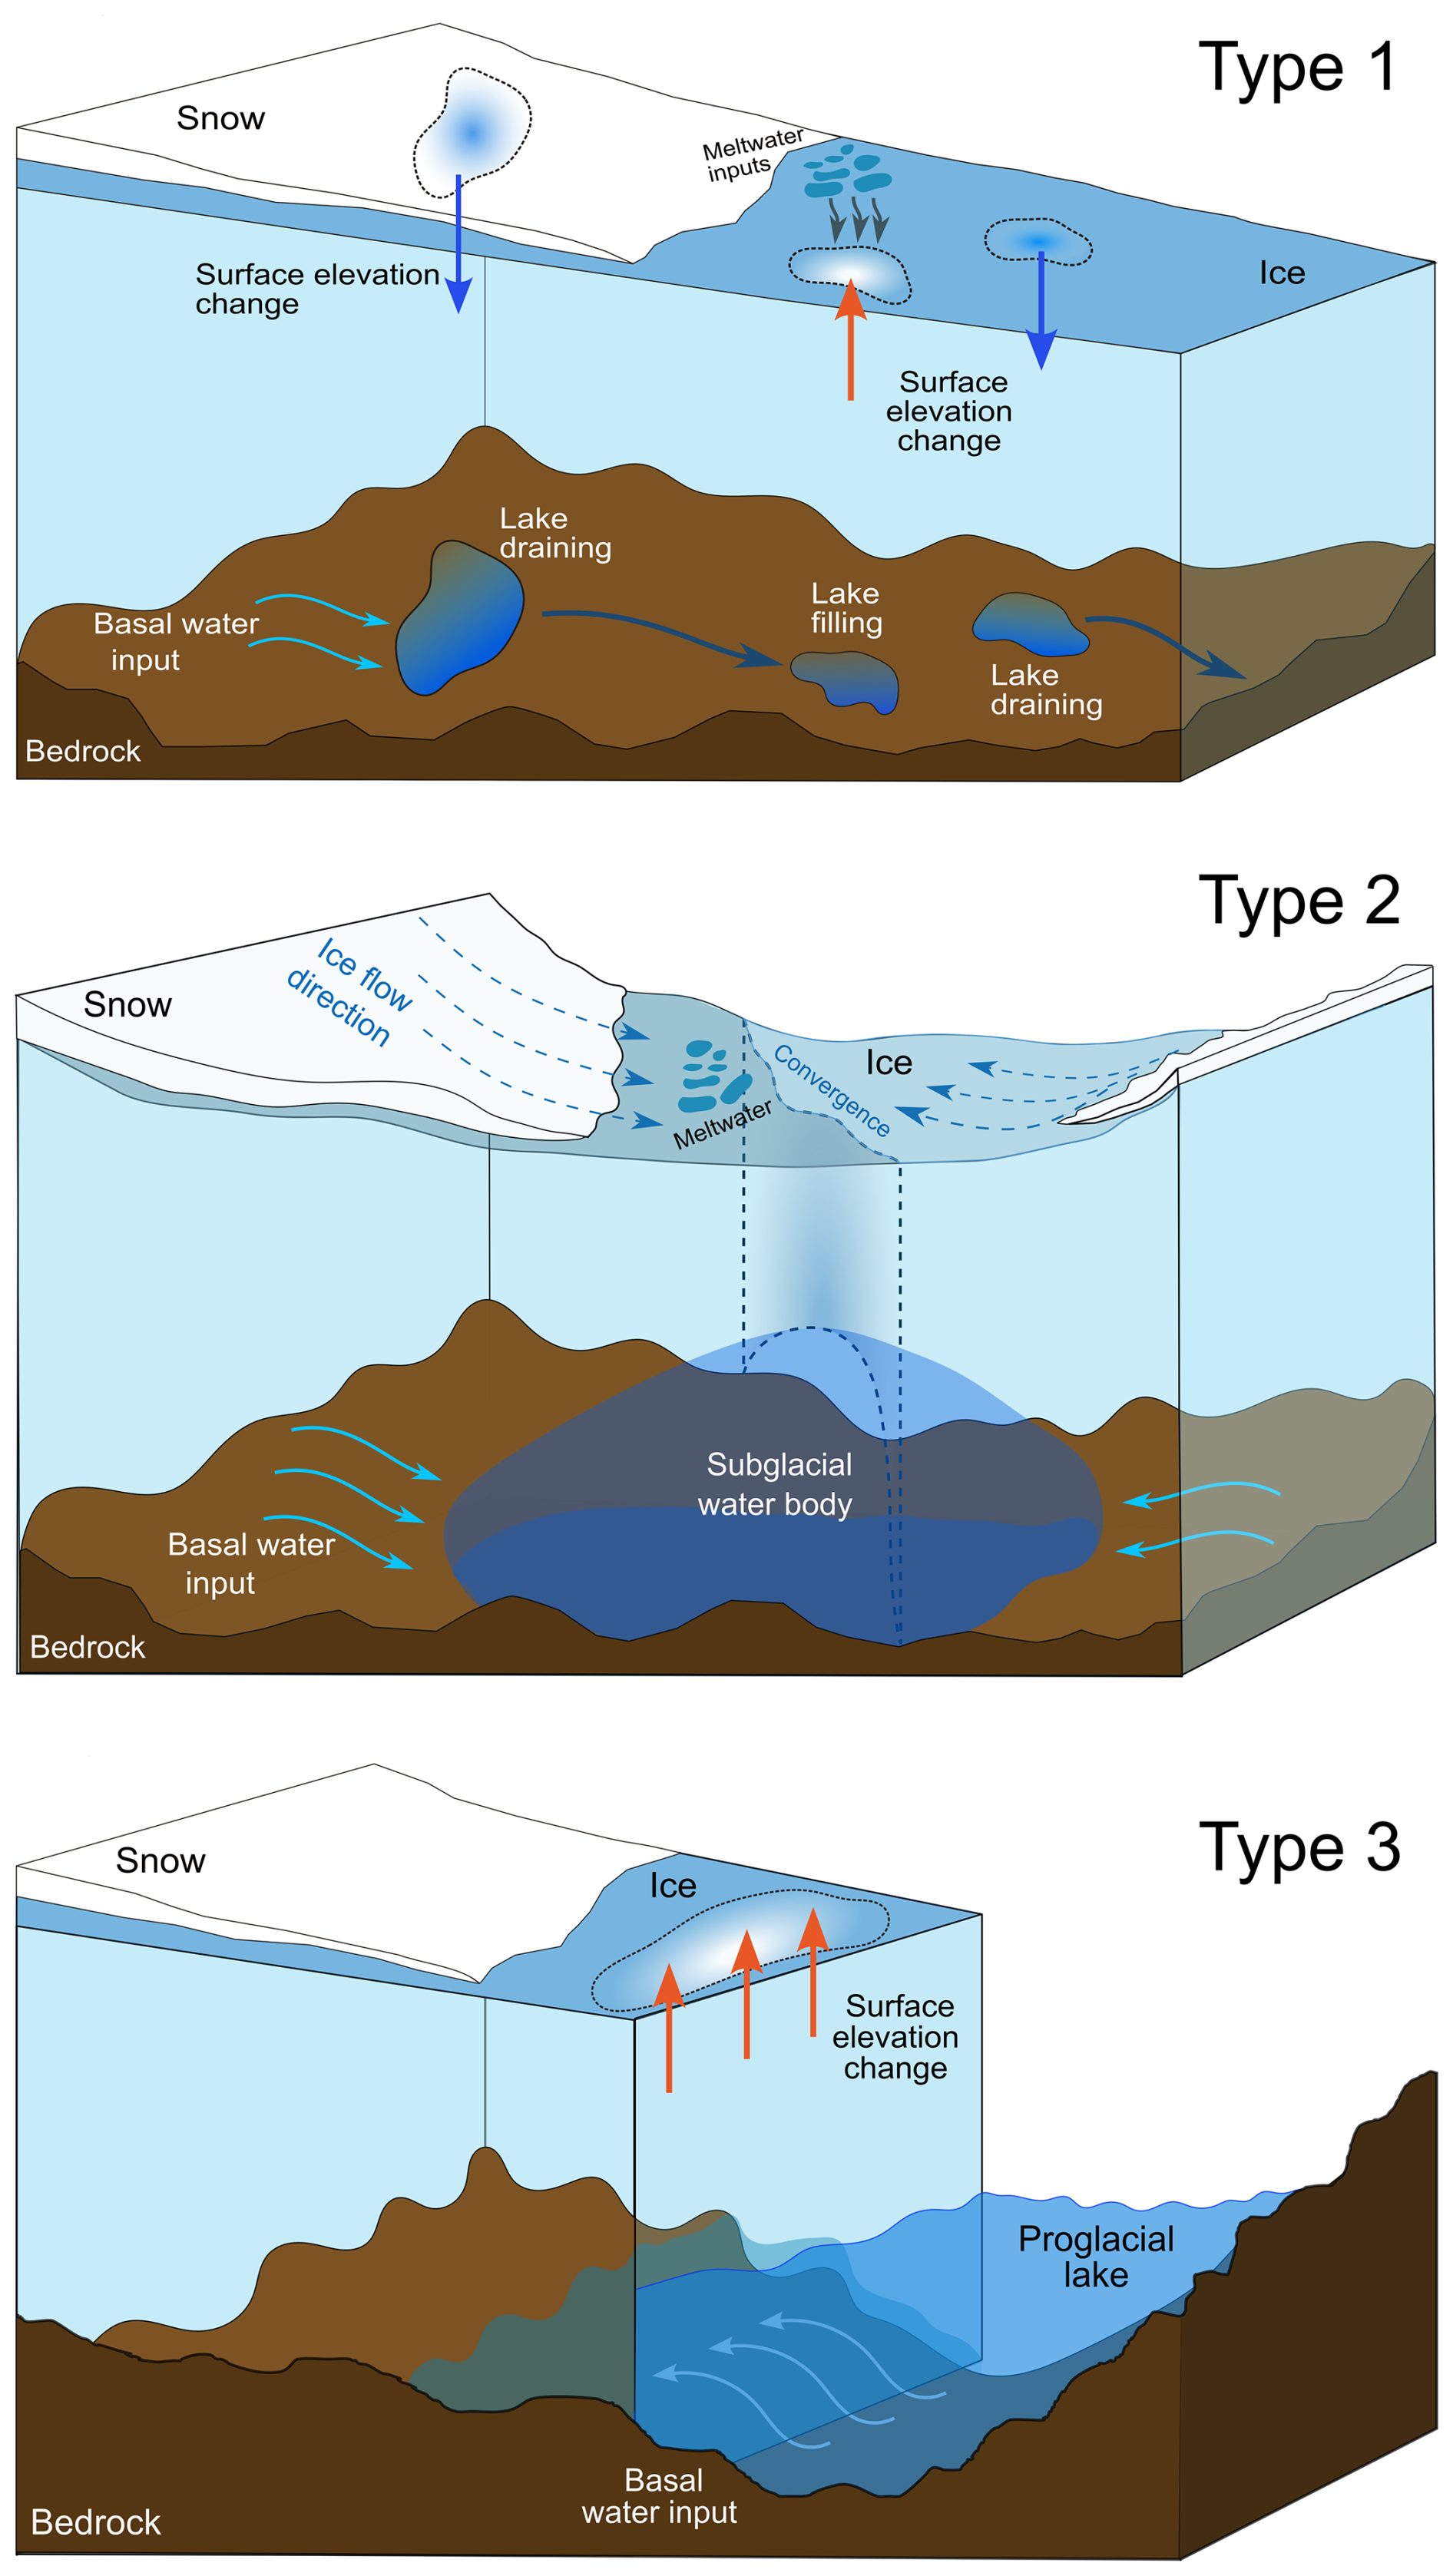
Figure 6Sketch showing different types of subglacial lakes described in this study. A Type 1 lake (classic subglacial) is confined by a single glacier and the bedrock. Sketch based on Livingstone et al. (2022). A Type 2 lake (terminal subglacial) is found at the coalesced terminus where two glacier flows converge and accumulate in a constrained valley topography. A Type 3 lake (partial subglacial) includes an open water area that resembles a proglacial lake when viewed in the satellite imagery.
Although this is the first time Type 2 lake (terminal subglacial) has been introduced, there have been a few lakes in the literature that can be classified as this type (Gray et al., 2024a, b). For a terminal subglacial lake to form, the ice at the coalesced terminus must be thinner than upstream to create an environment with low hydraulic potential. The valley side walls can thus provide good confinement for the water to accumulate. It is reasonable to assume similar water sources to classic subglacial lakes; that is, water can come from basal melt or surface melt that penetrates through the ice near or at the coalesced terminus. The compressional stress due to glacier convergence can create a heavily crevassed field as seen from the satellite images of these lakes (e.g., Lakes 13 and 19; Figs. S16b and S22b), providing the necessary englacial routes to the lake (Willis et al., 2015). It should be noted that all the terminal subglacial lakes discovered so far have short-term events.
Type 3 subglacial lakes (partial subglacial) show a great variety in terms of open-water area. Some of them are mostly beneath the ice (e.g., Lakes 22 and 24), while others have a proglacial area that is several times bigger than the subglacial portion (e.g., Lakes 20 and 32). For the latter case, the overlying glacier is essentially a floating ice tongue with surface elevations largely influenced by lake level. Since these lakes extend to non-glacierized area, they can be recharged by sources such as direct precipitation and surface runoff, in addition to glacier melt. For partial subglacial lakes with drain-recharge cycles, the water likely drains through the damming ice when the hydraulic pressure is sufficient to expand the outflow channels. Outside of the Canadian Arctic, three subglacial lakes at Brady Glacier, Alaska, reported by Capps et al. (2010), can also be reclassified as Type 3 lakes as well, since a small portion of these lakes is exposed along the glacier margin.
4.4 Correlation with regional mass balance
To understand whether subglacial lake activities have been influenced by recent ice loss in the Canadian Arctic, we perform a correlation analysis by comparing the number of short-term events each year with the annual glacier mass change published by the Glacier Mass Balance Intercomparison Exercise (GlaMBIE) project (Zemp et al., 2025). Since the event records for 2011–2012 and 2021–2022 may be incomplete due to our search constraints, we focus on the data between 2012 and 2021 for comparison. When comparing with the mass balance, we use the number of short-term subglacial events instead of the volume changes associated with these events because of two reasons: (1) All the existing mass balance estimates for this area have not excluded the mass loss due to subglacial lake activities, so the volume change due to subglacial events can already be highly correlated with the mass balance of the hosting glaciers. (2) A comparison using volume change would be highly skewed by Lake #14, which accounts for 63 % of the total volume change (Table 1). Our results show that the number of short-term subglacial events during these nine years has a significant correlation with the combined glacier mass change from the ACN and ACS (, p-value=0.039) under a 5 % significance level (Fig. 7). This significance still holds if we exclude partial subglacial (Type 3) lakes (, p-value =0.023). The strong correlation may indicate that increased meltwater supply can quickly change the hydraulic conditions of these subglacial lakes, opening new outflow channels for efficient drainage. An elevated recharge rate can also result in a shorter drain-recharge cycle. The change in Lake 26 may imply this process: lake drainage (as indicated by ice elevation change) took place every year since 2019, when the regional glacier mass change switched from a slight gain (14 Gt) to a large loss (−105 Gt) for at least two years (Figs. 5g and 7).
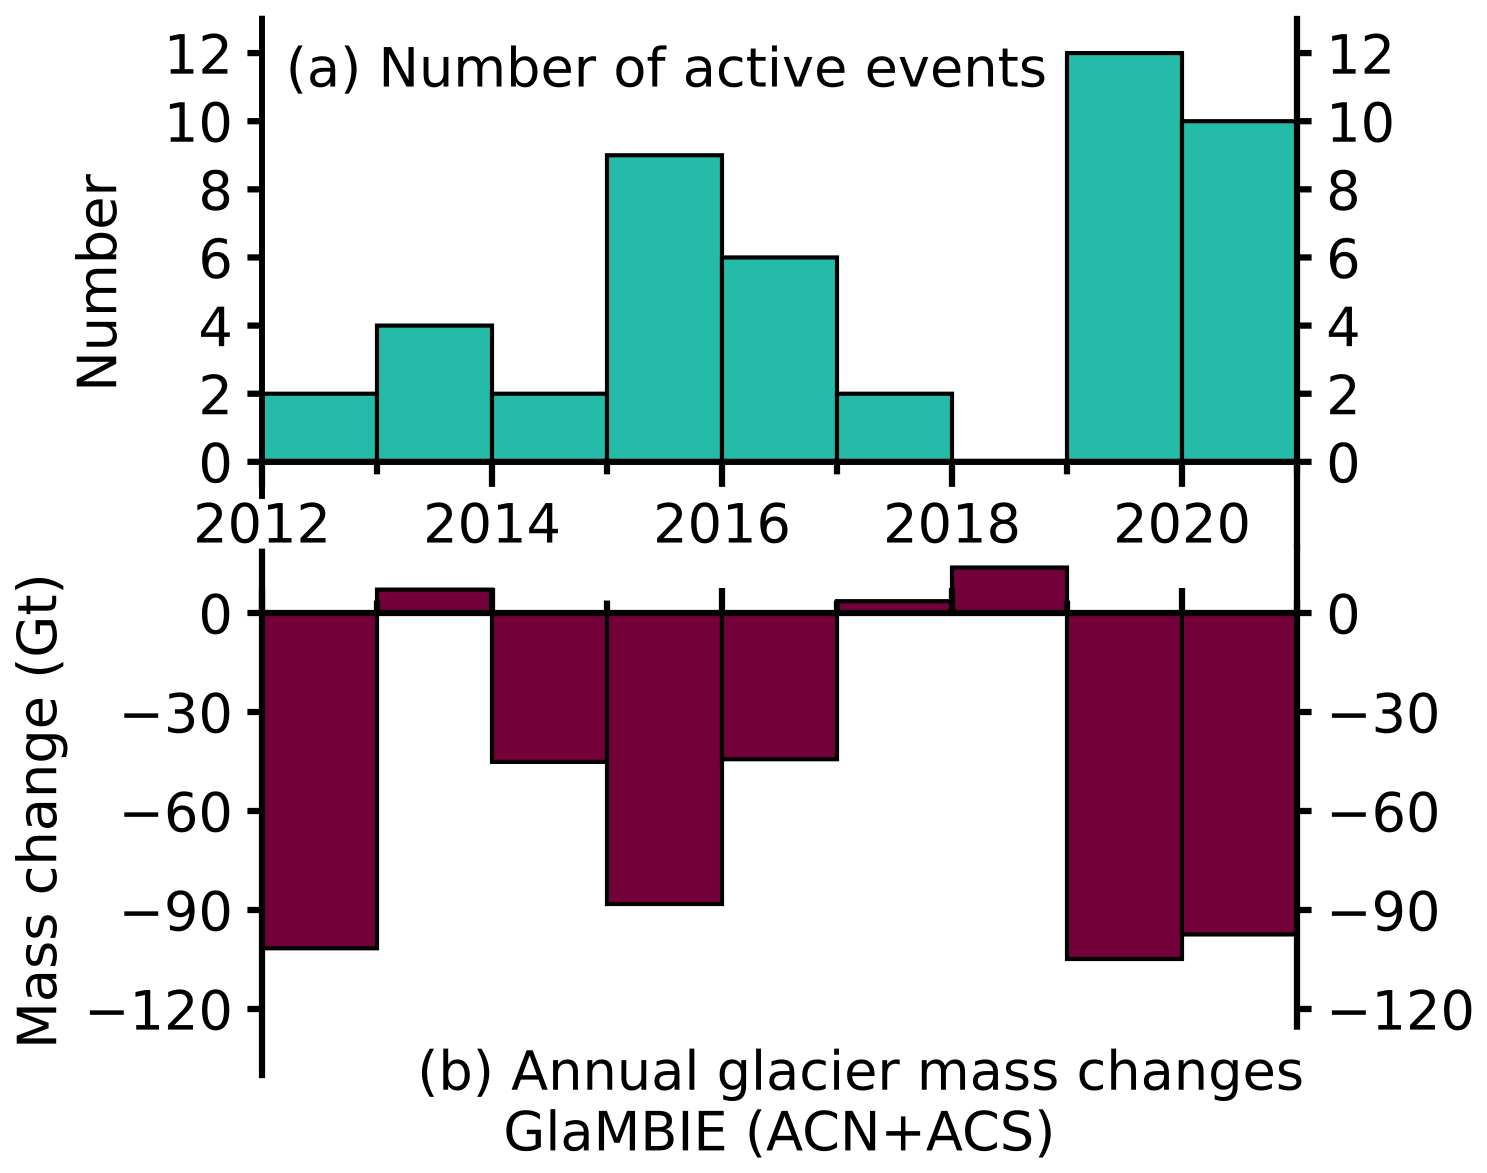
Figure 7Comparison between the subglacial event frequency and the regional glacier mass change. (a) Total number of short-term events from the reported subglacial lakes each year. The records of short-term events in 2011–2012 and 2021–2022 are excluded for this graph because they may be incomplete due to searching constraints. (b) Annual glacier mass change from the GlaMBIE project (Zemp et al., 2025). The plot shows the combined mass balance of the two subregions in the Canadian Arctic (north and south) defined by RGI (RGI 7.0 Consortium, 2023). Each annual record represents one hydrological year from 1 October to 30 September. For visualization purposes, we shift each record three months later and plot it starting on 1 January next year.
Although we did not observe a clear link between lake activities and ice velocity changes, these lakes have the potential to influence the glacier mass balance as indicated by the correlation found in this study. For partial subglacial lakes (Type 3), the ablation of glacier ice due to contact with lake water can cause additional loss of ice mass that is typically overlooked by satellite geodesy, as observed in proglacial lakes (Zhang et al., 2023). In addition, calving of lake terminating ice fronts may be facilitated by the presence of water at the margin, resulting in glacier retreat. Terminal subglacial lakes (Type 2) may also be vulnerable to these processes. Once the overlying ice melts or calves, they become partial subglacial lakes and are subject to instabilities related to ice-marginal lakes. The detailed mechanism and significance of these lakes for glacier dynamics and mass balances are still unclear and require fine-scale monitoring with the aid of future satellite programs and fieldwork, followed by a better parameterization of the subglacial hydrology model.
Considering the rapid changes and water volume associated with these lakes, it is therefore important to consider changes in subglacial hydrology when estimating the glacier mass balance, especially using geodesy-based methods, a process that has been inadequately incorporated due to a lack of understanding of the lake system. When applied to a regional or larger-scale analysis, these methods typically attribute the observed glacier surface height to the change in ice, firn, or snow volume, regardless of lake activities. However, our study shows that glaciers with an active subglacial lake can experience large variations in mass change largely controlled by lake drain-recharge cycles. A better assessment should separate the mass balance of liquid water from that of ice. In doing so, glacier ice loss and subglacial lake activities can be more precisely observed and modeled. Since the change in glacier mass correlates with the frequency of lake activities, this separation process could become even more important in the context of accelerated ice loss in the Canadian Arctic (Gardner et al., 2011; Lenaerts et al., 2013; Noël et al., 2018; Hugonnet et al., 2021; Zemp et al., 2025).
4.5 Limitations and future outlook
While we present a new high-resolution subglacial lake inventory for the Canadian Arctic over the period of 2011–2021, this study has several limitations in terms of the completeness of the subglacial lake inventory and the accuracy of subglacial events:
-
Our methodology is not capable of detecting subglacial lakes without distinct elevation change signals. Stable lakes are absent from the inventory because they do not affect ice surface elevations through hydrological events. Active lakes with a frequent drainage-recharge cycle might also be overlooked because the resulting elevation changes resemble high noise in a linear model.
-
The interannual availability of ArcticDEM acquisitions varies. Observations are typically in the spring and summer, and the winter elevations are missing because the DEMs were extracted from optical images, which cannot be captured during the polar night. Thus, the actual timing of the short-term events within a year is uncertain. This can underestimate the associated water volume if the immediate maximum or the minimum elevations before or after the event are missing.
-
Our method assumes that over the observed subglacial lake area, the elevation change observed at the ice surface directly translates to the change of subglacial water volume based on the conservation of glacier ice. This neglects that ice can flow into a surface depression after subglacial water is drained, and vice versa. Therefore, our water volume measurements are again likely to underestimate the true volume of the water movement (Smith et al., 2017).
-
The elevation change model is selected manually and does not necessarily represent the true physical signals resulting from the subglacial drainage or recharge. This imposes an additional uncertainty for detecting short-term events and water volume estimates due to model selection. For example, Lake #7 likely started a short-term drainage event in 2021 (Fig. 5b), but we are not able to report it with a linear model. It is needed to extend the elevation time series for this case to better fit the potential drainage event with the sigmoid or the Gaussian Process regression model.
Some current and future satellite missions may be used to improve the detection of subglacial lake activities. ICESat-2 will continue to provide precise elevation data every three months along its ground tracks, extending the elevation time series for better modeling. The CryoSat-2 and Surface Water and Ocean Topography (SWOT) satellites can also measure ice surface topography over time at hundred-meter-scale spatial resolution, thus potential data sets to detect active subglacial lakes. The SWOT satellite could also be used to trace other relevant signals, such as increased water outflow at nearby proglacial lakes and streams, as long as they are located within the orbital limit south of 78° N.
Our results present the first inventory of all known active subglacial lakes in the Canadian Arctic. We also introduce a three-type classification system for subglacial lakes, characterized by topological confinement and potential sources of water supply (Fig. 6). This inventory (Table 1) consists of 22 complete subglacial lakes (Types 1 and 2) and 15 partial subglacial lakes (Type 3). Even if we account for complete subglacial lakes alone, this number exceeds the number of active subglacial lakes in any other glacierized region, except Antarctica and the Greenland ice sheets (Livingstone et al., 2022; Fan et al., 2023). Furthermore, the Greenland ice sheet is at least 10 times larger than the glacierized Canadian Arctic, but it has only 24 active lakes in the most updated inventory (Fan et al., 2023). This comparison indicates that many subglacial lakes are still likely to be discovered.
Although these subglacial lakes are small, with only two exceeding 10 km2, their hydrological activity has caused substantial changes in the ice surface elevation. Most lakes follow a slow recharge and rapid drainage cycle, with drainage events likely lasting for several months. The drainage of the lake leads to the glacier surface lowering, and in five lakes the ice elevation decrease exceeds 100 m. The subglacial lake dynamics do not show a clear influence on glacier flow speed, but a significant correlation between the frequency of short-term hydrological events and the regional glacier mass balance is identified. These findings suggest that enhanced glacier mass loss may trigger subglacial lake activities through increased meltwater supply and altered hydraulic conditions.
The observed total water movement from the short-term drainage events is at the scale of several cubic kilometers (i.e., several gigatonnes assuming water density = 1000 kg m−3), which accounts for ∼ 1 %–2 % of the observed regional mass change (−457 Gt in 2012–2021, Fig. 7; Zemp et al., 2025). Nevertheless, with a warming climate, subglacial lakes in the Canadian Arctic may become more active, implying an increased influence on glacier mass balance. Continuous identification and monitoring of these lake activities through field and satellite observations will be essential for accurately understanding their contributions to glacier flow dynamics, calving process, and mass balance.
Table A1ALOS-2/PALSAR-2 data specifications used in this study.
The ArcticDEM strip data set is available at https://doi.org/10.7910/DVN/C98DVS (Porter et al., 2022). The ICESat-2 ATL-6 data are available at https://doi.org/10.5067/ATLAS/ATL06.006 (Smith et al., 2023). The RGI 7.0 glacier outlines for the Canadian Arctic are available at https://doi.org/10.5067/f6jmovy5navz (RGI 7.0 Consortium, 2023). The ALOS-2 PALSAR-2 stripmap SAR images are available for query and purchase at https://alos-pasco.com/en/offer/archive/ (last access: 6 May 2025). The derived data (excluding the InSAR results because we do not have authorization) necessary to reproduce the results and figures in this paper are available at https://doi.org/10.30238/TPIDR.DB_ISWCA/Dataset (Zheng et al., 2024).
The CARST software is hosted on Github (https://github.com/ncu-cryosensing/CARST, last access: 29 January 2026, https://doi.org/10.5281/zenodo.4592619, Zheng et al., 2021) and can be installed via PyPI (https://pypi.org/project/carst/, last access: 29 January 2026). The scripts we use to generate the figures in this paper are available at https://github.com/whyjz/ac-subglacial-lakes (last access: 29 January 2026, https://doi.org/10.5281/zenodo.19097467, Zheng, 2026) with the Jupyter Book pages at https://whyjz.github.io/ac-subglacial-lakes/ (last access: 29 January 2026).
The supplement related to this article is available online at https://doi.org/10.5194/tc-20-1699-2026-supplement.
Conceptualization: WZ, WVW. Methodology: WZ. Investigation: WZ, TY. Software: WZ, TL. Validation, Visualization, & Writing – original draft: WZ, WVW, TL. Writing – review and editing: all authors.
At least one of the (co-)authors is a member of the editorial board of The Cryosphere. The peer-review process was guided by an independent editor, and the authors also have no other competing interests to declare.
Publisher's note: Copernicus Publications remains neutral with regard to jurisdictional claims made in the text, published maps, institutional affiliations, or any other geographical representation in this paper. The authors bear the ultimate responsibility for providing appropriate place names. Views expressed in the text are those of the authors and do not necessarily reflect the views of the publisher.
We thank the National Center for High-Performance Computing (NCHC) in Taiwan for providing the computational resources necessary for this study. Wesley Van Wychen acknowledges support from the Canada Foundation for Innovation (John Evan’s Leadership Fund), the Ontario Research Fund, and Environment and Climate Change Canada (Climate Research Division). We acknowledge the ALOS4ice team for providing the ALOS-2/PALSAR-2 data (PI no. PER4A2N073). We thank Stephen Livingstone, Chang-Qing Ke, David Burgess, Jérémie Bonneau, and other anonymous colleagues, who provided constructive reviews to improve the quality of this work.
This research has been supported by the National Science and Technology Council of Taiwan (Whyjay Zheng; grant nos. 112-2628-M-008-006 and 113-2116-M-008-024), Natural Sciences and Engineering Research Council of Canada (NSERC) Discovery Grant/Cette recherche a été financée par le Conseil de recherches en sciences naturelles et en génie du Canada (CRSNG) (Wesley Van Wychen; grant no. RGPIN-02443-2021), European Union's Horizon 2020 research and innovation programme through the project Arctic PASSION (Tian Li; grant no. 101003472), and the Leverhulme Early Career Fellowship (Tian Li; grant no. ECF-2024-157).
This paper was edited by Stephen Livingstone and reviewed by Chang-Qing Ke and David Burgess.
Andersen, J. K., Rathmann, N., Hvidberg, C. S., Grinsted, A., Kusk, A., Merryman Boncori, J. P., and Mouginot, J.: Episodic Subglacial Drainage Cascades Below the Northeast Greenland Ice Stream, Geophys. Res. Lett., 50, https://doi.org/10.1029/2023GL103240, 2023. a, b, c, d, e
Arthur, J. F., Shackleton, C., Moholdt, G., Matsuoka, K., and van Oostveen, J.: Evidence of active subglacial lakes under a slowly moving coastal region of the Antarctic Ice Sheet, The Cryosphere, 19, 375–392, https://doi.org/10.5194/tc-19-375-2025, 2025. a
Bell, R. E.: The role of subglacial water in ice-sheet mass balance, Nat. Geosci., 1, 297–304, https://doi.org/10.1038/ngeo186, 2008. a, b
Beyer, R. A., Alexandrov, O., and McMichael, S.: The Ames Stereo Pipeline: NASA's Open Source Software for Deriving and Processing Terrain Data, Earth Space Sci., 5, 537–548, https://doi.org/10.1029/2018EA000409, 2018. a
Björnsson, H.: Subglacial lakes and jökulhlaups in Iceland, Global Planet. Change, 35, 255–271, https://doi.org/10.1016/S0921-8181(02)00130-3, 2003. a, b, c
Björnsson, H., Rott, H., Gudmundsson, S., Fischer, A., Siegel, A., and Gudmundsson, M. T.: Glacier–volcano interactions deduced by SAR interferometry, J. Glaciol., 47, 58–70, https://doi.org/10.3189/172756501781832520, 2001. a, b
Bowling, J. S., Livingstone, S. J., Sole, A. J., and Chu, W.: Distribution and dynamics of Greenland subglacial lakes, Nat. Commun., 10, 2810, https://doi.org/10.1038/s41467-019-10821-w, 2019. a, b
Burgess, D. O. and Danielson, B. D.: Meighen Ice Cap: changes in geometry, mass, and climatic response since 1959, Can. J. Earth Sci., 59, 884–896, https://doi.org/10.1139/cjes-2021-0126, 2022. a
Capps, D. M., Rabus, B., Clague, J. J., and Shugar, D. H.: Identification and characterization of alpine subglacial lakes using interferometric synthetic aperture radar (InSAR): Brady Glacier, Alaska, USA, J. Glaciol., 56, 861–870, https://doi.org/10.3189/002214310794457254, 2010. a, b
Ehrenfeucht, S., Dow, C., McArthur, K., Morlighem, M., and McCormack, F. S.: Antarctic Wide Subglacial Hydrology Modeling, Geophys. Res. Lett., 52, e2024GL111386, https://doi.org/10.1029/2024GL111386, 2025. a
Ester, M., Kriegel, H.-P., Sander, J., and Xu, X.: A density-based algorithm for discovering clusters in large spatial databases with noise, in: Proceedings of the Second International Conference on Knowledge Discovery and Data Mining (KDD-96), edited by Simoudis, E., Han, J., and Fayyad, U. M., 226–231, AAAI Press, https://dl.acm.org/doi/10.5555/3001460.3001507 (Last access: 18 March 2026.), 1996. a
Fan, Y., Ke, C.-Q., Shen, X., Xiao, Y., Livingstone, S. J., and Sole, A. J.: Subglacial lake activity beneath the ablation zone of the Greenland Ice Sheet, The Cryosphere, 17, 1775–1786, https://doi.org/10.5194/tc-17-1775-2023, 2023. a, b, c, d, e, f
Flament, T., Berthier, E., and Rémy, F.: Cascading water underneath Wilkes Land, East Antarctic ice sheet, observed using altimetry and digital elevation models, The Cryosphere, 8, 673–687, https://doi.org/10.5194/tc-8-673-2014, 2014. a, b
Fricker, H. A. and Scambos, T.: Connected subglacial lake activity on lower Mercer and Whillans Ice Streams, West Antarctica, 2003–2008, J. Glaciol., 55, 303–315, https://doi.org/10.3189/002214309788608813, 2009. a, b
Fricker, H. A., Carter, S. P., Bell, R. E., and Scambos, T.: Active lakes of recovery ice stream, East Antarctica: A bedrock-controlled subglacial hydrological system, J. Glaciol., 60, 1015–1030, https://doi.org/10.3189/2014JoG14J063, 2014. a, b
Gardner, A. S., Moholdt, G., Wouters, B., Wolken, G. J., Burgess, D. O., Sharp, M. J., Cogley, J. G., Braun, C., and Labine, C.: Sharply increased mass loss from glaciers and ice caps in the Canadian Arctic Archipelago, Nature, 473, 357–360, https://doi.org/10.1038/nature10089, 2011. a
Gardner, A. S., Moholdt, G., Scambos, T., Fahnstock, M., Ligtenberg, S., van den Broeke, M., and Nilsson, J.: Increased West Antarctic and unchanged East Antarctic ice discharge over the last 7 years, The Cryosphere, 12, 521–547, https://doi.org/10.5194/tc-12-521-2018, 2018. a, b
Gardner, A. S., Fahnestock, M. A., and Scambos, T. A.: ITS_LIVE Regional Glacier and Ice Sheet Surface Velocities, National Snow and Ice Data Center [data set], https://doi.org/10.5067/6II6VW8LLWJ7, 2019. a, b
Gray, L., Burgess, D., Copland, L., Demuth, M. N., Dunse, T., Langley, K., and Schuler, T. V.: CryoSat-2 delivers monthly and inter-annual surface elevation change for Arctic ice caps, The Cryosphere, 9, 1895–1913, https://doi.org/10.5194/tc-9-1895-2015, 2015. a
Gray, L., Burgess, D., Copland, L., Dow, C., Fettweis, X., Fisher, D., Kochtitzky, W., van Wychen, W., and Zheng, J.: Repeated subglacial jökulhlaups in northeastern Greenland revealed by CryoSat, J. Glaciol., 1–11, https://doi.org/10.1017/jog.2024.32, 2024a. a, b, c
Gray, L., Lauzon, B., Copland, L., Van Wychen, W., Dow, C., Kochtitzky, W., and Alley, K. E.: Tracking the Filling, Outburst Flood and Resulting Subglacial Water Channel From a Large Canadian Arctic Subglacial Lake, Geophys. Res. Lett., 51, https://doi.org/10.1029/2024GL110456, 2024b. a, b, c, d, e, f, g, h
Hodgson, D. A., Jordan, T. A., Ross, N., Riley, T. R., and Fretwell, P. T.: Drainage and refill of an Antarctic Peninsula subglacial lake reveal an active subglacial hydrological network, The Cryosphere, 16, 4797–4809, https://doi.org/10.5194/tc-16-4797-2022, 2022. a
Hugonnet, R., McNabb, R., Berthier, E., Menounos, B., Nuth, C., Girod, L., Farinotti, D., Huss, M., Dussaillant, I., Brun, F., and Kääb, A.: Accelerated global glacier mass loss in the early twenty-first century, Nature, 592, 726–731, https://doi.org/10.1038/s41586-021-03436-z, 2021. a, b, c, d
Jakob, L. and Gourmelen, N.: Glacier Mass Loss Between 2010 and 2020 Dominated by Atmospheric Forcing, Geophys. Res. Lett., 50, 1–10, https://doi.org/10.1029/2023GL102954, 2023. a
Khalsa, S. J. S., Borsa, A., Nandigam, V., Phan, M., Lin, K., Crosby, C., Fricker, H., Baru, C., and Lopez, L.: OpenAltimetry – rapid analysis and visualization of Spaceborne altimeter data, Earth Sci. Inform., 15, 1471–1480, https://doi.org/10.1007/s12145-020-00520-2, 2022. a
Killingbeck, S. F., Rutishauser, A., Unsworth, M. J., Dubnick, A., Criscitiello, A. S., Killingbeck, J., Dow, C. F., Hill, T., Booth, A. D., Main, B., and Brossier, E.: Misidentified subglacial lake beneath the Devon Ice Cap, Canadian Arctic: a new interpretation from seismic and electromagnetic data, The Cryosphere, 18, 3699–3722, https://doi.org/10.5194/tc-18-3699-2024, 2024. a, b
Killingbeck, S. F., Unsworth, M. J., Young, D. A., Rutishauser, A., Yan, S., Beem, L. H., Richter, T. G., Blankenship, D. D., Dubnick, A., Criscitiello, A. S., Vestrum, Z., Greenbaum, J., and Dow, C. F.: Integrating Gravity, Magnetic, and Magnetotelluric Data Over Devon Ice Cap, Canadian Arctic, to Investigate the Subglacial Geology, J. Geophys. Res.-Sol. Ea., 130, https://doi.org/10.1029/2024JB028929, 2025. a
Lenaerts, J. T. M., van Angelen, J. H., van den Broeke, M. R., Gardner, A. S., Wouters, B., and van Meijgaard, E.: Irreversible mass loss of Canadian Arctic Archipelago glaciers, Geophys. Res. Lett., 40, 870–874, https://doi.org/10.1002/grl.50214, 2013. a, b, c
Livingstone, S. J., Clark, C. D., Woodward, J., and Kingslake, J.: Potential subglacial lake locations and meltwater drainage pathways beneath the Antarctic and Greenland ice sheets, The Cryosphere, 7, 1721–1740, https://doi.org/10.5194/tc-7-1721-2013, 2013. a, b
Livingstone, S. J., Li, Y., Rutishauser, A., Sanderson, R. J., Winter, K., Mikucki, J. A., Björnsson, H., Bowling, J. S., Chu, W., Dow, C. F., Fricker, H. A., McMillan, M., Ng, F. S. L., Ross, N., Siegert, M. J., Siegfried, M., and Sole, A. J.: Subglacial lakes and their changing role in a warming climate, Nature Reviews Earth & Environment, 3, 106–124, https://doi.org/10.1038/s43017-021-00246-9, 2022. a, b, c, d, e, f, g, h, i
MacKie, E. J., Schroeder, D. M., Caers, J., Siegfried, M. R., and Scheidt, C.: Antarctic Topographic Realizations and Geostatistical Modeling Used to Map Subglacial Lakes, J. Geophys. Res.-Earth, 125, https://doi.org/10.1029/2019JF005420, 2020. a
Magnússon, E., Rott, H., Björnsson, H., and Pálsson, F.: The impact of jökulhlaups on basal sliding observed by SAR interferometry on Vatnajökull, Iceland, J. Glaciol., 53, 232–240, https://doi.org/10.3189/172756507782202810, 2007. a
Noël, B., van de Berg, W. J., Lhermitte, S., Wouters, B., Schaffer, N., and van den Broeke, M. R.: Six Decades of Glacial Mass Loss in the Canadian Arctic Archipelago, J. Geophys. Res.-Earth, 123, 1430–1449, https://doi.org/10.1029/2017JF004304, 2018. a, b, c
Pedregosa, F., Varoquaux, G., Gramfort, A., Michel, V., Thirion, B., Grisel, O., Blondel, M., Prettenhofer, P., Weiss, R., Dubourg, V., Vanderplas, J., Passos, A., Cournapeau, D., Brucher, M., Perrot, M., and Duchesnay, E.: Scikit-learn: Machine Learning in Python, J. Mach. Learn. Res., 12, 2825–2830, 2011. a, b
Porter, C., Howat, I., Noh, M.-J., Husby, E., Khuvis, S., Danish, E., Tomko, K., Gardiner, J., Negrete, A., Yadav, B., Klassen, J., Kelleher, C., Cloutier, M., Bakker, J., Enos, J., Arnold, G., Bauer, G., and Morin, P.: ArcticDEM – Strips, Version 4.1, Harvard Dataverse [data set], https://doi.org/10.7910/DVN/C98DVS, 2022. a, b, c, d, e
Porter, C., Howat, I., Noh, M.-J., Husby, E., Khuvis, S., Danish, E., Tomko, K., Gardiner, J., Negrete, A., Yadav, B., Klassen, J., Kelleher, C., Cloutier, M., Bakker, J., Enos, J., Arnold, G., Bauer, G., and Morin, P.: ArcticDEM – Mosaics, Version 4.1, Harvard Dataverse [data set], https://doi.org/10.7910/DVN/3VDC4W, 2023. a
Rasmussen, C. E. and Williams, C. K. I.: Gaussian Processes for Machine Learning, The MIT Press, ISBN 026218253X, https://doi.org/10.7551/mitpress/3206.001.0001, 2005. a
RGI 7.0 Consortium: Randolph Glacier Inventory – A Dataset of Global Glacier Outlines, Version 7.0, National Snow and Ice Data Center [data set], https://doi.org/10.5067/f6jmovy5navz, 2023. a, b, c, d, e
Rutishauser, A., Blankenship, D. D., Sharp, M., Skidmore, M. L., Greenbaum, J. S., Grima, C., Schroeder, D. M., Dowdeswell, J. A., and Young, D. A.: Discovery of a hypersaline subglacial lake complex beneath Devon Ice Cap, Canadian Arctic, Science Advances, 4, 2–7, https://doi.org/10.1126/sciadv.aar4353, 2018. a, b
Sandberg Sørensen, L., Bahbah, R., Simonsen, S. B., Havelund Andersen, N., Bowling, J., Gourmelen, N., Horton, A., Karlsson, N. B., Leeson, A., Maddalena, J., McMillan, M., Solgaard, A., and Wessel, B.: Improved monitoring of subglacial lake activity in Greenland, The Cryosphere, 18, 505–523, https://doi.org/10.5194/tc-18-505-2024, 2024. a
Sharp, M., Burgess, D. O., Cogley, J. G., Ecclestone, M., Labine, C., and Wolken, G. J.: Extreme melt on Canada's Arctic ice caps in the 21st century, Geophys. Res. Lett., 38, L11501, https://doi.org/10.1029/2011GL047381, 2011. a, b
Siegfried, M., Venturelli, R., Patterson, M., Arnuk, W., Campbell, T., Gustafson, C., Michaud, A., Galton-Fenzi, B., Hausner, M., Holzschuh, S., Huber, B., Mankoff, K., Schroeder, D., Summers, P., Tyler, S., Carter, S., Fricker, H., Harwood, D., Leventer, A., Rosenheim, B., Skidmore, M., and Priscu, J.: The life and death of a subglacial lake in West Antarctica, Geology, 51, 434–438, https://doi.org/10.1130/G50995.1, 2023. a
Siegfried, M. R. and Fricker, H. A.: Thirteen years of subglacial lake activity in Antarctica from multi-mission satellite altimetry, Ann. Glaciol., 59, 42–55, https://doi.org/10.1017/aog.2017.36, 2018. a
Siegfried, M. R. and Fricker, H. A.: Illuminating Active Subglacial Lake Processes With ICESat‐2 Laser Altimetry, Geophys. Res. Lett., 48, https://doi.org/10.1029/2020GL091089, 2021. a
Siegfried, M. R., Fricker, H. A., Carter, S. P., and Tulaczyk, S.: Episodic ice velocity fluctuations triggered by a subglacial flood in West Antarctica, Geophys. Res. Lett., 43, 2640–2648, https://doi.org/10.1002/2016GL067758, 2016. a, b, c
Smith, B., Adusumilli, S., Csatho, B. M., Felikson, D., Helen, A. F., Gardner, A., Holschuh, N., Lee, J., Paolo, F. S., Siegfried, M. R., Sutterley, T., and ICESat-2 Science Team: ATLAS/ICESat-2 L3A Land Ice Height, Version 6, National Snow and Ice Data Center [data set], https://doi.org/10.5067/ATLAS/ATL06.006, 2023. a, b
Smith, B. E., Fricker, H. A., Joughin, I. R., and Tulaczyk, S.: An inventory of active subglacial lakes in Antarctica detected by ICESat (2003–2008), J. Glaciol., 55, 573–595, https://doi.org/10.3189/002214309789470879, 2009. a
Smith, B. E., Gourmelen, N., Huth, A., and Joughin, I.: Connected subglacial lake drainage beneath Thwaites Glacier, West Antarctica, The Cryosphere, 11, 451–467, https://doi.org/10.5194/tc-11-451-2017, 2017. a
Stearns, L. A., Smith, B. E., and Hamilton, G. S.: Increased flow speed on a large East Antarctic outlet glacier caused by subglacial floods, Nat. Geosci., 1, 827–831, https://doi.org/10.1038/ngeo356, 2008. a, b, c, d, e
Stubblefield, A. G., Meyer, C. R., Siegfried, M. R., Sauthoff, W., and Spiegelman, M.: Reconstructing subglacial lake activity with an altimetry-based inverse method, J. Glaciol., 1–15, https://doi.org/10.1017/jog.2023.90, 2023. a
Willis, M. J., Herried, B. G., Bevis, M. G., and Bell, R. E.: Recharge of a subglacial lake by surface meltwater in northeast Greenland, Nature, 518, 223–227, https://doi.org/10.1038/nature14116, 2015. a, b, c
Wingham, D. J., Siegert, M. J., Shepherd, A., and Muir, A. S.: Rapid discharge connects Antarctic subglacial lakes, Nature, 440, 1033–1036, https://doi.org/10.1038/nature04660, 2006. a, b, c
Wright, A. and Siegert, M.: A fourth inventory of Antarctic subglacial lakes, Antarctic Sci., 24, 659–664, https://doi.org/10.1017/S095410201200048X, 2012. a
Zemp, M., Jakob, L., Dussaillant, I., Nussbaumer, S. U., Gourmelen, N., Dubber, S., A, G., Abdullahi, S., Andreassen, L. M., Berthier, E., Bhattacharya, A., Blazquez, A., Boehm Vock, L. F., Bolch, T., Box, J., Braun, M. H., Brun, F., Cicero, E., Colgan, W., Eckert, N., Farinotti, D., Florentine, C., Floricioiu, D., Gardner, A., Harig, C., Hassan, J., Hugonnet, R., Huss, M., Jóhannesson, T., Liang, C.-C. A., Ke, C.-Q., Khan, S. A., King, O., Kneib, M., Krieger, L., Maussion, F., Mattea, E., McNabb, R., Menounos, B., Miles, E., Moholdt, G., Nilsson, J., Pálsson, F., Pfeffer, J., Piermattei, L., Plummer, S., Richter, A., Sasgen, I., Schuster, L., Seehaus, T., Shen, X., Sommer, C., Sutterley, T., Treichler, D., Velicogna, I., Wouters, B., Zekollari, H., and Zheng, W.: Community estimate of global glacier mass changes from 2000 to 2023, Nature, https://doi.org/10.1038/s41586-024-08545-z, 2025. a, b, c, d, e, f, g, h
Zhang, G., Bolch, T., Yao, T., Rounce, D. R., Chen, W., Veh, G., King, O., Allen, S. K., Wang, M., and Wang, W.: Underestimated mass loss from lake-terminating glaciers in the greater Himalaya, Nat. Geosci., 16, 333–338, https://doi.org/10.1038/s41561-023-01150-1, 2023. a
Zheng, W., Pritchard, M. E., Willis, M. J., Tepes, P., Gourmelen, N., Benham, T. J., and Dowdeswell, J. A.: Accelerating glacier mass loss on Franz Josef Land, Russian Arctic, Remote Sens. Environ., 211, 357–375, https://doi.org/10.1016/j.rse.2018.04.004, 2018. a, b, c
Zheng, W., Durkin, W. J., Melkonian, A. K., and Pritchard, M. E.: Cryosphere And Remote Sensing Toolkit (CARST) v2.0.0a1, Zenodo [code], https://doi.org/10.5281/zenodo.4592619, 2021. a, b
Zheng, W., Willis, M. J., Pritchard, M. E., and Howat, I.: 15-m ArcticDEM-derived Elevation Change Rate of Glaciers in The Arctic, Taiwan Polar Institute Data Repository [data set], https://doi.org/10.30238/TPIDR.DB_ECRG/Dataset, 2024. a, b
Zheng, W.: whyjz/ac-subglacial-lakes: v1.0, Zenodo [code], https://doi.org/10.5281/zenodo.19097467, 2026. a