the Creative Commons Attribution 4.0 License.
the Creative Commons Attribution 4.0 License.
 | 18 Mar 2026
Light-absorbing snow impurities: nine years (2016–2024) of snowpack sampling close to Sonnblick Observatory, Austrian Alps
Marion Greilinger
Andjela Vukićević
Jakub Bielecki
Laura Kronlachner
Anne Kasper-Giebl
We present chemical analysis data of the seasonal snow cover focusing on the light-absorbing snow impurities elemental carbon and mineral dust collected at a high-alpine glacier field close to Sonnblick Observatory. Sampling covered the whole winter accumulation periods between 2016 and 2024. The co-occurrence of mineral dust leads to an underestimation of elemental carbon quantified via thermal-optical analysis. To minimise the bias, we apply a linear laser correction, leading to a median increase in elemental carbon by 63 % for single samples and up to 8.3 % for entire snowpacks collected at the end of the accumulation period. Average concentrations for elemental carbon and water-insoluble organic carbon were 11.1±2.5 and 458±215 ng g−1, respectively, and ranged up to 86.3 and 3260 ng g−1 for single layers, respectively. Using the interference introduced by mineral dust, we identify mineral dust layers and find substantial agreement with a complementary method based on calcium concentrations and the pH. Based on thermal-optical analysis and an average iron fraction in mineral dust of 4 %, the approximated mineral dust concentrations ranged up to 25 µg g−1 in single layers. The approximated mineral dust input during the accumulation period agrees well with gravimetric results and ranged up to 2100 mg m−2.
- Article
(1796 KB) - Full-text XML
- BibTeX
- EndNote


The seasonal snow cover acts as a reservoir for deposited compounds. Sampling and analysing this repository allow to assess the input of various species during the accumulation period. Compounds of interest include light-absorbing impurities (LAI) in snow, also known as light-absorbing snow impurities (LASI) or light-absorbing particles (LAPs), due to their direct and indirect radiative forcing. After deposition on snow surfaces, LASI affect the hydrological cycle via reduction of the albedo and earlier melt of the snow cover and can impact snowpack stability (e.g., Warren and Wiscombe, 1980; Tuzet et al., 2020; Réveillet et al., 2022; Dick et al., 2023). Upon melt, insoluble light-absorbing particles are enriched on the snow surface, amplifying their adverse effects (Doherty et al., 2013). Mineral dust and elemental carbon pose important and widely studied representatives of LASI, especially in background regions like the Alps or the Arctic (e.g., Roussel et al., 2025; Di Mauro et al., 2019; Doherty et al., 2010; Svensson et al., 2018; Thevenon et al., 2009) or at the glaciers in the Himalayas and the Tibetan Plateau, which are close to source regions and thus show even higher input (e.g., Gul et al., 2022; Li et al., 2018; Thind et al., 2019).
Global mineral dust emission is dominated by North African source regions, has increased substantially since pre-industrial times and was estimated to be 29±8 Tg between 1981 and 2000 (Kok et al., 2021, 2023). After long-range transport, mineral dust is deposited regularly in the Alps and may reach up to northern Europe or the Arctic (e.g., Meinander et al., 2023; Greilinger and Kasper-Giebl, 2021; Barkan and Alpert, 2010). Deposited on snow, it increases alkalinity and affects the biogeochemical cycle by introducing several elements, e.g., Ca, Fe and P (e.g., Lafon et al., 2006; Nielson and Brahney, 2025; Rogora et al., 2004). Consequently, the pH and Ca2+ concentration (Greilinger et al., 2016) or the elemental composition including Fe, Ca, Al, Si and Ti can be used to determine mineral dust (e.g., Li et al., 2017; Telloli et al., 2018). The possibility to assess the Fe loading on filters influenced by mineral dust from thermal-optical analysis (Kau et al., 2022) offers a starting point to estimate mineral dust from thermal-optical analysis data.
Elemental carbon is emitted by incomplete combustion and is estimated to be the second strongest climate forcer from human emission ranking only behind CO2 (Bond et al., 2013). Various analytical techniques can be applied for the quantification of elemental carbon (or black carbon, see Petzold et al., 2013, for differentiation), including laser-induced incandescence, optical methods or thermal-optical analysis (Schwarz et al., 2012; Grenfell et al., 2011; Birch and Cary, 1996). The latter is the reference method for the quantification of elemental carbon in ambient air samples (DIN e.V., 2017) and is commonly applied to filters loaded with insoluble particles from snow samples (e.g., Zdanowicz et al., 2021; Tuzet et al., 2020; Forsström et al., 2013). The co-occurrence of mineral dust leads to an interference in the quantification of elemental carbon in thermal-optical analysis and adapted evaluation of measurement data was proposed without quantifying the impact on elemental carbon concentrations (Wang et al., 2012; Gul et al., 2018).
We present a multi-year time series of snowpack sampling and analysis at a glacier field close to Sonnblick Observatory in the Austrian Alps starting in 2016. Using thermal-optical analysis as the central analytical technique, we report concentrations of elemental carbon and water-insoluble organic carbon. Besides the presentation of this data set, the novelty of the paper is its methodological focus. Applying different laser correction methods, the bias in elemental carbon measurements introduced by mineral dust can be quantified and a more reliable method for general monitoring practice of elemental carbon is introduced. A particular advantage is that the laser correction method can also be applied to existing data sets via post-processing. The interference itself, a temperature dependent change in transmittance of the laser applied in thermal-optical analysis, is used to identify samples containing mineral dust and to approximate the mineral dust load in the snowpack. Thus, thermal-optical analysis can be used for both the quantification of elemental carbon and the approximation of mineral dust concentrations.
2.1 Snow sampling
Snowpacks were collected at the glacier field Goldbergkees (GOK) at an elevation above 3000 m a.s.l. in the National Park Hohe Tauern, located in the Austrian Alps. The high-alpine site is distant to anthropogenic activities and in the vicinity of the Global Atmosphere Watch (GAW) station Sonnblick Observatory. The sampling procedure is described in detail in Greilinger et al. (2016). An overview is given here: At the end of the winter accumulation period (end of April or early May), snowpacks were sampled in increments of 20 cm for carbonaceous compounds (quantification via thermal-optical analysis (TOA), referred to as TOA-profile) and 10 cm for Ca2+ concentration analysed via ion chromatography (IC) and pH (referred to as IC-profile). The samples were cut using stainless-steel cylinders with a diameter of 5.6 and 5.0 cm, respectively. The larger increments for the TOA-profile were a compromise between depth resolution and sufficient analyte loadings. At the same time this allowed to use samples collected for the determination of snow density. The samples were transported to the laboratory frozen in polyethylene bags and kept frozen until processing. The profiles were assigned to the year of sampling (2016–2024), i.e., the profile of 2016 corresponds to the winter accumulation period 2015/2016.
In 2023, sampling had to be postponed due to challenging weather conditions, leading to a rather late sampling date. Melting of snow on the wall of the snow pit was observed and wash down of compounds from upper to lower layers cannot be excluded. Challenging weather conditions stopped the sampling in 2019, when only 3.2 of 4.4 m of the snow cover could be sampled. In the residual years, the entire snow cover could be sampled.
2.2 Thermal-optical analysis-profile
2.2.1 Sample preparation
Sample preparation is described in detail by Meinander et al. (2022) within the sections referring to TU Wien. In short, after melting the snow sample of the TOA-profile in a glass beaker using a microwave, it was filtered onto a quartz fibre filter (PALLFLEX® Tissuquartz™, Pall Laboratory), leading to a loaded area with a diameter of 16 mm. After careful evaluation of literature and own experiments we decided not to use a coagulant to increase filtration efficiency. A detailed discussion can be found in Appendix A. After filtration, few samples (n=10, ∼6 %) showed low particulate filter loadings. To reach loadings above the limit of detection, depth resolution was sacrificed, and the subsequent sample was loaded on the same filter. In contrast, one dust-laden sample of 2016 included high particulate loading and was filtered on two separate filters to prevent loss of particles during handling and analysis. For all samples from 2016, a punch with a diameter of 15 mm was used and the result calculated for the entire loaded area. For some of these samples, a darkening around the rim of the loaded area was observed and underestimation of the results is possible. An underestimation of water-insoluble total carbon between 7 % and 32 % was found for comparable samples (n=9) with an average of 18 % and a standard deviation of 9 %. Thus, we report results for 2016 with an increased uncertainty of 50 %. To ensure quantification of carbon in the entire sample, from 2017 on a punch with a diameter of 17 mm was used.
All samples were cut in half to fit into the instrument, both parts were analysed and considered. Masses of water-insoluble particles on the filters were determined gravimetrically for the years 2017–2022 and 2024.
2.2.2 Thermal-optical analysis
Water-insoluble total carbon (WinsTC), split into water-insoluble organic carbon (WinsOC) and elemental carbon (EC), was quantified via thermal-optical analysis using a Lab OC-EC Aerosol Analyzer (Sunset Laboratory Inc.). Samples were measured with the EUSAAR2 protocol (Cavalli et al., 2010) in the program OCEC834 and evaluated with the program Calc453 (both Sunset Laboratory Inc.). For blank correction, several method blanks were prepared each time samples were processed. Snowpack layers correspond to water equivalents of 70–290 g, consequently between 100 and 200 g of ultrapure water were drawn through a preheated quartz fibre filter, using the identical procedure and labware as for the samples. These blanks showed only signals for WinsOC; hence only WinsOC and WinsTC loadings were blank corrected with the method blanks of the respective year (between 1.99 and 3.53 µg cm−2). Limits of detection were calculated as the threefold standard deviation of the blanks and ranged between 0.98 and 3.76 µg cm−2 for both WinsOC and WinsTC for the different years. The limit of detection for EC was determined as the threefold standard deviation of repeated analysis of a lightly loaded PM10 filter collected at Sonnblick Observatory (n=10). The result was 0.20 µg cm−2 and agrees with the lower limit of the measurement range of the instrument given by the manufacturer. For 2016 only WinsTC is available due to insufficient quality of the laser signal. Quality assurance included the daily analysis of a sucrose standard and participation in international comparisons conducted annually within ACTRIS (Aerosol, Clouds and Trace Gases Research Infrastructure) since 2021.
2.2.3 Inductively coupled plasma-optical emission spectroscopy
Quantification of Fe via inductively coupled plasma-optical emission spectroscopy (ICP-OES) was done using a 5110 ICP-OES instrument (Agilent). Selected dust-laden filters from the TOA-profiles were subjected to microwave-assisted acid digestion prior to analysis, as described in Kau et al. (2022). Mineral dust from long-range transport obtained from snow and rime and local dust samples recovered from bare rock were also analysed this way, digesting about 12 mg. For duplicates and triplicates of these dust samples, the entire digestion process (weighing in and digesting) was repeated. More information on these samples can be found in Appendix B.
Measurement conditions included a viewing height of 10 mm, a read time of 10 s, a radio frequency power of 1.20 kW, and nebulizer, plasma and auxiliary gas flows of 0.70, 12.0, and 1.00 L min−1, respectively. Fe was quantified at 238.204 nm. External standards were prepared using ICP multi-element standard solution VIII (Certipur®, Supelco®, Sigma-Aldrich). The limit of detection corresponded to 0.1 µg Fe cm−2. Eu (plasma standard solution, Specpure®, Thermo Scientific) was used as an internal standard and added to all standards and samples in a final concentration of 10 mg L−1. For quality assurance, quintuplicate digestion and analysis of NIST® Standard Reference Material® 2709 San Joaquin Soil was conducted. The average recovery for Fe was 97 % with a standard deviation of 7 % and a median of 99 %.
2.3 Ion chromatography-profile
For the quantification of Ca2+ using ion chromatography (Dionex Aquion, Thermo Fisher) and the electrochemical determination of the pH value (InLab® Pure Pro–ISM, Mettler Toledo), samples of the IC-profile were melted inside the polyethylene bags at room temperature and filled into vials. Samples with high particulate loadings were filtered using a syringe filter (PALL ACRODISC® 0.2 µm Supor®) prior to analysis. Instrumentation for Ca2+ quantification included Dionex Ion Pac CS16 and CG16 columns and 30 mm methanesulfonic acid as eluent. Measurements and evaluations were done in the software Chromeleon 7 (Thermo Fisher Scientific). Quantification in IC was done using external standards (mixture and dilution of 1000 ppm Ion Chromatography Standard (IC), VWR). The limit of detection for Ca2+ was 0.01 mg L−1. Quality assurance for IC and determination of pH included continuous analyses of control standards and regular participation in semi-annual inter-laboratory comparison studies by the World Meteorological Organization (WMO) GAW Programme.
3.1 Identification of mineral dust layers from thermal-optical analysis and ionic data
The identification of mineral dust layers allows to retrace events with mineral dust deposition during the accumulation period and is the starting point for mineral dust concentration and deposition assessment. We identified dust-laden samples based on the temperature dependent change in optical properties of residual material seen in thermal-optical analysis. If mineral dust is present, this refractory material remains on the filter and shows a reddish colour due to the presence of Fe oxides. As described by Kau et al. (2022), the transmitted laser signal (λ=660 nm) was evaluated in the calibration phase. At this point, the actual analysis of carbonaceous compounds is already finished. Oven and filter sample are just cooling down, but data is still logged to record the calibration peak. Kau et al. (2022) evaluated a temperature range between 700 and 400 °C. Due to small adjustments of the insulation material, the lower temperature, i.e., 400 °C, given previously was not always reached at the end of the calibration phase for our set of samples. Thus, we now evaluated the change in transmittance observed between 700 and 450 °C using the transmitted laser signal I700 and I450, respectively. Converted into a dimensionless temperature dependent attenuation (ΔATN700−450, see Eq. 1), samples that equalled or exceeded a value of 4.0 were classified as containing mineral dust. For clarification, ΔATN700−450 corresponds to ATN700−400 defined in Kau et al. (2022), however, using the intensity of the transmitted laser signal at 450 °C. To account for lower filter loadings, we added high linearity of the relationship between the temperature and the transmitted laser signal (coefficient of determination, R2, above 0.9) as a criterion. We refer to this method to identify dust-laden filters as TOA approach.
The TOA approach is compared to a complementary approach based on pH values above 5.6 and Ca2+ concentrations above 10 µeq L−1, which was previously used to identify mineral dust layers at the GOK site (Greilinger et al., 2018). In the following we will refer to this method as IC approach. The following limitations apply: (1) The methods are compared using neighbouring depth profiles taken within one snow pit, but not identical profiles. Hence, differences resulting from uneven terrain or snow drifts cannot be excluded. Schöner et al. (1997) report coefficients of variation up to 82 % (median up to 24 %) for major ions except Na+ for single layers of three adjacent profiles within one snow pit at the GOK site. Similar differences can be assumed for our setting. (2) The depth resolution of the profiles differs. One layer of the IC-profile corresponds to two layers of the TOA-profile. This affects the number of identified layers.
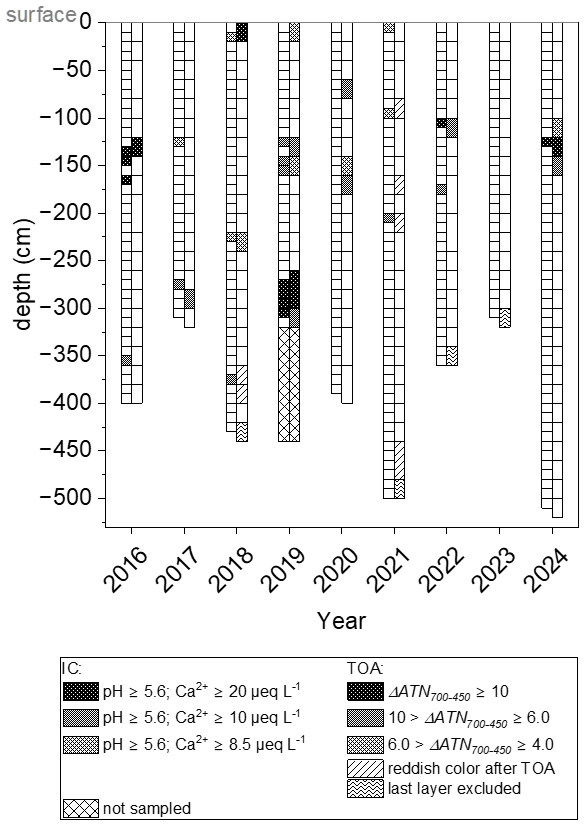
Figure 1Identification of mineral dust layers using the TOA approach (ΔATN and R2>0.9) and the IC approach (pH value ≥5.6 and Ca2+ concentration ≥8.5 or 10 µeq L−1, respectively).
The layers identified with the two methods are shown in Fig. 1. Different shades correspond to the intensity of the mineral dust event according to the data. For the IC approach, an additional class using a slightly lower Ca2+ concentration of 8.5 µeq L−1 and again a pH value above 5.6 was added. This led to an increased agreement of the two methods in two out of five cases. Weak events may be overlooked with the previous limit, but also false positive results are possible with the lower limit. For 2018 and 2021, the TOA approach identified less layers than the IC approach. Coloured carbon species may conceal mineral dust prior to TOA, however, due to its refractive properties the colour can easily be evaluated after the analysis. We found a reddish colouration on the corresponding filters for 2018 and 2021 after TOA. The loading was too low to trigger the TOA approach. The colour of filters has previously been related to chemical aerosol composition including mineral dust (Tomza et al., 2001). For 2018, the two approaches show the same number of mineral dust layers when the layers with coloured filters are considered. Here, the mineral dust layer observed within the IC-profile is divided in two samples in the TOA-profile. For 2021, two out of four layers identified via the colouration of the TOA filters would match the IC approach. Still, as the additional two layers cannot be matched, the overall agreement of the two approaches remains the same. The colour of filters after TOA was checked also for the residual years. No additional layers were found. This shows that the TOA approach may overlook filters with slight colouration but is triggered by most samples coloured reddish after TOA. Few layers, e.g., in 2020, were found only with the TOA approach. Events with high dilution due to strong snowfall may not be recognized with either approach, and depending on the spatial variability only one may trigger.
In years where mineral dust layers occur close to the surface, e.g., 2018, we expect an increased effect on the duration of the snow cover due to direct and indirect forcing. In contrast, if the mineral dust layers occur close to the bottom layers and are covered by snow for most of the melting season, e.g., in 2017, we expect smaller effects. No further quantification of these effects is conducted within this work.
The agreement of the two approaches was quantified calculating Cohen's kappa based on the depth resolution of the TOA-profile and evaluating the result based on the classification given by Landis and Koch (1977). While a strict comparison of the layers using the criteria (ΔATN for TOA approach and pH ≥ 5.6 and Ca2+ concentration ≥8.5 µeq L−1) showed only moderate agreement, the consideration of the aforementioned limitations (two neighbouring profiles may show slight displacement, layers with coloured filters) increases the agreement from moderate to substantial. Hence, each approach may be used to identify mineral dust layers. Ideally, both complementary approaches are applied. Further evaluations of mineral dust samples presented in this work refer to the identification with the TOA approach. These samples show sufficient loadings to introduce a bias to TOA.
3.2 Elemental carbon and water-insoluble organic carbon
3.2.1 Bias introduced by mineral dust: laser correction methods
A suitable laser correction method must be chosen to minimize the bias on OC and EC for samples influenced by mineral dust. We compared results for OC and EC by applying the default option for the Laser/Temp Correction Method in the Calc453 software (Simple Laser/Temp Corr. – Divide by 2) and the linear option (Linear Fit) using the same raw data. The linear option applies a correction that considers temperature dependent changes in the transmittance signal. Thus, the marked increase of the transmitted laser signal observed for dust-laden samples is no longer visible. Due to a higher available filter area and hence the possibility to analyse triplicates, we used weekly PM10 filters collected at Sonnblick Observatory. Six filters showed an influence of mineral dust (ΔATN). These samples represent the highest mineral dust loadings at the site between 2019 and 2022. For comparison, six additional filters without influence of mineral dust, collected one or two weeks before or after each mineral dust filter, were analysed.
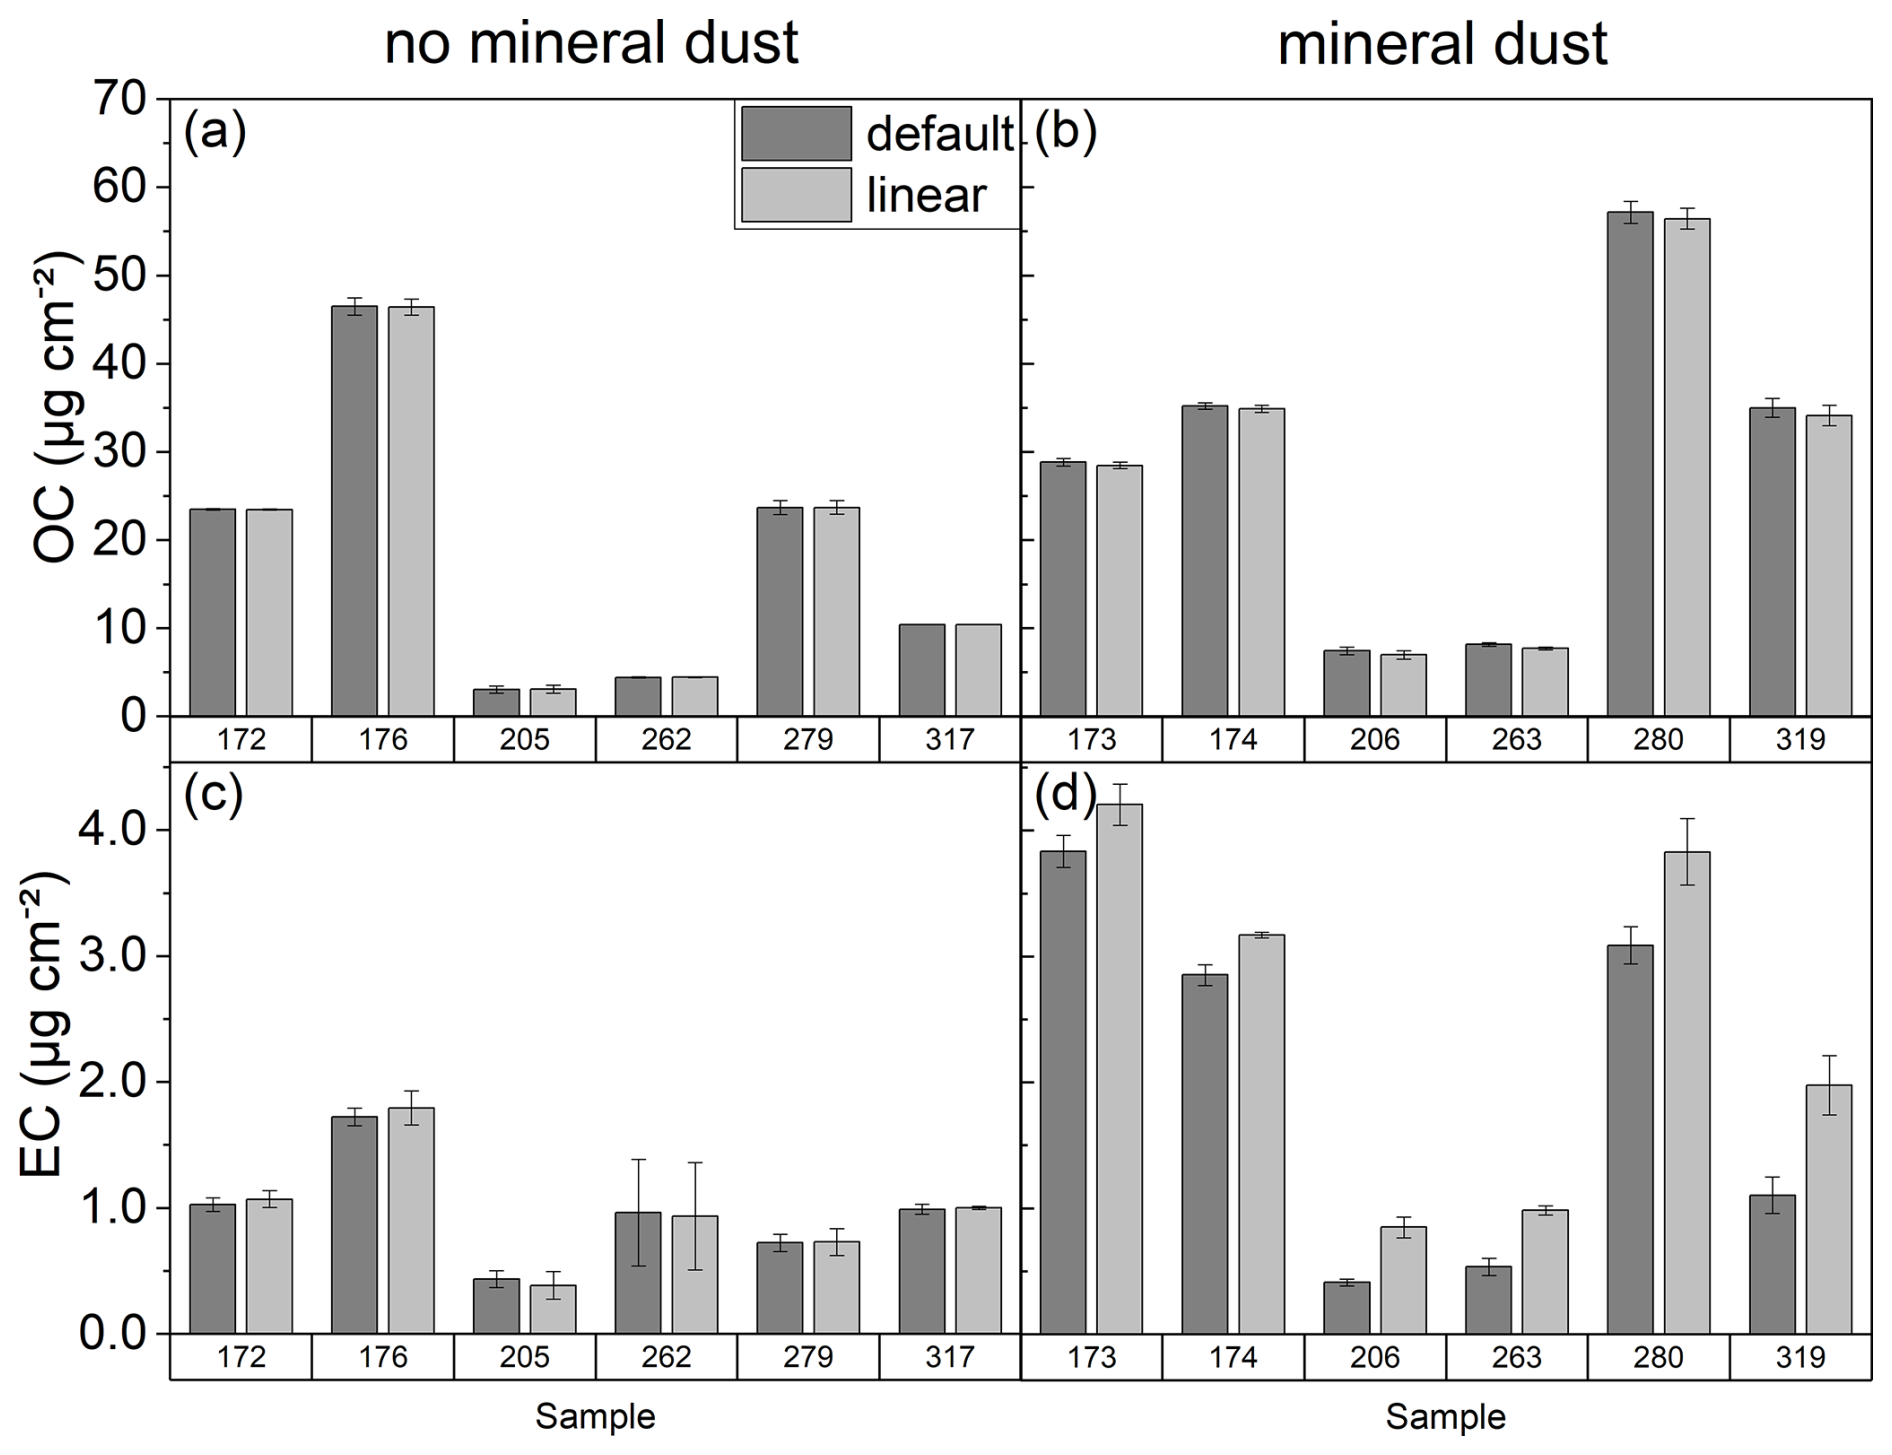
Figure 2Comparison of OC and EC loadings using the default and linear options for the Laser/Temp Correction Method for 6 PM10-filters without mineral dust (a, c) and 6 filters with mineral dust influence (b, d).
Results are shown in Fig. 2 with error bars corresponding to the standard deviation of triplicates. Changes for OC were below the uncertainty given by the instrument for both sample groups. The same applies to EC, when samples without mineral dust influence are considered. If mineral dust is observed, the linear option will show higher EC loadings. The increase of the EC signal is ranging from 9.6 % to 110 % with a median of 51 %. This highlights the importance of choosing a suitable laser correction for samples showing a temperature dependent change in optical properties.
We apply the linear option for the Laser/Temp Correction Method to TOA-profile samples influenced by mineral dust to avoid biased results for EC and WinsOC. The PM10 dataset suggests that the use of the linear option is justified for all samples, however, we cannot exclude the introduction of a bias if the laser signal is not dominated by mineral dust. Hence, we apply the linear option only for mineral dust samples identified with the TOA approach and quantify the effect of the adapted evaluation for EC and WinsOC. As WinsOC concentrations exceed EC concentrations by one to two orders of magnitude, changes become only visible for EC.
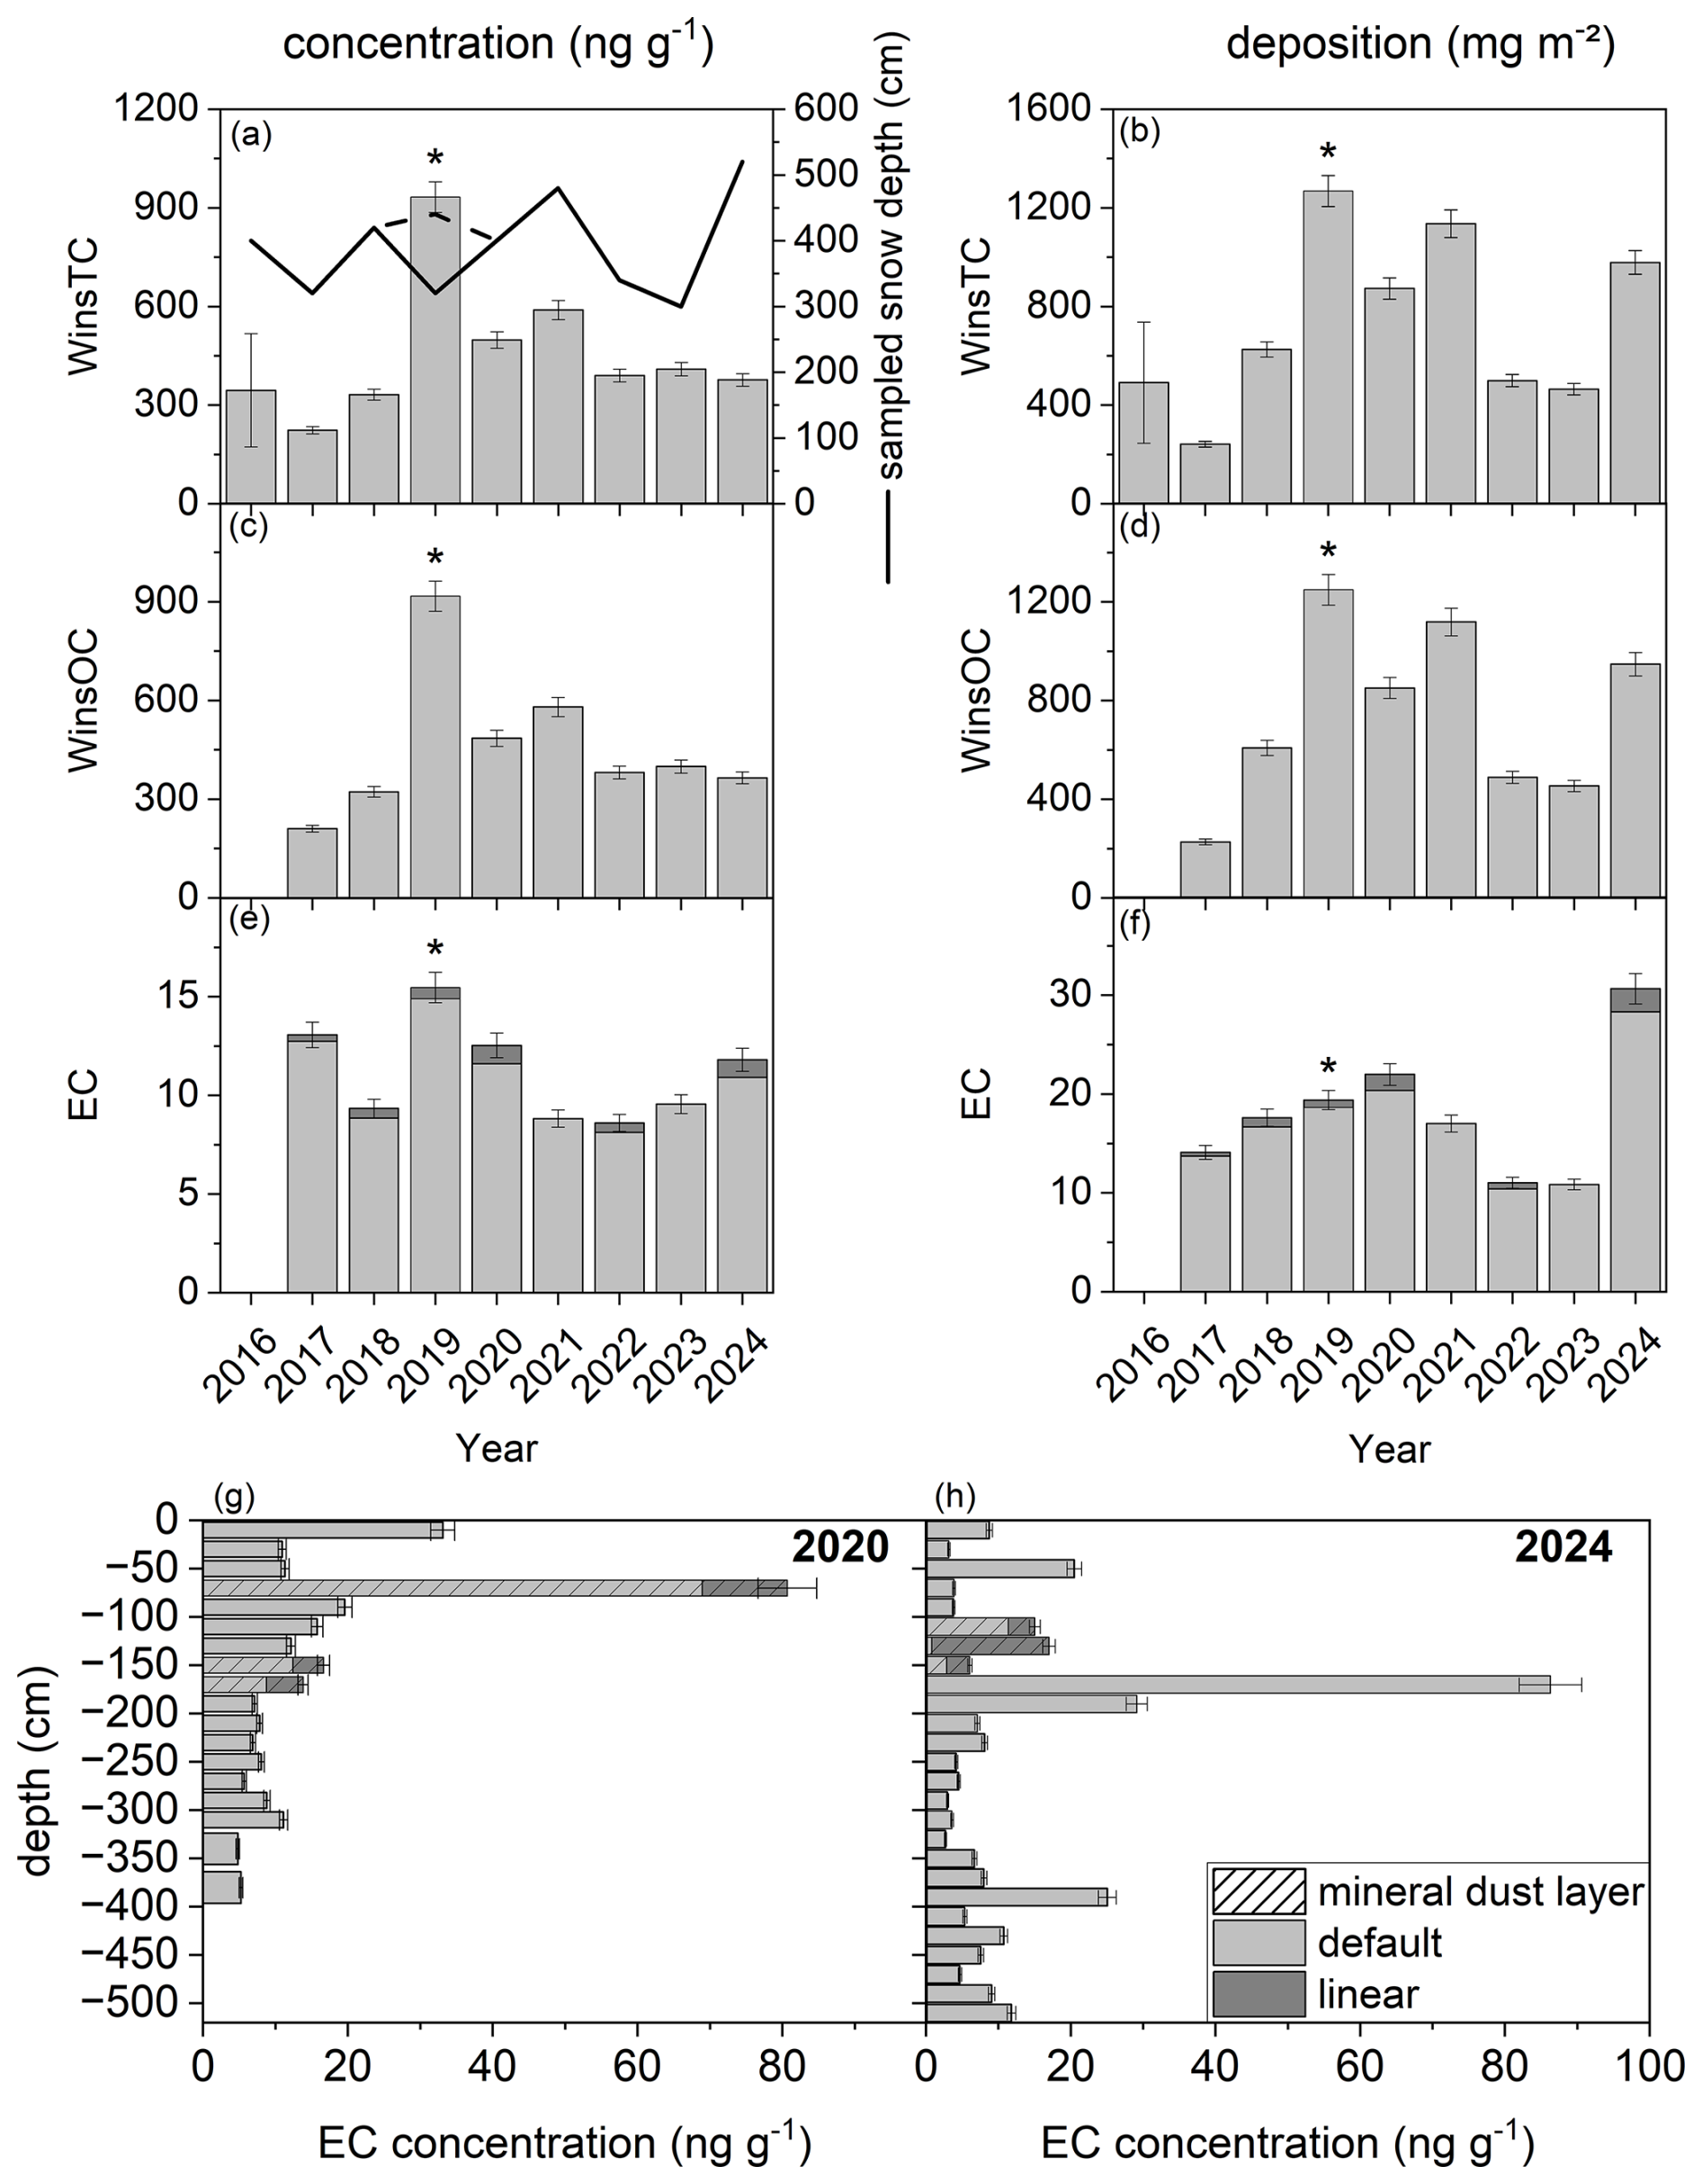
Figure 3WinsTC concentration (a) and deposition (b) for 2016–2024, concentration of WinsOC (c) and EC (e) and deposition of WinsOC (d) and EC (f) for 2017–2024. Sampled snow depth is shown in (a) as a continuous line. For 2019 (marked with *), sampling had to be interrupted. Dashed line shows actual snow depth for 2019. EC concentration of single layers is exemplified for 2020 (g) and 2024 (h).
For single samples, i.e., the layers affected with mineral dust, median reductions of WinsOC were −0.52 % and ranged up to −2.4 %. For EC the median increase was 63 %, while ranging up to 2100 %. These extremely high changes for EC were observed for samples with very high loadings of mineral dust. For them, no EC was detected with the default option, i.e., the laser signal never reached its initial value, and the calculated increase is based on half of the limit of detection. EC concentrations of single layers and changes for layers including mineral dust are exemplified in Fig. 3 using the data of 2020 and 2024. For entire snowpacks, the correction of bias introduced by mineral dust led to negligible changes for WinsOC with a maximum of −0.25 % and a median of −0.14 %, while the impact for EC is still noteworthy and ranged up to 8.3 % with a median of 4.7 %. Note that the changes shown here just affect the split between OC and EC determined via the laser signal and TC concentrations will remain unchanged. Carbon introduced by mineral dust, e.g., carbonate or a biofilm adhered to the particles, will still be part of either WinsOC or EC depending on the temperature protocol. The results for EC, i.e., the median increase of 63 % for single samples and the impact on entire snowpacks of up to 8.3 %, underline the importance of identifying samples where mineral dust affects the laser signal and choosing a suitable laser correction method. Further evaluations are done with the corrected WinsOC and EC data.
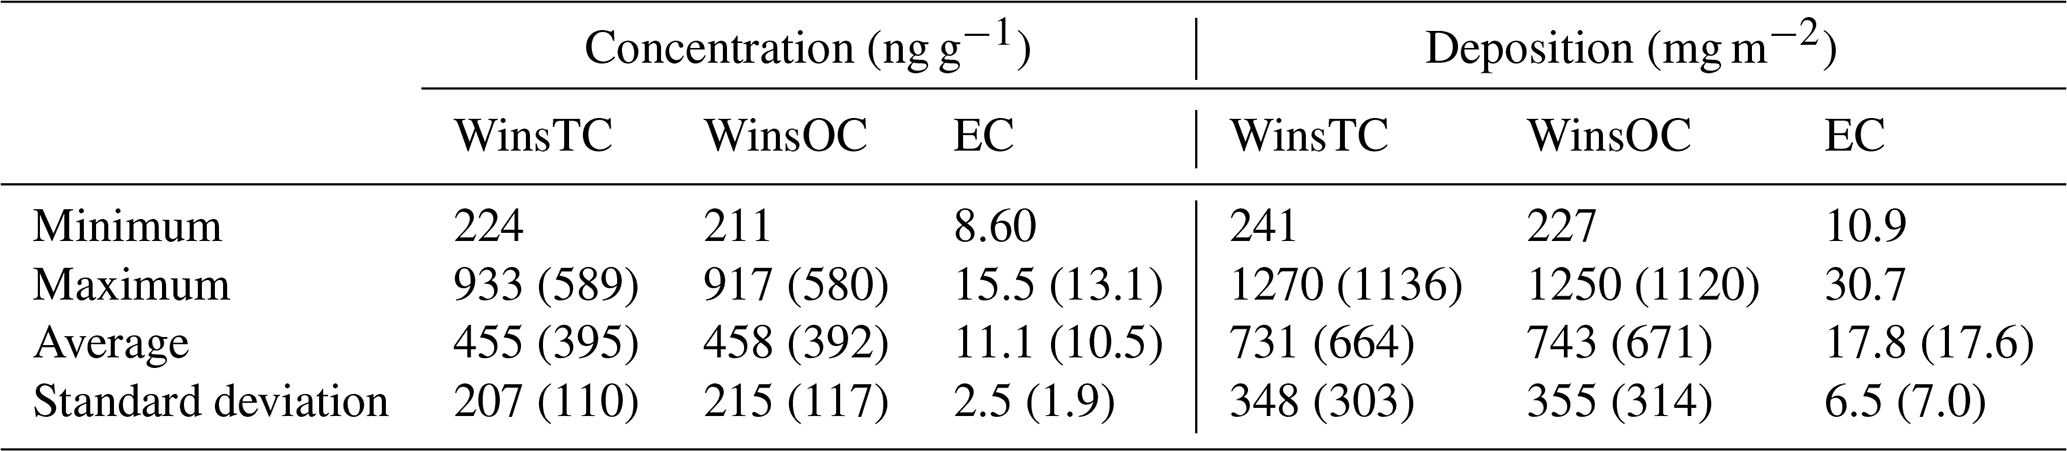
Table 1Minimum, maximum, average concentrations and depositions and their standard deviations for the accumulation periods 2016–2024 (WinsTC) and 2017–2024 (WinsOC and EC). Results excluding data of 2019 are reported in brackets.
3.2.2 Concentration and deposition between 2016 and 2024
WinsTC, WinsOC and EC concentrations and depositions are shown in Fig. 3. Minimum and maximum concentrations and depositions as well as their average and standard deviation for the winter accumulation periods are given in Table 1. Results excluding data of 2019, where the snow cover was sampled incompletely, are provided in brackets. Concentrations are given as the mass of carbon per mass of deposited snow. While WinsTC data cover the whole time period, WinsOC and EC data are available between 2017 and 2024 only, due to insufficient quality of the laser data in 2016. For single layers, WinsOC and EC concentrations ranged up to 3260 and 86.3 ng g−1, respectively.
EC accounted for 1.4±0.9 % of WinsTC on average and ranged between 0.39 % and 3.0 %. Due to the low share of EC in WinsTC, the courses of WinsOC concentration and deposition resemble those of WinsTC. None of the carbonaceous species show a trend in the observed period, more data are necessary for robust statistical evaluation. In 2019, sampling had to be stopped due to bad weather and about 72 % of the snowpack regarding depth could be collected. While the lack of these samples leads to an unknown bias for the concentrations of analytes (higher or lower actual concentration possible), it leads to an underestimation of their depositions.
We want to give an overview of WinsOC and EC concentrations and depositions from literature of various sites to compare to our data. Early data reporting WinsOC and EC concentrations in the Alps were given by Cerqueira et al. (2010). They reported concentrations for WinsOC and EC at Sonnblick in surface snow samples collected between March 2003 and July 2004 ranging between 33–785 µg L−1 and up to 12 µg L−1, respectively, and average concentrations of 145±174 and 5.2±3.7 µg L−1, respectively. Contribution of EC to TC was found to be below 6.5 %, which agrees well with the recent data of this work (up to 3.0 %). For Schauinsland (Germany), average EC and WinsOC concentrations in rain and snow were 28±38 and 205±266 µg L−1, respectively (Cerqueira et al., 2010). More recent data are given for the French Alps, where EC concentrations during the two snow seasons 2016–2017 and 2017–2018 were reported between 0 and 80 ng g−1 using coagulant (Tuzet et al., 2020), quite similar to the single samples of the snow profiles exemplified for 2020 and 2024 in Fig. 3. Extensive sampling has also been reported for Scandinavia and the Arctic. Mori et al. (2019) report median concentrations of black carbon in snowpack column samples collected between 2012 and 2015 in the Arctic between 1.45 and 10.7 µg L−1. Forsström et al. (2013) report EC column loads for various sites in Scandinavia and the European Arctic, which were collected between 2007 and 2009, spanning from 1.5 to 171.2 mg m−2. Zdanowicz et al. (2021) found varying concentrations for WinsOC (<1 to 9426 ng g−1) and EC (<1.0 to 266.6 ng g−1) in Svalbard at 37 sites between 2007 and 2018. Carbon input varies globally and can reach much higher values. Kaspari et al. (2014) found average black carbon concentrations of 180.0, 24.4 and 1.0 µg L−1 at 3 different sites at Mera glacier (Himalaya), with single values spanning up to 3 orders of magnitude within one site. Zhang et al. (2018) reported black carbon concentrations at 3 regions of the Tibetan Plateau between 1323±242 and 5624±1500 ng g−1 in samples collected in December 2014 and November 2015. Our data are comparable with data from the European background and Arctic and provide recent concentrations and depositions of carbonaceous species covering nearly a decade at a central European background site in the Austrian Alps.
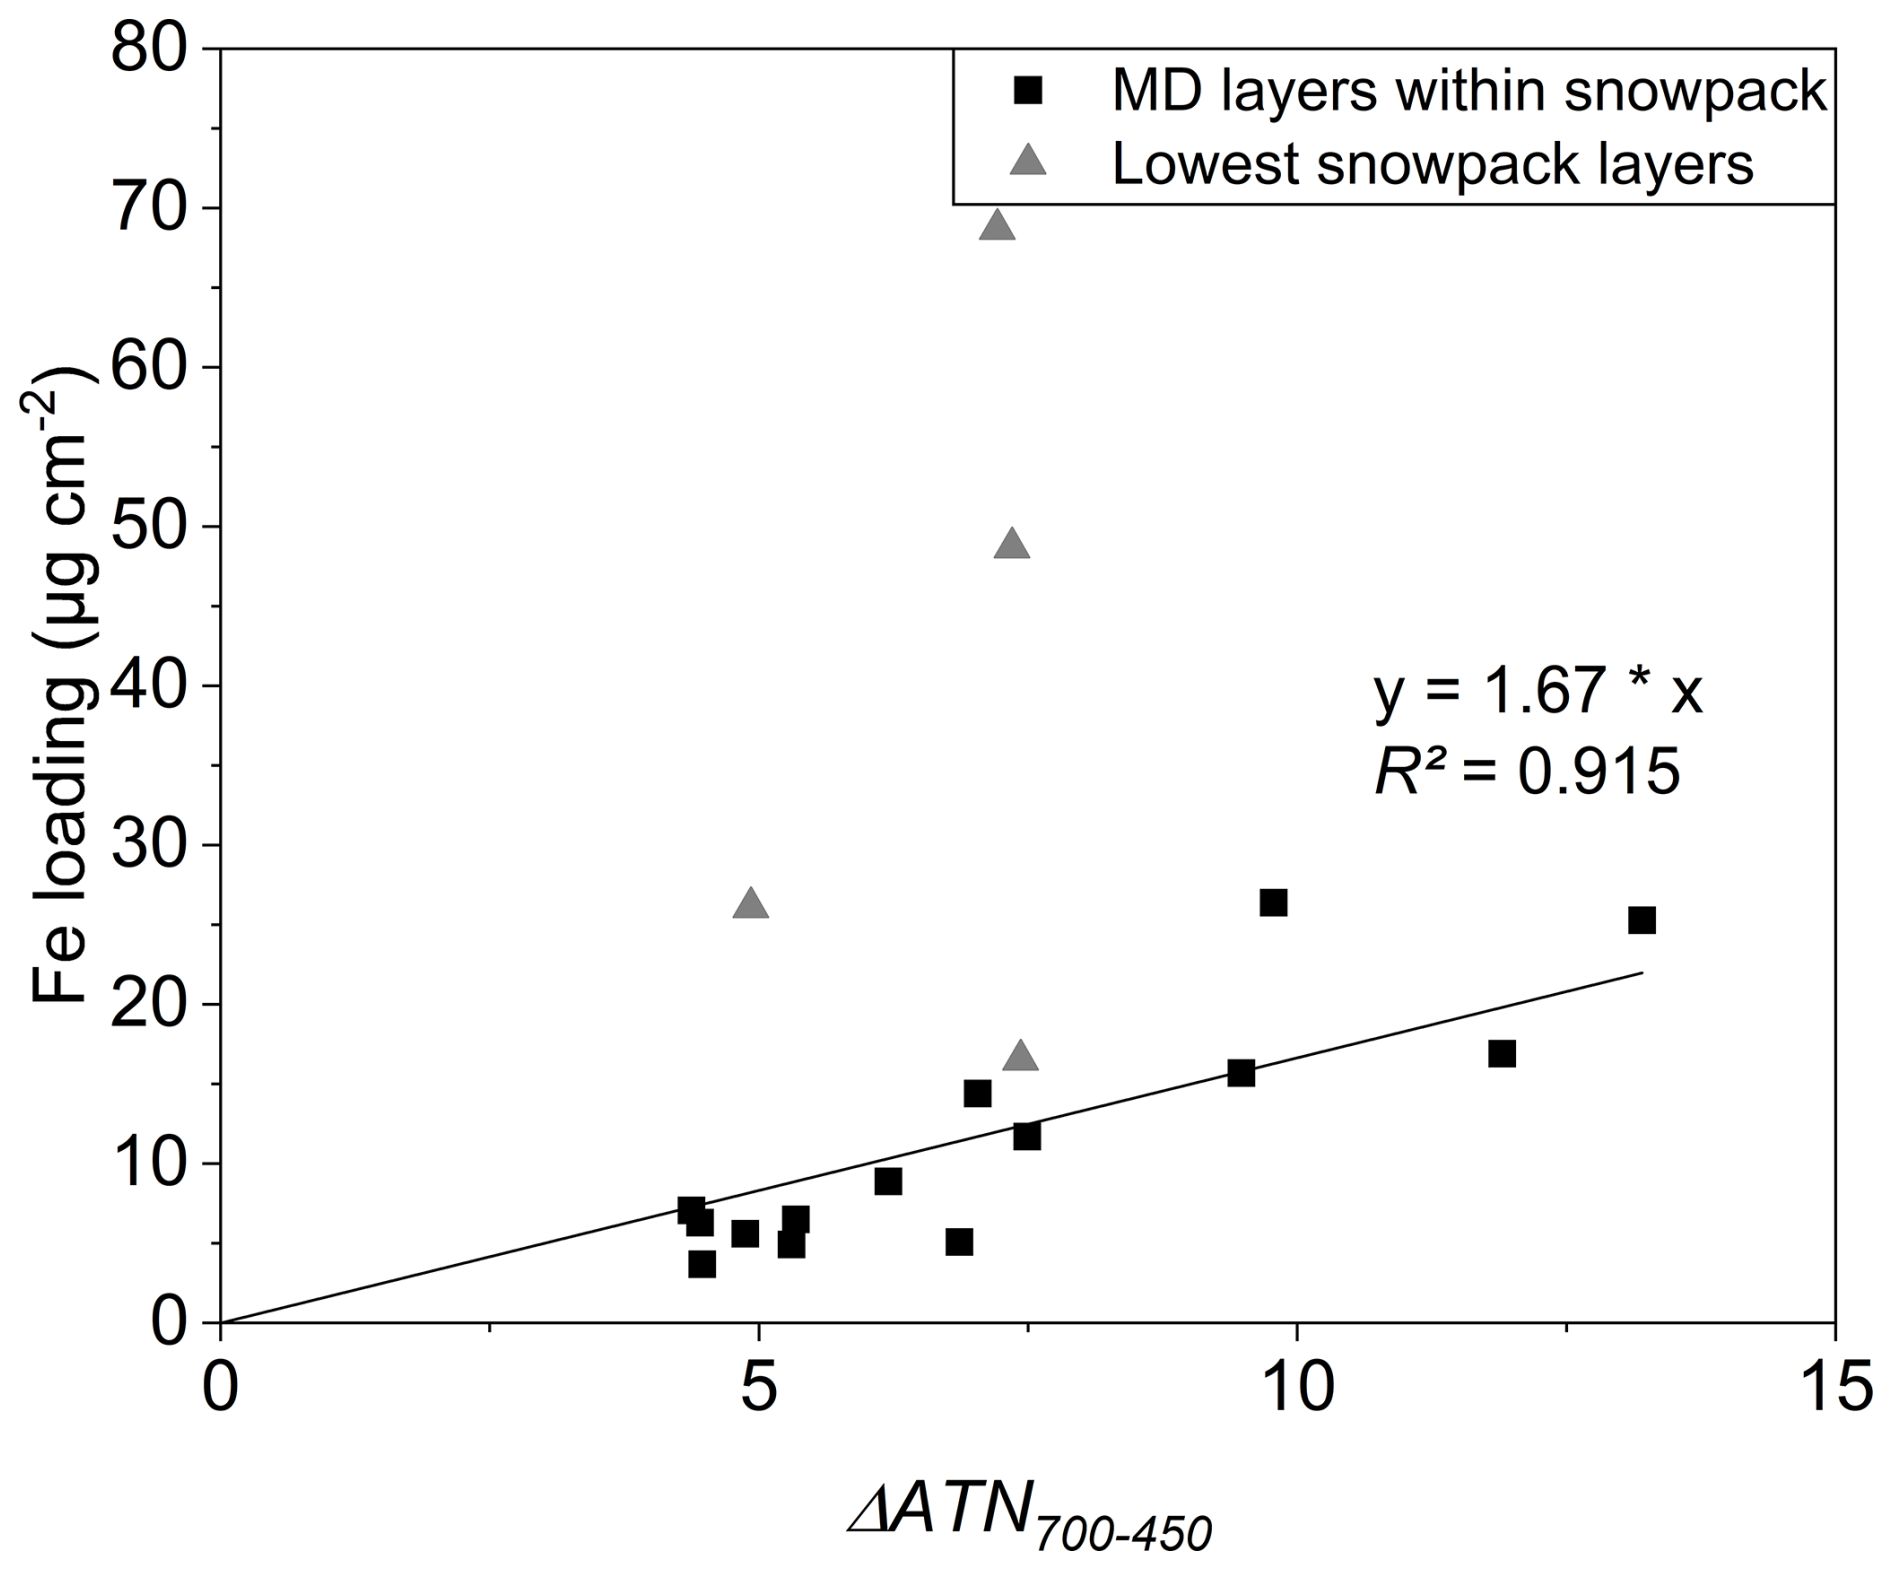
Figure 4Relationship of ΔATN700−450 and the Fe loading for mineral dust samples within the snowpack. Lowest snowpack layers are shown as triangles.
3.3 Mineral dust
3.3.1 Calculation of Fe loading from thermal-optical analysis data
The Fe loading of mineral dust layers was estimated from TOA data as described in Kau et al. (2022). As discussed in Sect. 3.1, the temperature range for the attenuation calculation was adapted in this work, necessitating a new fit to obtain the Fe loading from TOA data. The Fe loading was determined via ICP-OES and related to the ΔATN700−450 values for selected dust-laden filters. As the calculation of a new fit should be based on a maximum of data points and only 7 data points were available for GOK, data of another glacier field close to Sonnblick Observatory, Kleinfleißkees, were added. In contrast to GOK, sampling there was not conducted annually, but data of mineral dust layers from the years 2017–2018 and 2022–2023 were available. A sum of 14 samples could be used to calculate the fit shown in Eq. (2) and Fig. 4. Most available samples showed low Fe loadings. As the highest ΔATN700−450 value was 13, the resulting fit is only applicable between 4.0 and 13 and should be reevaluated when an increased number of samples is available. The differences between the calculated and measured Fe loadings related to the measured Fe loadings for GOK samples spanned between 0.6 % and 19 % with an average of 11 % and a median of 13 %.
Targeting complete sampling, lowest layers may include material deposited prior to the accumulation period, usually containing a considerable amount of dust and carbonaceous particles of varying origin (e.g., cryoconite). This was the case for the TOA-profiles of 2018 and 2021–2023, where the last layer was excluded from the evaluation. Their relationship between ΔATN700−450 and the Fe loading differs from that of samples within the snowpack and shows a steeper slope, see Fig. 4. We attribute this to several factors, including mixture with residual material of the last accumulation period, mixture with local dust and possible weathering of last accumulation period's dust. Note that the relationship between ΔATN700−450 and the Fe loading may differ for samples collected at other sites. Thus, the applicability of the fit obtained here should be validated prior to application.
3.3.2 Fe as a proxy to determine mineral dust mass
Identifying mineral dust layers opens the possibility to approximate the mineral dust load via a suitable marker. This would be a useful alternative to the gravimetric determination, which is labour-intensive and cannot easily be applied to quartz fibre filters needed for subsequent TOA to determine EC. We decided to use Fe as a marker, as it is also accessible via TOA (Kau et al., 2022) and would further facilitate an approximation of the dust load within a monitoring program. The approximation of mineral dust from TOA is based on the Fe loading of the filters and the mass fraction of Fe in mineral dust. The average Fe fraction in mineral dust was deduced from snow (n=5) and rime (n=3) samples collected at Sonnblick Observatory after intense mineral dust events occurring between 2020 and 2024. For comparison, local dust collected at the surrounding snow-free surfaces in August 2024 was analysed. A detailed description of the sampling and the evaluation can be found in Appendix B.
For mineral dust from long-range transport, the Fe fraction spanned between 3.0 % and 4.5 %, with an average of 3.9 %, a standard deviation of 0.4 % and a median of 4.0 %. In literature, varying Fe fractions in mineral dust are reported: Di Mauro et al. (2019) found 4.0 % Fe in a Saharan dust sample collected in the Italian Alps in February 2014. Dumont et al. (2023) report a decreasing mass fraction for Fe along the transport path from 11 % in the Pyrenees to 2 % in the Swiss Alps for a mineral dust event in February 2021. This corresponds to higher average total-Fe content of mineral dusts collected close to the source regions, as reported by Lafon et al. (2004), who found 6.3±0.95 % in dusts from the Sahara and 7.8±0.4 % in dusts from the Sahel collected in Niger. The Fe fractions reported for mineral dust samples from long-range transport collected in Europe cover the range found in this work. The median Fe fraction in mineral dust mass corresponds to a factor of 25 to estimate the mineral dust loading from the Fe loading.
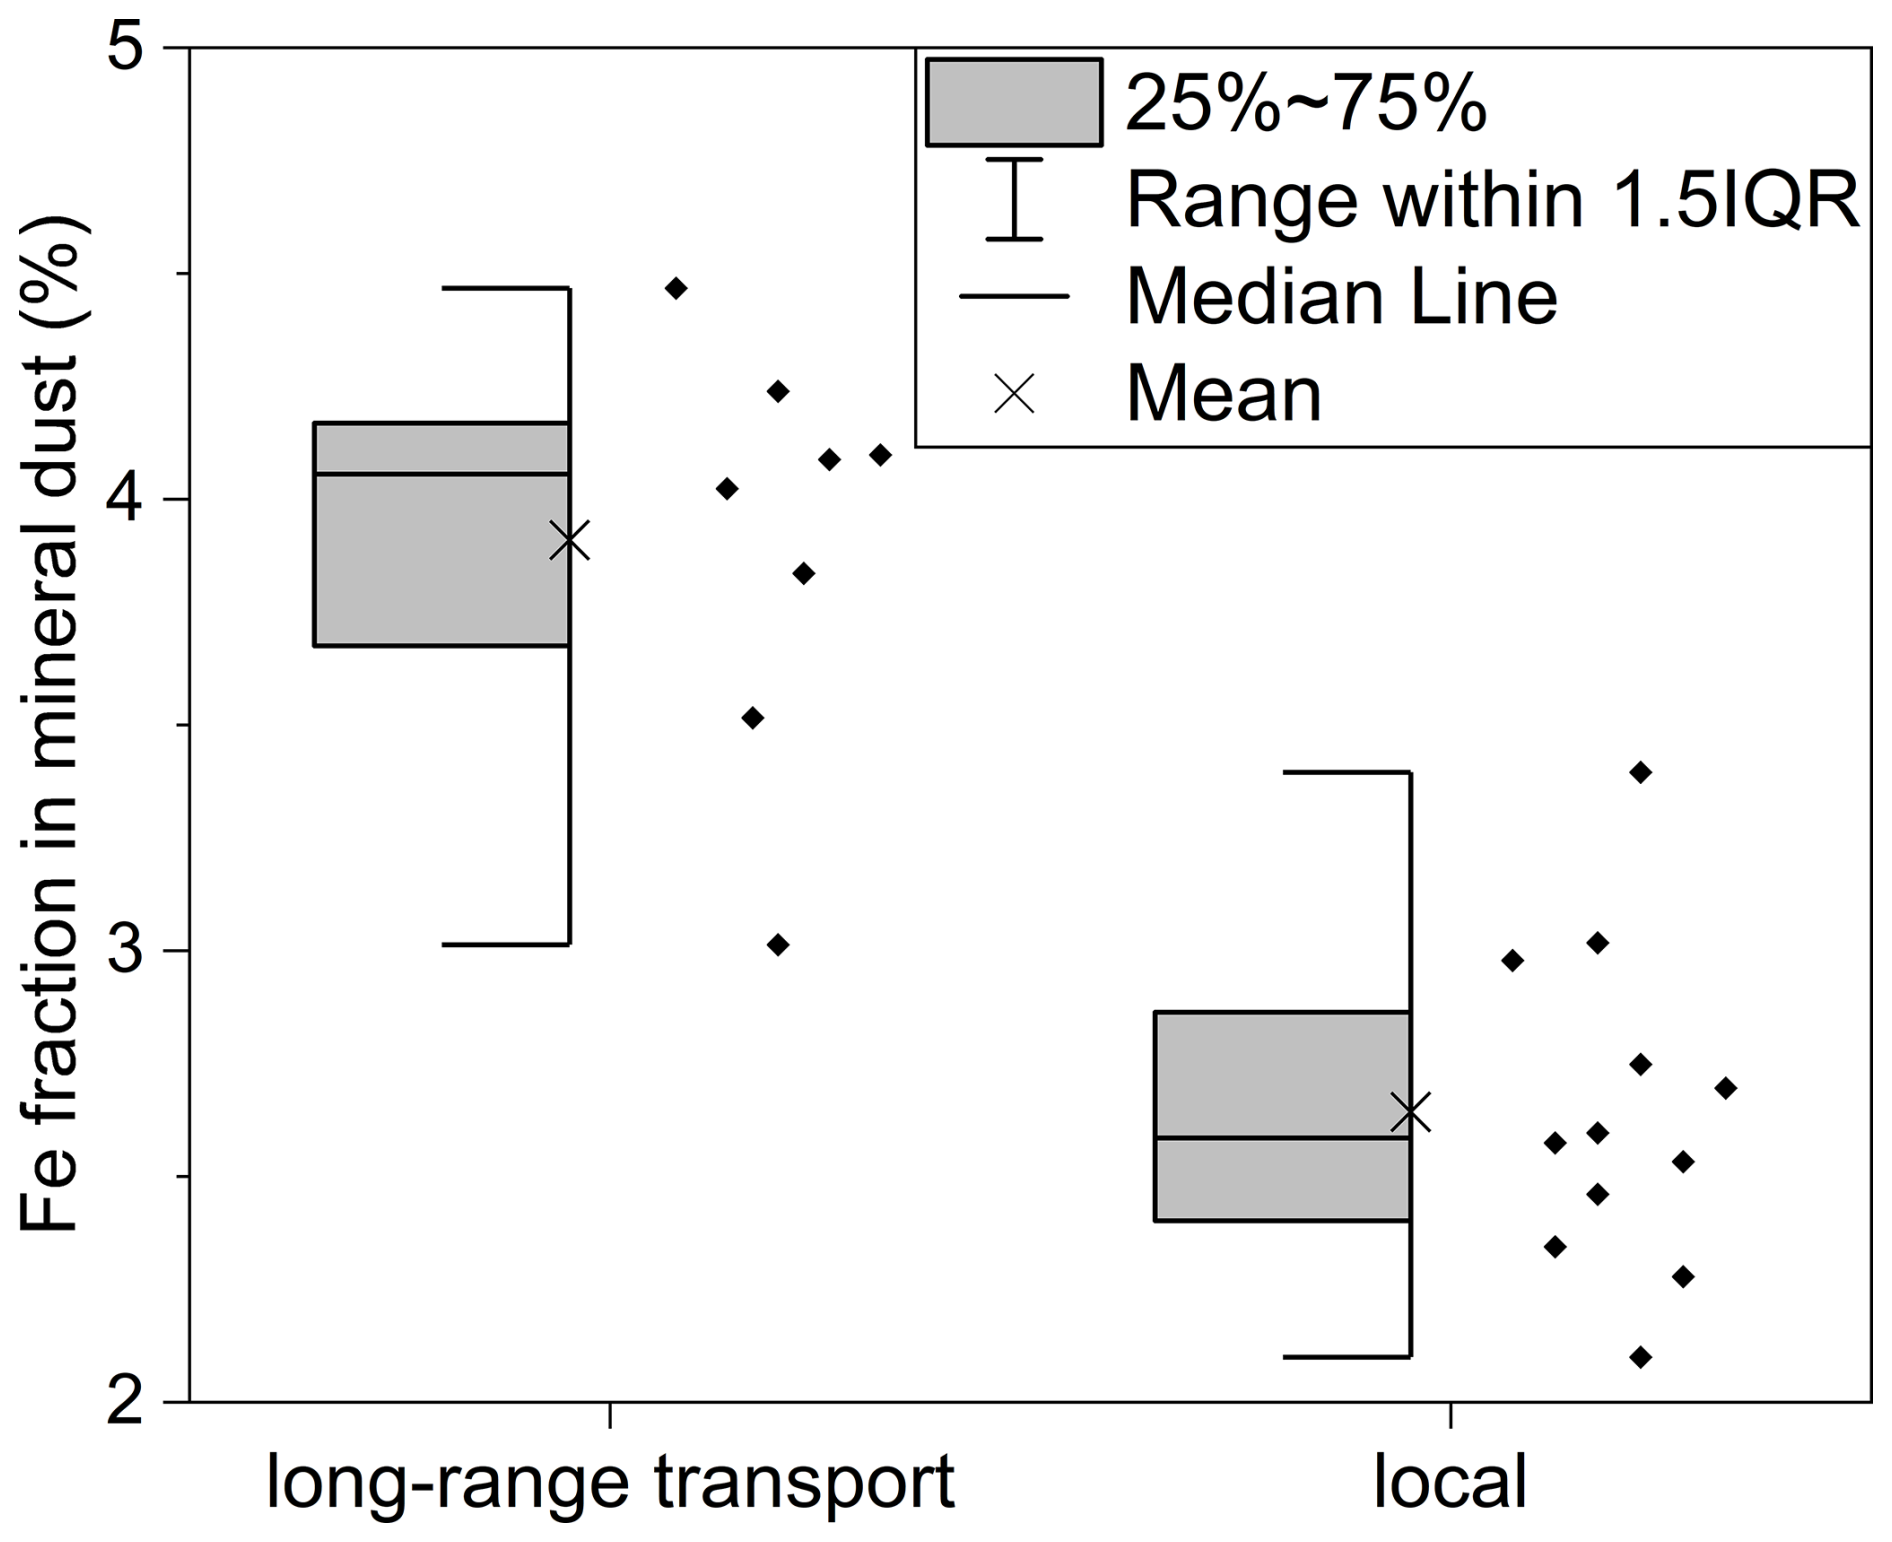
Figure 5Fe fraction in mineral dust from long-range transport and local sources. IQR: interquartile range.
For the local samples, the Fe fraction spanned between 2.1 % and 3.4 %, with an average of 2.6 %, a standard deviation of 0.4 % and a median of 2.6 %. The results for both sample groups are shown in Fig. 5. The boxplots of the two groups show an overlap, but local samples generally have lower Fe content. Data of additional elements and a higher number of samples would be needed when aiming at a classification between mineral dust from local or remote sources. Further calculations are based on the data set for dust from long-range transport, i.e., a factor of 25 will be applied to approximate mineral dust based on Fe loadings obtained by TOA. Note that these estimations of mineral dust are based on a simple approach assuming relatively stable Fe fractions in mineral dust. The variability of this fraction is reflected in the resulting uncertainty.
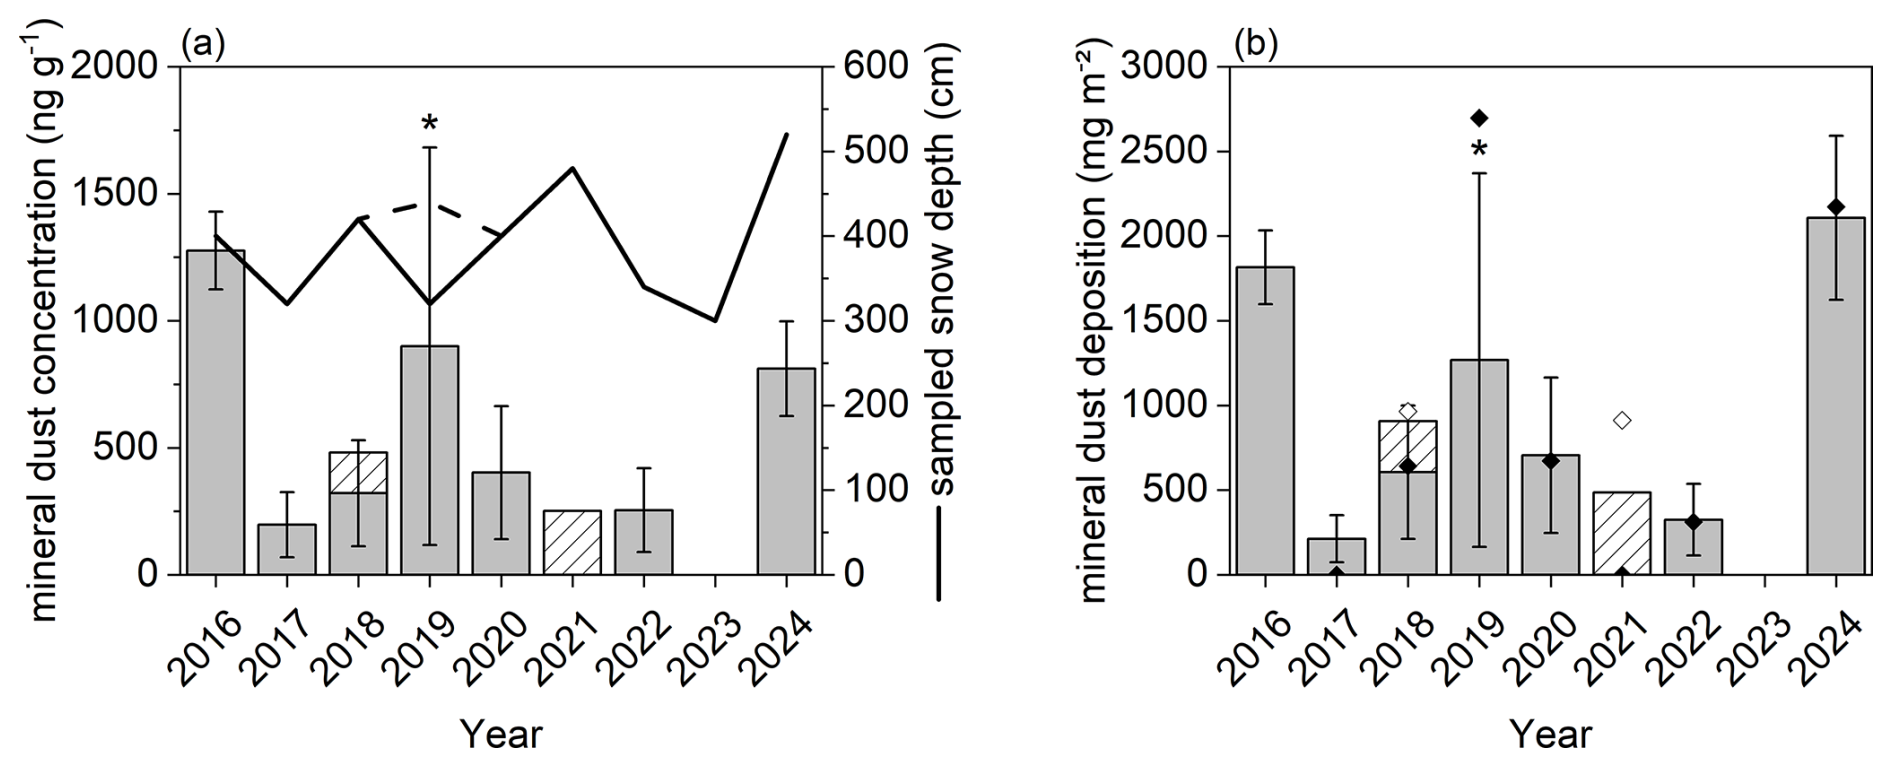
Figure 6(a) Sampled snow depth (continuous line), estimated mineral dust concentration and (b) deposition (bars) for 2016–2024. For 2019 (marked with *), sampling had to be interrupted. Dashed line shows actual snow depth for 2019. Hatched areas correspond to filters, which were not identified as containing mineral dust but showed a reddish colour after TOA. Particle mass on mineral dust filters determined by gravimetry is shown as black diamonds in (b); white diamonds consider also dashed mineral dust layers.
3.3.3 Estimation of mineral dust concentration and deposition from thermal-optical analysis data
The resulting mineral dust concentrations and depositions for the years 2016 to 2024 are shown in Fig. 6. For the year 2016, the estimation is based on the Fe loading determined via ICP-OES, as the laser data were of insufficient quality. Uncertainty includes the variability of the Fe mass fraction in mineral dust, represented by the factor to estimate mineral dust loadings from Fe loadings (25±3), and spreading of data points around the fit to calculate Fe loadings from ΔATN700−450 (11±7 %). The first includes variation due to the composition of mineral dust and from the ICP-OES analysis procedure, while the latter includes variation in composition and variation of the laser signal from TOA. A high variability of Fe content in mineral dusts found at a site, e.g., due to different source regions, would increase the uncertainty of the method. While elemental ratios may be used for source apportionment, Scheuvens et al. (2013) found that Fe contents are rather constant and homogeneously distributed in northern African dusts and sediments, comparable to the composition of the upper continental crust. On a bigger regional scale, Kandler and Scheuvens (2019) report that the local variation in the composition of dust can exceed the differences between Asian and African dust. We observed only small variation of the Fe mass fraction in dusts collected at our site between 2020 and 2024 covering several transport events, reflected in the first parameter (25±3). Still, one must be aware that the calculated mineral dust concentrations and depositions presented below will be influenced by the source-dependent Fe variability. This can affect single events and interannual comparisons. We assume the error in retention of the quartz fibre filter to be negligible, as the mode of deposited mineral dust particle sizes in snow was between 4.5 and 13 µm (determined with Mastersizer 2000, Malvern Panalytical), which is in good agreement with dust-laden snow samples collected in the Italian Alps showing modes of 7.9 and 8.5 µm (Di Mauro et al., 2019). The calculation of the uncertainty of the mineral dust approximation was based on error propagation and resulted in 65 %. While the uncertainty may seem substantial, we want to point out that the spatial variation of dust input is expected to be high. Studies analysing spatial variation reported for various parameters, e.g., dust deposition, ionic input, snow depth, and scales, ranging from within one snow pit to larger scales, show high variability, even if often not quantified (e.g., Rohrbough et al., 2003; Dumont et al., 2023; Di Mauro et al., 2015; Rohde et al., 2023). On the smallest scale, within one snow pit, coefficients of variations ranged up to 82 % with a median up to 24 % for major ions excluding Na+ at the GOK site (Schöner et al., 1997). An uncertainty of this magnitude can be expected and can never be reduced. The method introduced here allows the approximation of mineral dust as an additional parameter deduced from EC monitoring, as no change in the analytical routine is necessary.
Mineral dust concentrations ranged up to 1300 ng g−1. Highest mineral dust concentrations were found for the years 2016, 2019 and 2024. Note that the incomplete sampling of the snow cover in 2019 leads to an unknown bias in the concentration, while the deposition may be underestimated. This was already discussed in Sect. 3.1.2. Assuming no deposition of mineral dust in the lower part of the snowpack and a similar density of snow layers, mineral dust concentration may be decreased by 28 %. The concentration of mineral dust would still be within the top 3 years in the researched period. For single layers, highest mineral dust concentrations were found in 2016 and 2024 and ranged up to 25 and 16 µg g−1, respectively. This comes close to concentrations of strong mineral dust events observed in the Italian Alps, where the mean concentration of surface snow from six spots was 54.5 µg dust (g snow)−1 in 2016 (Di Mauro et al., 2019).
The deposition of mineral dust ranged up to 2100 mg m−2. Mineral dust deposition was highest in the same years as the concentration, however, 2024 exceeding 2016 and 2019. As mineral dust deposition in 2019 may be underestimated due to incomplete sampling of the snow cover, it may be the second highest or highest year regarding mineral dust input. For the February event in 2021, Dumont et al. (2023) analysed samples collected in the Pyrenees, French Alps and Swiss Alps and found depositions between 0.2 and 58.6 g m−2. Deposited mass decreased along the transport path and led to mean values of 21.2, 7.2 and 3.5 g m−2 for the aforementioned sites, respectively. Meinander et al. (2023) modelled the deposition of Saharan dust in February 2021 over Finland. Maximum total wet deposition of dust was between 500 and 1000 mg m−2, while their simulations show how dust transport bypassed Austria. This is consistent with our findings that no intense mineral dust layer corresponding to this transport event was found at the GOK site. The orders of magnitude in our work agree with these findings, especially for 2016, where only one layer dominated the mineral dust deposition. Compared to most studies, our results do not focus on the deposition of mineral dust resulting from single events but represent the mineral dust input throughout the entire winter accumulation period in nine consecutive years.
For filters showing a reddish colour after TOA but not triggering the TOA approach, mineral dust was estimated from elemental data and is also shown in Fig. 6. Considering these filters would lead to an increase of mineral dust concentration and deposition by 160 ng g−1 and 300 mg m−2 (50 %) for 2018 and 250 ng g−1 and 490 mg m−2 for 2021, respectively. For 2021, four separate layers were evaluated. Note that each layer would contribute only little to the mineral dust input. The two layers for 2018 are concentrated in one layer for the IC-profile, while they are separated in the TOA-profile. They are considered “overlooked” and should be included for future evaluations. For quality assurance, checking the filters' colour after TOA is recommended.
Gravimetric data of insoluble particles are available for 2017–2022 and 2024 based on the quartz fibre filters subsequently used for TOA. However, an alternative to gravimetric determination of mineral dust is desirable, as several challenges occur: Care must be taken to take the mass of the filters before and after filtration at comparable conditions, i.e., comparable level of humidity, as particle loadings are usually low and can easily be biased. Fibres of the filter material are lost during handling (visible as white residue in the filtration device), leading to an underestimation of particle mass. Hence, most blanks show negative masses after filtration of ultrapure water, which necessitates a correction of the filter loadings. The variability of the losses observed for blanks leads to high limits of detection. Due to the low particle loadings at our site, only 36 out of 131 samples corresponding to 27 % of samples were above these limits of detection. Still, most mineral dust samples exceeded the limits of detection (87 %). Two mineral dust filters were below the limit of detection (one from 2017 and 2018 each, corresponding to 100 and 50 % of mineral dust layers of these years). For 2017, 2018 and 2020 (no data available for one sample), gravimetric data presented underestimates actual particle mass of the mineral dust layers. Furthermore, gravimetry by itself is not a reliable criterion to identify mineral dust samples.
In Fig. 6, we show the deposited particle mass from the gravimetric evaluation of the mineral dust filters for 2017–2022 and 2024 assuming that all insoluble particles can be attributed to mineral dust. Overall, our newly presented method agrees well with gravimetric data. If an appropriate estimate for the Fe fraction is available, a mineral dust estimate from archived TOA data is accessible.
We report continuous data of water-insoluble total carbon (WinsTC), water-insoluble organic carbon (WinsOC) and elemental carbon (EC) for snowpacks sampled between 2016 and 2024. A linear laser correction was applied to evaluate samples containing mineral dust to minimize the bias caused by the temperature dependent changes in optical properties. Changes due to the adapted evaluation showed negligible influence on WinsOC for single samples and entire snowpacks, but median increases for EC of 63 and 8.3 %, respectively. This highlights the necessity to choose a suitable laser correction for samples including mineral dust in thermal-optical analysis (TOA). Average concentrations for WinsTC, WinsOC and EC were 459±204, 458±215 and 11.1±2.5 ng g−1 and depositions were 731±348 g m−2, 743±355 mg m−2 and 17.8±6.5 mg m−2, respectively.
We identified mineral dust layers in the snowpacks using two complementary approaches based on TOA data or ion chromatography data combined with the pH. They agreed substantially and we conclude that each may be used. The median Fe fraction in mineral dust from long-range transport deposited at Sonnblick Observatory between 2020 and 2024 was 4.0 %. Using this value, we estimated the mineral dust concentration and deposition based on TOA data. Concentration in the snowpacks ranged up to 1300 ng g−1 and deposition up to 2100 mg m−2. The results agree well with the gravimetric data of these layers and strongest events with data reported in literature. The approximation of mineral dust from TOA data is applicable for monitoring assuming a rather stable Fe fraction in mineral dust mass. Identification and approximation can be retrospectively applied to data of samples containing mineral dust, as no change in analytical routine is necessary.
In liquid filtration, EC filtration efficiency of quartz fibre filters is still discussed. In literature, different samples (standards or precipitation) were analysed using a series of filters or via comparison with other methods and reported filtration efficiencies for EC ranged from 10 % to 92 % (e.g., Ogren et al., 1983; Torres et al., 2014; Hadley et al., 2008; Lim et al., 2014). We did not assess the EC filtration efficiency for our samples, but assessment for similar sample preparation and types gave an undercatch of 22 % (Zdanowicz et al., 2021). Using reference materials (oxidized black carbon), addition of coagulant (NH4H2PO4) showed an increase of the filtration efficiency from 5 % to 95 % (Torres et al., 2014). For real snow samples including aged carbon, filter efficiency was higher and addition of the coagulant showed a smaller effect on EC filtration efficiency (increase by a factor of 1.45; Kuchiki et al., 2015). Only a small number of publications applying the method are available (e.g., Tuzet et al., 2020; Thind et al., 2021). We added NH4H2PO4 to a limited number of three types of samples (ultrapure water to be considered as blank; sample containing mineral dust; sample not affected by mineral dust) and compared it to untreated aliquots to assess the applicability for our background site (n=5 for each sample type and treatment). Addition of the coagulant led to a decrease in pH (ultrapure water: 5.6 to 4.4; sample containing mineral dust: 8.2 to 4.6), which can alter the sample composition, e.g., by removing carbonate carbon. We observed changes in the signal of the flame ionisation detector in various OC and EC fractions (positive and negative) and obtained blanks with doubled TC loadings (untreated: 2.5 µg cm−2; NH4H2PO4: 4.8 µg cm−2). Addition of NH4H2PO4 led to a decreased TC loading for the sample containing mineral dust (untreated: 114±2 µg cm−2; NH4H2PO4: 80.5±1.75 µg cm−2), presumably dominated by carbonate carbon. The removal of substances leading to a broad shoulder in OC4 was comparable to filters treated with HCl, which will quantitatively remove carbonate carbon. The untreated sample without mineral dust showed comparable TC loadings for filters loaded with untreated sample and addition of NH4H2PO4 (17±3 µg cm−2 and 19±2 µg cm−2, respectively), while only the untreated aliquots showed EC (0.23±0.11 µg cm−2). In agreement with Kuchiki et al. (2015), no influence of an aqueous solution of the substance pipetted on a clean filter on the laser signal was observed. Still, no automatic split point could be set for any replicate of the sample not containing mineral dust treated with NH4H2PO4, while the untreated sample showed EC. This suggests that the coagulant can interact with compounds of real snow samples leading to changes in optical properties. Due to the influence on sample composition and analysis, and the lack of datasets from background regions applying the method for comparison, we decided not to modify our samples by adding coagulant. Hence, we expect an underestimation of EC. Uncertainties regarding homogeneity of the filter loading do not apply in our case, as the entire loaded area was analysed, and we do not expect losses to the container walls during sample preparation based on Forsström et al. (2009).
Dust from long-range transport was obtained from snow and rime collected at Sonnblick Observatory after intense transport events. Samples were melted in a beaker using a microwave (600 W for 1 min, homogenized, repeated until fully melted) and transferred to closed plastic bottles. The particles were left to settle for 24 h and the supernatant was decanted. The settled dust was transferred to an evaporating dish with a small amount of ultrapure water and was put on a hotplate at around 125 °C (not boiling) to remove most of the liquid. The moist dust was dried at 115 °C in a drying oven over night.
Dust from local sources was collected on snow-free surfaces close to Sonnblick Observatory (n=4) using a brush and for one sample a hand-held vacuum cleaner. Visual inspection allowed to select samples resembling the dust from long-range transport obtained from surface snow and rime in terms of particle size. All samples were collected at surfaces without visible signs of vegetation.
Replicates of each sample (each about 12 mg) were digested, and Fe was quantified via ICP-OES. For half of the samples from long-range transport (overall n=8), triplicate measurements could be done, while for the other half only duplicate measurements were possible due to limited sample mass. To avoid unbalanced influence of the samples due to varying numbers of replicates, the average of the replicates was used for each sample in the subsequent evaluation. This was valid, as variation in replicates was small (triplicates: relative standard deviation; duplicates: half of the difference related to the average) and ranged between 0.1 % and 4.1 % with a median of 1.3 %.
For the local samples (n=4), triplicate analyses were done. Relative standard deviation ranged from 5.4 % to 20 % with a median of 9.9 %. We contribute the high variation to inhomogeneity of the samples. Due to the even number of replicates, low overall number of samples and high variation within one sample, each result was considered by itself for the evaluation of the Fe fraction in the dust samples.
As described in Sect. 3.3.1 and 3.3.2, the fit to approximate the Fe loading based on ΔATN700−450 was calculated using 14 samples from the GOK site and a nearby site, Kleinfleißkees. The fit covered a range of 4.0 to 13 and was applied to all samples from the GOK site between 2017 and 2024. Most samples were in the range of the fit, as seen in Fig. C1. Three samples are outside the linear range (ΔATN). For one of these samples from 2024 (ΔATN), the Fe loading obtained via ICP-OES was available and was compared to the Fe loading based on its ΔATN700−450 value and the fit. Using the latter would underestimate the Fe loading by 30 %. This leads to a decreased uncertainty of 23 % for the mineral dust approximation of 2024. For this sample, the approximation of mineral dust was based on the Fe loading obtained via ICP-OES. For the other two samples exceeding an ΔATN700−450 of 13 (both from 2019, ΔATN700−450 of 21 and 35), no Fe loading from ICP-OES was available. Lacking an alternative, we based the mineral dust approximation for these samples on ΔATN700−450 and consequently increased the error bar for 2019 in Fig. 6 to 87 % to consider the underestimation of these samples.
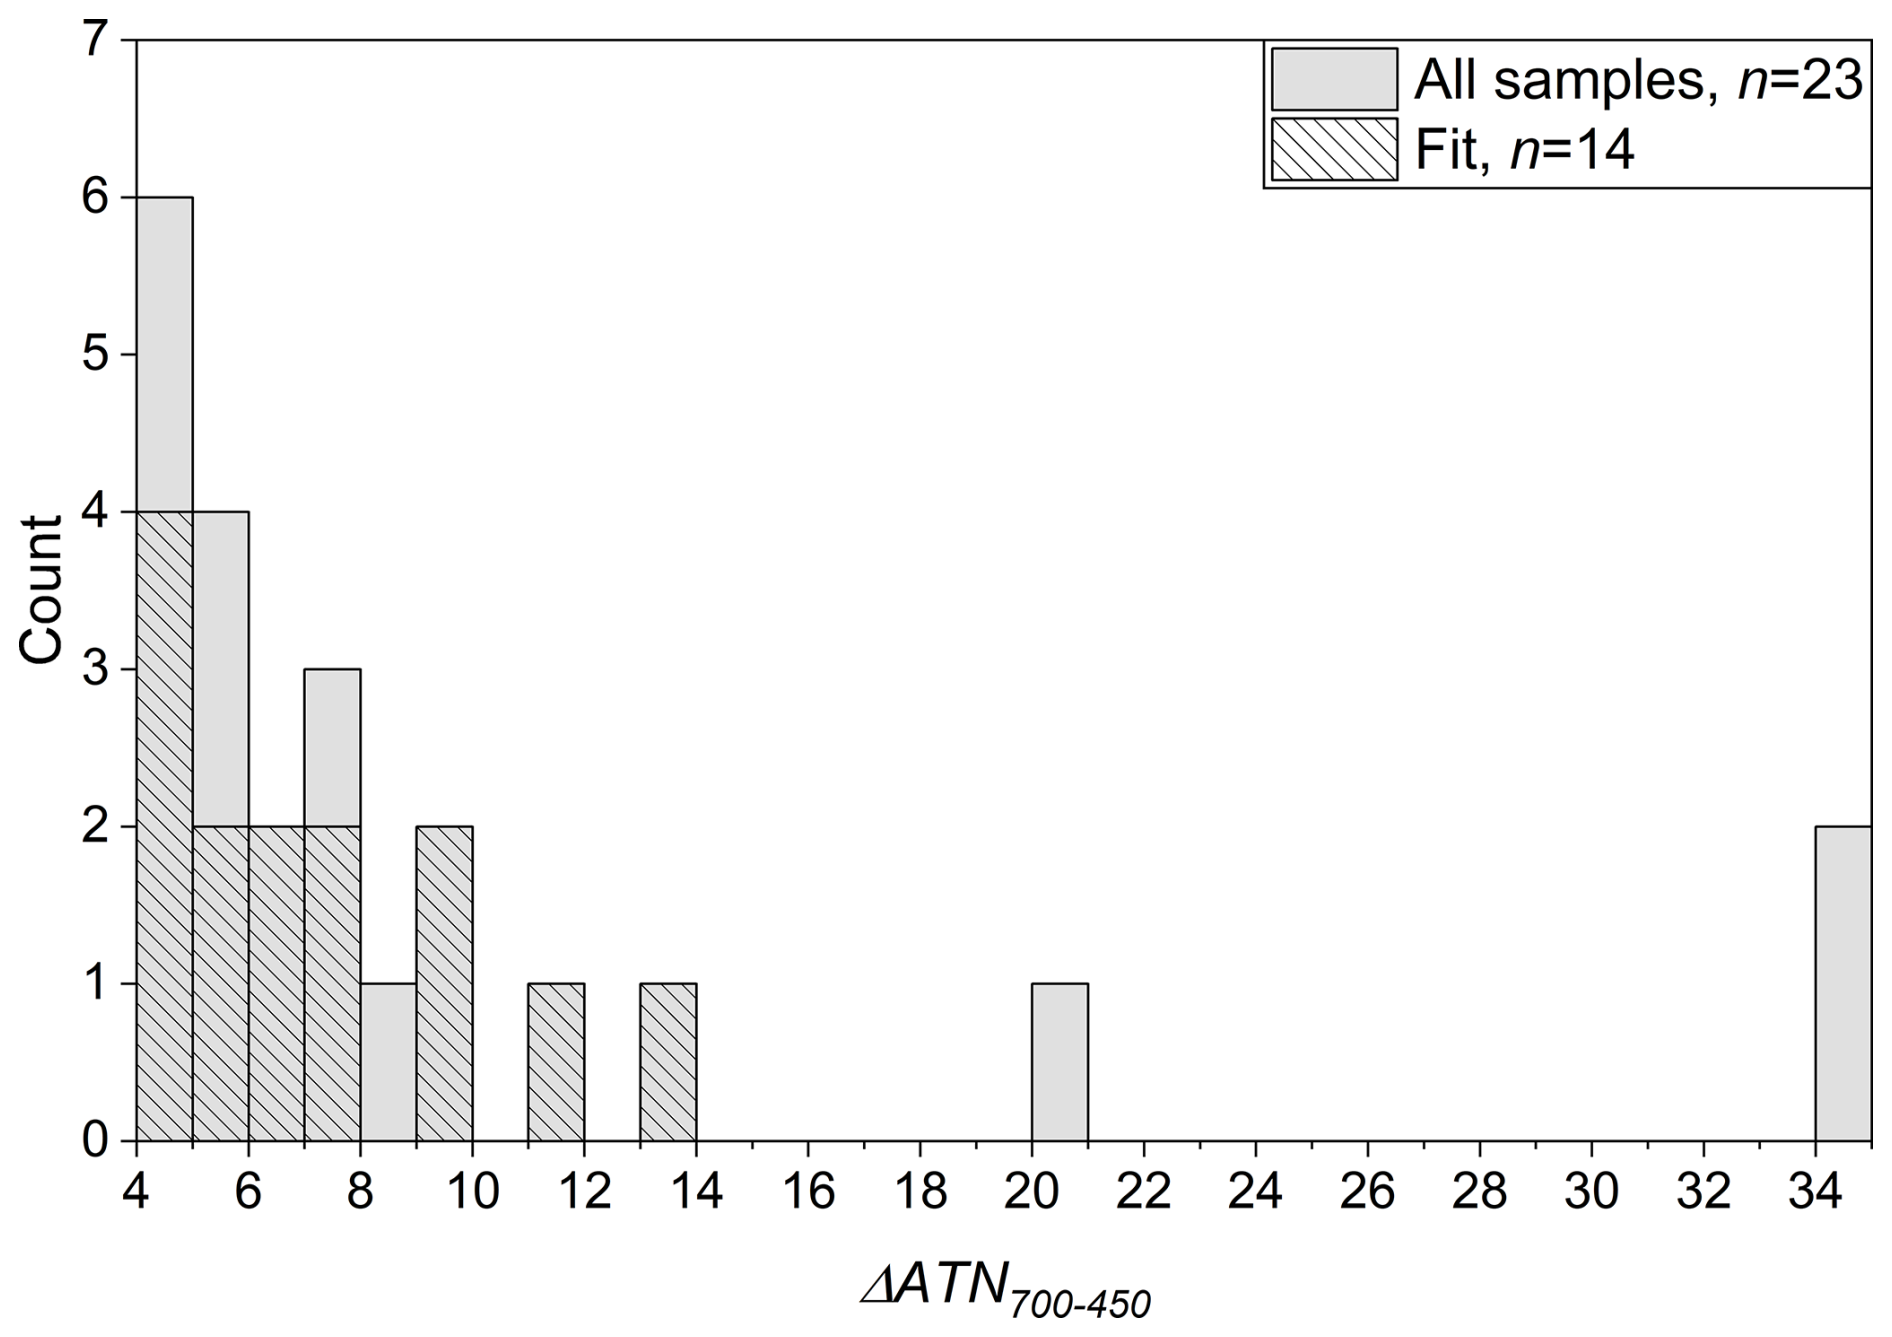
Figure C1Overview of samples which were used to calculate the fit for the Fe loading estimation from ΔATN700−450 and samples the fit was applied to.
Data presented within this work are available at TU Wien Research Data (https://doi.org/10.48436/yb10b-yfc83; Kau, 2026).
DK: Conceptualization, Data curation, Formal analysis, Investigation, Methodology, Validation, Visualization, Writing (original draft preparation), Writing (review and editing). MG: Data curation, Formal analysis, Writing (review and editing). AV: Investigation, Writing (review and editing). JB: Investigation, Writing (review and editing). LK: Investigation, Writing (review and editing). AKG: Conceptualization, Methodology, Resources, Writing (original draft preparation), Writing (review and editing).
The contact author has declared that none of the authors has any competing interests.
Publisher's note: Copernicus Publications remains neutral with regard to jurisdictional claims made in the text, published maps, institutional affiliations, or any other geographical representation in this paper. The authors bear the ultimate responsibility for providing appropriate place names. Views expressed in the text are those of the authors and do not necessarily reflect the views of the publisher.
We thank Gerd Mauschitz from the Research Group for Particle Technology, Recycling Technology and Technology Assessment from TU Wien for the opportunity to analyse particle size distributions. Special thanks go to a group of students who helped with chemical analysis of samples. Snow sampling is nowadays financed by general resources from the GeoSphere Austria. Sampling is supported by colleagues from the Section Climate Monitoring and Cryosphere and from the Sonnblick Observatory. We thank http://www.foto-webcam.eu (last access: 17 March 2026) for permission to use a part of a photo from “Goldbergkees 2” for the graphical abstract. The authors acknowledge TU Wien Bibliothek for financial support through its Open Access Funding Programme.
This paper was edited by K. M. Meiners and reviewed by Matthew Johnson and one anonymous referee.
Barkan, J. and Alpert, P.: Synoptic analysis of a rare event of Saharan dust reaching the Arctic region, Weather, 65, 208–211, https://doi.org/10.1002/wea.503, 2010.
Birch, M. E. and Cary, R. A.: Elemental carbon-based method for monitoring occupational exposures to particulate diesel exhaust, Aerosol Sci. Technol., 25, 221–241, https://doi.org/10.1080/02786829608965393, 1996.
Bond, T. C., Doherty, S. J., Fahey, D. W., Forster, P. M., Berntsen, T., DeAngelo, B. J., Flanner, M. G., Ghan, S., Kärcher, B., Koch, D., Kinne, S., Kondo, Y., Quinn, P. K., Sarofim, M. C., Schultz, M. G., Schulz, M., Venkataraman, C., Zhang, H., Zhang, S., Bellouin, N., Guttikunda, S. K., Hopke, P. K., Jacobson, M. Z., Kaiser, J. W., Klimont, Z., Lohmann, U., Schwarz, J. P., Shindell, D., Storelvmo, T., Warren, S. G., and Zender, C. S.: Bounding the role of black carbon in the climate system: A scientific assessment, J. Geophys. Res.-Atmos., 118, 5380–5552, https://doi.org/10.1002/jgrd.50171, 2013.
Cavalli, F., Viana, M., Yttri, K. E., Genberg, J., and Putaud, J.-P.: Toward a standardised thermal-optical protocol for measuring atmospheric organic and elemental carbon: the EUSAAR protocol, Atmos. Meas. Tech., 3, 79–89, https://doi.org/10.5194/amt-3-79-2010, 2010.
Cerqueira, M., Pio, C., Legrand, M., Puxbaum, H., Kasper-Giebl, A., Afonso, J., Preunkert, S., Gelencsér, A., and Fialho, P.: Particulate carbon in precipitation at European background sites, J. Aerosol Sci., 41, 51–61, https://doi.org/10.1016/j.jaerosci.2009.08.002, 2010.
Dick, O., Viallon-Galinier, L., Tuzet, F., Hagenmuller, P., Fructus, M., Reuter, B., Lafaysse, M., and Dumont, M.: Can Saharan dust deposition impact snowpack stability in the French Alps?, The Cryosphere, 17, 1755–1773, https://doi.org/10.5194/tc-17-1755-2023, 2023.
Di Mauro, B., Fava, F., Ferrero, L., Garzonio, R., Baccolo, G., Delmonte, B., and Colombo, R.: Mineral dust impact on snow radiative properties in the European Alps combining ground, UAV, and satellite observations, J. Geophys. Res.-Atmos., 120, 6080–6097, https://doi.org/10.1002/2015JD023287, 2015.
Di Mauro, B., Garzonio, R., Rossini, M., Filippa, G., Pogliotti, P., Galvagno, M., Morra di Cella, U., Migliavacca, M., Baccolo, G., Clemenza, M., Delmonte, B., Maggi, V., Dumont, M., Tuzet, F., Lafaysse, M., Morin, S., Cremonese, E., and Colombo, R.: Saharan dust events in the European Alps: role in snowmelt and geochemical characterization, The Cryosphere, 13, 1147–1165, https://doi.org/10.5194/tc-13-1147-2019, 2019.
DIN e.V.: DIN EN 16909:2017, Außenluft – Messung von auf Filtern gesammeltem elementaren Kohlenstoff (EC) und organisch gebundenem Kohlenstoff (OC), Deutsche Fassung EN 16909:2017, Beuth Verlag GmbH, Berlin, 2017.
Doherty, S. J., Warren, S. G., Grenfell, T. C., Clarke, A. D., and Brandt, R. E.: Light-absorbing impurities in Arctic snow, Atmos. Chem. Phys., 10, 11647–11680, https://doi.org/10.5194/acp-10-11647-2010, 2010.
Doherty, S. J., Grenfell, T. C., Forsström, S., Hegg, D. L., Brandt, R. E., and Warren, S. G.: Observed vertical redistribution of black carbon and other insoluble light-absorbing particles in melting snow, J. Geophys. Res.-Atmos., 118, 5553–5569, https://doi.org/10.1002/jgrd.50235, 2013.
Dumont, M., Gascoin, S., Réveillet, M., Voisin, D., Tuzet, F., Arnaud, L., Bonnefoy, M., Bacardit Peñarroya, M., Carmagnola, C., Deguine, A., Diacre, A., Dürr, L., Evrard, O., Fontaine, F., Frankl, A., Fructus, M., Gandois, L., Gouttevin, I., Gherab, A., Hagenmuller, P., Hansson, S., Herbin, H., Josse, B., Jourdain, B., Lefevre, I., Le Roux, G., Libois, Q., Liger, L., Morin, S., Petitprez, D., Robledano, A., Schneebeli, M., Salze, P., Six, D., Thibert, E., Trachsel, J., Vernay, M., Viallon-Galinier, L., and Voiron, C.: Spatial variability of Saharan dust deposition revealed through a citizen science campaign, Earth Syst. Sci. Data, 15, 3075–3094, https://doi.org/10.5194/essd-15-3075-2023, 2023.
Forsström, S., Ström, J., Pedersen, C. A., Isaksson, E., and Gerland, S.: Elemental carbon distribution in Svalbard snow, J. Geophys. Res.-Atmos., 114, D19112, https://doi.org/10.1029/2008JD011480, 2009.
Forsström, S., Isaksson, E., Skeie, R. B., Ström, J., Pedersen, C. A., Hudson, S. R., Berntsen, T. K., Lihavainen, H., Godtliebsen, F., and Gerland, S.: Elemental carbon measurements in European Arctic snow packs, J. Geophys. Res.-Atmos., 118, 13–614, https://doi.org/10.1002/2013JD019886, 2013.
Greilinger, M. and Kasper-Giebl, A.: Saharan dust records and its impact in the European Alps, in: Oxford Research Encyclopedia of Climate Science, https://doi.org/10.1093/acrefore/9780190228620.013.827, 2021.
Greilinger, M., Schöner, W., Winiwarter, W., and Kasper-Giebl, A.: Temporal changes of inorganic ion deposition in the seasonal snow cover for the Austrian Alps (1983–2014), Atmos. Environ., 132, 141–152, https://doi.org/10.1016/j.atmosenv.2016.02.040, 2016.
Greilinger, M., Schauer, G., Baumann-Stanzer, K., Skomorowski, P., Schöner, W., and Kasper-Giebl, A.: Contribution of Saharan dust to ion deposition loads of high alpine snow packs in Austria (1987–2017), Front. Earth Sci., 6, 126, https://doi.org/10.3389/feart.2018.00126, 2018.
Grenfell, T. C., Doherty, S. J., Clarke, A. D., and Warren, S. G.: Light absorption from particulate impurities in snow and ice determined by spectrophotometric analysis of filters, Appl. Optics, 50, 2037–2048, https://doi.org/10.1364/AO.50.002037, 2011.
Gul, C., Puppala, S. P., Kang, S., Adhikary, B., Zhang, Y., Ali, S., Li, Y., and Li, X.: Concentrations and source regions of light-absorbing particles in snow/ice in northern Pakistan and their impact on snow albedo, Atmos. Chem. Phys., 18, 4981–5000, https://doi.org/10.5194/acp-18-4981-2018, 2018.
Gul, C., Kang, S., Puppala, S. P., Wu, X., He, C., Xu, Y., Koch, I., Muhammad, S., Kumar, R., and Dubache, G.: Measurement of light-absorbing particles in surface snow of central and western Himalayan glaciers: spatial variability, radiative impacts, and potential source regions, Atmos. Chem. Phys., 22, 8725–8737, https://doi.org/10.5194/acp-22-8725-2022, 2022.
Hadley, O. L., Corrigan, C. E., and Kirchstetter, T. W.: Modified thermal-optical analysis using spectral absorption selectivity to distinguish black carbon from pyrolized organic carbon, Environ. Sci. Technol., 42, 8459–8464, https://doi.org/10.1021/es800448n, 2008.
Kandler, K. and Scheuvens, D.: Asian and Saharan dust from a chemical/mineralogical point of view: differences and similarities from bulk and single particle measurements, E3S Web of Conferences, 99, 03001, https://doi.org/10.1051/e3sconf/20199903001, 2019.
Kaspari, S., Painter, T. H., Gysel, M., Skiles, S. M., and Schwikowski, M.: Seasonal and elevational variations of black carbon and dust in snow and ice in the Solu-Khumbu, Nepal and estimated radiative forcings, Atmos. Chem. Phys., 14, 8089–8103, https://doi.org/10.5194/acp-14-8089-2014, 2014.
Kau, D.: Supplementary material to “Light-absorbing snow impurities: Nine years (2016–2024) of snowpack sampling close to Sonnblick Observatory, Austrian Alps”, TU Wien [data set], https://doi.org/10.48436/yb10b-yfc83, 2026.
Kau, D., Greilinger, M., Kirchsteiger, B., Göndör, A., Herzig, C., Limbeck, A., Eitenberger, E., and Kasper-Giebl, A.: Thermal–optical analysis of quartz fiber filters loaded with snow samples – determination of iron based on interferences caused by mineral dust, Atmos. Meas. Tech., 15, 5207–5217, https://doi.org/10.5194/amt-15-5207-2022, 2022.
Kok, J. F., Adebiyi, A. A., Albani, S., Balkanski, Y., Checa-Garcia, R., Chin, M., Colarco, P. R., Hamilton, D. S., Huang, Y., Ito, A., Klose, M., Li, L., Mahowald, N. M., Miller, R. L., Obiso, V., Pérez García-Pando, C., Rocha-Lima, A., and Wan, J. S.: Contribution of the world's main dust source regions to the global cycle of desert dust, Atmos. Chem. Phys., 21, 8169–8193, https://doi.org/10.5194/acp-21-8169-2021, 2021.
Kok, J. F., Storelvmo, T., Karydis, V. A., Adebiyi, A. A., Mahowald, N. M., Evan, A. T., He, C., and Leung, D. M.: Mineral dust aerosol impacts on global climate and climate change, Nat. Rev. Earth Environ., 4, 71–86, https://doi.org/10.1038/s43017-022-00379-5, 2023.
Kuchiki, K., Aoki, T., Niwano, M., Matoba, S., Kodama, Y., and Adachi, K.: Elemental carbon, organic carbon, and dust concentrations in snow measured with thermal optical and gravimetric methods: Variations during the 2007–2013 winters at Sapporo, Japan, J. Geophys. Res.-Atmos., 120, 868–882, https://doi.org/10.1002/2014JD022144, 2015.
Lafon, S., Rajot, J. L., Alfaro, S. C., and Gaudichet, A.: Quantification of iron oxides in desert aerosol, Atmos. Environ., 38, 1211–1218, https://doi.org/10.1016/j.atmosenv.2003.11.006, 2004.
Lafon, S., Sokolik, I. N., Rajot, J. L., Caquineau, S., and Gaudichet, A.: Characterization of iron oxides in mineral dust aerosols: Implications for light absorption, J. Geophys. Res.-Atmos., 111, D21207, https://doi.org/10.1029/2005JD007016, 2006.
Landis, J. R. and Koch, G. G.: The measurement of observer agreement for categorical data, Biometrics, 33, 159–174, https://doi.org/10.2307/2529310, 1977.
Li, C., Yan, F., Kang, S., Chen, P., Han, X., Hu, Z., Zhang, G., Hong, Y., Gao, S., Qu, B., Zhu, Z., Li, J., Chen, B., and Sillanpää, M.: Re-evaluating black carbon in the Himalayas and the Tibetan Plateau: concentrations and deposition, Atmos. Chem. Phys., 17, 11899–11912, https://doi.org/10.5194/acp-17-11899-2017, 2017.
Li, X., Kang, S., Zhang, G., Qu, B., Tripathee, L., Paudyal, R., Jing, Z., Zhang, Y., Yan, F., Li, G., Cui, X., Xu, R., Hu, Z., and Li, C.: Light-absorbing impurities in a southern Tibetan Plateau glacier: Variations and potential impact on snow albedo and radiative forcing, Atmos. Res., 200, 77–87, https://doi.org/10.1016/j.atmosres.2017.10.002, 2018.
Lim, S., Faïn, X., Zanatta, M., Cozic, J., Jaffrezo, J.-L., Ginot, P., and Laj, P.: Refractory black carbon mass concentrations in snow and ice: method evaluation and inter-comparison with elemental carbon measurement, Atmos. Meas. Tech., 7, 3307–3324, https://doi.org/10.5194/amt-7-3307-2014, 2014.
Meinander, O., Kasper-Giebl, A., Becagli, S., Aurela, M., Kau, D., Calzolai, G., and Schöner, W.: Intercomparison Experiment of Water-Insoluble Carbonaceous Particles in Snow in a High-Mountain Environment (1598 m asl), Geosciences, 12, 197, https://doi.org/10.3390/geosciences12050197, 2022.
Meinander, O., Kouznetsov, R., Uppstu, A., Sofiev, M., Kaakinen, A., Salminen, J., Rontu, L., Welti, A., Francis, D., Piedehierro, A. A., Heikkilä, P., Heikkinen, E., and Laaksonen, A.: African dust transport and deposition modelling verified through a citizen science campaign in Finland, Sci. Rep., 13, 21379, https://doi.org/10.1038/s41598-023-46321-7, 2023.
Mori, T., Goto-Azuma, K., Kondo, Y., Ogawa-Tsukagawa, Y., Miura, K., Hirabayashi, M., Oshima, N., Koike, M., Kupiainen, K., Moteki, N., Ohata, S., Sinha, P. R., Sugiura, K., Aoki, T., Schneebeli, M., Steffen, K., Sato, A., Tsushima, A., Makarov, V., Omiya, S., Sugimoto, A., Takano, S., and Nagatsuka, N.: Black carbon and inorganic aerosols in Arctic snowpack, J. Geophys. Res.-Atmos., 124, 13325–13356, https://doi.org/10.1029/2019JD030623, 2019.
Nielson, J. R. and Brahney, J.: Quantifying dust nutrient mobility through an alpine watershed, J. Geophys. Res.-Biogeo., 130, e2024JG008175, https://doi.org/10.1029/2024JG008175, 2025.
Ogren, J. A., Charlson, R. J., and Groblicki, P. J.: Determination of elemental carbon in rainwater, Anal. Chem., 55, 1569–1572, 1983.
Petzold, A., Ogren, J. A., Fiebig, M., Laj, P., Li, S.-M., Baltensperger, U., Holzer-Popp, T., Kinne, S., Pappalardo, G., Sugimoto, N., Wehrli, C., Wiedensohler, A., and Zhang, X.-Y.: Recommendations for reporting ”black carbon” measurements, Atmos. Chem. Phys., 13, 8365–8379, https://doi.org/10.5194/acp-13-8365-2013, 2013.
Réveillet, M., Dumont, M., Gascoin, S., Lafaysse, M., Nabat, P., Ribes, A., Nheili, R., Tuzet, F., Ménégoz, M., Morin, S., Picard, G., and Ginoux, P.: Black carbon and dust alter the response of mountain snow cover under climate change, Nat. Commun., 13, 5279, https://doi.org/10.1038/s41467-022-32501-y, 2022.
Rogora, M., Mosello, R., and Marchetto, A.: Long-term trends in the chemistry of atmospheric deposition in Northwestern Italy: the role of increasing Saharan dust deposition, Tellus B, 56, 426–434, https://doi.org/10.3402/tellusb.v56i5.16456, 2004.
Rohde, A., Vogel, H., Hoshyaripour, G. A., Kottmeier, C., and Vogel, B.: Regional Impact of Snow-Darkening on Snow Pack and the Atmosphere During a Severe Saharan Dust Deposition Event in Eurasia, J. Geophys. Res.-Earth Surf., 128, e2022JF007016, https://doi.org/10.1029/2022JF007016, 2023.
Rohrbough, J. A., Davis, D. R., and Bales, R. C.: Spatial variability of snow chemistry in an alpine snowpack, southern Wyoming, Water Resour. Res., 39, 1190, https://doi.org/10.1029/2003WR002067, 2003.
Roussel, L., Dumont, M., Réveillet, M., Six, D., Kneib, M., Nabat, P., Fourteau, K., Monteiro, D., Gascoin, S., Thibert, E., Rabatel, A., Sicart, J.-E., Bonnefoy, M., Piard, L., Laarman, O., Jourdain, B., Fructus, M., Vernay, M., and Lafaysse, M.: Saharan dust impacts on the surface mass balance of Argentière Glacier (French Alps), The Cryosphere, 19, 5201–5230, https://doi.org/10.5194/tc-19-5201-2025, 2025.
Scheuvens, D., Schütz, L., Kandler, K., Ebert, M., and Weinbruch, S.: Bulk composition of northern African dust and its source sediments – A compilation, Earth Sci. Rev., 116, 170–194, https://doi.org/10.1016/j.earscirev.2012.08.005, 2013.
Schöner, W., Puxbaum, H., Staudinger, M., Maupetit, F., and Wagenbach, D.: Spatial variability in the chemical composition of the snowcover at high alpine sites, Theor. Appl. Climatol., 56, 25–32, https://doi.org/10.1007/BF00863780, 1997.
Schwarz, J. P., Doherty, S. J., Li, F., Ruggiero, S. T., Tanner, C. E., Perring, A. E., Gao, R. S., and Fahey, D. W.: Assessing Single Particle Soot Photometer and Integrating Sphere/Integrating Sandwich Spectrophotometer measurement techniques for quantifying black carbon concentration in snow, Atmos. Meas. Tech., 5, 2581–2592, https://doi.org/10.5194/amt-5-2581-2012, 2012.
Svensson, J., Ström, J., Kivekäs, N., Dkhar, N. B., Tayal, S., Sharma, V. P., Jutila, A., Backman, J., Virkkula, A., Ruppel, M., Hyvärinen, A., Kontu, A., Hannula, H.-R., Leppäranta, M., Hooda, R. K., Korhola, A., Asmi, E., and Lihavainen, H.: Light-absorption of dust and elemental carbon in snow in the Indian Himalayas and the Finnish Arctic, Atmos. Meas. Tech., 11, 1403–1416, https://doi.org/10.5194/amt-11-1403-2018, 2018.
Telloli, C., Chicca, M., Pepi, S., and Vaccaro, C.: Saharan dust particles in snow samples of Alps and Apennines during an exceptional event of transboundary air pollution, Environ. Monit. Assess., 190, 37, https://doi.org/10.1007/s10661-017-6412-6, 2018.
Thevenon, F., Anselmetti, F. S., Bernasconi, S. M., and Schwikowski, M.: Mineral dust and elemental black carbon records from an Alpine ice core (Colle Gnifetti glacier) over the last millennium, J. Geophys. Res.-Atmos., 114, D17102, https://doi.org/10.1029/2008JD011490, 2009.
Thind, P. S., Chandel, K. K., Sharma, S. K., Mandal, T. K., and John, S.: Light-absorbing impurities in snow of the Indian Western Himalayas: impact on snow albedo, radiative forcing, and enhanced melting, Environ. Sci. Pollut. Res., 26, 7566–7578, https://doi.org/10.1007/s11356-019-04183-5, 2019.
Thind, P. S., Kumar, D., and John, S.: Source apportionment of the light absorbing impurities present in surface snow of the India Western Himalayan glaciers, Atmos. Environ., 246, 118173, https://doi.org/10.1016/j.atmosenv.2020.118173, 2021.
Tomza, U., Arimoto, R., and Ray, B. J.: Color-related differences in the chemical composition of aerosol-laden filters, Atmos. Environ., 35, 1703–1709, https://doi.org/10.1016/S1352-2310(00)00462-3, 2001.
Torres, A., Bond, T. C., Lehmann, C. M., Subramanian, R., and Hadley, O. L.: Measuring organic carbon and black carbon in rainwater: evaluation of methods, Aerosol Sci. Technol., 48, 239–250, https://doi.org/10.1080/02786826.2013.868596, 2014.
Tuzet, F., Dumont, M., Picard, G., Lamare, M., Voisin, D., Nabat, P., Lafaysse, M., Larue, F., Revuelto, J., and Arnaud, L.: Quantification of the radiative impact of light-absorbing particles during two contrasted snow seasons at Col du Lautaret (2058 m a.s.l., French Alps), The Cryosphere, 14, 4553–4579, https://doi.org/10.5194/tc-14-4553-2020, 2020.
Wang, M., Xu, B., Zhao, H., Cao, J., Joswiak, D., Wu, G., and Lin, S.: The influence of dust on quantitative measurements of black carbon in ice and snow when using a thermal optical method, Aerosol Sci. Technol., 46, 60–69, https://doi.org/10.1080/02786826.2011.605815, 2012.
Warren, S. G. and Wiscombe, W. J.: A model for the spectral albedo of snow. II: Snow containing atmospheric aerosols,J. Atmos. Sci., 37, 2734–2745, https://doi.org/10.1175/1520-0469(1980)037<2734:AMFTSA>2.0.CO;2, 1980.
Zdanowicz, C., Gallet, J.-C., Björkman, M. P., Larose, C., Schuler, T., Luks, B., Koziol, K., Spolaor, A., Barbaro, E., Martma, T., van Pelt, W., Wideqvist, U., and Ström, J.: Elemental and water-insoluble organic carbon in Svalbard snow: a synthesis of observations during 2007–2018, Atmos. Chem. Phys., 21, 3035–3057, https://doi.org/10.5194/acp-21-3035-2021, 2021.
Zhang, Y., Kang, S., Sprenger, M., Cong, Z., Gao, T., Li, C., Tao, S., Li, X., Zhong, X., Xu, M., Meng, W., Neupane, B., Qin, X., and Sillanpää, M.: Black carbon and mineral dust in snow cover on the Tibetan Plateau, The Cryosphere, 12, 413–431, https://doi.org/10.5194/tc-12-413-2018, 2018.
- Abstract
- Introduction
- Sampling, sample preparation and analysis
- Results and discussion
- Conclusions
- Appendix A: Use of coagulant in melted snow samples?
- Appendix B: Sampling, processing and evaluation of dust from long-range transport and local sources
- Appendix C: Further information on the fit between the Fe loading and ΔATN700−450
- Data availability
- Author contributions
- Competing interests
- Disclaimer
- Acknowledgements
- Review statement
- References