the Creative Commons Attribution 4.0 License.
the Creative Commons Attribution 4.0 License.
 | 16 Mar 2026
Brief communication: Updated grounding line mapping in the Amundsen Sea Embayment, Antarctica, from one day repeat Sentinel-1 SAR data
Jonas K. Andersen
Romain Millan
Eric Rignot
Lucille Gimenes
Bernd Scheuchl
Jean Baptiste Barré
Anders A. Bjørk
Knowledge of Antarctic glacier grounding lines, which mark the transition between grounded and floating ice, is a vital parameter in determining the stability of major ice shelves and hence the ice sheet. Rapid grounding line retreat and associated mass loss has been documented at numerous Antarctic glaciers, particularly in the Amundsen Sea Embayment. However, few comprehensive grounding line mappings exist, particularly from recent years. Here, we utilize a unique record of Sentinel-1 Synthetic Aperture Radar 1 d repeat-pass imagery to generate a comprehensive retrieval of grounding line location in the Amundsen Sea Embayment in 2025 and evaluate recent changes.
- Article
(7281 KB) - Full-text XML
-
Supplement
(9714 KB) - BibTeX
- EndNote


Mass loss from the Antarctic Ice Sheet has increased over the past four decades, mainly due to speed-up and increased ice discharge of glaciers in West Antarctica (Otosaka et al., 2023). Mass loss from this sector increased from 39.5 ± 19 Gt yr−1 during 1992–2001 to 103.6 ± 10.8 Gt yr−1 during 2002–2020 (Otosaka et al., 2023). Glacier acceleration is linked to ice shelf weakening, driven by the intrusion of warm, saline circumpolar deep water beneath floating ice, which enhances basal melting (Holland et al., 2023). Melting peaks near the grounding line (GL), the boundary between grounded and floating ice. As warm and saline circumpolar deep water is advected below the ice shelf, GL retreat into deeper basins accelerates ice flow and dynamic thinning, further promoting retreat and decreasing the buttressing potential of the shelf (Schmidtko et al., 2014; Holland et al., 2023; Joughin et al., 2014). In the Amundsen Sea Embayment (ASE), located at the West Antarctic Ice Sheet (Fig. 1) and holding a 1.26 ± 0.02 m potential sea level rise (Morlighem et al., 2020), monitoring of GL locations is of particular interest due to their documented rapid retreat into drainage basins deep below sea level, which will likely lead to further instabilities and mass loss in the future (Mouginot et al., 2014; Park et al., 2013; Rignot et al., 2014; Scheuchl et al., 2016).
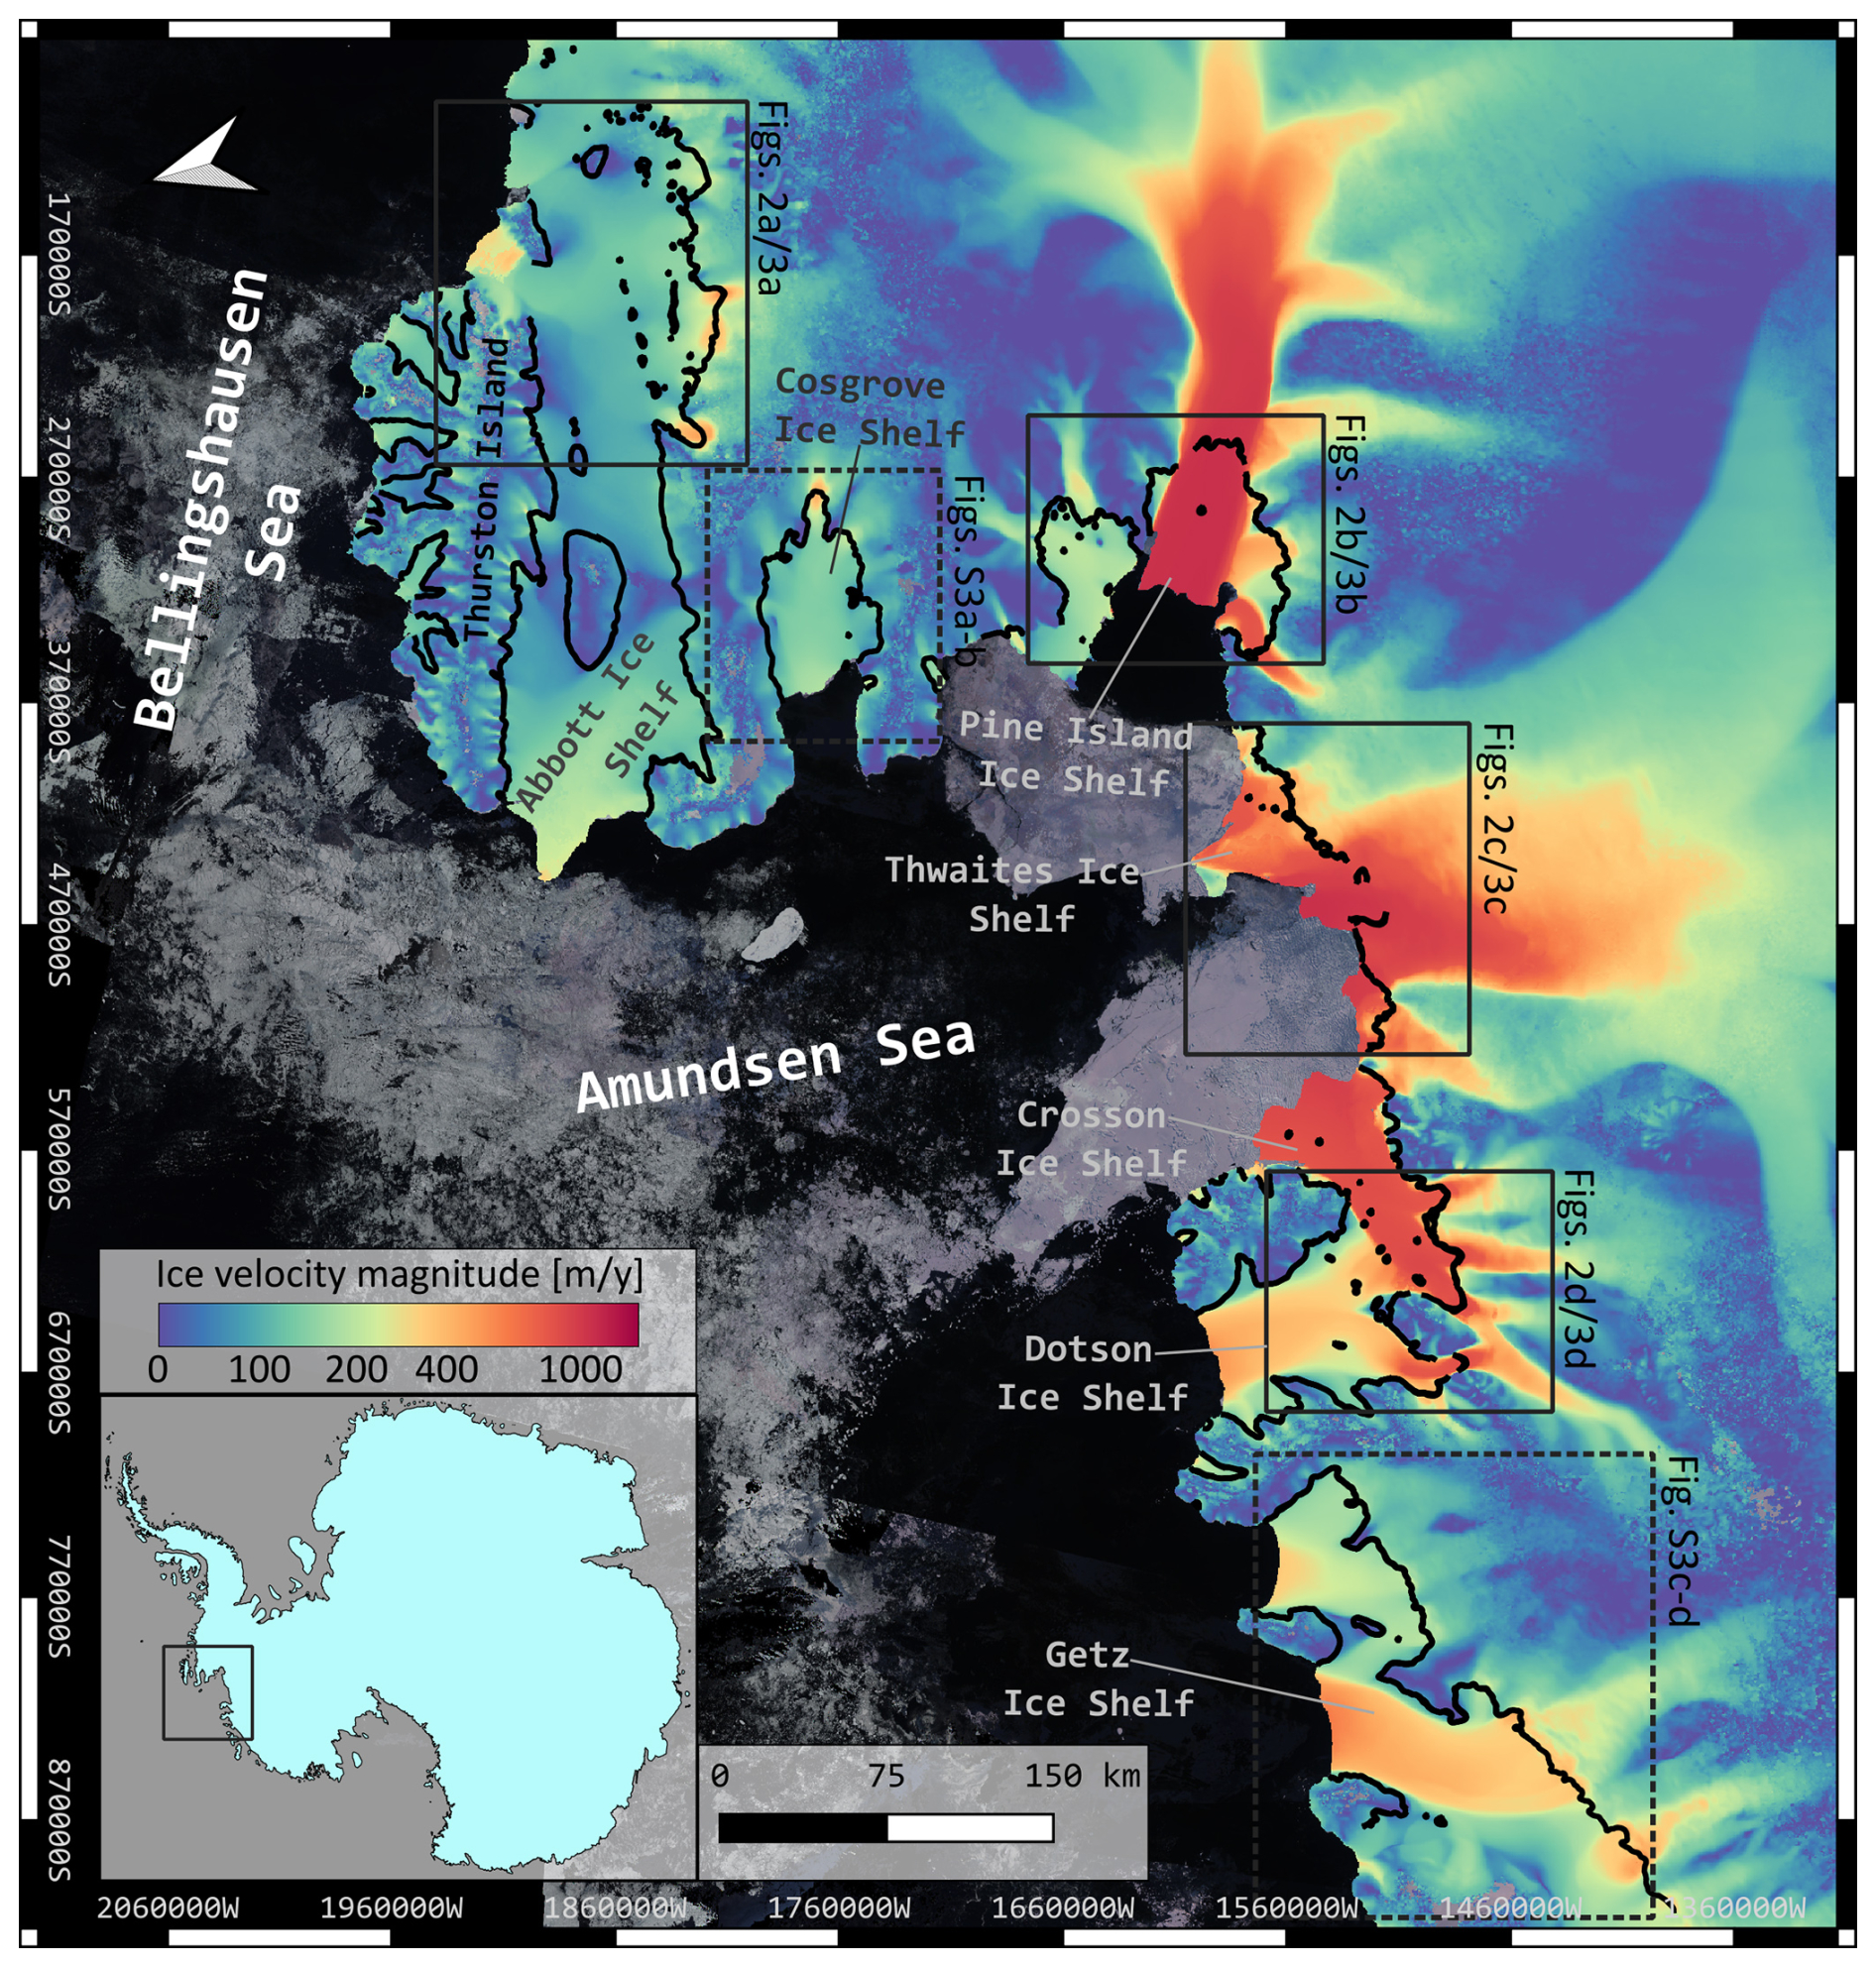
Figure 1Overview of Sentinel-1 2025 Amundsen Sea Embayment grounding line delineations (black lines), overlaid on an ice velocity mosaic from MEaSUREs (Rignot et al., 2017), clipped to the 2025 ice shelf extent (as derived from Sentinel-1 intensity images). Black rectangles indicate spatial extents of panels (a)–(d) in Figs. 2 and 3, while dashed rectangles show extents for Fig. S3. Background map is a Sentinel-2 true color mosaic from January–March 2025 and map projection is EPSG:3031 (arrow in top left corner shows true north).
Given the GL's critical role in Antarctic ice sheet stability and mass loss, accurate information on its evolution is essential for better constraining ice-ocean interactions and predicting the ice sheet's future evolution and its contribution to sea-level rise. Thus, extensive and repeated observations of this critical boundary are essential (Konrad et al., 2018; Rignot, 2023). The need for frequent observations is compounded by the fact that the true GL fluctuates during a tidal cycle within an ice grounding zone, which may be several kilometers wide, depending on factors such as tide magnitude, ice thickness, and bedrock slope (Fricker and Padman, 2006; Freer et al., 2023; Milillo et al., 2022; Rignot et al., 2024).
While in-situ methods for observing GL location have been demonstrated (e.g., Le Meur et al., 2014), remote sensing techniques offer a more feasible alternative for large-scale, repeated retrievals. Several remote sensing techniques have been applied including phase-based and amplitude-based processing of satellite Synthetic Aperture Radar (SAR) data, repeat laser or radar altimetry, and optical imagery – a comprehensive review of these methods is provided by Friedl et al. (2020). The most accurate retrievals are obtained from double-difference SAR interferometry (Rignot, 1996; Friedl et al., 2020) (described in Sect. 2.2). This technique has been used to map GLs across the Antarctic Ice Sheet, with the ERS-1/2 satellites allowing for a particularly extensive coverage, however only during periods where the satellites flew in short repeat-pass constellations (i.e., the 1 d tandem phases during 1995–1996 and 1999–2000 and the 3 d ice phases during 1991–1992, 1994, and 2011) (Rignot et al., 2016). While the temporal resolution of these acquisitions was limited to discrete intervals, precluding a full delineation of the grounding zone, the ERS imagery enabled the detection of rapid and widespread GL retreat across West Antarctica during the 1991–2011 period (Rignot et al., 2014). Recent advances using data from the Sentinel-1 archive provided a continent-wide estimate of the grounding zone, through a dense time series of automated interferometry-based GL retrievals from 2018 (Mohajerani et al., 2021). However, this retrieval was limited by the relatively long repeat-pass period of Sentinel-1 (6 or 12 d), hindering delineations in the fastest-changing sectors, where strong decorrelation occurs in central glacier trunks experiencing the highest GL retreat. Some previous studies have acquired commercial/non-public SAR data with short repeat-pass periods to provide well-resolved GL retrievals over specific glaciers (e.g., Rignot et al., 2024; Milillo et al., 2022). However, no public, routinely acquired SAR data with a repeat-pass period short enough to provide adequate GL delineations over the fastest-changing glaciers in the ASE currently exists.
Here, we use Sentinel-1 imagery with a 1 d repeat-pass period, acquired during January–March 2025 for the in-orbit commissioning of Sentinel-1C, to delineate glacier GLs across the ASE. The short repeat-pass data allows for several well-resolved, contemporary delineations of ASE GLs, most of which have been mapped only rarely in the past decade and, to our knowledge, not at all since 2020 or earlier.
2.1 Sentinel-1 data
The EU Copernicus Sentinel-1 satellite constellation nominally consists of two C-band SAR satellites, orbiting in a polar, sun-synchronous orbit 180° out of phase. The orbit repeat-pass period is 12 d, yielding a 6 d repeat-pass period with two active satellites. Sentinel-1A, launched in April 2014, remains active, while Sentinel-1B (launched in July 2016) ceased operations on 23 December 2021 due to a power system failure. Consequently, dense 6 d repeat-pass coverage was available across the Antarctic and Greenland ice sheet margins from 2016 to 2021. From 2022 to early 2025, the constellation operated with only Sentinel-1A, yielding 12 d temporal baselines. The launch of Sentinel-1C on 5 December 2024, followed by its in-orbit commissioning (completed in May 2025), restored 6 d repeat coverage. Sentinel-1D was successfully launched on 4 November 2025, and is currently undergoing in-orbit commissioning.
A short temporal baseline (i.e., the time separation of images) in interferometric SAR processing is vital, as increased baselines generally lead to increased decorrelation. In many parts of the marginal Antarctic and Greenland ice sheets high flow speeds, shear deformation, snowfall and redistribution, and/or surface melt yield total decorrelation for 6 or 12 d Sentinel-1 image pairs all year, precluding the retrieval of flow speeds or GL delineations.
During the in-orbit commissioning phase of Sentinel-1C, the satellite was temporarily placed in a 1 d offset orbit relative to Sentinel-1A from 17 January to 7 March 2025. A total of 166 Single Look Complex image slices, covering four orbit tracks (see Fig. S1 in the Supplement) in the Interferometric Wide swath mode, were acquired from both satellites over the marginal Antarctic Ice Sheet in the ASE (Fig. 1). These 1 d repeat retrievals form the basis of our updated 2025 GL delineations.
2.2 Double-difference interferometry for grounding line detection
Differential SAR interferometry (DInSAR) measures the phase difference between two subsequent SAR acquisitions, which, after correcting for satellite geometry and surface topography (using a Digital Elevation Model), is proportional to surface displacement in the radar line-of-sight (LoS) direction (Massonnet et al., 1993). Because the LoS vector has both vertical and horizontal components, phase changes can reflect motion in either direction:
By differencing two sequential DInSAR measurements, a technique known as double-difference interferometry, we isolate changes in LoS displacement between the two time intervals. If horizontal velocity remains steady, these differences primarily reflect changes in vertical displacement:
Over floating ice shelves, tidal variations between acquisitions often produce different vertical motion contributions between repeat passes, leading to measurable double-difference phase signals in the form of dense fringes, while the (presumed) constant horizontal flow contribution cancels out. The inland limit of these fringes marks the limit of tidal flexure of the ice, which approximately coincides with the GL, although the true GL will generally lie slightly seaward of the flexure limit (Fricker and Padman, 2006). This approach is widely regarded as one of the most accurate remote sensing methods for GL detection and has been applied with various SAR sensors (Rignot, 1996; Joughin et al., 2010; Friedl et al., 2020).
Differential interferograms were processed using the workflow outlined in Andersen et al. (2020). The REMA DEM at 100 m resolution (Howat et al., 2022) and MEaSUREs Antartica Ice Velocity product at 450 m resolution (Rignot et al., 2017) were applied in the refined coregistration procedure, and all images from each respective track were resampled to the same reference image. We use Precise Orbit Ephemerides (POE) to update orbit state vectors only for Sentinel-1A acquisitions, as POE products for Sentinel-1C were not available for this period. Finally, double-difference interferograms are then formed simply by differencing the phase images of sequential interferograms.
GLs were manually digitized at the inland limit of the tide-induced fringe patterns (see Fig. 2). A separate delineation was generated for each available double-difference interferogram, digitizing all resolvable (coherent) GL features within the given product. We also digitize pinning points, i.e. localized areas of the ice shelf that stick to bathymetric highs and act to buttress and stabilize ice flow.
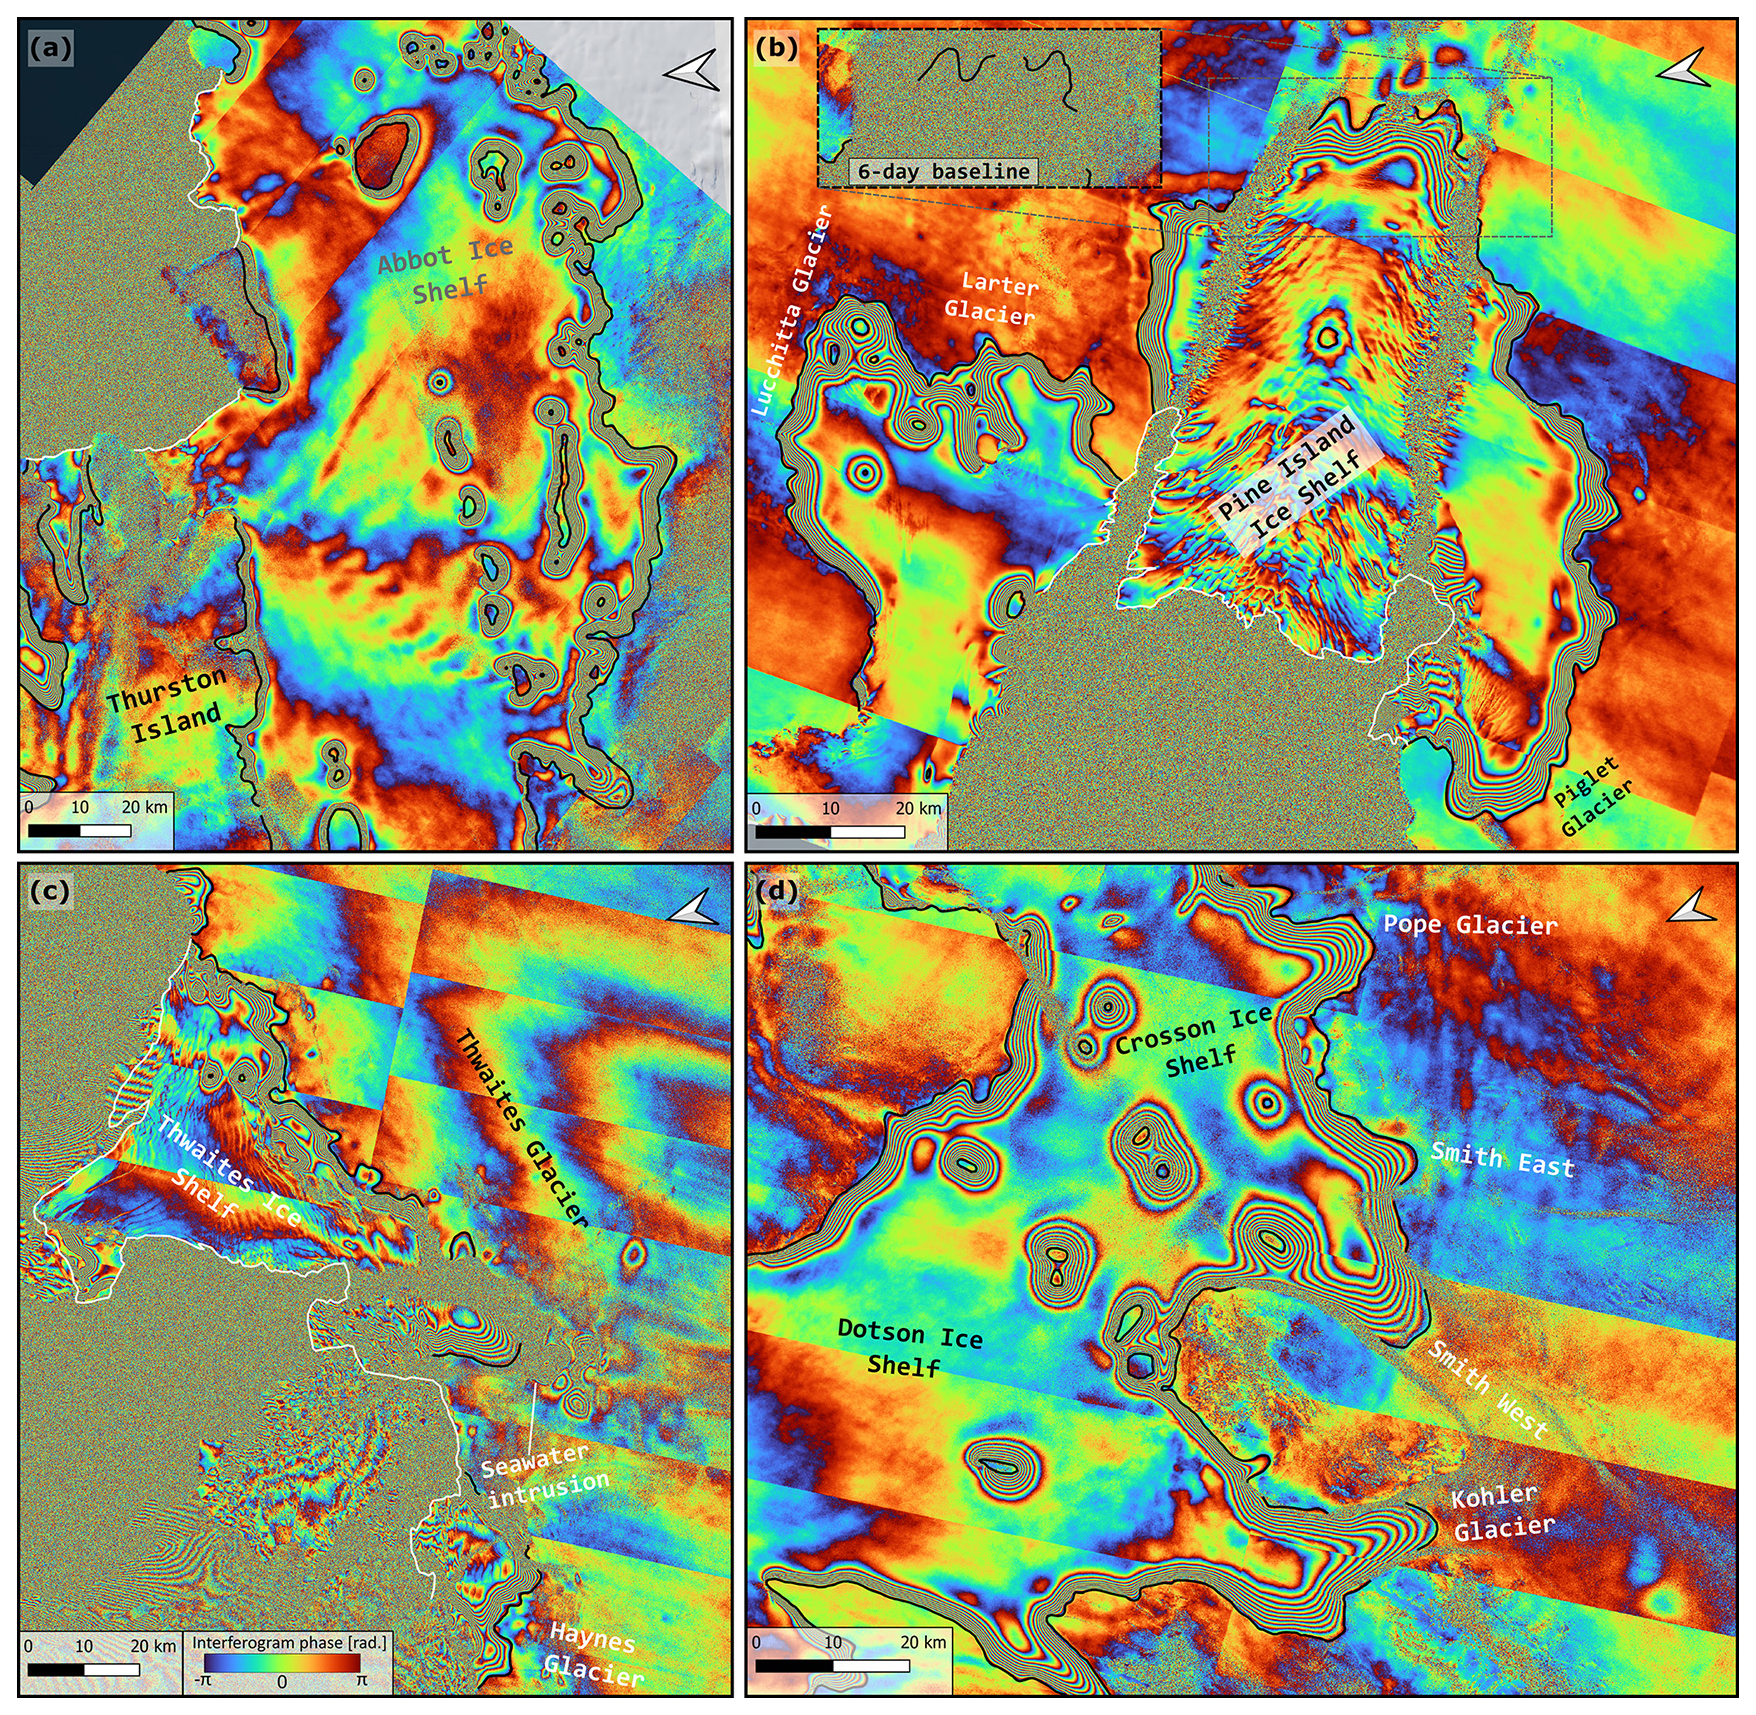
Figure 2Sentinel-1 1 d repeat double-difference interferograms from 2025 covering Abbot Ice Shelf (a), Pine Island Ice Shelf (b), Thwaites and Haynes glaciers (c), Pope, Smith, and Kohler glaciers (d). Acquisition times and corresponding relative and maximum sea surface height estimates (Sect. S1) are provided in Table S1. Sentinel-1 2025 grounding line delineations are indicated by black lines. Inset in (b) contains an example double-difference interferogram using 6 d baseline imagery (Fig. S6), which shows complete loss of coherence. White lines show 2025 ice shelf calving fronts and top right arrows indicate true north.
Figure 1 shows an overview of the 2025 ASE GL delineations from available Sentinel-1 1 d repeat imagery (see Table S1 in the Supplement), spanning the coast from Abbot Ice Shelf to Getz Ice Shelf. Figure 2 shows examples of Sentinel-1 1 d double-difference interferograms and associated GL delineations for four of the regions highlighted in Fig. 1. The interferograms are generally highly coherent and at least one contiguous GL delineation was mapped for nearly the entire coast, with a few exceptions in zones of high velocity gradients at Thwaites, Pine Island, and Kohler glaciers, which lead to decorrelation even with the 1 d repeat pass period. For the majority of the region, multiple GL delineations were made spanning different tidal and atmospheric conditions (Sect. S1 and Table S1 in the Supplement). GLs near the Abbott and Cosgrove ice shelves were captured in 1–2 delineations, while the remaining regions were captured in 3–7 separate retrievals. While this sampling density is insufficient to robustly resolve the full grounding zone, the availability of multiple delineations enables partial observation of short-term, tide- and pressure-induced GL variability. Examples of such short-term GL migration, varying from a few hundred meters to several kilometers, are shown in Fig. S2 in the Supplement.
Figure 3 shows a comparison between the new 2025 GL delineations and the MEaSUREs Antarctica grounding line product (Rignot et al., 2016), which contains retrievals from the period 1992–2014 for nearly the full region, the ESA CCI grounding line product (ESA AIS CCI, 2021), containing retrievals from the period 1994–2020 for select glaciers, and the COSMO-SkyMed grounding line dataset from Milillo et al. (2022), covering the Pope, Smith, and Kohler glaciers during 2016–2020, overlaid on the BedMachine v3 bed elevation product (Morlighem, 2022). These historic GL products generally rely on single or sporadic acquisitions per year and therefore represent snapshots of the GL at varying tidal and atmospheric conditions, rather than the full grounding zone. In contrast, the deep learning-based 2018 GL dataset of Mohajerani et al. (2021), although not covering the fastest-flowing glaciers (e.g., Pine Island, Thwaites, Smith), provides an estimate of grounding zone width based on all available 2018 Sentinel-1 data. In the ASE, grounding zone widths inferred from this product vary from less than 1 km to locally more than 5 km.
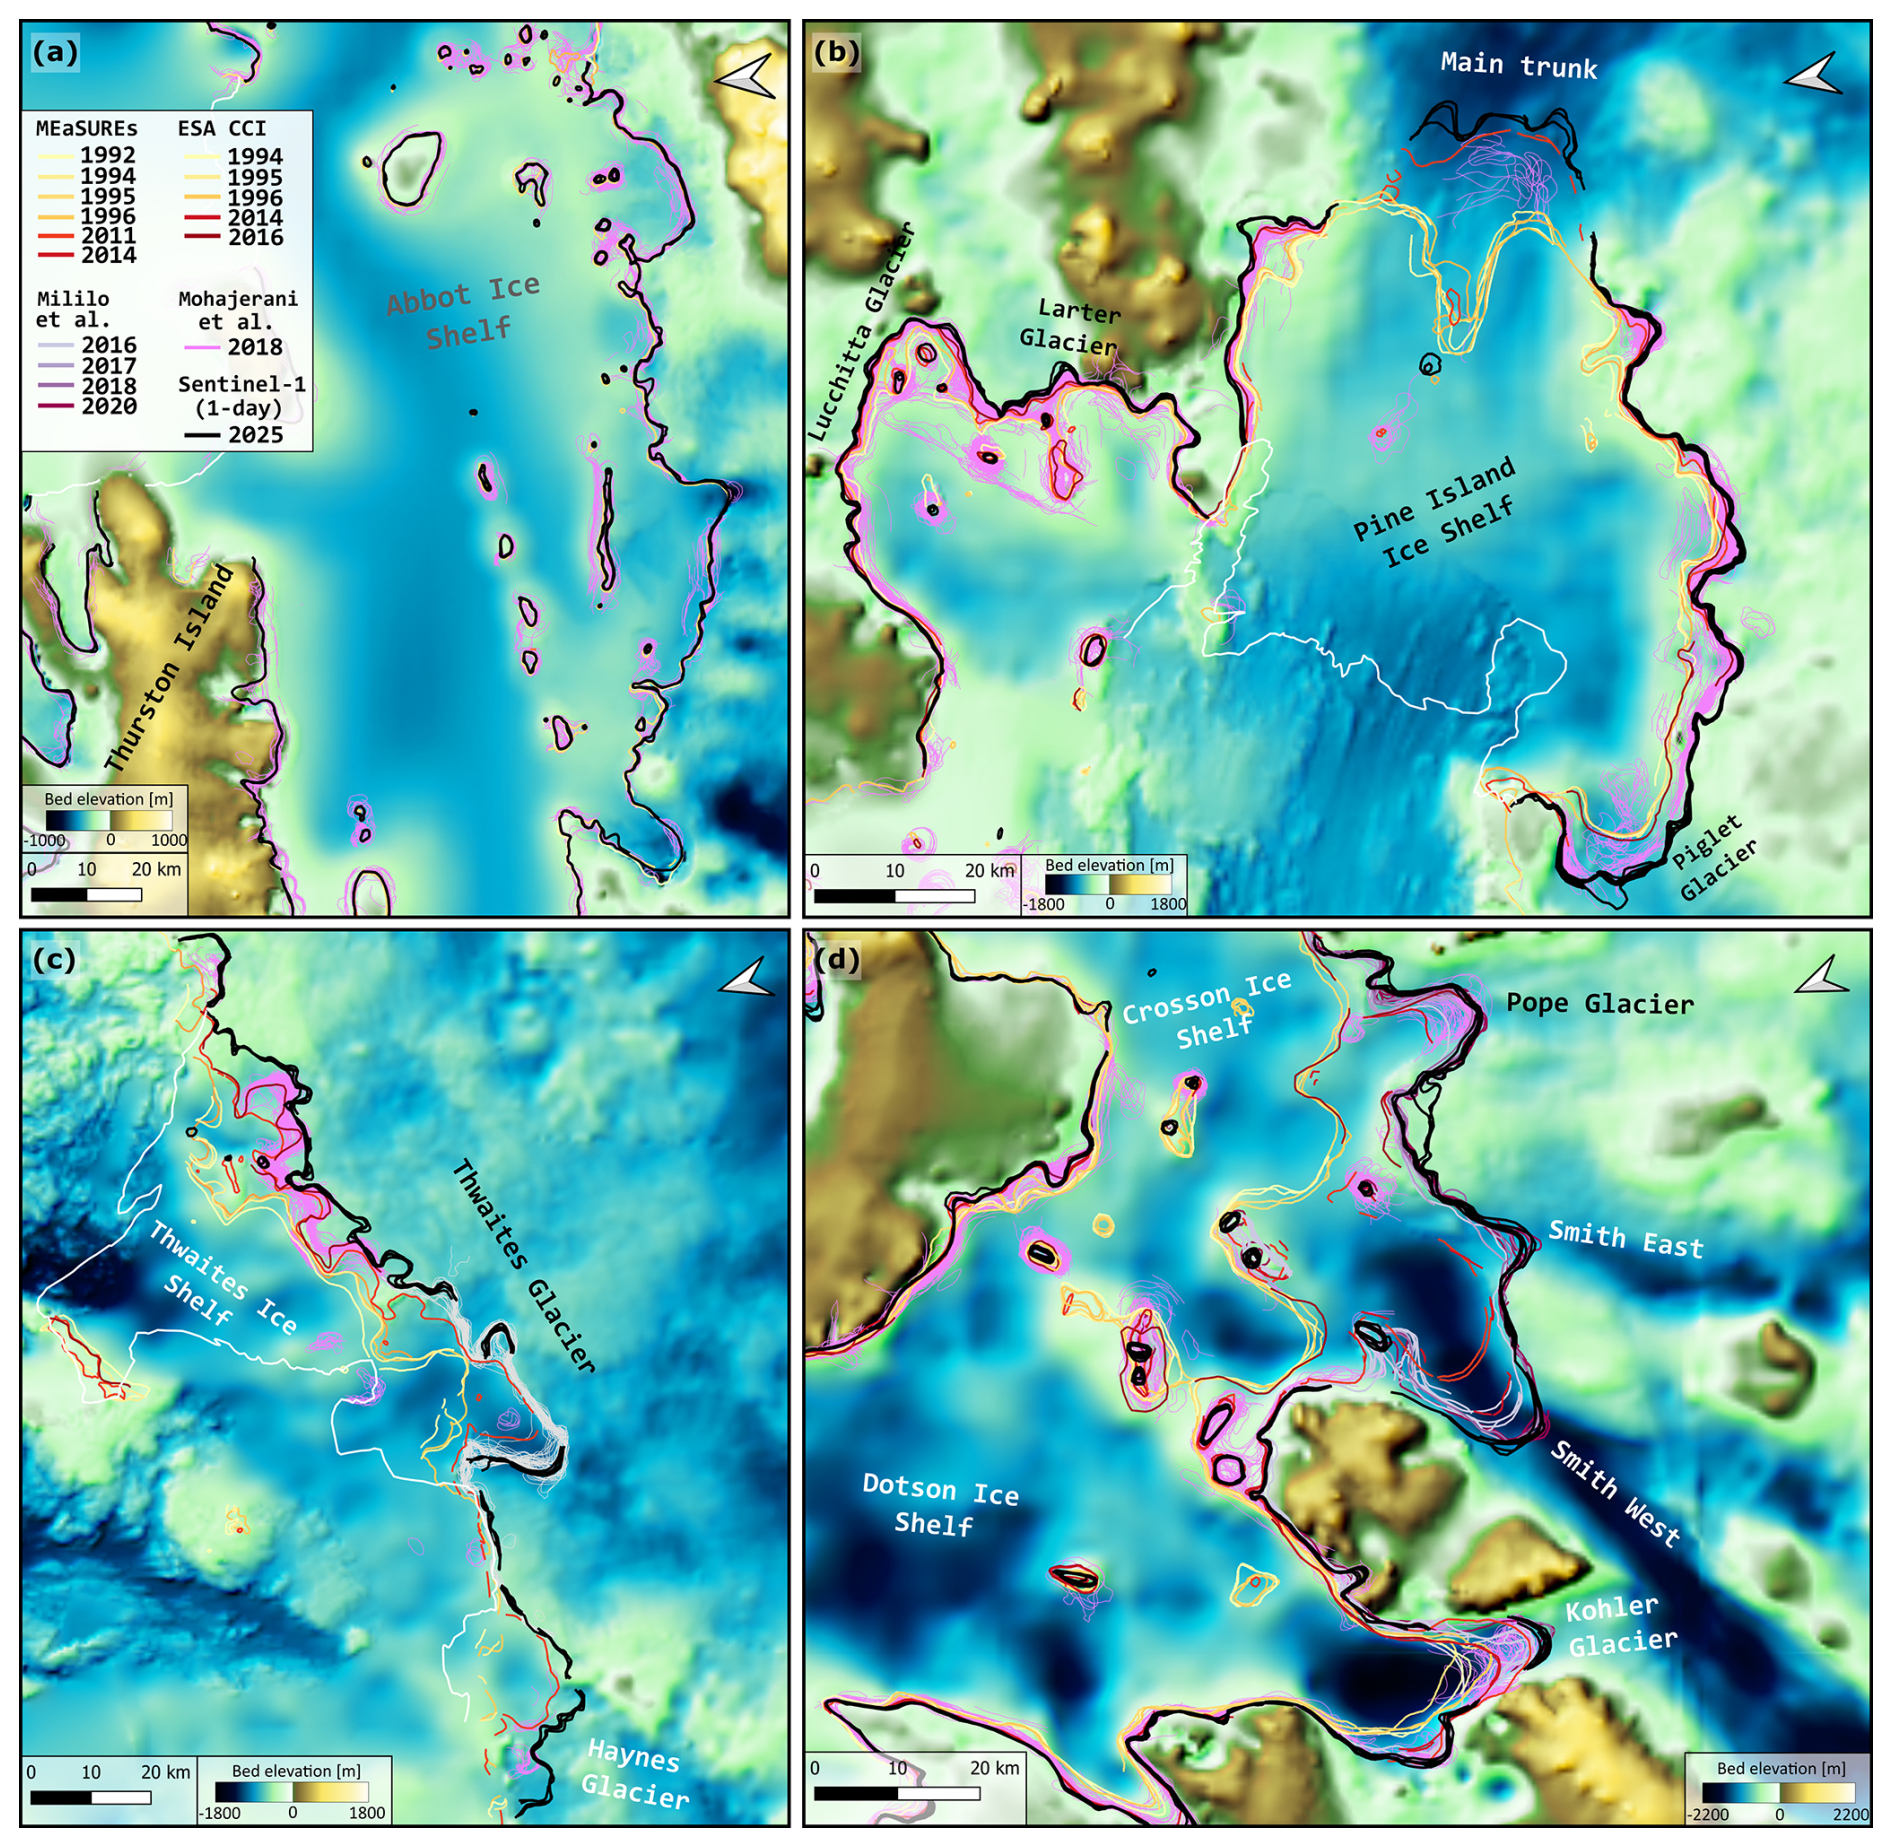
Figure 3Grounding line changes at Abbot Ice Shelf (a), Pine Island Ice Shelf (b), Thwaites and Haynes glaciers (c), Pope, Smith, and Kohler glaciers (d). Background map shows bed elevation from BedMachine v3 (Morlighem, 2022) and white lines indicate 2025 ice shelf calving fronts. The 2025 Sentinel-1 grounding line product is indicated by black lines, while the MEaSUREs (Rignot et al., 2016), ESA AIS CCI (2021), Milillo et al. (2022), and Mohajerani et al. (2021) grounding line products are indicated by various colors, depending on retrieval year (see legend in panel a). Grey lines in (c) show grounding line delineations from Rignot et al. (2024).
Taken together, these differences in temporal sampling imply that apparent GL advances or retreats between products, particularly between single-acquisition historic delineations and the 2025 retrievals, should be interpreted with caution. Where offsets of several kilometers are observed, part of the apparent change may reflect the incomplete capturing of the grounding zone, rather than solely long-term migration. The 2025 dataset occupies an intermediate position between single-acquisition historical products and fully resolved grounding zone estimates, providing improved, although partial, constraints on short-term GL variability.
At Abbot Ice Shelf, which extends from the Bellingshausen Sea into the ASE, the GL remains almost completely unchanged since the 1990s, with the 2025 delineation lying within ±1 km of the 1992/95 position almost everywhere (Fig. 3a), which in turn aligns well with the 2018 grounding zone (Mohajerani et al., 2021). Christie et al. (2016) found a widespread but modest GL retreat during 1990–2015 (<1 km for most sectors but locally as high as 3 km). Such a retreat does not appear to have continued into the 2015–2025 period. The locations of pinning points observed in 2025 remain nearly identical to the 1992/95 positions (Fig. 3a). Owing to its stability relative to the neighboring ice shelves in the ASE, the Abbot Ice Shelf remains less studied, however, previous work has identified an onset of dynamic thinning following a flow speed-up at the grounding zone (Chuter et al., 2017), and the ice shelf has been suggested to be vulnerable to incoming warm circumpolar deep water (Christie et al., 2016). The 2025 GL delineations also provide coverage over nearly the entire coast of Thurston Island (Fig. 1), most of which is not captured in historic products (Rignot et al., 2016; ESA AIS CCI, 2021).
Similarly, the neighboring Cosgrove Ice Shelf shows no apparent GL changes since the 1992–2018 period, with the 2025 delineation lying within a few hundred meters of the 2011 retrieval almost everywhere (Fig. S3a and b in the Supplement). An exception is observed in the central, fastest-flowing trunk, where the 2025 GL lies 1–2 km inland from the 2011 delineation, although still remaining well within the 2018 grounding zone, which is observed to be wider in this sector (Mohajerani et al., 2021). The apparent stability is not surprising, as the Cosgrove GL is situated on a predominantly prograde bed (Fig. S3b). Only a single double-difference interferogram could be generated for this region, so any short-term, tide-induced GL migration is not captured by our product.
The fastest-flowing sector of the Getz Ice Shelf is not covered by the Sentinel-1 1 d repeat data set. For the rest of the ice shelf, we compare the 2025 GL delineations with the 2018 retrievals from Mohajerani et al. (2021) and note that the 2025 GL lies approximately within the estimated 2018 grounding zone, with a few local exceptions, in which the 2025 GL appears to lie 1–2 km inland (Fig. S3c and d).
At Pine Island Ice Shelf, the main trunk GL shows an apparent further retreat of approximately 2–7 km since 2011, following a larger retreat of 15–20 km during 1992–2011. In the main trunk of the glacier – the region with the fastest ice flow – the northern section has retreated by up to 7 km, while the central part has pulled back by approximately 1–3 km. The southern section of the main trunk appears to have been dislodged from a sill in the bedrock topography at a depth of −1000 m and subsequently retreated by around 5 km (Fig. 3b). In this critical part of the glacier, where ice discharge is at its maximum, the GL has retreated more significantly along the northern and southern flanks than at the center. The southern tributary glacier, sometimes referred to as Piglet Glacier, which flows toward the Pine Island Ice Shelf front, has experienced widespread GL retreat during 2016–2018, averaging around 3 km with localized retreats reaching up to 6 km, particularly in areas where the bedrock slope is slightly retrograde. In 2025, we observe an additional apparent retreat of around 2 km, compared to the 2018 grounding zone (Fig. 3b). Conversely, at the northern tributaries (Lucchitta and Larter glaciers), the GL has remained relatively stable, situated on a more pronounced, mountainous, and prograde topography (Fig. 3b). Finally, the 2025 interferograms show the presence of a pinning point in the central part of the ice shelf (Fig. 2b), which has previously been identified as an ephemeral feature (Qian et al., 2025; Rignot et al., 2014).
The Thwaites Ice Shelf GL has shown a spatially varying retreat since 1992, ranging from <1 to 20 km, (Milillo et al., 2019; Rignot et al., 2014, 2024). The highest retreat rates are associated with ice shelf basal channels, which enhance basal melt rates, and steep retrograde bed slopes (Chartrand et al., 2024). In the eastern sector, where the ice shelf is largest, we observe local retreats spanning 3–8 km, when comparing to the 2018 grounding zone (Mohajerani et al., 2021). In the western sector, the 2025 GL delineations (Fig. 3c) lie within the 2023 grounding zone measured by Rignot et al. (2024) using commercial ICEYE data. Loss of coherence in parts of the fastest-flowing sector leads to local discontinuities in the 2025 delineations. We observe indications of apparent seawater intrusions behind the Thwaites GL, which may enhance basal melting under grounded ice, in the same location reported by Rignot et al. (2024) in March–June 2023 (Figs. 2c and S4 in the Supplement), suggesting that these intrusions persistently reoccur. Recent work also documented how subglacial discharge from upstream lake drainages previously enhanced ocean melting near the GL in the same sector as the observed seawater intrusions, promoting further retreat (Gourmelen et al., 2025).
Figure 3d shows an overview of the system of Pope, Smith, and Kohler glaciers, which feed the Crosson and Dotson ice shelves. At the main trunk of Pope Glacier, the 2025 GL remains at the 2018–2020 position, following an apparent 6 km retreat during 2014–2018 (and a ∼15 km retreat during 1996–2014). Scheuchl et al. (2016) noted that a prograde bedrock slope beginning 4.5 km behind the 2014 GL position might limit further GL retreat, perfectly in line with our observations. A similar pattern is observed at Smith Glacier. Both of the Smith East and Smith West GLs remain at their 2018–2020 positions, following a 5–6 km retreat during 2014–2020. Both GLs now sit at flat or slightly prograde bed slopes, after having retreated past retrograde slopes during 1992–2016 (Scheuchl et al., 2016; Milillo et al., 2022). Contrary to Pope, however, both Smith East and Smith West will encounter retrograde bed slopes again if GL retreat continues another 3–7 km (Fig. 3d).
The Kohler Glacier GL retreated 8 km during 1992–2011, re-advanced 4.5 km during 2011–2014, then retreated 7 km during 2014–2020. The 2025 GL now sits approximately at the 2018–2020 position, about 3 km from the top of a steep prograde slope (Milillo et al., 2022).
The abated GL retreat during 2018–2025 of Pope, Smith, and Kohler (compared to the preceding decades) is associated with a shift in the ice flow regime: Selley et al. (2025) observed near-steady flow speeds during the 2015–2022 period for all glaciers, whereas all glaciers showed rapid flow acceleration for all or parts of the 2005–2015 period.
Finally, we note apparent GL retreat at a series of smaller glaciers, including Bunner, Holt, McClinton, Singer, and Philbin Inlet glaciers (Fig. S5 in the Supplement). These glaciers generally exhibit wide grounding zones (5–10 km), as estimated from 2018 data (Mohajerani et al., 2021), complicating the prescription of long-term migration based on few observations. However, we note that all 2025 GL delineations (3–5 retrievals per glacier) lie at the inland limit of the 2018 grounding zones, with only a small fraction (or none) of the 2018 delineations extending comparably far inland, suggesting a potential modest retreat. The clearest example is Holt Glacier, for which 2025 delineations lie 2–3 km inland of any 2018 retrievals (Fig. S5a).
Continually updated retrievals of glacier GLs are essential for understanding the ongoing rapid mass loss from the ASE as well as detecting early signs of retreat and instability at other ice shelves (Li et al., 2023; Brancato et al., 2020; Milillo et al., 2019; Millan et al., 2022). Existing spatially comprehensive GL products are based primarily on data from ERS-1/2, Sentinel-1, and TerraSAR-X/TanDEM-X with additional retrievals from Radarsat-1/2, ALOS PALSAR, and COSMO-SkyMed (Rignot et al., 2016; Mohajerani et al., 2021; Milillo et al., 2022; ESA AIS CCI, 2021). The vast majority of well-resolved, contiguous GL delineations, however, come from short repeat-pass SAR acquisitions, such as ERS-1/2 imagery from the tandem mission phase (1 d repeat-pass, 1995–1996 and 1999–2000) and the ice phase (3 d repeat-pass, winters of 1991/92 and 1993/94 and 2011) (Rignot et al., 2016; Friedl et al., 2020). Other studies have used short repeat-pass data from non-public/commercial SAR satellites, allowing for highly resolved GL retrievals at specific glaciers (e.g., Milillo et al., 2019; Rignot et al., 2024). No current satellite mission provides publicly available, short (<6 d) repeat-pass SAR data, and no sensors acquire routine short repeat-pass data with a large-scale (i.e., ice sheet-wide) coverage. This lack of short-repeat pass data remains the limiting factor for routinely retrieving GL locations, particularly for the most vulnerable and rapidly changing regions of the ice sheet (Friedl et al., 2020). In this context, the Sentinel-1 1 d repeat-pass acquisition campaign during the Sentinel-1C commissioning phase clearly demonstrates the potential for operational short-repeat SAR acquisitions in large-scale, high-resolution GL monitoring. Figures 2b and S6 in the Supplement illustrate the significant improvement in coherence achieved with 1 d repeat data compared to longer baseline interferograms. The launch of Sentinel-1D may provide another opportunity for acquiring 1 d repeat imagery and hence GL delineations similar to the ones presented here.
We have presented a 2025 grounding line dataset in the Amundsen Sea Embayment featuring multiple acquisitions with near-contiguous coverage, based on a, to date, unique set of Sentinel-1 1 d repeat-pass data. GLs in the ASE have been mapped with a relatively coarse temporal resolution over the past three decades and, to our knowledge, a majority of GLs have not been mapped since the 2018–2020 period (Mohajerani et al., 2021; Milillo et al., 2022), so the 2025 dataset serves as an important acquisition in maintaining a consistent time series for the region. Future GL retrievals will be needed to monitor both the ongoing retreat at glaciers such as Pine Island and Thwaites as well as the potential onset of GL retreat, and hence instability, at other ice shelves such as Abbot, Cosgrove, and Getz.
The 2025 GL retrievals highlight areas of continued vulnerability, particularly at Pine Island and Smith glaciers, where the GLs are situated at or near retrograde bed slopes. At Pine Island, retreat into deeper terrain will further enhance discharge, while continued retreat at Smith could soon lead to renewed instability as the glacier enters another retrograde section of the bed. These configurations emphasize the value of high-resolution, repeated GL observations to track evolving glacier stability.
The 2025 Amundsen Sea Embayment grounding line product, along with geocoded Sentinel-1 double-difference interferograms used for delineations, is available at https://doi.org/10.5281/zenodo.18503724 (Andersen et al., 2025). Sentinel-1/2 imagery, including Precise Orbit Ephimeredes, is available at https://dataspace.copernicus.eu/ (last access: 13 August 2025). The MEaSUREs Antarctica grounding line product is available at https://doi.org/10.5067/IKBWW4RYHF1Q (Rignot et al., 2016) and the ESA CCI Antarctica grounding line product is available at https://climate.esa.int/en/projects/ice-sheets-antarctic/ (last access: 15 July 2025) (ESA AIS CCI, 2021). The MEaSUREs Antarctica velocity mosaic is available at https://doi.org/10.5067/D7GK8F5J8M8R (Rignot et al., 2017), the BedMachine v3 bed elevation product is available at https://nsidc.org/data/nsidc-0756/versions/3 (last access: 29 August 2025) (Morlighem, 2022), and the REMA Digital Elevation Model is available at https://doi.org/10.7910/DVN/EBW8UC (Howat et al., 2022).
The supplement related to this article is available online at https://doi.org/10.5194/tc-20-1589-2026-supplement.
J.K.A., A.A.B., and E.R. designed the study. J.K.A., J.B.B., and L.G. carried out data processing, with analysis contributions from all authors. J.K.A. and R.M. wrote the initial draft of the manuscript, with editing from all other authors.
The contact author has declared that none of the authors has any competing interests.
Publisher's note: Copernicus Publications remains neutral with regard to jurisdictional claims made in the text, published maps, institutional affiliations, or any other geographical representation in this paper. The authors bear the ultimate responsibility for providing appropriate place names. Views expressed in the text are those of the authors and do not necessarily reflect the views of the publisher.
We thank Nuno Miranda and ESA for publicly providing the 1 d repeat Sentinel-1 data. The authors thank Bryony Freer, one anonymous referee, and editor Nicholas Barrand for their helpful comments, which greatly improved the paper.
This research has been supported by the Villum Fonden (grant no. 29456), the Danmarks Frie Forskningsfond (grant no. 10.46540/2064-00050B), the HORIZON EUROPE European Research Council (grant no. 10116439), the National Aeronautics and Space Administration (grant nos. 80NSSC23K0177, 80NSSC23M0146, and 80NSSC20K1076), and the National Science Foundation (grant no. 1739003).
This paper was edited by Nicholas Barrand and reviewed by Bryony Freer and one anonymous referee.
Andersen, J. K., Kusk, A., Boncori, J. P. M., Hvidberg, C. S., and Grinsted, A.: Improved Ice Velocity Measurements with Sentinel-1 TOPS Interferometry, Remote Sens.-Basel, 12, 2014, https://doi.org/10.3390/rs12122014, 2020. a
Andersen, J. K., Millan, R., Rignot, E., Gimenes, L., Scheuchl, B., Barré, J. B., and Bjørk, A. A.: Updated grounding line mapping in the Amundsen Sea Embayment, Antarctica, from 1 d repeat Sentinel-1 SAR data, https://doi.org/10.5281/ZENODO.18503724, 2025. a
Brancato, V., Rignot, E., Milillo, P., Morlighem, M., Mouginot, J., An, L., Scheuchl, B., Jeong, S., Rizzoli, P., Bueso Bello, J. L., and Prats-Iraola, P.: Grounding Line Retreat of Denman Glacier, East Antarctica, Measured With COSMO-SkyMed Radar Interferometry Data, Geophys. Res. Lett., 47, e2019GL086291, https://doi.org/10.1029/2019GL086291, 2020. a
Chartrand, A. M., Howat, I. M., Joughin, I. R., and Smith, B. E.: Thwaites Glacier thins and retreats fastest where ice-shelf channels intersect its grounding zone, The Cryosphere, 18, 4971–4992, https://doi.org/10.5194/tc-18-4971-2024, 2024. a
Christie, F. D. W., Bingham, R. G., Gourmelen, N., Tett, S. F. B., and Muto, A.: Four-decade record of pervasive grounding line retreat along the Bellingshausen margin of West Antarctica, Geophys. Res. Lett., 43, 5741–5749, https://doi.org/10.1002/2016GL068972, 2016. a, b
Chuter, S. J., Martín-Español, A., Wouters, B., and Bamber, J. L.: Mass balance reassessment of glaciers draining into the Abbot and Getz Ice Shelves of West Antarctica, Geophys. Res. Lett., 44, 7328–7337, https://doi.org/10.1002/2017GL073087, 2017. a
ESA AIS CCI: Grounding line for key glaciers, Antarctica, derived from ERS-1/2, TerraSAR-X and Copernicus Sentinel-1 data acquired in 1994–2021, https://climate.esa.int/en/projects/ice-sheets-antarctic/ (last access: 15 July 2025), 2021. a, b, c, d, e
Freer, B. I. D., Marsh, O. J., Hogg, A. E., Fricker, H. A., and Padman, L.: Modes of Antarctic tidal grounding line migration revealed by Ice, Cloud, and land Elevation Satellite-2 (ICESat-2) laser altimetry, The Cryosphere, 17, 4079–4101, https://doi.org/10.5194/tc-17-4079-2023, 2023. a
Fricker, H. A. and Padman, L.: Ice shelf grounding zone structure from ICESat laser altimetry, Geophys. Res. Lett., 33, 2006GL026907, https://doi.org/10.1029/2006GL026907, 2006. a, b
Friedl, P., Weiser, F., Fluhrer, A., and Braun, M. H.: Remote sensing of glacier and ice sheet grounding lines: A review, Earth-Sci. Rev., 201, 102948, https://doi.org/10.1016/j.earscirev.2019.102948, 2020. a, b, c, d, e
Gourmelen, N., Jakob, L., Holland, P. R., Dutrieux, P., Goldberg, D., Bevan, S., Luckman, A., and Malczyk, G.: The influence of subglacial lake discharge on Thwaites Glacier ice-shelf melting and grounding-line retreat, Nat. Commun., 16, 2272, https://doi.org/10.1038/s41467-025-57417-1, 2025. a
Holland, P. R., Bevan, S. L., and Luckman, A. J.: Strong Ocean Melting Feedback During the Recent Retreat of Thwaites Glacier, Geophys. Res. Lett., 50, e2023GL103088, https://doi.org/10.1029/2023GL103088, 2023. a, b
Howat, I., Porter, C., Noh, M.-J., Husby, E., Khuvis, S., Danish, E., Tomko, K., Gardiner, J., Negrete, A., Yadav, B., Klassen, J., Kelleher, C., Cloutier, M., Bakker, J., Enos, J., Arnold, G., Bauer, G., Morin, P., and Polar Geospatial Center: The Reference Elevation Model of Antarctica – Mosaics, Version 2, https://doi.org/10.7910/DVN/EBW8UC, 2022. a, b
Joughin, I., Smith, B. E., and Holland, D. M.: Sensitivity of 21st century sea level to ocean-induced thinning of Pine Island Glacier, Antarctica, Geophys. Res. Lett., 37, 2010GL044819, https://doi.org/10.1029/2010GL044819, 2010. a
Joughin, I., Smith, B. E., and Medley, B.: Marine Ice Sheet Collapse Potentially Under Way for the Thwaites Glacier Basin, West Antarctica, Science, 344, 735–738, https://doi.org/10.1126/science.1249055, 2014. a
Konrad, H., Shepherd, A., Gilbert, L., Hogg, A. E., McMillan, M., Muir, A., and Slater, T.: Net retreat of Antarctic glacier grounding lines, Nat. Geosci., 11, 258–262, https://doi.org/10.1038/s41561-018-0082-z, 2018. a
Le Meur, E., Sacchettini, M., Garambois, S., Berthier, E., Drouet, A. S., Durand, G., Young, D., Greenbaum, J. S., Holt, J. W., Blankenship, D. D., Rignot, E., Mouginot, J., Gim, Y., Kirchner, D., de Fleurian, B., Gagliardini, O., and Gillet-Chaulet, F.: Two independent methods for mapping the grounding line of an outlet glacier – an example from the Astrolabe Glacier, Terre Adélie, Antarctica, The Cryosphere, 8, 1331–1346, https://doi.org/10.5194/tc-8-1331-2014, 2014. a
Li, T., Dawson, G. J., Chuter, S. J., and Bamber, J. L.: Grounding line retreat and tide-modulated ocean channels at Moscow University and Totten Glacier ice shelves, East Antarctica, The Cryosphere, 17, 1003–1022, https://doi.org/10.5194/tc-17-1003-2023, 2023. a
Massonnet, D., Rossi, M., Carmona, C., Adragna, F., Peltzer, G., Feigl, K., and Rabaute, T.: The displacement field of the Landers earthquake mapped by radar interferometry, Nature, 364, 138–142, https://doi.org/10.1038/364138a0, 1993. a
Milillo, P., Rignot, E., Rizzoli, P., Scheuchl, B., Mouginot, J., Bueso-Bello, J., and Prats-Iraola, P.: Heterogeneous retreat and ice melt of Thwaites Glacier, West Antarctica, Science Advances, 5, eaau3433, https://doi.org/10.1126/sciadv.aau3433, 2019. a, b, c
Milillo, P., Rignot, E., Rizzoli, P., Scheuchl, B., Mouginot, J., Bueso-Bello, J. L., Prats-Iraola, P., and Dini, L.: Rapid glacier retreat rates observed in West Antarctica, Nat. Geosci., 15, 48–53, https://doi.org/10.1038/s41561-021-00877-z, 2022. a, b, c, d, e, f, g, h
Millan, R., Mouginot, J., Derkacheva, A., Rignot, E., Milillo, P., Ciraci, E., Dini, L., and Bjørk, A.: Ongoing grounding line retreat and fracturing initiated at the Petermann Glacier ice shelf, Greenland, after 2016, The Cryosphere, 16, 3021–3031, https://doi.org/10.5194/tc-16-3021-2022, 2022. a
Mohajerani, Y., Jeong, S., Scheuchl, B., Velicogna, I., Rignot, E., and Milillo, P.: Automatic delineation of glacier grounding lines in differential interferometric synthetic-aperture radar data using deep learning, Sci. Rep.-UK, 11, 4992, https://doi.org/10.1038/s41598-021-84309-3, 2021. a, b, c, d, e, f, g, h, i, j
Morlighem, M.: MEaSUREs BedMachine Antarctica, Version 3, https://doi.org/10.5067/FPSU0V1MWUB6, 2022. a, b, c
Morlighem, M., Rignot, E., Binder, T., Blankenship, D., Drews, R., Eagles, G., Eisen, O., Ferraccioli, F., Forsberg, R., Fretwell, P., Goel, V., Greenbaum, J. S., Gudmundsson, H., Guo, J., Helm, V., Hofstede, C., Howat, I., Humbert, A., Jokat, W., Karlsson, N. B., Lee, W. S., Matsuoka, K., Millan, R., Mouginot, J., Paden, J., Pattyn, F., Roberts, J., Rosier, S., Ruppel, A., Seroussi, H., Smith, E. C., Steinhage, D., Sun, B., Broeke, M. R. V. D., Ommen, T. D. V., Wessem, M. V., and Young, D. A.: Deep glacial troughs and stabilizing ridges unveiled beneath the margins of the Antarctic ice sheet, Nat. Geosci., 13, 132–137, https://doi.org/10.1038/s41561-019-0510-8, 2020. a
Mouginot, J., Rignot, E., and Scheuchl, B.: Sustained increase in ice discharge from the Amundsen Sea Embayment, West Antarctica, from 1973 to 2013, Geophys. Res. Lett., 41, 1576–1584, https://doi.org/10.1002/2013GL059069, 2014. a
Otosaka, I. N., Shepherd, A., Ivins, E. R., Schlegel, N.-J., Amory, C., van den Broeke, M. R., Horwath, M., Joughin, I., King, M. D., Krinner, G., Nowicki, S., Payne, A. J., Rignot, E., Scambos, T., Simon, K. M., Smith, B. E., Sørensen, L. S., Velicogna, I., Whitehouse, P. L., A, G., Agosta, C., Ahlstrøm, A. P., Blazquez, A., Colgan, W., Engdahl, M. E., Fettweis, X., Forsberg, R., Gallée, H., Gardner, A., Gilbert, L., Gourmelen, N., Groh, A., Gunter, B. C., Harig, C., Helm, V., Khan, S. A., Kittel, C., Konrad, H., Langen, P. L., Lecavalier, B. S., Liang, C.-C., Loomis, B. D., McMillan, M., Melini, D., Mernild, S. H., Mottram, R., Mouginot, J., Nilsson, J., Noël, B., Pattle, M. E., Peltier, W. R., Pie, N., Roca, M., Sasgen, I., Save, H. V., Seo, K.-W., Scheuchl, B., Schrama, E. J. O., Schröder, L., Simonsen, S. B., Slater, T., Spada, G., Sutterley, T. C., Vishwakarma, B. D., van Wessem, J. M., Wiese, D., van der Wal, W., and Wouters, B.: Mass balance of the Greenland and Antarctic ice sheets from 1992 to 2020, Earth Syst. Sci. Data, 15, 1597–1616, https://doi.org/10.5194/essd-15-1597-2023, 2023. a, b
Park, J. W., Gourmelen, N., Shepherd, A., Kim, S. W., Vaughan, D. G., and Wingham, D. J.: Sustained retreat of the Pine Island Glacier, Geophys. Res. Lett., 40, 2137–2142, https://doi.org/10.1002/grl.50379, 2013. a
Qian, Y., Zhou, C., Sun, S., Chen, Y., Wang, T., and Zhang, B.: Ephemeral grounding on the Pine Island Ice Shelf, West Antarctica, from 2014 to 2023, EGUsphere [preprint], https://doi.org/10.5194/egusphere-2025-603, 2025. a
Rignot, E.: Tidal motion, ice velocity and melt rate of Petermann Gletscher, Greenland, measured from radar interferometry, J. Glaciol., 42, 476–485, https://doi.org/10.3189/S0022143000003464, 1996. a, b
Rignot, E.: Observations of grounding zones are the missing key to understand ice melt in Antarctica, Nat. Clim. Change, 13, 1010–1013, https://doi.org/10.1038/s41558-023-01819-w, 2023. a
Rignot, E., Mouginot, J., Morlighem, M., Seroussi, H., and Scheuchl, B.: Widespread, rapid grounding line retreat of Pine Island, Thwaites, Smith, and Kohler glaciers, West Antarctica, from 1992 to 2011, Geophys. Res. Lett., 41, 3502–3509, https://doi.org/10.1002/2014GL060140, 2014. a, b, c, d
Rignot, E., Mouginot, J., and Scheuchl, B.: MEaSUREs Antarctic Grounding Line from Differential Satellite Radar Interferometry, Version 2, https://doi.org/10.5067/IKBWW4RYHF1Q, 2016. a, b, c, d, e, f, g
Rignot, E., Mouginot, J., and Scheuchl, B.: MEaSUREs InSAR-Based Antarctica Ice Velocity Map, Version 2, https://doi.org/10.5067/D7GK8F5J8M8R, 2017. a, b, c
Rignot, E., Ciracì, E., Scheuchl, B., Tolpekin, V., Wollersheim, M., and Dow, C.: Widespread seawater intrusions beneath the grounded ice of Thwaites Glacier, West Antarctica, P. Natl. Acad. Sci. USA, 121, e2404766121, https://doi.org/10.1073/pnas.2404766121, 2024. a, b, c, d, e, f, g
Scheuchl, B., Mouginot, J., Rignot, E., Morlighem, M., and Khazendar, A.: Grounding line retreat of Pope, Smith, and Kohler Glaciers, West Antarctica, measured with Sentinel-1a radar interferometry data, Geophys. Res. Lett., 43, 8572–8579, https://doi.org/10.1002/2016GL069287, 2016. a, b, c
Schmidtko, S., Heywood, K. J., Thompson, A. F., and Aoki, S.: Multidecadal warming of Antarctic waters, Science, 346, 1227–1231, https://doi.org/10.1126/science.1256117, 2014. a
Selley, H. L., Hogg, A. E., Davison, B. J., Dutrieux, P., and Slater, T.: Speed-up, slowdown, and redirection of ice flow on neighbouring ice streams in the Pope, Smith, and Kohler region of West Antarctica, The Cryosphere, 19, 1725–1738, https://doi.org/10.5194/tc-19-1725-2025, 2025. a