the Creative Commons Attribution 4.0 License.
the Creative Commons Attribution 4.0 License.
 | 23 Feb 2026
Simulating snow properties and Ku-band backscatter across the forest-tundra ecotone
Georgina J. Woolley
Nick Rutter
Leanne Wake
Vincent Vionnet
Chris Derksen
Julien Meloche
Benoit Montpetit
Nicolas R. Leroux
Richard Essery
Gabriel Hould Gosselin
Philip Marsh
Sophisticated snowpack models are required to provide accurate estimation of snowpack properties across the forest-tundra ecotone where in situ measurements are sparse. As snowpack properties strongly influence radar scattering signals, accurate simulation is crucial for the success of spaceborne radar missions to retrieve snow water equivalent (SWE). In this study, we evaluate the ability of default and Arctic versions of Crocus embedded within the Soil, Vegetation and Snow version 2 (SVS2-Crocus) land surface model to simulate snowpack properties (e.g. depth, density, SWE, specific surface area; SSA) across a 40 km transect of the Northwest Territories, Canada, using two winter seasons (2021–22 and 2022–23) of in situ measurements. An ensemble of simulated snowpack properties (120 members from default and Arctic SVS2-Crocus) was used in the Snow Microwave Radiative Transfer (SMRT) model to simulate Ku-band (13.5 GHz) backscatter. Simulated backscatter from multi-layer (∼ 20-layer) SVS2-Crocus snowpack simulations and simplified 3-layer “radar-equivalent snowpack” SVS2-Crocus simulations were compared to simulated backscatter from snow pit observations (with no snow layer simplification). Results highlight that Arctic SVS2-Crocus wind-induced compaction modifications were spatially transferable across the forest-tundra ecotone, reducing the RMSD of surface density by an average of 29 %. Basal vegetation modifications were less effective in simulating low-density basal snow layers at all sites (2022 and 2023; default RMSD: 67 kg m−3; Arctic RMSD: 69 kg m−3) but were necessary to simulate a physically representative Arctic density profile. SVS2-Crocus underestimated SSA leading to high errors in the simulation of snow backscatter (2022 and 2023; default RMSD 3.5 dB; Arctic RMSD: 4.8 dB). RMSD of backscatter was reduced by implementing a minimum SSA value (8.7 m2 kg−1; 2022 and 2023; default RMSD: 1.5 dB; Arctic RMSD: 1.5 dB). A radar-equivalent snowpack was effective in retaining the scattering behaviour of the multi-layer snowpack (RMSD < 1 dB) providing a means to estimate SWE with increased computational efficiency.
- Article
(7153 KB) - Full-text XML
- BibTeX
- EndNote


The forest-tundra ecotone represents a transition zone between areas of boreal forest and Arctic tundra (Callaghan et al., 2002). Rising air temperatures and altered precipitation patterns due to climate warming have led to rapid changes in vegetation composition and distribution across the forest-tundra ecotone (Graveline et al., 2024; Montesano et al., 2020), resulting in highly heterogeneous snow cover (Lackner et al., 2022). The structure and evolution of snowpack properties across the ecotone are poorly monitored because measurements of snow properties are sparse. Considering the rapid changes that are occurring across the forest-tundra ecotone, there is increasing need to explicitly simulate processes controlling evolution of snowpack properties through the use of snowpack models.
Differences in vegetation, topography and meteorological conditions across the forest-tundra ecotone generate spatially diverse snowpacks that display differences in microstructural properties (Lackner et al., 2022). Tundra snowpacks are exposed to high wind speeds and cold air temperatures leading to shallow snow depths (∼ 40 cm; Derksen et al., 2014) with two dominant layers (Rutter et al., 2019; Derksen et al., 2009). High wind speeds compact the surface layers of the snowpack leading to the formation of high-density wind slab snow layers (King et al., 2020). Strong temperature gradients generate rapid metamorphism, redistributing mass through vapor transport and forming basal depth hoar layers (Bouvet et al., 2023; Weise, 2017). Shrub density increases southward across the forest-tundra ecotone (Ernakovich et al., 2014) resulting in deeper snow depths through the trapping effect of vegetation (Callaghan et al., 2012; Domine et al., 2016) and a reduction in snow density by inhibiting compaction (Royer et al., 2021b; Gouttevin et al., 2018; Barrere et al., 2017). Shrub branches that protrude through the surface of the snowpack can act as conducting thermal bridges, cooling the ground in winter (Domine et al., 2022) and impact the albedo of the snowpack surface (Ménard et al., 2014). In the boreal forest, canopy density influences the spatial variability of snowpack properties (Lackner et al., 2022). Beneath dense canopy, the snowpack is typically shallower due to interception of solid precipitation (Bouchard et al., 2022; Royer et al., 2021a). A shallower snowpack increases the temperature gradient, favouring depth hoar formation through water vapour transport (Bouchard et al., 2024). Under sparse forest canopy, the influence of snow interception and sublimation is low, combined with reduced wind speeds, deeper snow depths with low-density surface layers are found (Royer et al., 2021a; Lackner et al., 2022).
Accounting for all competing processes that contribute to the spatial diversity in snowpack properties observed across the forest-tundra ecotone within a snowpack model is possible, but the ability of such models to adequately simulate snowpack properties requires evaluation. The ability to simulate realistic vertical profiles of Arctic snowpack properties in tundra environments has been enhanced through the parameterisation of missing Arctic processes; wind-induced compaction and the presence of basal vegetation impacting compaction and metamorphism (Royer et al., 2021b; Domine et al., 2019; Barrere et al., 2017; Gouttevin et al., 2018; Lackner et al., 2022; Woolley et al., 2024). Optimal combinations of Arctic parameterisations that improve the simulation of snowpack properties at an Arctic site have been identified (Woolley et al., 2024) but are yet to be tested in areas that differ in terms of vegetation, topography and meteorological conditions. The variability in snowpack properties across the forest-tundra ecotone has been measured in field campaigns (e.g. Royer et al., 2021a; Lackner et al., 2022; Bouchard et al., 2022), but few model the impact of vegetation on simulated snowpack microstructure properties (Lackner et al., 2022). Under forest canopy, good agreement for the simulation of bulk density and SWE has been found (Bartlett et al., 2006; Oreiller et al., 2014), whereas uncertainties in the simulation of snow density still remain (Lackner et al., 2022; Bonner et al., 2022). Furthermore, the effect of shrubs (Barrere et al., 2017; Gouttevin et al., 2018; Royer et al., 2021b; Woolley et al., 2024) and canopy structure (Mazzotti et al., 2024; Sun et al., 2018) on snowpack properties has been included within many snowpack schemes (Essery et al., 2025), allowing for important forest-snow interactions to be modelled.
Remote sensing can contribute to improved monitoring of snow across the forest-tundra ecotone, but current snow mass products are too coarse to spatially resolve the influence of landscape heterogeneity on snow distribution (Mortimer et al., 2020). Spaceborne radar missions could potentially contribute new snow information, but they require accurate information on snowpack properties (e.g. specific surface area (SSA), density, layering) to retrieve SWE (Derksen et al., 2021; Tsang et al., 2022). Due to a lack of observation stations and ground-based measurements of snow microstructure (Sokol et al., 2003), simulation of snowpack properties across areas that differ in terms of vegetation, climatology and topography are therefore crucial to constrain the accuracy of SWE retrievals. Ku-band radar has been found to be sensitive to the snowpack microstructure, where a radiative transfer model (RTM) can be used to link snowpack properties to backscatter (Pan et al., 2017; Cui et al., 2016). Significant progress has been made relating measurements of snowpack properties to backscatter (King et al., 2018; Lemmetyinen et al., 2018; Montpetit et al., 2024) but little work has focused on the impact of simulated snowpack information. A key variable in the retrieval of SWE is the number of snow model layers (Rutter et al., 2016), where large numbers of layers yields detailed information but at an increased computational cost. Recent studies show that similar scattering behaviour can be provided to the SWE retrieval using a simplified 3-layer snowpack through algorithms that retain the bulk SWE and microwave scattering behaviour of the snowpack (Meloche et al., 2025; Pan et al., 2017). Linking a simplified simulated snowpack with backscatter through a RTM can therefore reduce the computational cost of SWE retrieval. This enables continuous SWE monitoring over continental scales, which is essential for environmental prediction, climate monitoring and water resource management (Garnaud et al., 2019; Kim et al., 2021).
This study evaluates the impact of changing vegetation across the forest-tundra ecotone on simulated snowpack properties (e.g. SWE, depth, density, profiles of density and SSA). Snow properties are simulated using the multi-physics ensemble version of Crocus (Lafaysse et al., 2017; Vionnet et al., 2012) embedded within the Soil, Vegetation and Snow version 2 land surface model (hereafter referred to as SVS2-Crocus; Vionnet et al., 2022; Woolley et al., 2024), driven by meteorological forcing data from the High Resolution Deterministic Prediction System (HRDPS; Milbrandt et al., 2016) without downscaling. SVS2-Crocus simulations are compared to measurements at 7 sites across a 40 km transect of the Northwest Territories (NWT), Canada, that represent the transition from small shrubs to sparse evergreen needleleaf forest. The impact of an ensemble of simulated snow properties on Ku-band (13.5 GHz) backscatter using the Snow Microwave Radiative Transfer Model (SMRT; Picard et al., 2018), is then tested under three configurations:
- 1.
SMRT driven by a detailed (∼ 20-layer) SVS2-Crocus simulated snowpack.
- 2.
SMRT driven by a simplified (3-layer) radar-equivalent SVS2-Crocus simulated snowpack, following the approach of Meloche et al. (2025).
- 3.
SMRT driven by raw snow pit observations, representing the best available measured representation of the snowpack and serving as a reference for assessing model performance.
A total of 7 sites spanning a 40 km transect across the NWT were selected to represent the variability in vegetation and snow conditions across the forest-tundra ecotone (Figs. 1 and 2). Among the 7 sites, 2 situated at the most northern edge of the transect were characterised as tundra (Figs. 1 and 2; Upper Plateau and Trail Valley Creek) with vegetation primarily consisting of low shrubs (0.1–0.7 m), lichens, grasses and mosses (King et al., 2018; Walker and Marsh, 2021; Marsh et al., 2010). Three sites with scattered patches of grasses, mosses, birch and willow shrubs of varying heights (0.1–2 m) were distributed between tundra and forest sites to characterise the transition in vegetation across the ecotone and were classified as deciduous shrub (Figs. 1 and 2; Valley, Small Shrub, Mixed Shrub). Two further sites, characterised as forest, were selected at the most southern point of the transect covered by sparse evergreen needleleaf forest (canopy densities between 10 % and 13 %) and open areas of tundra (Figs. 1 and 2; Shrub Tree & Havikpak; Krogh and Pomeroy, 2019). The mean annual daily air temperature obtained from the HRDPS was −16.8 °C over the 2021/22 winter and −16.9 °C over the 2022/23 winter, varying by 0.9 °C (2021/22) and 1.1 °C (2022/23) between sites. Maximum daily wind speed at 10 m above the surface was 4.8 and 4.5 m s−1, varying by 0.9 and 0.7 m s−1 in the 2021/22 and 2022/23 winters, respectively. A significant snowfall event occurred late September in 2021, followed by gradual accumulation over the course of the winter (Fig. 3). The 2022/23 winter experienced consistent and gradual snowfall over the entire winter. Snowfall was higher in 2021/22 than in 2022/23, with the maximum cumulative snowfall reaching 138 mm in 2021/22 and 113 mm 2022/23 at Shrub Tree (Fig. 3). Maximum snow accumulation between all sites varied by 21 mm in 2021/22 and 14 mm in 2023/23, with the lowest snowfall at Trail Valley Creek (Fig. 3).
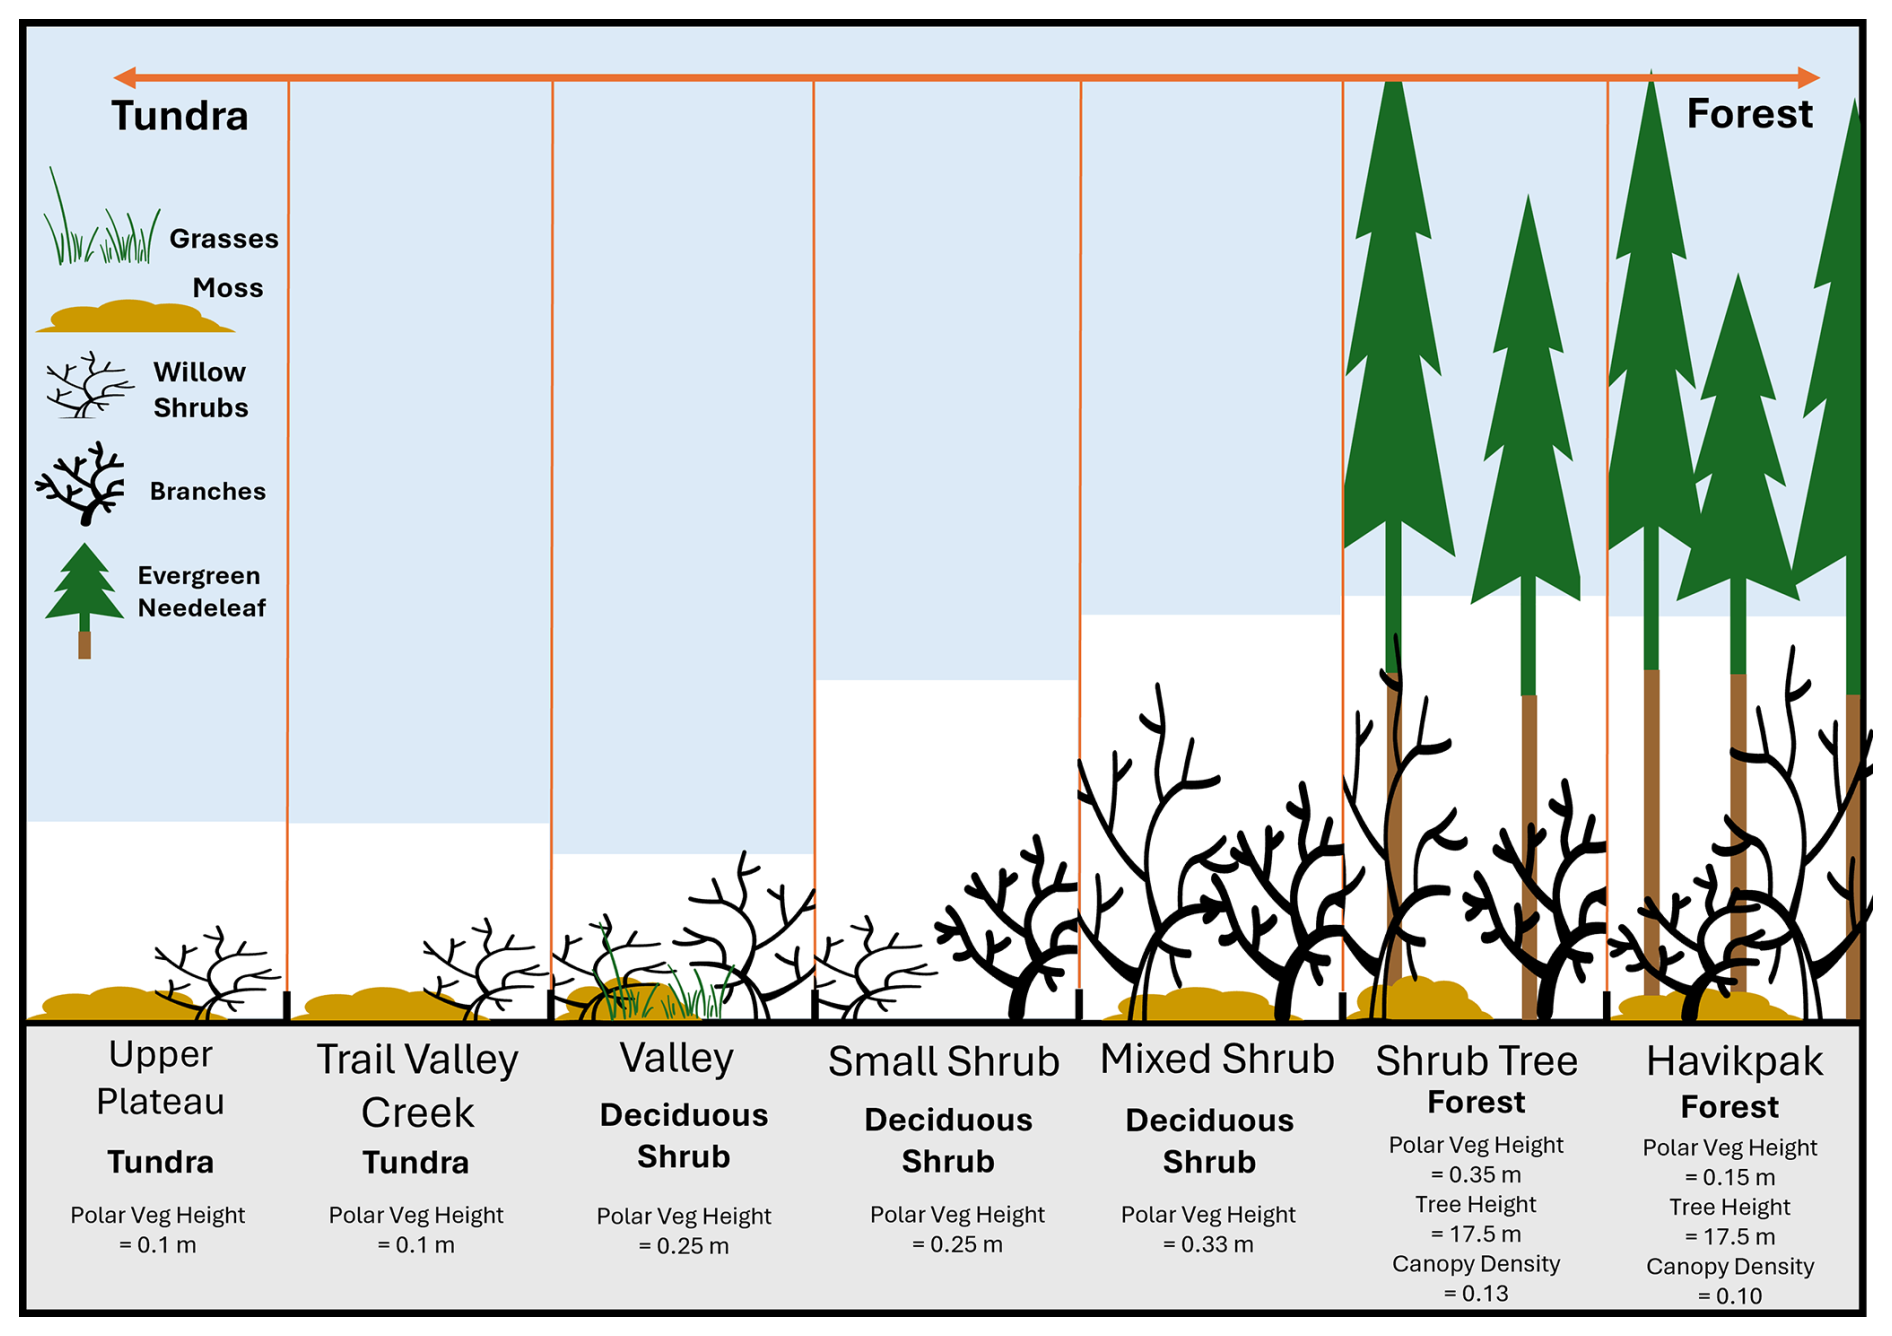
Figure 1Schematic showing the variation in vegetation and relative snow depth (white bars) across a 40 km transect of the Northwest Territories, Canada (Fig. 2). SVS2-Crocus model parameters of vegetation type, polar vegetation height (see Sect. 3.2.1 for definition), tree height and canopy density are also displayed for each site.
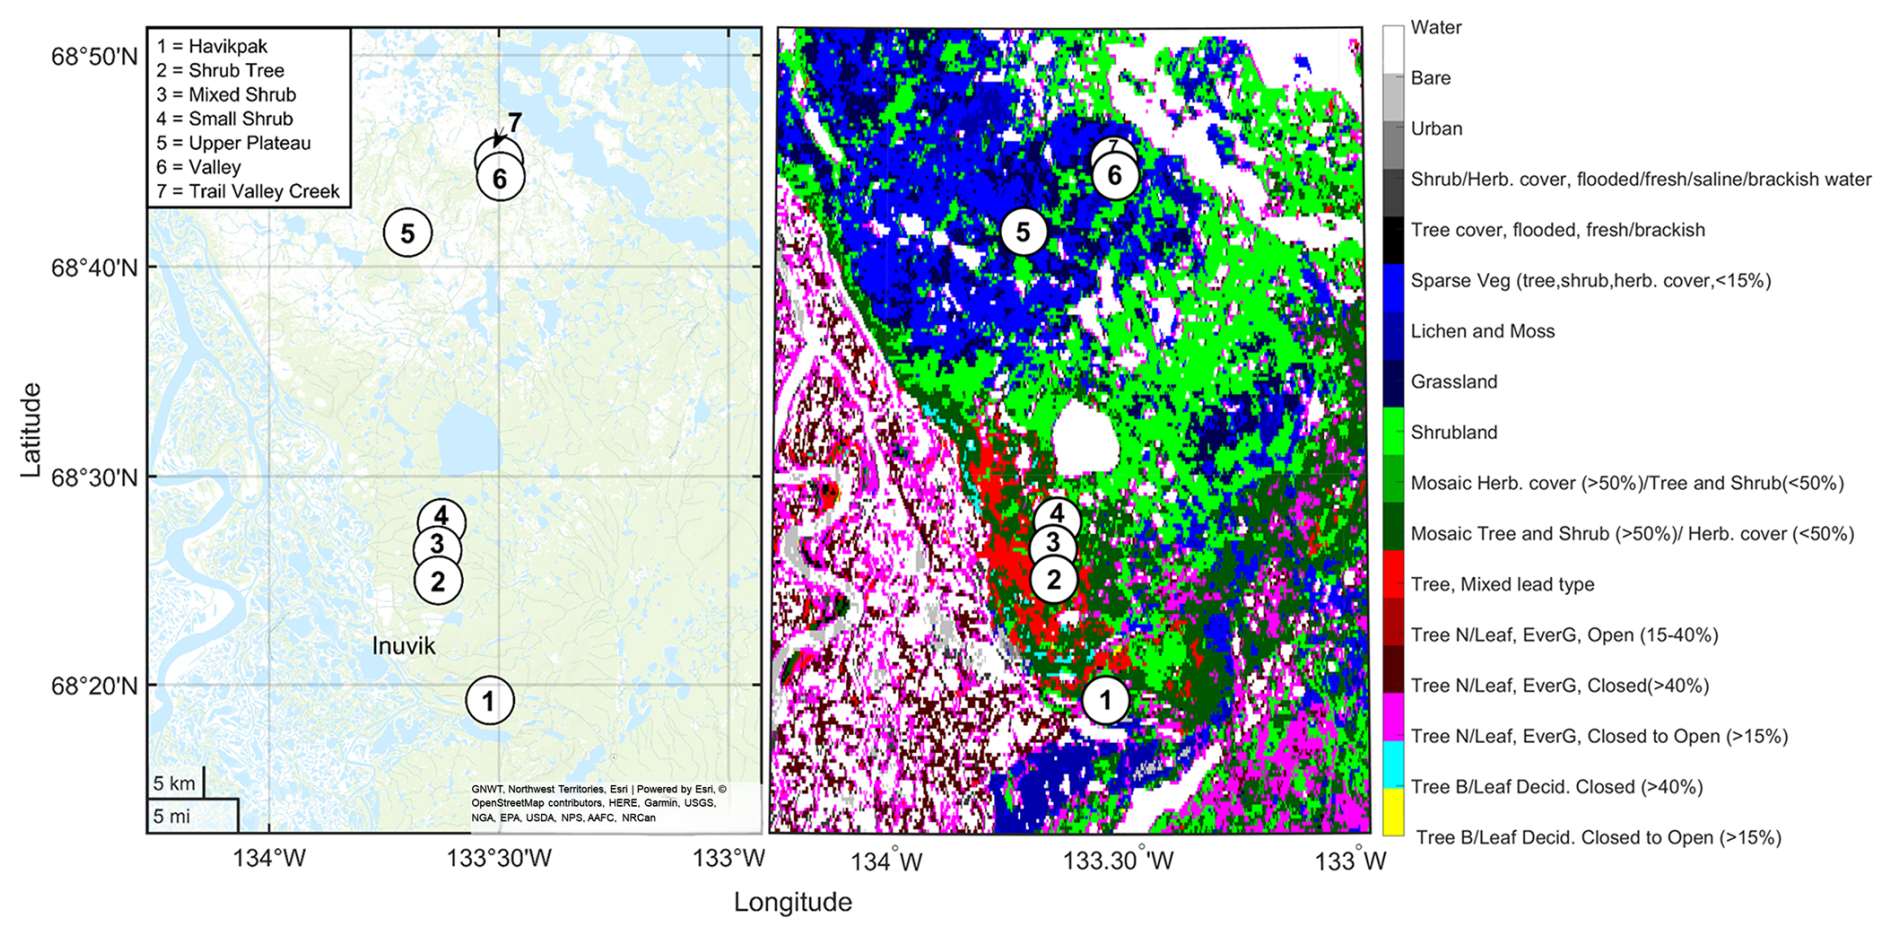
Figure 2Map of the study domain showing (left) the location of the 7 sites across the 40 km transect of the Northwest Territories, Canada and (right) vegetation type at each site derived from the ESA CC1 LC global map (European Space Agency Climate Change Initiative Land Cover; http://esa-landcover-cci.org, last access: 14 March 2025).
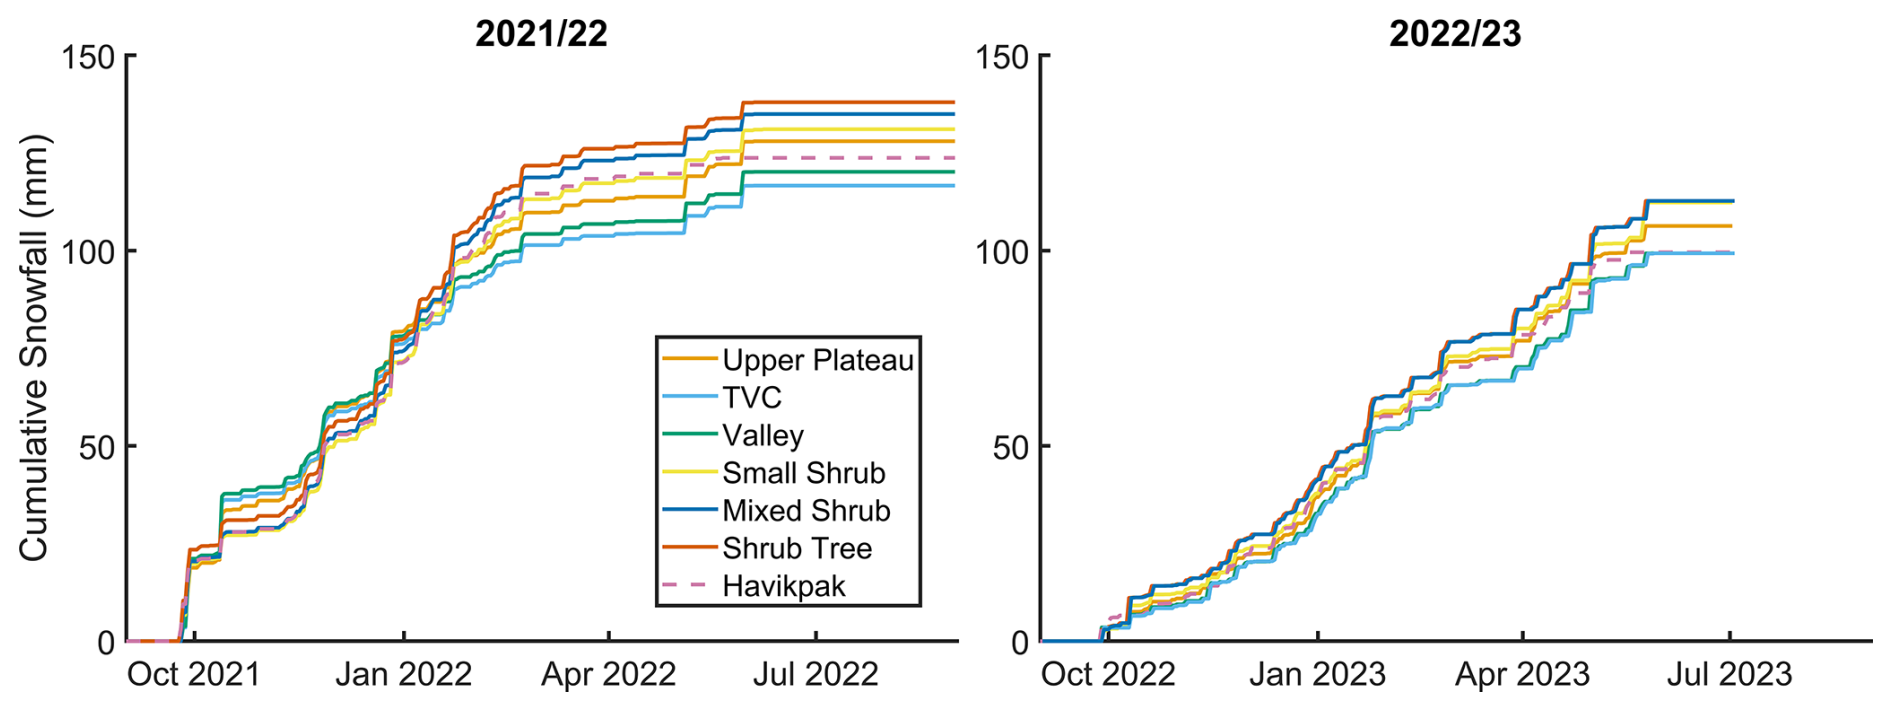
Figure 3Cumulative snowfall (mm) obtained from the High-Resolution Deterministic Prediction System (HRDPS) for each site for the 2021/22 and 2022/23 winters.
3.1 Field Methods
Over the 2021/22 and 2022/23 winters, snowpack properties were measured in snow pits (n = 66) around the time of peak SWE (late March). Snow pits were measured at the start, middle and end of a 1 km transect at each site to capture the spatial variability in snow properties, with forested sites sampled in a canopy gap and two locations beneath the canopy. At all sites except Havikpak, one profile was conducted in each of the three snow pits during the 2021/22 season. Two profiles were conducted in each of the three snow pits during the 2022/23 season. At Havikpak, a 1 km transect was not possible due to forest cover. Instead, four profile locations were selected to represent the snow properties under forest canopy and in forest gaps. One profile was conducted in each of the four snow pits during the 2021/22 season, and two profiles were conducted in each of the four snow pits during the 2022/23 season at Havikpak. Profiles of density using a 100 cm3 density cutter and SSA using an A2 Photonic Sensor IceCube (Zuanon, 2013; Gallet et al., 2009) were measured at 3 cm vertical resolution. Snow temperature was measured using a stem thermometer at 10 cm intervals and snow stratigraphy identified by visual inspection following Fierz et al. (2009). At each of the 7 sites, snow depth distribution was measured along the 1 km transect (or between snow pits at Havikpak) using a Magnaprobe (∼ 530 measurements per site; Sturm and Holmgren, 2018). Spirals around each pit were carried out at all non-forested sites (∼ 270 measurements per site). SWE measurements were made at 50 m intervals along each transect using a clear Lexan ESC-30 snow corer (Kinar and Pomeroy, 2015). The snow samples were weighted and depths recorded to provide the SWE at each sample point.
3.2 Modelling
3.2.1 SVS2-Crocus
The multi-physics ensemble version of the snowpack model Crocus (Brun et al., 1992; Lafaysse et al., 2017; Vionnet et al., 2012) embedded within the Soil, Vegetation and Snow version 2 (SVS2) land surface model (Vionnet et al., 2022; Woolley et al., 2024) driven by meteorological forcing from the HRDPS was used to simulate the vertical layering and seasonal evolution of snowpack physical properties i.e. density, depth, SWE and SSA. Crocus computes the mass, density, temperature, liquid water content, age and snow microstructure properties (optical diameter, sphericity) of a multi-layer snowpack. Simulations were run from September 2020 to July 2023, with model spin-up of 5 years from September 2015 to allow soil temperatures to equilibrate. Soil properties (sand/clay fraction) from the HRDPS geophysical fields were used to characterise the soil. Land cover type was specified based upon the metrics (vegetation type, polar vegetation height, tree height) presented in Figs. 1 and 2. The height of polar low vegetation, classified as the height of basal vegetation within each snow pit, was measured at each site ranging from 0.1 to 0.35 m (Fig. 1). Canopy cover density (CC) values ranged from 10 % to 13 % (Fig. 1), derived from hemispherical photographs taken along the 1 km at both forested sites (Essery et al., 2008). For these sites, the vegetation type in SVS2-Crocus was specified as evergreen needleleaf trees, for which the model uses a default leaf area index (LAI) of 4 (Vionnet et al., 2025, their Table S2). An effective LAI (LAIeff), LAIeff = (CC * LA) was then used to compute the maximum snow holding capacity in the Hedstrom and Pomeroy (1998) interception model (Vionnet et al., 2025, Eqs. 28–29). The default LAI value parameterised in SVS2 is likely over-representing canopy density at both forested sites and reflects a broader limitation in how plant functional types are represented within the model. The darkening coefficient in the snow albedo parameterisation was modified from 60 to 900 d within all simulations to account for a lower magnitude of light-absorbing impurities, associated fluxes and radiative forcing with Arctic snowpacks (Gaillard et al., 2025). Meteorological forcing data consisted of air temperature, specific humidity, wind speed, incoming longwave and shortwave radiation and solid and liquid precipitation rates, which were obtained for each site from the HRDPS at 2.5 km grid spacing. Successive short-term HRDPS forecasts (7–12 h lead time) were combined together to generate continuous hourly meteorological forcing.
The Ensemble System Crocus (ESCROC; Lafaysse et al., 2017) modelling framework within SVS2-Crocus allows model uncertainty due to parameterisation of snow processes within midlatitude environments to be investigated. However, the ESCROC ensemble does not consider Arctic processes and has been found insufficient to simulate snowpack properties in an Arctic environment (Woolley et al., 2024). An Arctic version of ESCROC within SVS2-Crocus (Arctic SVS2-Crocus) was developed by Woolley et al. (2024) that relied on existing parameterisations that have been developed for Arctic snowpacks to overcome these limitations (Barrere et al., 2017; Lackner et al., 2022; Royer et al., 2021b; Gouttevin et al., 2018). Woolley et al. (2024) implemented new parametrisations that considered the impact of wind speed on surface snow following Royer et al. (2021b) and Lackner et al. (2022) by modifying the default parameterisation of Vionnet et al. (2012) for falling snow density. As wind speed also increases surface snow density during drifting or blowing snow events, Woolley et al. (2024) also modified the parameter that modulates the increase in density for a given snow transport intensity. The maximum density of snow impacted by wind was also raised following the work of Barrere et al. (2017), Royer et al. (2021b) and Lackner et al. (2022). To consider the impact of basal vegetation on compaction and metamorphism, wind compaction was deactivated, and viscosity was increased below a set polar vegetation height (Domine et al., 2016; Gouttevin et al., 2018; Royer et al., 2021b). Finally, alternate thermal conductivity formulations better suited for Arctic snow types were implemented in Arctic SVS2-Crocus (Fourteau et al., 2021; Sturm et al., 1997). Parameterising missing Arctic processes within SVS2-Crocus improved the simulation of snow density and SSA at Trail Valley Creek when compared to the default version of the model (Woolley et al., 2024). A detailed description of the options for each physical process for the default and Arctic SVS2-Crocus ensembles can be found in Woolley et al. (2024) and Lafaysse et al. (2017). We select the same 120-ensemble members used within Woolley et al. (2024) from default and Arctic SVS2-Crocus to investigate the spatial transferability of Arctic parameterisations across the forest-tundra ecotone. Further recent developments of SVS2-Crocus include the implementation of a canopy module to simulate snowpack properties in forested environments. The module simulates the impact of forest canopy on near surface meteorological variables such as air temperature, wind speed, relative humidity and radiative fluxes (Mazzotti et al., 2024). The canopy module is described in Appendix A.
The root-mean-square deviation (RMSD) and spread skill (SS) were used to evaluate the simulation of snow depth, SWE, bulk density and profiles of density and SSA. The RMSD represents the accuracy of a simulated outcome in comparison to a measured result, whereas the SS measures the ratio of the root-mean ensemble spread to the RMSD of the ensemble mean against a measured result (Lafaysse et al., 2017). A SS value of 1 indicates measurements lie within the ensemble spread and represents perfect dispersion (Fortin et al., 2014). RMSD values for the simulation of snow depth were calculated using combined Magnaprobe transect and snow pit measurements, with Magnaprobe data serving as the primary reference. For the simulation of SWE, RMSD values are calculated using the aggregation of both SWE tube and snow pit measurements. The RMSD and SS scores are generated for the overall ensemble, the depth hoar fraction (DHF), and the wind slab (WS) fraction, which reflects the difference and spread of the ensemble, allowing evaluation of the predictive performance and uncertainty of SVS2-Crocus. The DHF of each measured profile was determined by identifying transitions in the density and/or SSA. The transition between the SSA for different layers is often more distinct than density (Rutter et al., 2019), providing a sharper transition between wind slab and depth hoar than can be visibly identified. Where the transition in snow type occurs, the density and/or SSA is noted, cross referenced with those presented in Fig. 9 of Rutter et al. (2019) and the grain type reported during snow pit measurements. DHF values used within this study varied from 40 % to 64 %, and all snow above the depth hoar layer was classified as wind slab. Simulated profiles of density and SSA were classified into their vegetation type following Figs. 1 and 2 for statistical analysis as follows: Tundra (Upper Plateau and Trail Valley Creek), Deciduous Shrub (Valley, Small Shrub and Mixed Shrub) and Forest (Shrub Tree and Havikpak). As measured and simulated profiles can differ in depth and vertical resolution, all profiles were normalised and then rescaled to 0.005 increments up to the maximum depth, interpolated using layer thickness to allow for fair layer evaluation.
3.2.2 SMRT
The Snow Microwave Radiative Transfer model (SMRT; Picard et al., 2018) was used to simulate the backscatter signal following the model configuration of Montpetit et al. (2024): Ku-band (13.5 GHz) frequency, VV single-polarization, incidence angle of 40°, exponential microstructure model, improved born approximation (IBA) electromagnetic model, and the Discrete Ordinate and Eigenvalue (DORT) radiative transfer solver (Picard et al., 2018). We adopt the configuration constrained by Montpetit et al. (2024) as it was specifically optimised for the tundra snow conditions at Trail Valley Creek through the calibration of microstructural and radiative parameters against snow pit and radiometric observations and validated through Ku-band backscatter simulations using airborne SAR data. This configuration enabled isolation of snow model uncertainty on simulated snow backscatter. Each snow layer within SMRT is characterised by temperature, density, thickness and exponential correlation length (ρex), using either SVS2-Crocus simulations or snow pit measurements. The exponential correlation length was derived from the optical diameter (dopt) and density (ρsnow):
where the polydispersity (K) was assumed to be 1 for all simulations (Meloche et al., 2025). Fixing K = 1 provided a consistent configuration suitable for our analysis of simulated SVS2-Crocus backscatter versus pit simulated backscatter. This assumption isolates the influence of snow microstructure and density differences between SVS2-Crocus and pit measurements, while avoiding additional uncertainty by varying polydispersity. Measurements of SSA were converted into dopt:
Effective soil permittivity (2.7) and effective soil roughness (0.011) values used for Trail Valley Creek in Montpetit et al. (2024) were applied to all sites in this study. SMRT simulations of radar backscatter used vertical profiles of snowpack properties simulated by 120-members of default and Arctic SVS2-Crocus (see Sect. 3.2.1 for a description of ensemble members) from the date of measurement during the 2021/22 and 2022/23 field campaigns. Initial simulations were run with a multi-layer snowpack (∼ 20 layers) to investigate the impact of detailed snow microstructure on the backscatter signal. The multi-layer snowpack was then simplified into a 3-layer radar equivalent snowpack using a K-means clustering algorithm following the methods of Meloche et al. (2025). The method aims to increase the computational efficiency needed for SWE retrieval whilst conserving the bulk SWE and microwave scattering behaviour of the snowpack. In addition, a minimum SSA of 8.7 m2 kg−1 (maximum dopt of 0.75 mm) was applied to the SVS2-Crocus multi-layer and simplified snowpack SMRT simulations to optimize the scattering behaviour of the snowpack. Analysis of pit measurements found 8.7 m2 kg−1 to be the median minimum value across all sites used within this study for both 2021/22 and 2022/23, and lies within the range of depth hoar SSA measurements made across the wider Arctic (Woolley et al., 2024; Rutter et al., 2019; Montpetit et al., 2024).
4.1 Bulk Snow Properties: SWE, Snow Depth and Density
Measured snow depth and SWE increased southward across the forest-tundra ecotone during the winters of 2021/22 and 2022/23. The shallowest snow depths were found at Trail Valley Creek (0.41 m; 2022) and Valley (0.4 m; 2023) and the deepest at Shrub Tree (0.72 m; 2022 and 0.69 m; 2023). Valley (95 kg m−2; 2022) and Small Shrub (84 kg m−2; 2022) exhibited the lowest measured SWE whereas Shrub Tree consistently exhibited the highest measured SWE across both years (162 kg m−2; 2022 and 153 kg m−2; 2023). Measured bulk density decreased southward across the ecotone with highest bulk density values at Trail Valley Creek (293 kg m−3; 2022 and 334 kg m−3; 2023) and lowest at Havikpak (191 kg m−3; 2022) and Mixed Shrub (198 kg m−3; 2023). Deeper snow depths and higher SWE were found in 2022 than 2023 for all sites due to higher snowfall early in the snow season in 2022 (Fig. 3) whereas bulk density was higher in 2023 than 2022.
Both default and Arctic SVS2-Crocus driven by HRDPS are able to simulate the measured increase in snow depth that occurs along the transition zone from tundra to forest (Fig. 4). Deepest snow depths (Fig. 4; mean across 2021/22 and 2022/23: 0.61 m) simulated at Shrub Tree due to high snowfall and canopy cover restricting wind compaction and redistribution show good agreement with measurements in 2021/22 (default RMSD: 0.08 m; Arctic RMSD: 0.05 m) and underestimation in 2022/23 (default RMSD: 0.13 m; Arctic RMSD: 0.12 m). Shallowest snow depths are simulated at Trail Valley Creek (Fig. 4; mean across 2021/22 and 2022/23: 0.37 m) due to lower snowfall and exposure to high winds in both 2021/22 (default RMSD: 0.11 m; Arctic RMSD: 0.06 m) and 2022/23 (default RMSD: 0.09 m; Arctic RMSD: 0.04 m).
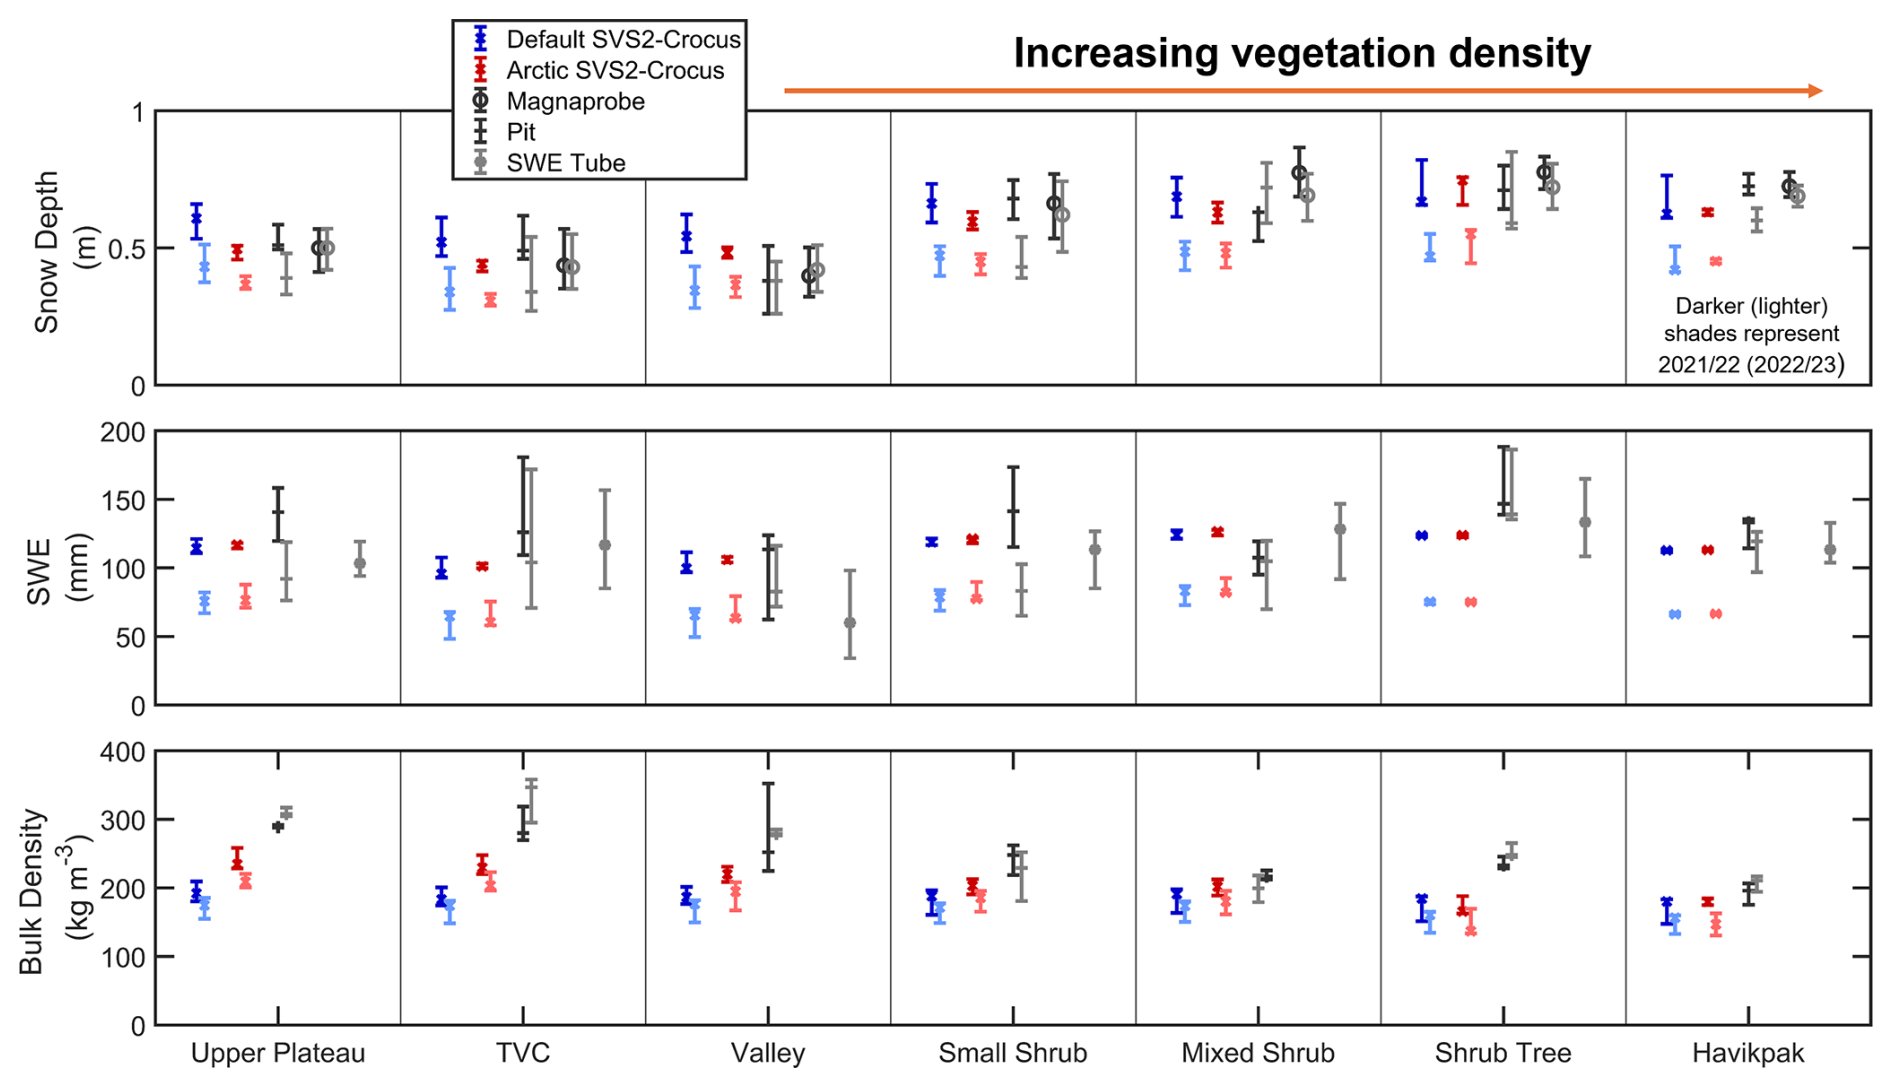
Figure 4Distribution (median, interquartile range) of simulated and measured snow depth (m), SWE (kg m−2) and bulk density (kg m−3) at each site for the 2021/22 and 2022/23 winter. Lighter shades of each colour represent the winter of 2022/23. Each distribution represents simulated and measured snow properties at the time of snow pit measurements. Vegetation type for each site is described in Fig. 1.
Wind effect modifications applied to Arctic SVS2-Crocus lead to higher simulated bulk densities and shallower snow depths at all sites when compared to default SVS2-Crocus (Fig. 4). Arctic SVS2-Crocus simulated bulk density was highest at Upper Plateau (2022: 241 kg m−3) and Trail Valley Creek (2023: 234 kg m−3) due to high wind speeds resulting from exposed topography whereas default SVS2-Crocus simulated lowest bulk densities at Havikpak (2022: 171 kg m−3; 2023: 150 kg m−3) due to canopy cover reducing wind speed and compaction processes. Reduced variability in snow depth simulated by Arctic SVS2-Crocus is due to the inclusion of wind-induced compaction, which increases snowpack density and produces snow depths more consistent with observations relative to the default configuration. As both default and Arctic SVS2-Crocus received identical precipitation forcing from the HRDPS, they simulate similar magnitudes of SWE (Fig. 4). Default and Arctic SVS2-Crocus show good agreement with measurements for the simulation of SWE at all sites in 2021/22 (Fig. 4; default RMSD range: 12–28 kg m−2; Arctic RMSD range: 8–25 kg m−2). However, SWE is underestimated by both ensembles at Trail Valley Creek (default RMSD: 51 kg m−2; Arctic RMSD: 46 kg m−2), Shrub Tree (default and Arctic RMSD: 61 kg m−2) and Havikpak (default RMSD: 50 kg m−2; Arctic RMSD: 50 kg m−2) in 2022/23. The differences in snow depth simulated by default and Arctic SVS2-Crocus therefore result from the opposing trends in bulk density (Fig. 4).
4.2 Profiles of density and SSA
Figures 5 and 6 compare measured and simulated profiles of snow density and SSA for Upper Plateau, Small Shrub and Havikpak, representing three sites of contrasting vegetation type (see Fig. 1) for the 2021/22 and 2022/23 winter seasons, respectively. All remaining sites are displayed in Appendix B. We discuss the results from Figs. 5, 6, 7 and Appendix B with reference to the vegetation type, as classified in Fig. 1: Tundra (Upper Plateau, Trail Valley Creek), Deciduous Shrub (Valley, Small Shrub, Mixed Shrub) and Forest (Shrub Tree and Havikpak). Measured profiles of snow density at tundra and deciduous shrub sites exhibit the typical structure of an Arctic snowpack: low-density basal layers ranging between 150 and 300 kg m−3 overlain by higher density surface layers ranging between 300 and 400 kg m−3 (Figs. 5 and 6, Appendix B). At forest sites, measured snow density shows less variability throughout the snowpack with surface and basal layers exhibiting similar densities (Figs. 5 and 6, Appendix B: WS Mean: 196 kg m−3; DHF Mean: 192 kg m−3). Despite differences in snow density, the pattern of measured SSA is consistent amongst all sites with lower SSA values for basal layers (ranging between 5 and 20 m2 kg−1) and higher SSA (ranging between 30 and 60 m2 kg−1) values for near-surface layers (Figs. 5 and 6, Appendix B). The variability between measured pit profiles of density and SSA decreases from tundra to forest (Figs. 5 and 6, Appendix B).
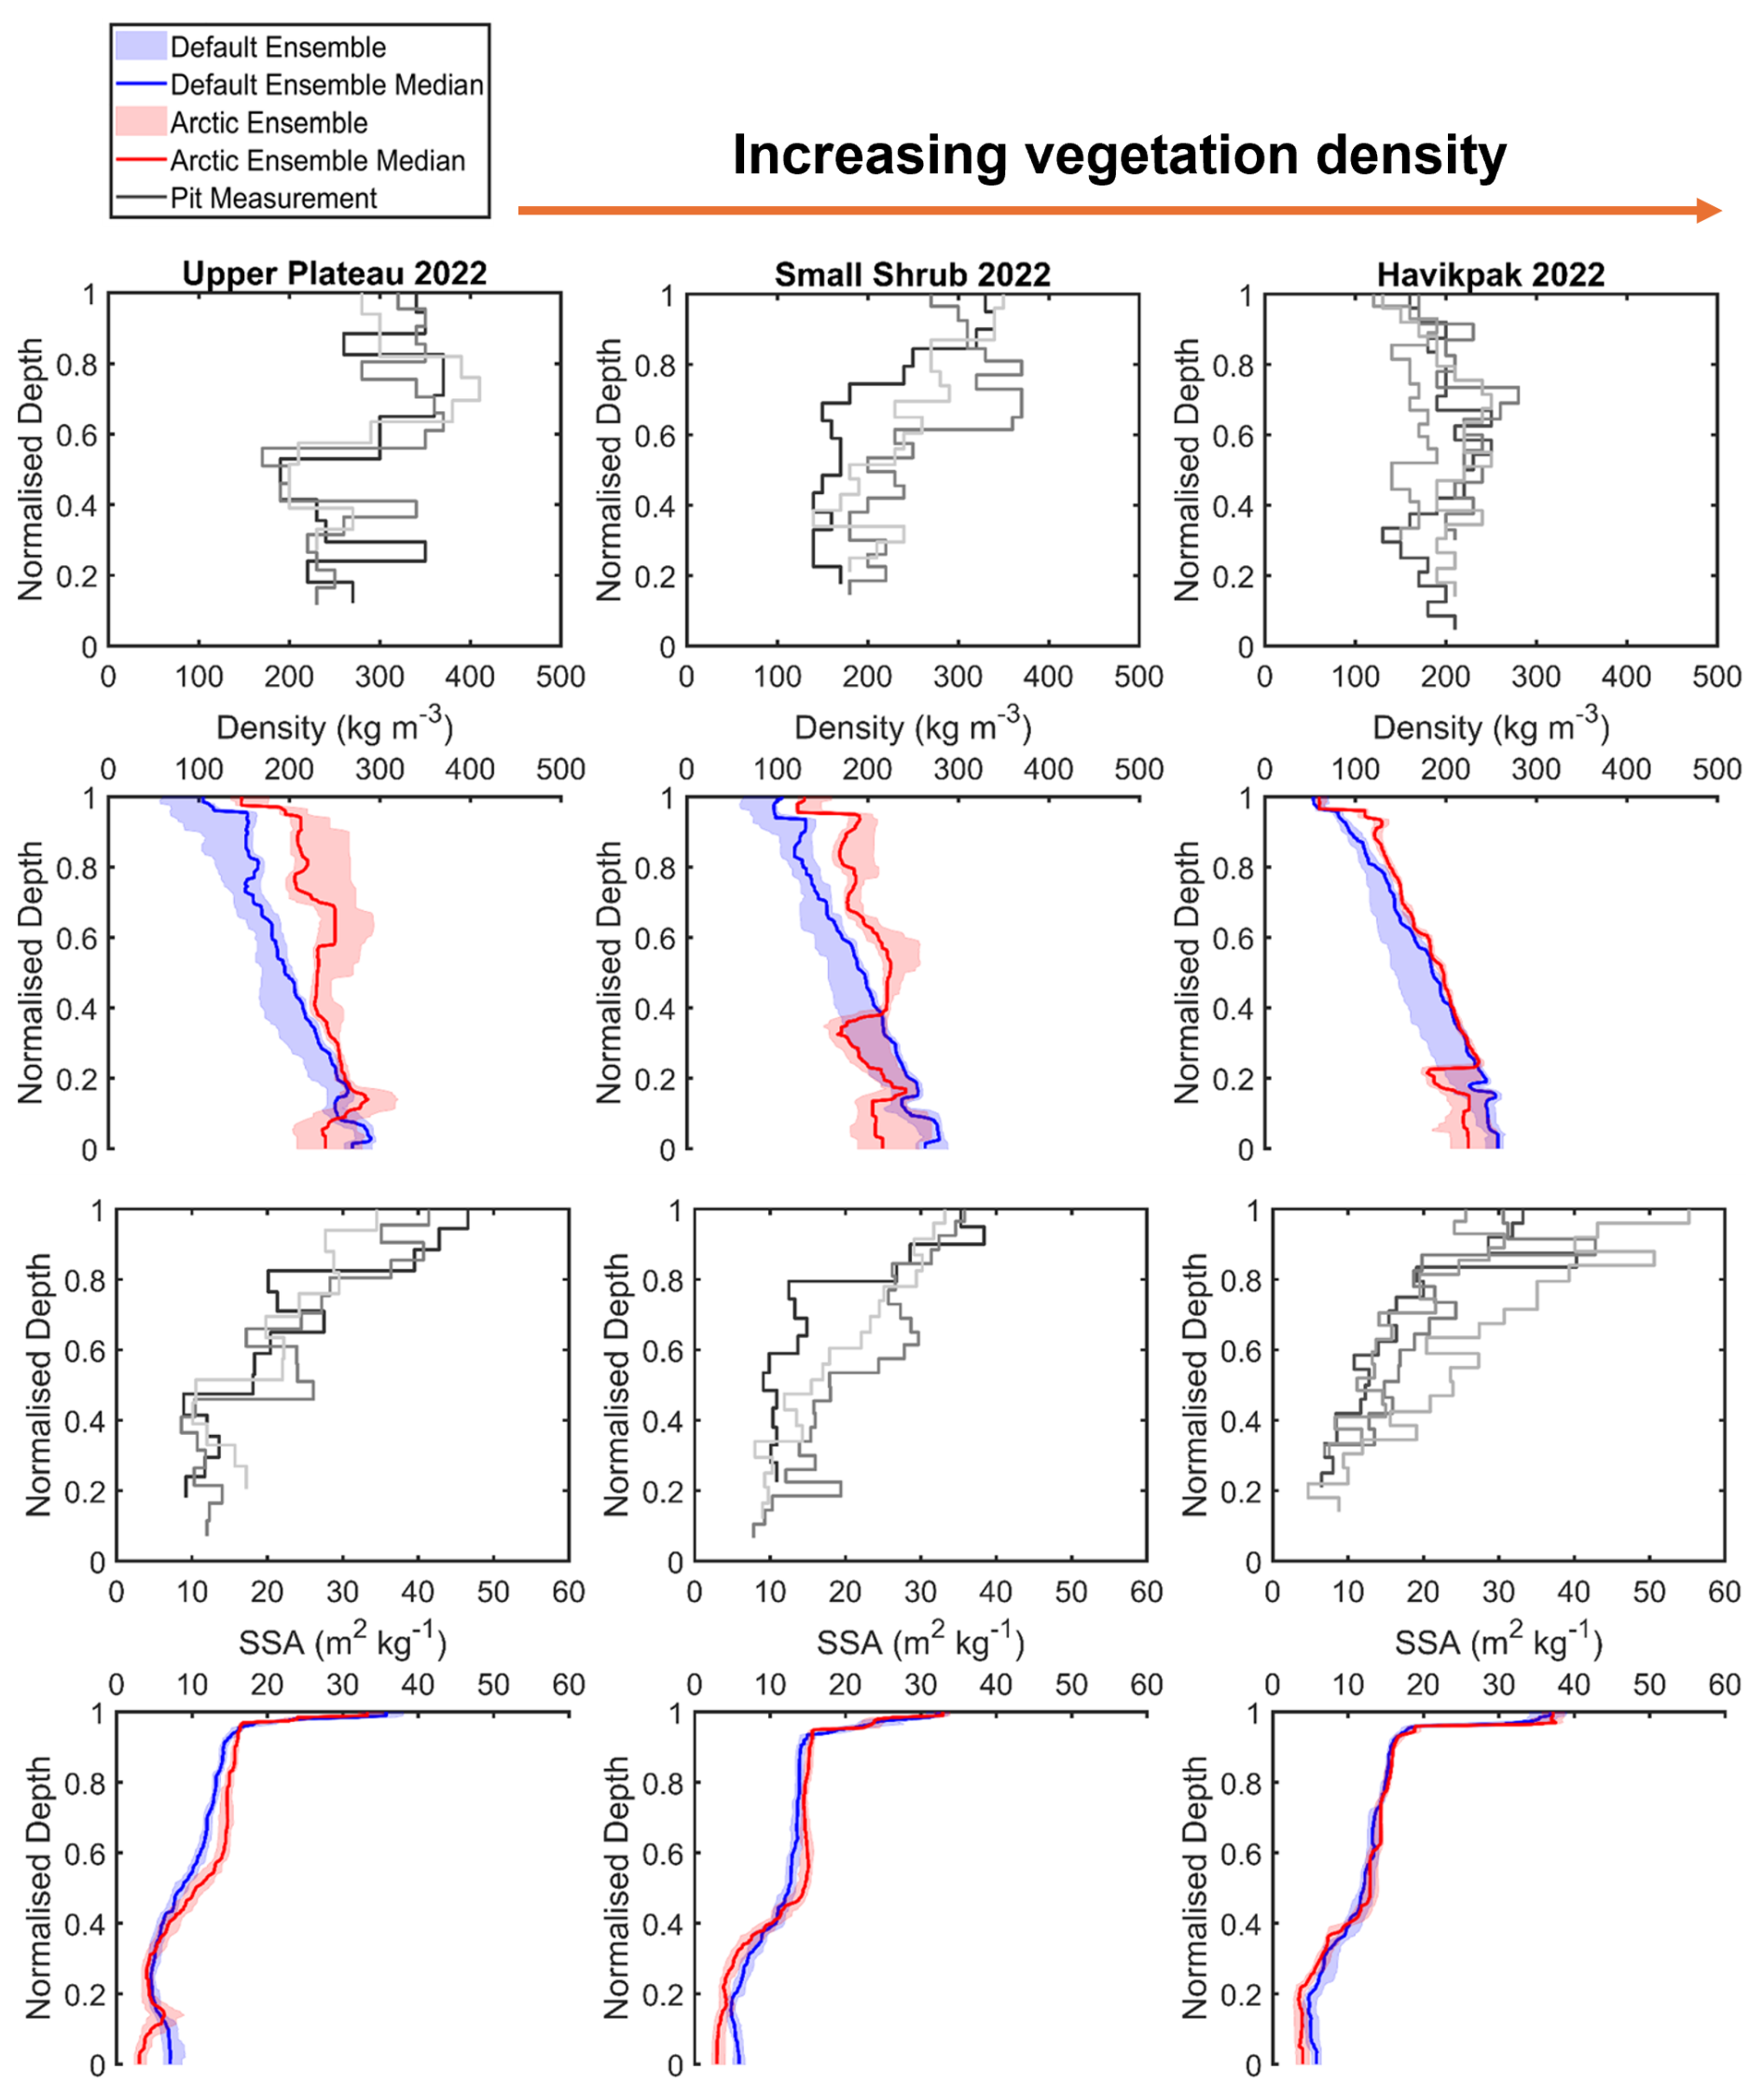
Figure 5Comparison of measured and simulated vertical profiles of density (kg m−3, median, interquartile range) and SSA (m2 kg−1, median, interquartile range) by default and Arctic SVS2-Crocus from the March 2022 winter field campaign. Black and grey lines indicate different pit profiles. Vegetation type for each site is described in Fig. 1.
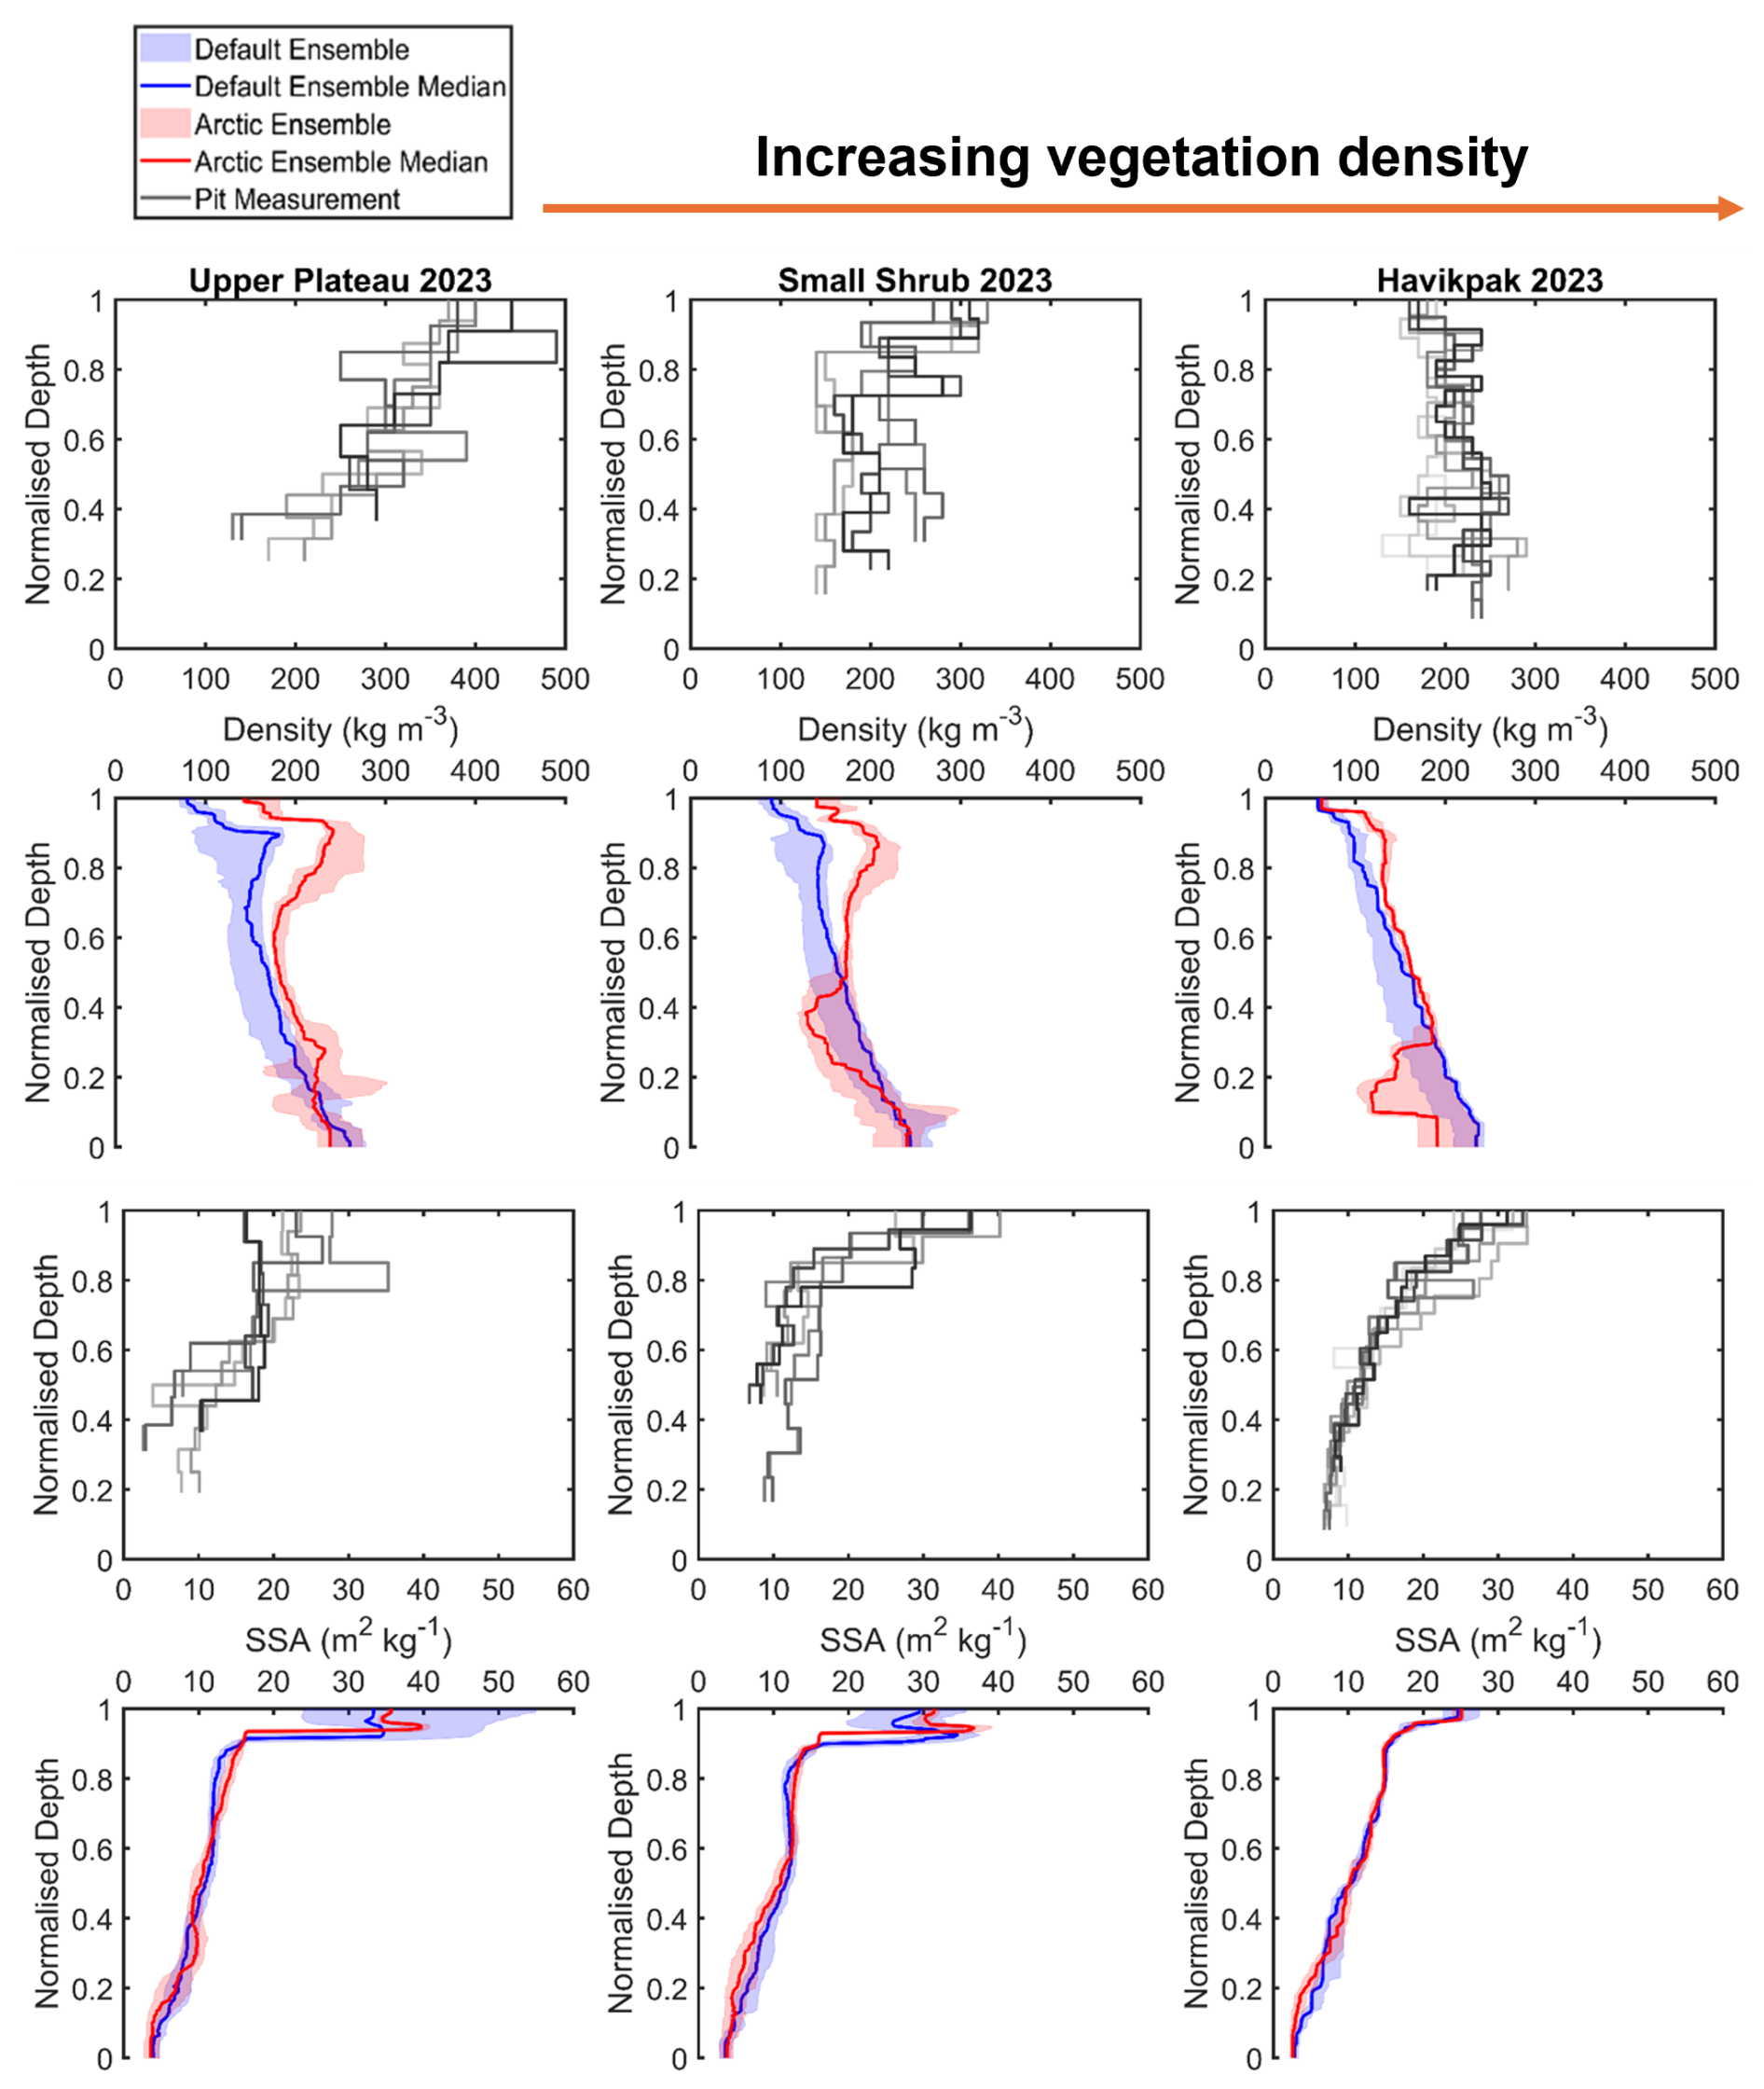
Figure 6Comparison of measured and simulated vertical profiles of density (kg m−3, median, interquartile range) and SSA (m2 kg−1, median, interquartile range) by default and Arctic SVS2-Crocus from the March 2023 winter field campaign. Black and grey lines indicate different pit profiles. Vegetation type for each site is described in Fig. 1.
At all sites, for both winter seasons, default SVS2-Crocus underestimates surface layer density (Fig. 7). Wind effect parameterisations applied to Arctic SVS2-Crocus are effective in compacting surface snow layers, reducing the RMSD at all sites (Fig. 7, Table 1). The performance of the Arctic parameterisations are most effective at tundra and deciduous shrub sites where high wind speeds contribute to a significant proportion of surface snow compaction. At forest sites, the parameterisation of below-canopy wind speed reduces the ability of Arctic parameterisations to compact surface layers resulting in a smaller reduction in RMSD. Despite improvements in the RMSD by Arctic SVS2-Crocus, surface snow density is underestimated at all sites (Figs. 5, 6 and Appendix B). This remaining underestimation is likely due to uncertainties associated with wind speed within the HRDPS meteorological forcing data. The spread of the Arctic SVS2-Crocus ensemble (Fig. 7, Table 1) captures the variability in snow pit measurements better than default SVS2-Crocus (Fig. 7, Table 1) but both ensembles display under dispersion (SS < 1). The spread of both ensembles decreases from tundra to forest, similar to patterns observed within measurements (Fig. 7).
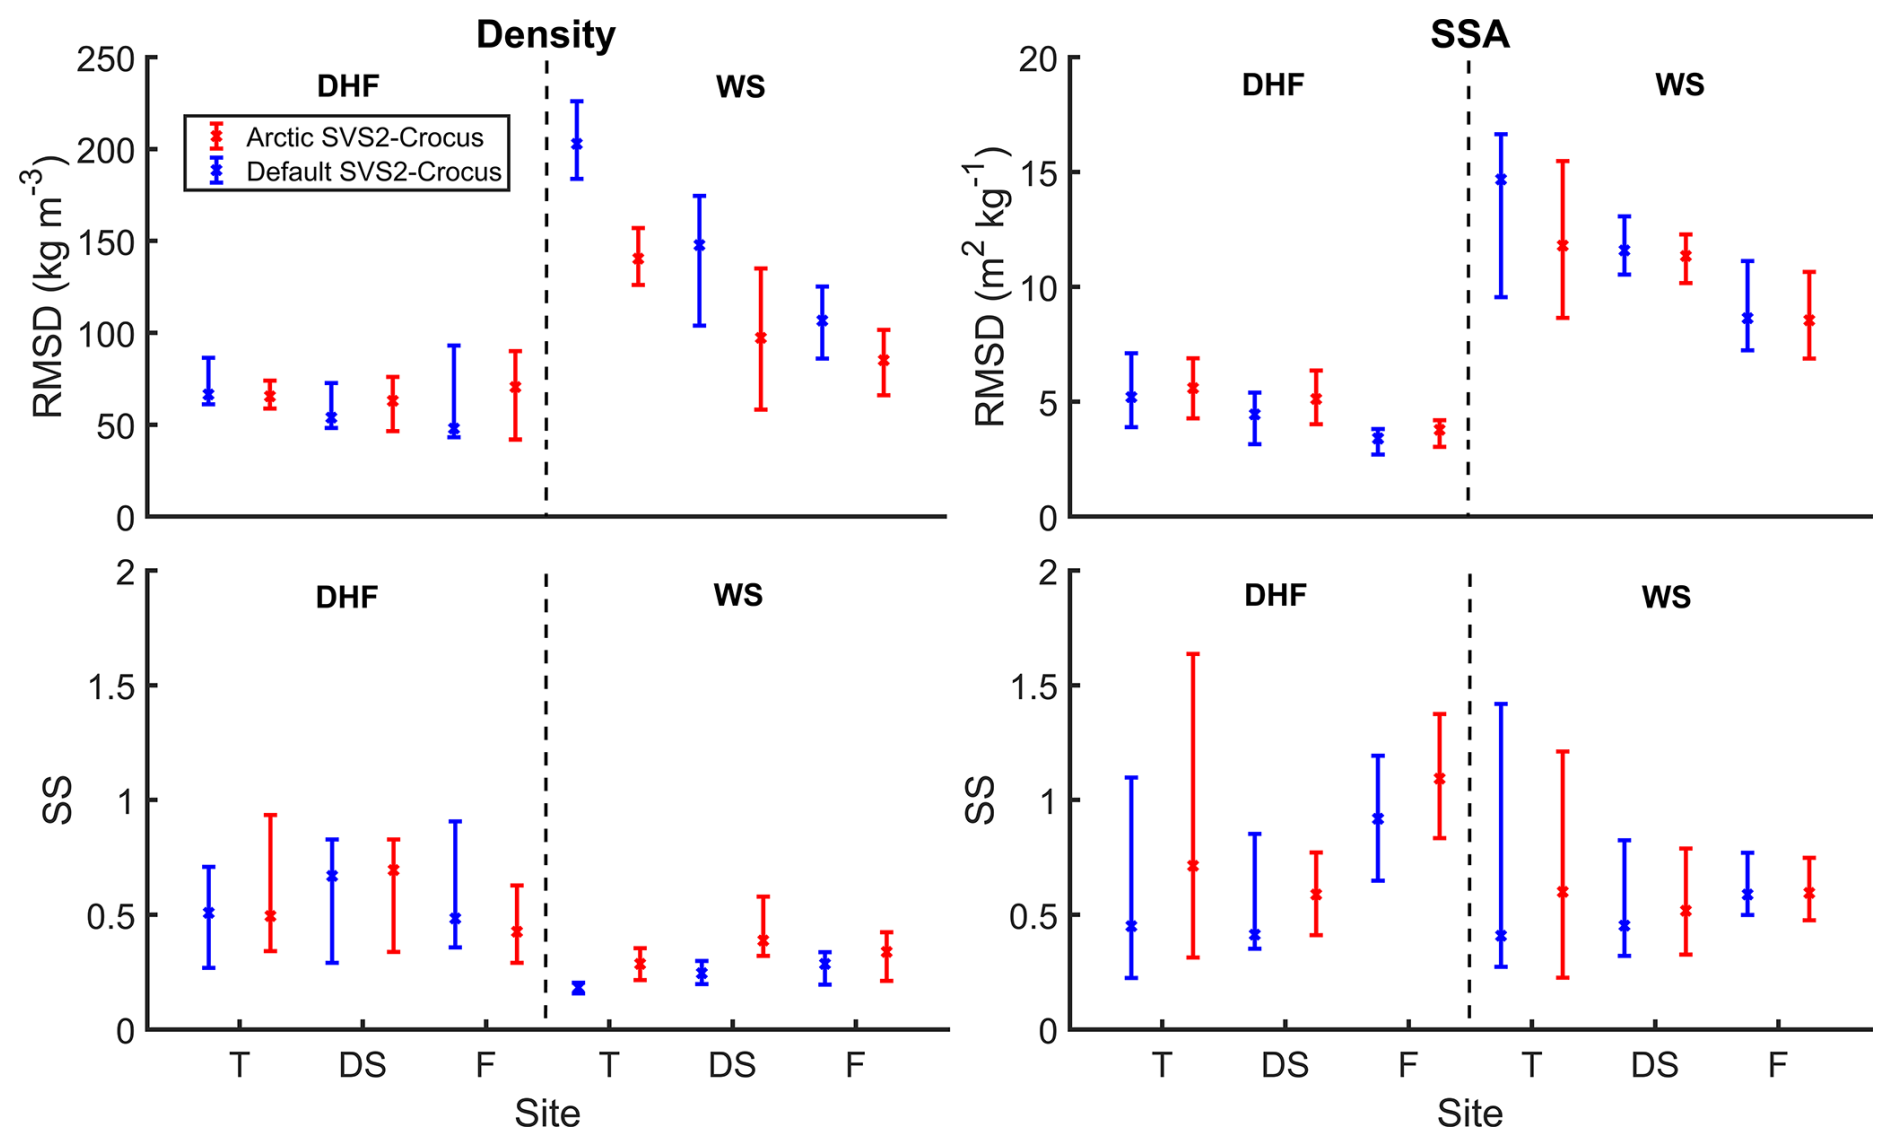
Figure 7RMSD and SS scores the simulation of density (kg m−3) and SSA (m2 kg−1) by default and Arctic SVS2-Crocus for different vegetation types (T: Tundra; DS: Deciduous Shrubs: F: Forest – described in Sect. 3.2.1) for the 2021/22 and 2022/23 field campaigns. Scores are separated for depth hoar (DHF) and wind slab (WS).
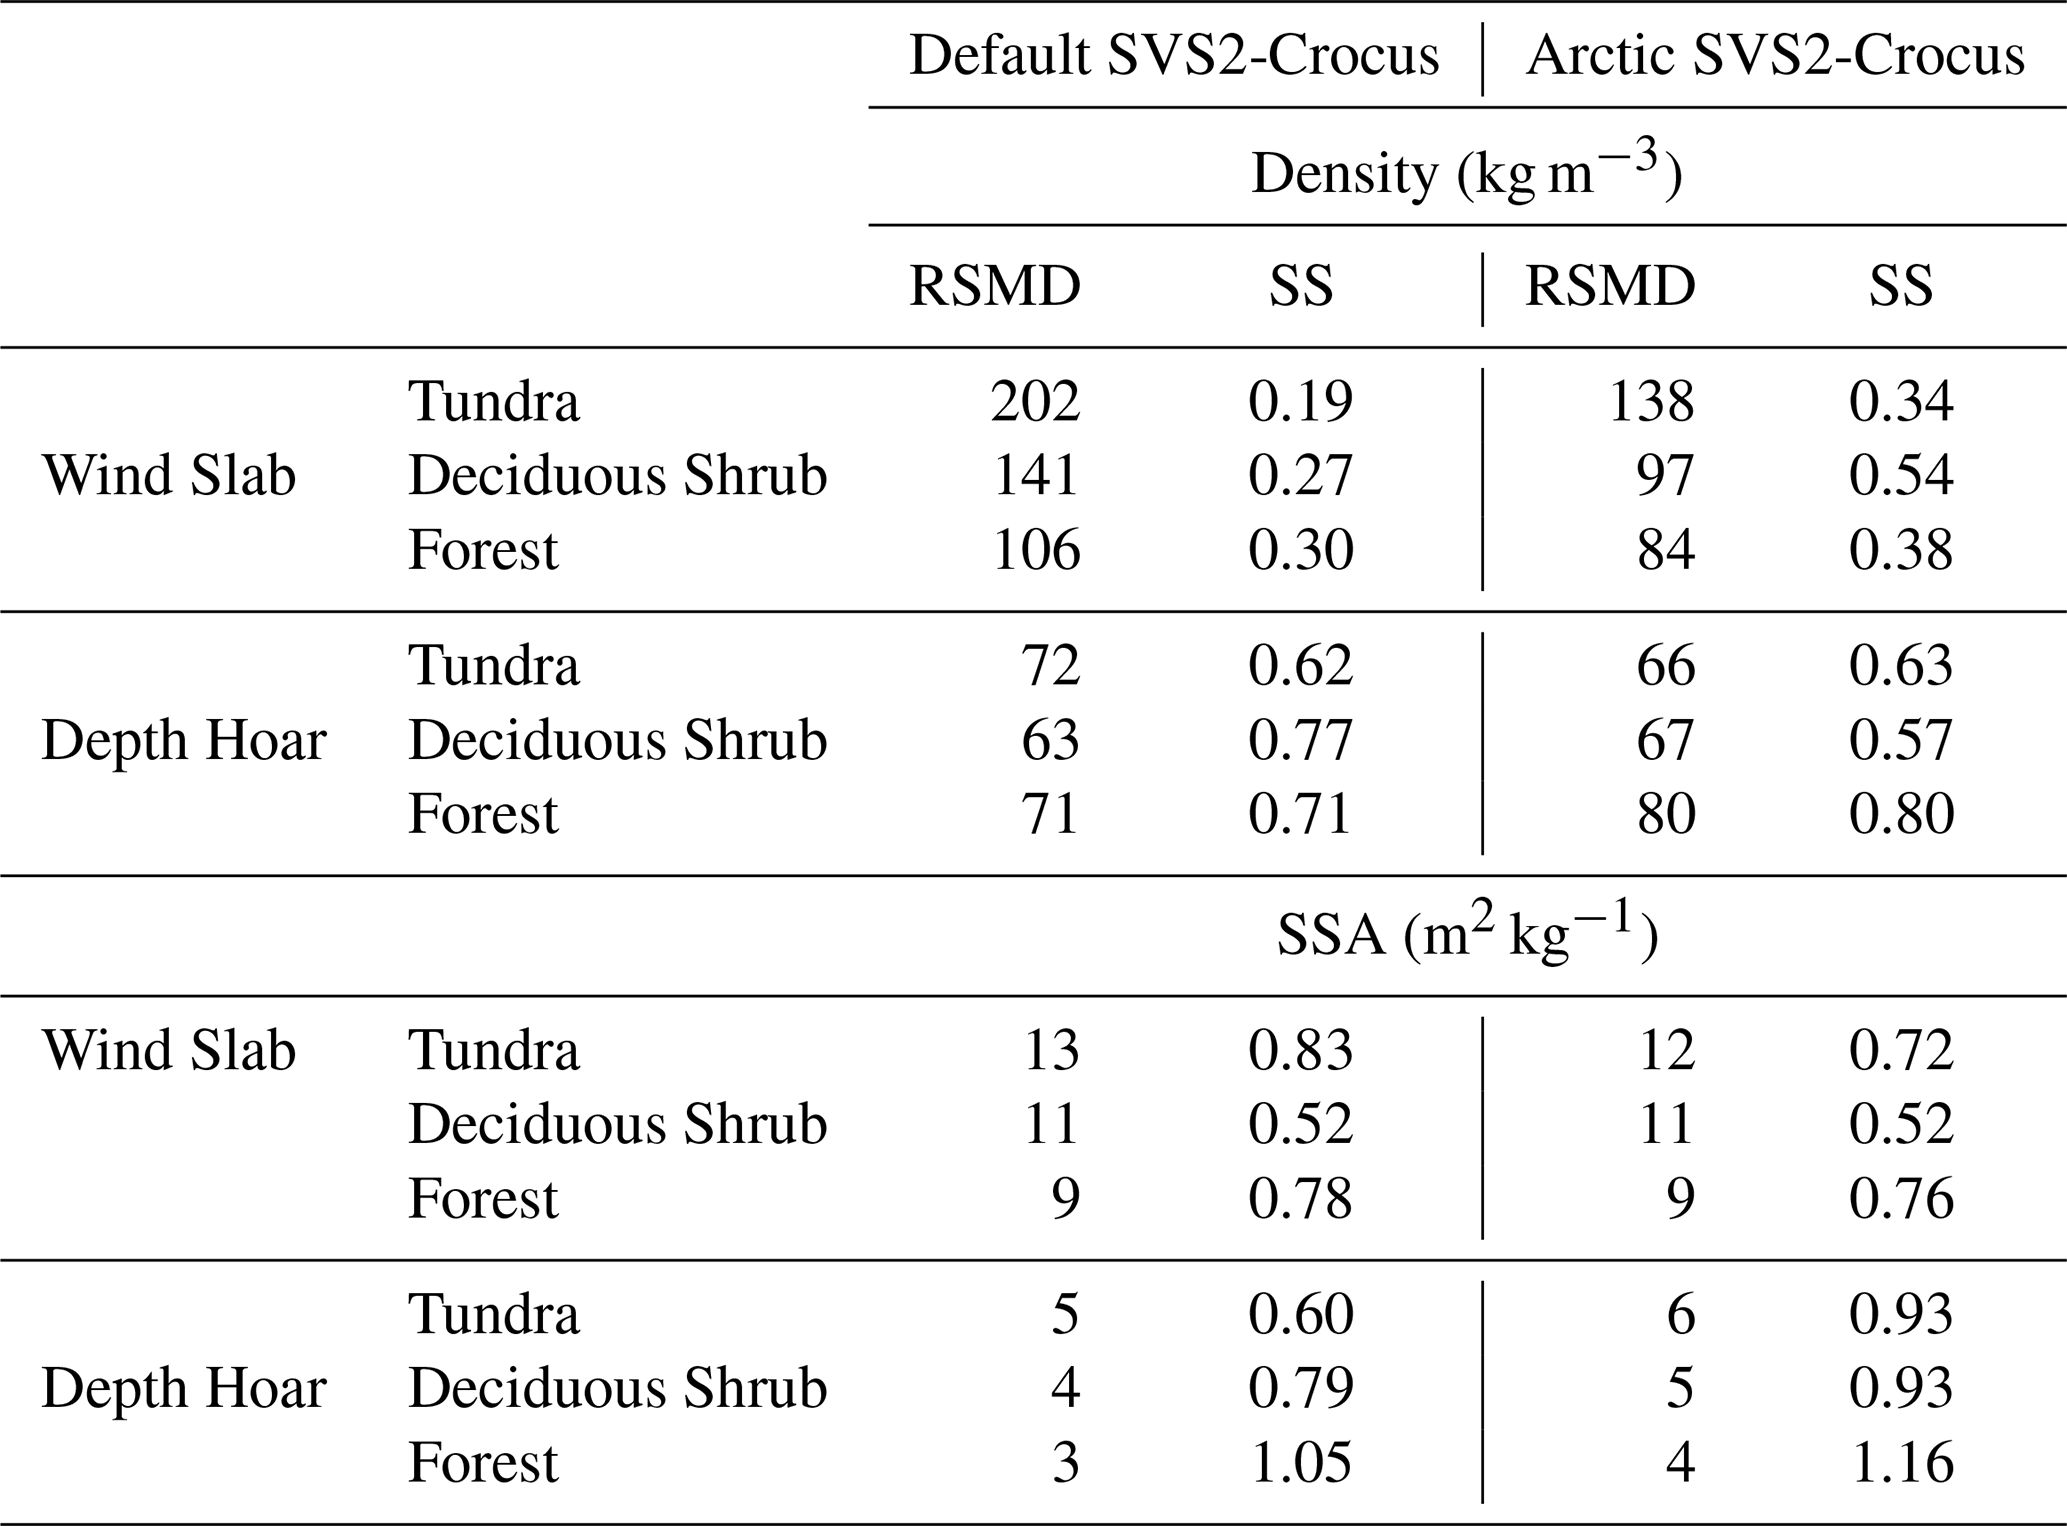
Table 1Mean RMSD and SS scores for measured and simulated snow density (kg m−3) and SSA (m2 kg−1) for combined 2021/22 and 2022/23 snow seasons. Statistics are presented for each layer (depth hoar and wind slab) and each vegetation type, as classified in Fig. 1: Tundra (Upper Plateau, Trail Valley Creek), Deciduous Shrub (Valley, Small Shrub, Mixed Shrub) and Forest (Shrub Tree and Havikpak).
Simulated basal layer densities by default and Arctic SVS2-Crocus range from ∼ 150 to ∼ 250 kg m−3 and are often too low in comparison to measurements. The RMSD of default SVS2-Crocus (Fig. 7, Table 1) for the simulation of basal layer density is lower than that of Arctic SVS2-Crocus (Fig. 7, Table 1) at deciduous shrub and forest sites for the 2021/22 and 2022/23 winters. Arctic SVS2-Crocus reduces the error at tundra sites (Fig. 7, Table 1). The parameterisations applied to Arctic SVS2-Crocus work to decrease basal layer density but are not effective in improving the overall error (Fig. 7). The compaction parameterisation within default SVS2-Crocus that simulates a profile of increasing density with snow depth results in basal densities that are in some cases similar to Arctic SVS2-Crocus despite the large underestimation in surface layer density (Figs. 5, 6 and 7, Appendix B). The SS of the Arctic SVS2-Crocus ensemble better captures the variability in measurements than of default SVS2-Crocus at deciduous shrub sites (Fig. 6, Table 1). Similar SS scores are observed at tundra sites (Fig. 7, Table 1) and an improvement using default SVS2-Crocus is found at forest sites (Fig. 7, Table 1).
Both default and Arctic SVS2-Crocus underestimate surface and basal layer SSA. Simulated SSA increases towards the surface, reaching a maximum value of 38 m2 kg−1 at Havikpak in March 2022, likely due to fresh snowfall and a reduced rate of wind-induced compaction resulting in lower density surface snow (Figs. 5 and 6, Appendix B). Arctic parametrisations contribute to a minor increase in the RMSD (Fig. 7, Table 1) in simulated basal layer SSA at all sites in comparison to default SVS2-Crocus (Fig. 7, Table 1). Both ensembles have similar error for simulation of surface layer SSA (Fig. 7, Table 1). Arctic SVS2-Crocus (Fig. 7, Table 1) better captures the variability in basal layer SSA than default SVS2-Crocus at tundra and deciduous shrub sites (Fig. 7, Table 1), due to greater ensemble spread. Default SVS2-Crocus (Fig. 7, Table 1) exhibits greater skill in capturing variability in surface layer SSA at tundra and forest sites (Fig. 7, Table 1) than at deciduous shrub. Simulated profiles of SSA exhibit a narrow spread in comparison to that of the measured profile, suggesting that the uncertainty in the metamorphism scheme is underestimated within SVS2-Crocus.
4.3 Simulated Ku-band backscatter
The exponential microstructure model, used within SMRT to compute the scattering coefficient, characterizes snow microstructure using the exponential correlation length which can be derived from SSA and density (Eq. 1; Picard et al., 2018). As Arctic parameterisations work to modify both SSA and density and since Ku-band frequency is highly sensitive to the snow grain size (Lemmetyinen et al., 2014), we investigate the impact of SSA and density on (a) the exponential correlation length (Fig. 8) and (b) the resulting snow backscatter (Fig. 9). Small errors in simulated basal SSA, which is underestimated by both default and Arctic SVS2-Crocus result in large errors in the optical diameter and in the exponential correlation length (Fig. 8). Low basal SSA values result in a correlation length that is too long (0.6 × 10⁻³–0.8 × 10⁻³ m) for the base of the snowpack in comparison to measurements (0.2 × 10⁻³ m). Errors in the simulation of surface layer SSA result in smaller errors in the exponential correlation length for the surface of the snowpack (Fig. 8). By substituting small simulated basal SSA values with larger snow pit measurements of SSA, the simulated exponential correlation length is shorter (0.2 × 10⁻³–0.3 × 10⁻³ m).
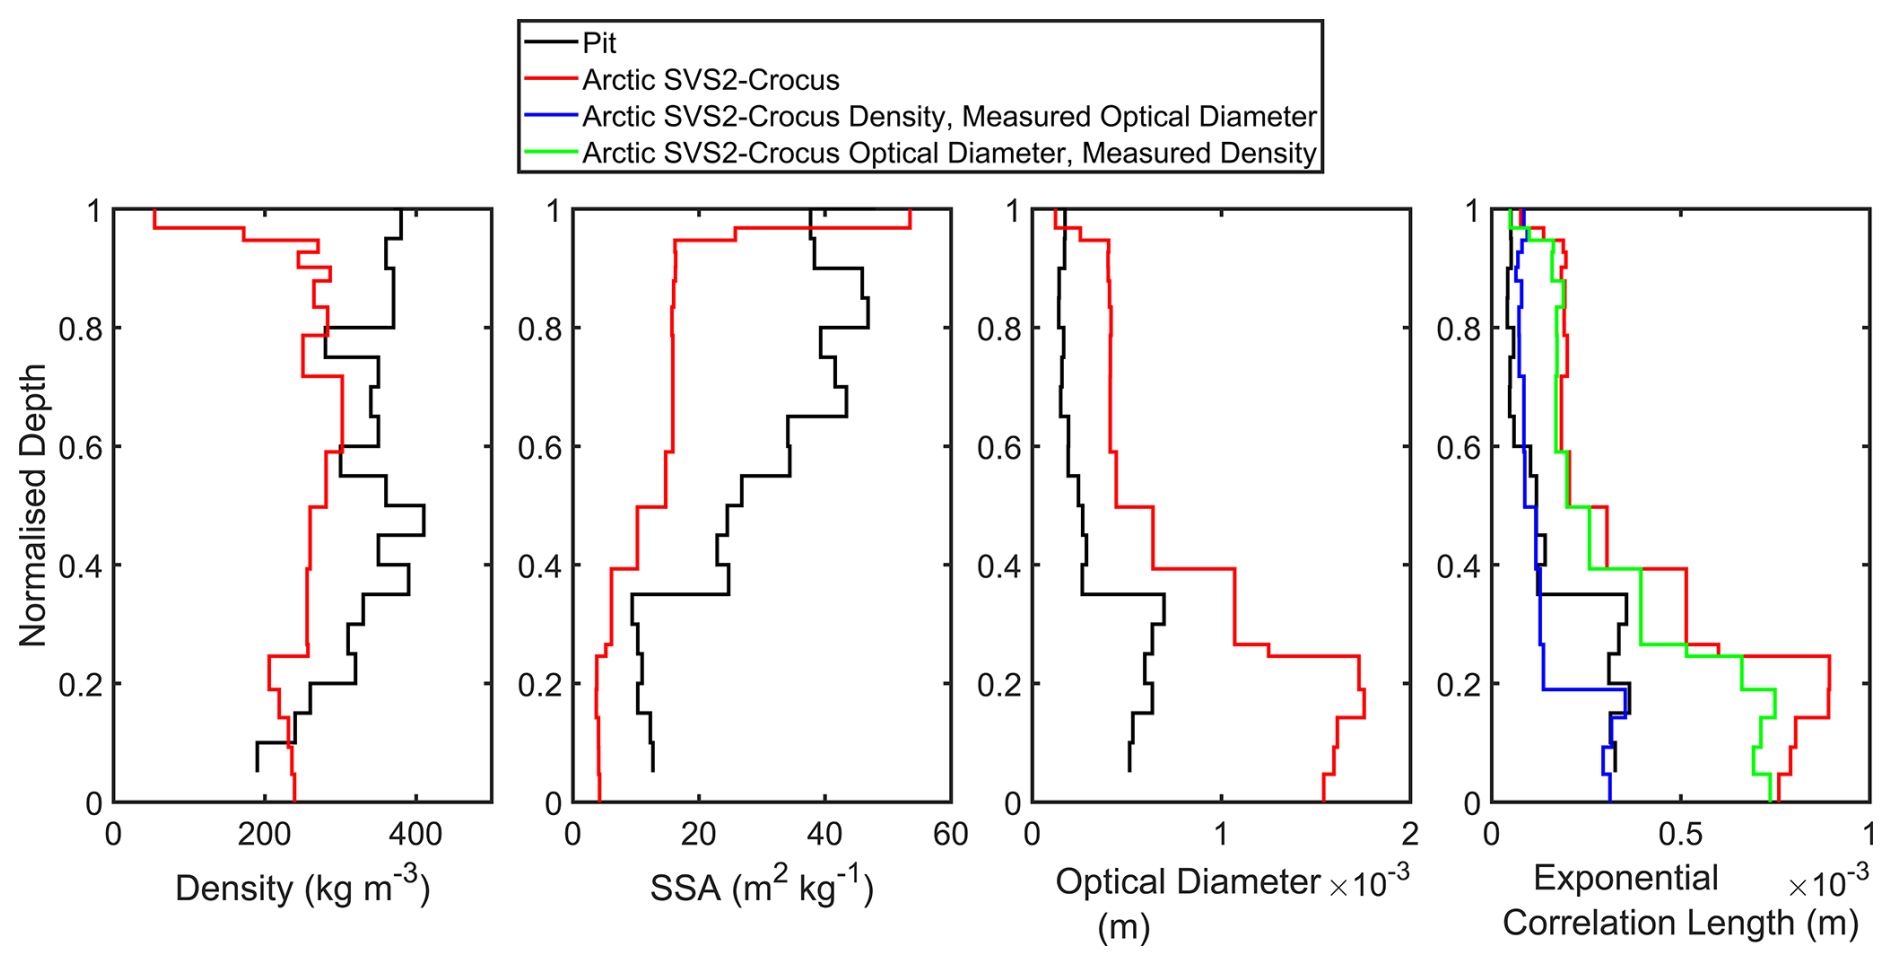
Figure 8Impact of density and optical diameter on the exponential correlation length at Trail Valley Creek (2021/22) simulated by Arctic SVS2-Crocus (Eq. 1). Simulated and measured SSA is also displayed. SSA is measured in the field but not computed directly by SVS2-Crocus therefore, simulated values were derived from the simulated optical diameter using: SSA = where D is the optical diameter and ρice is the density of pure ice (917 kg m−3).
Figure 9 compares two sets of backscatter simulations at Ku-band frequency (13.5 GHz). The first set of simulations uses snow pit measurements as inputs to SMRT (“Pit Simulated Backscatter” in Fig. 9). The second set of simulations uses simulated snowpack properties from default and Arctic SVS2-Crocus as inputs to SMRT (“Multi-Layer/3-Layer SVS2 Simulated Backscatter” in Fig. 9). The error in simulated backscatter is greater when using Arctic SVS2-Crocus due to a larger underestimation in basal SSA which results in an overestimation of the exponential correlation length and increased scattering. Across all sites, pit simulated backscatter varies from −5.9 to −14.3 dB whereas SVS2-Crocus simulated backscatter varies from −2.7 to −13.4 dB (Fig. 9). Both default and Arctic SVS2-Crocus overestimate backscatter (Fig. 9; ranging from −5 to −10 dB) in comparison to simulated backscatter using snow pit measurements (Fig. 9; ranging from −10 to −14 dB). The RMSD when using default SVS2-Crocus is greatest at Upper Plateau (mean RMSD: 5.0 dB) whereas the RMSD for Arctic SVS2-Crocus is greatest at sites Mixed Shrub and Shrub Tree (mean RMSD 6.6 dB). At Small Shrub and Shrub Tree, the difference in simulated basal SSA between default and Arctic SVS2-Crocus exceeds that of other sites (Figs. 5 and 6, Appendix B), leading to no overlap in ensemble ranges for backscatter simulation (Fig. 9), highlighting the impact of basal SSA errors.
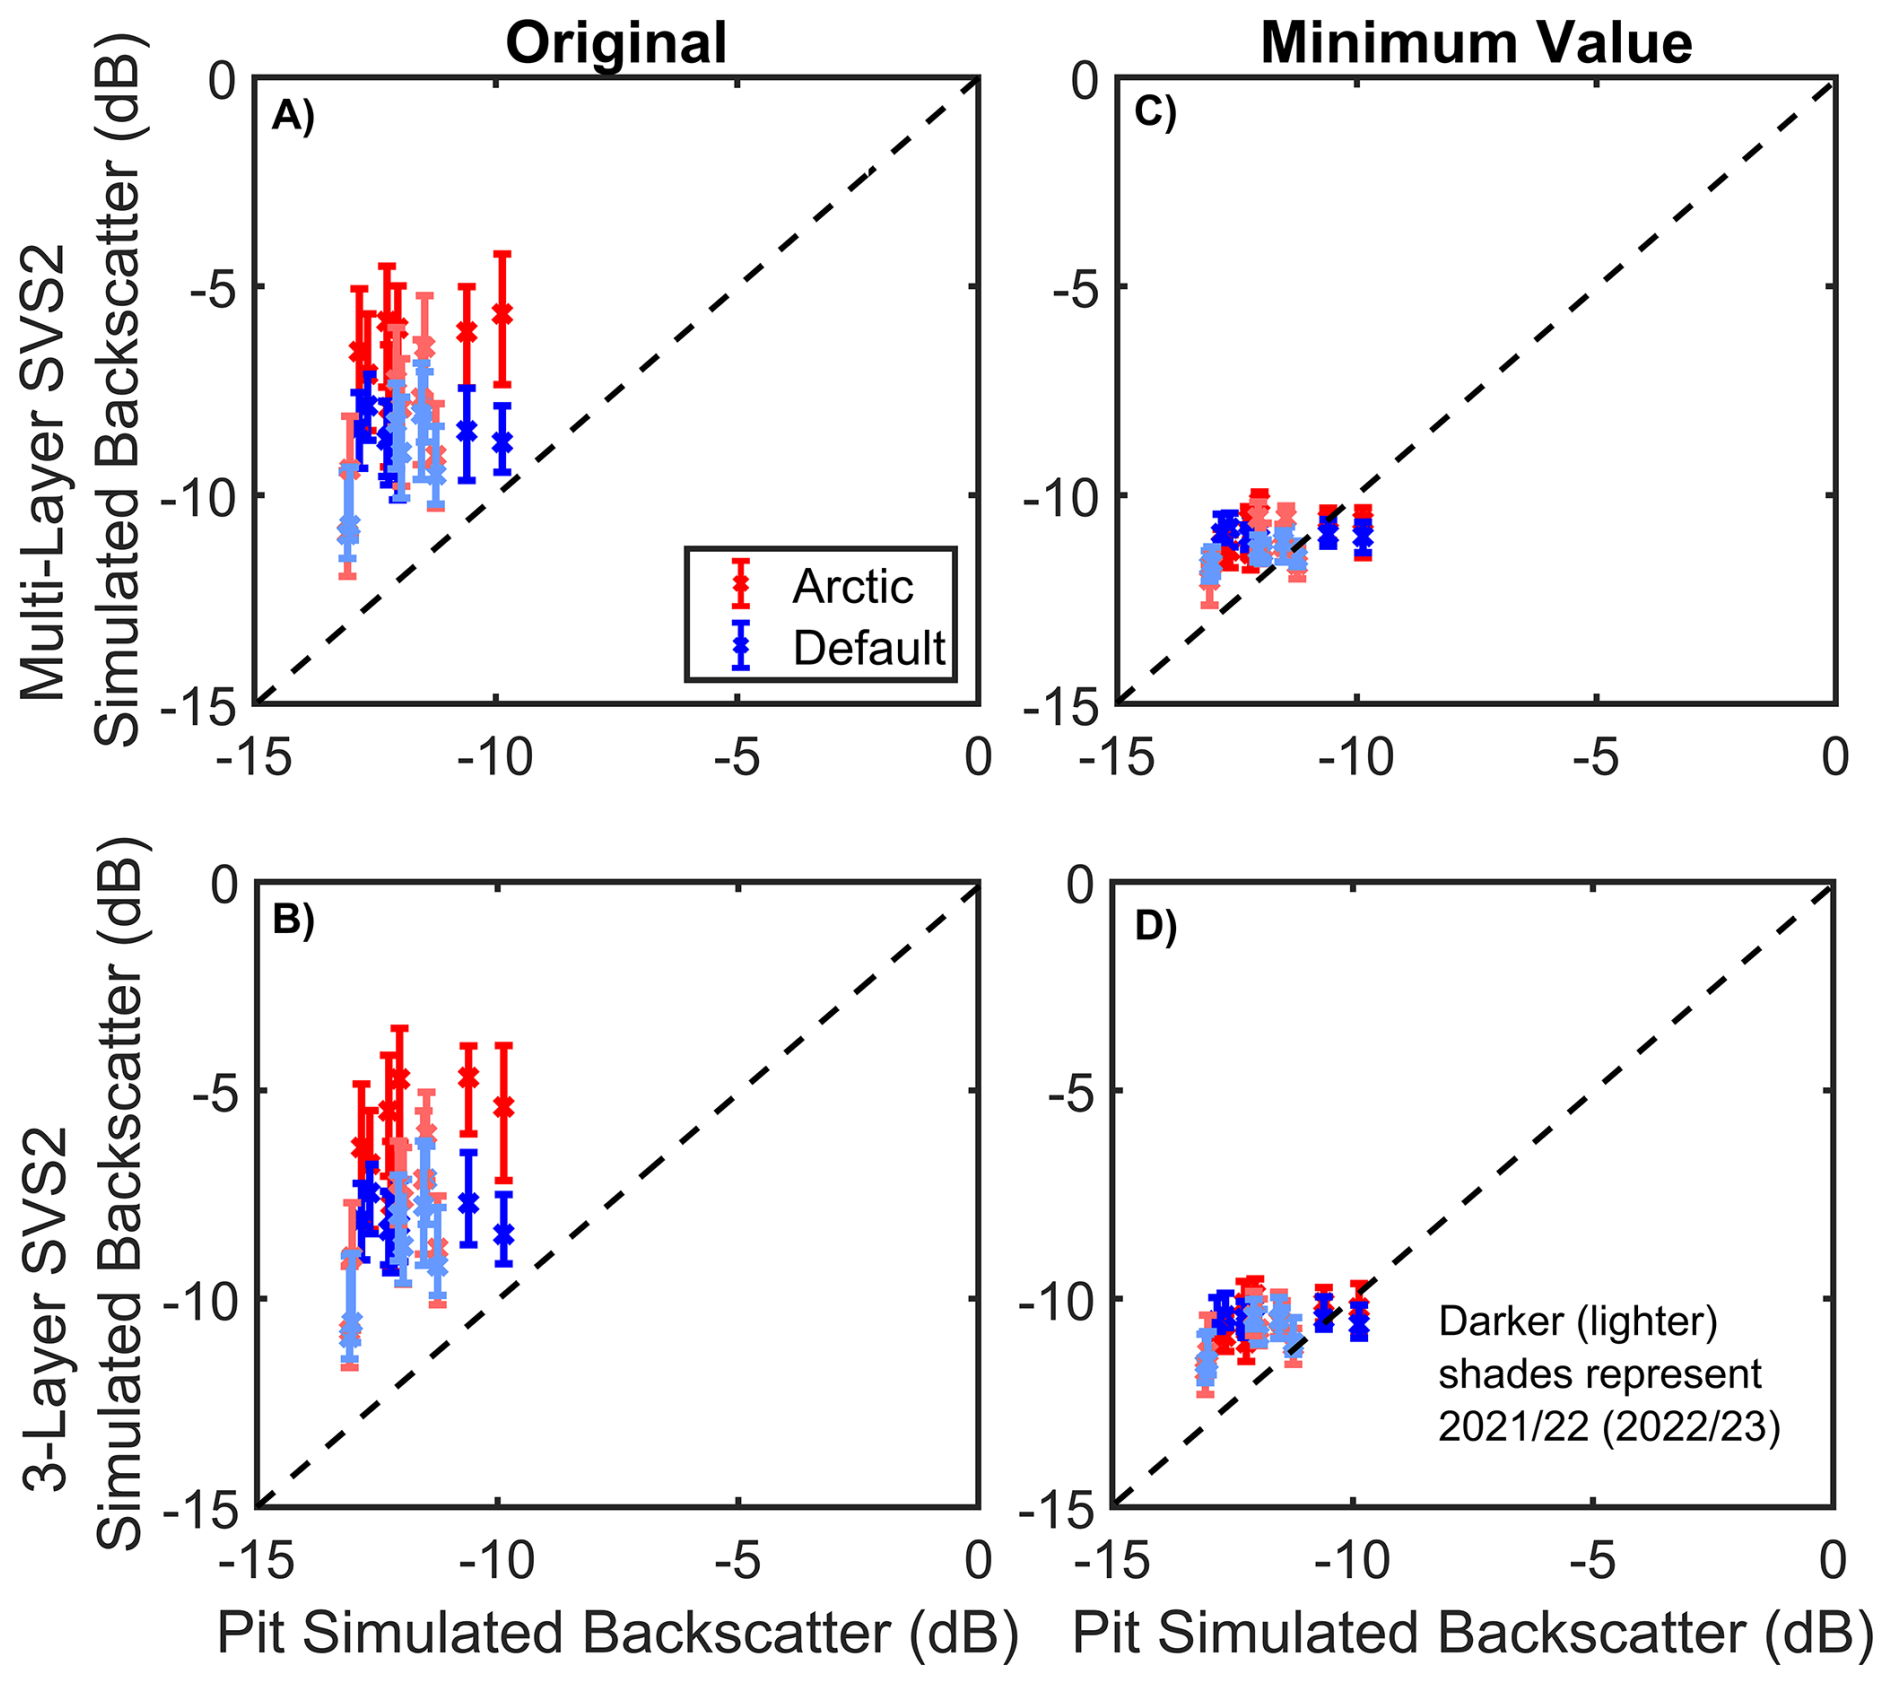
Figure 9Comparison between pit simulated backscatter and SVS2-Crocus simulated backscatter for a multi-layer (A, “Original”) and 3-layer (B, “Original”) radar equivalent snowpack (interquartile range, median) for the 2021/22 and 2022/23 winter seasons at Ku-band frequency (13.5 GHz). (C, D) Comparison with a minimum SSA of 8.7 m2 kg−1 (“Minimum Value”; maximum optical diameter equivalent 0.75 mm).
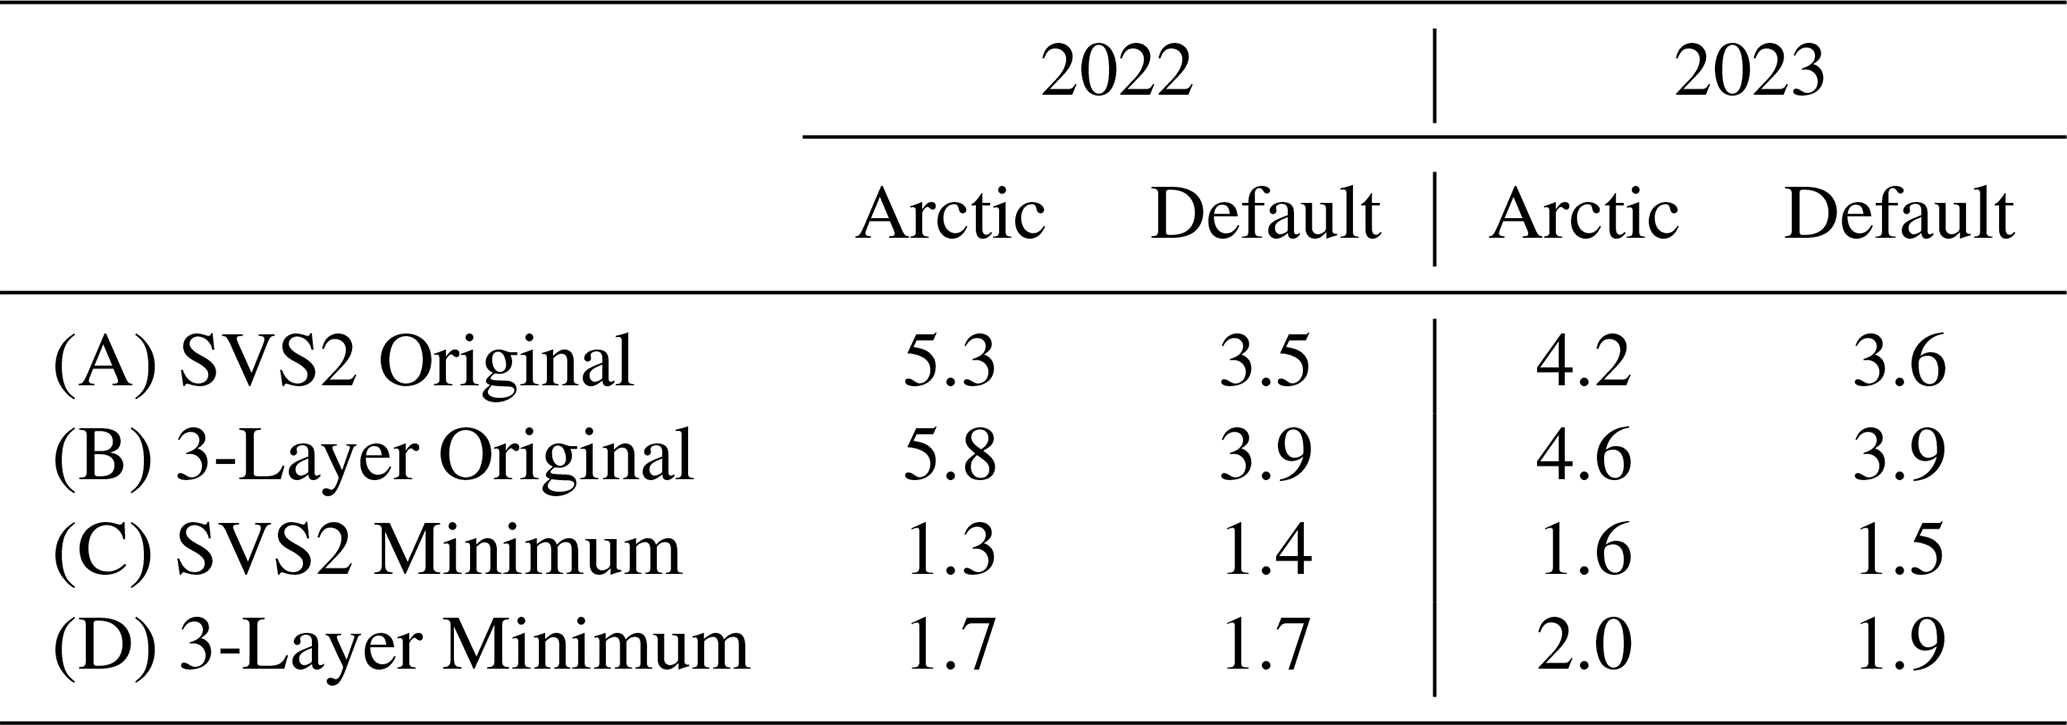
Table 2Mean RMSD between simulated SVS2-Crocus backscatter and snow pit simulated backscatter (dB) for all seven sites for the 2021/22 and 2022/23 winter seasons. Separated for default and Arctic SVS2-Crocus. Letters refer to panels on Fig. 9.
As the underestimation in basal SSA values simulated by both default and Arctic SVS2-Crocus have a large impact on the simulation of snow backscatter, we addressed this bias by constraining the minimum SSA of the snow grains to a value of 8.7 m2 kg−1 (Fig. 9c and d). The selected value represents the average median DHF value from all pit measurements at all sites and removes the effect of unrealistically low simulated SSA values. Implementing a minimum SSA value removes the influence of large snow grains on the simulation of snow backscatter and allows the simulation of a weaker backscatter that is more representative of simulated snow pit backscatter (values ranging between −10 to −12 dB). Applying a minimum SSA value also reduces the difference between default and Arctic SVS2-Crocus suggesting this method constrains a key model uncertainty that contributes towards the inaccurate simulation of snow backscatter (Fig. 9c and d; Table 2: C). The average RMSD of all sites is reduced when applying a minimum value by 59 % for default SVS2-Crocus and 67 % for Arctic SVS2-Crocus for 2021/22 and 2022/23. The overall reduction in the RMSD for Arctic SVS2-Crocus is greater than that of default SVS2-Crocus, suggesting the improved simulated density profile contributes to the improved simulation of backscatter when the large influence of low SSA values is removed.
A simulated radar-equivalent snowpack is able to replicate the scattering behaviour of the multi-layer snowpack, resulting in an RMSD below 1 dB (Table 2) at all sites except for Shrub Tree (RMSD: 1.32 dB) and Havikpak (RMSD: 1.30 dB) in 2022 where snowpacks are deeper and more complex than in 2023 (Fig. 4). The overestimation in simulated backscatter when compared to snow pit simulated backscatter is consistent between both multi-layer (Table 2: A) and 3-layer simulations (Table 2: B). Following the pattern of the multi-layer snowpack, implementing a minimum SSA values reduce the RMSD at all sites when using a radar-equivalent snowpack by 54 % (default SVS2-Crocus) and 65 % (Arctic SVS2-Crocus) for 2021/22 and 2022/23. The computation time in SMRT simulations was reduced by 60 % by simplifying the multi-layer snowpack (∼ 20 layers) to a radar equivalent snowpack (3 layers). The radar-equivalent snowpack can therefore increase the computational efficiency for SWE retrieval algorithms without altering the scattering behaviour.
Accurate simulation of profiles of snow density, and especially SSA, by physical snowpack models are crucial inputs to radiative transfer models for accurate estimation of SWE (Derksen et al., 2021; Tsang et al., 2022). Consequently, to assess the reliability of forward model simulations driven by SVS2-Crocus, which are a requirement to inform the inversion of SWE from backscatter measurements, an evaluation of simulated density and SSA by SVS2-Crocus was first conducted across the forest-tundra ecotone to quantify uncertainties in the representation of physical snow properties (Sect. 5.1). Analysis then follows of the impact uncertainties in simulated density and SSA have on the simulation of Ku-band backscatter (Sect. 5.2).
5.1 Impact of vegetation on simulated snowpack properties
Evaluation of SVS2-Crocus driven by HRDPS meteorological forcing data across the forest-tundra ecotone demonstrates that Arctic modifications are effective in representing the impact of vegetation by reducing the error in the simulation of bulk snowpack properties, enhancing the spatial transferability of Arctic SVS2-Crocus. Both default and Arctic SVS2-Crocus simulated the observed increase in snow depth that occurs across the forest-tundra ecotone where taller shrubs and sparse evergreen needleleaf forest canopies trap snow (Essery and Pomeroy, 2004) and reduce wind speed minimising snow redistribution (Roth and Nolin, 2017) and compaction (Gouttevin et al., 2018) within shrubs and beneath tree canopies. At tundra sites, where vegetation is low and wind speeds are high, Arctic modifications are effective in counteracting the dominance of compaction due to the weight of the overlying snow within SVS2-Crocus (Vionnet et al., 2012), working to decrease snow depth and increase bulk density in line with measurements (Woolley et al., 2024; Royer et al., 2021b; Lackner et al., 2022). The addition of a canopy module within SVS2-Crocus allowed for snow-forest interactions to be simulated but led to an underestimation in bulk density at all forested sites due to uncertainties in the HRDPS wind speed and in the parameterisation of below-canopy wind speed. Furthermore, SVS2-Crocus does not simulate the evolution of snow properties in the canopy due to metamorphism and classifies unloaded snow as fresh snowfall (Lumbrazo et al., 2022). Implementing a parameterisation that considers the density and microstructure of snow within the canopy may reduce the underestimation in simulated bulk density (Bouchard et al., 2024). As the sites selected for use within this study represent the edge of the forest-tundra ecotone where forest canopies are sparse (< 15 %) and wind speed plays a role in shaping the snowpack (Derksen et al., 2014), current parameterisations designed for dense canopies may be inappropriate for these environments.
Coupling of SVS2-Crocus and HRDPS successfully simulated snowpack properties at sites where in situ meteorological data were not available, supporting the use of the coupling within future studies and the need for such datasets for research at remote sites. Implementing wind effect modifications into Arctic SVS2-Crocus reduced the error in the simulation of surface snow density at all sites across the forest-tundra ecotone by an average of 29 %. Parameterising wind-induced compaction, the impact of wind on fresh snow density, and raising the maximum density impacted by wind in surface layers, reduced the error in Arctic SVS2-Crocus simulations in comparison to default SVS2-Crocus, confirming the ability of Arctic SVS2-Crocus to generate more realistic simulations of surface layer density at a wide range of sites across the forest-tundra ecotone. As Arctic SVS2-Crocus exhibits an improved ensemble dispersion (SS value closer to 1) at all sites, it suggests that the optimal skill of the Arctic parameterisations are better suited to Arctic environments when compared to default SVS2-Crocus. Although wind effect modifications work to improve the simulation of surface snow density in comparison to default SVS2-Crocus, simulated values are still underestimated when compared to measurements. Comparing Arctic SVS2-Crocus simulations at Trail Valley Creek using in situ meteorological data (see Fig. 6 of Woolley et al., 2024) with simulations using HRDPS forcing within this study (Appendix B), we find a 43 % increase in RMSD for surface layer density. The decreased accuracy indicates that the simulated results deviate more from observed values when relying on HRDPS meteorological forcing data, suggesting an underestimation in HRDPS wind speed and associated wind-induced compaction. Furthermore, the HRDPS forcing was used without downscaling to the local scale of the field sites. This introduces additional uncertainty in the simulations, arising from both inherent errors and biases from the HRDPS forecasts and from the mismatch between the 2.5 km HRDPS grid and the smaller-scale variability captured by our 1 km snow measurements transects. At non-forested sites, the reduction in the RMSD is greater (31 %; tundra and deciduous shrubs) than at forest sites (21 %; forest) as the compaction effects of the Arctic parameterisations at forested sites are inhibited by the parameterisation of below-canopy wind speed. Despite inclusion of a canopy parameterisation that incorporates a weighted average of the wind profile in open and closed environments (Mazzotti et al., 2024), the reduction in wind speed was too high for sparse canopies, reducing the rate of wind-induced compaction, leading to an underestimation in surface layer density.
Statistically, basal vegetation effect modifications do not improve the simulation of basal layer density when compared to default SVS2-Crocus, but modifications are necessary to simulate a physically representative density profile in an Arctic environment. Without the basal vegetation effect modifications, default SVS2-Crocus would simulate a profile of increasing density due to the dominance of compaction, which when combined with the wind effect modifications would lead to basal densities that are overestimated. The statistical analysis of basal vegetation effect modifications within this study is limited as density measurements in layers close to the base of the snowpack are often impeded by shrubs. The ability to select the height of polar vegetation with Arctic SVS2-Crocus simulations is a key feature that allows for the impact of differing shrub height between sites to be represented that is not considered within default SVS2-Crocus. Polar vegetation height in SVS2-Crocus represents low vegetation (e.g. shrubs and sedges) that affect basal snow properties by reducing compaction and wind-packing. A fixed value (0.1–0.35 m), representative of shrub and understory vegetation measured in snow pits along each 1 km transect during the March 2021/22 and 2022/23 field campaigns was used for all simulations and represents bending and compression of shrubs due to the weight of the overlying snow at the time of measurement (Belke-Brea et al., 2020; Ménard et al., 2014). SVS2-Crocus does not currently consider the progressive bending of shrubs when snow accumulates during winter, which represents a model limitation. At forested sites, polar vegetation height refers to only the understory layer, while the tree height is separately defined in the canopy scheme. Some simulated profiles can be shallower than measured profiles as a function of the precipitation inputs meaning some polar vegetation heights encompass much of the simulated profile. This is particularly evident at sites Small shrub and Mixed shrub, where the selected height of polar vegetation causes the basal vegetation effect modifications to activate at greater snow depths (Figs. 5 and 6, Appendix B). As a result, the basal vegetation effect modifications work to counteract wind-induced compaction and reduce the impact of the wind effect modifications. Future work could focus on revising the parameterisation of basal vegetation modifications. For example, SVS2-Crocus does not currently account for several shrub-related processes such as changes in winter surface albedo due to erected shrubs (Belke-Brea et al., 2020), alterations in solar radiation transmission within the snowpack (Domine et al., 2025), or thermal bridging through shrub branches affecting the underlying soil (Domine et al., 2022). Considering the effect of polar vegetation within the base of an Arctic snowpack is crucial as shrubification of the Arctic is expected with a warming climate (Sturm et al., 2001; Nill et al., 2022).
Much previous work illustrating the need for Arctic specific parameterisations for the simulation of snowpack properties has focused on improving the density profile, supporting simulations of soil temperatures and permafrost modelling (Royer et al., 2021b; Lackner et al., 2022; Barrere et al., 2017; Gouttevin et al., 2018). Uncertainties in simulations of SSA highlighted within this study now push the focus towards the importance of improving parameterisations of snow metamorphism for SWE retrieval (Derksen et al., 2021; Tsang et al., 2022) and data assimilation (Larue et al., 2018). Although IceCube may overestimate measurements of SSA for depth hoar grains (Martin and Schneebeli, 2023), simulated SSA by both default and Arctic SVS2-Crocus lie outside the range of typical measurements found within the Arctic (Montpetit et al., 2024; Woolley et al., 2024; Rutter et al., 2019). Uncertainties in the simulation of SSA by SVS2-Crocus could stem from the growth of depth hoar in the metamorphism scheme (Marbouty, 1980) or the optical diameter (Carmagnola et al., 2014; Libois et al., 2014; Morin et al., 2013). The parameterisation of Marbouty (1980) is not well suited to simulate the optical size of depth hoar grains and should be revised for Arctic snowpacks with strong temperature gradients. Tundra sites, Trail Valley Creek and Valley, experience the largest underestimation in SSA suggesting the shallow snowpacks (mean Trail Valley Creek SD: 0.37 m; mean Valley SD: 0.41 m) generate strong temperature gradients and further increase the rate of metamorphism (Wang and Baker, 2014).
5.2 Capacity to simulate snow backscatter
Low basal layer SSA values simulated by both default and Arctic SVS2-Crocus have a large impact on simulated Ku-band backscatter. The short wavelength at Ku-band (13.5 GHz) is sensitive to the coarse and large basal snow grains simulated by SVS2-Crocus as their size is comparable to the wavelength, scattering the radar signal more effectively and enhancing the backscatter signal through Mie scattering (Fung, 1994). Shallow snowpacks further enhance the effect of Mie scattering from large snow grains and reduce the available contribution to volume scattering in Arctic tundra environments (King et al., 2015; Tsang et al., 2022). This is evident at sites with shallow snow depths and the most pronounced underestimation in SSA (Valley and Upper Plateau), where the RMSD in simulated backscatter is highest. The vegetation types present at Valley and Upper Plateau sites (e.g. grasses and small shrubs) are also prone to developing shallower and more spatially heterogeneous snowpacks due to wind scouring and redistribution (Derksen et al., 2014; Woolley et al., 2024), which may further increase the sensitivity of backscatter estimates by enhancing variability in wind slab to depth hoar ratios under shallow snow conditions. Although density is known to contribute to scattering within the snowpack by altering the ice–air interfaces (King et al., 2015), the impact on the exponential correlation length is secondary to that of SSA as it does not directly influence the spatial arrangement of the snow crystals (Fig. 8; Rott et al., 2009; Tsang et al., 2022). Reducing the number of SVS2-Crocus simulated layers through the approach of Meloche et al. (2025) preserves snowpack scattering characteristics and ensures snow backscatter simulations are reproduced within 1 dB accuracy. A 60 % increase in computational gain using the radar-equivalent snowpack suggests that this approach can effectively increase the computational efficiency needed for SWE retrieval algorithms.
An improved simulation of snow backscatter can be achieved by implementing a minimum SSA value of 8.7 m2 kg−1, reducing the scattering effect of the snowpack. Implementing a minimum SSA value removes the influence of large snow grains and constrains a key model uncertainty when simulating backscatter. Although the polydispersity value was assumed to be 1 for all simulations, a fixed value of K provided a consistent configuration suitable for our analysis of simulated SVS2-Crocus backscatter versus simulated pit backscatter. Typical polydispersity values based upon measurements in tundra snow range from 0.6–0.75 for rounded grains and 1.1–1.9 for depth hoar (Montpetit et al., 2024; Picard et al., 2022; Sandells et al., 2024), which relate to the two-layer nature of an Arctic snowpack (Derksen et al., 2014). However, few studies have applied a polydispersity parameter to simulated output, where typical Arctic depth hoar polydispersity (1.1–1.9) values amplify the influence of larger simulated snow grains (low SSA/high optical diameter), increasing the exponential correlation length and the simulated microwave scattering. Consequently, instead of accounting for polydispersity in SVS2-Crocus, this analysis focuses on accurate estimation of SSA.
Implementing a minimum SSA value further reduces the error in the simulation of backscatter by both default and Arctic SVS2-Crocus by directly reducing the grain size and scattering effect of the snowpack, resulting in a weaker backscatter that is more representative of measurements. Although reducing the scattering effect of large snow grains allows density to contribute to the simulation of backscatter, basal vegetation effect modifications do not improve basal layer density, resulting in backscatter simulations remaining similar for both default and Arctic SVS2-Crocus. The spread of simulated backscatter with a minimum SSA value exhibits less variability compared to pit simulated backscatter. As the SVS2-Crocus simulated SSA and density profiles (Figs. 5 and 6) show less variability than measured profiles, removing values below 8.7 m2 kg−1 further reduces the variability, making the SVS2-Crocus spread appear flatter relative to the pit simulated backscatter. However, as the variability in backscatter for both the default and Arctic SVS2-Crocus ensemble is reduced by reducing the scattering effects of the snowpack at all sites, it is suggested that the impact of low SSA values on the simulation of snow backscatter are greater than the snow model uncertainty due to parameterisation of snow processes captured by default and Arctic SVS2-Crocus (Woolley et al., 2024; Lafaysse et al., 2017).
SVS2-Crocus simulates both bulk properties (e.g. SWE) and the vertical structure of snow layers over large domains, driven by distributed meteorological forcing from numerical weather prediction systems, surface analyses or reanalyses (Vionnet et al., 2012, 2025). Errors in simulated SWE arise from uncertainties in the meteorological forcing, and structural limitations in the representation of snow and land surface processes (Lafaysse et al., 2017). These errors can be reduced by assimilating SWE observations in SVS2-Crocus. However, in situ SWE measurements are spatially sparse across the Arctic, which limits the effectiveness of data assimilation when relying solely on ground-based networks. To address this limitation, current and future satellite missions aim to retrieve SWE from Ku-band backscatter over continental scales. Reliable SWE retrieval at Ku-band (e.g. Montpetit et al., 2025) requires a priori information on snow microstructure, which can be provided by SVS2-Crocus. Improvements to the simulation of snow SSA and Ku-band backscatter progress our capacity to retrieve SWE from satellites (Carmagnola et al., 2014; Libois et al., 2014), which will be crucial for understanding the impact of climate change in seasonally snow-covered environments (Derksen et al., 2021; Larue et al., 2018).
Through evaluation of the simulation of snowpack properties at 7 sites across the forest-tundra ecotone for two winter seasons (2021/22 and 2022/23), the spatial transferability of Arctic SVS2-Crocus from Woolley et al. (2024) driven by HRDPS meteorological forcing has been assessed. Implementing wind effect modifications in Arctic SVS2-Crocus improves the simulation of surface snow density at all sites across the forest-tundra ecotone and contributes to an improved simulation of snow depth and bulk density by capturing the effects of wind-induced compaction. Simulations at sites with no forest canopy, tundra and deciduous shrub, yield the largest reduction in the RMSD (31 %) of surface snow layers as wind speed is a dominant driver in the formation of wind slab snow layers. The addition of a forest canopy module within SVS2-Crocus allows for the simulation of snow-forest interactions which is an important feature for large-scale simulations that include forested environments. Despite this, the parameterisation of below-canopy wind speed inhibits the ability of the wind effect modifications to compact the surface layers of the snowpack and should be revised for areas of low canopy density (< 20 %), where wind speed plays a large part in compacting surface layers.
The basal vegetation effect modifications do not statistically improve the simulation of low-density basal layers but are necessary to simulate a physically representative Arctic density profile without parameterisation of water vapour flux. The ability to dynamically change the height of polar vegetation is a key feature of Arctic SVS2-Crocus, not available in default SVS2-Crocus, which represents the impact of polar low vegetation (shrubs) on basal layer density. Both default and Arctic SVS2-Crocus underestimate basal and surface layer SSA at all sites across the forest-tundra ecotone in comparison to measurements due to uncertainties in the metamorphism scheme which should be revised for Arctic environments. Expansion of shrubs and increased vegetation density across the Arctic is projected (Mekonnen et al., 2021; Ernakovich et al., 2014) and so the ability to simulate the impact of changing vegetation on snowpack properties using Arctic SVS2-Crocus is important to understand future impacts of climate change in a rapidly warming region.
Scaling the scattering effect of snowpack microstructure by implementing a minimum SSA (8.7 m2 kg−1) improved the simulation of snow backscatter at Ku-band frequency at all sites across the forest-tundra ecotone. The simulation of snow backscatter was found to be highly sensitive to low simulated SSA values leading to large errors and an overestimation in backscatter when compared to backscatter simulations initialized with snow pit measurements. This is in part due to the sensitivity of Ku-band to snowpack properties in basal layers, but also due to uncertainties in the SVS2-Crocus snow metamorphism scheme. The ability to provide an improved simulation of backscatter using the coupling of SVS2-Crocus and SMRT is a requirement to SWE retrieval algorithms for potential future radar missions. Reducing the number of SVS2-Crocus simulated layers through the approach of Meloche et al. (2025) retained the scattering behaviour of the snowpack and produced an accurate simulation of snow backscatter that was within 1 dB of the multi-layer snowpack, contributing to a reduction in computational complexity (60 %) for SWE retrieval. As satellite remote sensing is our only means to monitor SWE at continental scales, improvements to simulation of snow SSA and Ku-band backscatter progress our capacity to retrieve SWE from satellites, which will be crucial for understanding the impact of climate change in seasonally snow-covered environments.
The canopy module within SVS2-Crocus includes two options to represent the canopy energy balance: (i) a one-layer module similar to the module available in the FSM2 model (Mazzotti et al., 2020b; Essery et al., 2025) and (ii) a zero-layer module relying on meteorological transfer functions by means of which above-canopy meteorological data are modified to represent sub-canopy meteorological states (Ellis et al., 2010; Strasser et al., 2024). Mazzotti et al. (2024) used the zero-layer approach to couple FSM2 with Crocus to simulate snowpack properties in forested environments. This approach is used in our study and is described in this appendix.
Canopy in SVS2-Crocus is defined by three structure parameters: (i) canopy height (htop), (ii) canopy closure (Vdens) and (iii) average vegetation area index (VAI) of trees composing the canopy. VAI includes leaves, stems, and branches, and is expressed as a one-sided leaf area per unit ground area of closed forest. The product VdensVAI converts the VAI per unit ground of closed forest to an effective VAI per unit ground of canopy that accounts for closure. The skyview factor of the canopy (SVF) is derived from Vdens and VAI (Essery et al., 2008):
where Ω is a clumping parameter that accounts for leaves being vertically stacked in a canopy (Essery et al., 2008; Musselman et al., 2015). Ω depends on the type of trees. In SVS2-Crocus, it is taken equal to 0.5 as proposed by Bartlett et al. (2006) for needle-leaf trees. When applied in point-scale mode, htop and Vdens are provided by the model user as detailed on Fig. 1 for this study. VAI is derived from a look-up table as a function of the vegetation type specified by the user.
The presence of canopy in SVS2-Crocus modifies the energy and mass fluxes received by the snowpack below the canopy. The zero-layer approach assumes that canopy temperature is equal to air temperature (Ta) (Rutter et al., 2023). The longwave and shortwave radiation received at the surface below the canopy can as:
with LWin the longwave radiation above the canopy (W m−2) and SWdir and SWdif the direct and diffuse shortwave radiation above the canopy. τdif the transmissivity of diffuse radiation through the canopy is equal to the skyview factor (e.g. Musselman et al., 2015) and τdir is the direct transmissivity of shortwave radiation defined as in Pomeroy and Dion (1996).
where kext is an extinction coefficient taken equal to 0.5 for randomly oriented canopy elements and θ is the solar angle (rad).
Turbulent fluxes of sensible and latent heat above the snow surface below canopy are computed using wind speed, air temperature and specific humidity taken at a below-canopy reference level, hbc (set to 1.5 m). Air temperature and specific humidity are taken directly from the meteorological forcing at the same height. For the wind speed, the canopy modifies the wind profile close to the surface and affects turbulent exchanges between the snow surface below the canopy and the atmosphere. As in Mazzotti et al. (2024), the wind speed below the canopy, Ubc, accounts for canopy closure and is taken as a weighted average of the wind speed in open terrain (unperturbed by the canopy), Uopn and the wind speed below dense canopy, Ubc:
The wind profile in the dense canopy is assumed to be logarithmic above the canopy and exponential within the canopy:
where htop is canopy height (m), Ua is wind speed (m s−1) at the forcing height zU (m) (above the ground, zU > htop), Utop is wind speed at the top of the canopy (m s−1), z0mv is momentum roughness length of the canopy (m) and d is the zero plane displacement height (m). z0mv and d depend on the canopy height following: z0mv = 0.1htop and d = 0.67htop. The factor wcan characterizes attenuation of wind speed in the dense canopy and depends on canopy structure with wcan = βΩVAI, with β = 0.9 as in Liston and Elder (2006). In addition to the turbulent fluxes, Ubc is also used in SVS2-Crocus to compute properties of falling snow, wind-induced compaction and mass loss due to blowing snow sublimation for the snowpack below the canopy. SVS2-Crocus simulates snow interception by the canopy using the method of Hedstrom and Pomeroy (1998). The amount of snowfall intercepted by the canopy, Isv (kg m−2 s−1), is computed as:
where SR is the snowfall rate (kg m−2 s−1), Snv is the intercepted snow mass (kg) and is the maximum snow holding capacity of the canopy. varies with air temperature (Ta, °C) as in Andreadis et al. (2009):
where mscap is a coefficient fixed to 5 (Andreadis et al., 2009). The dependency on air temperature allows the model to capture the increase in snow loading resulting from increased adhesion and cohesion above −3 °C as recommended by Lundquist et al. (2021). Snow unloading from trees follows the simple approach of Mazzotti et al. (2020a) with Usv = , with Δt the model time step (s) and τ a relaxation time constant (s). This time constant is taken equal to 240 h for cold snow or 48 h for melting snow. Finally, the sublimation of intercepted snow is estimated following Pomeroy et al. (1998) and Essery et al. (2003). In the version of SVS2-Crocus used within this paper, unloaded snow is added to the snowfall and has the same physical properties (density and microstructure) as falling snow (Mazzotti et al., 2024).
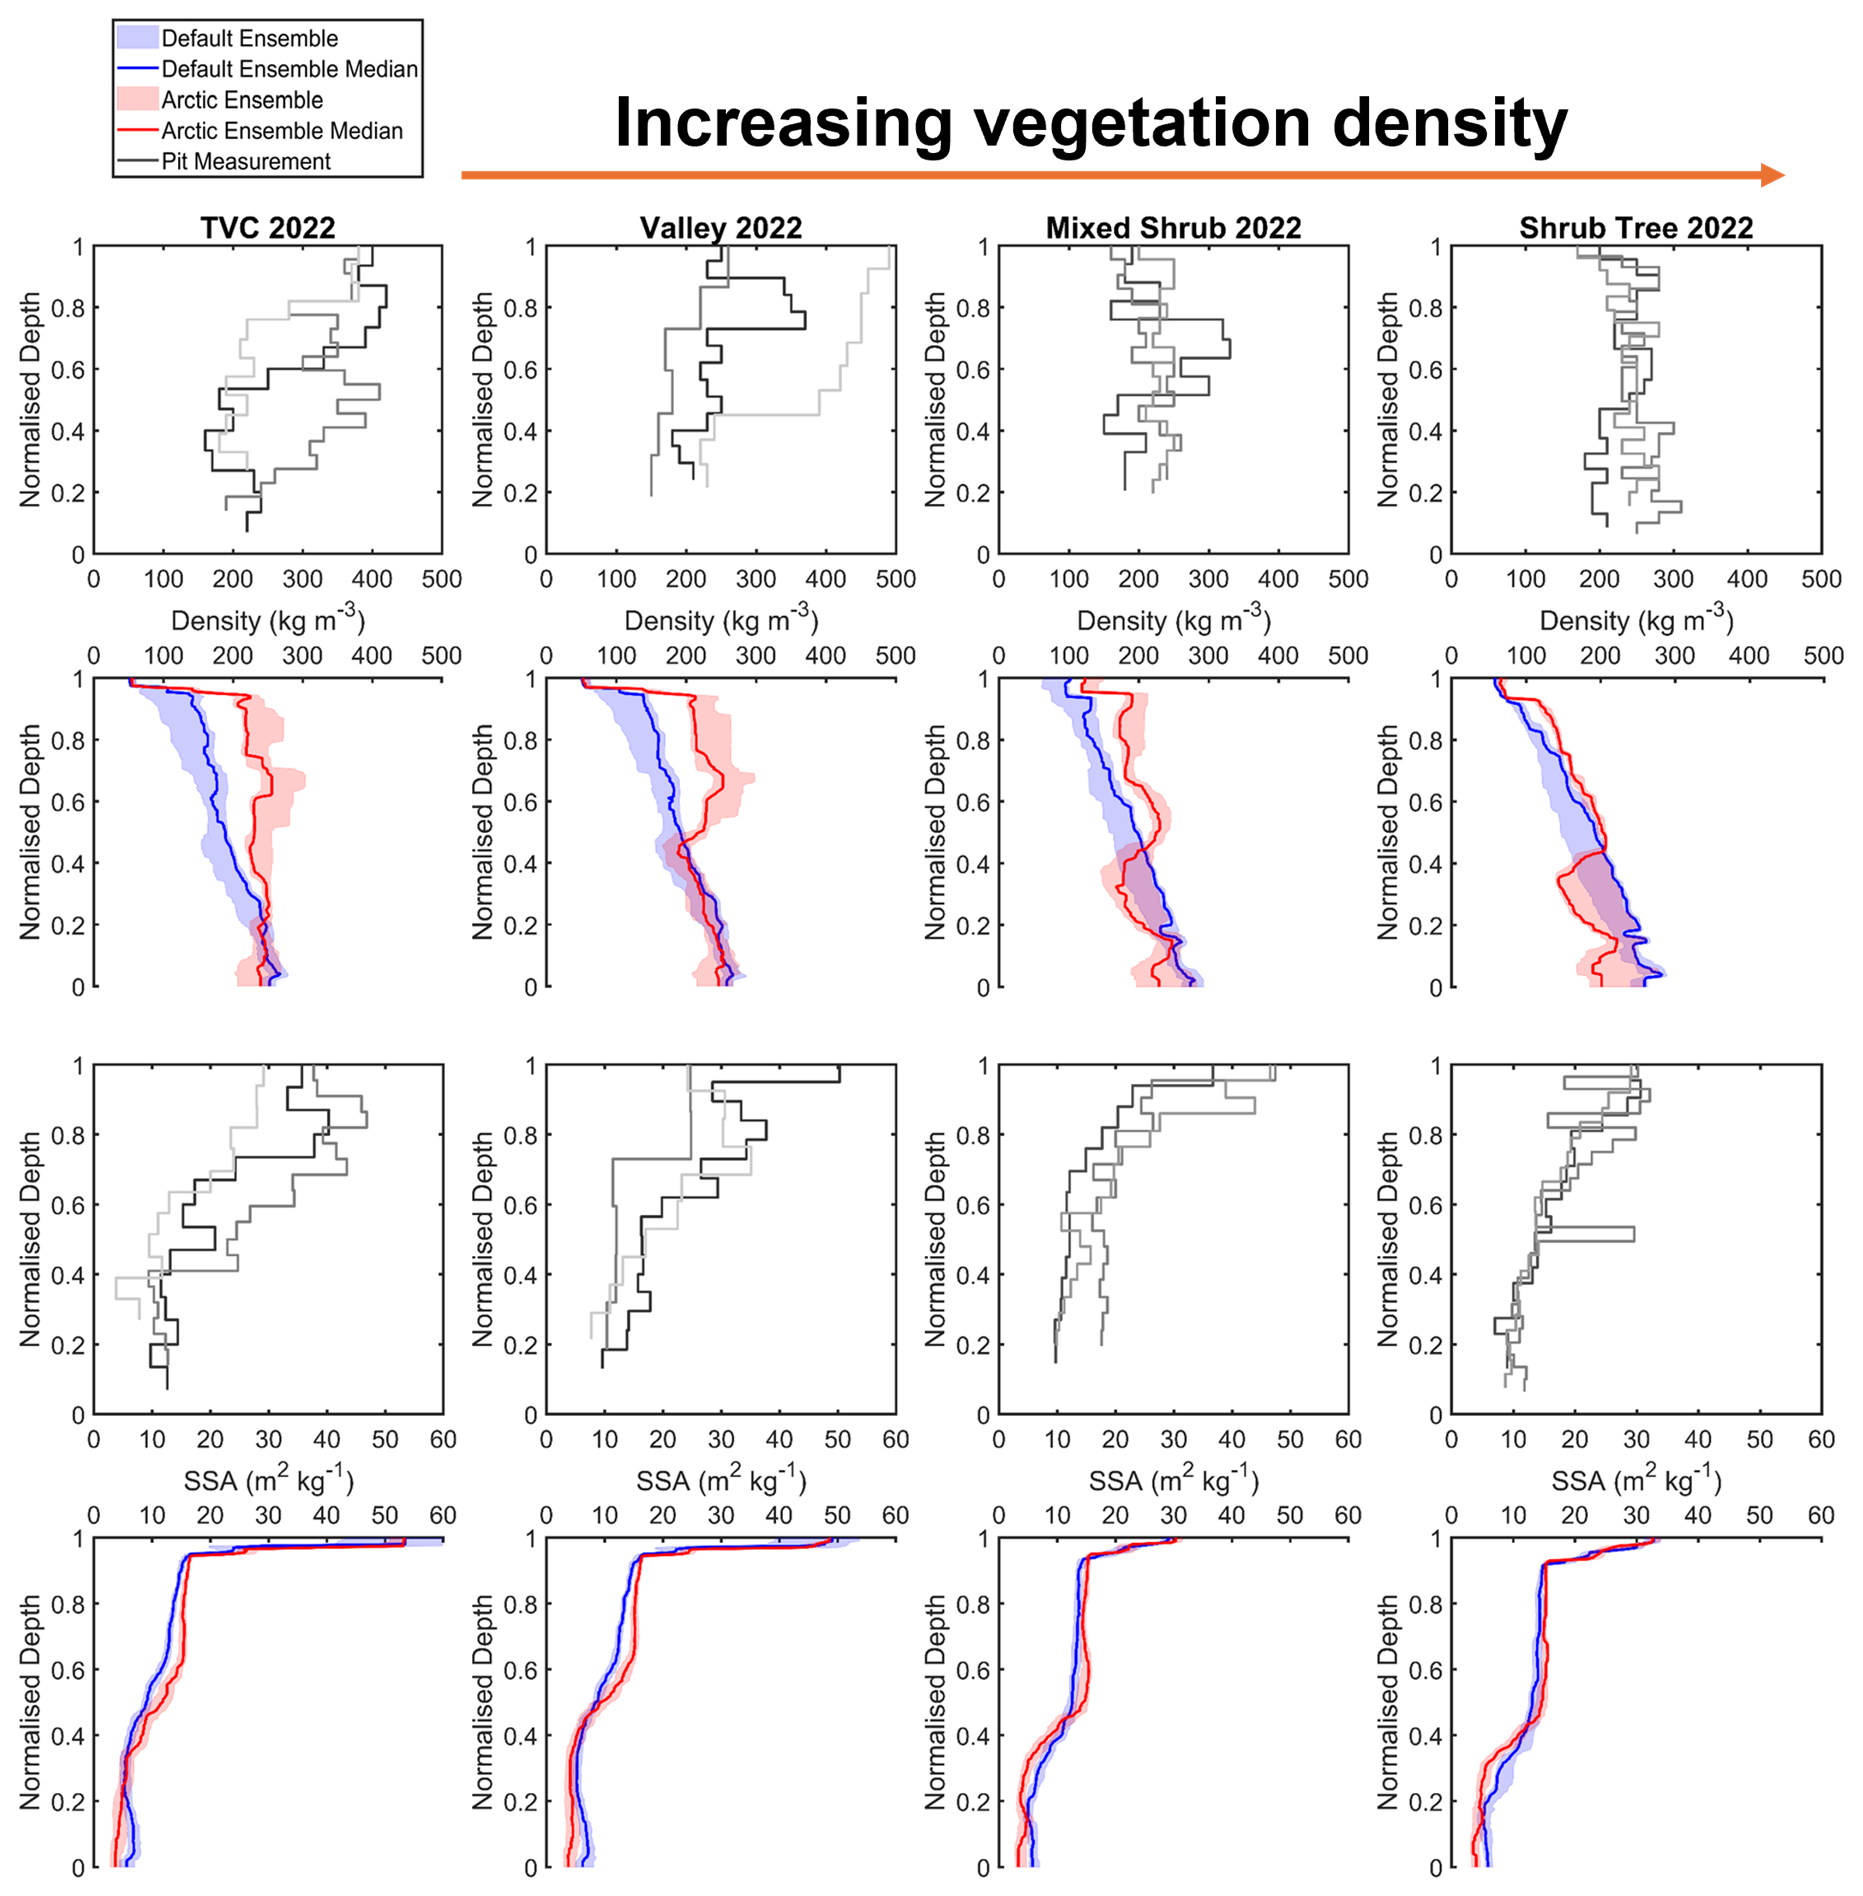
Figure B1Comparison of measured and simulated vertical profiles of density (kg m−3, median, interquartile range) and SSA (m2 kg−1, median, interquartile range) by default and Arctic SVS2-Crocus from the March 2022 winter field campaign. Black and grey lines indicate different pit profiles. Vegetation type for each site is described in Fig. 1.
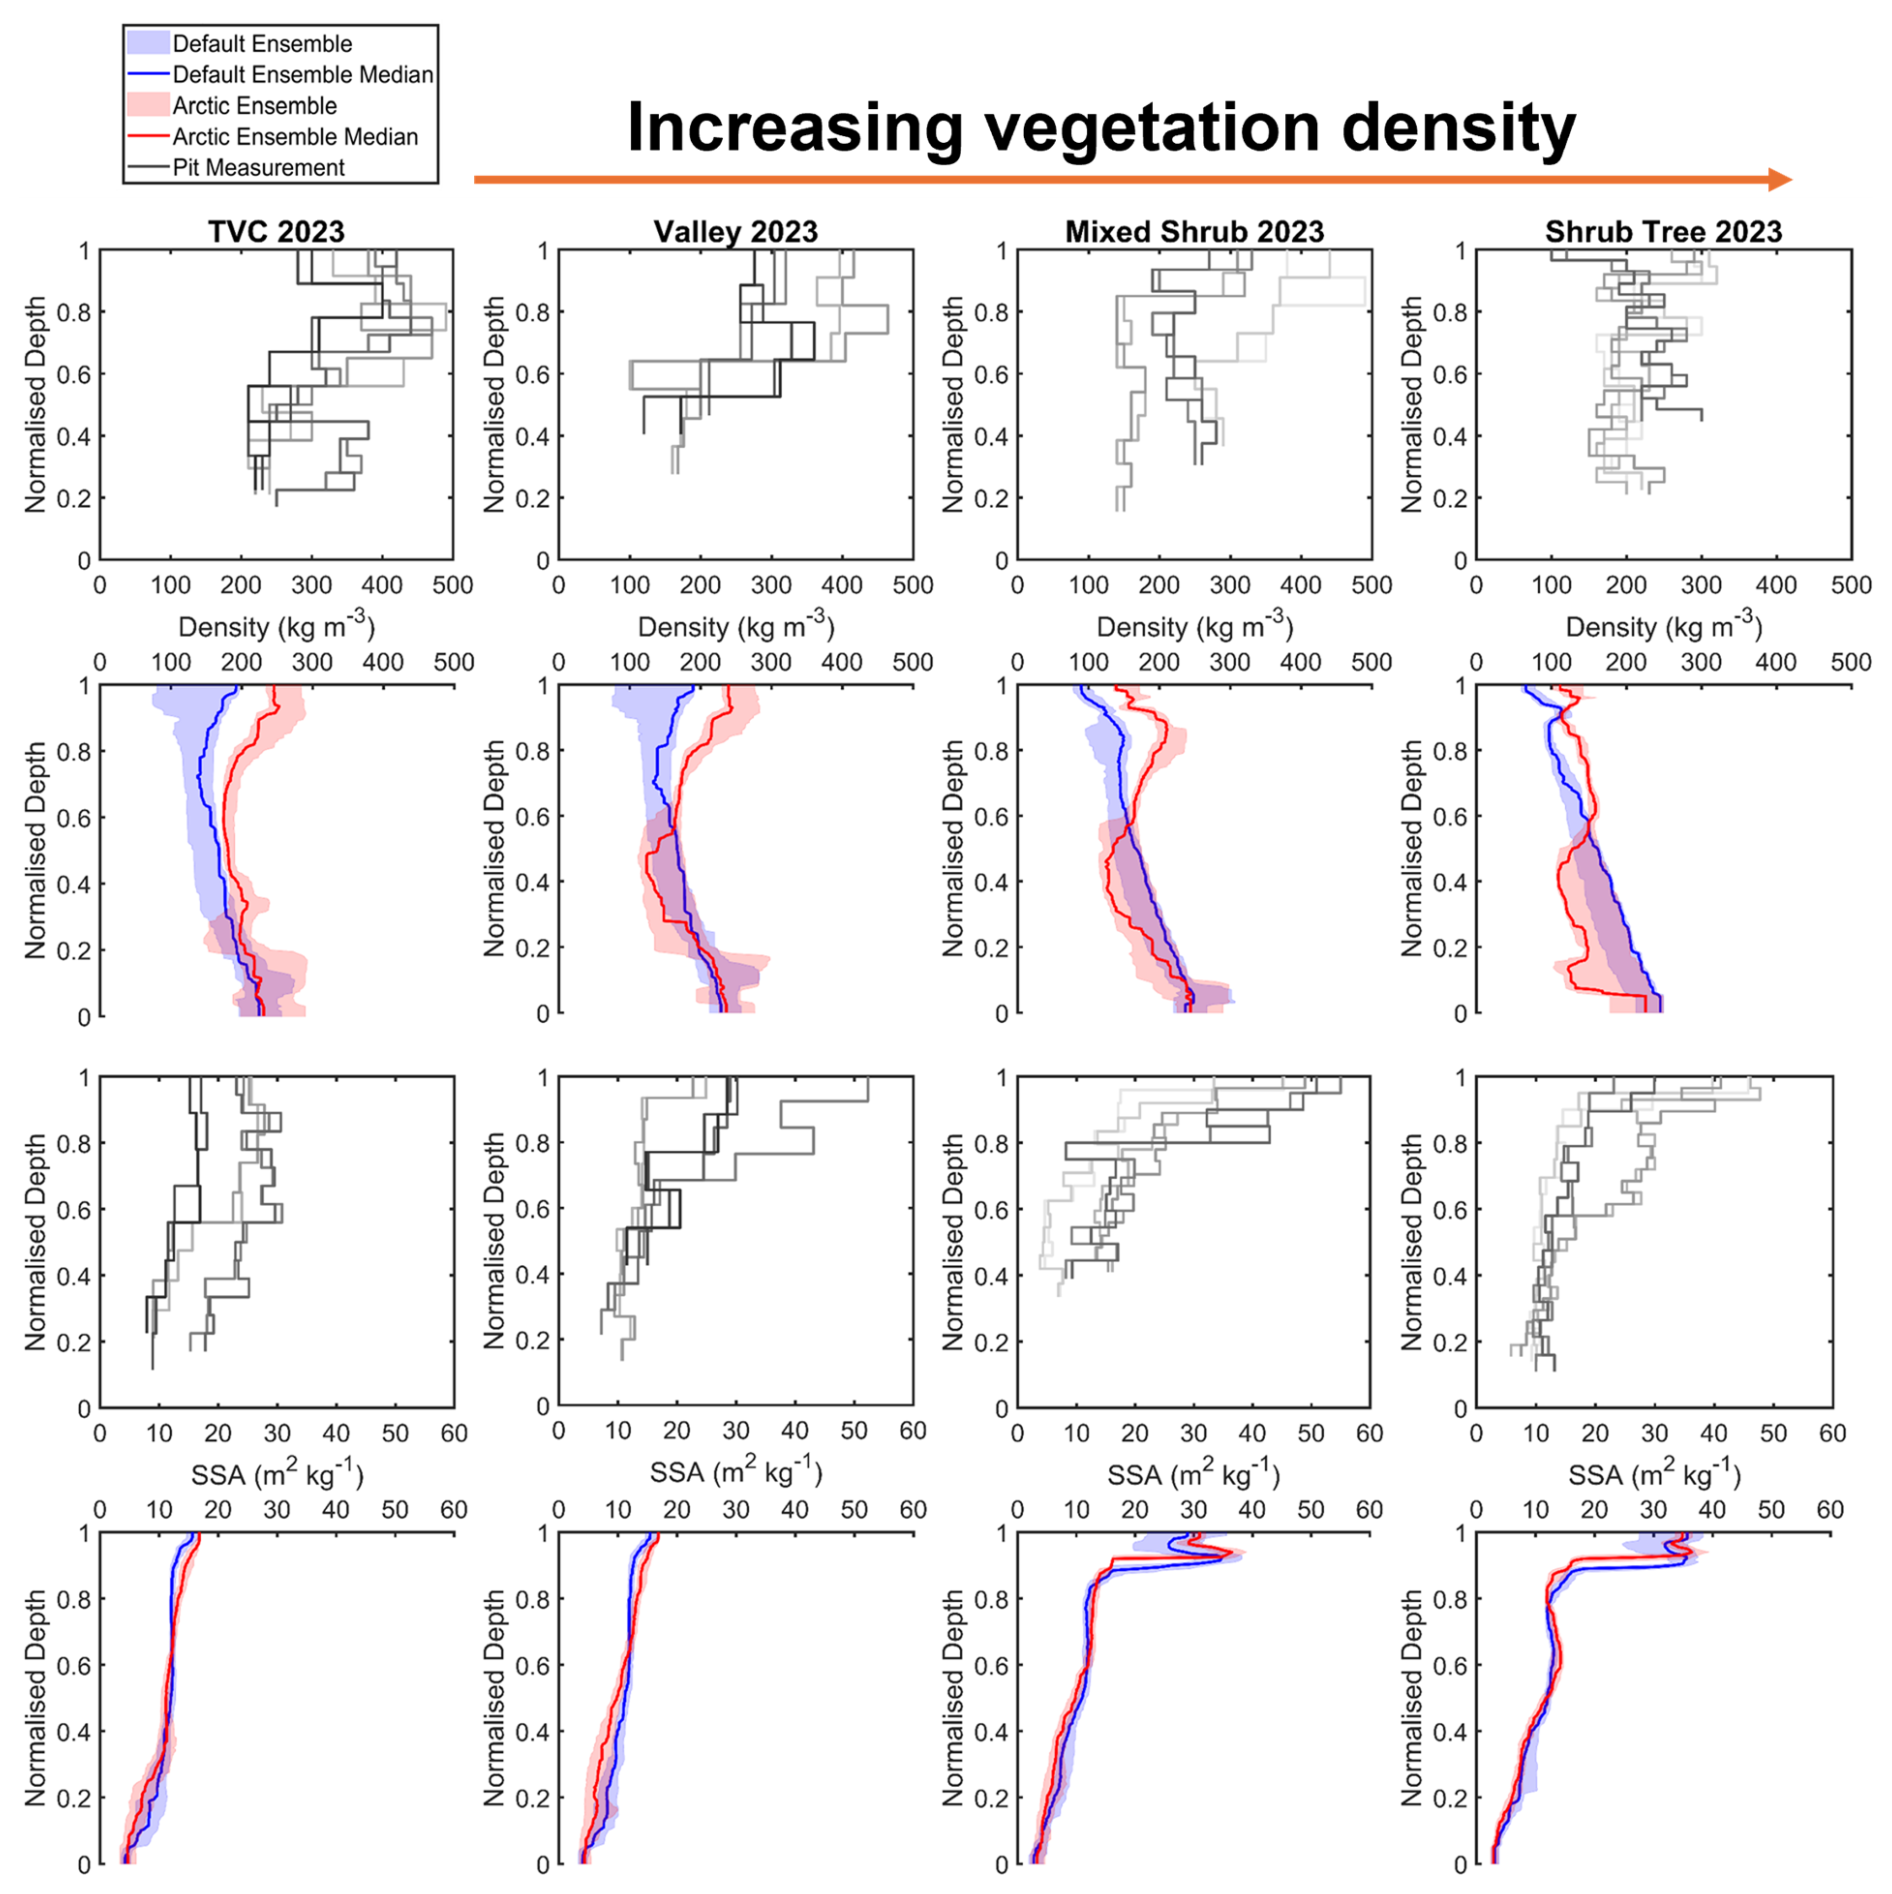
Figure B2Comparison of measured and simulated vertical profiles of density (kg m−3, median, interquartile range) and SSA (m2 kg−1, median, interquartile range) by default and Arctic SVS2-Crocus from the March 2023 winter field campaign. Black and grey lines indicate different pit profiles. Vegetation type for each site is described in Fig. 1.
Code, simulated output and measurements to produce figures and meteorological forcing data are available at: https://doi.org/10.5281/zenodo.15091024 (Woolley, 2025b). The version of Arctic SVS2-Crocus used within this study is available at: https://doi.org/10.5281/zenodo.15091095 (Woolley, 2025a).
GJW conducted the simulations, analysis and drafted the manuscript. NR, LW, VV and CD supervised the project. GJW, NR, VV, CD, RE, GHG and PM collected Trail Valley Creek snow measurements. GJW, VV and LW designed the SVS2-Crocus simulations. RE performed the analysis of the hemispherical photographs. NL and VV provided the HRPDS meteorological forcing data and developed the canopy module. GJW, JM and BM set up SMRT and designed the simulations. All authors participated in reviewing and editing the paper.
At least one of the (co-)authors is a member of the editorial board of The Cryosphere. The peer-review process was guided by an independent editor, and the authors also have no other competing interests to declare.
Publisher's note: Copernicus Publications remains neutral with regard to jurisdictional claims made in the text, published maps, institutional affiliations, or any other geographical representation in this paper. The authors bear the ultimate responsibility for providing appropriate place names. Views expressed in the text are those of the authors and do not necessarily reflect the views of the publisher.
Georgina J. Woolley was supported by the Natural Environment Research Council (NERC)-funded ONE Planet Doctoral Training Partnership, hosted jointly by Northumbria and Newcastle Universities. Nick Rutter and Leanne Wake were also supported by NERC. The project was conducted with approval issue with the Aurora Research Institute, Aurora College (license nos. 16237, 16501 and 17232). The authors would like to acknowledge that this study occurred within the Inuvialuit Settlement Region located in western Canada.
This research has been supported by the Natural Environment Research Council (grant nos. NE/S007512/1 and NE/W003686/1).
This paper was edited by S. McKenzie Skiles and reviewed by two anonymous referees.
Andreadis, K. M., Storck, P., and Lettenmaier, D. P.: Modeling snow accumulation and ablation processes in forested environments, Water Resour. Res., 45, https://doi.org/10.1029/2008wr007042, 2009.
Barrere, M., Domine, F., Decharme, B., Morin, S., Vionnet, V., and Lafaysse, M.: Evaluating the performance of coupled snow–soil models in SURFEXv8 to simulate the permafrost thermal regime at a high Arctic site, Geosci. Model Dev., 10, 3461–3479, https://doi.org/10.5194/gmd-10-3461-2017, 2017.
Bartlett, P. A., MacKay, M. D., and Verseghy, D. L.: Modified snow algorithms in the Canadian land surface scheme: Model runs and sensitivity analysis at three boreal forest stands, Atmos. Ocean, 44, 207–222, https://doi.org/10.3137/ao.440301, 2006.
Belke-Brea, M., Domine, F., Barrere, M., Picard, G., and Arnaud, L.: Impact of shrubs on winter surface albedo and snow specific surface area at a low Arctic site: In situ measurements and simulations, J. Climate, 33, 597–609, 2020.
Bonner, H. M., Raleigh, M. S., and Small, E. E.: Isolating forest process effects on modelled snowpack density and snow water equivalent, Hydrol. Process., 36, https://doi.org/10.1002/hyp.14475, 2022.
Bouchard, B., Nadeau, D. F., and Domine, F.: Comparison of snowpack structure in gaps and under the canopy in a humid boreal forest, Hydrol. Process., 36, https://doi.org/10.1002/hyp.14681, 2022.
Bouchard, B., Nadeau, D. F., Domine, F., Wever, N., Michel, A., Lehning, M., and Isabelle, P.-E.: Impact of intercepted and sub-canopy snow microstructure on snowpack response to rain-on-snow events under a boreal canopy, The Cryosphere, 18, 2783–2807, https://doi.org/10.5194/tc-18-2783-2024, 2024.
Bouvet, L., Calonne, N., Flin, F., and Geindreau, C.: Heterogeneous grain growth and vertical mass transfer within a snow layer under a temperature gradient, The Cryosphere, 17, 3553–3573, https://doi.org/10.5194/tc-17-3553-2023, 2023.
Brun, E., David, P., Sudul, M., and Brunot, G.: A numerical model to simulate snow-cover stratigraphy for operational avalanche forecasting, J. Glaciol., 38, https://doi.org/10.3189/S0022143000009552, 1992.
Callaghan, T. V., Werkman, B. R., and Crawford, R. M. M.: The Tundra-Taiga Interface and Its Dynamics: Concepts and Applications, Ambio, 2002, 6–14, http://www.jstor.org/stable/25094570, 2002.
Callaghan, T. V., Johansson, M., Brown, R. D., Groisman, P. Y., Labba, N., Radionov, V., Bradley, R. S., Blangy, S., Bulygina, O. N., Christensen, T. R., Colman, J. E., Essery, R. L. H., Forbes, B. C., Forchhammer, M. C., Golubev, V. N., Honrath, R. E., Juday, G. P., Meshcherskaya, A. V., Phoenix, G. K., Pomeroy, J., Rautio, A., Robinson, D. A., Schmidt, N. M., Serreze, M. C., Shevchenko, V. P., Shiklomanov, A. I., Shmakin, A. B., Sköld, P., Sturm, M., Woo, M.-k., and Wood, E. F.: Multiple Effects of Changes in Arctic Snow Cover, Ambio, 40, 32–45, https://doi.org/10.1007/s13280-011-0213-x, 2012.
Carmagnola, C. M., Morin, S., Lafaysse, M., Domine, F., Lesaffre, B., Lejeune, Y., Picard, G., and Arnaud, L.: Implementation and evaluation of prognostic representations of the optical diameter of snow in the SURFEX/ISBA-Crocus detailed snowpack model, The Cryosphere, 8, 417–437, https://doi.org/10.5194/tc-8-417-2014, 2014.
Cui, Y., Xiong, C., Lemmetyinen, J., Shi, J., Jiang, L., Peng, B., Li, H., Zhao, T., Ji, D., and Hu, T.: Estimating Snow Water Equivalent with Backscattering at X and Ku Band Based on Absorption Loss, Remote Sensing, 8, https://doi.org/10.3390/rs8060505, 2016.
Derksen, C., Lemmetyinen, J., Toose, P., Silis, A., Pulliainen, J., and Sturm, M.: Physical properties of Arctic versus subarctic snow: Implications for high latitude passive microwave snow water equivalent retrievals, J. Geophys. Res.-Atmos., 119, 7254–7270, https://doi.org/10.1002/2013JD021264, 2014.
Derksen, C., Silis, A., Sturm, M., Holmgren, J., Liston, G. E., Huntington, H., and Solie, D.: Northwest Territories and Nunavut Snow Characteristics from a Subarctic Traverse: Implications for Passive Microwave Remote Sensing, J. Hydrometeorol., 10, 448–463, https://doi.org/10.1175/2008jhm1074.1, 2009.
Derksen, C., King, J., Belair, S., Garnaud, C., Vionnet, V., Fortin, V., Lemmetyinen, J., Crevier, Y., Plourde, P., Lawrence, B., van Mierlo, H., Burbidge, G., and Siqueira, P.: Development of the Terrestrial Snow Mass Mission, 2021 IEEE International Geoscience and Remote Sensing Symposium IGARSS, https://doi.org/10.1109/igarss47720.2021.9553496, 2021.
Domine, F., Barrere, M., and Morin, S.: The growth of shrubs on high Arctic tundra at Bylot Island: impact on snow physical properties and permafrost thermal regime, Biogeosciences, 13, 6471–6486, https://doi.org/10.5194/bg-13-6471-2016, 2016.
Domine, F., Fourteau, K., Picard, G., Lackner, G., Sarrazin, D., and Poirier, M.: Permafrost cooled in winter by thermal bridging through snow-covered shrub branches, Nat. Geosci., 15, 554–560, https://doi.org/10.1038/s41561-022-00979-2, 2022.
Domine, F., Picard, G., Morin, S., Barrere, M., Madore, J.-B., and Langlois, A.: Major Issues in Simulating Some Arctic Snowpack Properties Using Current Detailed Snow Physics Models: Consequences for the Thermal Regime and Water Budget of Permafrost, J. Adv. Model. Earth Sy., 11, 34–44, https://doi.org/10.1029/2018MS001445, 2019.
Domine, F., Quémener, M., Bégin, L., Bouchard, B., Dionne, V., Jerczynski, S., Larouche, R., Lévesque-Desrosiers, F., Philibert, S.-O., Vigneault, M.-A., Picard, G., and Côté, D. C.: Impact of shrub branches on the shortwave vertical irradiance profile in snow, The Cryosphere, 19, 1757–1774, https://doi.org/10.5194/tc-19-1757-2025, 2025.
Ellis, C. R., Pomeroy, J. W., Brown, T., and MacDonald, J.: Simulation of snow accumulation and melt in needleleaf forest environments, Hydrol. Earth Syst. Sci., 14, 925–940, https://doi.org/10.5194/hess-14-925-2010, 2010.
Ernakovich, J. G., Hopping, K. A., Berdanier, A. B., Simpson, R. T., Kachergis, E. J., Steltzer, H., and Wallenstein, M. D.: Predicted responses of arctic and alpine ecosystems to altered seasonality under climate change, Glob. Change Biol., 20, 3256–3269, https://doi.org/10.1111/gcb.12568, 2014.
Essery, R. and Pomeroy, J.: Vegetation and Topographic Control of Wind-Blown Snow Distributions in Distributed and Aggregated Simulations for an Arctic Tundra Basin, J. Hyrometeorol., 5, 735–744, https://doi.org/10.1175/1525-7541(2004)005<0735:VATCOW>2.0.CO;2, 2004.
Essery, R., Pomeroy, J., Parviainen, J., and Storck, P.: Sublimation of Snow from Coniferous Forests in a Climate Model, J. Climate, 16, 1855–1864, https://doi.org/10.1175/1520-0442(2003)016<1855:SOSFCF>2.0.CO;2, 2003.
Essery, R., Pomeroy, J., Ellis, C., and Link, T.: Modelling longwave radiation to snow beneath forest canopies using hemispherical photography or linear regression, Hydrol. Process., 22, 2788–2800, https://doi.org/10.1002/hyp.6930, 2008.
Essery, R., Mazzotti, G., Barr, S., Jonas, T., Quaife, T., and Rutter, N.: A Flexible Snow Model (FSM 2.1.1) including a forest canopy, Geosci. Model Dev., 18, 3583–3605, https://doi.org/10.5194/gmd-18-3583-2025, 2025.
Fierz, C., Armstrong, R. L., Durand, Y., Etchevers, P., Greene, E., McClung, D., Nishimura, K., Satyawali, P., and Sokratov, S. A.: The international classification for seasonal snow on the ground UNESCO, IHP-VII, Tech. Doc. Hydrol. no. 18, 1607-7962/gra/EGU2008-A-10525, 2009.
Fortin, V., Abaza, M., Anctil, F., and Turcotte, R.: Why Should Ensemble Spread Match the RMSD of the Ensemble Mean?, J. Hydrometeorol., 15, 1708–1713, https://doi.org/10.1175/jhm-d-14-0008.1, 2014.
Fourteau, K., Domine, F., and Hagenmuller, P.: Impact of water vapor diffusion and latent heat on the effective thermal conductivity of snow, The Cryosphere, 15, 2739–2755, https://doi.org/10.5194/tc-15-2739-2021, 2021.
Fung, A.: Microwave scattering and emission models and their applications, Artech House, Boston, ISBN 9780890065235, 1994.
Gaillard, M., Vionnet, V., Lafaysse, M., Dumont, M., and Ginoux, P.: Improving large-scale snow albedo modeling using a climatology of light-absorbing particle deposition, The Cryosphere, 19, 769–792, https://doi.org/10.5194/tc-19-769-2025, 2025.
Gallet, J.-C., Domine, F., Zender, C. S., and Picard, G.: Measurement of the specific surface area of snow using infrared reflectance in an integrating sphere at 1310 and 1550 nm, The Cryosphere, 3, 167–182, https://doi.org/10.5194/tc-3-167-2009, 2009.
Garnaud, C., Bélair, S., Carrera, M. L., Derksen, C., Bilodeau, B., Abrahamowicz, M., Gauthier, N., and Vionnet, V.: Quantifying Snow Mass Mission Concept Trade-Offs Using an Observing System Simulation Experiment, J. Hydrometeorol., 20, 155–173, https://doi.org/10.1175/jhm-d-17-0241.1, 2019.
Gouttevin, I., Langer, M., Löwe, H., Boike, J., Proksch, M., and Schneebeli, M.: Observation and modelling of snow at a polygonal tundra permafrost site: spatial variability and thermal implications, The Cryosphere, 12, 3693–3717, https://doi.org/10.5194/tc-12-3693-2018, 2018.
Graveline, V., Helbig, M., Gosselin, G. H., Alcock, H., Detto, M., Walker, B., Marsh, P., and Sonnentag, O.: Surface-atmosphere energy exchanges and their effects on surface climate and atmospheric boundary layer characteristics in the forest-tundra ecotone in northwestern Canada, Agr. Forest Meteorol., 350, 109996, https://doi.org/10.1016/j.agrformet.2024.109996, 2024.
Hedstrom, N. R. and Pomeroy, J. W.: Measurements and modelling of snow interception in the boreal forest, Hydrol. Process., 12, 1611–1625, https://doi.org/10.1002/(SICI)1099-1085(199808/09)12:10/11<1611::AID-HYP684>3.0.CO;2-4, 1998.
Kim, R. S., Kumar, S., Vuyovich, C., Houser, P., Lundquist, J., Mudryk, L., Durand, M., Barros, A., Kim, E. J., Forman, B. A., Gutmann, E. D., Wrzesien, M. L., Garnaud, C., Sandells, M., Marshall, H.-P., Cristea, N., Pflug, J. M., Johnston, J., Cao, Y., Mocko, D., and Wang, S.: Snow Ensemble Uncertainty Project (SEUP): quantification of snow water equivalent uncertainty across North America via ensemble land surface modeling, The Cryosphere, 15, 771–791, https://doi.org/10.5194/tc-15-771-2021, 2021.
Kinar, N. J. and Pomeroy, J. W.: Measurement of the physical properties of the snowpack, Rev. Geophys., 53, 481–544, https://doi.org/10.1002/2015rg000481, 2015.
King, J., Kelly, R., Kasurak, A., Duguay, C., Gunn, G., Rutter, N., Watts, T., and Derksen, C.: Spatio-temporal influence of tundra snow properties on Ku-band (17.2 GHz) backscatter, J. Glaciol., 61, 267–279, https://doi.org/10.3189/2015JoG14J020, 2015.
King, J., Derksen, C., Toose, P., Langlois, A., Larsen, C., Lemmetyinen, J., Marsh, P., Montpetit, B., Roy, A., Rutter, N., and Sturm, M.: The influence of snow microstructure on dual-frequency radar measurements in a tundra environment, Remote Sens. Environ., 215, 242–254, https://doi.org/10.1016/j.rse.2018.05.028, 2018.
King, J., Howell, S., Brady, M., Toose, P., Derksen, C., Haas, C., and Beckers, J.: Local-scale variability of snow density on Arctic sea ice, The Cryosphere, 14, 4323–4339, https://doi.org/10.5194/tc-14-4323-2020, 2020.
Krogh, S. A. and Pomeroy, J. W.: Impact of Future Climate and Vegetation on the Hydrology of an Arctic Headwater Basin at the Tundra–Taiga Transition, J. Hydrometeorol., 20, 197–215, https://doi.org/10.1175/jhm-d-18-0187.1, 2019.
Lackner, G., Domine, F., Nadeau, D. F., Lafaysse, M., and Dumont, M.: Snow properties at the forest–tundra ecotone: predominance of water vapor fluxes even in deep, moderately cold snowpacks, The Cryosphere, 16, 3357–3373, https://doi.org/10.5194/tc-16-3357-2022, 2022.
Lafaysse, M., Cluzet, B., Dumont, M., Lejeune, Y., Vionnet, V., and Morin, S.: A multiphysical ensemble system of numerical snow modelling, The Cryosphere, 11, 1173–1198, https://doi.org/10.5194/tc-11-1173-2017, 2017.
Larue, F., Royer, A., De Sève, D., Roy, A., Picard, G., Vionnet, V., and Cosme, E.: Simulation and Assimilation of Passive Microwave Data Using a Snowpack Model Coupled to a Calibrated Radiative Transfer Model Over Northeastern Canada, Water Resour. Res., 54, 4823–4848, https://doi.org/10.1029/2017wr022132, 2018.
Lemmetyinen, J., Kontu, A., Pulliainen, J., and Wiesmann, A.: Observations of seasonal snow cover at X and Ku bands during the NoSREx campaign, EUSAR 2014, in: 10th European Conference on Synthetic Aperture Radar, Berlin, Germany, 1–4, 2014.
Lemmetyinen, J., Derksen, C., Rott, H., Macelloni, G., King, J., Schneebeli, M., Wiesmann, A., Leppänen, L., Kontu, A., and Pulliainen, J.: Retrieval of Effective Correlation Length and Snow Water Equivalent from Radar and Passive Microwave Measurements, Remote Sensing, 10, https://doi.org/10.3390/rs10020170, 2018.
Libois, Q., Picard, G., Arnaud, L., Morin, S., and Brun, E.: Modeling the impact of snow drift on the decameter-scale variability of snow properties on the Antarctic Plateau, J. Geophys. Res.-Atmos., 119, 11662–11681, https://doi.org/10.1002/2014jd022361, 2014.
Liston, G. E. and Elder, K.: A Meterological Distribution System for High-Resolution Terrestrial Modeling (MicroMet), J. Hydrometeorol., 7, 217–234, https://doi.org/10.1175/JHM486.1, 2006.
Lumbrazo, C., Bennett, A., Currier, W. R., Nijssen, B., and Lundquist, J.: Evaluating Multiple Canopy-Snow Unloading Parameterizations in SUMMA With Time-Lapse Photography Characterized by Citizen Scientists, Water Resour. Res., 58, https://doi.org/10.1029/2021wr030852, 2022.
Lundquist, J. D., Dickerson-Lange, S., Gutmann, E., Jonas, T., Lumbrazo, C., and Reynolds, D.: Snow interception modelling: Isolated observations have led to many land surface models lacking appropriate temperature sensitivities, Hydrol. Process., 35, https://doi.org/10.1002/hyp.14274, 2021.
Marbouty, D.: An Experimental Study of Temperature-Gradient Metamorphism, J. Glaciol., 26, 303–312, https://doi.org/10.3189/s0022143000010844, 1980.
Marsh, P., Bartlett, P., MacKay, M., Pohl, S., and Lantz, T.: Snowmelt energetics at a shrub tundra site in the western Canadian Arctic, Hydrol. Process., 24, 3603–3620, https://doi.org/10.1002/hyp.7786, 2010.
Martin, J. and Schneebeli, M.: Impact of the sampling procedure on the specific surface area of snow measurements with the IceCube, The Cryosphere, 17, 1723–1734, https://doi.org/10.5194/tc-17-1723-2023, 2023.
Mazzotti, G., Essery, R., Moeser, C. D., and Jonas, T.: Resolving Small-Scale Forest Snow Patterns Using an Energy Balance Snow Model With a One-Layer Canopy, Water Resour. Res., 56, e2019WR026129, https://doi.org/10.1029/2019wr026129, 2020a.
Mazzotti, G., Essery, R., Webster, C., Malle, J., and Jonas, T.: Process-Level Evaluation of a Hyper-Resolution Forest Snow Model Using Distributed Multisensor Observations, Water Resour. Res., 56, e2020WR027572, https://doi.org/10.1029/2020WR027572, 2020b.
Mazzotti, G., Nousu, J.-P., Vionnet, V., Jonas, T., Nheili, R., and Lafaysse, M.: Exploring the potential of forest snow modeling at the tree and snowpack layer scale, The Cryosphere, 18, 4607–4632, https://doi.org/10.5194/tc-18-4607-2024, 2024.
Mekonnen, Z. A., Riley, W. J., Berner, L. T., Bouskill, N. J., Torn, M. S., Iwahana, G., Breen, A. L., Myers-Smith, I. H., Criado, M. G., Liu, Y., Euskirchen, E. S., Goetz, S. J., Mack, M. C., and Grant, R. F.: Arctic tundra shrubification: a review of mechanisms and impacts on ecosystem carbon balance, Environ. Res. Lett., 16, 053001, https://doi.org/10.1088/1748-9326/abf28b, 2021.
Meloche, J., Leroux, N. R., Montpetit, B., Vionnet, V., and Derksen, C.: Radar-equivalent snowpack: reducing the number of snow layers while retaining their microwave properties and bulk snow mass, The Cryosphere, 19, 2949–2962, https://doi.org/10.5194/tc-19-2949-2025, 2025.
Ménard, C. B., Essery, R., Pomeroy, J., Marsh, P., and Clark, D. B.: A shrub bending model to calculate the albedo of shrub-tundra, Hydrol. Process., 28, 341–351, https://doi.org/10.1002/hyp.9582, 2014.
Milbrandt, J. A., Bélair, S., Faucher, M., Vallée, M., Carrera, M. L., and Glazer, A.: The pan-Canadian high resolution (2.5 km) deterministic prediction system, Weather Forecast., 31, 1791–1816, 2016.
Montesano, P. M., Neigh, C. S. R., Macander, M., Feng, M., and Noojipady, P.: The bioclimatic extent and pattern of the cold edge of the boreal forest: the circumpolar taiga-tundra ecotone, Environ. Res. Lett., 15, 105019, https://doi.org/10.1088/1748-9326/abb2c7, 2020.
Montpetit, B., King, J., Meloche, J., Derksen, C., Siqueira, P., Adam, J. M., Toose, P., Brady, M., Wendleder, A., Vionnet, V., and Leroux, N. R.: Retrieval of snow and soil properties for forward radiative transfer modeling of airborne Ku-band SAR to estimate snow water equivalent: the Trail Valley Creek 2018/19 snow experiment, The Cryosphere, 18, 3857–3874, https://doi.org/10.5194/tc-18-3857-2024, 2024.
Montpetit, B., Meloche, J., Vionnet, V., Derksen, C., Woolley, G., Leroux, N. R., Siqueira, P., Adam, J. M., and Brady, M.: Snow Water Equivalent from airborne Ku-band data: the Trail Valley Creek 2018/19 snow experiment, The Cryosphere, 19, 5465–5484, https://doi.org/10.5194/tc-19-5465-2025, 2025.
Morin, S., Domine, F., Dufour, A., Lejeune, Y., Lesaffre, B., Willemet, J. M., Carmagnola, C. M., and Jacobi, H. W.: Measurements and modeling of the vertical profile of specific surface area of an alpine snowpack, Adv. Water Resour., 55, 111–120, https://doi.org/10.1016/j.advwatres.2012.01.010, 2013.
Mortimer, C., Mudryk, L., Derksen, C., Luojus, K., Brown, R., Kelly, R., and Tedesco, M.: Evaluation of long-term Northern Hemisphere snow water equivalent products, The Cryosphere, 14, 1579–1594, https://doi.org/10.5194/tc-14-1579-2020, 2020.
Musselman, K. N., Pomeroy, J. W., and Link, T. E.: Variability in shortwave irradiance caused by forest gaps: Measurements, modelling, and implications for snow energetics, Agr. Forest Meteorol., 207, 69–82, https://doi.org/10.1016/j.agrformet.2015.03.014, 2015.
Nill, L., Grünberg, I., Ullmann, T., Gessner, M., Boike, J., and Hostert, P.: Arctic shrub expansion revealed by Landsat-derived multitemporal vegetation cover fractions in the Western Canadian Arctic, Remote Sens. Environ., 281, 113228, https://doi.org/10.1016/j.rse.2022.113228, 2022.
Oreiller, M., Nadeau, D. F., Minville, M., and Rousseau, A. N.: Modelling snow water equivalent and spring runoff in a boreal watershed, James Bay, Canada, Hydrol. Process., 28, 5991–6005, https://doi.org/10.1002/hyp.10091, 2014.
Pan, J., Durand, M. T., Vander Jagt, B. J., and Liu, D.: Application of a Markov Chain Monte Carlo algorithm for snow water equivalent retrieval from passive microwave measurements, Remote Sens. Environ., 192, 150–165, https://doi.org/10.1016/j.rse.2017.02.006, 2017.
Picard, G., Sandells, M., and Löwe, H.: SMRT: an active–passive microwave radiative transfer model for snow with multiple microstructure and scattering formulations (v1.0), Geosci. Model Dev., 11, 2763–2788, https://doi.org/10.5194/gmd-11-2763-2018, 2018.
Picard, G., Löwe, H., Domine, F., Arnaud, L., Larue, F., Favier, V., Le Meur, E., Lefebvre, E., Savarino, J., and Royer, A.: The Microwave Snow Grain Size: A New Concept to Predict Satellite Observations Over Snow-Covered Regions, AGU Advances, 3, https://doi.org/10.1029/2021av000630, 2022.
Pomeroy, J. W. and Dion, K.: Winter Radiation Extinction and Reflection in a Boreal Pine Canopy: Measurements and Modelling, Hydrol. Process., 10, 1591–1608, https://doi.org/10.1002/(SICI)1099-1085(199612)10:12<1591::AID-HYP503>3.0.CO;2-8, 1996.
Pomeroy, J. W., Parviainen, J., Hedstrom, N., and Gray, D. M.: Coupled modelling of forest snow interception and sublimation, Hydrol. Process., 12, 2317–2337, https://doi.org/10.1002/(sici)1099-1085(199812)12:15<2317::AID-HYP799>3.0.CO;2-X, 1998.
Roth, T. R. and Nolin, A. W.: Forest impacts on snow accumulation and ablation across an elevation gradient in a temperate montane environment, Hydrol. Earth Syst. Sci., 21, 5427–5442, https://doi.org/10.5194/hess-21-5427-2017, 2017.
Rott, H., Heidinger, M., Nagler, T., Cline, D., and Yueh, S.: Retriveal of Snow Parameters from Ku-Band and X-Band Radar Backscatter Measurements, IEEE International Geoscience and Remote Sensing Symposium, II-144–II-147, https://doi.org/10.1109/IGARSS.2009.5418024, 2009.
Royer, A., Domine, F., Roy, A., Langlois, A., Marchand, N., and Davesne, G.: New northern snowpack classification linked to vegetation cover on a latitudinal mega-transect across northeastern Canada, Écoscience, 28, 225–242, https://doi.org/10.1080/11956860.2021.1898775, 2021a.
Royer, A., Picard, G., Vargel, C., Langlois, A., Gouttevin, I., and Dumont, M.: Improved Simulation of Arctic Circumpolar Land Area Snow Properties and Soil Temperatures, Frontiers in Earth Science, 9, 2296–6463, https://doi.org/10.3389/feart.2021.685140, 2021b.
Rutter, N., Marshall, H. P., Tape, K., Essery, R., and King, J.: Impact of spatial averaging on radar reflectivity at internal snowpack layer boundaries, J. Glaciol., 62, 1065–1074, https://doi.org/10.1017/jog.2016.99, 2016.
Rutter, N., Essery, R., Baxter, R., Hancock, S., Horton, M., Huntley, B., Reid, T., and Woodward, J.: Canopy Structure and Air Temperature Inversions Impact Simulation of Sub-Canopy Longwave Radiation in Snow-Covered Boreal Forests, J. Geophys. Res.-Atmos., 128, https://doi.org/10.1029/2022jd037980, 2023.
Rutter, N., Sandells, M. J., Derksen, C., King, J., Toose, P., Wake, L., Watts, T., Essery, R., Roy, A., Royer, A., Marsh, P., Larsen, C., and Sturm, M.: Effect of snow microstructure variability on Ku-band radar snow water equivalent retrievals, The Cryosphere, 13, 3045–3059, https://doi.org/10.5194/tc-13-3045-2019, 2019.
Sandells, M., Rutter, N., Wivell, K., Essery, R., Fox, S., Harlow, C., Picard, G., Roy, A., Royer, A., and Toose, P.: Simulation of Arctic snow microwave emission in surface-sensitive atmosphere channels, The Cryosphere, 18, 3971–3990, https://doi.org/10.5194/tc-18-3971-2024, 2024.
Sokol, J., Pultz, T. J., and Walker, A. E.: Passive and active airborne microwave remote sensing of snow cover, Int. J. Remote Sens., 24, 5327–2344, https://doi.org/10.1080/0143116031000115076, 2003.
Strasser, U., Warscher, M., Rottler, E., and Hanzer, F.: openAMUNDSEN v1.0: an open-source snow-hydrological model for mountain regions, Geosci. Model Dev., 17, 6775–6797, https://doi.org/10.5194/gmd-17-6775-2024, 2024.
Sturm, M. and Holmgren, J.: An Automatic Snow Depth Probe for Field Validation Campaigns, Water Resour. Res., 54, 9695–9701, https://doi.org/10.1029/2018wr023559, 2018.
Sturm, M., Racine, C., and Tape, K.: Increasing shrub abundance in the Arctic, Nature, 411, 546–547, 2001.
Sturm, M., Holmgren, J., König, M., and Morris, K.: The thermal conductivity of seasonal snow, J. Glaciol., 43, 26–41, https://doi.org/10.3189/s0022143000002781, 1997.
Sun, N., Wigmosta, M., Zhou, T., Lundquist, J., Dickerson-Lange, S., and Cristea, N.: Evaluating the functionality and streamflow impacts of explicitly modelling forest–snow interactions and canopy gaps in a distributed hydrologic model, Hydrol. Process., 32, 2128–2140, https://doi.org/10.1002/hyp.13150, 2018.
Tsang, L., Durand, M., Derksen, C., Barros, A. P., Kang, D.-H., Lievens, H., Marshall, H.-P., Zhu, J., Johnson, J., King, J., Lemmetyinen, J., Sandells, M., Rutter, N., Siqueira, P., Nolin, A., Osmanoglu, B., Vuyovich, C., Kim, E., Taylor, D., Merkouriadi, I., Brucker, L., Navari, M., Dumont, M., Kelly, R., Kim, R. S., Liao, T.-H., Borah, F., and Xu, X.: Review article: Global monitoring of snow water equivalent using high-frequency radar remote sensing, The Cryosphere, 16, 3531–3573, https://doi.org/10.5194/tc-16-3531-2022, 2022.
Vionnet, V., Brun, E., Morin, S., Boone, A., Faroux, S., Le Moigne, P., Martin, E., and Willemet, J.-M.: The detailed snowpack scheme Crocus and its implementation in SURFEX v7.2, Geosci. Model Dev., 5, 773–791, https://doi.org/10.5194/gmd-5-773-2012, 2012.
Vionnet, V., Leroux, N. R., Fortin, V., Abrahamowicz, M., Woolley, G., Mazzotti, G., Gaillard, M., Lafaysse, M., Royer, A., Domine, F., Gauthier, N., Rutter, N., Derksen, C., and Bélair, S.: Enhancing simulations of snowpack properties in land surface models with the Soil, Vegetation and Snow scheme v2.0 (SVS2), Geosci. Model Dev., 18, 9119–9147, https://doi.org/10.5194/gmd-18-9119-2025, 2025.
Vionnet, V., Verville, M., Fortin, V., Brugman, M., Abrahamowicz, M., Lemay, F., Thériault, J. M., Lafaysse, M., and Milbrandt, J. A.: Snow Level From Post-Processing of Atmospheric Model Improves Snowfall Estimate and Snowpack Prediction in Mountains, Water Resour. Res., 58, https://doi.org/10.1029/2021WR031778, 2022.
Walker, B. and Marsh, P.: Snow depth, density, and snow water equivalent observations at Trail Valley Creek Research Station, Northwest Territories, 2015-2019, Version V1, Borealis [data set], https://doi.org/10.5683/SP2/RUSEHA, 2021.
Wang, X. and Baker, I.: Evolution of the specific surface area of snow during high-temperature gradient metamorphism, J. Geophys. Res.-Atmos., 119, https://doi.org/10.1002/2014JD022131, 2014.
Weise, M.: Time-lapse tomography of mass fluxes and microstructural changes in snow, PhD thesis, ETH Zurich, https://doi.org/10.3929/ethz-b-000213853, 2017.
Woolley, G. J.: Code for the Soil Vegetation and Snow version 2 (SVS2) land surface model (Woolley et al., 2025), Version v1.0.0, Zenodo [code], https://doi.org/10.5281/zenodo.15091095, 2025a.
Woolley, G. J.: georginawoolley/Snow-Properties-Ku-Band-Backscatter-: Snow Properties and Ku-Band Backscatter, Version v1.0.0, Zenodo [data set], https://doi.org/10.5281/zenodo.15091024, 2025b.
Woolley, G. J., Rutter, N., Wake, L., Vionnet, V., Derksen, C., Essery, R., Marsh, P., Tutton, R., Walker, B., Lafaysse, M., and Pritchard, D.: Multi-physics ensemble modelling of Arctic tundra snowpack properties, The Cryosphere, 18, 5685–5711, https://doi.org/10.5194/tc-18-5685-2024, 2024.
Zuanon, N.: IceCube, a portable and reliable instrument for snow specific surface area measurement in the field, International Snow Science Workshop Grenoble, Chamonix Mont-Blanc, 7–11 October 2013, ISSW13_paper_P2-20.pdf, 1020–1023, 2013.
- Abstract
- Introduction
- Study Location
- Data and Methods
- Results
- Discussion
- Conclusion
- Appendix A: The canopy module in SVS2-Crocus
- Appendix B: Profiles of density and SSA at Trail Valley Creek, Valley, Mixed Shrub and Shrub Tree
- Code and data availability
- Author contributions
- Competing interests
- Disclaimer
- Acknowledgements
- Financial support
- Review statement
- References