the Creative Commons Attribution 4.0 License.
the Creative Commons Attribution 4.0 License.
 | 17 Feb 2026
The changing mass of the Antarctic Ice Sheet during ENSO-dominated periods in the GRACE era (2002–2022)
John Bright Ayabilah
Matt King
Danielle Udy
Tessa Vance
Large-scale modes of climate variability significantly influence Antarctic Ice Sheet (AIS) mass change. Improved understanding of the relationship between these climate modes and AIS mass change can help reduce uncertainties in future ice mass estimates and its contribution to sea level rise. However, the spatiotemporal patterns of AIS mass variation driven by El Niño Southern Oscillation (ENSO)-induced atmospheric circulation remain unclear. We investigated AIS mass variability during different ENSO periods using Gravity Recovery and Climate Experiment (GRACE) observed mass changes and modelled surface mass balance (using RACMO2.4p1) over the period 2002 to 2022. To allow comparison with GRACE, we used a cumulative sum indexing method to define different ENSO-dominated `periods' over 2002–2022. This method results in time periods that are dominated by a particular phase of ENSO, that is not necessarily equivalent to specific events as derived from canonical indices. The results show strong spatial variability in how the ENSO teleconnection cumulatively manifests over the AIS. These differing spatial patterns are primarily driven by changes in the Amundsen Sea Low strength, location, and extent, which alter circulation patterns and moisture flow in West Antarctica. In East Antarctica, ice mass variability is largely influenced by the positioning of cyclonic and anticyclonic circulation anomalies, primarily driven by the Southern Annular Mode; however, ENSO signals are also present. In both East and West Antarctica, this study shows that the spatial impact of any given ENSO-dominant period can trigger distinct circulation patterns which can variably influence surface mass balance and ice mass change. However, uncertainties remain, as the mass variability observed during ENSO-dominant periods may not be solely attributed to ENSO, due to teleconnections that may not have fully developed or may have been masked by other processes.
- Article
(8854 KB) - Full-text XML
-
Supplement
(944 KB) - BibTeX
- EndNote


The drivers of inter-annual to decadal Antarctic Ice Sheet (AIS) mass variability are complex and not yet fully understood (IMBIE Team, 2018). External factors, such as episodic extreme precipitation events often linked to atmospheric rivers (Wille et al., 2021), and internal factors, including ice dynamics (IMBIE Team, 2018), both contribute to these variations. Understanding the mechanisms underlying AIS mass change and variability is critical for improving future projections of ice mass changes and the Antarctic contribution to sea level rise.
The main determinants of the net AIS mass balance (MB) are ice discharge (D) from the continental margins of Antarctica and Surface Mass Balance (SMB). SMB is further defined as accumulating precipitation and riming onto the ice sheet, minus runoff, sublimation/evaporation and blowing snow erosion. The fluctuation of the AIS mass balance and its subsequent contribution to sea level rise are based on the difference between ice discharge and SMB (i.e., MB = SMB −D). The AIS SMB exhibits high variability on inter-annual to decadal timescales (Kim et al., 2020; Medley and Thomas, 2019; van de Berg et al., 2006). Precipitation variability, driven by atmospheric circulation, is a key determinant of Antarctic SMB and, over a wide range of timescales, including interannual to decadal, is closely linked to modes of climate variability (Kim et al., 2020).
The Southern Annular Mode (SAM) is the dominant mode of extratropical variability in the Southern Hemisphere. The SAM signal is driven by a combination of internal atmospheric dynamics and external forcings, including stratospheric ozone depletion, increases in greenhouse gases, and tropical teleconnections (Fogt and Marshall, 2020a). It varies on timescales from weeks to decades, and its influence on Antarctic precipitation is regionally dependent (Marshall et al., 2017). During the positive phase of SAM, the westerlies around 60° S strengthen, and the overall impact on the AIS is a net decrease in SMB (Marshall et al., 2017; Medley and Thomas, 2019). Conversely, the net influence of the negative phase of SAM on the AIS is an increase in SMB (Medley and Thomas, 2019; Marshall et al., 2017). However, SAM related circulation patterns are not stationary and vary over decades, meaning that the regional impacts may shift over time (Marshall et al., 2013).
The El Niño Southern Oscillation (ENSO) is the dominant mode of inter-annual climate variability globally (2–7-year timescales) and is defined by variations in sea surface temperature (SST) anomalies in the tropical Pacific (McPhaden et al., 2006). The ENSO pathway to Antarctica is modulated by the Amundsen Sea Low (ASL), which lies at the poleward end of a Rossby wave train originating in the tropics (Hoskins and Karoly, 1981). This Rossby wave train leads to the formation of the Pacific South American mode 1 (PSA-1), an atmospheric anomaly pattern that enables ENSO signals to reach Antarctica (Hoskins and Karoly, 1981). This creates a positive pressure anomaly over the Amundsen-Bellingshausen sector (ABS) during El Niño events – the positive phase of PSA-1 and negative pressure anomaly during La Niña conditions – the negative phase of PSA-1 (Turner, 2004; Hoskins and Karoly, 1981). The ASL represents a climatological area of low pressure in the South Pacific and is a key component of the nonzonal climatological circulation (Raphael et al., 2016a). The teleconnection between ENSO and the ASL is strongest during the austral spring (September–November; SON) but exerts influence throughout the year (Schneider et al., 2012; Clem and Fogt, 2013; Fogt et al., 2011). The strength, extent, and location of the ASL shows significant variability during different ENSO phases and individual ENSO events, resulting in varying atmospheric circulation patterns that strongly influences moisture and temperature distribution in West Antarctica (Raphael et al., 2016a; Hosking et al., 2013). The impact of ENSO on Antarctic climate is modulated by the phase of SAM, with the signal amplified when SAM and ENSO are atmospherically in phase (positive SAM/La Niña or negative SAM/El Niño) and reduced when they are atmospherically out of phase (positive SAM/El Niño or negative SAM/La Niña) (Clem et al., 2016; Fogt et al., 2011). Positive SAM and La Niña conditions are associated with a deepening (i.e. lower pressure anomaly) ASL, while negative SAM and El Niño conditions weaken the ASL, and influence its longitudinal shift (Raphael et al., 2016a; Hosking et al., 2013). The deepening of the ASL induces continental wind outflow on its western flank, reducing precipitation and SMB over the Antarctic Peninsula and from the Bellingshausen Sea to the Ross Sea region in West Antarctica, whereas a weakened ASL leads to onshore winds that enhance precipitation and SMB (Zhang et al., 2021; Li et al., 2022). The longitudinal shift of the ASL modifies these impact zones.
The spatial patterns and magnitude of AIS mass variability due to large-scale modes of climate variability remain unclear. Studies on the role of ENSO in Antarctic climate have mostly focused on precipitation derived from reanalysis products or modelled SMB data (e.g., Medley and Thomas, 2019; Clem et al., 2016; Clem and Fogt, 2013; Fogt et al., 2011). Only a few studies have examined the relationship between large-scale modes of climate variability and recent observed ice mass variation using Gravity Recovery and Climate Experiment (GRACE) observed AIS ice mass change time series on timescales ranging from months to decades (e.g., Bodart and Bingham, 2019; Zhang et al., 2021; King et al., 2023). Most of these studies have focused on single strong ENSO events, such as the 2015–2016 El Niño (Bodart and Bingham, 2019), or on the mean impact of ENSO on the AIS. In contrast, our study investigates the spatial impacts of multiple individual ENSO periods (as defined in our study), enabling an assessment of how AIS mass variability differs between events and capturing the diverse responses across the ice sheet, rather than a mean signal.
The GRACE mission, launched in 2002, has contributed to our understanding of the redistribution of mass within the Earth system, which is useful for observing changes of the Greenland and Antarctic ice sheets (Tapley et al., 2004; Shepherd et al., 2012). GRACE-observed ice mass variability is related to atmospheric circulation-driven snow accumulation and variation in ice discharge (Diener et al., 2021). Although mass loss from runoff and sublimation is included in the GRACE signal, these components are relatively minor compared to discharge. Over the interannual timescales, atmospheric variability dominates the observed mass changes (King et al., 2023). Studies of ENSO's impact on AIS using GRACE-observed ice mass changes show that different ENSO events result in varying climatic and surface weather effects, leading to different spatial patterns of AIS mass variability. Bodart and Bingham (2019) demonstrated that during the 2015–2016 El Niño, the Antarctic Peninsula and West Antarctica gained mass, while East Antarctica experienced a reduction in mass. This spatial pattern is also consistent over a longer period, in line with Zhang et al. (2021) who found similar correlations. They observed a bipolar spatial pattern: during El Niño events, there was a mass gain over the Antarctic Peninsula and West Antarctica and a mass loss over East Antarctica, while the pattern reversed during La Niña events. The bipolar spatial patterns are consistent with the results of King et al. (2023), based on a GRACE analysis for the period 2002–2021, and King and Christoffersen (2024), which used GRACE and altimetry data (2002–2020), despite differences in approaches and study periods. However, other studies have suggested that specific ENSO events and types of ENSO events have distinct impacts on Antarctic SMB that are not limited to a bipolar pattern (e.g., Macha et al., 2024; Sasgen et al., 2010).
This study aims to investigate the spatial patterns of ice mass change and the driving atmospheric circulation conditions during various ENSO-dominated periods, as observed in GRACE-derived AIS mass variations between 2002 and 2022. Since GRACE observes total mass change without distinguishing between the individual components of the mass balance, we use SMB output from a regional climate model RACMO2.4p1 to assess the contribution of SMB to the spatial patterns detected by GRACE. The results indicate that no two ENSO periods have the same net effect on Antarctic ice mass, especially at regional scales, and the bipolar spatial pattern observed in earlier studies is not consistent across all ENSO events. This variability suggests that the ENSO signal in the AIS is shifted from its background pattern depending on event-specific atmospheric and oceanic factors.
2.1 AIS mass change
We used the GRACE and GRACE Follow On data, provided by the GFZ German Research Centre for Geosciences (Landerer et al., 2020). The GRACE Follow-On mission, launched in May 2018, succeeded the GRACE mission, which was decommissioned in October 2017 due to battery and fuel problems. This gap between the GRACE and GRACE Follow-On missions resulted in the loss of data from July 2017 and May 2018. Our analysis involved GRACE data spanning from April 2002 to December 2022 without gap filling. We used the COST-G release 1 version 3 (RL-01 V0003) gridded mass anomaly product, which combines GRACE/GRACE-FO solutions from multiple GRACE analysis centres (Landerer et al., 2020). The data are provided on 50 km grid products with approximately monthly temporal sampling. However, GRACE data have an underlying spatial resolution of ∼300 km (Sasgen et al., 2020; Dahle et al., 2025). This relatively coarse resolution limits GRACE's ability to resolve or capture relatively small mass changes, particularly those associated with localised SMB anomalies.
The various available GRACE data products differ based on the processing methods and background models used. The gridded mass change product adopted here is initially derived by solving for spherical harmonic coefficients and then computing mass anomalies for each grid cell across the entire ice sheet using tailored sensitivity kernels that minimise both GRACE and leakage error (Groh and Horwath, 2016). Within this product, glacial isostatic adjustment is corrected using the ICE6G_D model (Peltier et al., 2018), although this has no bearing on non-linear variability as studied here. The effects of atmospheric and oceanic mass redistribution are modelled using standard de-aliasing products. Spherical harmonic degree-1 terms are added based on the approach of Swenson et al. (2008). Further details about the GRACE time series, post-processing techniques, and quality assessment can be found in Dahle et al. (2019). It is worth noting that the GRACE-observed ice mass change time series is affected by systematic errors associated with the GRACE orbital geometry and small unmodelled errors, evident in the (largely north-south) striping pattern observed in some of the ice mass change results.
We focus our analysis on the ENSO signal in ice mass variation during different ENSO-dominated periods. First, we removed short-term signal fluctuations in the GRACE data by applying a 7-month moving median smoother to the GRACE time series. This filter choice, following King et al. (2023), is a subjective decision aimed at dampening month-to-month noise without distorting longer-term variability. Since our focus is on GRACE-observed ice mass variability, we subtracted the linear trend at each grid point, estimated using ordinary least squares over the data span. This effectively produces mass anomalies with respect to the 2002–2022 GRACE period.
To understand the relationship between ice mass changes and ENSO-dominated periods, we computed the rate of ice mass change for each identified ENSO-dominated period. These rates represent the impact of ENSO during each ENSO-dominated period. We calculated the rates for each grid cell of the gridded GRACE ice mass anomaly data and generated spatial patterns of ice mass trends for each ENSO-dominated period.
2.2 Climate indices
To characterise ENSO variability, we used the Niño3.4 index, one of several metrics that measures the strength and phase of ENSO based on SST anomalies in the central and eastern tropical Pacific. This index is obtained by tracking the running five-month mean SST based on the HadlSST record over 5° N–5° S, 170–120° W (Rayner et al., 2003) and is normalised and shown in Fig. 1a. It is provided by the Climate Prediction Centre (CPC) of the National Oceanic and Atmospheric Administration (NOAA) and can be accessed at https://psl.noaa.gov/data/timeseries/month/Nino34/ (last access: 1 March 2025). The Niño3.4 temperature anomalies are standard for detecting and monitoring ENSO events but cannot differentiate between eastern and central ENSO events. We used the Niño3.4 index because our focus was on the spatial variability in AIS mass during all ENSO events, rather than differentiating between eastern and central ENSO events.
For SAM, we used the station-derived index from Marshall (2003), available at http://www.nerc-bas.ac.uk/icd/gjma/sam.html (last access: 1 March 2025), and shown in Fig. 1a. This index is based on the zonal pressure differences at 12 stations located between 40 and 65° S.
To identify ENSO signatures in the GRACE data, we first identified El Niño- and La Niña-dominated periods based on the cumulative summed indices, which act as a sort of low-pass filter of the raw indices. The cumulative summed indices were derived from anomalies relative to their climatological mean using a reference window of 1971–1999. This period is a well observed period before the commencement of GRACE and is the same as that chosen by King et al. (2023). After the indices were normalised using the mean and standard deviation computed within the reference window, the normalised indices were restricted to the GRACE period, cumulatively summed, detrended, and renormalised.
To investigate the potential linkage between large-scale climate variability and ice mass variation, we cumulatively summed all the climate indices (Fig. 1b) and further detrended them (Fig. 1c). The AIS mass reflects the compound effect of surface mass fluxes over time. The cumulative mass flux observed by GRACE reflects the cumulative climate indices (King et al., 2023) as opposed to raw indices, which relate to mass flux. These cumulative indices are also captured by modelled cumulative SMB (Kim et al., 2020; Diener et al., 2021). The alternative approach is to difference GRACE data in time, but this inflates the GRACE noise and reduces the lower frequency signal and is hence undesirable (King et al., 2023).
In this study, we defined El Niño-dominated periods as intervals during which the positive phase of ENSO persists and outweighs the negative phase, culminating in a positive peak in the cumulative ENSO index. Similarly, La Niña-dominated periods are defined as intervals during which negative phase outweighs the positive phase, culminating in a negative peak. Only ENSO periods with a minimum duration of 12 months were considered in our analysis. In a cumulatively summed index, these are expressed as sustained periods of positive (El Niño) or negative (La Niña) slope. Based on this criterion, we identified four El Niño-dominated periods over the GRACE time steps: 2002–2005, 2009–2010, 2014–2016, and 2018–2020 (Fig. 1d). An equal number of La Niña-dominated periods were found, covering 2007–2009, 2010–2014, 2016–2018, and 2020–2022. The strength of the expression of the ENSO signal in the Antarctic climate is modulated by the phase of SAM (Fogt et al., 2011). During the 2002–2005 El Niño-dominated period, the cumulative SAM index was dominated by negative SAM until around 2008 (atmospherically in phase El Niño/-SAM). After 2008, the cumulative SAM index exhibited no notable trend, indicating a neutral phase. During the 2014–2016 El Niño, cumulative SAM and ENSO indices were atmospherically out of phase (El Niño/+SAM). SAM shifted to a neutral state during the 2016–2018 La Niña. SAM and ENSO were atmospherically in phase during the 2018–2020 El Niño (El Niño/-SAM) and 2020–2022 La Niña (La Niña/+SAM), which is notable as the only time positive SAM and La Niña co-occurred over the GRACE period (Fig. 1d, e).
Note that we do not distinguish between Central Pacific (CP) and Eastern Pacific (EP) El Niño events in our analysis because our ENSO dominated periods frequently span multiple years. Indeed, examining the cumulative CP and EP indices shows they are very similar, aside from 2016–2018, and hard to distinguish in an analysis of GRACE data (Fig. S1b). Our method using the Niño3.4 index encapsulates variations in the tropical spatial pattern of SST anomalies.
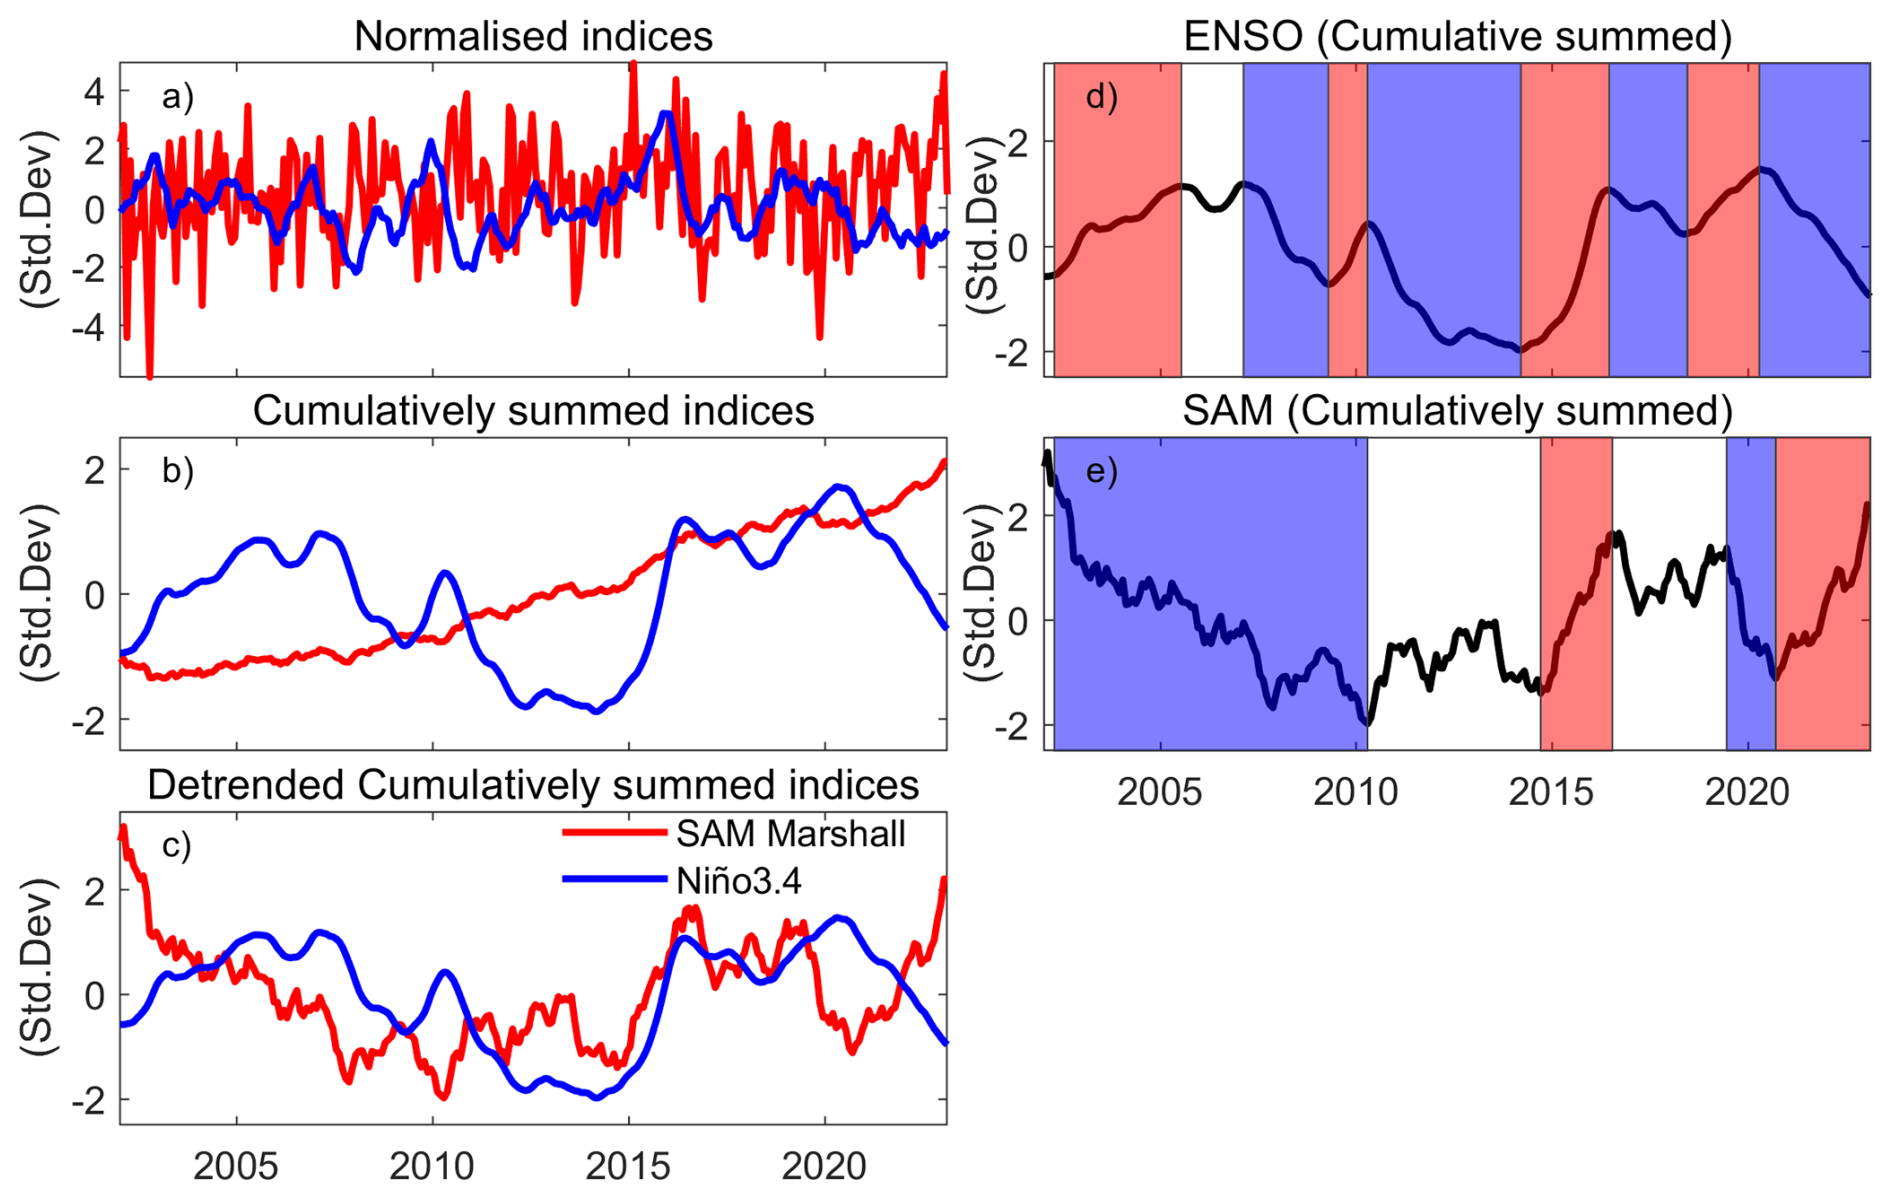
Figure 1Monthly climate indices of SAM (Marshall, 2003) and Niño3.4 from 2002–2022: (a) normalised SAM and Niño3.4 indices; (b) normalised cumulatively summed SAM and Niño3.4 indices; (c) detrended, cumulatively summed SAM and Niño3.4 indices (normalised). Periods until positive and negative peaks are reached in the cumulatively summed Niño3.4 are defined as El Niño-dominated and La Niña-dominated periods, respectively, represented as red and blue shaded areas in (d). Similarly, periods until positive and negative peaks are reached in the cumulatively summed SAM index (Marshall, 2003) are defined as SAM-positive and SAM-negative dominated periods, respectively, denoted as red and blue shaded areas in (e). Neutral dominated periods are represented by white shading.
2.3 SMB model outputs
We used modelled SMB output from the Regional Atmospheric Climate Model RACMO2.4p1 model (van Dalum et al., 2025, 2024b). This model has a horizontal resolution of 11 km and a vertical resolution of 40 atmospheric levels. This version of SMB model output is forced by ERA5 reanalysis data at its lateral boundaries and SST and sea ice extent at the sea surface boundary, with data available from 1979 onward. Compared with previous releases, RACMO2.4p1 provides a better representation of SMB process which agree with observation (van Dalum et al., 2025, 2024b). For our study, monthly SMB values truncated to the GRACE period were used, covering April 2002 to December 2022. To compare with GRACE data, we computed anomalies relative to the 2002–2022 mean and then cumulatively summed them to obtain cumulative SMB anomalies in units of kg m−2. These anomalies were then interpolated to match the GRACE grid spacing and time steps. We detrended the cumulative SMB and performed a regression analysis on these anomalies for each defined ENSO-dominated period.
2.4 Reanalysis climate data
To explore the potential climatic forcing during an ENSO-dominated period, we examined monthly mean ERA5 reanalysis model 10 m winds and sea level pressure from 2002 to 2022, with a resolution of 0.25° by 0.25° (Hersbach et al., 2020). Anomalies of 10 m zonal and meridional wind components, as well as sea level pressure, were computed for each grid cell relative to the mean over the GRACE period, for all regions south of 40° S. We then computed anomaly composite means for each ENSO-dominated period. We used ERA5 products instead of RACMO outputs because ERA5 provides broader spatial coverage and is more suitable for capturing large-scale atmospheric circulation patterns, which are critical for analysing ENSO-related teleconnections. Additionally, RACMO is forced by ERA5.
2.5 Definitions of events, periods and anomaly interpretations used in this study
We use the term “El Niño- or La Niña-dominated period” or simply “period” when considering periods of sustained ENSO phase as defined using our cumulatively summed index. In contrast, when comparing to or describing other literature, we use the term “El Niño/La Niña event” which refers to the peak phase of ENSO events. We also describe anomalies from the mean over the GRACE period. For the purposes of this study, the pressure and wind fields, as well as SMB and GRACE mass change, depicted in the figures represent anomalies from the 2002–2022 period for each relevant variable. That is, for a given wind and pressure map, the fields depict wind and pressure anomalies against the 2002–2022 mean (the GRACE data period). For example, positive anomalies over the Antarctic continent reflect a relative strengthening of the mean Antarctic High, while negative anomalies reflect a relative weakening of the Antarctic High (not the presence of a low). For SMB, positive SMB and GRACE anomalies represent an increase in mass, whereas negative anomalies indicate a reduction in mass relative to 2002–2022.
2.6 Statistical significance of the results
To quantify the significance of our regression trends at each grid point, we employed a two-tailed Student's t test. The standard error of the slope at each grid point was calculated from the regression residuals and used to assess whether the slope significantly differed from zero at the 5 % significance level. For mean sea level pressure anomaly composites, statistical significance was assessed relative to the 2002–2022 baseline using a two-sample t test assuming unequal variances, also at the 5 % significance level.
3.1 Ice mass change
We start by examining the long-term trend and acceleration in AIS mass change over the GRACE observational period, represented by the linear and quadratic terms in the regression, respectively (Fig. 2). The spatial pattern reveals strong regional variability, with areas of both positive and negative mass anomalies. While not identical, the linear rate and acceleration exhibit closely aligned spatial patterns of mass change. In West Antarctica, the rate of ice mass loss is most pronounced in the Amundsen Sea and Bellingshausen Sea sectors, where accelerated ice discharge is well documented (Rignot et al., 2019; Gardner et al., 2018). The East Antarctic ice sheet shows mass gain across Dronning Maud Land (and through to Enderby Land); conversely, the Wilkes Land sector has experienced a decline in mass. The negative acceleration observed in the Amundsen Sea sector and Wilkes Land indicates that the rate of mass loss in these regions is increasing over time.
While the long-term trend in AIS mass is primarily driven by ice dynamics, the interannual variability is more closely linked to changes in precipitation (Kim et al., 2020). Short-term mass fluctuations can be influenced by large-scale circulation modes. To explore the impact of ENSO on ice mass variability, we next examine how atmospheric circulation and mass anomalies respond to ENSO forcing.
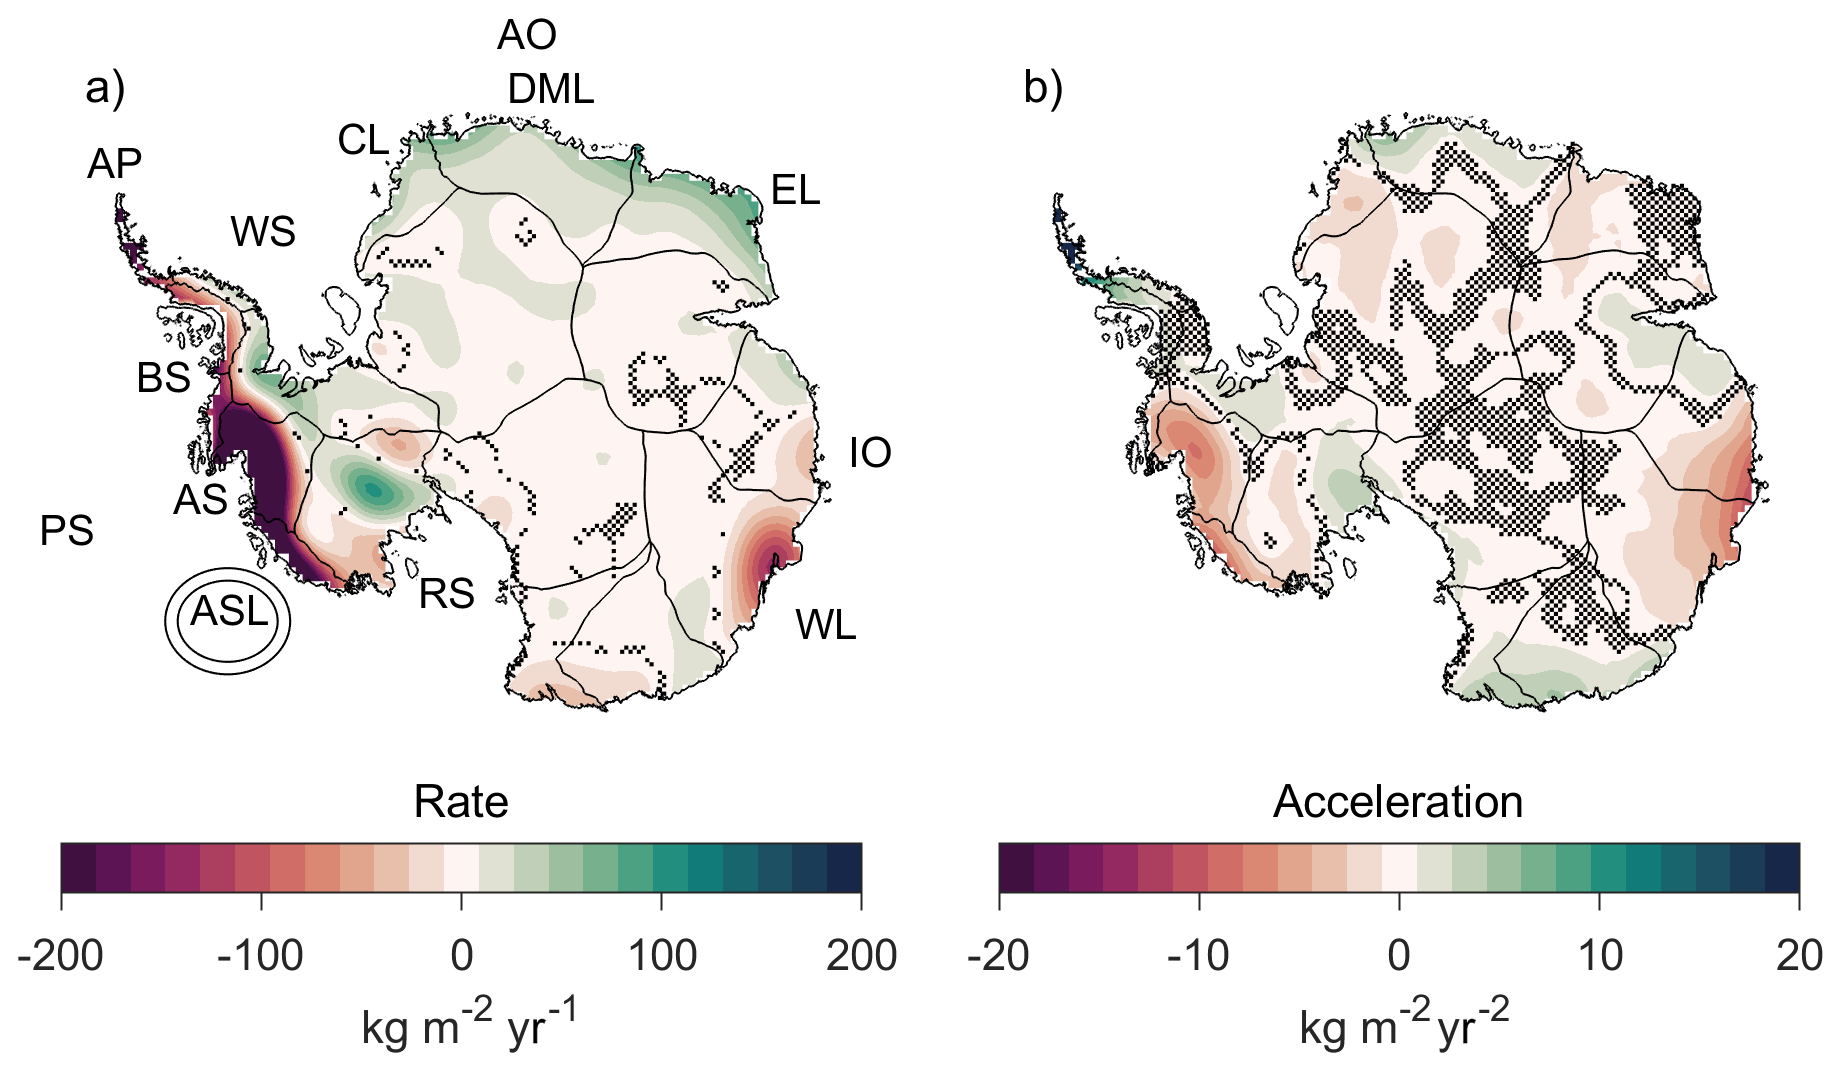
Figure 2(a) Linear rate and (b) acceleration of AIS mass change (2002–2022) based on GRACE data from using univariate regression. Key Antarctic regions are labelled: Antarctic Peninsula (AP), Bellingshausen Sea (BS), Amundsen Sea (AS), Amundsen Sea Low (ASL), Pacific Sector (PS), Ross Sea (RS), Indian Ocean (IO), Atlantic Ocean (AO), Wilkes Land (WL), Enderby Land (EL), Dronning Maud Land (DML), Coats Land (CL), and Weddell Sea (WS). Stippling indicates areas not statistically significant (ρ>0.05). Significance tests do not reflect the effects of temporal correlations in these data (Williams et al., 2014).
Figure 3 presents the regression results of cumulatively summed anomalies in ERA5 reanalysis climate variables (sea level pressure and 10 m winds) and RACMO2.4p1 model SMB, along with GRACE-derived ice mass change anomalies, against the cumulatively summed Niño3.4 index. All variables were detrended before regression to focus on the variability. The results show that the cumulative ENSO is associated with shifts in atmospheric circulation that supports the observed dipole SMB and ice mass anomaly between West and East Antarctica (Fig. 3a).
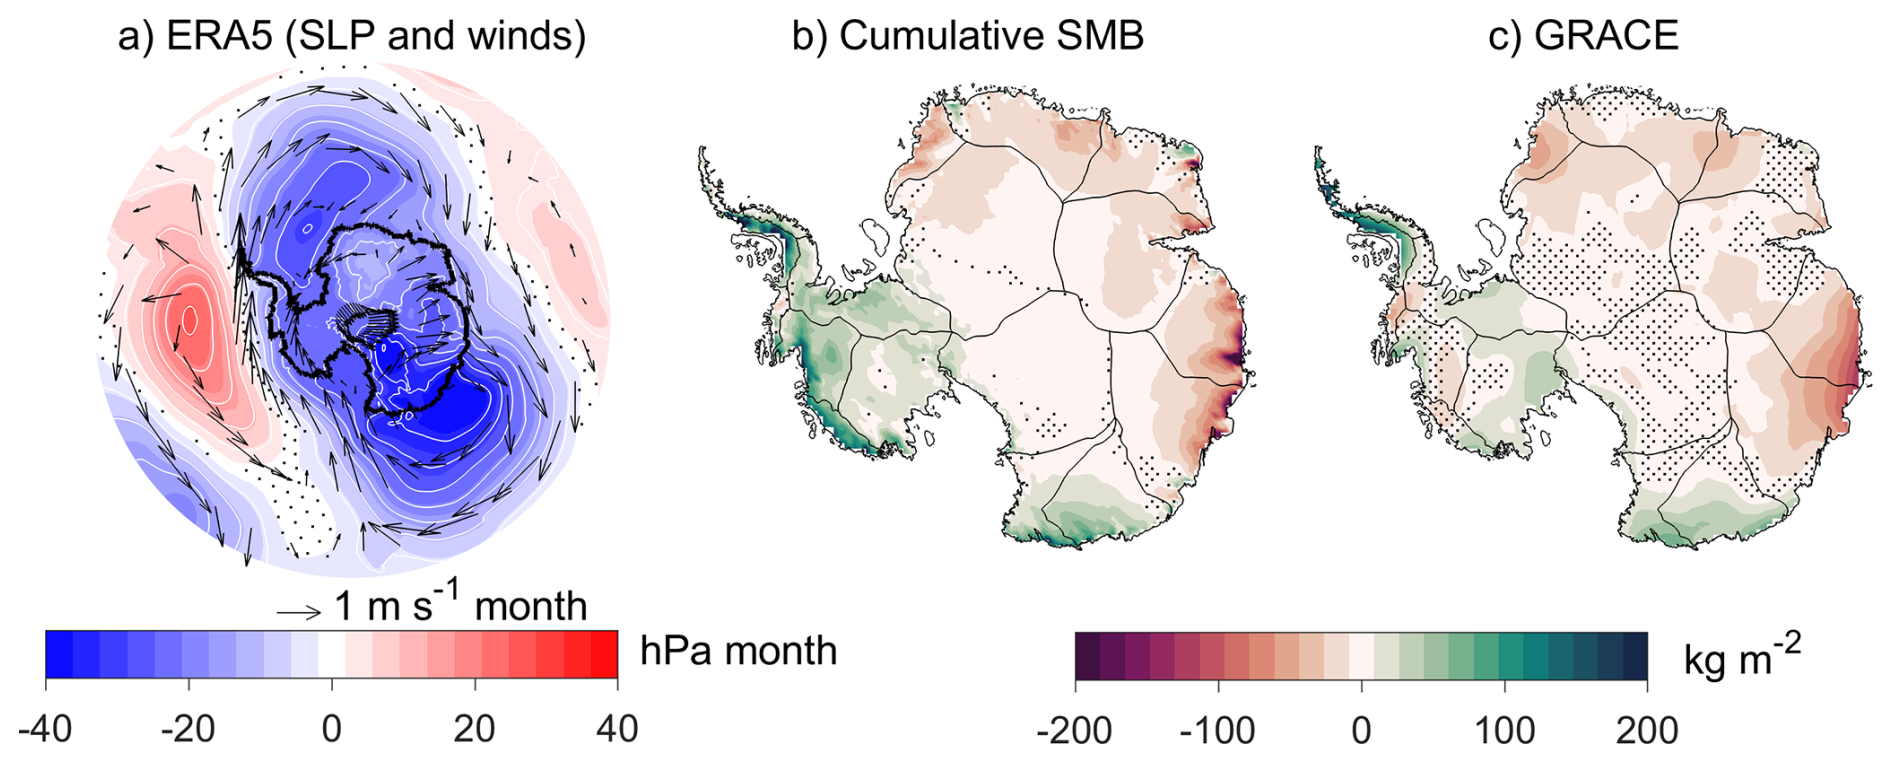
Figure 3Regression of cumulatively summed sea level pressure (shaded region and contour) and 10 m wind anomalies represented by reference vectors (m s−1) from ERA5 reanalysis (a), cumulatively summed RACMO2.4p1 model SMB anomalies (b), and GRACE ice mass change anomalies (c) regressed against cumulatively summed Niño3.4. The u and v wind components were regressed separately. All panels reflect regression anomalies over the period 2002–2022. All variables were linearly detrended prior to regression using the full data periods. Stippling indicates regions where the regression results are not statistically significant (ρ>0.05).
We also compared the regression results presented in Fig. 3 with El Niño and La Niña composites (see Fig. S2) derived from annual accumulated SMB anomalies and annual mean Niño3.4 index, which broadly agree with the cumulative approach spatial patterns observed in West and East Antarctica. From the composite map (Fig. S2, covering 2002–2022), we observe that in West Antarctica, El Niño years are associated with a positive mean SMB anomaly (26.98 kg m−2 yr−1), while La Niña years correspond to a negative mean anomaly (−10.29 kg m−2 yr−1). In contrast, East Antarctica shows a negative mean SMB anomaly (−3.14 kg m−2 yr−1) during El Niño years and a positive anomaly (5.28 kg m−2 yr−1) during La Niña years.
Our result shows that, spatially, SMB and ice mass increase in West Antarctica and decrease in East Antarctica during El Niño-dominated periods, with the pattern reversing during La Niña-dominated periods (Fig. 3b–c). The cumulative ENSO-induced changes in meridional flow are associated with the SMB variability (Fig. 3a–b). Since SMB fluctuations are closely linked to ice mass change, the spatially coherent patterns between SMB and GRACE-derived ice mass change vary (Fig. 3b–c).
However, in West Antarctica, the SMB signal differs from GRACE-derived ice mass changes, which indicates relatively modest positive mass anomalies compared to the stronger SMB signal (Fig. 3b–c), whereas in East Antarctica, the two signals are more closely aligned.
We next focus on the variability within ENSO-dominated periods and find that no two ENSO periods are identical. We examine AIS mass change, SMB variability, and the atmospheric circulation driving these changes during different ENSO-dominated periods we defined in this study (see Sect. 2.2). The results reveal distinct spatial patterns of ice mass change associated with individual El Niño and La Niña events. We remind the reader that the GRACE signal is more reliable in the coastal regions and less reliable in the interior, where inherent systematic errors in GRACE measurements in the form of north-south striping are more pronounced.
3.2 El Niño-dominated periods
Across the Antarctic continent, spatial pressure anomalies vary between El Niño-dominated periods, with both positive and negative pressure anomalies observed (Fig. 4a–d). These pressure patterns reflect either a relative intensification or relative weakening of the mean Antarctic High (Fig. 4a–b). These variations align with the cumulatively summed SAM indices (Fig. 1e), where high-pressure anomalies correspond to prolonged negative SAM phases, and low-pressure anomalies coincide with prolonged positive SAM phases. Mass anomalies observed in both RACMO SMB and GRACE are most pronounced along the coastal regions, where the signals are statistically significant. In this study, we focus on the absolute mass changes during each period, while relative impacts are presented in Fig. S3.
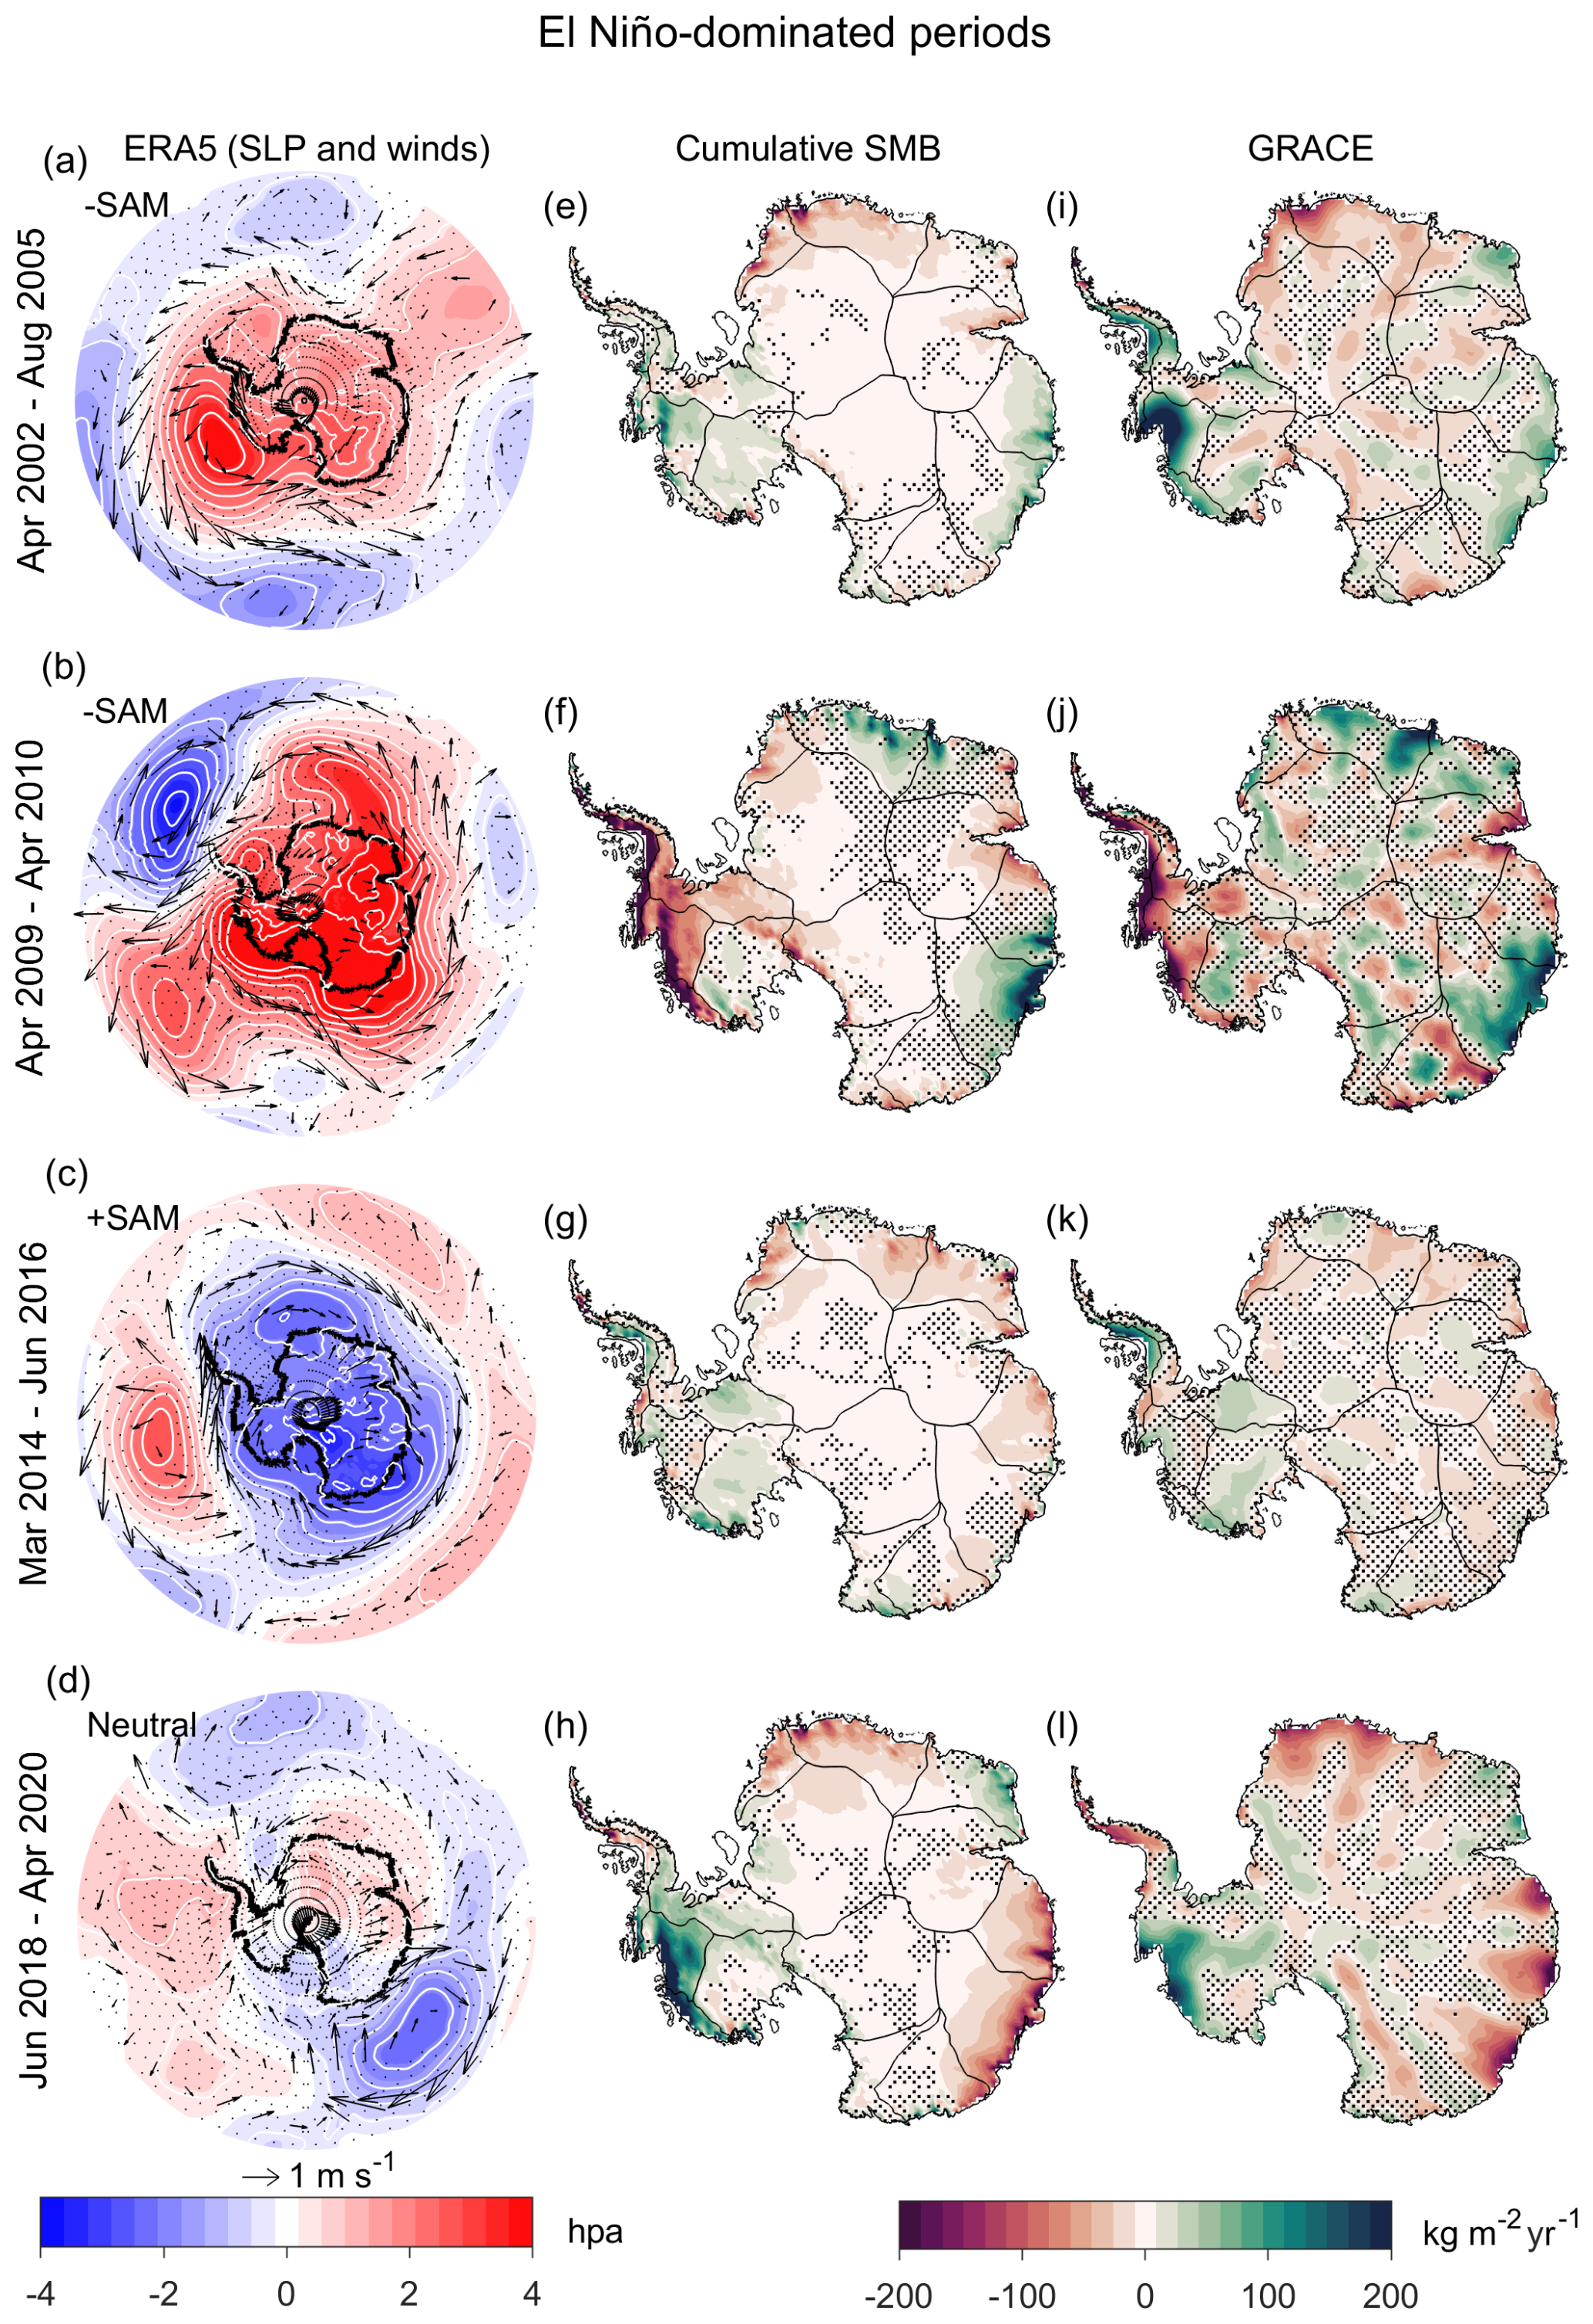
Figure 4Atmospheric circulation anomalies relative to the GRACE period (2002–2022) (a–d), rate of change in cumulative SMB anomalies from RACMO2.4p1 model (e–h) and linear rate of GRACE-derived ice mass anomalies (i–l) during El Niño-dominated period. Sea level pressure anomalies are shown as shaded regions with contours (hPa), while wind anomalies are indicated by reference vectors (m s−1). SMB and GRACE maps (kg m−2 yr−1) illustrate variability in AIS mass for each identified El Niño-dominated period. The GRACE signal is more reliable in the coastal regions and less reliable in the interior, where GRACE systematic error in the form of north-south striping is more evident. Non-significant areas are stippled for the pressure anomalies and AIS mass trend at p value >0.05.
3.2.1 West Antarctic anomalies during El Niño-dominated periods
In West Antarctica, El Niño-dominated periods are characterised by a positive pressure anomaly in the Pacific sector off the West Antarctic coastline (Fig. 4a–b). The position and strength of these positive pressure anomalies vary for each El Niño-dominated period, which is also reflected in the variation of wind anomalies and spatial patterns of SMB (Fig. 4e–h) and ice mass change (Fig. 4i–l). However, during the 2018–2020 period, no significant pressure anomaly is observed, and in the 2009–2010 period, a significant pressure anomaly is located closer to the continent, with a non-significant pressure anomaly further north (Fig. 4a–b).
During three out of four El Niño-dominated periods (2002–2005, 2014–2016, and 2018–2020), the Amundsen Sea sector shows positive anomalies in both SMB (Fig. 4e, g–h) and ice mass anomalies (Fig. 4i, k–l), indicating mass gain, despite variations in the location and strength of the positive pressure anomaly in the Pacific (Fig. 4a, c–d). The positive mass anomalies are more widespread across the Amundsen Sea sector during the 2002–2005 period in GRACE (Fig. 4i) and in both SMB and GRACE during the 2018–2020 period (Fig. 4h, l). The positive pressure anomaly in the Pacific which supports these mass gains, is significant during the 2002–2005 period.
For the 2014–2016 El Niño-dominated period, we observed weak and, in some regions, non-significant positive SMB and ice mass anomalies in the Amundsen Sea sector and western Ross Sea (Fig. 4g, k). During this period, our cumulative ENSO and SAM were out of phase (El Niño/+SAM), as evidenced by significant negative pressure anomalies over the continent (Fig. 4c). The positive pressure anomaly in the Pacific was located away from the coastline and was associated more with wind anomalies along the shore, rather than onshore (Fig. 4c).
The mass change pattern in the Amundsen Sea sector during the 2009–2010 El Niño-dominated period is distinct from the other El Niño periods, with widespread significant negative SMB (Fig. 4f) and ice mass (Fig. 4j) anomalies indicating a net mass reduction. In contrast to the other El Niño periods, a large area of significant positive pressure anomaly extends offshore from the Antarctic continent, spanning from the Peninsula to beyond the Ross Sea, and supports offshore wind anomalies in the Amundsen Sea sector (Fig. 4b).
The Antarctic Peninsula exhibits contrasting mass change responses during El Niño-dominated periods (Fig. 4). Positive SMB (Fig. 4e, g) and ice mass anomalies (Fig. 4j, l) are observed during the 2002–2005 and 2014–2016 El Niño periods, particularly in GRACE (Fig. 4i, k), whereas negative SMB (Fig. 4f, h) and ice mass anomalies (Fig. 4j, l) are evident during the 2009–2010 and 2018–2020 periods. These mass change pattern align with pressure anomaly distributions and are associated with onshore wind anomalies during the 2002–2005 and 2014–2016 periods (Fig. 4a, c) and offshore wind anomalies for 2009–2010 and 2018–2020 (non-significant) periods (Fig. 4b, d).
3.2.2 East Antarctic anomalies during El Niño dominated periods
In the Atlantic Ocean sector, three out of four El Niño-dominated periods (2002–2005, 2014–2016, and 2018–2020) show consistent patterns with negative SMB (Fig. 4e, g–h) and ice mass (Fig. 4i, k–l) anomalies in Dronning Maud Land. The reduction in mass is more extensive during the 2002–2005 and 2018–2020 El Niño periods, covering much of Coats Land and Dronning Maud Land, with strong mass anomalies along the western edge of Dronning Maud Land (Fig. 4e, h, i, l). The magnitude of mass reduction is lesser for the 2014–2016 El Niño period (Fig. 4g). However, among these periods, the 2014–2016 El Niño period shows a significant pressure anomaly, which can be directly associated with the observed mass reduction patterns.
Conversely, during the 2009–2010 El Niño period, we observed a significant anomalous mass gain in Dronning Maud Land (Fig. 4f, j). This mass gain coincides with a significant positive pressure anomaly over the Atlantic, which supports onshore wind anomalies into Dronning Maud Land.
Enderby Land shows positive mass anomalies, which in some instances are evident in GRACE but not in SMB, and vice versa. For example, during the 2002–2005 El Niño period, positive mass anomalies are more pronounced in GRACE than in SMB (Fig. 4e, i), whereas during the 2018–2020 El Niño period, the positive anomalies are stronger in SMB than in GRACE (Fig. 4h, l). Atmospheric circulation anomalies during the 2009–2010 and 2014–2016 El Niño periods are statistically significant and supports the observed mass change patterns. For the 2002–2005 and 2018–2020 El Niño periods, we cannot associate the observed mass patterns to circulation anomalies at the 0.05 significance level.
In the Indian Ocean sector/Wilkes Land, mass gain is broadly observed during the 2002–2005 and 2009–2010 El Niño periods (Fig. 4e–f, i–j), and a reduction in mass during the 2014–2016 and 2018–2020 El Niño periods (Fig. 4g–h, k–l). During the periods with mass gain, positive pressure anomalies were present over Wilkes Land (Fig. 4a–b), with the anomaly more intense and statistically significant during the 2009–2010 El Niño period and associated with a greater magnitude of mass gain in Wilkes Land (Fig. 4b, f, j). Conversely, during periods broadly associated with mass reduction (Fig. 4g–h, k–l), negative pressure anomalies were observed around the Wilkes Land region, aligned with offshore wind anomalies across much of the sector (Fig. 4c–d).
3.3 La Niña-dominated periods
Figure 5 presents atmospheric circulation patterns, SMB anomalies, and AIS mass changes during La Niña-dominated periods. Absolute mass changes are shown in this section, while relative mass changes can be found in Fig. S4. The atmospheric circulation pattern anomalies during La Niña-dominated periods (Fig. 5a–d) shows fewer areas of statistical significance compared to the El Niño periods (Fig. 4a–d). Instrument malfunctions and the termination of the GRACE mission in 2017 introduced noise and data gaps, affecting ice mass estimates. Therefore, we limit our discussion to the atmospheric circulation and SMB for the 2016–2018 La Niña-dominated period to avoid conclusions based on potentially unreliable data in GRACE.
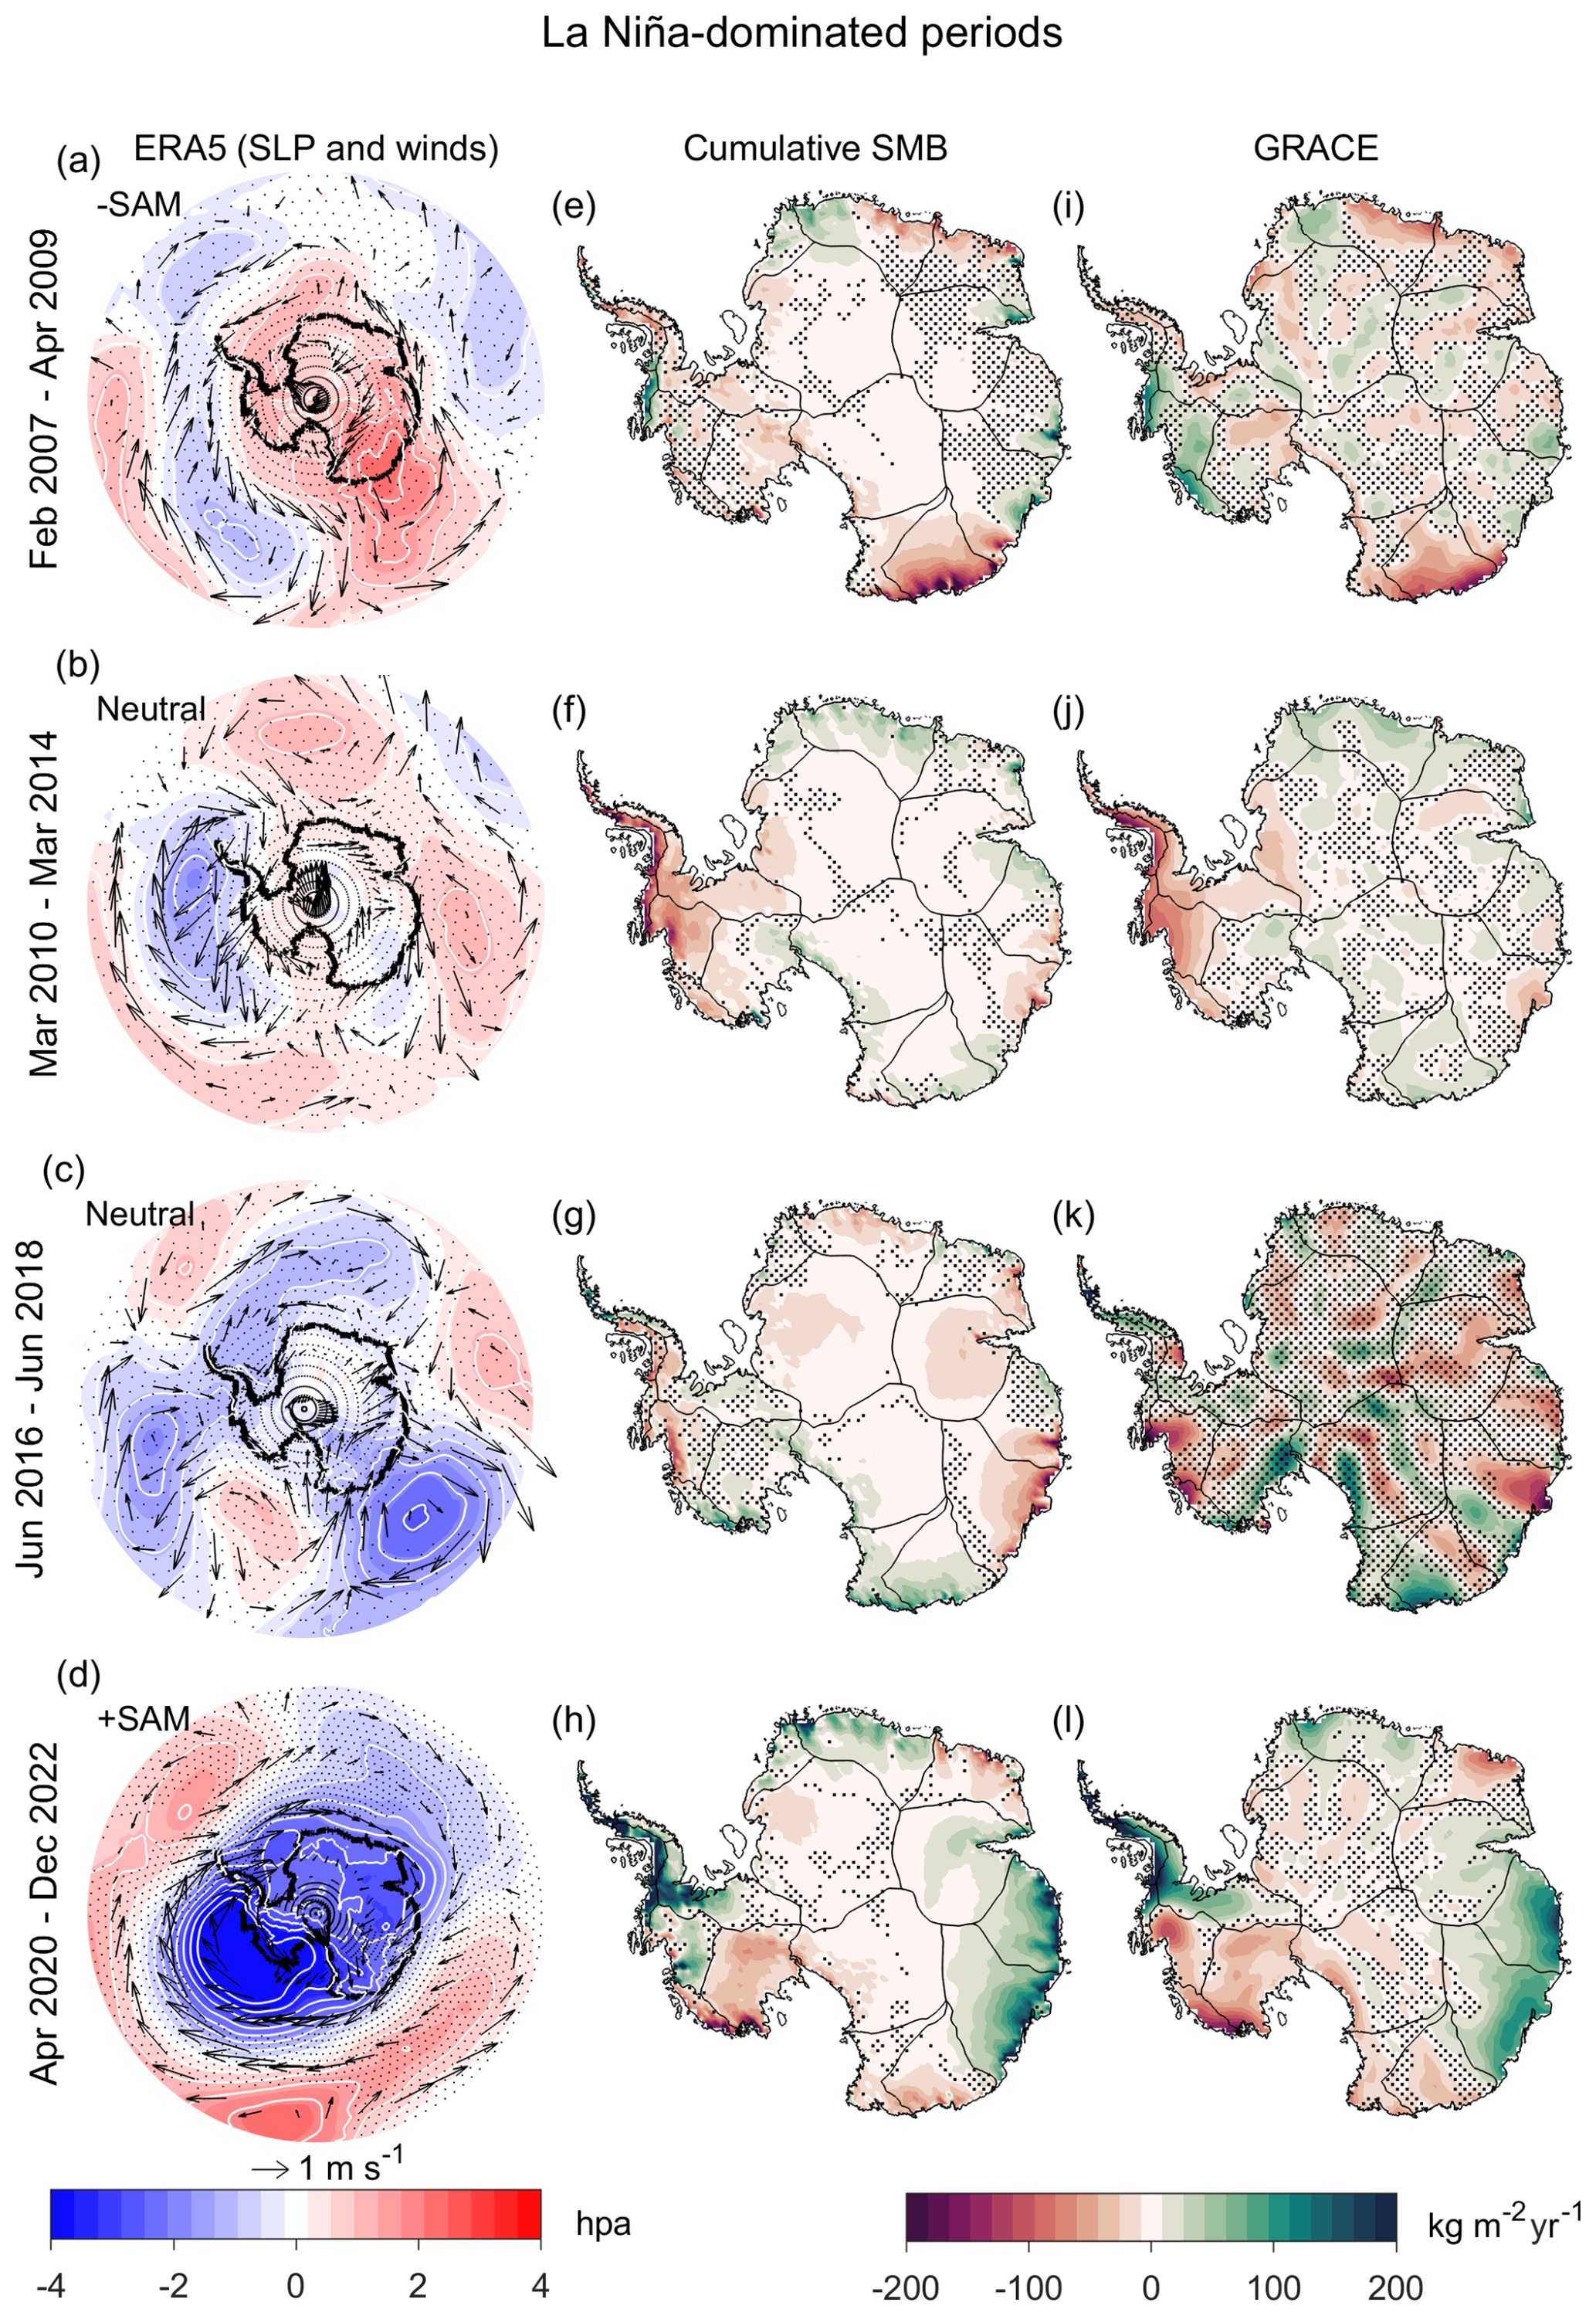
Figure 5Atmospheric circulation anomalies relative to the GRACE period (2002–2022) (a–d), rate of change in cumulative SMB anomalies from the RACMO2.4p1 model (e–h), and linear rate of GRACE-derived ice mass anomalies (i–l) during La Niña-dominated period. Sea level pressure anomalies are shown as shaded regions with contours (hPa), 10 m wind anomalies are indicated by reference vectors (m s−1). SMB and GRACE (kg m−2 yr−1) maps illustrate variability in AIS mass for each identified La Niña-dominated period. The GRACE signal is strongest near the coastal regions and weaker in the interior, where uncertainties are higher. The GRACE satellite malfunction during 2016–2018 is apparent in the signal for that period, where instrument noise dominates over actual variability with pronounced north-south striping. Non-significant areas are stippled for the pressure anomalies and AIS mass trend at p value >0.05.
3.3.1 West Antarctic anomalies during La Niña-dominated periods
Overall, during our La Niña-dominated periods, the Pacific sector exhibits a persistent negative pressure anomaly (Fig. 5a–d), which appears more elongated than the positive pressure anomaly associated with El Niño periods. This pressure anomaly is statistically significant for the 2020–2022 La Niña period; however, there are also significant regions near the centre of the pressure anomaly during the 2010–2014 La Niña period.
Three out of the four La Niña periods (2010–2014, 2016–2018, and 2020–2022) are broadly associated with negative SMB (Fig. 5f–h) and ice mass anomalies (Fig. 5j–l) across the Amundsen Sea sector. The reduction in mass during the 2020–2022 and 2010–2014 La Niña periods aligns with a significant negative pressure anomaly in the Pacific sector, and offshore wind anomalies (Fig. 5b, d).
In contrast, during the 2007–2009 La Niña period, a mass gain is prominently observed in GRACE (Fig. 5i), a pattern more commonly associated with El Niño periods described earlier. However, the SMB and pressure anomaly patterns during this period are not statistically significant at the 0.05 level.
Similar to the Amundsen Sea sector, the Antarctic Peninsula exhibits contrasting mass change responses during La Niña-dominated periods. Broadly, negative mass anomalies are observed during the 2007–2009 and 2010–2014 La Niña periods (Fig. 5i–j), whereas positive mass anomalies are evident during the 2016–2018 and 2020–2022 La Niña periods (Fig. 5k–l). The magnitude of mass reduction is strongest during the 2010–2014 La Niña period, while the mass gain is most pronounced during the 2020–2022 La Niña period.
This contrasting mass change response between the two periods aligns with the position of the negative pressure anomaly in the Pacific sector. In the 2010–2014 La Niña period, the pressure anomaly is centred over the Bellingshausen Sea, accompanied by offshore wind anomalies over the Peninsula (Fig. 5b). In contrast, during the 2020–2022 La Niña period, the negative pressure anomaly is centred in the Amundsen Sea, with onshore wind anomalies directed into the Peninsula (Fig. 5d).
3.3.2 East Antarctic anomalies during La Niña-dominated periods
Along the Atlantic sector, a dipole-like mass anomaly pattern is present during the 2007–2009 and 2020–2022 La Niña periods (Fig. 5e, h), whereas a more uniform response is observed during the 2010–2014 and 2016–2018 La Niña periods (Fig. 5f–g). During the 2007–2009 La Niña period, positive SMB anomalies were observed over Coats Land and negative SMB anomalies toward Enderby Land (Fig. 5e), with this spatial pattern reversed during the 2020–2022 La Niña period (Fig. 5h).
Positive mass anomalies were also observed across the Atlantic region during the 2014–2016 La Niña period, with a reversed pattern during the 2016–2018 La Niña period (Fig. 5f–g). Regionally, Dronning Maud Land shows consistent positive SMB (Fig. 5f, h) and ice mass anomalies (Fig. 5j, l) during the 2010–2014 and 2020–2022 La Niña periods.
The negative pressure anomaly during the 2020–2022 La Niña period aligns with the observed mass gain in Dronning Maud Land. Conversely, during the 2016–2018 period, negative SMB anomalies were observed in Dronning Maud Land, with no clear pressure anomaly pattern (Fig. 5g).
In the Indian Ocean sector/Wilkes Land we found no consistent mass response to La Niña-dominated periods. During the 2020–2022 La Niña period, mass change in the Indian Ocean sector is spatially uniform, with positive mass anomalies observed across the entire region (Fig. 4h, l). This contrasts with other La Niña periods, which show more variable responses. The 2010–2014 and 2016–2018 La Niña periods are consistent with each other, showing negative mass anomalies over Wilkes Land. For both periods, a negative pressure anomaly is present adjacent to the Wilkes Land coast, with the 2016–2018 period showing a statistically significant anomaly and stronger negative mass signals. In contrast, the 2007–2009 and 2020–2022 La Niña periods are associated with positive mass anomalies in Wilkes Land (Fig. 5i, l), although the anomalies during 2007–2009 are weaker and less spatially extensive (Fig. 5i). During the 2007–2009 La Niña period, a positive pressure anomaly marginally significant at the centre of the anomaly extends offshore along the Wilkes Land coast, associated with onshore wind anomalies (Fig. 5a).
3.4 Mean Anomalies during ENSO-dominated periods
Figure 6 presents the mean AIS response across El Niño- and La Niña-dominated periods, summarizing the impacts of different ENSO periods. The figure is derived by averaging the maps presented in Figs. 4 and 5. While this mean response differs slightly from the regression results in Fig. 3b–c, certain regional patterns remain consistent. The SMB results show a positive response during El Niño-dominated periods in the Amundsen Sea sector and Marie Byrd Land, as well as in Enderby Land (Fig. 6c). In contrast, negative SMB anomalies are observed in the Antarctic Peninsula, Coats Land, and Dronning Maud Land (Fig. 6c). During La Niña-dominated periods, this pattern is broadly reversed (Fig. 6d). Wilkes Land shows positive SMB anomalies during both El Niño- and La Niña-dominated periods; however, the anomalies are more spatially extensive during La Niña (Fig. 6c–d). The patterns in GRACE are broadly similar to the SMB results, however, north south stripping noise in GRACE is maximised over short periods.
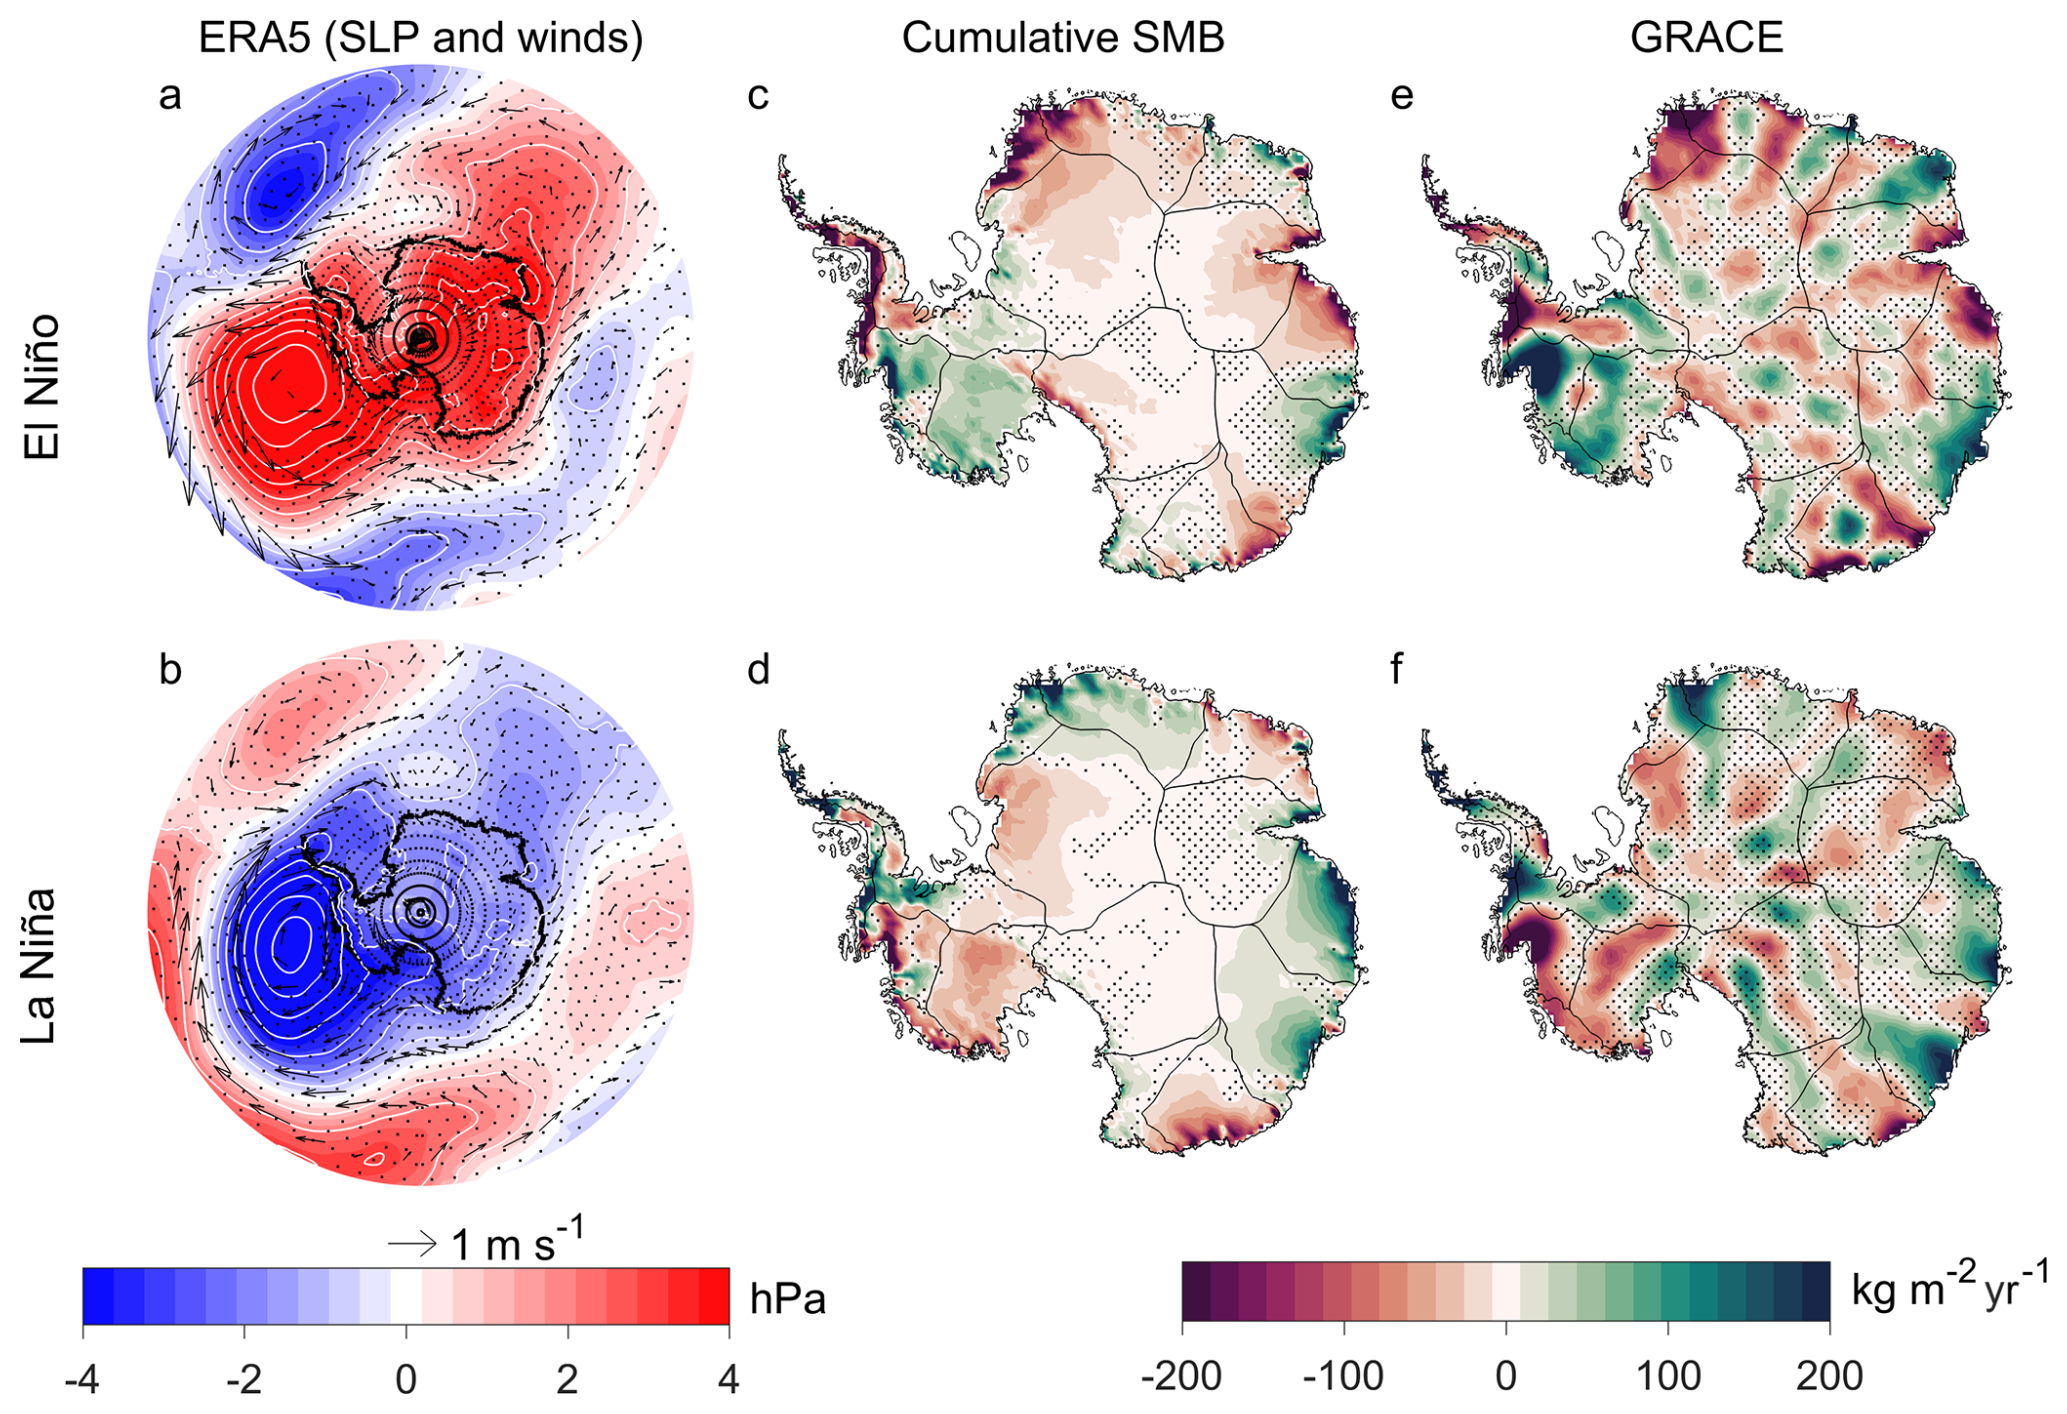
Figure 6The composites are generated based on the results of the four defined ENSO-dominated periods combined. ERA5 mean sea level pressure and 10 m wind anomalies (a–b), RACMO2.4p1 SMB (c–d), and GRACE-derived ice mass change (e–f). This represents the cumulative impact of different ENSO phases on AIS mass variability. Sea level pressure anomalies are shown as shaded regions with contours (hPa), and 10 m wind anomalies as vectors (m s−1). SMB and GRACE data (kg m−2 yr−1) are shown. Non-significant areas are stippled at p value >0.05.
4.1 Continental-wide perspective
We examined the AIS mass variability during different ENSO-dominated periods. Our results show that the AIS exhibits considerable variability across these periods, each associated with its own circulation anomalies (Figs. 4, 5), influenced by interactions between ENSO and SAM (Hosking et al., 2013; Fogt et al., 2011). Over longer timescales, the mean response reveals a dipole pattern: positive mass anomalies in West Antarctica and negative anomalies in East Antarctic during El Niño periods, and vice-versa during La Niña periods (Fig. 3b–c). This pattern is supported by data-driven analysis showing a strong correlation between GRACE and cumulative ENSO indices (King et al., 2023).
However, there is a difference between the SMB signal and GRACE in West Antarctica, but they are closely aligned in East Antarctica (Fig. 3b–c). This suggests that SMB variability drives ice mass changes in East Antarctica, but not necessarily in West Antarctica. The difference may be due to the near-instantaneous response of ice dynamics to ENSO-driven oceanic forcing and/or mismodelled SMB (IMBIE Team, 2018; Rignot et al., 2019), with the latter being more likely (King and Christoffersen, 2024).
Averaging multiple ENSO-dominated periods can obscure variability associated with individual periods and lead to misinterpretation. As shown in Figs. 4e–h and 5e–h, mass variability – particularly in the Antarctic Peninsula and East Antarctica – varies significantly across individual ENSO events (Figs. 4, 5). The mean response fails to capture these short-term variations, which are critical for understanding their influence on AIS mass balance.
4.2 West Antarctica
El Niño-and La Niña-dominated periods correspond to positive and negative pressure anomalies in the Pacific, respectively, indicative of positive PSA-1 and negative PSA-1 patterns (Hoskins and Karoly, 1981). These patterns are associated with a weakened or strengthened ASL, influencing circulation and climate in West Antarctica (Raphael et al., 2016b; Turner et al., 2017, 2012). Positive ice mass anomalies in the Amundsen Sea sector during the 2002–2005, 2014–2016 and 2018–2020 El Niño periods (Fig. 4i, k–l) and negative anomalies during the 2010–2014 and 2020–2022 La Niña periods (excluding the 2016–2018 period due to noisy GRACE data) (Fig. 5i, k–l), are broadly consistent with previous studies (Paolo et al., 2018; King et al., 2023). These mass anomalies are supported by the variability in the ASL during El Niño and La Niña periods influencing circulation into the Amundsen Sea sector.
During El Niño conditions, a weakened ASL and reduced coastal easterlies allow westerly wind anomalies to bring marine air masses, onshore, which, enhance snowfall and mass accumulation through orographic lifting (Paolo et al., 2018; Huguenin et al., 2024). In contrast, La Niña conditions strengthen the ASL and intensify coastal easterlies, limiting moisture transport and reducing precipitation (Huguenin et al., 2024; Hosking et al., 2013).
However, the 2009–2010 El Niño period deviates from this pattern, with negative SMB anomalies observed in the Amundsen Sea sector (Fig. 4f). The pressure anomaly during this period is distinct, with a positive pressure anomaly extending from the Amundsen Sea to beyond the Ross Sea. An important difference to the other El Niño periods, is the extension of this positive pressure anomaly further to the west, which decreases moisture transport into the region. This period encompasses a strong Central Pacific El Niño event (Kim et al., 2011), and associated pressure anomaly (Fig. 4b) resembles patterns linked to such events, which are associated with moisture depleted wind anomalies and suppressed precipitation in the Amundsen and Bellingshausen regions (Chen et al., 2023; Macha et al., 2024).
Our 2009–2010 El Niño mass pattern aligns with Macha et al. (2024), who reported reduced accumulation during Central Pacific El Niño events in the SON and JJA seasons. These similarities suggest that the observed mass change may reflect the impact of Central Pacific El Niño phases during the SON and JJA seasons in the Amundsen Sea sector.
It is important to state that our defined ENSO periods do not distinguish between El Niño types or seasonal phases but instead capture the net mass change over the entire period, providing broader context for ice sheet mass balance.
Similarly, the 2007–2009 La Niña period shows a mass pattern that contrasts with other La Niña periods, featuring a positive mass anomaly in the Amundsen Sea sector (Fig. 5i). However, atmospheric circulation patterns during this period do not statistically support the observed mass gain, suggesting that it may be linked to unrelated weather events or other modes of climate variability.
Our results support that mass variability in the Antarctic Peninsula is variable and influenced by various factors such as large-scale climate modes including SAM and ENSO (Clem et al., 2016; Clem and Fogt, 2013) and the Peninsula's unique mountainous geography. A previous study demonstrated a reduction in mass during El Niño and an increase during La Niña across the Peninsula (Sasgen et al., 2010). This is consistent with our results for the 2018–2020 El Niño- and 2020–2022 La Niña-dominated periods (Figs. 4l, 5l). Meanwhile, other studies suggest the opposite pattern, reporting an increase in mass during El Niño and a reduction during La Niña in the Peninsula (Zhang et al., 2021), which aligns with our observed ice mass change during the 2002–2005 and 2014–2016 El Niño periods (Fig. 4i, k) and 2010–2014 La Niña period (Fig. 5j). However, the variable impact appears to be influenced by the position and orientation of the ASL and its effect on moisture transport into the Peninsula (Raphael et al., 2016a). Further, moisture transport into the Peninsula is influenced by SAM-driven westerly winds and ENSO-related meridional flow (Orr et al., 2008; Clem et al., 2016), which contributes to the complex mass change patterns.
4.3 East Antarctica
El Niño and La Niña events have been linked to negative and positive cumulative mass anomalies, respectively in the East Antarctic Ice Sheet (King et al., 2023; Li et al., 2022), consistent with our earlier findings (Fig. 3b–c). Our 2014–2016, 2018–2020 El Niño periods (Fig. 4k–l) and 2010–2014, 2020–2022 La Niña periods (Fig. 4j, l) broadly align with this pattern. However, this pattern is consistent for every ENSO period (e.g., Figs. 4j, 5i), and in some periods regionally variable responses observed across the Atlantic and Indian Ocean sectors.
SMB anomalies in East Antarctica are primarily influenced by the strength and position of cyclonic and anticyclonic anomalies over the continent and the Southern Ocean (Figs. 4a–d and 5a–d). These pressure anomalies regulate atmospheric circulation, with meridional flow changes affecting heat and moisture distribution across the region (Scarchilli et al., 2011; Wang et al., 2024; Udy et al., 2021). The SAM phase largely governs these pressure patterns by modulating their positioning which further highlights the dominant role of SAM as a climate driver of mass change in East Antarctica (Fogt et al., 2012; Fogt and Marshall, 2020a; Marshall et al., 2013). For instance, 2014–2016 El Niño showed a mass change pattern that is consistent with a positive SAM phase, with a reduction in precipitation (Marshall et al., 2017) and observed negative mass anomaly (Fig. 4g).
The anomalous mass gain during the 2009–2010 El Niño period observed in Dronning Maud Land has been attributed to atmospheric blocking, which produced large episodic snowfall events (Boening et al., 2012). Similarly, a positive pressure anomaly in the Atlantic during the 2010–2014 La Niña period (although not significant at p<0.05 over the 4-year period) appears to support the mass gain in Dronning Maud Land (Fig. 5j). Atmospheric blocking favours the occurrence of atmospheric rivers reaching the Antarctic coastline, often associated with increased precipitation and temperature (Wille et al., 2021; Pohl et al., 2021). The weakening of the westerlies during negative SAM conditions (Clem et al., 2016), allows for Rossby wave amplification and an increased frequency of atmospheric blocking events in East Antarctica, particularly during winter, when the relationship is strongest (Wang et al., 2024). It is important to note that climate modes of variability can create conditions favourable for atmospheric river events in East Antarctica (Shields et al., 2022), especially in Wilkes Land (Wang, 2023). However, in Dronning Maud Land, atmospheric rivers explain about 77 % of interannual variability (Baiman et al., 2023).
Our 2002–2005 and 2009–2010 El Niño periods, along with the 2007–2009 La Niña period, show a blocking pattern around Wilkes Land, consistent with transient meridional blocking associated with increased precipitation along the coastline (Udy et al., 2022, 2021). However, given the duration of our defined periods, this transient blocking is likely smoothed out over longer timeframes, which may explain the stronger signal observed during the shorter 2009–2010 El Niño period. The asymmetric shape of the positive pressure anomaly extension off the Wilkes Land is much stronger in the 2009–2010 period, and is consistent with the development of atmospheric blocking in the Tasman Sea region (Pook et al., 2006), which is associated with increased precipitation in Wilkes Land (Pohl et al., 2021; Udy et al., 2022).
Our 2020–2022 La Niña period shows significant mass gain across the Indian Ocean and Wilkes Land region and was the only period in our analysis combining La Niña with positive SAM (Fig. 1c). However, this period also included the March 2022 atmospheric river event, which delivered record-breaking precipitation and heat to East Antarctica (Wille et al., 2024). While this event was not the only atmospheric river to occur during the GRACE period, this 4 d event likely influenced the mass anomaly patterns of the 2020–2022 La Niña period. To determine the extent of the influence of this event, we examined the 2020–2022 period by comparing the inclusion and exclusion of the March 2022 event (Fig. S5). While the March 2022 event increased the strength of the SMB positive anomaly in Wilkes Land, the region still observed a strong positive SMB anomaly during the 2020–2022 period when March 2022 was excluded (Fig. S5). According to Wang et al. (2023), extreme events in October 2021 and March 2022 accounted for approximately 38 % of the precipitation anomalies in Wilkes Land during the 2020–2022 La Niña period, driven by a pair of symmetrically distributed high–low pressure systems over the Southern Ocean near 120° W and 60° E.
Our findings indicate that ice mass changes during ENSO-dominated periods cannot be solely attributed to ENSO forcing. To quantify changes in ENSO variability, long-term time series must be considered in future studies (Stevenson et al., 2010), along with the use of climate models to better isolate and capture purely ENSO-driven signals.
4.4 Combined ENSO and SAM influence
Isolating the ENSO signal and its impact on AIS ice mass is challenging due to several factors. The Rossby wave propagation of the ENSO signal to Antarctica is influenced by SAM (Marshall, 2003; Fogt and Marshall, 2020b), and the ENSO signal can be masked by other climate modes, such as zonal-wave 3 – a quasi-stationary pattern in the southern high latitudes that affects meridional heat and momentum transport (Goyal et al., 2022; Raphael, 2004). Additionally, synoptic-scale weather systems can further mask ENSO's influence. The complex interaction between ENSO and other modes of climate variability likely drives the equally complex patterns of AIS ice mass change observed during different ENSO-dominated periods.
Pressure anomaly variability in the Pacific sector during ENSO-dominated periods can be associated with the cumulative SAM phase. During ENSO periods when the cumulative SAM and ENSO occur in phase (El Niño/−SAM or La Niña/+SAM) (Fogt et al., 2011), the pressure anomaly over the Pacific sector is close to the continent, spatially extensive, and centred around the Amundsen Sea sector (Figs. 4a and 5d). However, during ENSO-dominated periods that are out of phase with the cumulative SAM (El Niño/+SAM or La Niña/−SAM) (Fogt et al., 2011), the pressure anomaly appears northward, away from the continent (Figs. 4c and 5a). Periods where the cumulative SAM index shows a neutral phase, the pressure anomaly in the Pacific is centred around the Bellingshausen Sea sector (Figs. 4d, 5b–c). However, between 2000 and 2020, shifts in large-scale circulation, particularly in SAM, have been reported, potentially affecting ENSO teleconnections and their influence on AIS variability (Xin et al., 2023).
Our analysis, which uses cumulative summed indices to match GRACE mass time series, has limitations. It focuses primarily on low-frequency variability and does not account for shorter temporal scale impacts, such as tropical convection pulses that trigger the Rossby waves or high-frequency variability associated with storm systems such as atmospheric rivers. However, the net effect of these would be captured by GRACE.
Studies on precipitation (Marshall et al., 2017) and ice core records (Medley and Thomas, 2019) both recognise that SMB generally decreases during positive SAM phase and increases during negative SAM phase. Regarding the impact of SAM on basal melting, negative SAM periods generally decrease the transport of warm circumpolar deep water onto the continental shelf (Palóczy et al., 2018), largely reducing ice shelf basal melt (Verfaillie et al., 2022) and subsequently contributing to ice mass gain. However, the timescale of the upstream ice response to positive SAM forcing is unclear and would involve a substantial lag, which can range from months to several years depending on regional ice dynamics (King and Christoffersen, 2024). This suggests that GRACE-derived signals may represent a delayed response rather than an immediate reaction to SAM variability. The spatial pattern of ice mass change anomaly during the 2002–2005 El Niño and 2007–2009 La Niña-dominated periods in the Amundsen Sea sector and Wilkes Land resembles the negative SAM spatial pattern reported by King et al. (2023). Negative SAM dominates the cumulative summed SAM (Fig. 1e) from the start of the GRACE time series in 2002 until around 2010, which aligns with the positive pressure anomaly observed over Antarctica, reflecting a stronger than average (over the GRACE period) Antarctic High during this period (Figs. 4a–b and 5a). Therefore, it is possible that ice mass variability observed between 2002 and 2010 was more influenced by SAM than by ENSO.
Our findings agree with the premise that ENSO forcing on the Antarctic climate impacts atmospheric circulation patterns, altering the ASL variability, which in turn influences Antarctic ice mass variability (Zhang et al., 2021; Paolo et al., 2018; Sasgen et al., 2010; Clem et al., 2017). However, across individual ENSO periods, the AIS response exhibits considerable variability, with each period associated with distinct atmospheric circulation patterns. It is possible that the teleconnection between tropical ENSO signals and Antarctic climate may not be fully established during a given ENSO phase or masked by other processes. Our analysis, which uses cumulative summed indices to match GRACE mass time series, is primarily sensitive to low-frequency variability and does not resolve shorter-term impacts, such as tropical convection pulses that initiate Rossby wave trains or high-frequency variability linked to storm systems like atmospheric rivers. Nonetheless, the integrated effect of these processes is captured by GRACE. Additionally, internal dynamics of the ASL may contribute to AIS mass variability that is independent of the influence of ENSO and SAM which potentially can impact our analysis. Given that our analysis spans a 22-year period, it is insufficient to capture the full range of ENSO variability, which requires a longer time period to be fully represented (Stevenson et al., 2010). Future studies should therefore consider a longer record, together with climate models, to better isolate and capture purely ENSO-driven signals. While ENSO induced circulation affects Antarctic SMB (Kim et al., 2020), recent Antarctic ice mass trends (2003–2020) have been primarily driven by mass imbalance triggered by long-term ice dynamics changes (Kim et al., 2024; Rignot et al., 2019). Some of the low-frequency mass variability around the long-term trend (which we removed) is associated with changing ice dynamics. This dynamic signal is stronger in West than in East Antarctica (Rignot et al., 2019).
In a warming climate, future ENSO event variability is predicted to increase (Cai et al., 2021). CMIP5 model simulations suggest a reduction in El Niño-induced precipitation over West Antarctica (Lee et al., 2023). Given that SAM is projected to remain in its positive phase across all seasons due to greenhouse gas emissions (Arblaster and Meehl, 2006), accurate modelling of future AIS mass estimates in relation to ENSO teleconnections must account for the interaction between SAM and ENSO. The AIS mass gain observed during 2020–2022 raises questions about how the AIS will respond to future La Niña and positive SAM periods and if it would increase the frequency of extreme events.
To examine the AIS mass change during different ENSO-dominated periods, we analysed AIS mass change anomalies observed by GRACE/GRACE-FO spanning the period 2002–2022. These anomalies were interpreted alongside RACMO2.4p1 modelled SMB and mean sea level pressure and 10 m winds from ERA5 reanalysis products. Our analysis reveals that El Niño and La Niña periods exert distinct influences on the AIS, with considerable spatial variability.
At the continental scale, three out of the four El Niño-dominated periods were characterised by mass increase in West Antarctica and mass decrease in East Antarctica. Conversely, two out of the three La Niña-dominated periods (here excluding the 2016–2018 period with degraded GRACE signal) showed the opposite pattern, with mass reduction in West Antarctica and to varying degrees, mass increase in East Antarctica. The Amundsen Sea sector typically experiences positive mass anomalies during El Niño-dominated periods and negative anomalies during La Niña-dominated periods.
Mass variability in West Antarctica is primarily driven by ENSO-induced ASL pressure anomalies, which modulate the atmospheric circulation and moisture transport. The ASL exhibits high variability in its location, strength, and extent, which influences its impact on the Antarctic Peninsula and West Antarctica. The ASL strengthens and moves closer to the Antarctic coastline during periods when ENSO-SAM are in phase (Hosking et al., 2013), and ENSO has its strongest impact in West Antarctica. In East Antarctica, atmospheric pressure patterns over the Southern Ocean play a crucial role in regulating moisture influx affecting ice mass variability.
In summary, this study highlights the complex nature of ENSO teleconnections in modulating AIS mass balance through changes in atmospheric circulation. Rather than exhibiting a simple dipole response, AIS mass variability during ENSO periods is shaped by unique teleconnections and moisture fluxes specific to each period. We acknowledge uncertainties in our analysis due to the relatively short ENSO-dominated periods considered. Some ENSO-related teleconnections may not have fully developed during these intervals, and other processes – such as atmospheric rivers – may have masked or modulated the ENSO signal, complicating the attribution of the observed spatial impacts. Although climate model projections remain uncertain regarding whether future ENSO events will resemble more an El Niño- or La Niña-like state, they consistently indicate that ENSO will influence Antarctic precipitation patterns. A clearer understanding of ENSO's role in Antarctic climate is therefore critical for assessing its impact on future SMB and long-term ice mass balance. This requires both process-level understanding and consideration of the net ENSO effect on AIS mass change as explored here.
Source code and data used in this analysis can be accessed online at https://doi.org/10.25959/K9BK-VA85 (Ayabilah et al., 2026). The GRACE data used is available at https://gravis.gfz.de/ais (last access: 1 March 2025). The ERA5 reanalysis data used in the atmospheric linkage to ice mass variation are publicly available from the Copernicus Climate Data Store (https://cds.climate.copernicus.eu/, last access: 1 March 2025) and are described in Hersbach et al. (2020). The station-derived SAM index from Marshall (2003) are available at http://www.nerc-bas.ac.uk/icd/gjma/sam.html (last access: 1 March 2025). The NOAA Niño3.4 index is publicly available online at https://psl.noaa.gov/data/timeseries/month/Nino34/ (last access: 1 March 2025). RACMO2.4p1 model SMB output can be accessed at https://doi.org/10.5281/zenodo.14217232 (van Dalum et al., 2024a).
The supplement related to this article is available online at https://doi.org/10.5194/tc-20-1237-2026-supplement.
All authors contributed to the conception and design of the study. JBA performed the statistical analysis and data processing. JBA wrote the manuscript with input from all co-authors. All authors helped with the revision and approved the final version of the manuscript.
The contact author has declared that none of the authors has any competing interests.
Publisher's note: Copernicus Publications remains neutral with regard to jurisdictional claims made in the text, published maps, institutional affiliations, or any other geographical representation in this paper. The authors bear the ultimate responsibility for providing appropriate place names. Views expressed in the text are those of the authors and do not necessarily reflect the views of the publisher.
We thank the providers of the data used in this study. We also thank the Editor and reviewers for their constructive and insightful comments.
JBA, MK and DU were supported by the Australian Research Council Special Research Initiative, Australian Centre for Excellence in Antarctic Science (Project Number SR200100008). TV was supported by the Australian Government's Antarctic Science Collaboration Initiative (grant no. ASCI000002) through funding to the Australian Antarctic Program Partnership. JBA was supported by a University of Tasmania Graduate Research Scholarship.
This paper was edited by Brice Noël and reviewed by two anonymous referees.
Arblaster, J. M. and Meehl, G. A.: Contributions of external forcings to southern annular mode trends, J. Climate, 19, 2896–2905, https://doi.org/10.1175/Jcli3774.1, 2006.
Ayabilah, J. B., King, M., Udy, D., and Vance, T.: Data for: The changing mass of the Antarctic Ice Sheet during ENSO-dominated periods in the GRACE era (2002–2022), Institute for Marine and Antarctic Studies [data set], https://doi.org/10.25959/K9BK-VA85, 2026.
Baiman, R., Winters, A. C., Lenaerts, J., and Shields, C. A.: Synoptic Drivers of Atmospheric River Induced Precipitation Near Dronning Maud Land, Antarctica, J. Geophys. Res.-Atmos., 128, e2022JD037859, https://doi.org/10.1029/2022jd037859, 2023.
Bodart, J. A. and Bingham, R. J.: The Impact of the Extreme 2015-2016 El Nino on the Mass Balance of the Antarctic Ice Sheet, Geophys. Res. Lett., 46, 13862–13871, https://doi.org/10.1029/2019gl084466, 2019.
Boening, C., Lebsock, M., Landerer, F., and Stephens, G.: Snowfall-driven mass change on the East Antarctic ice sheet, Geophys. Res. Lett., 39, L21501, https://doi.org/10.1029/2012gl053316, 2012.
Cai, W. J., Santoso, A., Collins, M., Dewitte, B., Karamperidou, C., Kug, J. S., Lengaigne, M., McPhaden, M. J., Stuecker, M. F., Taschetto, A. S., Timmermann, A., Wu, L. X., Yeh, S. W., Wang, G. J., Ng, B., Jia, F., Yang, Y., Ying, J., Zheng, X. T., Bayr, T., Brown, J. R., Capotondi, A., Cobb, K. M., Gan, B. L., Geng, T., Ham, Y. G., Jin, F. F., Jo, H. S., Li, X. C., Lin, X. P., McGregor, S., Park, J. H., Stein, K., Yang, K., Zhang, L., and Zhong, W. X.: Changing El Nino-Southern Oscillation in a warming climate, Nat. Rev. Earth Environ., 2, 628–644, https://doi.org/10.1038/s43017-021-00199-z, 2021.
Chen, X. Y., Li, S. L., and Zhang, C.: Distinct impacts of two kinds of El Nino on precipitation over the Antarctic Peninsula and West Antarctica in austral spring, Atmospheric and Oceanic Science Letters, 16, 100387, https://doi.org/10.1016/j.aosl.2023.100387, 2023.
Clem, K. R. and Fogt, R. L.: Varying roles of ENSO and SAM on the Antarctic Peninsula climate in austral spring, J. Geophys. Res.-Atmos., 118, 11481–11492, https://doi.org/10.1002/jgrd.50860, 2013.
Clem, K. R., Renwick, J. A., McGregor, J., and Fogt, R. L.: The relative influence of ENSO and SAM on Antarctic Peninsula climate, J. Geophys. Res.-Atmos., 121, 9324–9341, https://doi.org/10.1002/2016jd025305, 2016.
Clem, K. R., Renwick, J. A., and McGregor, J.: Large-Scale Forcing of the Amundsen Sea Low and Its Influence on Sea Ice and West Antarctic Temperature, J. Climate, 30, 8405–8424, https://doi.org/10.1175/Jcli-D-16-0891.1, 2017.
Dahle, C., Murböck, M., Flechtner, F., Dobslaw, H., Michalak, G., Neumayer, K. H., Abrykosov, O., Reinhold, A., König, R., Sulzbach, R., and Förste, C.: The GFZ GRACE RL06 Monthly Gravity Field Time Series: Processing Details and Quality Assessment, Remote Sens., 11, 2116, https://doi.org/10.3390/rs11182116, 2019.
Dahle, C., Boergens, E., Sasgen, I., Döhne, T., Reißland, S., Dobslaw, H., Klemann, V., Murböck, M., König, R., Dill, R., Sips, M., Sylla, U., Groh, A., Horwath, M., and Flechtner, F.: GravIS: mass anomaly products from satellite gravimetry, Earth Syst. Sci. Data, 17, 611–631, https://doi.org/10.5194/essd-17-611-2025, 2025.
Diener, T., Sasgen, I., Agosta, C., Fuerst, J. J., Braun, M. H., Konrad, H., and Fettweis, X.: Acceleration of Dynamic Ice Loss in Antarctica From Satellite Gravimetry, Front. Earth Sci., 9, 741789, https://doi.org/10.3389/feart.2021.741789, 2021.
Fogt, R. L. and Marshall, G. J.: The Southern Annular Mode: Variability, trends, and climate impacts across the Southern Hemisphere, WIREs Climate Change, 11, https://doi.org/10.1002/wcc.652, 2020a.
Fogt, R. L. and Marshall, G. J.: The Southern Annular Mode: Variability, trends, and climate impacts across the Southern Hemisphere, Wiley Interdisciplinary Reviews-Climate Change, 11, e652, https://doi.org/10.1002/wcc.652, 2020b.
Fogt, R. L., Bromwich, D. H., and Hines, K. M.: Understanding the SAM influence on the South Pacific ENSO teleconnection, Clim. Dynam., 36, 1555–1576, 2011.
Fogt, R. L., Jones, J. M., and Renwick, J.: Seasonal Zonal Asymmetries in the Southern Annular Mode and Their Impact on Regional Temperature Anomalies, J. Climate, 25, 6253–6270, https://doi.org/10.1175/jcli-d-11-00474.1, 2012.
Gardner, A. S., Moholdt, G., Scambos, T., Fahnstock, M., Ligtenberg, S., van den Broeke, M., and Nilsson, J.: Increased West Antarctic and unchanged East Antarctic ice discharge over the last 7 years, The Cryosphere, 12, 521–547, https://doi.org/10.5194/tc-12-521-2018, 2018.
Goyal, R., Jucker, M., Gupta, A. S., and England, M. H.: A New Zonal Wave-3 Index for the Southern Hemisphere, J. Climate, 35, 5137–5149, https://doi.org/10.1175/Jcli-D-21-0927.1, 2022.
Groh, A. and Horwath, M.: The method of tailored sensitivity kernels for GRACE mass change estimates, EGU General Assembly 2016, Vienna, Austria, 2016.
Hersbach, H., Bell, B., Berrisford, P., Hirahara, S., Horányi, A., Muñoz-Sabater, J., Nicolas, J., Peubey, C., Radu, R., Schepers, D., Simmons, A., Soci, C., Abdalla, S., Abellan, X., Balsamo, G., Bechtold, P., Biavati, G., Bidlot, J., Bonavita, M., De Chiara, G., Dahlgren, P., Dee, D., Diamantakis, M., Dragani, R., Flemming, J., Forbes, R., Fuentes, M., Geer, A., Haimberger, L., Healy, S., Hogan, R. J., Hólm, E., Janisková, M., Keeley, S., Laloyaux, P., Lopez, P., Lupu, C., Radnoti, G., de Rosnay, P., Rozum, I., Vamborg, F., Villaume, S., and Thépaut, J. N.: The ERA5 global reanalysis, Q. J. Roy. Meteor. Soc., 146, 1999–2049, https://doi.org/10.1002/qj.3803, 2020.
Hosking, J. S., Orr, A., Marshall, G. J., Turner, J., and Phillips, T.: The Influence of the Amundsen-Bellingshausen Seas Low on the Climate of West Antarctica and Its Representation in Coupled Climate Model Simulations, J. Climate, 26, 6633–6648, https://doi.org/10.1175/Jcli-D-12-00813.1, 2013.
Hoskins, B. J. and Karoly, D. J.: The Steady Linear Response of a Spherical Atmosphere to Thermal and Orographic Forcing, J. Atmos. Sci., 38, 1179–1196, https://doi.org/10.1175/1520-0469(1981)038<1179:Tslroa>2.0.Co;2, 1981.
Huguenin, M. F., Holmes, R. M., Spence, P., and England, M. H.: Subsurface Warming of the West Antarctic Continental Shelf Linked to El Niño-Southern Oscillation, Geophys. Res. Lett., 51, e2023GL104518, https://doi.org/10.1029/2023GL104518, 2024.
IMBIE Team: Mass balance of the Antarctic Ice Sheet from 1992 to 2017, Nature, 558, 219–222, https://doi.org/10.1038/s41586-018-0179-y, 2018.
Kim, B. H., Seo, K. W., Eom, J., Chen, J., and Wilson, C. R.: Antarctic ice mass variations from 1979 to 2017 driven by anomalous precipitation accumulation, Sci. Rep., 10, 20366, https://doi.org/10.1038/s41598-020-77403-5, 2020.
Kim, B. H., Seo, K. W., Lee, C. K., Kim, J. S., Lee, W. S., Jin, E. K., and van den Broeke, M.: Partitioning the drivers of Antarctic glacier mass balance (2003–2020) using satellite observations and a regional climate model, P. Natl. Acad. Sci. USA, 121, e2322622121, https://doi.org/10.1073/pnas.2322622121, 2024.
Kim, J., Kim, W., Yeh, S., Kug, J. S., and Kwon, M.: The unique 2009–2010 El Niño event: A fast phase transition of warm pool El Niño to La Niña, AGU Fall Meeting Abstracts, San Francisco, California, United States, 2011.
King, M. A. and Christoffersen, P.: Major Modes of Climate Variability Dominate Nonlinear Antarctic Ice-Sheet Elevation Changes 2002–2020, Geophys. Res. Lett., 51, e2024GL108844, https://doi.org/10.1029/2024GL108844, 2024.
King, M. A., Lyu, K., and Zhang, X. B.: Climate variability a key driver of recent Antarctic ice-mass change, Nat. Geosci., 16, 1128–1135, https://doi.org/10.1038/s41561-023-01317-w, 2023.
Landerer, F. W., Flechtner, F. M., Save, H., Webb, F. H., Bandikova, T., Bertiger, W. I., Bettadpur, S. V., Byun, S. H., Dahle, C., Dobslaw, H., Fahnestock, E., Harvey, N., Kang, Z. G., Kruizinga, G. L. H., Loomis, B. D., McCullough, C., Murböck, M., Nagel, P., Paik, M., Pie, N., Poole, S., Strekalov, D., Tamisiea, M. E., Wang, F. R., Watkins, M. M., Wen, H. Y., Wiese, D. N., and Yuan, D. N.: Extending the Global Mass Change Data Record: GRACE Follow-On Instrument and Science Data Performance, Geophys. Res. Lett., 47, e2020GL088306, https://doi.org/10.1029/2020GL088306, 2020.
Lee, H.-J., Jin, E. K., Kim, B.-H., and Lee, W. S.: Vanishing of the El Niño-induced delay effect on the ice mass loss of West Antarctica in future climate change, Research Square [preprint], https://doi.org/10.21203/rs.3.rs-2437498/v1, 2023.
Li, Z., Chao, B. F., Wang, H., and Zhang, Z.: Antarctica ice-mass variations on interannual timescale: Coastal Dipole and propagating transports, Earth Planet. Sc. Lett., 595, 117789, 117789, https://doi.org/10.1016/j.epsl.2022.117789, 2022.
Macha, J. M. A., Mackintosh, A. N., Mccormack, F. S., Henley, B. J., McGregor, H. V., van Dalum, C. T., and Purich, A.: Distinct Central and Eastern Pacific El Niño Influence on Antarctic Surface Mass Balance, Geophys. Res. Lett., 51, e2024GL109423, https://doi.org/10.1029/2024GL109423, 2024.
Marshall, G. J.: Trends in the southern annular mode from observations and reanalyses, J. Climate, 16, 4134–4143, https://doi.org/10.1175/1520-0442(2003)016<4134:Titsam>2.0.Co;2, 2003.
Marshall, G. J., Orr, A., and Turner, J.: A Predominant Reversal in the Relationship between the SAM and East Antarctic Temperatures during the Twenty-First Century, J. Climate, 26, 5196–5204, https://doi.org/10.1175/Jcli-D-12-00671.1, 2013.
Marshall, G. J., Thompson, D. W. J., and van den Broeke, M. R.: The Signature of Southern Hemisphere Atmospheric Circulation Patterns in Antarctic Precipitation, Geophys. Res. Lett., 44, 11580–11589, https://doi.org/10.1002/2017GL075998, 2017.
McPhaden, M. J., Zebiak, S. E., and Glantz, M. H.: ENSO as an integrating concept in earth science, Science, 314, 1740–1745, https://doi.org/10.1126/science.1132588, 2006.
Medley, B. and Thomas, E. R.: Increased snowfall over the Antarctic Ice Sheet mitigated twentieth-century sea-level rise, Nat. Clim. Change, 9, 34, https://doi.org/10.1038/s41558-018-0356-x, 2019.
Orr, A., Marshall, G. J., Hunt, J. C. R., Sommeria, J., Wang, C.-G., Van Lipzig, N. P. M., Cresswell, D., and King, J. C.: Characteristics of Summer Airflow over the Antarctic Peninsula in Response to Recent Strengthening of Westerly Circumpolar Winds, J. Atmos. Sci., 65, 1396–1413, https://doi.org/10.1175/2007jas2498.1, 2008.
Palóczy, A., Gille, S. T., and McClean, J. L.: Oceanic Heat Delivery to the Antarctic Continental Shelf: Large-Scale, Low-Frequency Variability, J. Geophys. Res.-Oceans, 123, 7678–7701, https://doi.org/10.1029/2018jc014345, 2018.
Paolo, F. S., Padman, L., Fricker, H. A., Adusumilli, S., Howard, S., and Siegfried, M. R.: Response of Pacific-sector Antarctic ice shelves to the El Nino/Southern Oscillation, Nat. Geosci., 11, 121–126, https://doi.org/10.1038/s41561-017-0033-0, 2018.
Peltier, W. R., Argus, D. F., and Drummond, R.: Comment on “An Assessment of the ICE‐6G_C (VM5a) Glacial Isostatic Adjustment Model” by Purcell et al, J. Geophys. Res.-Sol. Ea., 123, 2019–2028, https://doi.org/10.1002/2016jb013844, 2018.
Pohl, B., Favier, V., Wille, J., Udy, D. G., Vance, T. R., Pergaud, J., Dutrievoz, N., Blanchet, J., Kittel, C., Amory, C., Krinner, G., and Codron, F.: Relationship Between Weather Regimes and Atmospheric Rivers in East Antarctica, J. Geophys. Res.-Atmos., 126, https://doi.org/10.1029/2021jd035294, 2021.
Pook, M. J., McIntosh, P. C., and Meyers, G. A.: The Synoptic Decomposition of Cool-Season Rainfall in the Southeastern Australian Cropping Region, J. Appl. Meteorol. Climatol., 45, 1156–1170, https://doi.org/10.1175/jam2394.1, 2006.
Raphael, M. N.: A zonal wave 3 index for the Southern Hemisphere, Geophys. Res. Lett., 31, L23212, https://doi.org/10.1029/2004gl020365, 2004.
Raphael, M. N., Marshall, G. J., Turner, J., Fogt, R. L., Schneider, D., Dixon, D. A., Hosking, J. S., Jones, J. M., and Hobbs, W. R.: The Amundsen Sea Low: Variability, Change, and Impact on Antarctic Climate, B. Am. Meteorol. Soc., 97, 111–121, https://doi.org/10.1175/bams-d-14-00018.1, 2016a.
Raphael, M. N., Marshall, G. J., Turner, J., Fogt, R. L., Schneider, D., Dixon, D. A., Hosking, J. S., Jones, J. M., and Hobbs, W. R.: THE AMUNDSEN SEA LOW Variability, Change, and Impact on Antarctic Climate, B. Am. Meteorol. Soc., 97, 111–121, https://doi.org/10.1175/Bams-D-14-00018.1, 2016b.
Rayner, N. A., Parker, D. E., Horton, E. B., Folland, C. K., Alexander, L. V., Rowell, D. P., Kent, E. C., and Kaplan, A.: Global analyses of sea surface temperature, sea ice, and night marine air temperature since the late nineteenth century, J. Geophys. Res.-Atmos., 108, 4407, https://doi.org/10.1029/2002jd002670, 2003.
Rignot, E., Mouginot, J., Scheuchl, B., van den Broeke, M., van Wessem, M. J., and Morlighem, M.: Four decades of Antarctic Ice Sheet mass balance from 1979–2017, P. Natl. Acad. Sci. USA, 116, 1095–1103, https://doi.org/10.1073/pnas.1812883116, 2019.
Sasgen, I., Dobslaw, H., Martinec, Z., and Thomas, M.: Satellite gravimetry observation of Antarctic snow accumulation related to ENSO, Earth Planet. Sc. Lett., 299, 352–358, https://doi.org/10.1016/j.epsl.2010.09.015, 2010.
Sasgen, I., Groh, A., and Horwath, M.: COST-G GravIS RL01 Ice-Mass Change Products, GFZ Data Services [data set], https://doi.org/10.5880/COST-G.GRAVIS_01_L3_ICE, 2020.
Scarchilli, C., Frezzotti, M., and Ruti, P. M.: Snow precipitation at four ice core sites in East Antarctica: provenance, seasonality and blocking factors, Clim. Dynam., 37, 2107–2125, https://doi.org/10.1007/s00382-010-0946-4, 2011.
Schneider, D. P., Okumura, Y., and Deser, C.: Observed Antarctic Interannual Climate Variability and Tropical Linkages, J. Climate, 25, 4048–4066, https://doi.org/10.1175/Jcli-D-11-00273.1, 2012.
Shepherd, A., Ivins, E. R., A, G., Barletta, V. R., Bentley, M. J., Bettadpur, S., Briggs, K. H., Bromwich, D. H., Forsberg, R., Galin, N., Horwath, M., Jacobs, S., Joughin, I., King, M. A., Lenaerts, J. T., Li, J., Ligtenberg, S. R., Luckman, A., Luthcke, S. B., McMillan, M., Meister, R., Milne, G., Mouginot, J., Muir, A., Nicolas, J. P., Paden, J., Payne, A. J., Pritchard, H., Rignot, E., Rott, H., Sorensen, L. S., Scambos, T. A., Scheuchl, B., Schrama, E. J., Smith, B., Sundal, A. V., van Angelen, J. H., van de Berg, W. J., van den Broeke, M. R., Vaughan, D. G., Velicogna, I., Wahr, J., Whitehouse, P. L., Wingham, D. J., Yi, D., Young, D., and Zwally, H. J.: A reconciled estimate of ice-sheet mass balance, Science, 338, 1183–1189, https://doi.org/10.1126/science.1228102, 2012.
Shields, C. A., Wille, J. D., Marquardt Collow, A. B., Maclennan, M., and Gorodetskaya, I. V.: Evaluating Uncertainty and Modes of Variability for Antarctic Atmospheric Rivers, Geophys. Res. Lett., 49, https://doi.org/10.1029/2022gl099577, 2022.
Stevenson, S., Fox-Kemper, B., Jochum, M., Rajagopalan, B., and Yeager, S. G.: ENSO Model Validation Using Wavelet Probability Analysis, J. Climate, 23, 5540–5547, https://doi.org/10.1175/2010jcli3609.1, 2010.
Swenson, S., Chambers, D., and Wahr, J.: Estimating geocenter variations from a combination of GRACE and ocean model output, J. Geophys. Res.-Sol. Ea., 113, B08410, https://doi.org/10.1029/2007jb005338, 2008.
Tapley, B. D., Bettadpur, S., Ries, J. C., Thompson, P. F., and Watkins, M. M.: GRACE measurements of mass variability in the Earth system, Science, 305, 503–505, https://doi.org/10.1126/science.1099192, 2004.
Turner, J.: The El Nino-southern oscillation and Antarctica, Int. J. Climatol., 24, 1–31, https://doi.org/10.1002/joc.965, 2004.
Turner, J., Phillips, T., Hosking, J. S., Marshall, G. J., and Orr, A.: The Amundsen Sea low, Int. J. Climatol., 33, 1818–1829, https://doi.org/10.1002/joc.3558, 2012.
Turner, J., Orr, A., Gudmundsson, G. H., Jenkins, A., Bingham, R. G., Hillenbrand, C. D., and Bracegirdle, T. J.: Atmosphere-ocean-ice interactions in the Amundsen Sea Embayment, West Antarctica, Rev. Geophys., 55, 235–276, https://doi.org/10.1002/2016rg000532, 2017.
Udy, D. G., Vance, T. R., Kiem, A. S., Holbrook, N. J., and Curran, M. A. J.: Links between Large Scale Modes of Climate Variability and Synoptic Weather Patterns in the Southern Indian Ocean, J. Climate, 34, 883–899, https://doi.org/10.1175/Jcli-D-20-0297.1, 2021.
Udy, D. G., Vance, T. R., Kiem, A. S., and Holbrook, N. J.: A synoptic bridge linking sea salt aerosol concentrations in East Antarctic snowfall to Australian rainfall, Commun. Earth Environ., 3, 175, https://doi.org/10.1038/s43247-022-00502-w, 2022.
van Dalum, C., van de Berg, W. J., and van den Broeke, M.: Monthly RACMO2.4p1 data for Antarctica (11 km) for SMB, SEB and near-surface variables (1979–2023), Zenodo [data set], https://doi.org/10.5281/zenodo.14217232, 2024a.
van Dalum, C. T., van de Berg, W. J., Gadde, S. N., van Tiggelen, M., van der Drift, T., van Meijgaard, E., van Ulft, L. H., and van den Broeke, M. R.: First results of the polar regional climate model RACMO2.4, The Cryosphere, 18, 4065–4088, https://doi.org/10.5194/tc-18-4065-2024, 2024b.
van Dalum, C. T., van de Berg, W. J., van den Broeke, M. R., and van Tiggelen, M.: The surface mass balance and near-surface climate of the Antarctic ice sheet in RACMO2.4p1, The Cryosphere, 19, 4061–4090, https://doi.org/10.5194/tc-19-4061-2025, 2025.
van de Berg, W. J., van den Broeke, M. R., Reijmer, C. H., and van Meijgaard, E.: Reassessment of the Antarctic surface mass balance using calibrated output of a regional atmospheric climate model, J. Geophys. Res.-Atmos., 111, https://doi.org/10.1029/2005jd006495, 2006.
Verfaillie, D., Pelletier, C., Goosse, H., Jourdain, N. C., Bull, C. Y. S., Dalaiden, Q., Favier, V., Fichefet, T., and Wille, J. D.: The circum-Antarctic ice-shelves respond to a more positive Southern Annular Mode with regionally varied melting, Commun. Earth Environ., 3, 139, https://doi.org/10.1038/s43247-022-00458-x, 2022.
Wang, S.: New record of explosive warmings in East Antarctica, Sci. Bull., 68, 129–132, 2023.
Wang, S., Ding, M. H., Liu, G., Li, G. C., and Chen, W.: Blocking Events in East Antarctica: Impact on Precipitation and their Association with Large-Scale Atmospheric Circulation Modes, J. Climate, 37, 1333–1345, https://doi.org/10.1175/Jcli-D-23-0419.1, 2024.
Wang, W., Shen, Y. Z., Chen, Q. J., and Wang, F. W.: Unprecedented mass gain over the Antarctic ice sheet between 2021 and 2022 caused by large precipitation anomalies, Environ. Res. Lett., 18, 124012, 124012, https://doi.org/10.1088/1748-9326/ad0863, 2023.
Wille, J. D., Favier, V., Gorodetskaya, I. V., Agosta, C., Kittel, C., Beeman, J. C., Jourdain, N. C., Lenaerts, J. T. M., and Codron, F.: Antarctic Atmospheric River Climatology and Precipitation Impacts, J. Geophys. Res.-Atmos., 126, e2020JD033788, https://doi.org/10.1029/2020JD033788, 2021.
Wille, J. D., Alexander, S. P., Amory, C., Baiman, R., Barthélemy, L., Bergstrom, D. M., Berne, A., Binder, H., Blanchet, J., Bozkurt, D., Bracegirdle, T. J., Casado, M., Choi, T., Clem, K. R., Codron, F., Datta, R., Di Battista, S., Favier, V., Francis, D., Fraser, A. D., Fourré, E., Garreaud, R. D., Genthon, C., Gorodetskaya, I., González-Herrero, S., Heinrich, V. J., Hubert, G., Joos, H., Kim, S. J., King, J. C., Kittel, C., Landais, A., Lazzara, M., Leonard, G. H., Lieser, J. L., Maclennan, M., Mikolajczyk, D., Neff, P., Ollivier, I., Picard, G., Pohl, B., Ralph, F. M., Rowe, P., Schlosser, E., Shields, C. A., Smith, I. J., Sprenger, M., Trusel, L., Udy, D., Vance, T., Walker, C., Wever, N., and Zou, X.: The Extraordinary March 2022 East Antarctica “Heat” Wave. Part I: Observations and Meteorological Drivers, J. Climate, 37, 757–778, https://doi.org/10.1175/Jcli-D-23-0175.1, 2024.
Williams, S. D. P., Moore, P., King, M. A., and Whitehouse, P. L.: Revisiting GRACE Antarctic ice mass trends and accelerations considering autocorrelation, Earth Planet. Sc. Lett., 385, 12–21, https://doi.org/10.1016/j.epsl.2013.10.016, 2014.
Xin, M., Clem, K. R., Turner, J., Stammerjohn, S. E., Zhu, J., Cai, W., and Li, X.: West-warming East-cooling trend over Antarctica reversed since early 21st century driven by large-scale circulation variation, Environ. Res. Lett., 18, 064034, https://doi.org/10.1088/1748-9326/acd8d4, 2023.
Zhang, B., Yao, Y. B., Liu, L., and Yang, Y. J.: Interannual ice mass variations over the Antarctic ice sheet from 2003 to 2017 were linked to El Nino-Southern Oscillation, Earth Planet. Sc. Lett., 560, 116796, 116796, https://doi.org/10.1016/j.epsl.2021.116796, 2021.