the Creative Commons Attribution 4.0 License.
the Creative Commons Attribution 4.0 License.
 | 06 Jan 2026
Drivers of observed winter–spring sea-ice and snow thickness at a coastal site in East Antarctica
Ricardo Fonseca
Narendra Nelli
Petra Heil
Jonathan D. Wille
Irina V. Gorodetskaya
Robert A. Massom
Antarctic sea ice and its snow cover play a pivotal role in regulating the global climate system through feedback on both the atmospheric and the oceanic circulations. Understanding the intricate interplay between atmospheric dynamics, mixed-layer properties, and sea ice is essential for accurate future climate change estimates. This study investigates the mechanisms behind the observed sea-ice and snow characteristics at a coastal site in East Antarctica using in situ measurements in winter–spring 2022. The observed sea-ice thickness peaks at 1.16 m in mid–late October and drops to 0.06 m at the end of November, following the seasonal solar cycle. On the other hand, the snow thickness variability is impacted by atmospheric forcing, with significant contributions from precipitation, Foehn effects, blowing snow, and episodic warm and moist air intrusions, which can lead to changes of up to 0.08 m within a day for a field that is in the range of 0.02–0.18 m during July–November 2022. A high-resolution simulation with the Polar Weather Research and Forecasting model for the 14 July atmospheric river (AR), the only AR that occurred during the study period, reveals the presence of AR rapids and highlights the effects of katabatic winds from the Antarctic Plateau in slowing down the low-latitude air masses as they approach the Antarctic coastline. The resulting convergence of the two airflows, with meridional wind speeds in excess of 45 m s−1, leads to precipitation rates above 3 mm h−1 around coastal Antarctica. The unsteady wind field in response to the passage of a deep low-pressure system with a central pressure that dropped to 931 hPa triggers satellite-derived pack ice drift speeds in excess of 60 km d−1 and promotes the opening up of a polynya in the Southern Ocean around 64° S, 45° E from 14 to 22 July. Our findings contribute to a better understanding of the complex interactions within the Antarctic climate system, providing valuable insights for climate modeling and future projections.
- Article
(15655 KB) - Full-text XML
-
Supplement
(4720 KB) - BibTeX
- EndNote


Sea ice, which forms from the freezing of seawater and covers 3 %–6 % of the total surface area of the planet, plays multiple crucial roles in the Earth's climate system and high-latitude ecosystems (Thomas, 2017; Eayrs et al., 2019). Changes in the formation and melt rates, extent, seasonality, and thickness of Antarctic sea ice – both in the form of drifting pack ice and less extensive stationary nearshore landfast ice (fast ice) attached to coastal margins, sea floor, and grounded icebergs (Fraser et al., 2023) – substantially impact the heat and salinity content of the ocean and hence the oceanic circulation (e.g., Haumann et al., 2016; Li and Fedorov, 2021). At the same time, breaks in the sea ice, such as leads and recurrent and persistent polynyas (Barber and Massom, 2007; Francis et al., 2019, 2020; Fonseca et al., 2023), act as a thermal forcing (Guest, 2021), directly impacting the atmospheric flow (Trusel et al., 2023; Zhang and Screen, 2021). Both oceanic and atmospheric forcing directly affect sea ice and its spatial extent, seasonality, and thickness (Wang et al., 2020; Yang et al., 2021), within a finely coupled interactive ocean–sea ice–atmosphere system. At the same time, decreases in sea-ice thickness (SIT), sea-ice extent (SIE), and its snow cover have strong potential to impact low-latitude weather patterns (England et al., 2020), disrupt the global surface energy balance (Riihelä et al., 2021), and amplify climate warming at high southern latitudes (Williams et al., 2023), leading to increased sea-ice loss that is likely to be further accelerated by poorly understood ocean–ice–snow–atmosphere feedback mechanisms (Goosse et al., 2023).
The Antarctic sea ice–snow system is particularly impacted by two atmospheric processes: (1) strong katabatic winds that cascade seawards off the ice sheet and promote sublimation of the sea ice and its snow cover (Elvidge et al., 2020; Francis et al., 2023); and (2) a number of more ephemeral but influential extreme atmospheric events in the form of atmospheric rivers (ARs; Wille et al., 2025). Foehn effects are an important trigger of surface melting around Antarctica, as the adiabatic compression of the downslope flow can lead to a marked increase in surface temperature in excess of 15 K (Bozkurt et al., 2018), while the associated strong winds can promote iceberg calving events (Miles et al., 2017). An AR is a narrow and highly elongated band of moisture-rich air that originates in the tropics and subtropics and propagates polewards into the mid- and high latitudes (Wille et al., 2019; Gorodetskaya et al., 2020). ARs are associated with increased humidity and cloudiness, leading to an enhancement of the downward longwave radiation flux (Djoumna and Holland, 2021), with the resulting increase in the surface net radiation flux giving a warming tendency and promoting surface melting (Gorodetskaya et al., 2013; Francis et al., 2020, 2022a; Ghiz et al., 2021).
There are several examples of ARs triggering ice and snow melt around Antarctica, e.g., in the Weddell Sea in 1973 and 2017 (Francis et al., 2020); off the Antarctic Peninsula in March 2015 (Bozkurt et al., 2018) and February 2022 (Gorodetskaya et al., 2023); around the Amery Ice Shelf in September 2019 (Francis et al., 2021); in West Antarctica (Francis et al., 2023); and in the Ross Sea (Fonseca et al., 2023). The recent study of Liang et al. (2023) highlights that the largest impact of ARs on sea ice is found in the marginal ice zone, where the SIE reduction may exceed 10 % d−1. Reduced coastal offshore SIE may also foster a deeper penetration of the low-latitude air onto the inland ice sheet as it enhances moisture availability, as is the case with the March 2022 “heat wave” in East Antarctica (Wille et al., 2024a, b). While ARs themselves are relatively rare and short-lived in coastal Antarctica, with a frequency of ∼ 3 d yr−1 at any given location, the warm and moist air masses they transport can make a substantial contribution to the surface mass balance (SMB) and are linked to extreme precipitation events (Massom et al., 2004; Wille et al., 2021, 2025). For example, in East Antarctica, a series of ARs delivered an estimated 44 % of the total mean-annual snow accumulation to the high interior ice sheet over an 18 d period in the austral summer of 2001/2002 (Massom et al., 2004), and AR-associated rainfall has exceeded 30 % of the total annual precipitation (Maclennan et al., 2022, 2023). These studies highlight the impacts of extreme weather events on the coupled Antarctic ocean–ice–snow–atmosphere system and stress the need to better understand the role of low-latitude air incursions on the SMB and on the state of both the Antarctic Ice Sheet and its surrounding sea-ice cover and how these may change in a warming climate.
The effects of the atmospheric forcing, such as that associated with extreme weather episodes, on the sea ice–snow–air coupling system can be inferred through the analysis of in situ measurements of SIT and snow thickness (ST). This is achieved in this study through the deployment of an autonomous Snow Ice Mass Balance Array (SIMBA) buoy (Jackson et al., 2013) from July to November 2022 at a coastal fast-ice site close to Mawson Station in East Antarctica (67.5912° S, 62.8563° E), which will be denoted as “Khalifa SIMBA site on fast ice off Mawson Station” throughout the manuscript. This station is selected as it has among the highest AR frequencies on the continent, along with a statistically significant positive trend in AR frequency and intensity during 1980–2020 (Wille et al., 2025). The overall aim of this work is to further our understanding of the temporal evolution of the thickness and vertical structure of coastal sea ice and its snow cover in East Antarctica over a six-month period spanning austral winter through late spring when ARs are more frequent in the region (Wille et al., 2025). This study is timely given the precipitous downward trend in Antarctic SIE since 2016 (Parkinson, 2019), an extraordinary record-low annual minimum in February 2023, and a sudden departure to major sea-ice deficits through the winters of 2023 and 2024 (Reid et al., 2024). This turn of events suggests that Antarctic sea ice has abruptly shifted into a new low-extent regime (Purich and Doddridge, 2023; Hobbs et al., 2024). Much less well known – though no less important – are the thicknesses of the ice and its ST and whether these are changing. Obtaining more accurate and complete information on the Antarctic SIT distribution and its ST and precipitation rates, along with the factors and processes controlling them, is a critical high priority in climate science, particularly in light of climate variability and change (Webster et al., 2018; Meredith et al., 2021).
Accurate knowledge of SIT, SIE, and concentration is needed to estimate sea-ice volume, a field that is directly parameterized in numerical models (Massonnet et al., 2013; Zhang, 2014; Schroeter and Sandery, 2022) and that exhibits large uncertainties (Maksym et al., 2008, 2012). Satellite radar and laser altimeters hold the key to large-scale estimation and monitoring of both SIT (e.g., Fonseca et al., 2023) and ST (Kacimi and Kwok, 2020). Kurtz and Markus (2012) used the measurements collected by the Ice, Cloud, and land Elevation Satellite (ICESat) to estimate the ice thickness around Antarctica. A comparison with ship-based observations revealed a mean difference of 0.15 m for the period 2003–2008, with a typical SIT of 1–1.5 m. Kacimi and Kwok (2020), using both laser (ICESat-2) and radar (CryoSat-2) altimeter estimates for the period 1 April to 16 November 2019, found the thickest sea ice in the western Weddell Sea sector (predominantly multi-year sea ice), with a mean thickness of 2 m, and the thinnest ice around polynyas in the Ross Sea and off the Ronne Ice Shelf. Coincident use of laser and radar altimetry also enables basin-scale estimates of ST. The thickest snow was again observed in the western Weddell Sea (0.228 ± 12.4 m in May) and the coastal region of the Amundsen–Bellingshausen Sea sector (0.314 ± 23.1 m in September), while the thinnest snow was in the Ross Sea (0.0735 ± 4.30 m in April) and the eastern Weddell Sea (0.0821 ± 5.81 m in June) (Kacimi and Kwok, 2020). These studies focused on pack ice, but a similar range of values has been estimated for the thickness of fast ice, such as off Mawson (Li et al., 2022) and Davis (Heil, 2006) stations in East Antarctica. The SIMBA buoy observations provide invaluable gap-filling information on the temporal evolution and state of the snow–sea ice system and its response to atmospheric and oceanic variability. They are also crucial to both (1) calibrate the key satellite SIT and ST data products, and (2) evaluate and improve numerical idealized column and weather forecasting models (Hu et al., 2023; Plante et al., 2024; Sledd et al., 2024; M. Wang et al., 2024). Such steps are needed to rectify present low confidence in model projections of future climate and Antarctic sea-ice conditions that currently diverge among different models and scenarios (Roach et al., 2020).
While there are a number of studies on in situ SIT and ST measurements around Antarctica (e.g., Worby et al., 2011; Xie et al., 2011; Liao et al., 2022), the area of East Antarctica around Mawson Station, where extreme precipitation events in the form of ARs have become more frequent and intense in recent decades (Wille et al., 2025), has not been sampled. In addition, these works do not delve deep into the processes responsible for the observed changes in SIT and ST, which is a necessary step for refining Antarctic climate projections. The objectives of this study are twofold: (1) to identify the mechanisms behind the variability of the in situ measured SIT and ST at Mawson Station during July–November 2022 and compare the measured values with those estimated from remote sensing assets; and (2) to perform high-resolution numerical simulations for selected periods during the measurement campaign, in particular during extreme weather events, to gain further insight into the role of atmospheric forcing on the SIT and ST. This study will therefore contribute to further our understanding of the variability of the SIT and ST in coastal Antarctica and the respective driver processes.
This paper is structured as follows. The observational datasets, model outputs, products considered, and analysis techniques used are described in Sect. 2. The measurements of SIT and ST, including their variability and the mechanisms behind them, are discussed in Sect. 3. Section 4 provides a case-study analysis of the period 11–16 July 2022, while in Sect. 5, the main findings of the work are outlined and discussed.
2.1 In situ measurements at Khalifa SIMBA site off Mawson Station
In situ measurements of SIT and ST are obtained using a sea-ice mass balance (SIMBA) unit (Jackson et al., 2013). This SIMBA is deployed on landfast ice offshore from Mawson Station at 67.5912° S, 62.8563° E (Fig. 1a) on 7 July 2022 and remained in situ until 7 December 2022. The SIMBA unit, shown in Fig. 1b, consists of a 5 m-long thermistor string with a 0.02 m sensor spacing, a barometer for surface air pressure, and an external sensor for near-surface ambient air temperature (Jackson et al., 2013). During deployment, manual measurements of SIT and ST, as well as freeboard, are recorded. The positions of the sensors relative to the interfaces are noted to establish the initial state (on 7 July 2022). The measured SIT upon deployment is 0.988 m, the ST on top of the sea ice is 0.156 m, and the sea-ice freeboard is 0.046 m. No manual validation or calibration is conducted during the measurement period of 7 July–7 December 2022.
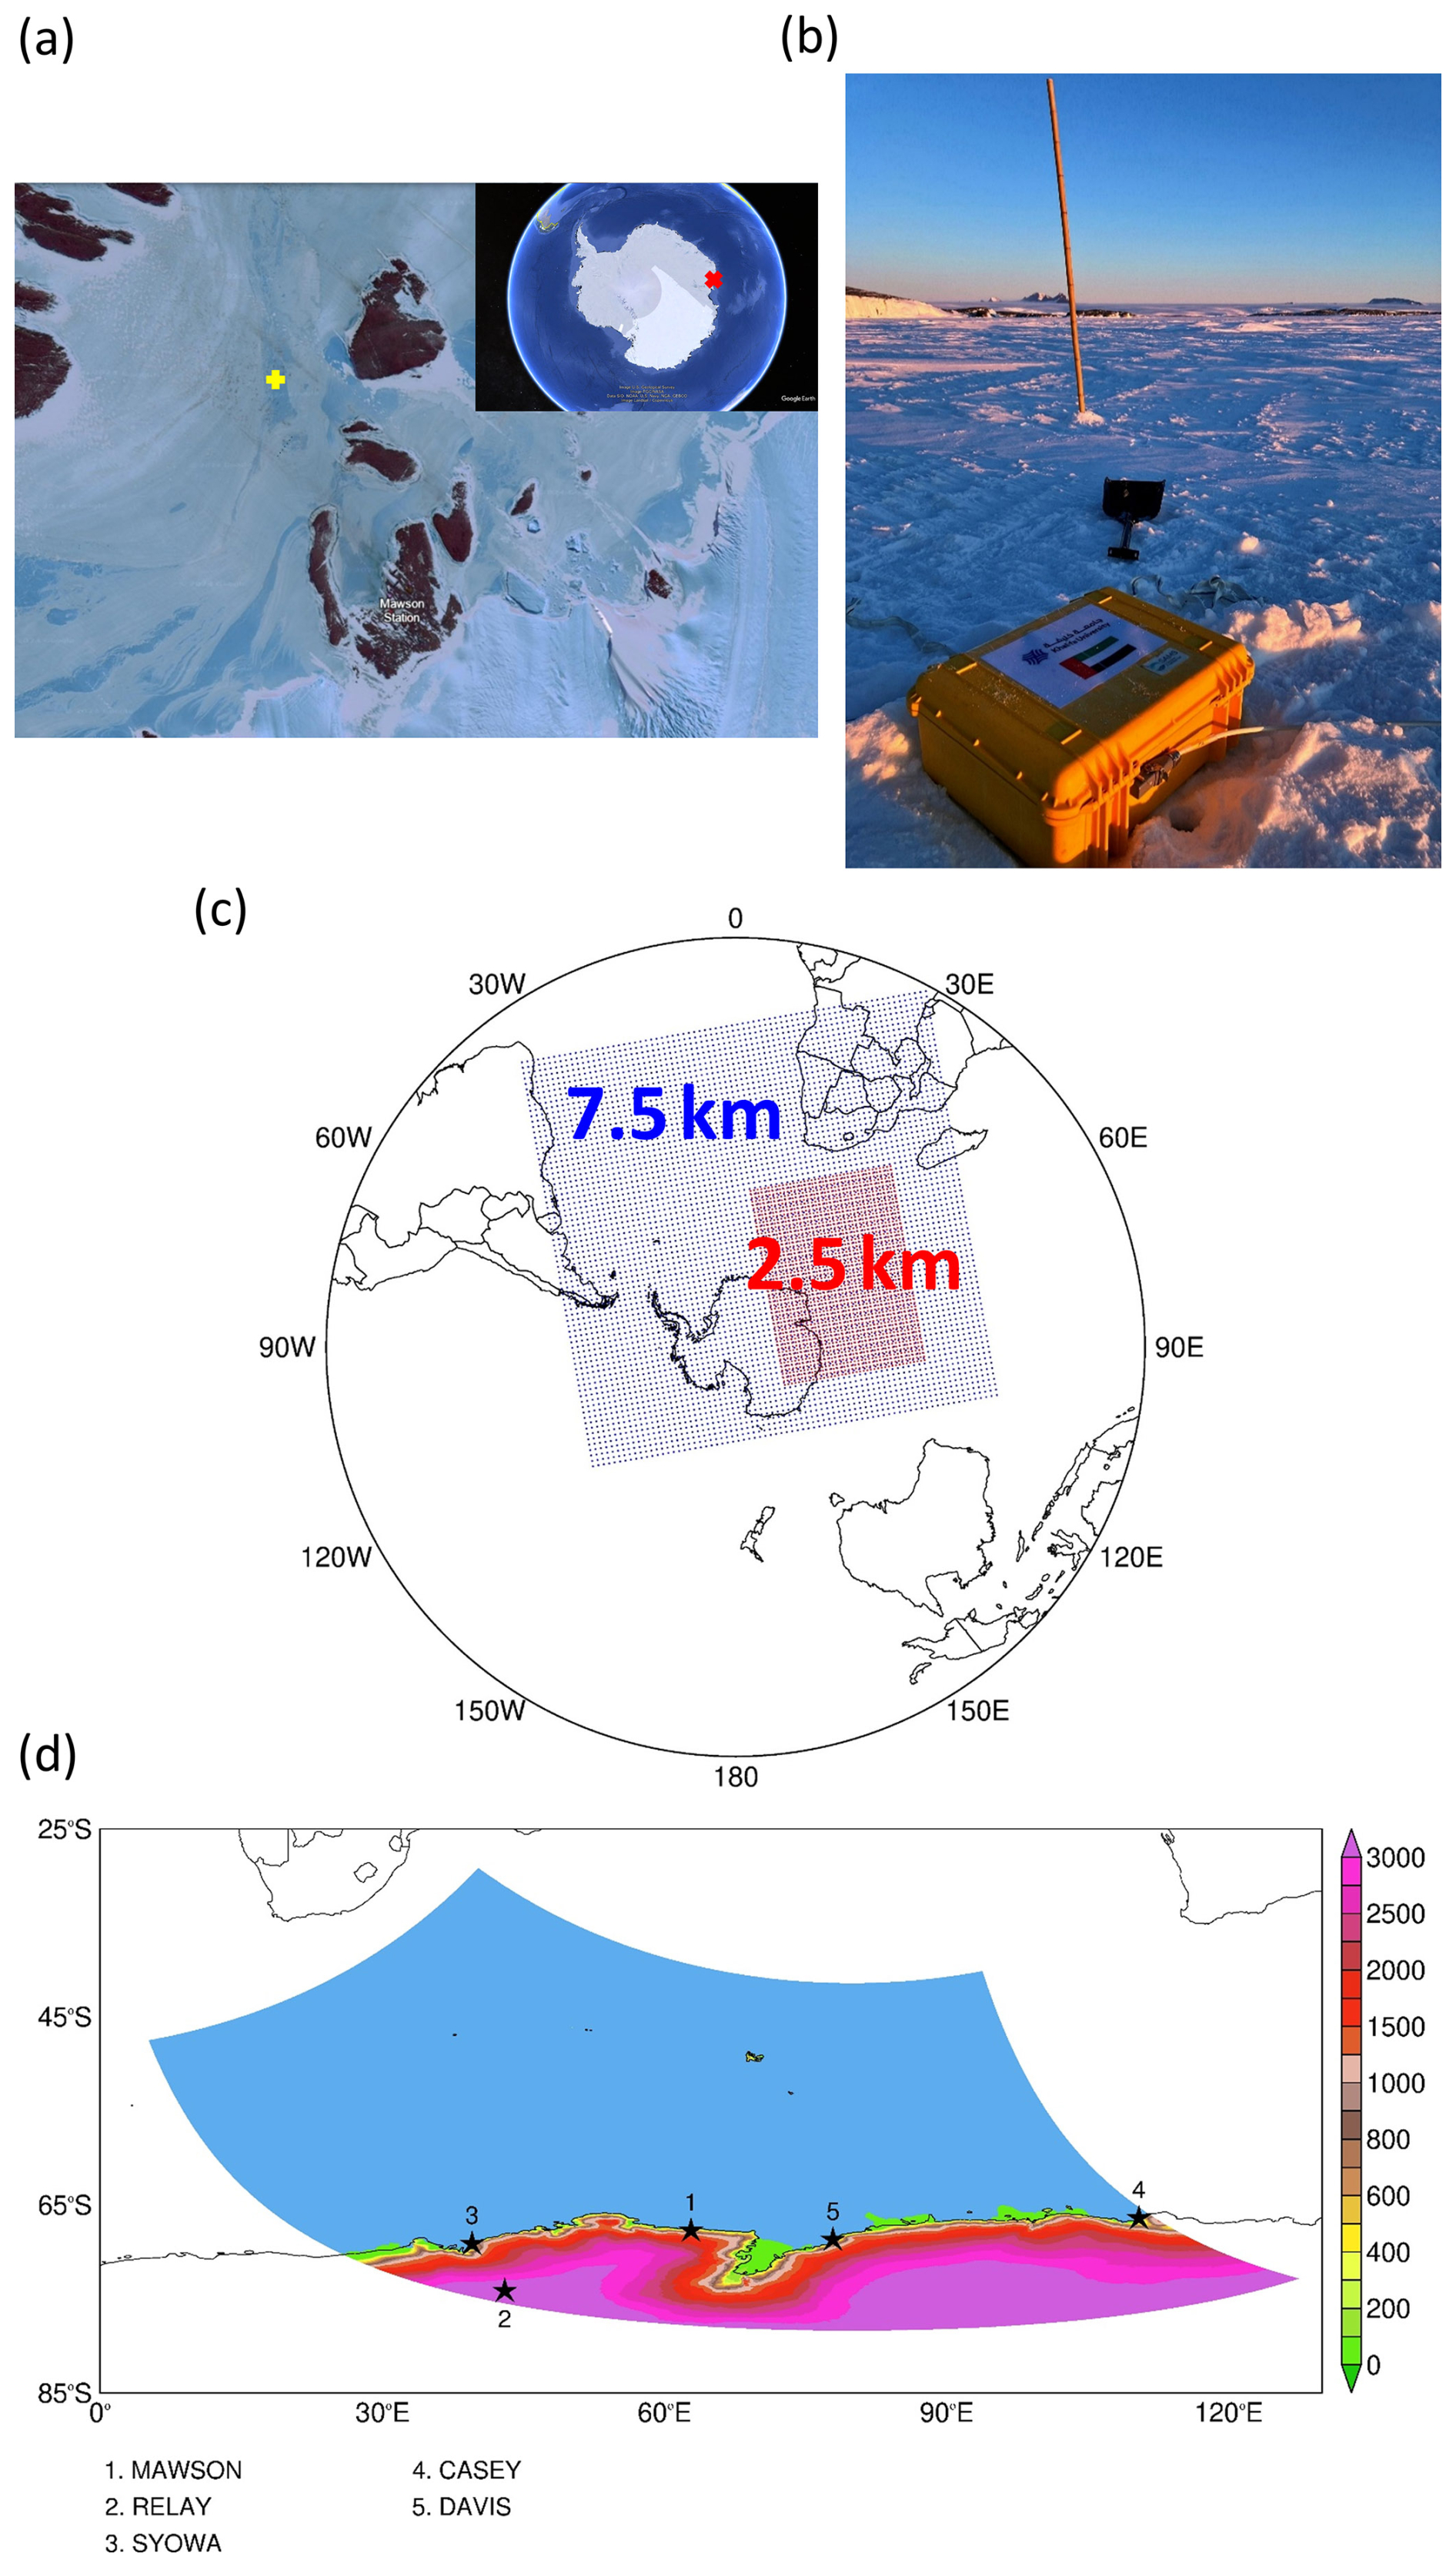
Figure 1SIMBA deployment site and PolarWRF simulation: (a) SIMBA deployment site (yellow cross) on the fast ice about 1.8 km off Mawson Station. Image source: Landsat 8 acquired on 19 November 2022. The red cross in the inset image, taken from © Google Earth Pro, shows where Mawson Station is located in Antarctica. (b) SIMBA instrument prior to deployment. Image credit: Peter Caithness. (c) Spatial extent of the 7.5 km (blue) and 2.5 km (red) PWRF grids used in the numerical simulations. (d) Spatial extent and orography (m) of the 2.5 km PWRF grid. The stars highlight the location of the five weather stations considered in this work.
The accuracy of the bus-addressable digital temperature sensing integrated circuit is ± 0.0625 K. A resistor is mounted directly underneath each thermistor sensor. A low voltage power supply (8 V) is connected to each sensor to gently heat the sensor and its immediate surroundings. In this study, heating is applied to the sensor chain for durations of 30 and 120 s once per day, with four vertical temperature profiles without heating recorded daily as well. In this study, SIMBA data from 8 July to 30 November 2022 are used to assess the evolution of SIT and ST at the site. The measurements are shown in Fig. 2. For the sensors 6 through 126, the actual temperature and the temperature rise after 120 s heating are given in Fig. 2a and b, respectively, with Fig. 2c showing the difference between the measurements of two adjacent temperature sensors after applying the heating.
The vertical temperature gradients in the air above the surface and in the water below the ice bottom are generally very small (Jackson et al., 2013; Hoppmann et al., 2015; Liao et al., 2018). After 120 s of heating, the rise in temperature is approximately 10 times higher in air than in ice and water (Jackson et al., 2013). For any two adjacent sensors in the ice, following the algorithm detailed in Liao et al. (2018) based on a physical model applied to the SIMBA measurements, the temperature difference should be ≤ 0.1875 K, whereas for two adjacent sensors in snow, the temperature difference should be ≥ 0.4375 K. These thresholds are applied to the temperature differences between adjacent sensors in the heating profile to identify the air–snow and snow–ice interfaces (Jackson et al., 2013; Hoppmann et al., 2015; Liao et al., 2018). The ice–water interface is identified using a statistical approach based on Liao et al. (2018). A section of the thermistor string, spanning from the top of the sea ice to a few sensors below the water, is selected. The seawater temperature near the ice bottom remains stable around the freezing point (Tf). The temperature readings from this section are analyzed as a time series, and the most frequent value is identified as Tf. Scanning from the bottom up, the last sensor close to Tf is identified as the ice bottom. The allowed temperature difference is 1.5 times the thermistor resolution of 0.0625 K. The temporal evolutions of the three interface locations are plotted in Fig. 2a–c.
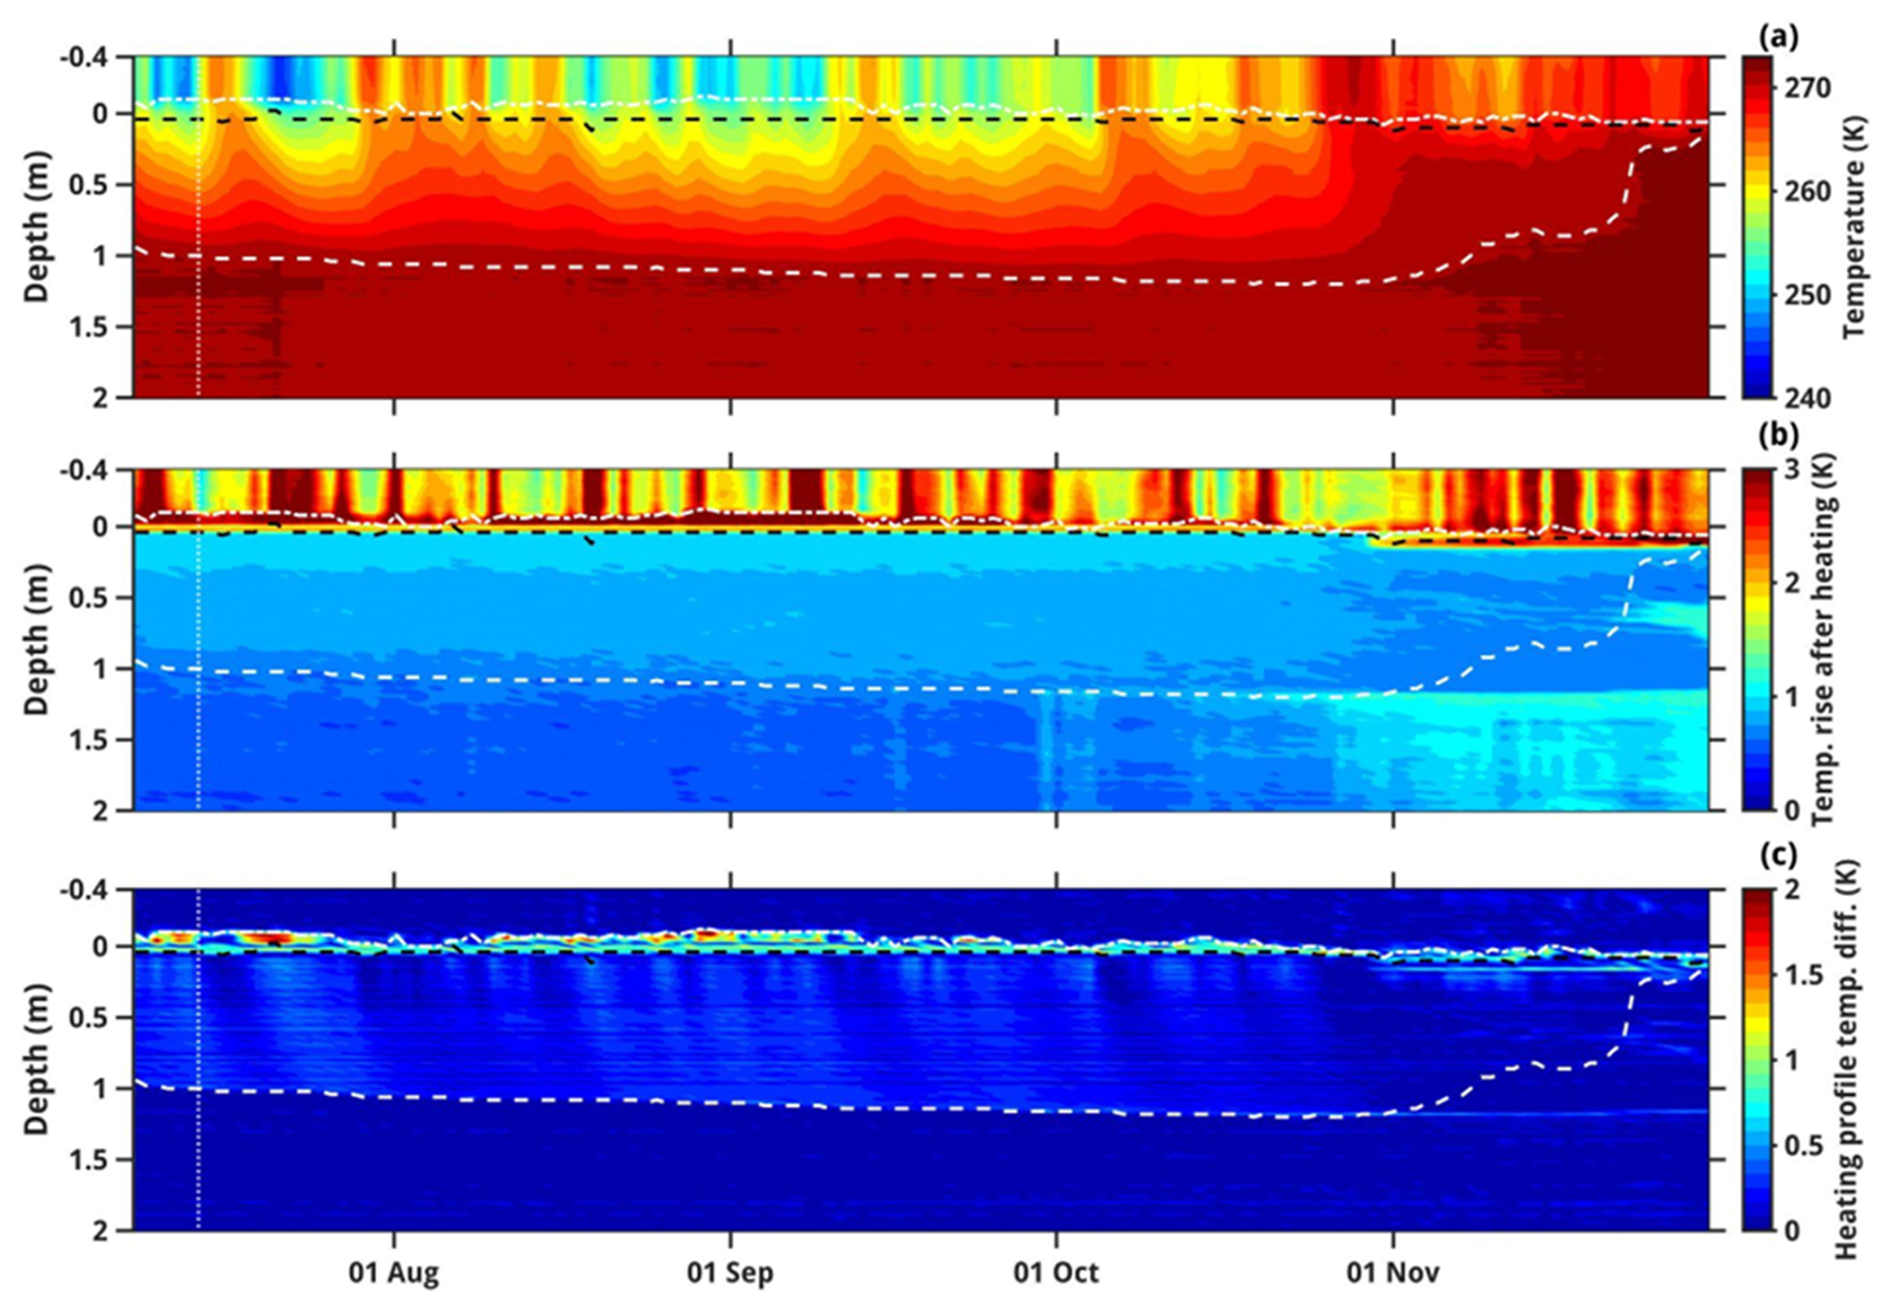
Figure 2SIMBA measurements: (a) temperature (K) evolution from the top of the chain through the ice down into the water (the zero line on the y-axis is at the snow-ice interface). (b) Temperature rise (K) after heating for 120 s. (c) Temperature difference (K) between adjacent sensors after applying the heating for 120 s. The vertical white dotted line indicates the day of AR occurrence at the site, 14 July. The horizontal dotted white line, black dashed line, and white dashed line give the air–snow (AS), snow–ice (SI), and ice–water (IW) interfaces, respectively.
2.2 Observational and reanalysis datasets
In addition to in situ SIT and ST measurements, three observational datasets are considered in this work: (i) satellite-derived SIE and sea-ice velocity; (ii) ground-based observations at five weather stations, namely Mawson, Syowa, Relay, Casey, and Davis (Fig. 1d); and (iii) twice daily sounding profiles at the Mawson, Syowa, Casey, and Davis stations (stations #1 and 3–5 in Fig. 1d). Data from the fifth generation of the European Centre for Medium Range Weather Forecasting reanalysis (ERA-5; Hersbach et al., 2020) are used to investigate the large-scale circulation and SMB during the study period. ERA-5 is regarded as one of the best reanalysis products currently available over Antarctica and the Southern Ocean (Gossart et al., 2019; Dong et al., 2020). All of these products are listed in Table 1.
Table 1Observational and reanalysis datasets: list of observational and reanalysis datasets used in this study.
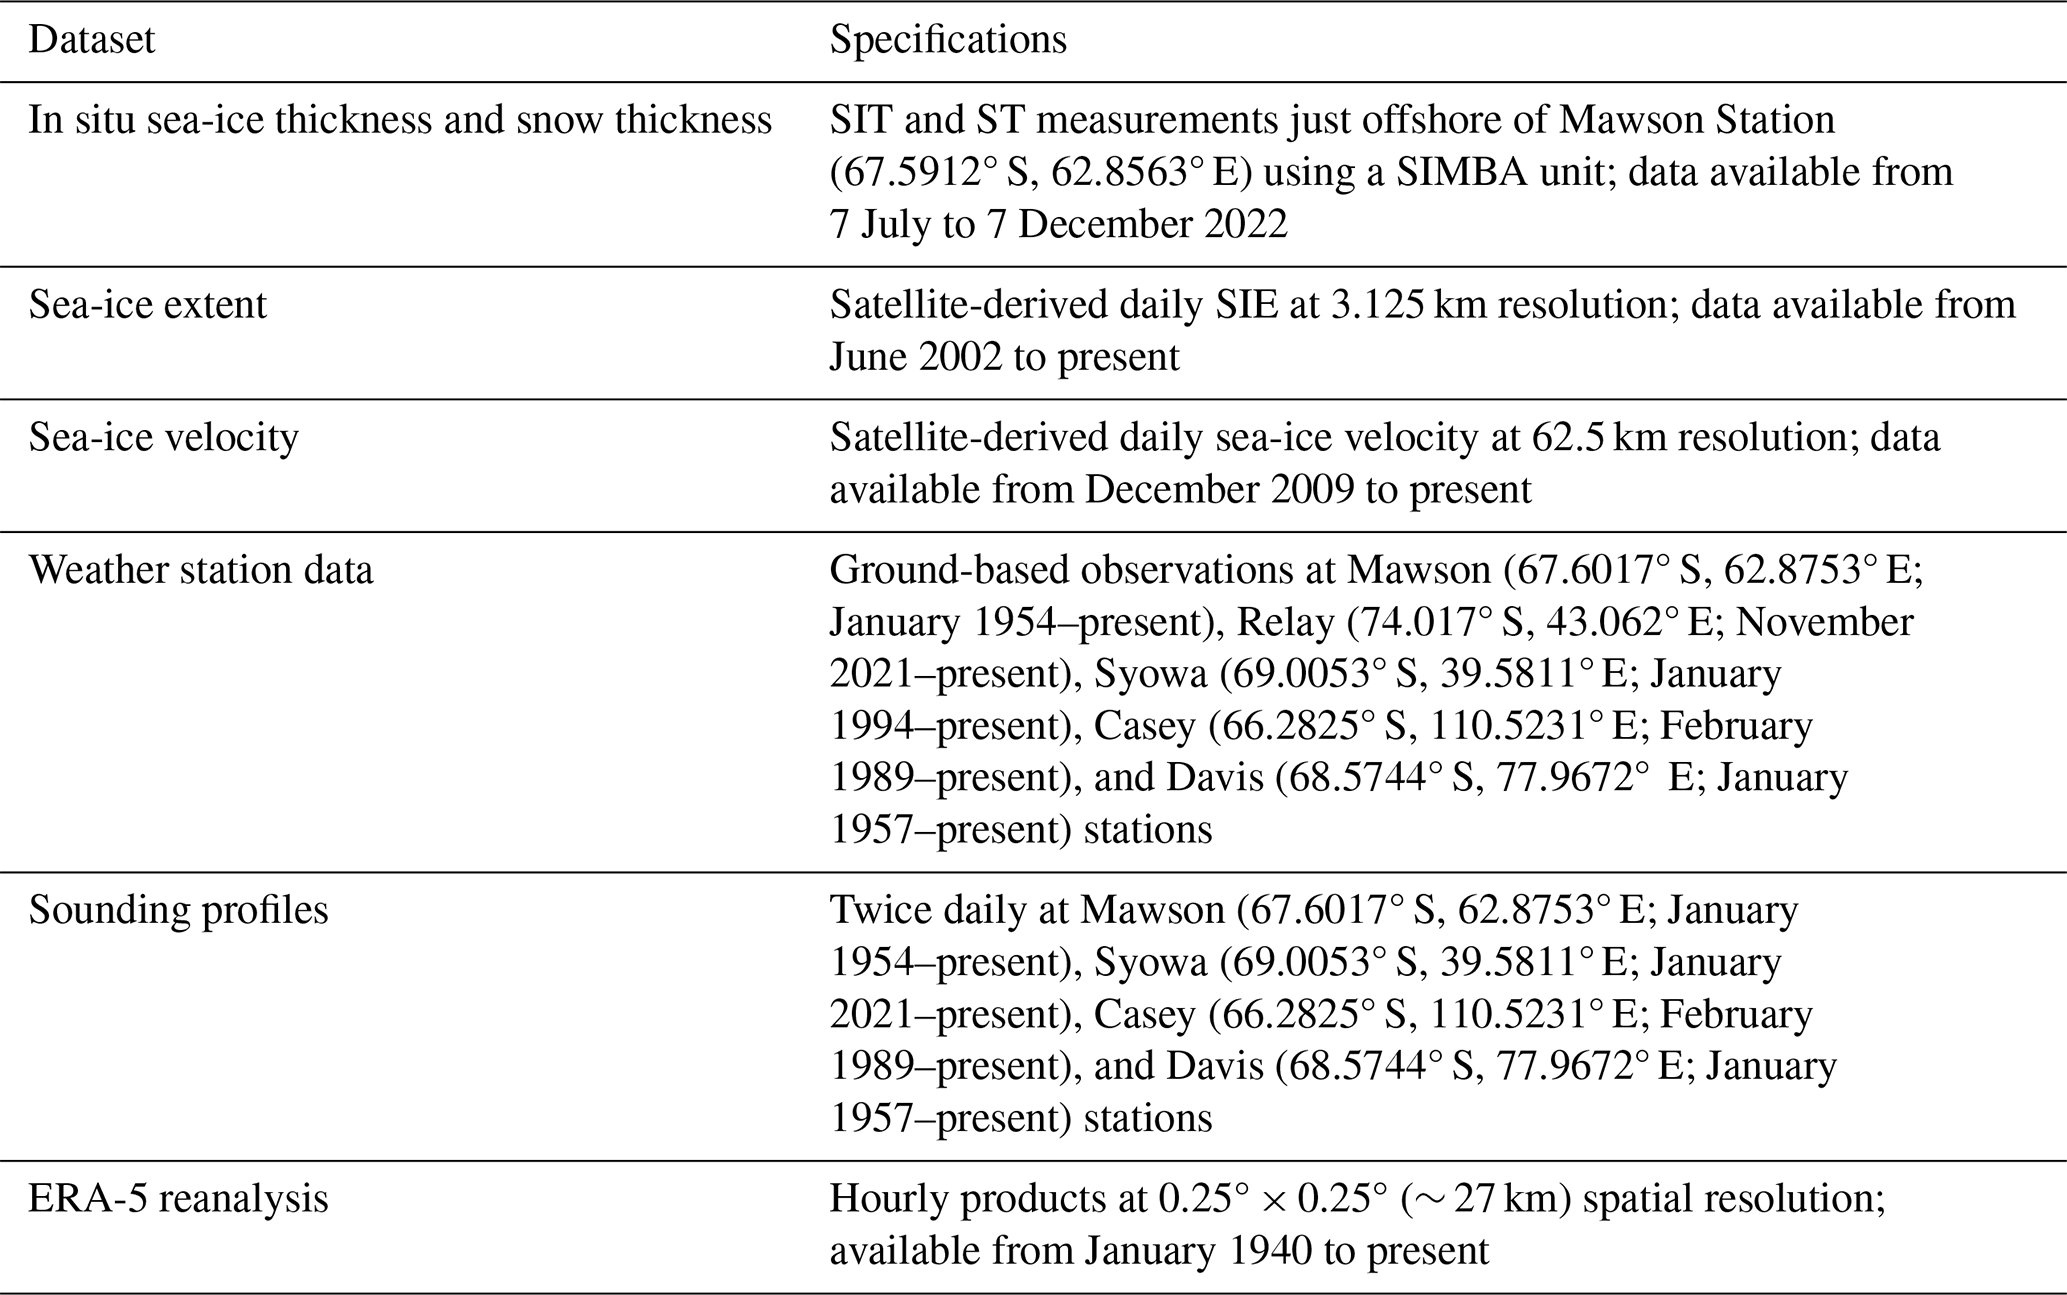
Daily SIE is derived from the measurements of sea-ice concentration collected by the Advanced Microwave Scanning Radiometer for Earth Observing Systems (AMSR-E) onboard the National Aeronautics and Space Administration (NASA) Aqua satellite from June 2002 to October 2011 and from the observations taken by the AMSR2 onboard the Japan Aerospace and Exploration Agency's Global Change Observation Mission – Water (GCOM-W) satellite from July 2012 to present (Spreen et al., 2008). Sea-ice velocity vectors, on the other hand, are obtained from the measurements collected by the Special Sensor Microwave Imager/Sounder onboard the United States Air Force Defense Meteorological Satellite Program, the Advanced Scatterometer onboard the European Space Agency's Meteorological Operational satellite, and the GCOM-W AMSR2 (Lavergne et al., 2010). Both the SIE and sea-ice velocity products are used to gain insight into the effects of the warm and moist air intrusions on the sea-ice state around Mawson Station, as performed in previous studies for other parts of Antarctica (e.g., Francis et al., 2021; Fonseca et al., 2023).
In situ observations at multiple automatic weather stations (AWSs) are used in the analysis and model evaluation (Fig. 1d). These include: (i) 1 min 2 m air temperature and humidity, 10 m horizontal wind velocity, and sea-level pressure (SLP) observations at the Australian Antarctic stations of Mawson, Casey, and Davis; (ii) 1 min measurements of meteorological parameters (2 m air temperature, SLP, 10 m horizontal wind velocity, and 2 m relative humidity) and radiation fluxes (surface upward and downward and shortwave and longwave) at the coastal Syowa Station; and (iii) 10 min SLP, horizontal wind velocity, and 2 m air temperature and relative humidity observations at the inland Relay Station. Also analyzed are data from atmospheric sounding profiles acquired twice daily (at 00:00 and 12:00 UTC) at the Mawson, Syowa, Casey, and Davis stations.
2.3 Numerical models
Here we use version 4.3.3 of the Polar PWRF (Weather Research and Forecasting) model, a version of the WRF model (Skamarock et al., 2019) optimized for the polar regions (Bromwich et al., 2013; Hines et al., 2021; Xue et al., 2022; Zou et al., 2023), to simulate and investigate the AR that impacted the Mac Robertson Land region on 14 July 2022. The model is run in a nested configuration, with a 7.5 km horizontal resolution grid domain comprising Antarctica, the Southern Atlantic Ocean, southern Africa, and the southwestern Indian Ocean and a 2.5 km horizontal resolution grid domain extending from the Southern Ocean just south of South Africa around 30° E into coastal East Antarctica as far east as approximately 120° E (Fig. 1c). The choice of resolution, in particular the 2.5 km grid that covers the bulk of the AR and associated warm and moist air intrusion into East Antarctica, reflects the findings of Box et al. (2023) and Francis et al. (2024). These studies stressed the need to properly resolve the fine-scale structure of an AR due to the possible presence of AR rapid-like features embedded in the convective region, which can generate copious amounts of precipitation and hence have a substantial impact on the SMB of the ice. AR rapids are narrow (5–15 km wide), elongated (100–200 km long), and shallow (∼ 3 km deep) linear features within the AR that propagate at high speed (> 30 m s−1) and last for more than 24 h. They have been reported for an AR that impacted Greenland in September 2017 (Box et al., 2023) and another that wreaked havoc in the Middle East in April 2023 (Francis et al., 2024). AR rapids are distinct from mesoscale convective systems (MCSs; Houze, 2004; Feng et al., 2021; Nelli et al., 2021), which propagate at a slower speed (10–20 m s−1), typically do not last as long (6–10 h), and generate broader (as opposed to linear) precipitation structures.
PWRF is run from 10 July 2022 at 00:00 UTC to 17 July 2022 at 00:00 UTC, comprising the only AR that impacted the site during July–November 2022, with the first day regarded as spin-up and the output discarded. The hourly outputs of the 7.5 and 2.5 km grids are used for analysis. The physics schemes selected, listed in Table 2, reflect the optimal model configuration for Antarctica and the Southern Ocean (Zou et al., 2021a, b, 2023). In order to prevent the large scales in the model from drifting away from the forcing fields, spectral nudging (Attada et al., 2021) is employed in both grids for spatial scales above 1000 km and ∼ 800 hPa and excluding the boundary layer. Fields nudged include the horizontal wind components, the potential temperature perturbation, and the geopotential height. In the vertical, 60 levels are considered, with the lowest level above the surface at ∼ 27 m and roughly 20 levels in the range of ∼ 1–6 km. The higher resolution in the low- to mid-troposphere is crucial to correctly represent the fine-scale variability of the warm and moist air masses impacting the site and associated cloud processes (Rauber et al., 2020; Finlon et al., 2020).
Table 2WRF experimental setup: physics schemes used in the WRF simulation.
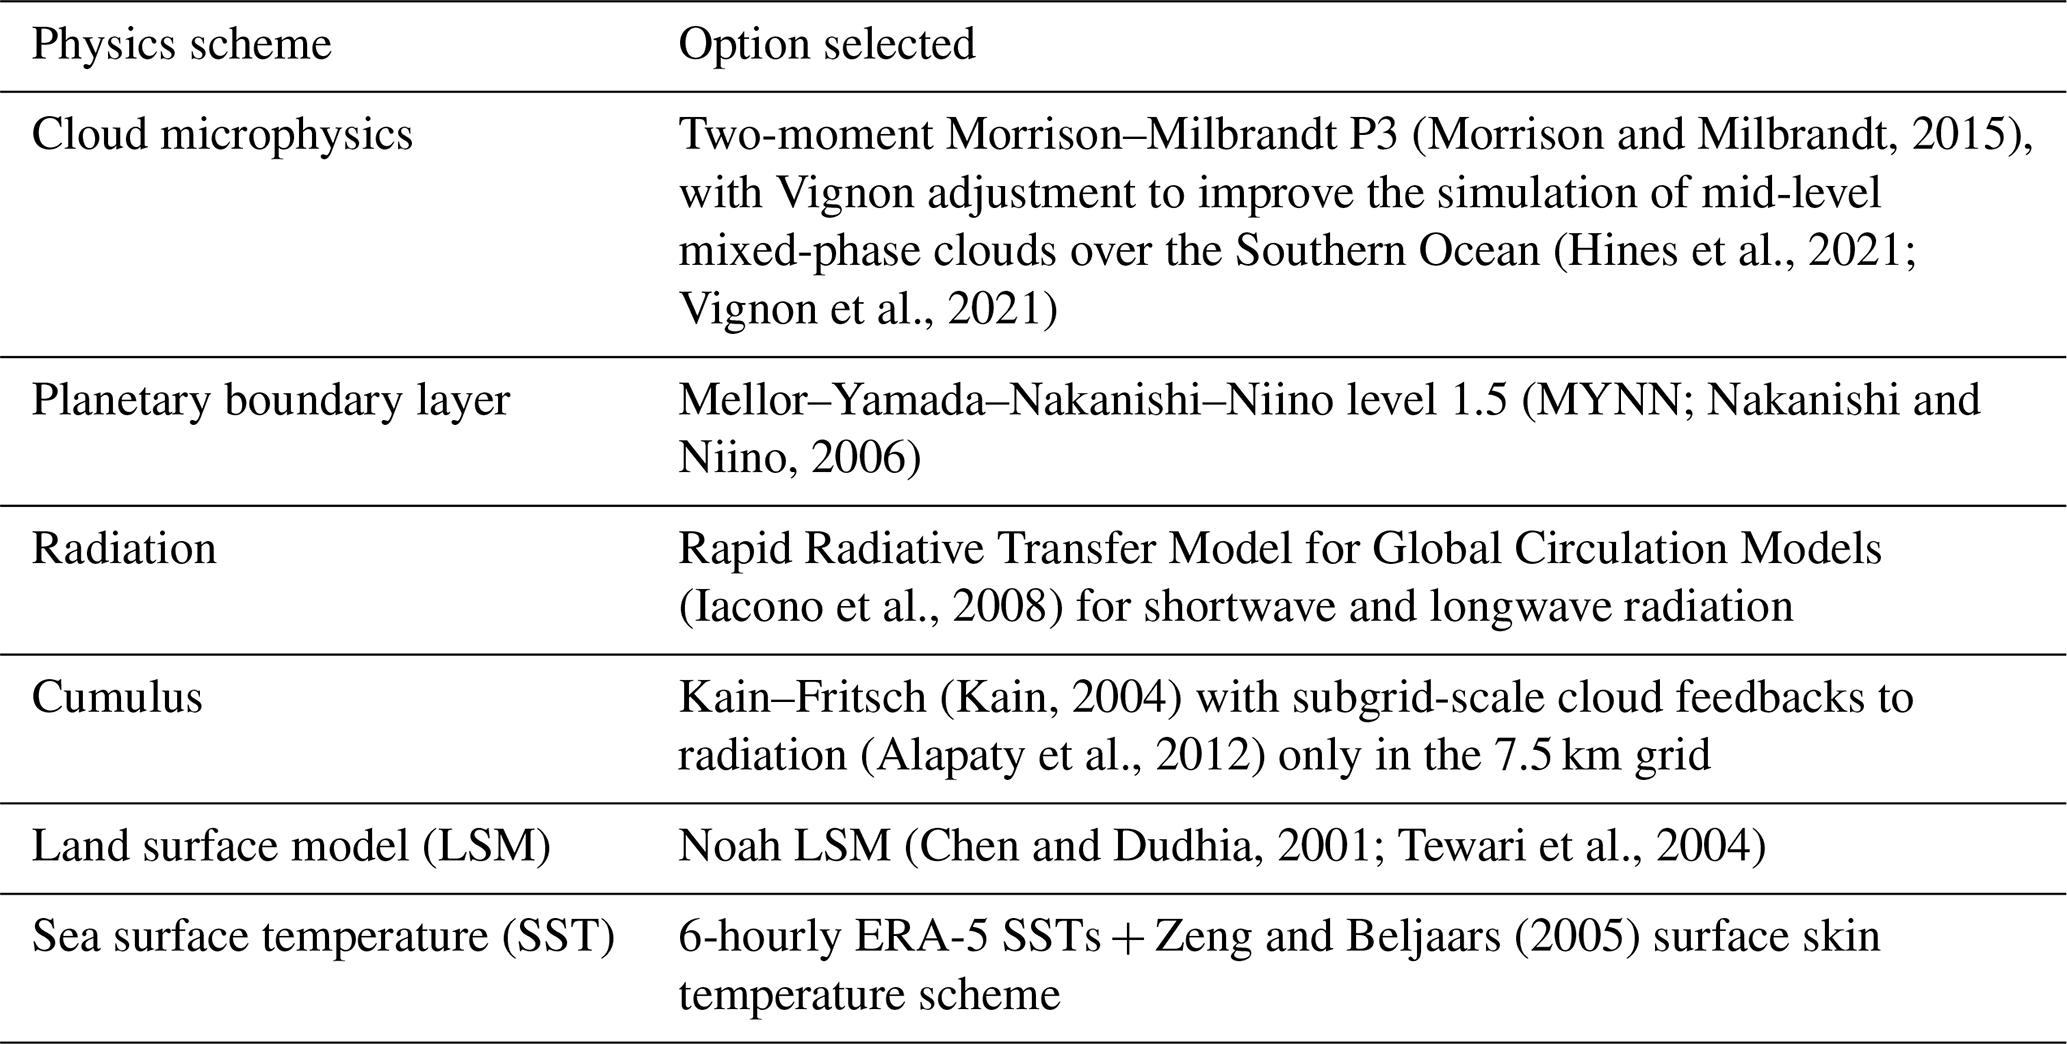
PWRF is driven by 6 h ERA-5 data, with the SSTs and SIE used in the simulations taken from ERA-5. Due to the lack of availability of SIT in ERA-5, the model's default SIT value of 3 m is used in all sea-ice-covered grid boxes. The sea-ice albedo is parameterized as a function of air and skin temperature following Mills (2011), with the model explicitly predicting ST on sea ice. A sensitivity experiment is performed in which a more realistic representation of SIE and SIT is considered. In particular, satellite-derived values are used for SIE, extracted from the 3.125 km-resolution daily product available at the University of Bremen website (UoB, 2024), while the SIT estimates at Mawson are employed at all sea-ice-covered pixels. A similar model performance is obtained with respect to the in situ observations (not shown). Therefore, for consistency with the atmospheric forcing, the ERA-5's SIE and the PWRF's default SIT values are used in the model runs.
The moisture sources that contributed to the AR during 11–16 July 2022 are diagnosed based on 96 h back-trajectories obtained with the Hybrid Single-Particle Lagrangian Integrated Trajectory (HYSPLIT; Stein et al., 2015) model driven by ERA-5 reanalysis data.
2.4 Diagnostics and metrics
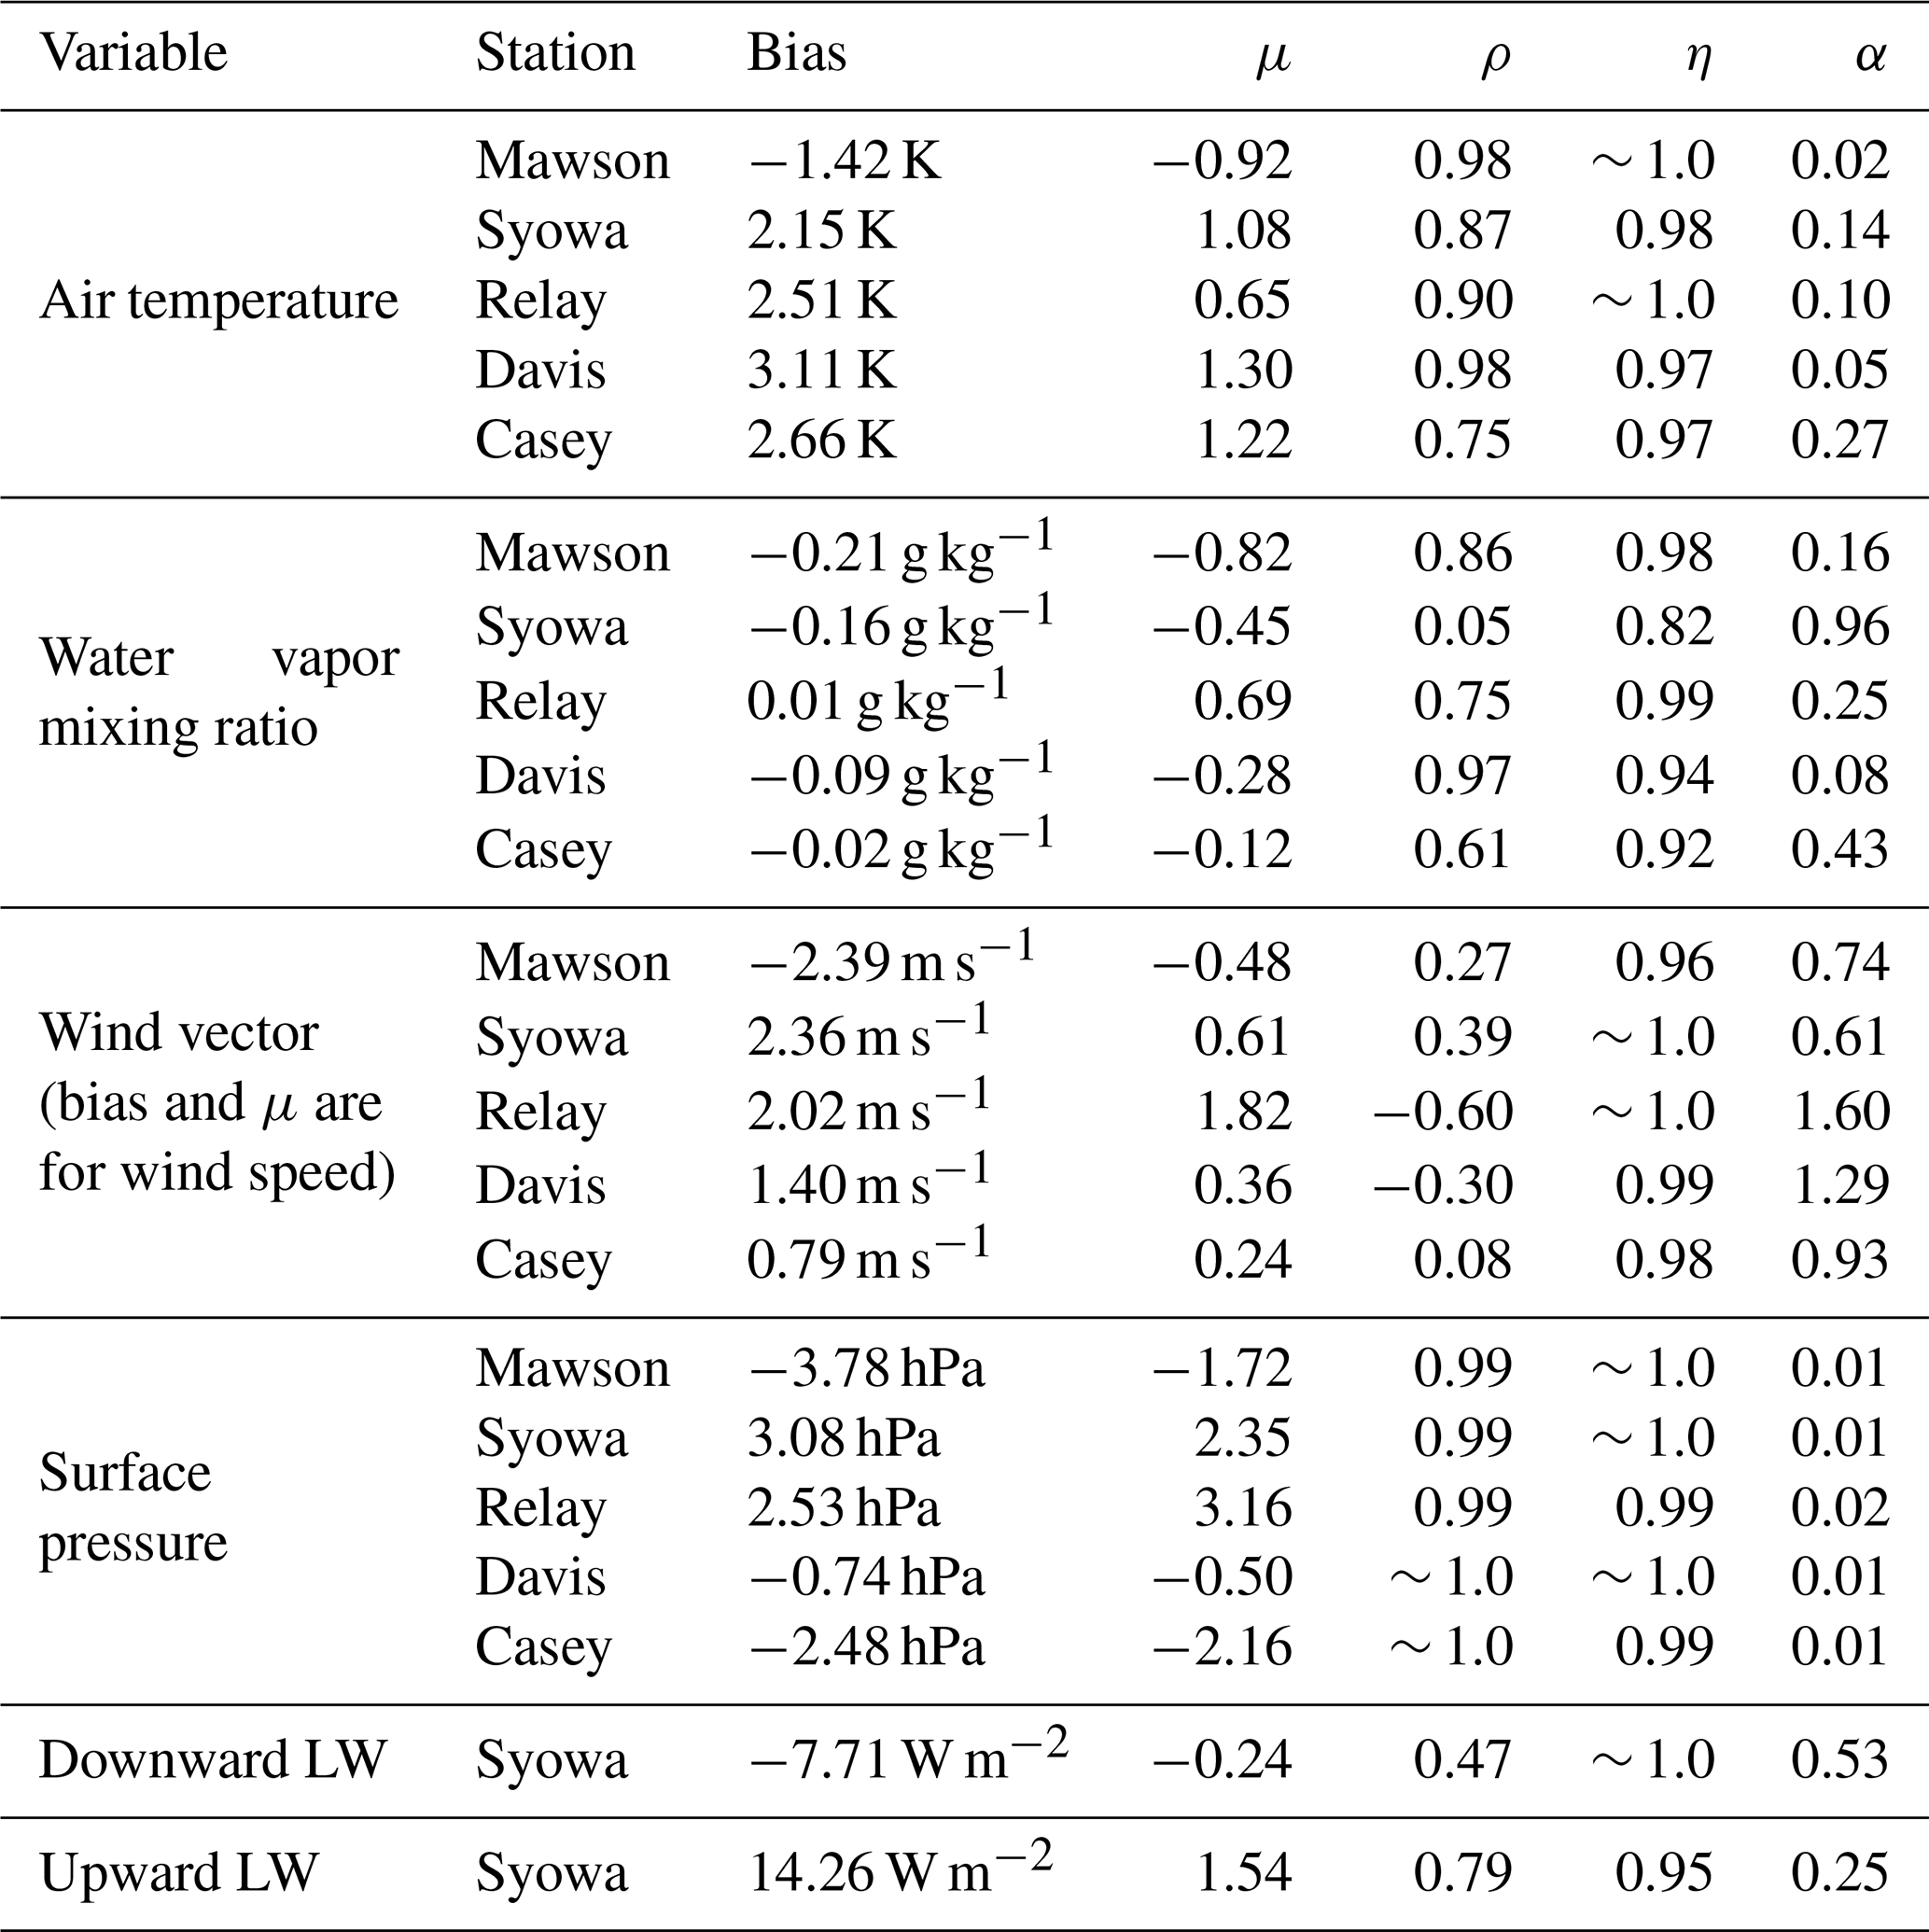
The performance of the PWRF model is assessed with the verification diagnostics proposed by Koh et al. (2012), outlined in Supplement Sect. S1. In addition to the model bias, the two key skill scores are (1) the normalized bias μ, defined as the ratio of the bias to the standard deviation of the discrepancy between the model forecasts and observations, and (2) the normalized error variance α, which accounts for both phase and amplitude errors. When |μ|<0.5, the model biases can be regarded as not significant, while when α <1, the model forecasts are deemed to be practically useful.
ARs are identified based on the integrated vapor transport (IVT; kg m−1 s−1), which is the column integral of the water-vapor flux advected by the horizontal wind. It is quantified as
In Eq. (1), g is the gravitational acceleration (9.80665 m s−2), q is the specific humidity (kg kg−1), u is the zonal wind speed (m s−1), v is the meridional wind speed (m s−1), and dp is the pressure difference between adjacent vertical levels (hPa). The criteria of Wille et al. (2021) applied to ERA-5 data are used here to identify ARs. In particular, IVT has to exceed the 98th percentile extracted for 1979–2022 at a given grid box, and a minimum latitudinal extent of 20° is required for the feature to be considered an AR. During the July–November 2022 study period, the Khalifa SIMBA site on fast ice off Mawson Station was affected by one AR on 14 July. This event is selected for more in-depth analysis and modeling in Sect. 4. Large-scale circulation patterns that favor ARs, including the presence of blocking and interaction with tropopause polar vortices (TPVs), are also explored. Further details regarding the metrics used to diagnose them are given in Supplementary Sects. S2–3.
The extratropical circulation can be modulated by tropical forcing, such as thermal (heating and cooling) anomalies (Hoskins and Karoly, 1981; Hoskins et al., 2012). In order to explore whether this occurs during the case study, the stationary wave activity flux, which indicates the direction of the anomalous stationary Rossby wave propagation, defined in Takaya and Nakamura (2001), is derived as Eqs. (2a)–(2b) and plotted.
In Eqs. (2a)–(2b), p is the ratio of the pressure level at which the W-vector is computed to 1000 hPa, ϕ is the latitude, λ is the longitude, u and v are the zonal and meridional climatological wind speeds, respectively, |u| is the climatological mean wind speed, and ψ′ is the streamfunction anomaly.
Variability in the ST, and perhaps to a lesser extent in the SIT, is directly related to the SMB, which can be expressed as
where P is the precipitation rate (mostly snowfall), Qsfc is the surface evaporation/sublimation rate, M is the surface melt and runoff rate, Qsnow is the blowing snow sublimation rate, and D is the blowing snow divergence rate term, all with units of mm w.e. h−1. Blowing snow refers to unconsolidated snow moved horizontally across the ice surface by winds above a certain threshold speed (Massom et al., 2001). As detailed in Francis et al. (2023), the P and M terms are directly extracted from ERA-5, for which the reanalysis values are in close agreement with satellite-derived estimates over Antarctica, while the remaining three (Qsfc, Qsnow, and D) are calculated using parameterization schemes described in Supplement Sect. S4. The hourly PWRF output is also used to estimate the SMB for the 11–16 July 2022 case study, with M given by the decrease in ST when the air temperature is above freezing after accounting for the other processes. Positive values of SMB indicate an accumulation of snowfall at the site, while negative values represent a reduction due to melting, sublimation, or wind erosion processes, or a combination of the three. It is also important to note that, following the convention of Dery and Yau (2002) adopted by Francis et al. (2023), positive values of Qsfc indicate deposition, while negative values indicate sublimation. For Qsnow, on the other hand, positive values indicate sublimation and negative values indicate deposition.
Foehn effects, which play an important role in the SMB (e.g., Kuipers Munneke et al., 2017; Francis et al., 2023), are identified using the methodology proposed by Francis et al. (2023). If, at a given grid point and hourly timestamp, the 2 m temperature exceeds its 60th percentile, the 2 m relative humidity drops below its 30th percentile, and the 10 m wind speed exceeds its 60th percentile, Foehn effects occur. The percentiles are grid-point dependent and are extracted for the period 1979–2021. Monthly hourly thresholds are used for the 2 m temperature to account for the annual cycle, while for the relative humidity and wind speed, they are extracted for the full period.
In Fig. 3a–b, the derived values of ST and SIT from 8 July to 30 November 2022 at the Khalifa SIMBA site on fast ice off Mawson Station are plotted. The uncertainty, which is estimated to be 7 % for ST and 2 % for SIT (Liao et al., 2018), is highlighted by the blue shading. The SIT exhibits a gradual increase starting on 8 July, peaking at 1.14–1.16 m from 19 to 24 October, followed by a steady decline to 0.06–0.10 m at the end of November. These values are comparable to those estimated for this region and time of year using satellite-derived products, which are typically in the range 0.50–1.50 m (Kacimi and Kwok, 2020). The ST on top of the ice, on the other hand, exhibits pronounced day-to-day variations as high as 0.08 m, peaking in mid-August to early September and with values not exceeding 0.10 m from mid-September to the end of November. These values are also in the range of those derived from satellite altimeter data for that coastal region (Kacimi and Kwok, 2020).
In order to explore whether atmospheric forcing could have played a role in the observed variability in SIT and ST, the local SMB is estimated around the Khalifa SIMBA site on fast ice off Mawson Station using ERA-5 data (Fig. 3c–d). An analysis of Figs. 2 and 3 reveals that the SIT appears to be mostly driven by the growth (increase in SIT) and melting (decrease in SIT) at the ice bottom, which, on top of the oceanic heat flux (Heil et al., 1996; Haas, 2017), depend on the conductive heat flux driven by the atmospheric forcing. The annual SIT decrease that initiates in late October coincides with the time when the air temperature climbs above 265 K (Figs. 2a, 3e) and there is increased solar insolation (note the strong diurnal variation in air temperature in Fig. 3e) at the site. On the other hand, a comparison of the ST observations and the SMB estimated from ERA-5 (Eq. 3) reveals a good correspondence between the two (cf. Fig. 3b with Fig. 3c–d). In particular, instances of positive SMB values (based on ERA-5) are typically associated with and followed by an increase in the measured ST at the site (e.g., in early July, mid-August, early and mid-October, and mid-November), while negative SMB values from ERA-5 are accompanied by a decrease in the observed ST (e.g., in late July–early August and in late September–early October). Besides precipitation (snowfall) events, which can lead to an increase in ST by up to 0.06 m, Foehn effects also modulate the ST. These correspond to episodes when the wind direction is offshore (typically southerly to southeasterly), with an increase in wind speed and air temperature and a decrease in relative humidity. Foehn timestamps, identified following the methodology proposed by Francis et al. (2023) described in Sect. 2.4, are shaded in purple in Fig. 3d. Several of these occurrences are seen during the study period, such as in mid-July, early August, mid-September, and late October, leading to a reduction in ST of up to 0.08 m in a day (cf. Fig. 3b–f). This is not surprising, as the Khalifa SIMBA site on fast ice off Mawson Station is exposed to katabatic winds flowing seaward off the interior plateau (Dare and Budd, 2001), which experience adiabatic compression as they descend toward coastal areas. If the air temperature, relative humidity, and wind speed meet the criteria detailed in Sect. 2.4, Foehn effects occur. Blowing snow, albeit less frequently, also affects the variability of ST; e.g., at the beginning of August, there is a 0.08 m decrease in ST during a blowing snow sublimation episode (Qsnow reaches 0.25 mm w.e. h−1) followed by a Foehn event (Fig. 3b–f). Blowing snow divergence, D, on the other hand, plays a much-reduced role in the SMB, having a larger magnitude during the passage of the AR on 14 July that brought wind speeds in excess of 30 m s−1 (Fig. 3b–f). Surface melting is unlikely to be a major driver of ST, as evidenced by the zero values of M during the measurement period (Fig. 3d). This is because during July–November 2022, the surface and air temperatures at the site remained below freezing (Figs. 2a and 3e).
Figure 3g–l is a zoom-in plot during 11–16 July, when an AR impacted the site. The 0.02 m variations in SIT during 15–16 July, Fig. 3g, are within the uncertainty range and hence can be ascribed to the uncertainties in the methodology used for its estimation. The changes in ST, Fig. 3h, on the other hand, can be linked to atmospheric forcing (cf. Fig. 3i–j). On 14 July, heavy precipitation (> 2 mm w.e. h−1) and strong easterly to southeasterly winds (> 30 m s−1) occurred in association with the AR, with a steady increase in air temperature from around 245 K on 13 July to 256 K at the beginning of 15 July (Fig. 3k–l). On the following day, Foehn effects occurred, Fig. 3j, in line with the decrease in relative humidity from ∼ 83 % to 60 %, the increase in wind speed from 12 to 28 m s−1 with a shift from an easterly (96°) to a southeasterly (156°) direction, and a further 4 K increase in air temperature, Fig. 3k–l. The negative Qsfc, which indicates surface sublimation, plays a major role in the SMB during Foehn periods, Fig. 3i–j, in line with Francis et al. (2023). The 0.02 m drop in ST from 15 to 16 July, Fig. 3h, can be attributed to Foehn effects, while the absence of an increase in ST during the AR may be explained by the strong winds (Fig. 3l) that blow the snow away and prevent it from accumulating at the instrument's location (note the positive blowing snow divergence, D, during the precipitation event, Fig. 3j). In fact, it has been reported that strong katabatic winds have blown the snow away as quickly as it falls on nearshore fast ice near Mawson (Dare and Budd, 2001) and Syowa (Kawamura et al., 1995) stations, resulting in very low accumulation close to the coast. ERA-5 predicts some precipitation on 16 July, Fig. 3i, even though at much reduced levels compared to 14 July. However, the fact that the wind speed is much lower on this day, dropping below 2 m s−1 (Fig. 3l), allows for snow accumulation at the Khalifa SIMBA site on fast ice off Mawson Station, which contributes to the observed 0.04 m increase in ST. It is important to note that a longer measurement period that comprises multiple AR passages would be needed for a robust link between ARs and their effects on ST and SIT to be established.
Figure 4a gives the Pook Blocking Index (Pook et al., 2013), defined in Eq. (S6), for the study period. It reveals a few blocking events east of the site around 120° E in late July–early August, 150° E in mid-September, and around the Dateline in mid- to late November. Zoomed-in plots around the time of the Mawson AR passage highlight the occurrence of blocking around the Dateline and 60° W (Fig. 4d). The latter actually coincided with the passage of three consecutive ARs west of the Antarctic Peninsula (Fig. 4f), with the air temperature climbing above freezing (Fig. 4e). Wille et al. (2024c) and Maclennan et al. (2023) stressed that the occurrence of blocking can lead to the development of an “AR family” (or multi-AR) event, with the counterclockwise flow around the high pressure and subsequent poleward advection of warm and moist low-latitude air masses leading to a marked rise in temperature. This is evident in particular around 120° E in late July–early August and mid-September and around 150° E in late November (Fig. 4a–c). At the Khalifa SIMBA site on fast ice off Mawson Station, on the other hand, blocking did not occur, as evidenced by the small values of the Pook Blocking Index (Fig. 4a). During the case study in mid-July (Fig. 4d–f), the presence of a ridge east of Mawson led to a second warm and moist air intrusion around 70–90° E on 16 July. The passage of the AR at Mawson on 14 July coincided with an increase in air temperature by more than 15 K in a couple of days (Fig. 4e), consistent with the observed rise in air temperature of ∼ 18 K at the site (Fig. 2a).
The results in Fig. 4 highlight the role of atmospheric dynamics in modulating the ST at the Khalifa SIMBA site on fast ice off Mawson Station, with the SIT largely controlled by the oceanic and conductive heat flux and the seasonal variability in the incoming solar radiation.
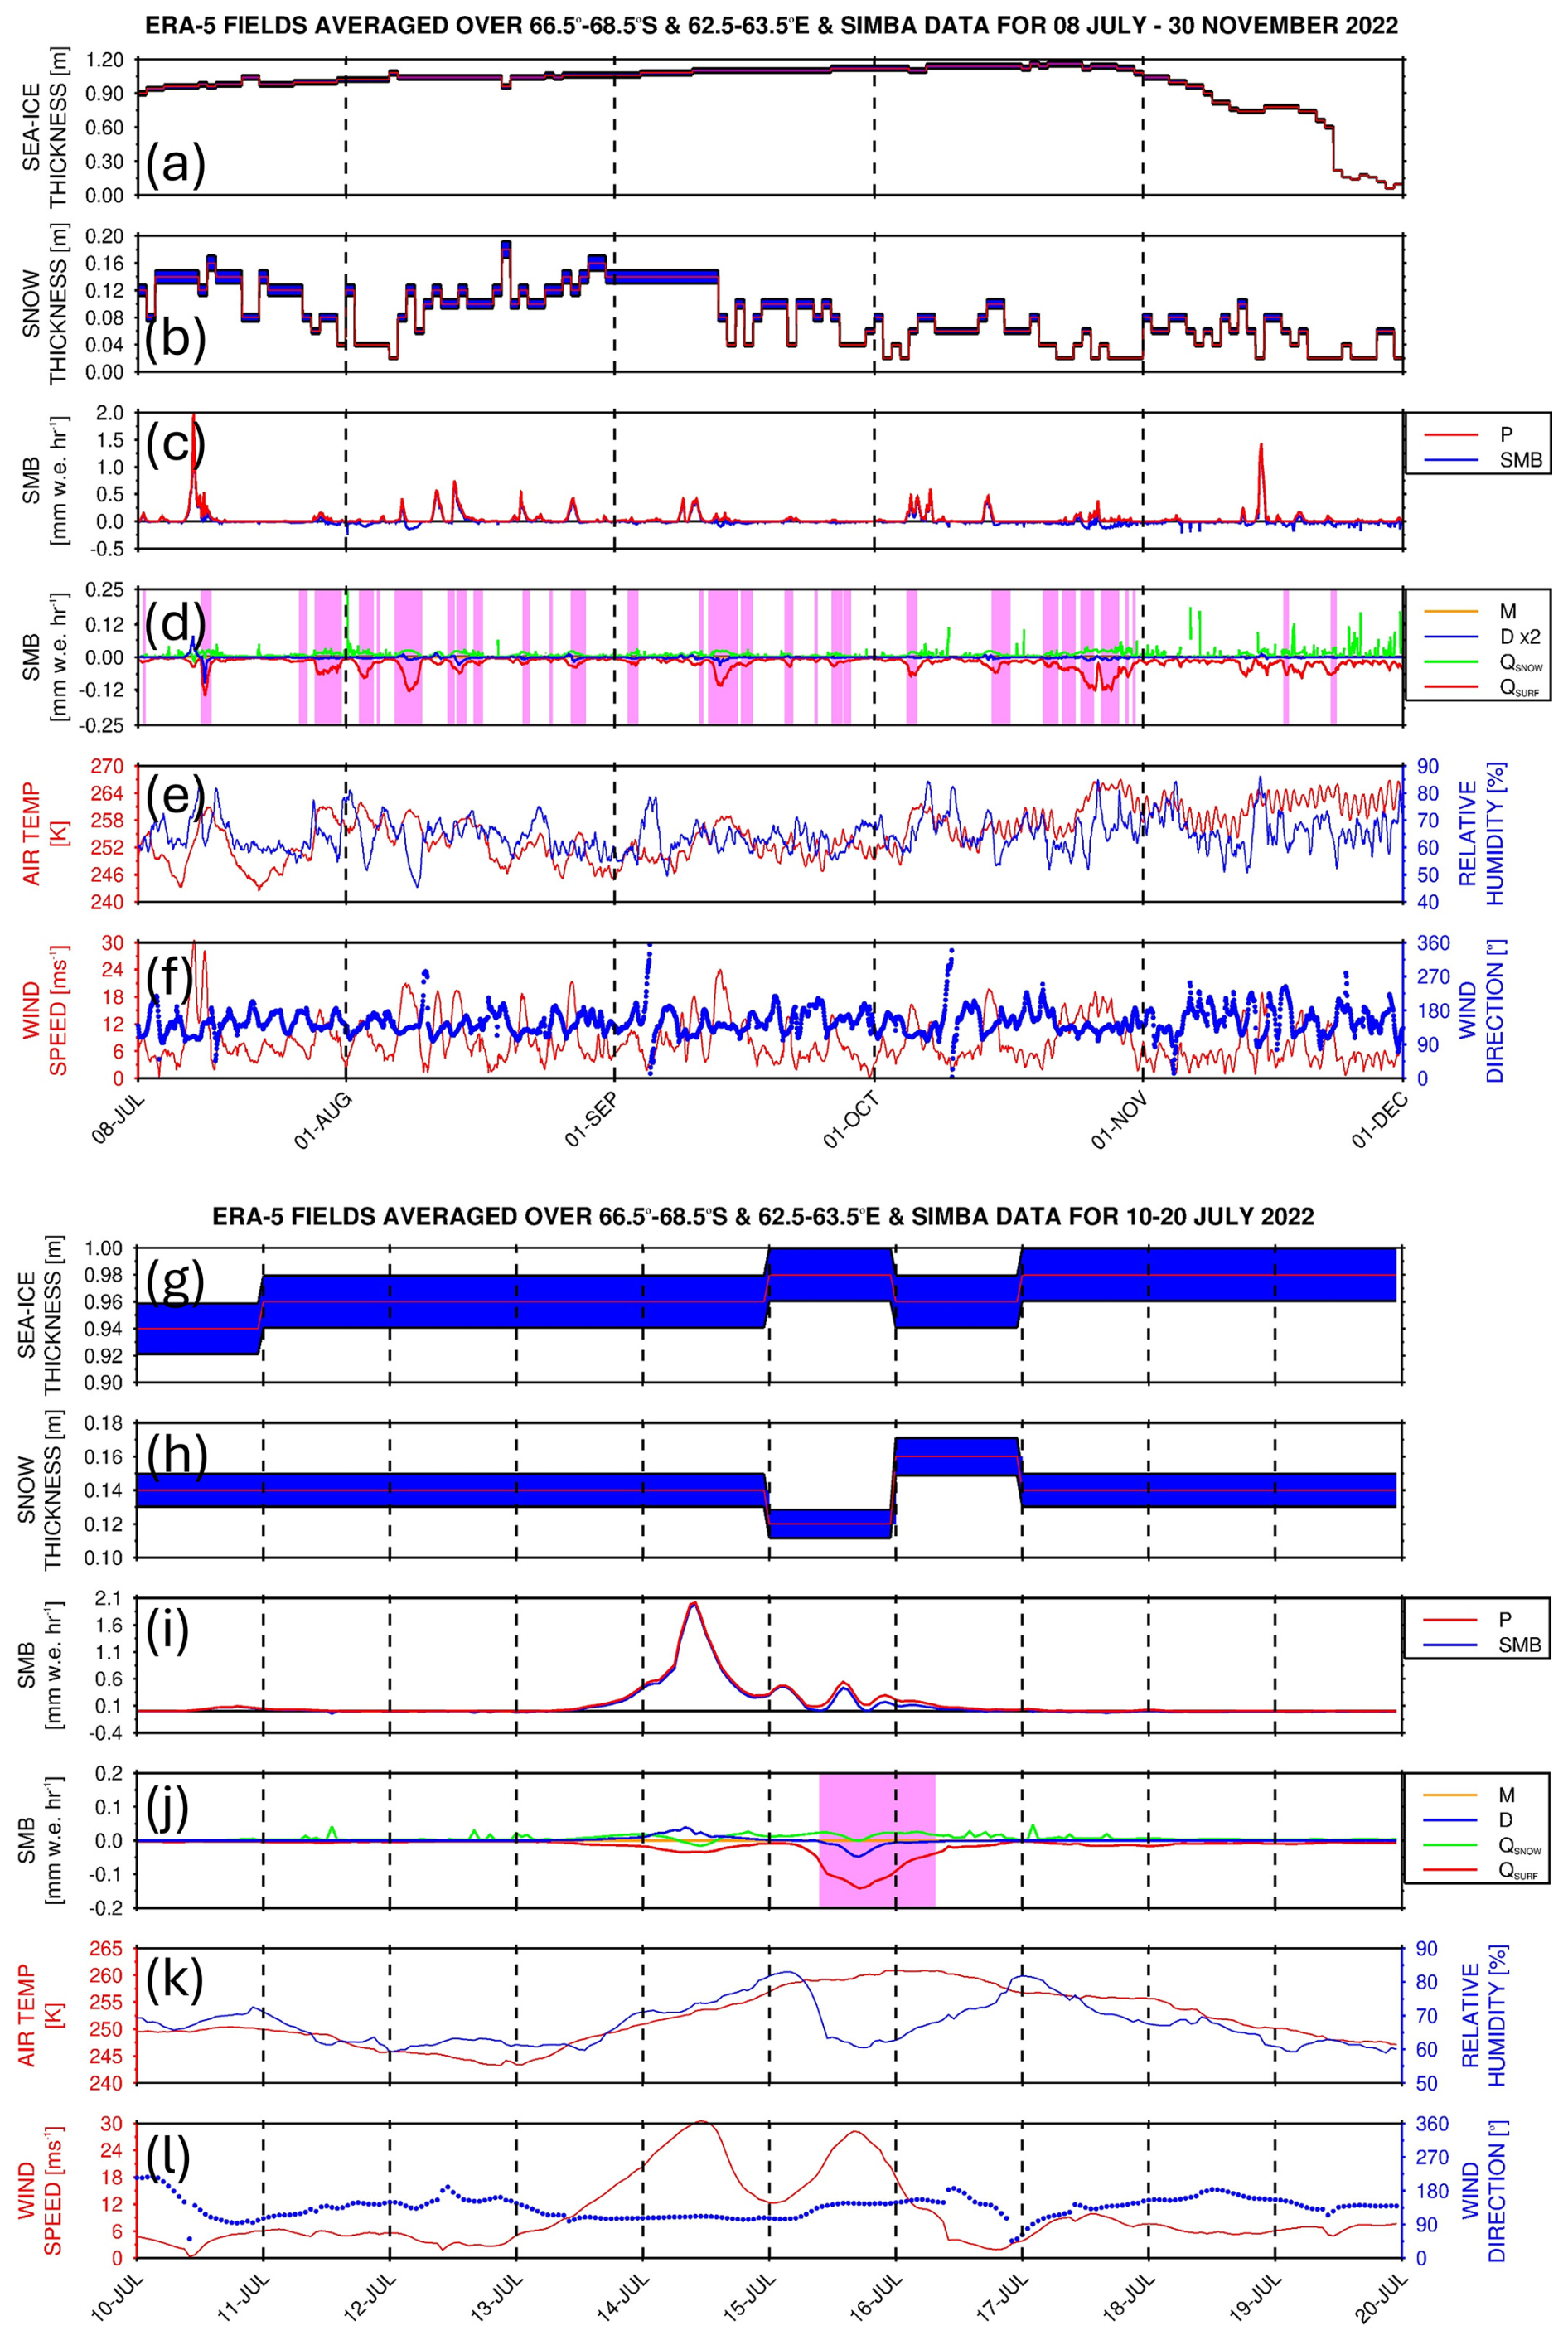
Figure 3Surface mass balance and SIMBA observations: (a) ST and (b) SIT from the SIMBA measurements for the period 8 July to 30 November 2022. The red line shows the observed values, while the blue shading gives the uncertainty, which is estimated as 7 % for ST and 2 % for SIT (Liao et al., 2018). (c)–(d) show the hourly SMB terms (mm w.e. h−1) from ERA-5 averaged over the domain 66.5–68.5° S and 62.5–63.5° E. Shown are the SMB (blue) and precipitation (red; P) in (c) and the snowmelt (orange; M), surface sublimation (red; Qsfc), blowing snow sublimation (green; Qsnow), and blowing snow divergence (blue; D) in (d). No snowmelt occurred during the measurement period, and the D term is multiplied by two for visualization purposes. The purple shading in (d) highlights hourly timestamps when Foehn effects occurred anywhere in the domain. (e)–(f) show the reanalysis' domain averaged hourly air temperature (red; K) and relative humidity (blue; %) in (e), and horizontal wind speed (red; m s−1) and direction (blue; °) in (f). (g)–(l) are the same as (a)–(f) but for 10–20 July 2022. No scaling is applied to the D term in (j).
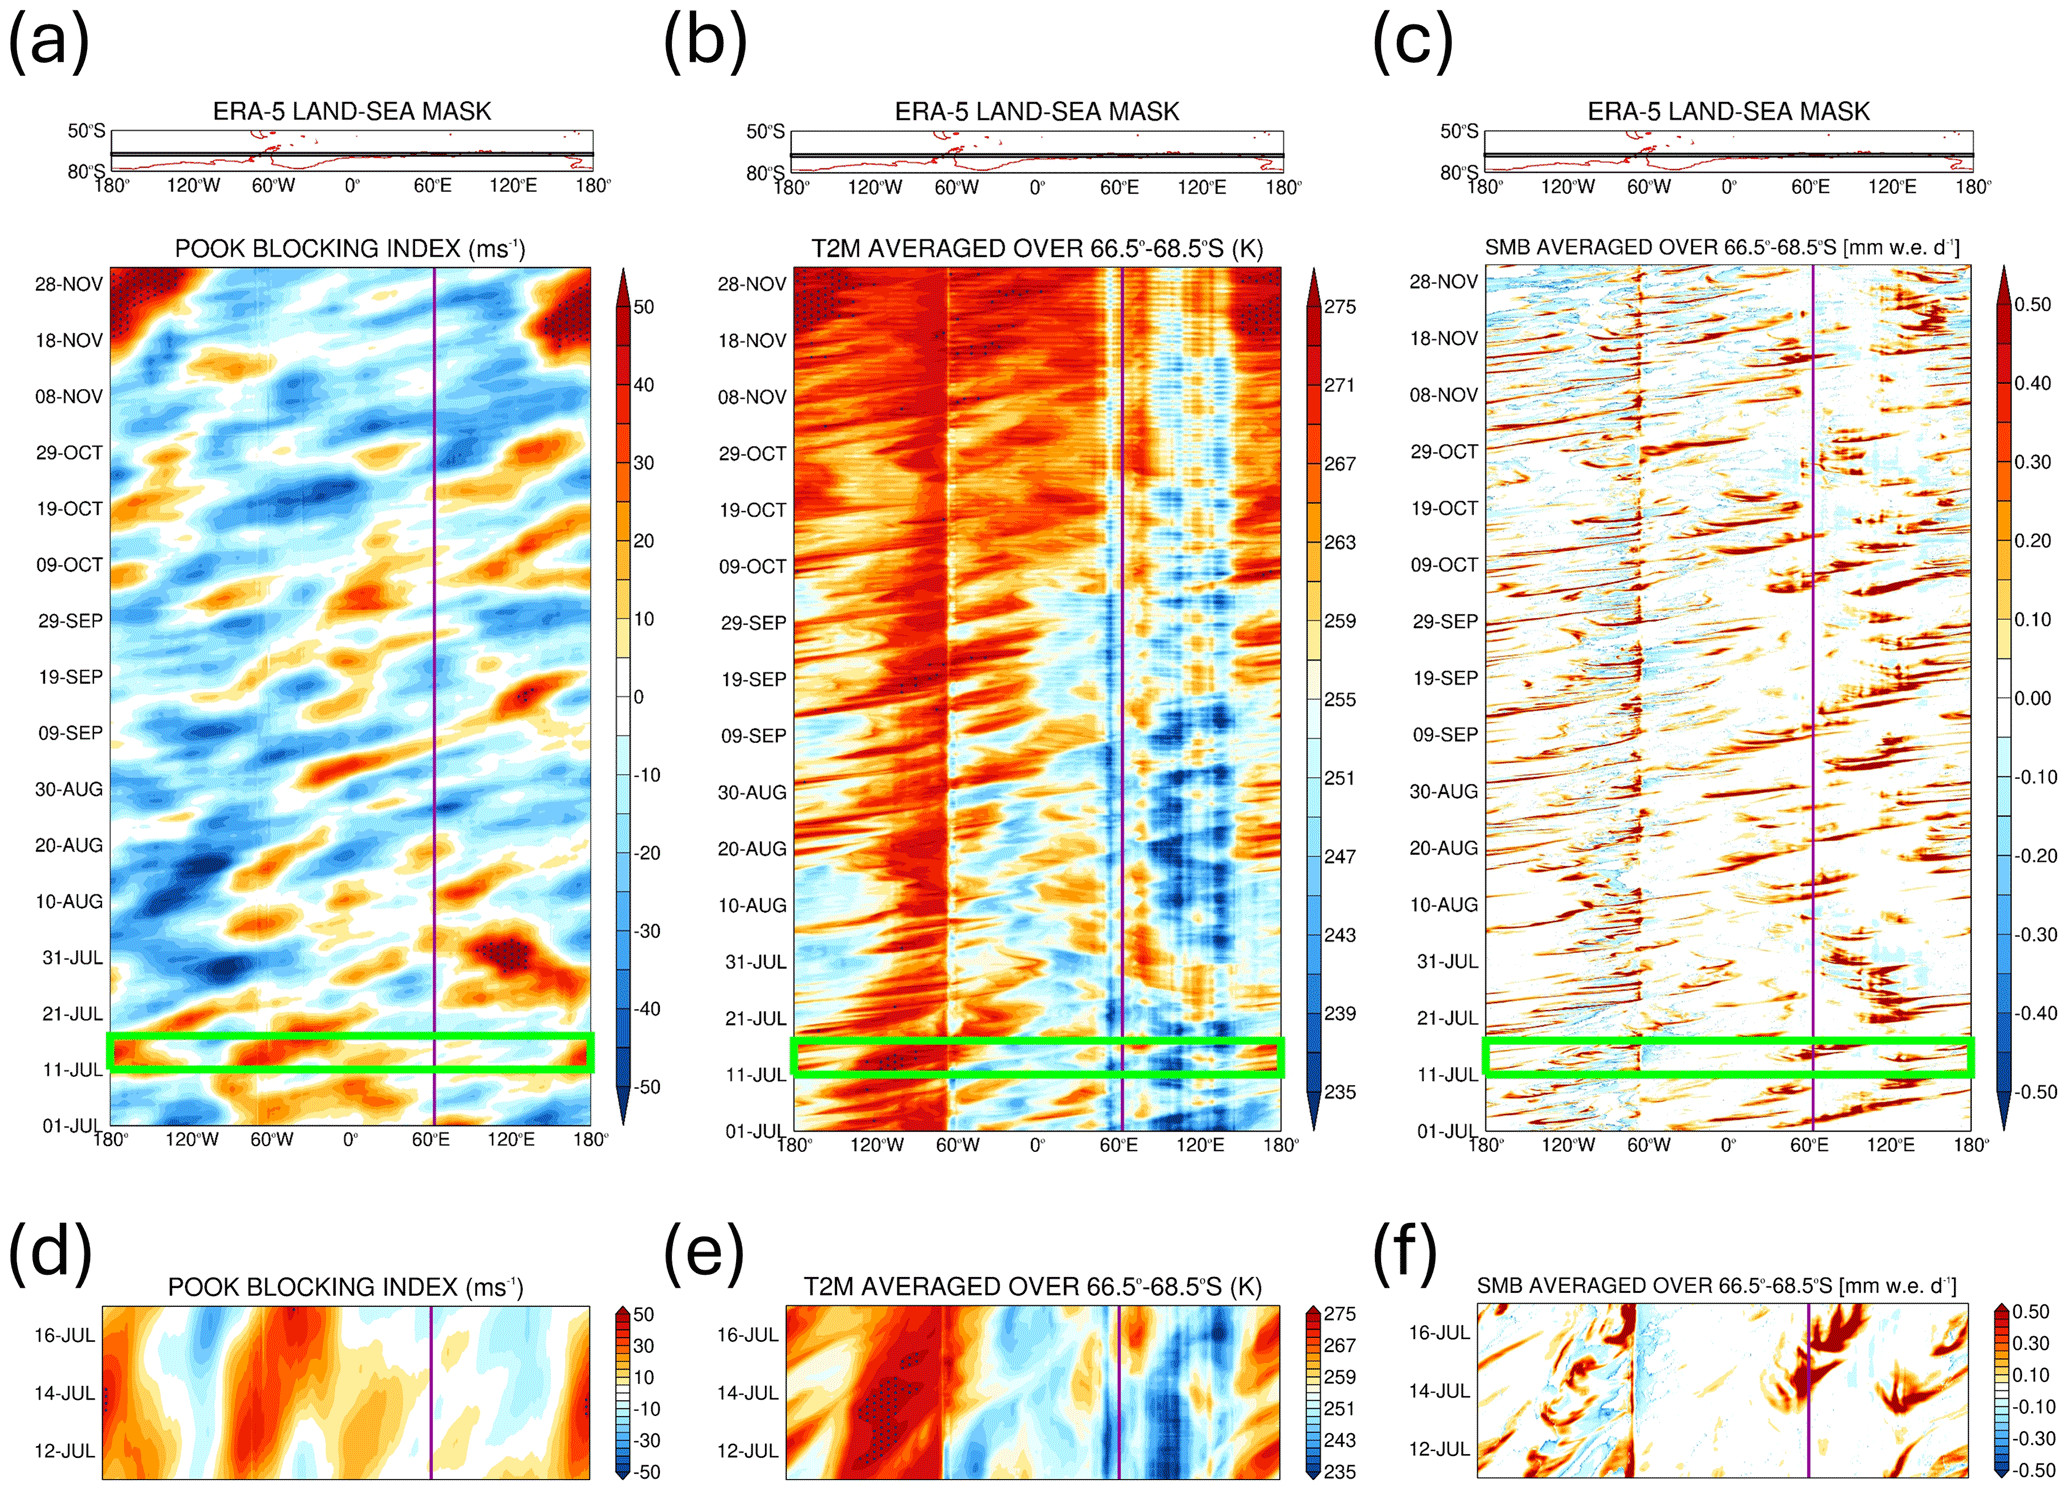
Figure 4Atmospheric dynamics and thermodynamics during the observational period: (a) Pook blocking index (m s−1) for July–November 2022. The vertical purple line shows the approximate longitude of the measuring site. Regions where the index exceeds 40 m s−1, an indication of a high degree of blocking, are stippled. The green rectangles indicate the period when an AR impacted the site from 11 to 16 July. Above the Hovmöller plot, the land–sea mask as seen by ERA-5 is plotted in red, and the averaging region is highlighted with a black rectangle. (b) and (c) are the same as (a) but for air temperature (K) and the SMB, defined in Eq. (3), respectively, averaged over 68.5–66.5° S. The sharp transition in the temperature field around 60° W arises from the presence of the Antarctic Peninsula (landmass), while the stipple in (b) indicates regions and times when the temperature is above freezing (273.15 K). (d)–(f) are the same as (a)–(c) but zoomed in for 11–16 July 2022.
An AR impacted the site on 14 July during the period July–November 2022. In Sect. 4.1, the large- and regional-scale environment that promoted the development of the AR is investigated, while in Sect. 4.2, the results of the PWRF simulations are discussed.
4.1 Large-scale atmospheric patterns
The period 10–19 July 2022 is characterized by a strong wavenumber 3 pattern along the Southern Hemisphere polar jet at about 60° S and a wavenumber 5 pattern along the subtropical jet at about 30° S (Fig. 5a), projecting onto the positive phase of Southern Annular Mode (SAM; Marshall, 2003) (Fig. 5b). The stationary wave activity flux vectors in Fig. 5a show little wave propagation from the tropics into the Southern Hemisphere mid-latitudes, with a prevailing zonal propagation within the wavenumber #5 pattern. This is also evidenced by the strong westerly flow around Antarctica (Fig. 5d). One of the reasons for the positive SAM is the La Niña that was taking place at the time, the third consecutive La Niña year after the 2018–2019 El Niño (NOAA/NWS, 2024), as La Niña events typically project onto the positive SAM pattern (Fogt et al., 2011).
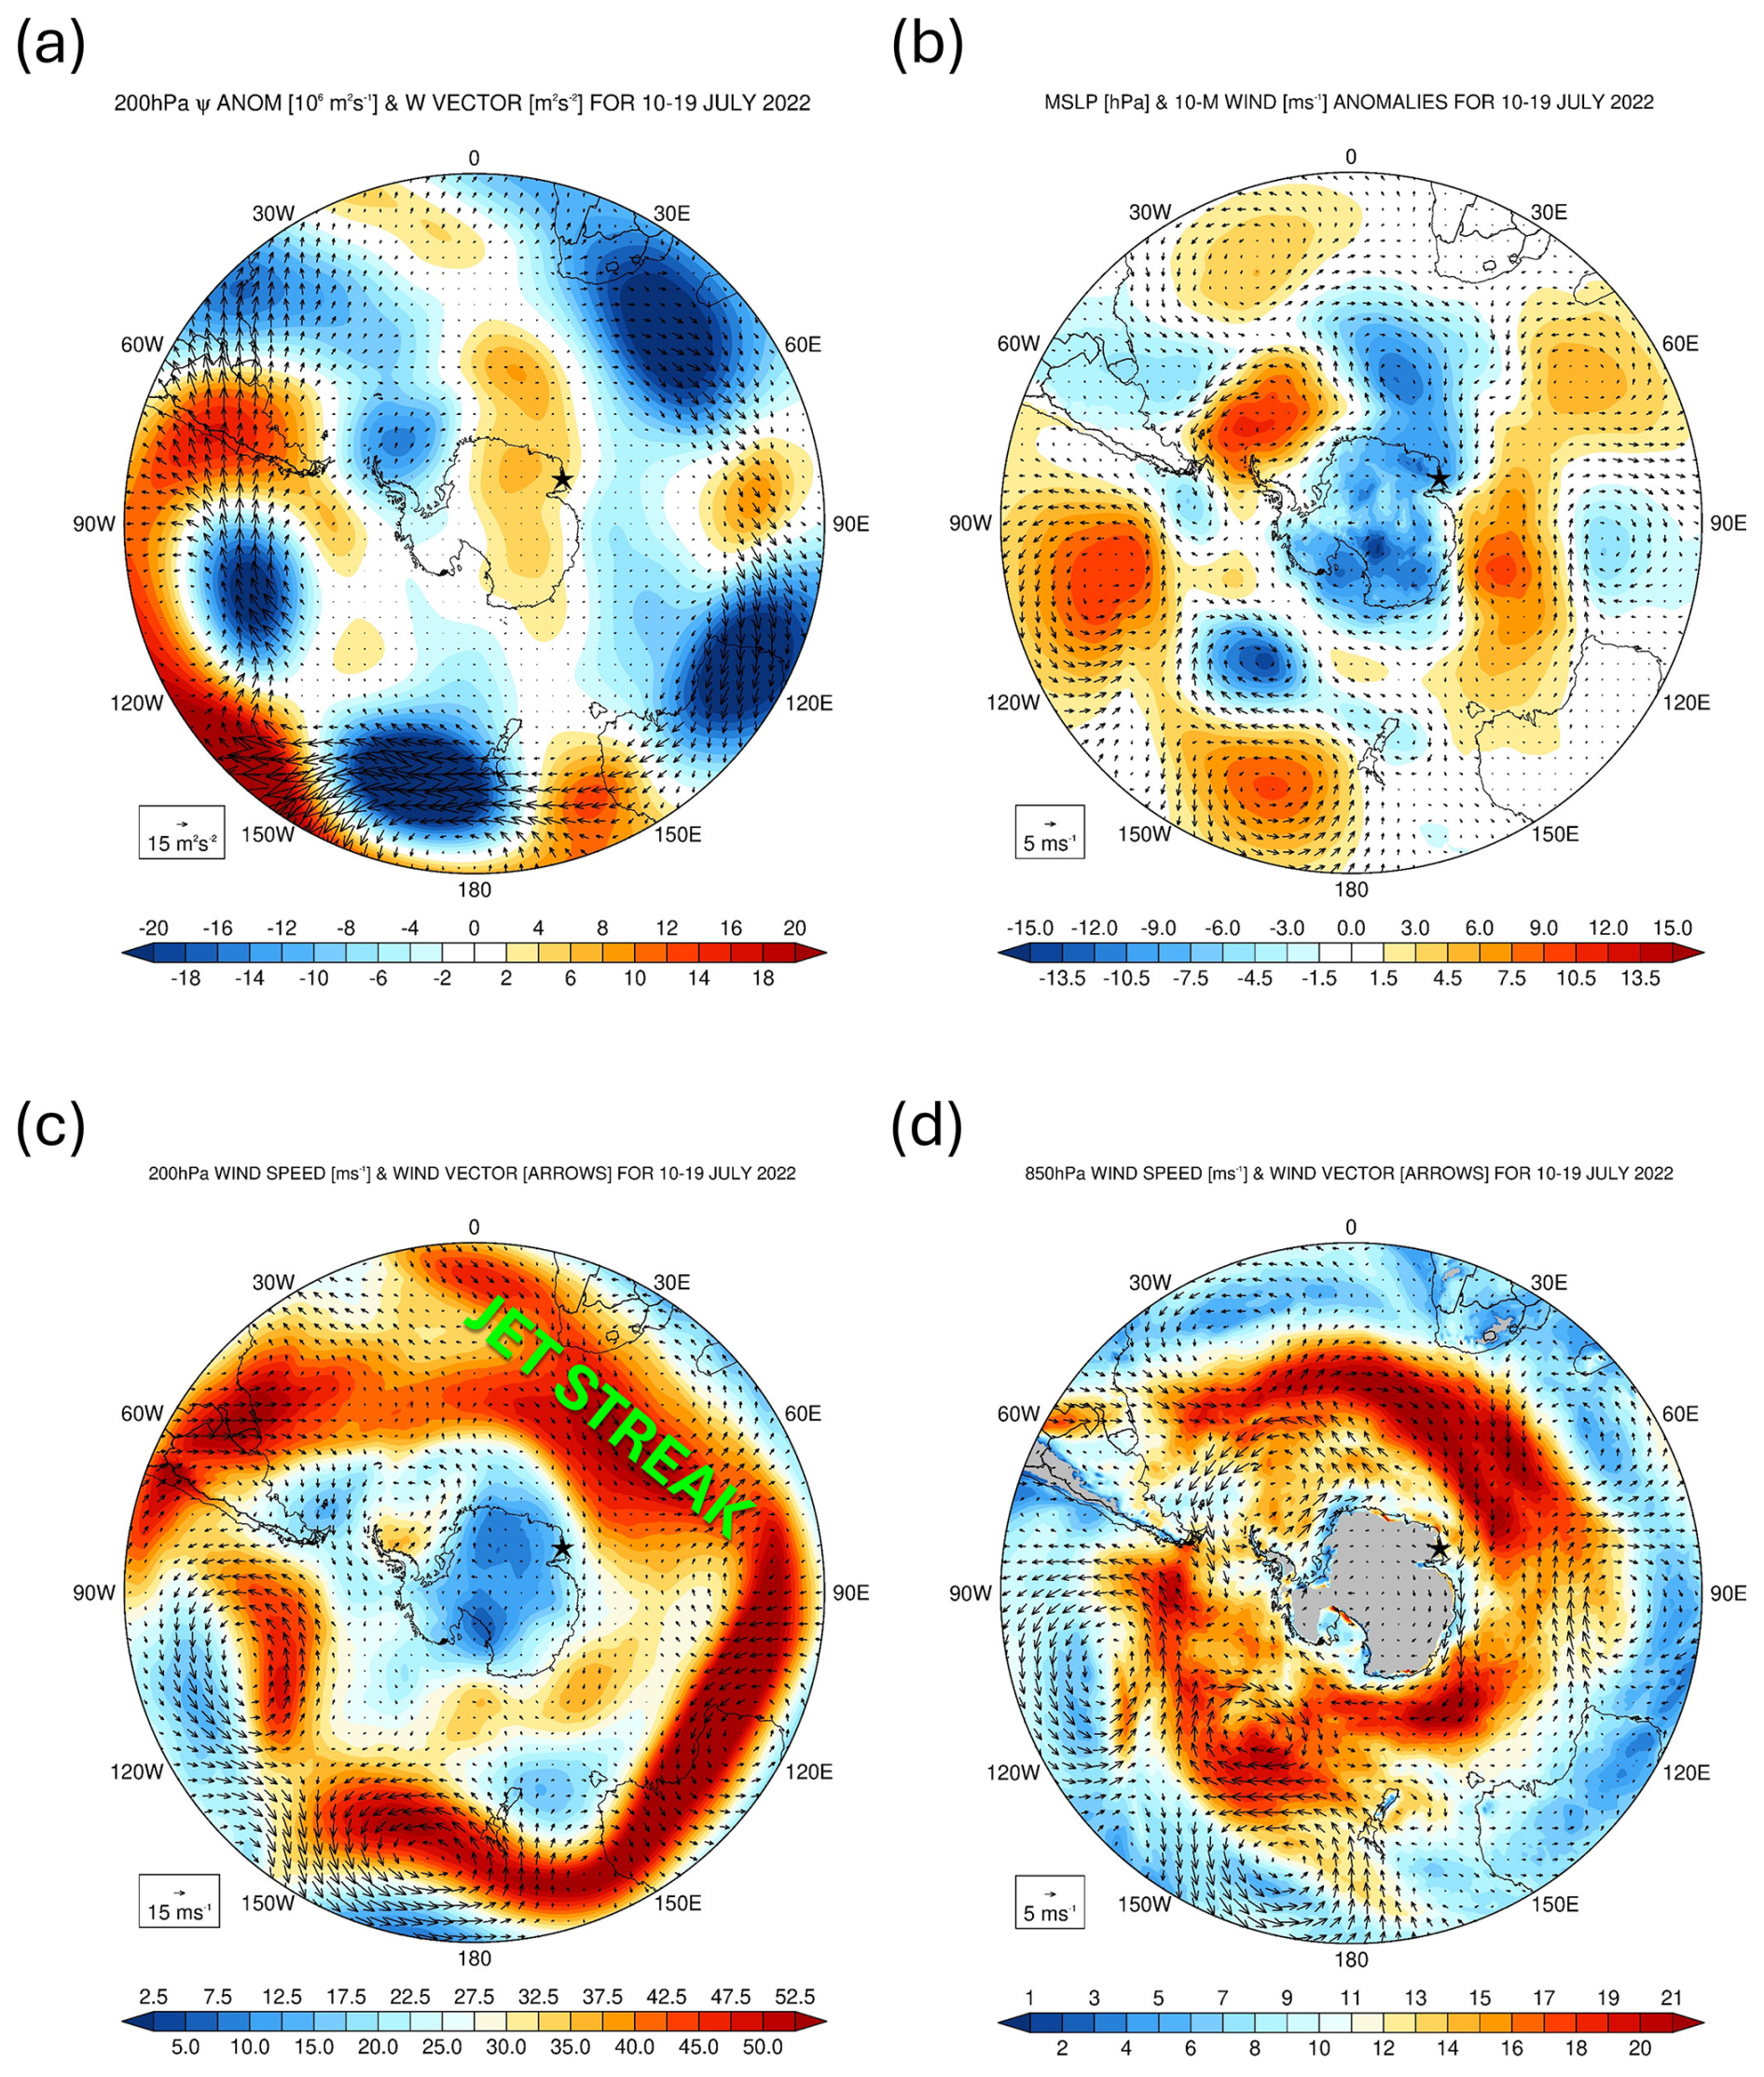
Figure 5Large-scale circulation during 10–19 July 2022: (a) 200 hPa streamfunction anomalies (shading; 106 m2 s−1), with respect to the hourly 1979–2021 climatology, and stationary W vectors (Takaya and Nakamura, 2001; Eqs. (2a) and (2b); arrows; m2 s−2) averaged over 10–19 July 2022. (b) Sea-level pressure (shading; hPa) and 10 m wind vector (arrows; m s−1) anomalies for the same period. (c) and (d) show the 200 and 850 hPa wind speed (shading; m s−1) and vectors (arrows) averaged over the same period. The jet streak referred to in the text is highlighted in (c). In all panels, the star shows the location of Mawson Station (67.5912° S, 62.8563° E).
North of Mawson Station, a pressure dipole is present around 40–65° S (Fig. 5b), with a ridge to the east and a trough to the west. This pattern favors the poleward propagation of warm and moist low-latitude air into the Khalifa SIMBA site on fast ice off Mawson Station in East Antarctica and is conducive to the development of ARs (Francis et al., 2022b; Gorodetskaya et al., 2023). The interaction between the subtropical jet and polar jet led to the development of a jet streak (Fig. 5c), a localized maximum in the strength of the flow. The low pressure associated with the AR (Fig. 5a) is located to the south of the jet entrance, in an area favorable for cyclogenesis (Wallace and Hobbs, 2006). Despite its slow eastward movement and anomalous high strength, the meridional extent of the ridge from East Antarctica to southeastern Madagascar may explain why it is not detected by the Pook Blocking Index, Fig. 4a and Eq. (S6), as the westerly flow at 35–40 and 65–70° S is also weaker. The AR that developed on 14 July 2022 is particularly remarkable, extending from the southwestern Indian Ocean into the Southern Ocean and East Antarctica and having its primary origin in South America (Fig. 6a–b). The wave train extending from South America to the southeastern Pacific Ocean comprises a ridge over southern parts of Chile and Argentina and a low over northern Argentina to the west of the South Atlantic subtropical high (Figs. S1b, d, and f). The pressure gradient between the latter two systems leads to a strengthening of the South American low-level jet (Marengo et al., 2004; Montini et al., 2019), which advects moisture from equatorial South America into the subtropics and helps to feed convection east of the Andes (Figs. S1a, c, and e). The moist outflow coming out of South America and the latent heat release from the convection strengthen the low pressure to the southwest of South Africa that is tracking southeastwards and promote the development of the AR that impacted the Khalifa SIMBA site on fast ice off Mawson Station on 14 July. After a first landfall on 14 July around Mawson Station, Fig. 6a, the AR made a second landfall around 75–90° E, Fig. 6b, impacting a wide swath of East Antarctica from about 45 to 100° E. Here, the air temperature anomalies generally exceeded 10 K, with some parts of East Antarctica having near-surface temperatures in the top 1 % of the 1979–2021 climatological distribution (Fig. 6d). The IVT at 06:00 UTC on 14 July exceeds 156 kg m−1 s−1 around the Khalifa SIMBA site on fast ice off Mawson Station and 800 kg m−1 s−1 further north along the AR (Fig. 6b), with the hourly IVT on this day being in the top 0.5 % of the climatological distribution (Fig. 6c), an attestation to the extreme nature of this event. A back-trajectory analysis performed with HYSPLIT forced with ERA-5 data revealed that tropical and subtropical moisture sources contributed to the 14 July 2022 AR (Fig. S2a). While at lower levels the moisture came from the Southern Ocean with specific humidity values generally below 2 g kg−1 and air temperatures generally below freezing, at 2250 m it originated in the subtropics just south of South Africa with specific humidity values in excess of 6 g kg−1 and air temperatures around 280–290 K (Fig. S2b–e). The latter air mass ascended from roughly 200 to 2250 m just north of Mawson Station when it encountered the colder and drier airflow (Fig. S2a). Several studies report on ARs impacting Antarctica being fed by subtropical moisture, such as the February 2011 (Terpstra et al., 2021) and the November–December 2018 (Gorodetskaya et al., 2020) ARs over East Antarctica and the February 2022 AR over the Antarctic Peninsula (Gorodetskaya et al., 2023).
The AR and attendant cyclone also had an important effect on the sea ice in the region. As seen in Fig. S3a–b, there was a considerable reduction in SIE from 12 to 16 July both around coastal Antarctica and upstream, with an open-ocean polynya developing well northwest of Mawson Station around 65° S, 45° E on 14 July and disappearing on 22 July. The role of ARs and the surface divergent flow associated with the attendant cyclone in opening up polynyas has been reported at multiple sites around Antarctica (Francis et al., 2019, 2020). The low-pressure system northwest of Mawson reached a minimum value of 944 hPa on 12 July over the Southern Ocean, with the secondary low that formed on 14 July reaching 933 hPa on this day at 06:00 UTC just off the Khalifa SIMBA site on fast ice off Mawson Station (Fig. 6a), and deepening further to 931 hPa late on 15 July just to the northeast of the site (Fig. 6b). These systems are stronger than those that played a role in the opening up of the Weddell Sea Polynya in September 1973 and 2017 (Francis et al., 2020) and the Maud Rise Polynya in September 2017 (Francis et al., 2019). The sea-ice vectors in Fig. S3c–d show an equatorward movement north of Mawson Station from 12 to 14 July (prior to the event) at speeds in excess of 40 km d−1 and a southward movement from 14 to 16 July (post event) at speeds in excess of 20 km d−1. These sea-ice drift velocities, which are associated with the changing wind field in response to the shift in the position of the mid-latitude weather systems in the region (Figs. 6a–b, d, and 7), are higher than those observed in the western Ross Sea in late April 2017 (Fonseca et al., 2023) and comparable to those estimated in the region in September 2017 (Francis et al., 2019).
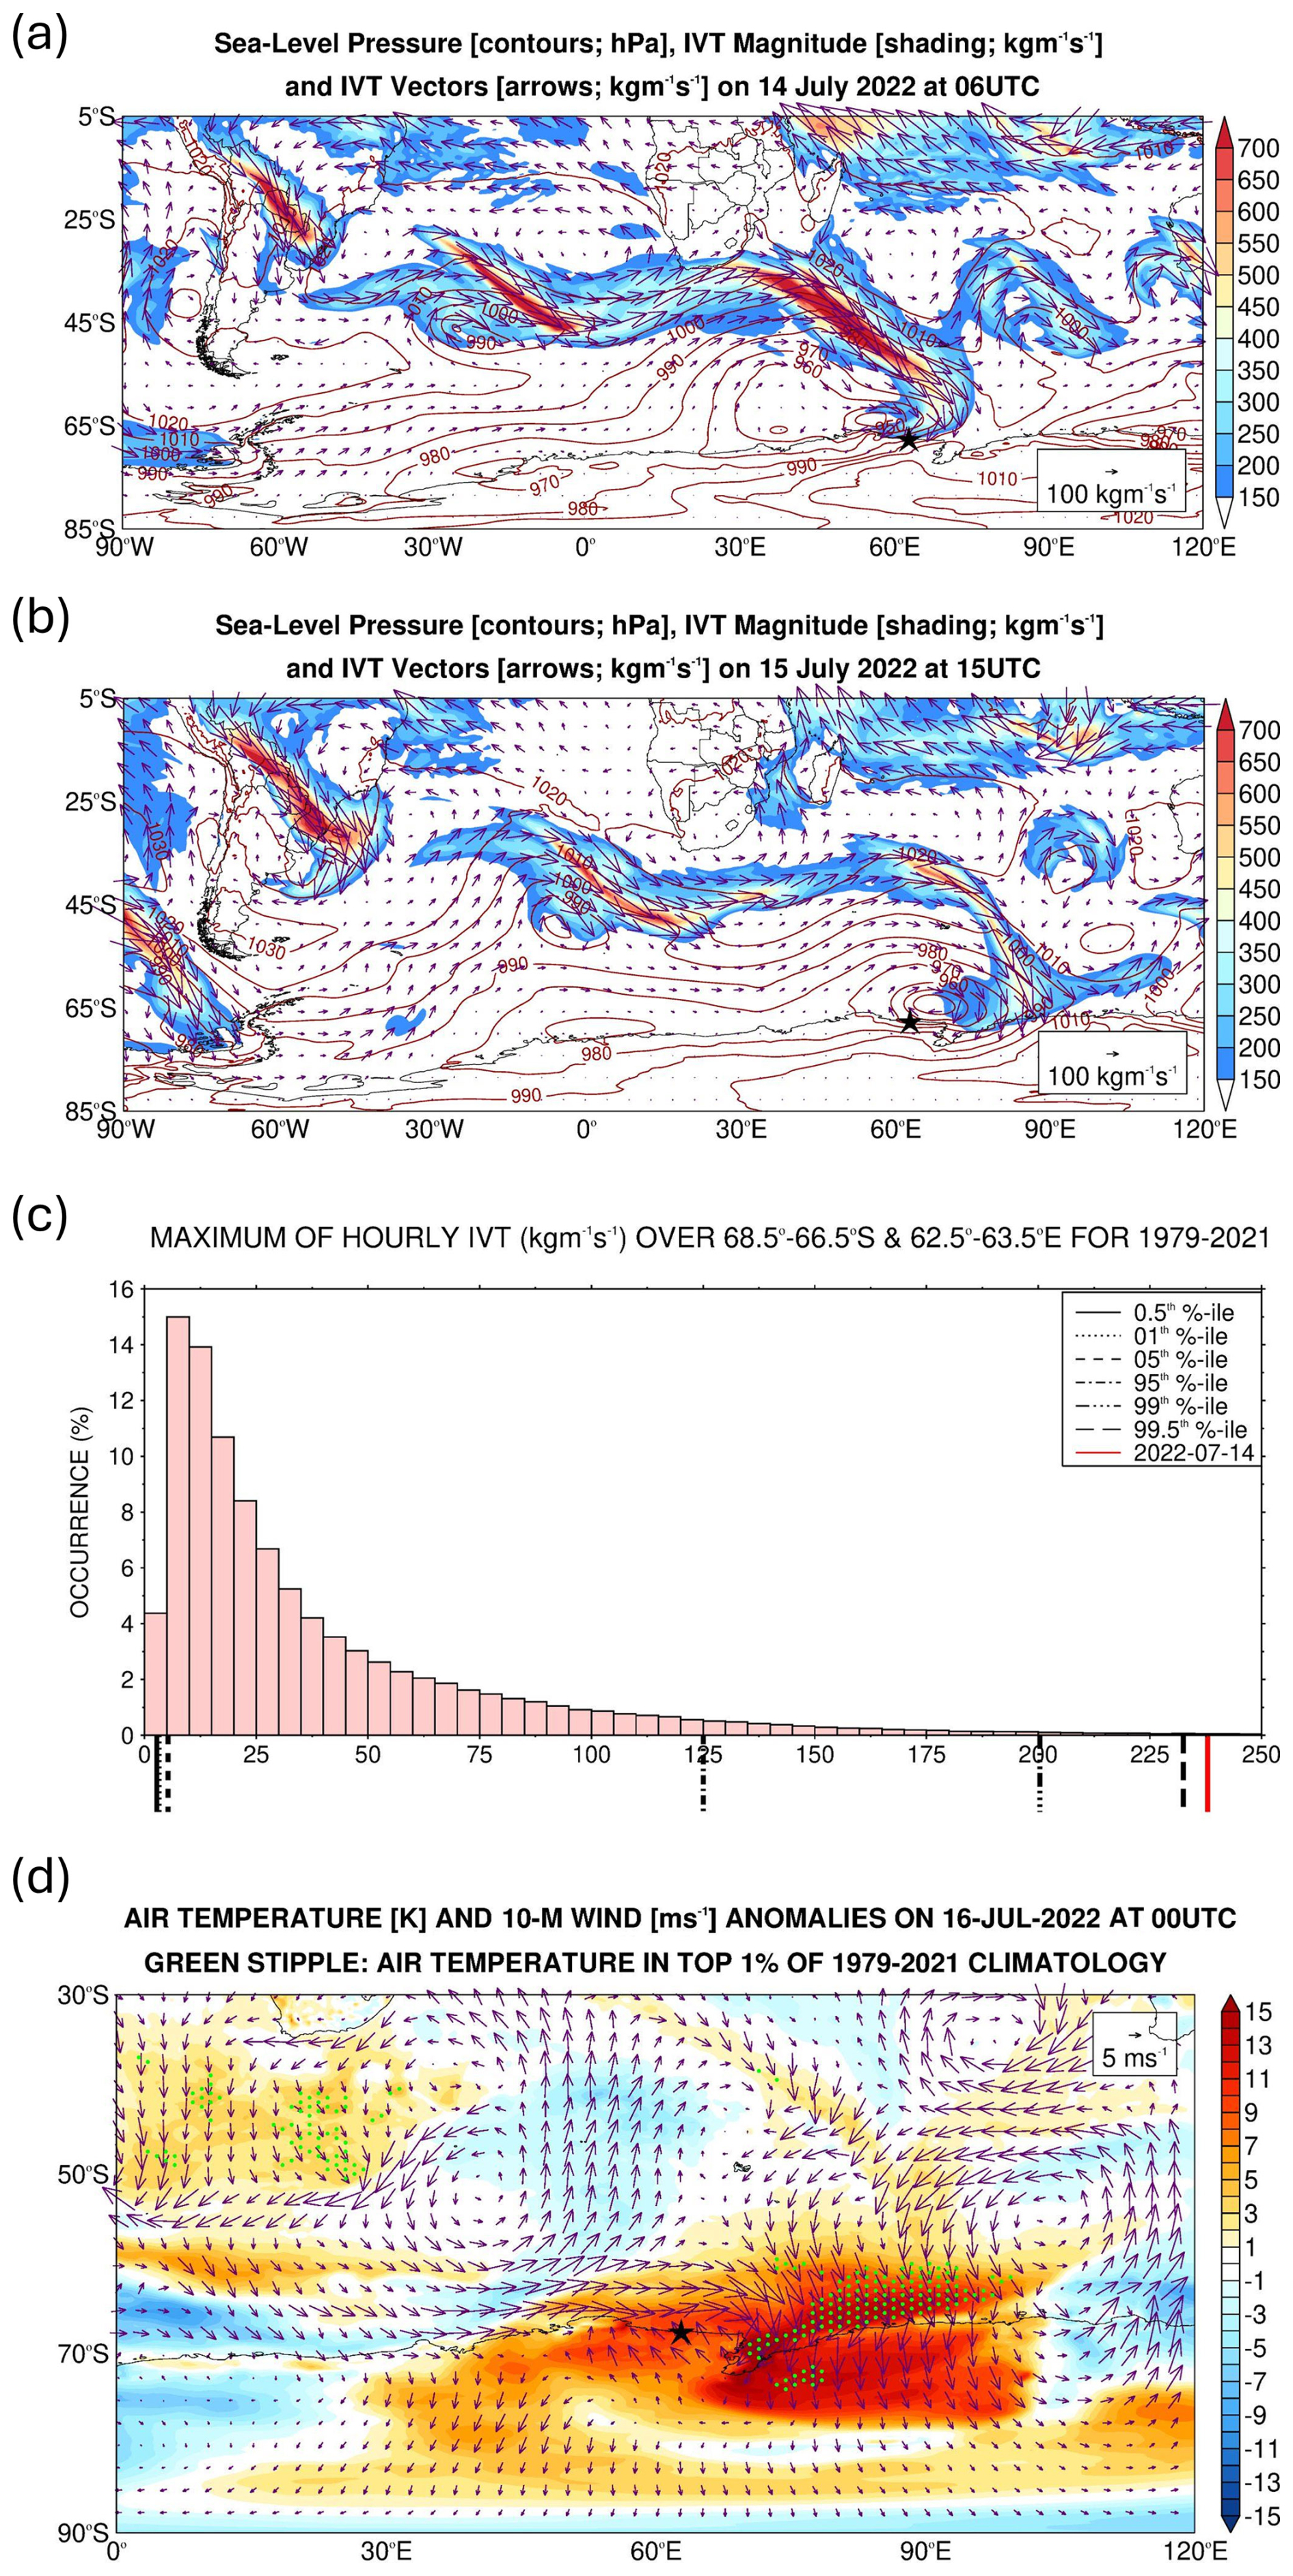
Figure 6Atmospheric river on 14 July 2022: (a) sea-level pressure (contours; every 10 hPa), integrated vapor transport (IVT) magnitude (shading; kg m−1 s−1), and IVT vectors (arrows; kg m−1 s−1) on (a) 14 July 2022 at 06:00 UTC and (b) 15 July 2022 at 15:00 UTC from ERA-5. The star shows the location of Mawson Station. (c) Histogram of the maximum hourly IVT around Mawson Station (68.5–66.5° S and 62.5–63.5° E) for 1979–2021. The solid, dotted, dashed, dotted-dashed, dashed-dotted-dotted, and long-dashed lines give the 0.5th, 1st, 5th, 95th, 99th, and 99.5th percentiles, respectively, while the red line indicates the maximum hourly values on 14 July 2022. (d) Air temperature (shading; K) and 10 m wind vector (arrows; m s−1) anomalies with respect to 1979–2021 climatology on 16 July 2022 at 00:00 UTC. The green stipple indicates regions where the air temperatures are in the top 1 % of the 1979–2021 climatological distribution.
Figures 5–6 provide a summary of the weather conditions during 10–19 July 2022, with Fig. 6 focusing on the AR event that impacted Mawson Station on 14 July. In order to gain insight into this AR event, it is important to assess the temporal evolution of the atmospheric circulation prior to and during the event itself. This is achieved in Fig. 7, which shows multiple fields from 13 July at 06:00 UTC to 15 July at 18:00 UTC. At 06:00 UTC on 13 July (Fig. 7a), a broad low-pressure system is centered northwest of the site, coincident with a TPV (highlighted in the figure), with a ridge to its east. The TPV helps the surface low to intensify, together with the jet streak at upper levels (Fig. 5c), with the central pressure dropping to around 944 hPa on 12 July at 12:00 UTC. The pressure dipole promotes the southward advection of a warmer and moist low-latitude air mass into the Southern Ocean, as noted by the hatching that highlights regions where the IVT exceeds 250 kg m−1 s−1. A secondary low, which develops later on 13 July (highlighted in Fig. 7c, also noted by the additional sea-level pressure contour), is not co-located with a TPV. Instead, the secondary low is driven by the interaction of the warm and moist air mass from the west and northwest around the low pressure with that from the northeast around the ridge. Closer to the Antarctic coast, the aforementioned low-level convergence is reinforced by the drier and colder katabatic flow blowing from the continent. The maximum Eady growth rate, a measure of baroclinicity (Hoskins and Valdes, 1990), at 850 hPa exceeded 3 d−1 on 14 July (not shown), indicating a highly baroclinic environment.
Figure 7b–d shows cyclonic Rossby wave breaking, with the secondary low exhibiting little eastward movement owing to the presence of a ridge to the east (Fig. 6a–b) and instead shifting southwards toward Antarctica. The incursion of the higher low-latitude potential temperature values into East Antarctica (Fig. 7b–d) is consistent with the warmer (Fig. 6d) and more moist (Fig. 6a–c) conditions in the region. The warm and moist air intrusion shifted eastwards from 14 to 15 July (Fig. 7c–d) and penetrated deeper into East Antarctica on 15–16 July (Figs. 7d and 6d), with air temperatures more than 15 K above climatology in some parts (Fig. 6d). Figure 7 shows more than one episode of intrusion of low-latitude air masses into Antarctica. For example, on 14–16 July, a warm and moist air intrusion reached the Antarctic Peninsula (Fig. 7c–d). Such occurrences are more common in an amplified pattern and can be aided by TPVs that act to strengthen the attendant cyclone (Wille et al., 2024c).
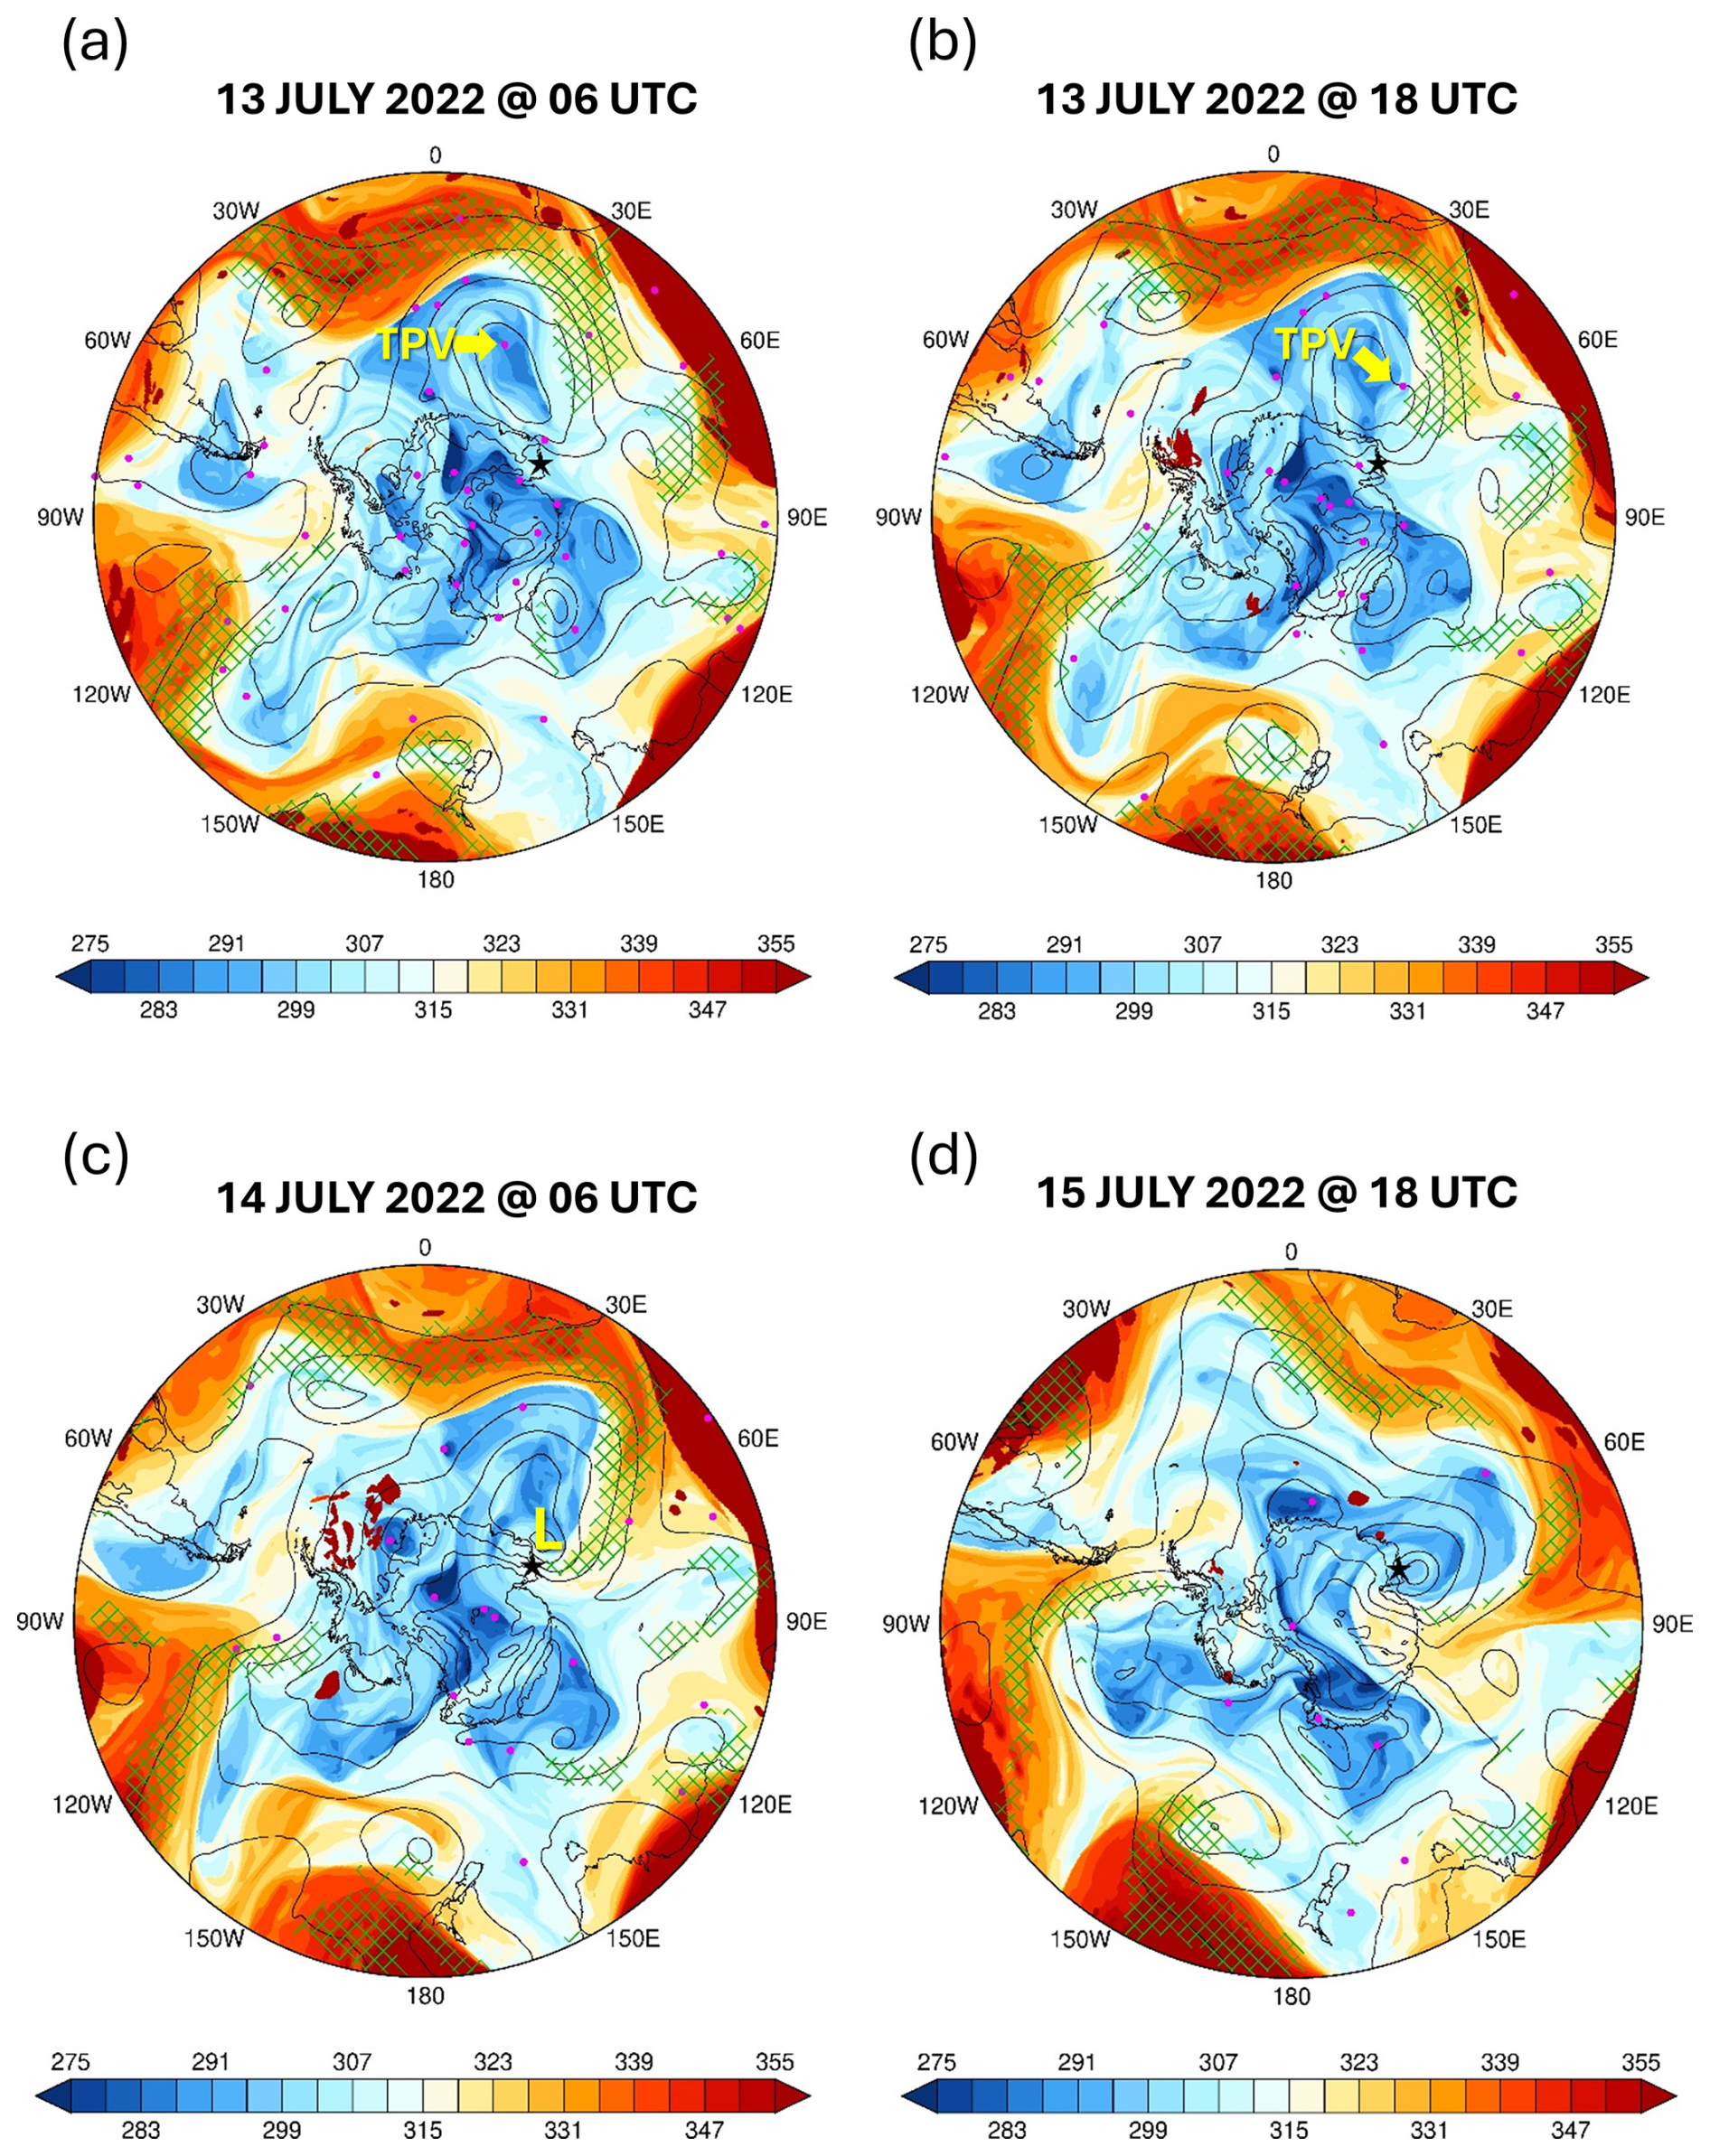
Figure 7Evolution of atmospheric state during 13–15 July 2022: potential temperature (θ; shading; K) on the dynamical tropopause (PV = −2 PVU), sea-level pressure (black contours; every 15 hPa starting at 900 hPa), and integrated vapor transport (IVT; hatching if > 250 kg m−1 s−1) on 13 July at (a) 06:00 UTC and (b) 18:00 UTC, (c) 14 July at 06:00 UTC, and (d) 15 July at 18:00 UTC. The purple dots indicate the location of tropopause polar vortices (TPVs) at the respective times. The TPV and the secondary low pressure discussed in the text are highlighted in panels (a)–(b) and (c), respectively.
4.2 PolarWRF simulation
In this subsection, the focus is on the modeling experiments. In Sect. 4.2.1, the PWRF predictions are evaluated against in situ measurements at the five stations in East Antarctica given in Fig. 1d, while in Sect. 4.2.2, the emphasis is on the additional insight that the higher-resolution model data provide on the mid-July 2022 AR event.
4.2.1 Evaluation of PolarWRF
The PWRF simulations for 11–16 July 2022 are evaluated against in situ meteorological observations at the Mawson, Syowa, Relay, Davis, and Casey stations, in addition to surface radiation fields at Syowa Station. Figure 8 shows the time series of hourly data for the Mawson and Syowa stations, with the corresponding time series for the other three stations given in Fig. S4. A quantitative assessment of the model performance for all stations and variables is presented in Table 3.
PWRF simulates the weather conditions well at the Mawson (Fig. 8a–f), Syowa (Figs. 8g–l and S4a–f), Relay (Fig. S4g–l), Davis (Fig. S4m–r), and Casey (Fig. S4s–x) stations for 11–16 July 2022. In particular, the observed variability in sea-level pressure is well replicated, with the model correctly capturing the time of passage and strength of the secondary cyclone on 14–15 July at Mawson (Figs. 7c–d, 8c) and on 15 July at the Davis (Figs. 7d, S4p) stations. Moreover, the warmer, more moist, and windier conditions on 12–14 July at Syowa Station (Fig. S4a–c and f), on 14–15 July at Mawson (Fig. 8a–c and e) and Relay (Fig. S4g–i and l) stations, and on 15–16 July at Davis (Fig. S4m–o and r) and Casey (Fig. S4s–u and x) stations are predicted by the model. Also, the model captures the increase in the downward long-wave radiation flux by up to 80 W m−2 at Syowa Station (Fig. 8k) in association with the warm and moist air intrusion on 13–14 July. An inspection of Table 3 reveals that, except mainly for the air temperature and surface pressure, the normalized bias μ is smaller than 0.5, indicating that the biases can be regarded as not significant, while the normalized error variance α does not exceed 1 for all fields and stations, except for the wind vector at the higher-elevation Relay and coastal Davis stations, indicating that the PWRF predictions can be regarded as reliable. The performance of PWRF for this event is comparable to that for the McMurdo Station in early January 2016 (Hines et al., 2019), West Antarctica in early to mid-January 2019 (Bromwich et al., 2022), and the Antarctic Peninsula in May–June 2019 and January 2020 (Matejka et al., 2021). This reflects the improvements made to PWRF by the model developers, with the aim of optimizing its performance and skill over Antarctica (e.g., Hines et al., 2021).
A closer inspection of Figs. 8 and S4 and Table 3 reveals some discrepancies in the PWRF predictions. For example, at Syowa Station, the model has a tendency to overpredict the air temperature by ∼ 1–3 K. This may explain the overestimation of the upward longwave radiation flux by about 14.3 W m−2 (Fig. 8l), which can also arise from an overprediction of the observed surface emissivity. The downward longwave radiation flux (Fig. 8k), on the other hand, is underestimated by roughly 7.7 W m−2, likely related to the reduced atmospheric moisture content in the model by about ∼ 0.16 g kg−1. At all four coastal Antarctic stations, the predicted wind direction is generally shifted clockwise by 45–90° compared to that observed (Figs. 8d, S4e, q, and w), with this mismatch at times reaching 180° at the Relay Station (Fig. S4k) located on the Antarctic plateau more than 3000 m above sea level (Fig. 1d). This discrepancy can be attributed to an incorrect representation of the surface topography, which exhibits a complex spatial heterogeneity in the region (Lea et al., 2024). Despite these issues, both the magnitude and variability of the observed wind speed are generally well represented by PWRF (Figs. 8e, S4f, l, r, and x). The more offshore wind direction at the coastal Antarctic stations reflects a stronger katabatic wind regime that acts to slow the poleward movement of the low-latitude air mass, which is consistent with the dry bias of up to 0.2 g kg−1. The positive mixing ratio bias at the Relay Station occurs primarily on 15–16 July (Fig. S4h) and is associated with increased but still rather low (generally below 0.1 g kg−1) moisture levels advected from the interior of Antarctica. At all stations except Mawson, PWRF exhibits a warm bias (Figs. 8a, g, S4g, m, and s), with the near-surface wind speed being underestimated at Mawson (Fig. 8e) and overestimated at the other stations (Figs. S4f, l, r, and x). Together with the dry bias, this suggests a tendency for excessive boundary layer mixing in the model compared to observations, which has been reported in a number of PWRF studies (e.g., Wille et al., 2016, 2017; Vignon et al., 2019). An optimized planetary boundary layer (PBL) scheme, which at least partially corrects for the excessive mixing and/or a more sophisticated land surface model that more accurately represents the boundary layer and surface processes, has to be considered to address the aforementioned biases. Despite this, PWRF captures the effects of the AR as seen in observations, most notably the increase in air temperature and water vapor mixing ratio and the strengthening of the near-surface wind, particularly at the more impacted Mawson (Fig. 8a–e) and Davis (Fig. S4m–r) stations.
The SMB analysis performed using ERA-5 data is repeated using the hourly PWRF predictions. Figs. S5a–b give the observed SIT and ST measurements, while Fig. S5c–d shows the different terms of the SMB as predicted by PWRF. The model gives a similar estimate of the components of the SMB with respect to the reanalysis dataset (cf. Figs. S5c–d with 3i–j), with the roughly 30 % higher surface sublimation on 15 July arising from the drier (∼ 10 % lower relative humidity; cf. Fig. S5e with Fig. 3k) and windier (∼ 10 % higher wind speed; cf. Fig. S5f with Fig. 3l) near-surface conditions in the model. The fact that ERA-5 captures Foehn effects at this site and for this event suggests that it can be used for the wider analysis of Foehn events around East Antarctica, as has been done over West Antarctica (Francis et al., 2023) and the Antarctic Peninsula (Laffin et al., 2021). The up to ∼ 2 mm w.e. h−1 precipitation rate (Figs. S5c and 3i), ∼ 5 K air temperature increase (Figs. S5e and 3k), and 30 m s−1 wind speeds (Figs. S5f and 3l) associated with the passage of the AR on 14 July are simulated by PWRF, with the cold bias in the model also seen in comparison with in situ measurements at Mawson Station (Table 3).
Figure 8f shows a comparison of the observed and simulated snow depth at the Khalifa SIMBA site on fast ice off Mawson Station. The ST in PWRF is initialized to zero, and hence the discrepancy with respect to the observed values during 11–13 July arises (the observed ST is equal to 0.14 m during 10–14 July). PWRF predicts around 0.24 m of snowfall in association with the passage of the AR on 14 July, and the weaker wind speeds in the model, at times by more than 20 m s−1, likely allow for snow to accumulate at the site instead of being blown away by the wind. The model fails to capture the observed decrease of 0.02 m in ST on 15 July in response to Foehn effects, which can be attributed to less favorable conditions for Foehn events in the model (e.g., the wind speed is lower by as much as 20 m s−1, Fig. 8e, with generally cooler air temperatures, Fig. 8a). A higher spatial resolution of at least 1 km would probably be needed for a more accurate simulation of the interaction of the AR with the complex Antarctic topography, including the Foehn effects (Gilbert et al., 2025). The increase in ST on 16 July due to snowfall is simulated by PWRF, even though its magnitude is underestimated by the model (0.01 m in PWRF as opposed to 0.04 m in observations), possibly because of the drier environment brought on by a more offshore wind direction (Figs. 8b, d–e, and S5e–f). It is important to stress that the discrepancies between the observed and modeled ST can also be tied to deficiencies in the LSM. In particular, the Noah LSM used in this study only considers a single snow layer and has a simplified representation of snow accumulation, sublimation, and melting processes (Lim et al., 2022). In contrast, the more sophisticated Noah LSM with multiparameterization options (Noah-MP), also available in PWRF, features user-defined parameters, includes up to three snow layers, represents the percolation, retention, and refreezing of meltwater within the snowpack, and accounts for snow metamorphism and compaction (Niu et al., 2011). Recent work has shown that it gives a superior performance with respect to the Noah LSM over Antarctica for the 2 m temperature and 10 m wind speed forecasts (Xue et al., 2022). An extension of this work would be to consider the Noah-MP and explore its effects on the ST predictions.
Besides ground-based observations, sounding data are available at the Mawson, Syowa, Davis, and Casey stations every 12 h and can be compared with the hourly PWRF predictions (Figs. S6 and S7). The model captures the timing of the arrival of the warm and moist air mass at Mawson on 14–15 July, as evidenced by the higher values of θE (270–280 K; Fig. S6a and e) and relative humidity (60 %–90 %; Fig. S6b and f). However, the katabatic wind flow is stronger in the model, as seen by the offshore wind direction (Fig. S6h) and drier conditions (Fig. S6b and f), and also evident in the ground-based observations (Figs. 8d and b), with a strong low-level jet (mostly below 700 hPa) on 14 and 16 July (Fig. S6g). At Syowa, the PWRF and observed profiles are in closer agreement than at the Mawson Station (cf. Fig. S6a–h with i–p). Here, the main discrepancy between the observed and modeled profiles is the dry bias (Fig. S6j and n), which is more pronounced on 13–14 July and is also evident in the near-surface data (Fig. 8i). The arrival of the low-latitude air mass at Davis on 15 July is seen in both the PWRF and observed profiles (Fig. S7a–h), with a less pronounced katabatic regime in the model compared to that at Mawson Station (cf. Figs. S6e–h with S7e–h). At Casey (Fig. S7i–p), PWRF simulates the more moist conditions on 14 July and the drier conditions on 15–16 July. The analysis of the sounding profiles reveals, however, that PWRF tends to overestimate the strength of the katabatic flow over coastal East Antarctica during 11–16 July. Vignon et al. (2019) attribute such overestimates to more stable boundary layers over the Antarctic Plateau and, to a lesser extent, steeper synoptic land–ocean pressure gradients in the model.
The results in Figs. 8, S4–7, and Table 3 reveal a reasonably good PWRF performance in the study area for the period 11–16 July 2022. In the next subsection, the model simulations are used to gain further insights into the dynamics of the 14 July AR event.
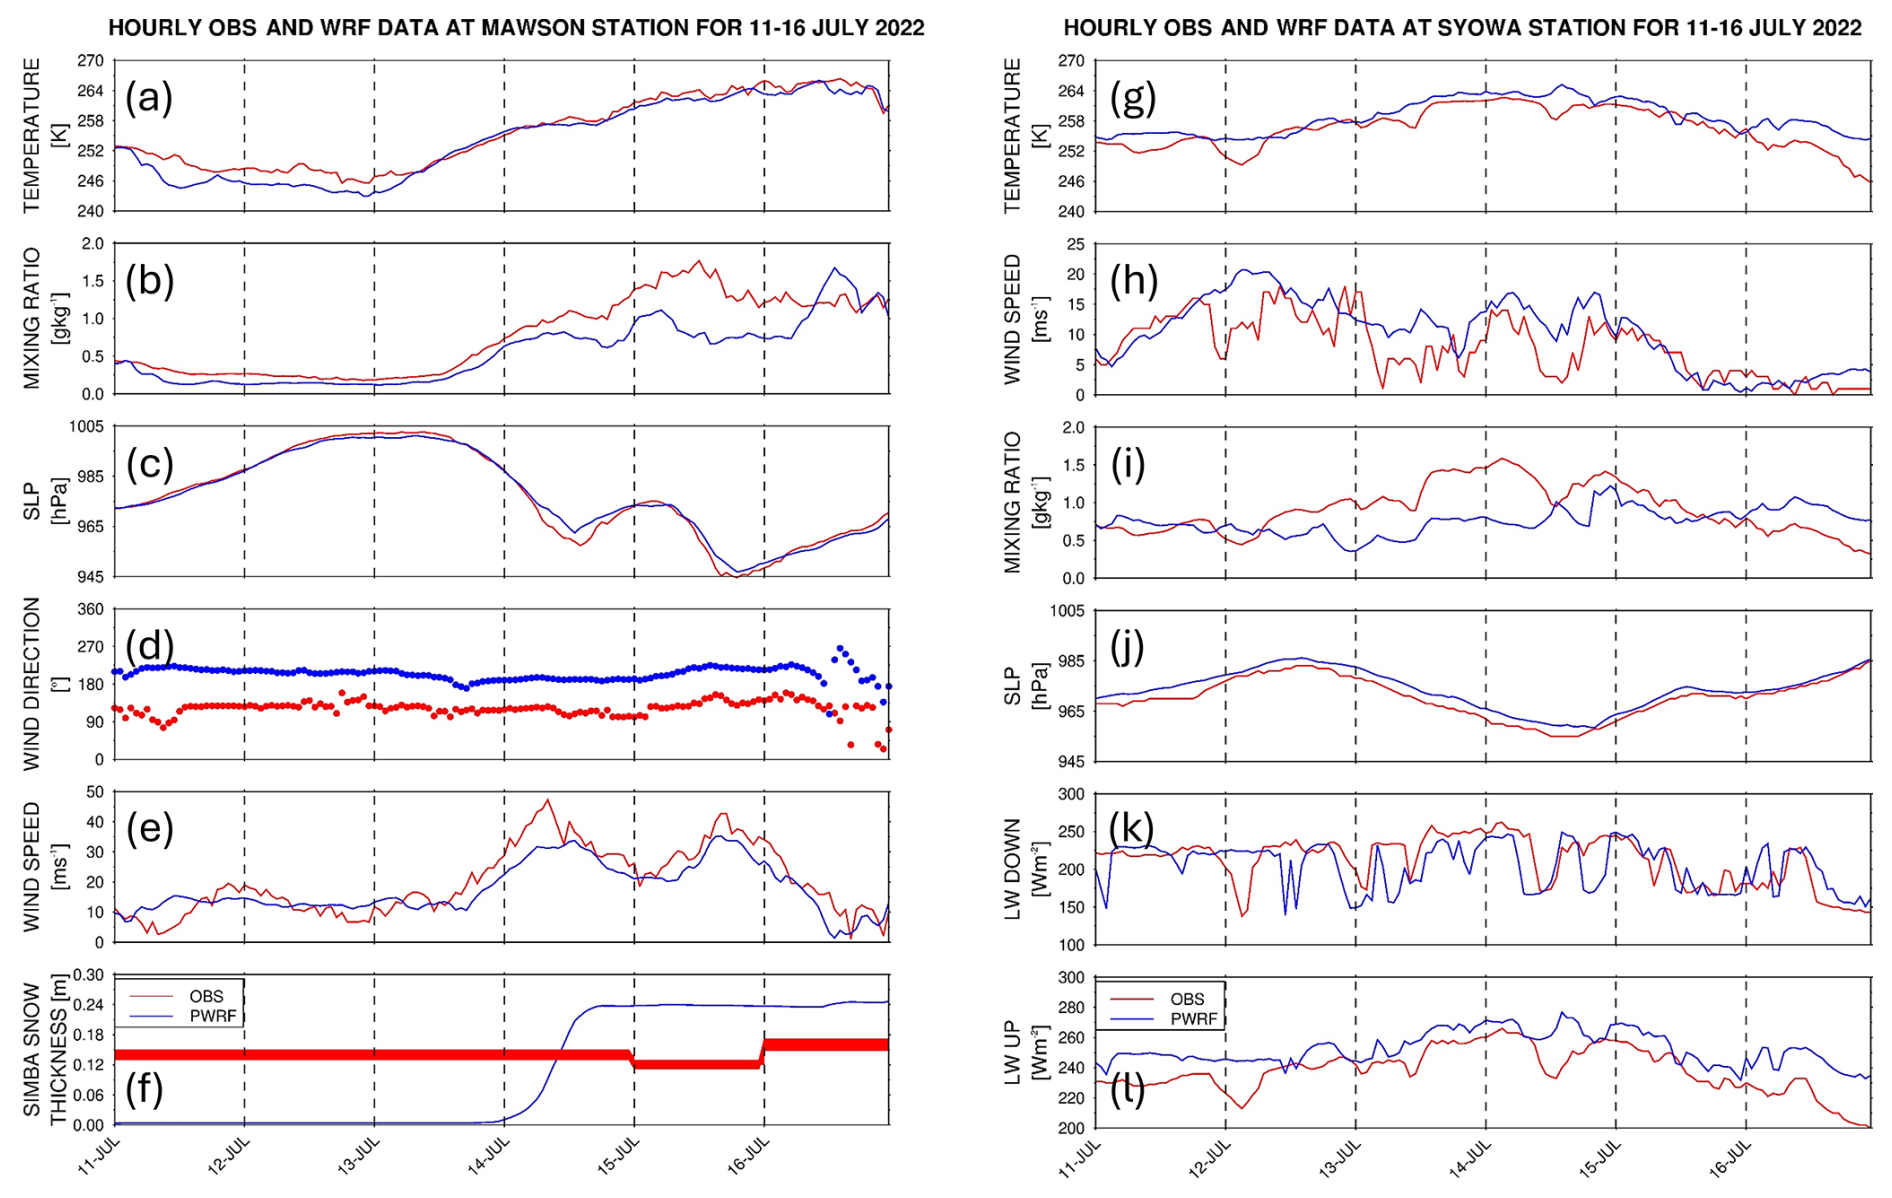
Figure 8Evaluation of PolarWRF against ground-based observations: hourly (a) air temperature (°C), (b) water vapor mixing ratio (g kg−1), (c) sea-level pressure (SLP; hPa), and horizontal wind (d) direction (°) and (e) speed (m s−1) from observations (red) and the PWRF simulation (blue) for 11–16 July 2022 at Mawson Station. (f) shows the daily observed (red) and hourly PWRF-predicted (blue) ST (m) at the Khalifa SIMBA site on fast ice off Mawson Station, the former with the estimated 7 % uncertainty. (g)–(l) are the same as (a)–(f) but for the hourly air temperature (K), horizontal wind speed (m s−1), water vapor mixing ratio (g kg−1), sea-level pressure (SLP; hPa), and surface downward and upward longwave radiation fluxes (W m−2) at Syowa Station. The wind fields at Syowa Station are shown in Figs. S4e–f. The location of the stations is given in Fig. 1d.
Table 3Verification diagnostics with respect to station data: bias, normalized bias (μ), correlation (ρ), variance similarity (η), and normalized error variance (α) for air temperature, water vapor mixing ratio, horizontal wind vector, and sea-level pressure for Mawson, Syowa, Relay, Davis, and Casey Stations for 11–16 July 2022. For Syowa Station, the scores are also given for the surface downward and upward longwave radiation fluxes at the bottom of the table. The model values are those at the closest grid point to the location of the station, and the evaluation is performed for hourly data. The corresponding time series are given in Figs. 8 and S4.
4.2.2 Insights into the dynamics and effects of the AR
One of the motivations for implementing the high-resolution (2.5 km) innermost grid is to check for the presence of AR rapids (Box et al., 2023; Francis et al., 2024). Figure 9a–d shows a Hovmöller plot of the vertical velocity at 700 hPa, 10 m meridional wind speed, 850 hPa equivalent potential temperature (θE), and precipitation rate averaged over 40–50° E, a latitude band that comprises the bulk of the AR (Figs. 6a, 7a–c, and 9i). It reveals AR rapids, in particular one on 13–14 July between 40 and 60° S (pink arrows in Fig. 9a and d), which is embedded within the AR, as seen on 13 July at 12:00 UTC when it is located at 40–50° S (Fig. 9i). No AR rapids are seen in the vertical profiles at the coastal Antarctic stations (Figs. S6 and S7), suggesting they are confined to the Southern Ocean. The linear structure propagating from ∼ 55° S late on 11 July to 65° S early on 13 July does not correspond to an AR rapid. Instead, the heavy precipitation (> 1 mm h−1; Fig. 9d) arises from the interaction of the low-latitude air mass with the katabatic wind regime originating from the Antarctic Plateau, as it is placed at the interface between the two flows (cf. Fig. 9a–b with d). The low-level convergence of these two air masses can be seen in Fig. 9i around 65° S. The katabatic flow is characterized by southerly winds (Fig. 9b) and low θE values (260–270 K, compared to 290–300 K for the low-latitude air mass; Fig. 9c), extending from the Antarctic Plateau to the Southern Ocean. Figure 9e–h is the same as Fig. 9a–d, except that the fields are averaged over 85–95° E. The low-latitude air mass reaches this part of East Antarctica on 15–16 July, when precipitation rates exceed 1.8 mm w.e. h−1. The maximum precipitation rate in coastal Antarctica, averaged over 85–95° E, is about 66 % higher than that averaged over 40–50° E (1.81 vs. 1.09 mm w.e. h−1). This can be explained by (1) the higher moisture levels (maximum longitudinally averaged θE values of 297.9 K vs. 289.7 K), as the low-latitude air mass penetrates further polewards due to a more favorable synoptic pressure pattern, and (2) a stronger katabatic flow off the Antarctic Plateau (maximum longitudinally averaged meridional wind speed of 22 m s−1 vs. 19 m s−1). Around 45–55° S on 16 July, AR rapids are present in the plots averaged over 85–95° E (pink arrows in Fig. 9e and h), when the low-level air intrusion was in the area (Fig. 9j). The fact that these structures have been identified in modeling products in the Southern Ocean in this study, around Greenland in Box et al. (2023) and in the Middle East in Francis et al. (2024), stresses the need for high spatial and temporal resolution three-dimensional radar observations along the ARs to check whether they actually exist or are just model artifacts.
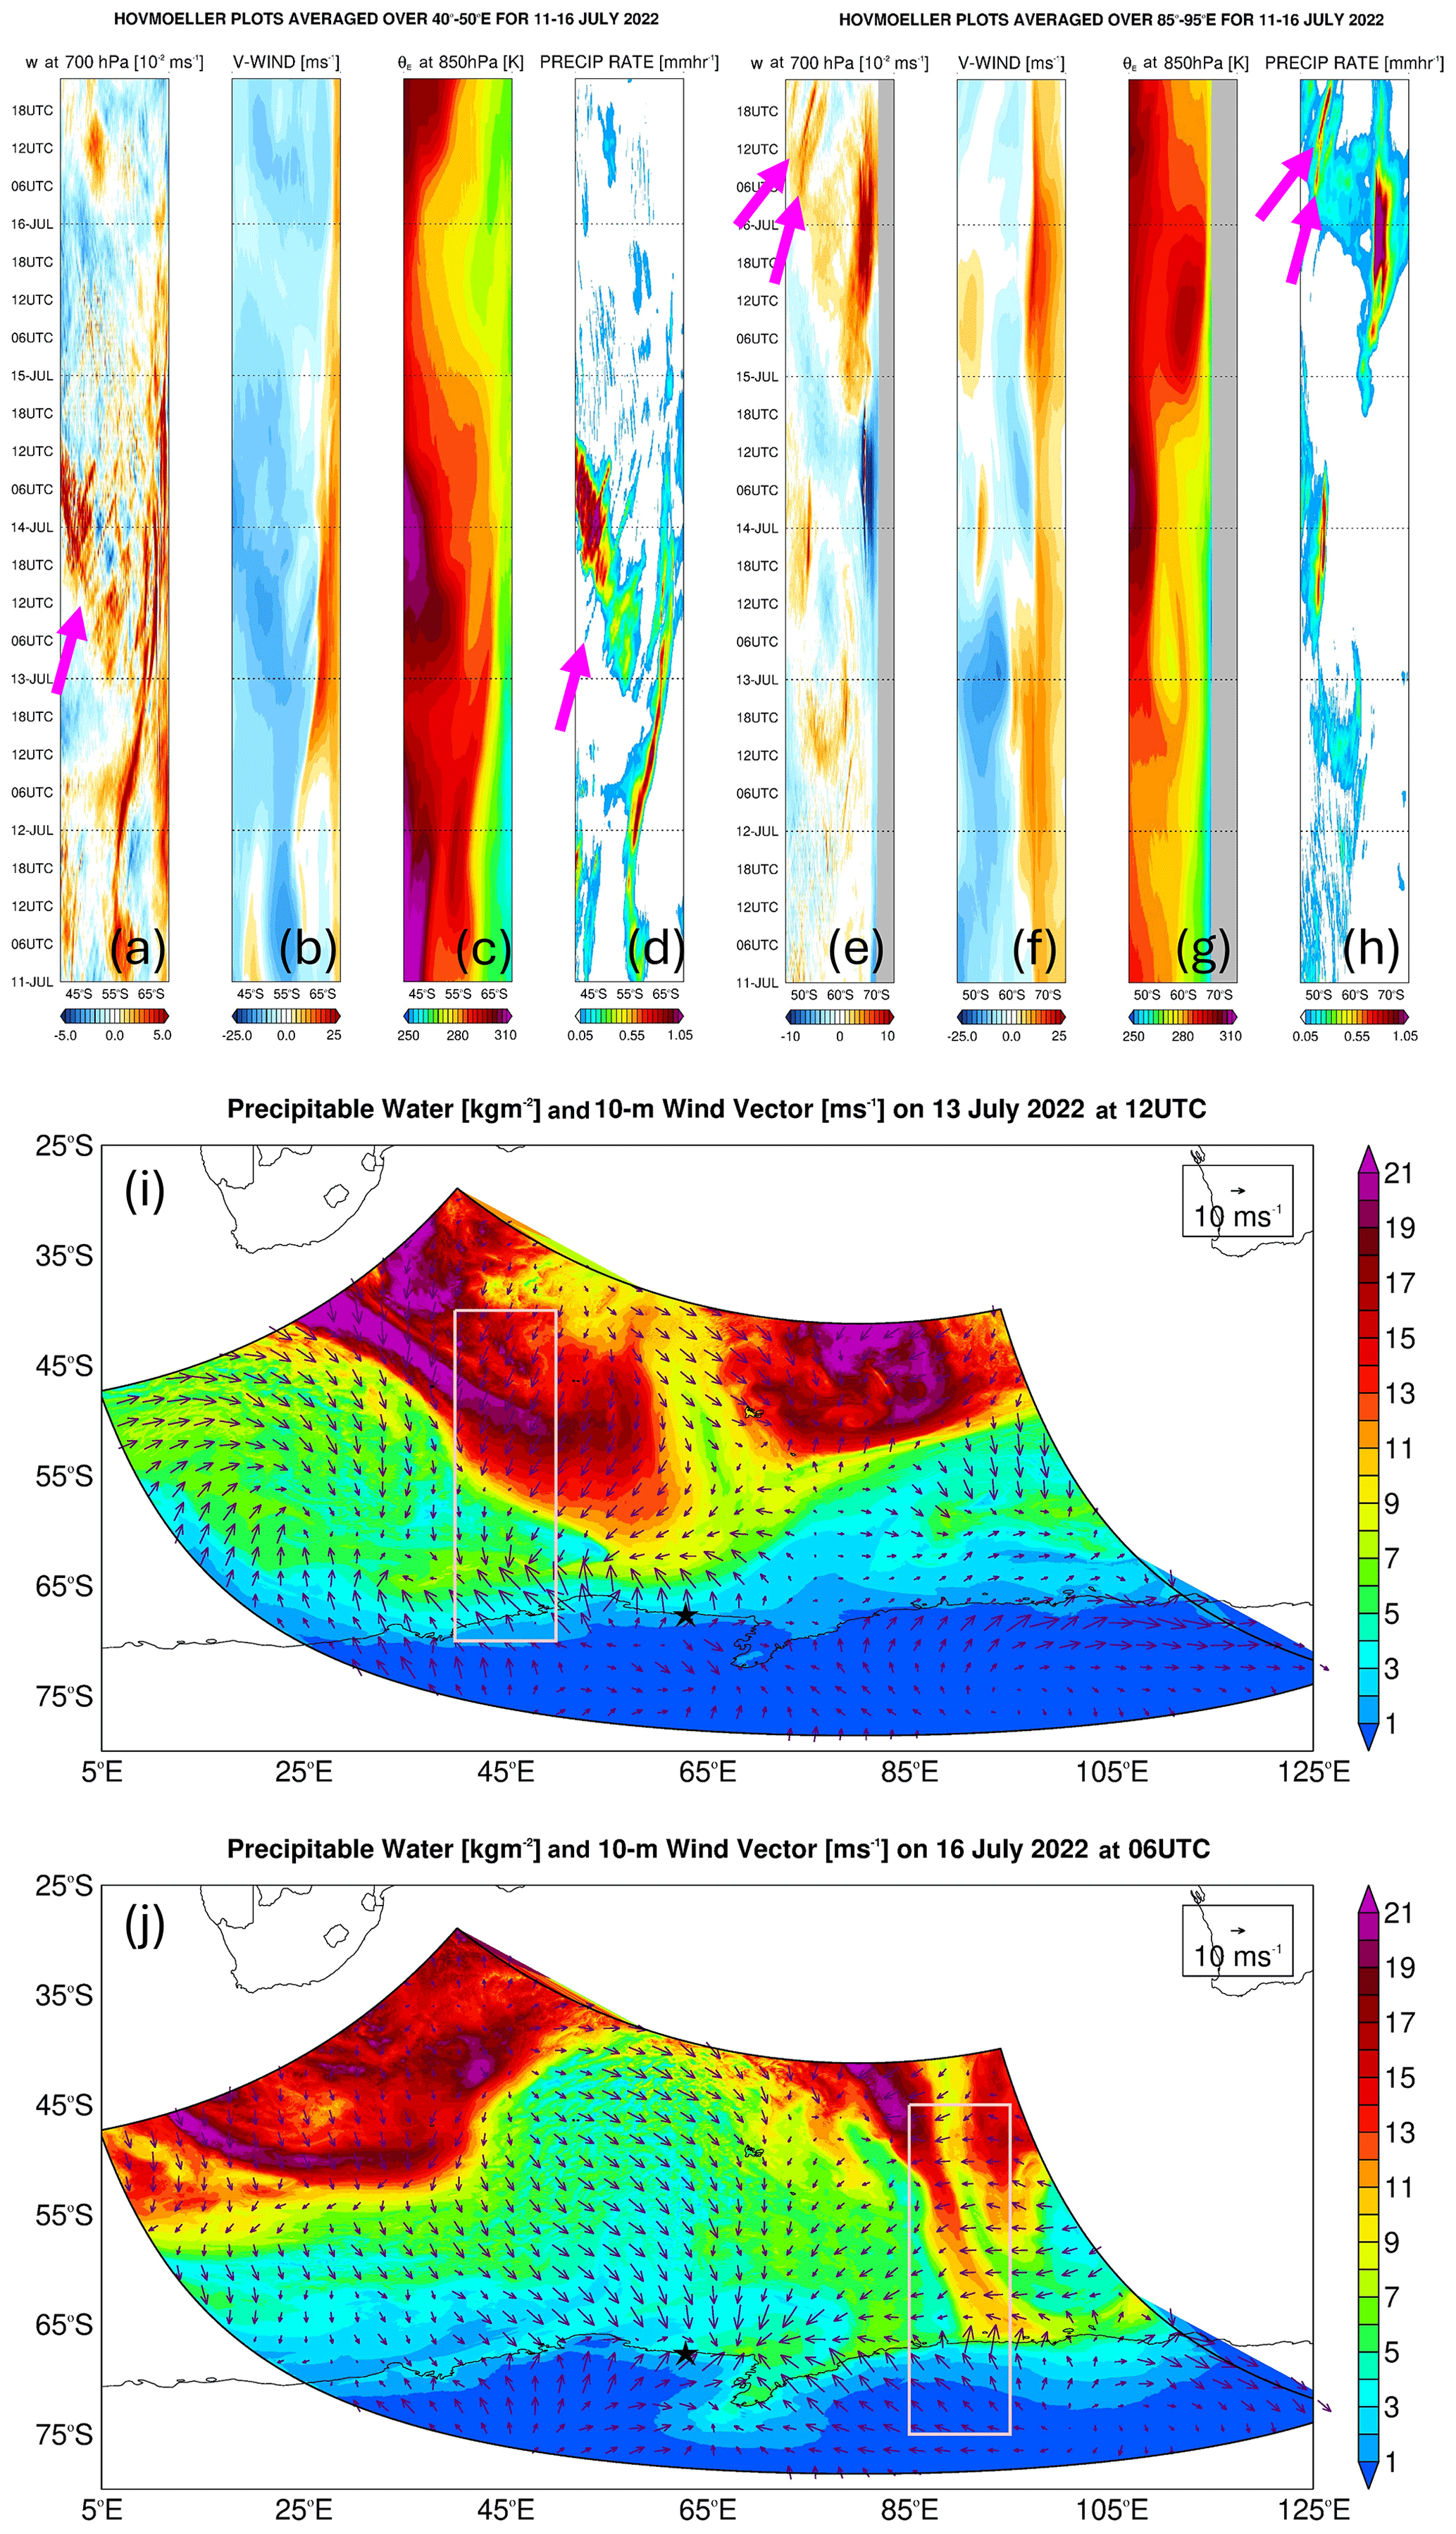
Figure 9Hovmöller plots: Hovmöller of hourly (a) 700 hPa vertical velocity (10−2 m s−1), (b) 10 m meridional wind speed (m s−1), (c) 850 hPa equivalent potential temperature (θE; K), and (d) precipitation rate (mm h−1) for 11–16 July 2022 averaged over 40–50° E. The pink arrows highlight AR rapids. (e)–(h) are the same as (a)–(d) but averaged over 85–95° E. The gray shading in (e) and (g) highlights latitudes for which the 700 and 850 hPa pressure levels, respectively, are below topography. (i) Precipitable water (shading; kg m−2) and 10 m wind vector (arrows; m s−1) at 12:00 UTC on 13 July. The star indicates the location of Mawson Station. The fields given in (a)–(d) are averaged over the longitude band of the pink box (40–50° E) and plotted over its latitude range. (j) is the same as (i) but at 06:00 UTC on 16 July, with the pink box also giving the latitude range over which the fields in (e)–(h) are plotted and its longitude band (85–95° E) used for averaging to generate the Hovmöller plots.
On top of surface evaporation from the subtropics (Fig. S2), the convergence of the flow around the low-pressure system to the west and the ridge to the east helped feed the AR and associated warm and moist air mass (Fig. 7). This can be seen in Fig. 10a–c. The zonal moisture transport in Fig. 10b highlights the convergence of the westerly flow at 5–10 m s−1 associated with θ values of 290–295 K, with the easterly flow around the high with zonal wind speeds of 20–25 m s−1, and θE values of 300–305 K, as this air mass comes directly from the tropics. At about 65° E, where the AR is located (Fig. 10a), the vertical velocity peaks in the mid-troposphere around 600–800 hPa with speeds up to 0.3 m s−1 (Fig. 10c). The vertical structure of the updrafts, with a peak in the low- to mid troposphere, and the updraft speeds are comparable to the AR rapids reported by Box et al. (2023) over Greenland on 14 September 2017. Precipitation rates in excess of 3 mm h−1 are simulated by the model at 12:00 UTC on 14 July (Fig. 10d) and at 00:00 UTC on 15 July (Fig. 10a) along the AR. As the moisture plume moved closer to the Antarctic coast, it interacted with the katabatic wind regime. This is evident in Fig. 10e–f, with the colder, drier (θE ∼ 260–265 K), and strong (meridional wind speeds in excess of 45 m s−1) airflow from Antarctica, which descends the steep slopes with downward vertical velocities up to −0.6 m s−1, converging with the slower (35–40 m s−1) and more moist (θE ∼ 275–280 K) flow from lower latitudes, with vertical velocities in the bottom 5 km reaching +0.3 m s−1. This convergence led to precipitation rates in excess of 3 mm h−1 around Mawson Station (Fig. 10d).
The results in Figs. 9 and 10 suggest that it can be difficult for ARs and associated warm and moist air intrusions to reach this region of East Antarctica owing to the interaction with the strong katabatic flow. This factor has been highlighted for other regions of East Antarctica (e.g., Terpstra et al., 2021; Gehring et al., 2022).
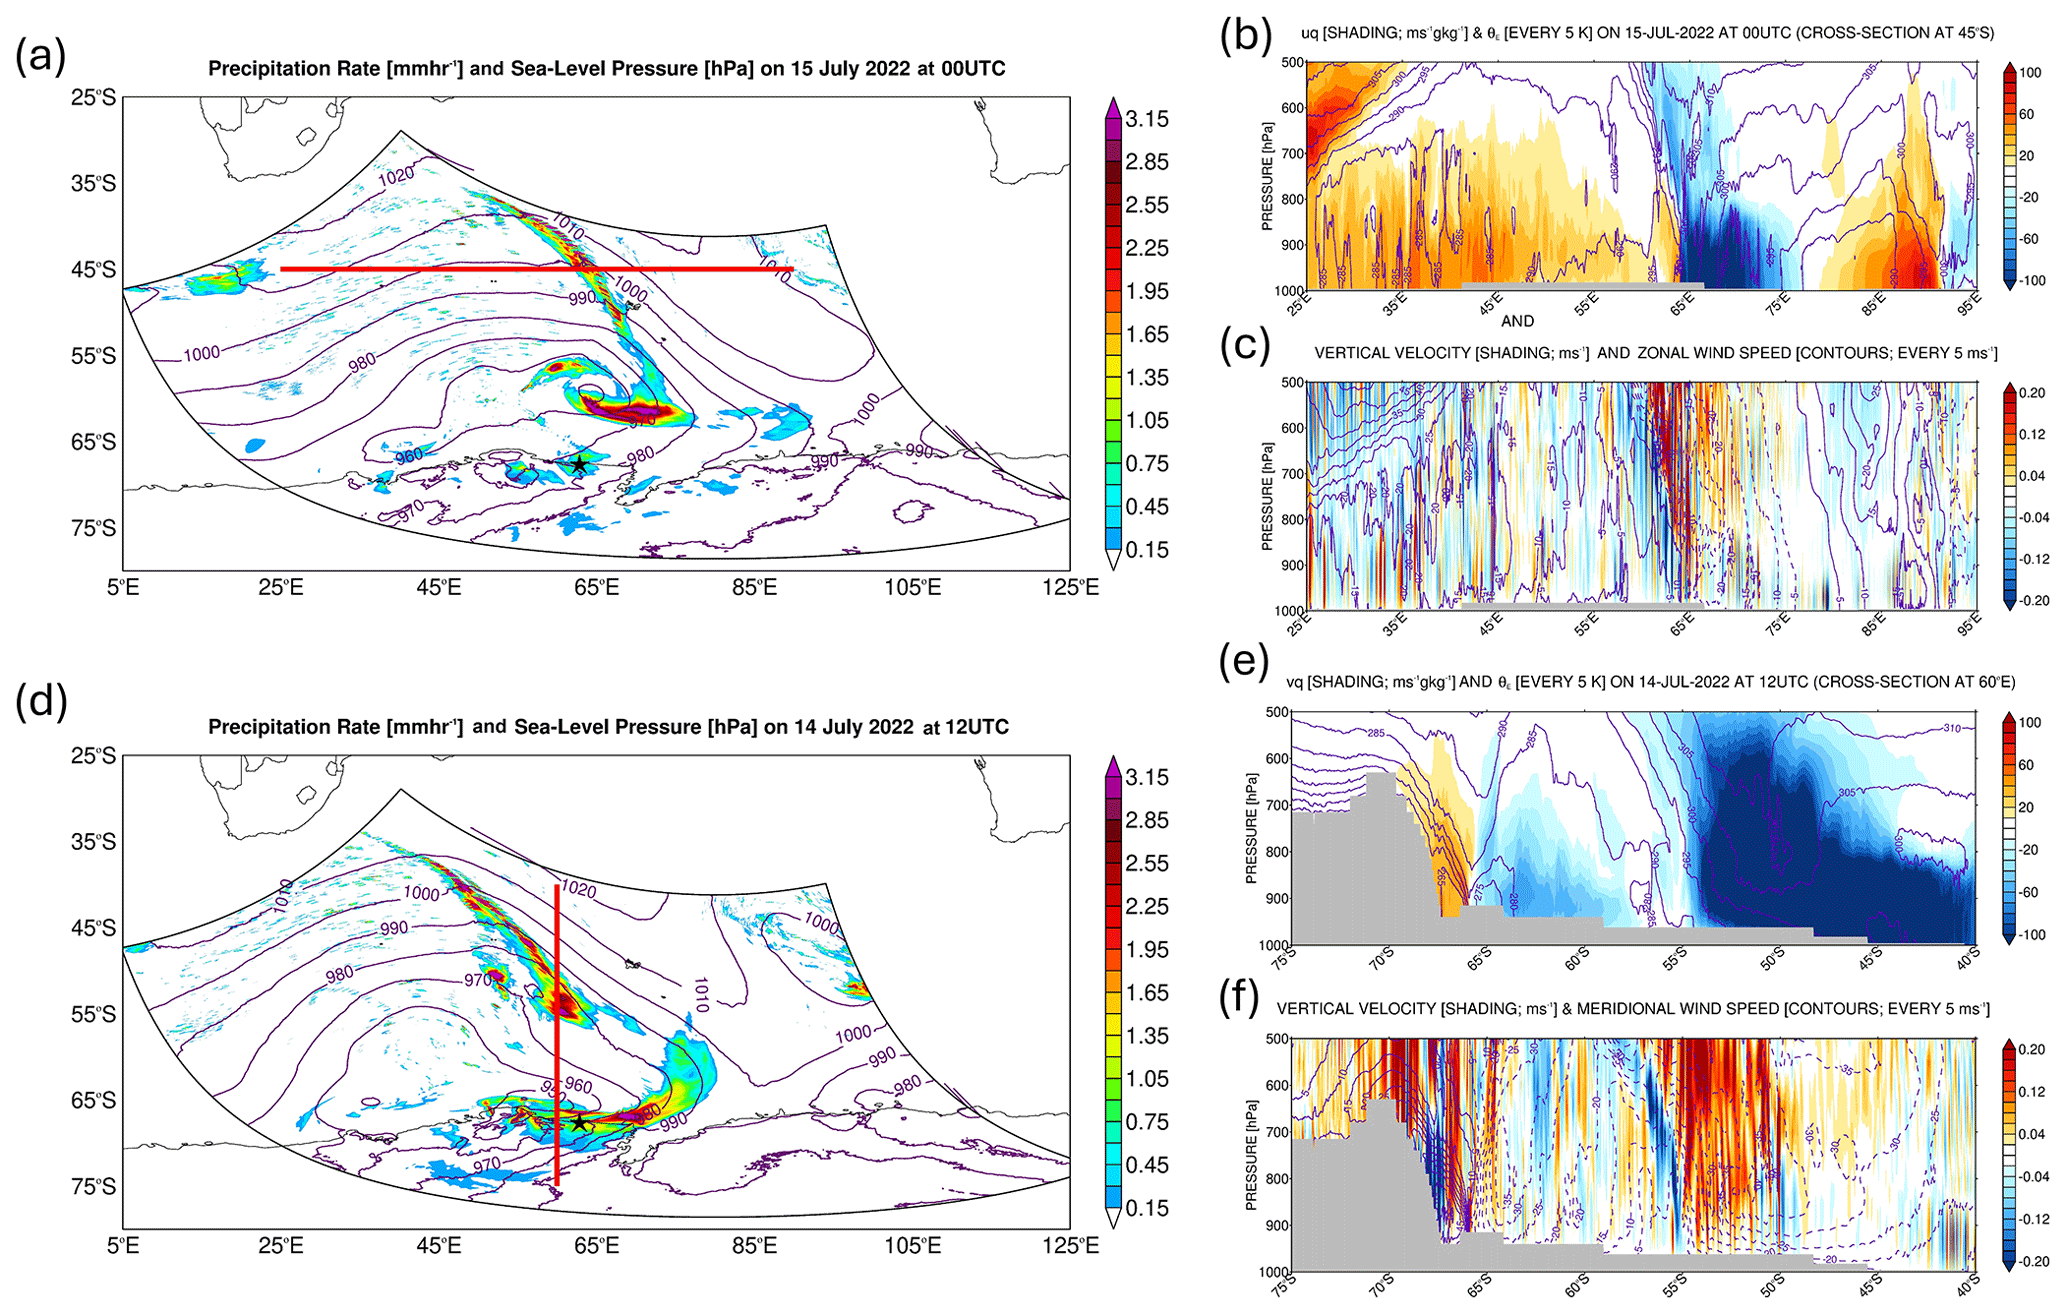
Figure 10Precipitation mechanisms in the Southern Ocean: (a) precipitation (shading; mm h−1) and sea-level pressure (contours; hPa) at 00:00 UTC on 15 July 2022, from PWRF's 2.5 km grid. Vertical cross section at 45° S indicated by the red line in (a), showing (b) zonal mass transport (shading; m s−1g kg−1) and equivalent potential temperature (θE; contours; every 5 K) and (c) vertical velocity (shading; 10−2 m s−1) and zonal wind speed (contours; every 5 m s−1) at the same time. Regions below the orography are shaded in gray. (d)–(f) are the same as (a)–(c) but at 12:00 UTC on 14 July. The cross section is at 60° E, with the meridional mass transport and meridional wind speed in (e) and (f) plotted instead of their zonal counterparts, respectively.
Sea ice is a critically important component of the climate system, modulating atmosphere–ocean interactions and ultimately the global climate (Raphael et al., 2011; Goosse et al., 2023). Antarctic SIE has abruptly dropped from 2016 to 2019 (Eayrs et al., 2021; Yang et al., 2021), with an all-time record low in 2023, driven by a complex and as yet poorly understood combination of oceanic and atmospheric processes (J. Wang et al., 2024). Climate model projections indicate major changes in the atmospheric circulation driven by the projected reduction in Antarctic sea ice in a warming climate: the Polar Cell and the katabatic flow off the coast of Antarctica are projected to strengthen, with a marginal weakening of the Ferrel and Hadley cells and an equatorward shift in the position of the Polar Jet (Tewari et al., 2023). This stresses the need for a much improved understanding of the observed variability of sea-ice properties, such as the SIE and SIT, which are highly heterogeneous around Antarctica, to increase confidence in future climate-change projections. This is achieved in this study at a coastal site in East Antarctica through in situ measurements for the period July–November 2022.
The SIT at the Khalifa SIMBA site on fast ice off Mawson Station largely follows the annual seasonal cycle, with a gradual increase during winter to mid-to-late October followed by a steady decline in late spring. The maximum values of ∼ 1.1–1.2 m are in the 0.50–1.50 m range estimated from satellite altimeter products for fast ice in the region around Mawson Station (Li et al., 2022) and are also comparable to the thickness of pack ice around Antarctica (Kurtz and Markus, 2012; Kacimi and Kwok, 2020). The ST, on the other hand, is highly variable, with values in the range 0.02–0.18 m; these values are also consistent with the estimates from satellite altimetry. In contrast to SIT, the temporal variability of ST is strongly linked to atmospheric forcing, in particular to precipitation (snowfall), Foehn effects, blowing snow, and episodic warm and moist air intrusions, which can lead to variations of up to ± 0.08 m in a day. During July–November 2022, an AR impacted the site on 14 July. It led to an 18 K increase in air temperature within 24 h and a variation of up to 0.04 m in ST due to Foehn effects and snowfall (the 0.02 m change in SIT is within the estimated uncertainty range). These changes occurred within one day of the AR's arrival and were followed by a recovery to pre-AR levels in the following 1–2 d. However, it is important to stress that a longer observational period would be needed to establish more robust and statistically significant links between atmospheric phenomena such as Foehn effects, blowing snow, and incursions of warm and moist low-latitude air and the coastal ST (and potentially SIT). In addition, having measurements for at least a full year would allow for the quantification of the potential role of surface melting in ST and SIT, which is more likely in the summer months but may occur at other times in a warming climate. Simulations with coupled ocean–atmosphere–sea ice models should also be considered to further explore the role of atmospheric forcing in ST and SIT. In addition, refined methods to extract SIT and ST are desirable as, in particular for SIT, the variation during weather events such as the passage of the AR is within the uncertainty range, preventing a clear signal from being extracted from the data.
The 14 July AR is particularly intense, with the highest IVT around the Khalifa SIMBA site on fast ice off Mawson Station of ∼ 156 kg m−1 s−1, which is in the top 0.5 % of the climatological distribution. This AR has its origins in South America, where a wave train coming from the Pacific Ocean leads to an intensification of the South American Low-Level Jet and increased moisture outflow into the South Atlantic Ocean. The period 10–19 July 2022 is characterized by a wavenumber #5 pattern along the subtropical jet and a wavenumber #3 along the polar jet in the Southern Hemisphere, the latter projecting into the positive SAM phase, which is expected given the ongoing La Niña. A pressure dipole, with a low to the west and a ridge to the east, promotes the advection of warm and moist low-latitude air across Mawson Station. A back-trajectory analysis indicates contributions from evaporation both in the subtropics and the Southern Ocean to the precipitation event on 14 July 2022. A more in-depth analysis reveals that a secondary low formed just northwest of the site on 13 July, driven by high baroclinicity arising from the interaction of the warmer low-latitude air masses with the cold katabatic winds that prevail around Mawson Station. At the same time, a TPV and a jet streak at upper levels contribute to an intensification of the primary low. The changing wind field in response to the passage of the deep cyclone, which had a central pressure as low as 931 hPa, also has an impact on the sea-ice dynamics. In particular, maximum pack-ice drift velocities north of Mawson Station exceeded 40 km d−1 from 12 to 14 July and 20 km d−1 from 14 to 16 July with the opening of a polynya in the Southern Ocean northwest of Mawson Station around 65° S, 45° E from 14 to 22 July. These pack-ice drift speeds are comparable to those estimated during the opening of the Maud Rise Polynya in September 2017 (Francis et al., 2019).
A high-resolution simulation with PWRF down to 2.5 km is conducted to gain further insight into this event. An evaluation against in situ observations indicates a good performance for both coastal and inland stations in the target region. A dry bias at coastal sites is attributed to an excessive offshore wind direction in the model and/or too much boundary layer mixing. An evaluation of the simulated vertical profiles against those observed at four coastal sites reveals a stronger katabatic flow in PWRF, which is consistent with the drier near-surface conditions. This is reported by other studies (e.g., Vignon et al., 2019), which attribute it to more stable boundary layers over the Antarctic Plateau and steeper land–sea synoptic pressure gradients. The overestimation of the surface upward longwave radiation flux may be a reflection of higher surface temperatures and/or excessively high surface emissivity in PWRF. This suggests the need to optimize the land surface properties in the model, as has been highlighted by other studies (Hines et al., 2019). Ingesting a more realistic representation of the SIE and SIT does not translate into higher skill scores for this particular event. This indicates that improvements to the boundary layer dynamics and/or land/ice processes, noted by Wille et al. (2016, 2017) and Vignon et al. (2019), and at least for this case study, are probably more important than having a more accurate sea-ice representation in the model. Besides calibrating surface parameters, future PWRF studies should explore other physics schemes and/or optimize the tunable parameters defined inside the selected ones, in particular in the PBL and LSM as done for other regions (e.g., Quan et al., 2016; Chinta and Balaji, 2020), in an attempt to improve the model performance. For example, the LSM employed, Noah LSM, has a simplified representation of snow processes compared to the more sophisticated Noah-MP (Niu et al., 2011), which has shown higher skill over Antarctica (Xue et al., 2022). Adding a higher-resolution nest over the target region can also be beneficial as it will allow for a more accurate representation of dynamic and thermodynamic processes (Gilbert et al., 2025). The high-resolution PWRF simulation reveals the presence of AR rapids, with a similar vertical structure and propagation speed as those reported in Box et al. (2023) over Greenland in September 2017. The model simulation also highlights the effects of the katabatic wind regime in slowing down and weakening the low-latitude warm and moist air incursions as they approach the Antarctic coast. It is this interaction that triggers precipitation rates in excess of 3 mm h−1 around Mawson Station during the 14 July AR.
The SIMBA deployment at a fast ice site off Mawson Station during July–November 2022 enabled a better understanding of the spatial and temporal variability of SIT and ST in that part of coastal East Antarctica. Such measurements should also be conducted at other sites, given the marked regional differences in sea-ice properties in the Southern Ocean (Parkinson and Cavalieri, 2012). This will also help to evaluate and improve the ST, SIE, and SIT estimates derived from satellite remote sensing and numerical models. Besides ocean dynamics and thermodynamics, the findings of the study stress the role of atmospheric forcing in driving the variability, in particular of ST. Long-term measurements are needed to further explore and quantify how Foehn effects, blowing snow, warm and moist air intrusions, and surface melting modulate SIT and ST and how they respond to seasonal and inter-annual variations in the atmospheric and oceanic state. This is a crucial step toward improving the quality and confidence of future climate-change projections and medium- and long-range weather forecasts owing to the global influence of sea-ice variability on the climate system.
The sea-ice and snow thickness measurements at the Khalifa SIMBA site on fast ice off Mawson Station for July–November 2022 are available upon request from the corresponding author (Diana Francis; diana.francis@ku.ac.ae). The remaining observational and reanalysis datasets used in this study are freely available online: (i) ERA-5 reanalysis data were downloaded from the Copernicus Climate Data Store website (Hersbach et al., 2023a, b); (ii) automatic weather station (AWS) data at the Mawson, Davis, and Casey stations can be requested from Australian Antarctic Data Center website (AADC, 2022); (iii) AWS and surface radiation data for Syowa Station were obtained from the World Radiation Monitoring Center – Baseline Surface Radiation Network website (AWI, 2024); (iv) AWS data for the Relay Station were extracted from the Antarctic Meteorological Research Center and Automatic Weather Stations Project (Lazzara, 2024); (v) sea-ice velocity vectors from the low-resolution sea-ice drift product are available from the European Organization for the Exploitation of Meteorological Satellites (EUMETSAT) Ocean and Sea Ice Satellite Application Facility (EUMETSAT, 2024); (vi) sea-ice concentration maps derived from the measurements collected by the Advanced Microwave Scanning Radiometer (AMSR) for Earth Observing Systems instrument onboard the National Aeronautics and Space Administration's (NASA) Aqua satellite and the AMSR-2 instrument onboard the Japan Aerospace and Exploration Agency Global Change Observation Mission 1st-Water “Shizuku” satellite from January 2013 to present were obtained from the University of Bremen website (UoB; 2024); (vii) twice daily atmospheric sounding profiles at the Mawson, Syowa, Davis, and Casey stations were accessed from the University of Wyoming website (Oolman, 2025). The Hybrid Single-Particle Lagrangian Integrated Trajectory (HYSPLIT) transport and dispersion model was downloaded from the National Aeronautic and Space Administration Air Resources Laboratory website (NOAA ARL, 2024). The PolarWRF model version 4.3.3 is available at the Byrd Polar and Climate Research Center at The Ohio State University website (PWRF, 2024). The figures presented in this manuscript have been generated with the Interactive Data Language (IDL; Bowman, 2005) and MATLAB (Mathworks, 2024) software.
The supplement related to this article is available online at https://doi.org/10.5194/tc-20-1-2026-supplement.
DF assisted in the conceptualization of the study, the interpretation and validation of the results, the writing of the draft, and funding acquisition. RF carried out formal analysis, data processing, analysis of the results, and the writing of the draft. NN contributed to data acquisition, processing, and analysis. NN, PH, JDW, IVG, and RAM aided in the interpretation of the results and provided input to the manuscript. All authors interpreted the results and provided input to the final manuscript.
At least one of the (co-)authors is a member of the editorial board of The Cryosphere. The peer-review process was guided by an independent editor, and the authors also have no other competing interests to declare.
Publisher’s note: Copernicus Publications remains neutral with regard to jurisdictional claims made in the text, published maps, institutional affiliations, or any other geographical representation in this paper. While Copernicus Publications makes every effort to include appropriate place names, the final responsibility lies with the authors.
This work was funded by the Khalifa University Polar Research Center. The authors wish to acknowledge the contribution of Khalifa University's high-performance computing and research computing facilities to the results of this research. The SIMBA deployment at a fast ice site near the Mawson Station, in situ measurements, and technical assistance were supported under Australian Antarctic Science [AAS] Project #4506 (CI: Petra Heil). The work of Petra Heil and Robert A. Massom was supported by the Australian Antarctic Division. With respect to Petra Heil and Robert A. Massom, this work contributes to Project 6 of the Australian Antarctic Program Partnership (ASCI000002) funded under the Australian Government's Antarctic Science Collaboration Initiative program. We are also grateful to the Byrd Polar and Climate Research Center at The Ohio State University for developing and maintaining PolarWRF and making it freely available to the scientific community. We greatly appreciate the support of the Automatic Weather Station Program and the Antarctic Meteorological Research Center for the weather station data used in this study (National Science Foundation grant numbers ARC-0713843, ANT-0944018, and ANT-1141908). The authors also gratefully acknowledge the National Oceanic and Atmospheric Administration Air Resources Laboratory for the provision of the Hybrid Single-Particle Lagrangian Integrated Trajectory (HYSPLIT) transport and dispersion model used in this work. We would like to thank the editor and three anonymous reviewers for their insightful and constructive comments and suggestions that helped to substantially improve the quality of this work.
Robert A. Massom was supported by the Australian Research Council Special Research Initiative, Australian Centre for Excellence in Antarctic Science (project no. SR200100008). Petra Heil has been supported from the Australian Antarctic Science Program (grant no. AAS4496, AAS4506, AAS4625) and grant funding from the International Space Science Institute (Switzerland; Project 405) and the Swiss Federal Research Fellowship program.
This paper was edited by Stephen Howell and reviewed by three anonymous referees.
AADC: Antarctic Climate Data Collected by Australian Agencies, Australian Antarctic Data Center, Australian Antarctic Data Centre [data set], https://data.aad.gov.au/ (last access: 22 April 2024), 2022.
Alapaty, K., Herwehe, J. A., Otte, T. L., Nolte, C. G., Bullock, O. R., Mallard, M. S., Kain, J. S., and Dudhia, J.: Introducing subgrid-scale cloud feedbacks to radiation for regional meteorological and climate modeling, Geophys. Res. Lett., 39, L24809, https://doi.org/2012GL054031, 2012.
Attada, R., Kunchala, R. K., Dasari, H. P., Sivareddy, S., Yesubabu, V., Knio, O., and Hoteit, I.: Representation of Arabian Peninsula summer climate in a regional atmospheric model using spectral nudging, Theor. Appl. Climatol., 145, 13–30, https://doi.org/10.1007/s00704-021-03617-w, 2021.
AWI: WRMC-BSRN, World Radiation Monitoring Center – Baseline Surface Radiation Network [data set], https://bsrn.awi.de/ (last access: 15 April 2024), 2024.
Barber, D. G. and Massom, R. A.: The Role of Sea Ice in Arctic and Antarctic Polynyas, in: Polynyas: Windows to the World's Oceans, edited by: Smith, W. O. and Barber, D. G., 1–54, Elsevier, Amsterdam, https://www.sciencedirect.com/science/chapter/bookseries/abs/pii/S0422989406740016 (last access: 1 August 2024), 2007.
Bowman, K. P.: An Introduction to Programming with IDL: Interactive Data Language, Academic Press [Software], 304 pp., ISBN-10: 012088559X, ISBN-13: 978-0120885596, 2005.
Box, J. E., Nielsen, K. P., Yang, X., Niwano, M., Wehrle, A., van As, D., Fettweis, X., Koltzow, M. A. O., Palmason, B., Fausto, R. S., van den Broeke, M. R., Huai, B., Ahlstrom, A. P., Langley, K., and Dachauer, A., Noel, B.: Greenland ice sheet rainfall climatology, extremes and atmospheric river rapids, Meteorol. Appl., 30, e2134, https://doi.org/10.1002/met.2134, 2023.
Bozkurt, D., Rondanelli, R., Marin, J. C., and Garreaud, R.: Foehn event triggered by an atmospheric river underlies record-setting temperature along continental Antarctica, J. Geophys. Res.-Atmos., 123, 3871–3892, https://doi.org/10.1002/2017JD027796, 2018.
Bromwich, D. H., Otieno, F. O., Hines, K. M., Manning, K. W., and Shilo, E.: Comprehensive evaluation of polar weather research and forecasting model performance in the Antarctic, J. Geophys. Res.-Atmos., 118, 274–292, https://doi.org/10.1029/2012JD018139, 2013.
Bromwich, D. H., Powers, J. G., Manning, K. W., and Zou, X.: Antarctic data impact experiments with Polar WRF during the YOPP-SH summer special observing period, Q. J. R. Meteorol. Soc., 148, 2194–2218, https://doi.org/10.1002/qj.4298, 2022.
Chen, F. and Dudhia, J.: Coupling an Advanced Land Surface-Hydrology Model with the Penn State – NCAR MM5 Modeling System, Part I: Model Implementation and Sensitivity, Mon. Weather Rev., 129, 569–585, https://doi.org/10.1175/1520-0493(2001)129<0569:CAALSH>2.0.CO;2, 2001.
Chinta, S. and Balaji, C.: Calibration of WRF model parameters using multiobjective adaptive surrogate model-based optimization to improve the prediction of the Indian summer monsoon, Clim. Dynam., 55, 631–650, https://doi.org/10.1007/s00382-020-05288-1, 2020.
Dare, R. A. and Budd, W. F.: Analysis of Surface Winds at Mawson, Antarctica, Wea. Forecast., 16, 416–431, https://doi.org/10.1175/1520-0434(2001)016<0416:AOSWAM>2.0.CO;2, 2001.
Djoumna, G. and Holland, D. M.: Atmospheric rivers, warm air intrusions, and surface radiation balance in the Amundsen Sea Embayment, J. Geophys. Res.-Atmos., 126, e2020JD034119, https://doi.org/10.1029/2020JD034119, 2021.
Dery, S. J. and Yau, M. K.: Large-scale mass balance effects of blowing snow and surface sublimation, J. Geophys. Res., 107, 4679, https://doi.org/10.1029/2001JD001251, 2002.
Dong, X., Wang, Y., Hou, S., Ding, M., Yin, B., and Zhang, Y.: Robustness of the Recent Global Atmospheric Reanalyses for Antarctic Near-Surface Wind Speed Climatology, J. Clim., 33, 4027–4043, https://doi.org/10.1175/JCLI-D-19-0648.1, 2020.
Eayrs, C., Holland, D. M., Francis, D., Wagner, T. J. W., Kumar, R., and Li, X.: Understanding the seasonal cycle of Antarctic sea ice extent in the context of long-term variability, Rev. Geophys., 57, 1037–1064, https://doi.org/10.1029/2018RG000631, 2019.
Eayrs, C., Li, X., Raphael, M. N., and Holland, D. M.: Rapid decline in Antarctic sea ice in recent years hints at future change, Nat. Geosci., 14, 460–464, https://doi.org/10.1038/s41561-021-00768-3, 2021.
Elvidge, A. D., Munneke, K., King, P., Renfrew, I. A., and Gilbert, E.: Atmospheric drivers of melt on Larsen C Ice Shelf: Surface energy budget regimes and the impact of foehn, J. Geophys. Res.-Atmos., 125, e2020JD032463, https://doi.org/10.1029/2020JD032463, 2020.
England, M. R., Wagner, T. J. W., and Eisenman, I.: Modeling the breakup of tabular icebergs, Sci. Adv., 6, eabd1273, https://doi.org/10.1126/sciadv.abd1273, 2020.
EUMETSAT: Global Low Resolution Sea Ice Drift, Ocean and Sea Ice Satellite Application Facility [data set], https://osi-saf.eumetsat.int/products/osi-405-c (last access: 12 August 2024), 2024.
Feng, Z., Leung, L. R., Liu, N., Wang, J., Houze, R. A. Jr., Li, J., Hardin, J. C., Chen, D., and Guo, J.: A global high-resolution mesoscale convective system database using satellite-derived cloud tops, surface precipitation, and tracking, J. Geophys. Res.-Atmos., 126, e2020JD034202, https://doi.org/10.1029/2020JD034202, 2021.
Finlon, J. A., Rauber, R. M., Wu, W., Zaremba, T. J., McFarquhar, G. M., Nesbitt, S. W., Schnaiter, M., Jarvinen, E., Waitz, F., Hill, T. C. J., and DeMott, P. J.: Structure of an atmospheric river over Australia and the Southern Ocean: II. Microphysical evolution, J. Geophys. Res.-Atmos., 125, e2020JD032514, https://doi.org/10.1029/2020JD032514, 2020.
Fogt, R. L., Bromwich, D. H., and Hines, K. M.: Understanding the SAM influence on the South Pacific ENSO teleconnection, Clim. Dynam., 36, 1555–1576, https://doi.org/10.1007/s00382-010-0905-0, 2011.
Fonseca, R., Francis, D., Aulicino, G., Mattingly, K., Fusco, G., and Budillon, G.: Atmospheric controls on the Terra Nova Bay polynya occurrence in Antarctica, Clim. Dynam., 61, 5147–5169, https://doi.org/10.1007/s00382-023-06845-0, 2023.
Francis, D., Eayrs, C., Cuesta, J., and Holland, D.: Polar cyclones at the origin of the reoccurrence of the Maud Rise Polynya in austral winter 2017, J. Geophys. Res.-Atmos., 124, 5251–5267, https://doi.org/10.1029/2019JD030618, 2019.
Francis, D., Fonseca, R., Bozkurt, D., Nelli, N., and Guan, B.: Atmospheric River Rapids and Their Role in the Extreme Rainfall Event of April 2023 in the Middle East, Geophys. Res. Lett., 51, e2024GL109446, https://doi.org/10.1029/2024GL109446, 2024.
Francis, D., Mattingly, K. S., Lhermitte, S., Temimi, M., and Heil, P.: Atmospheric extremes caused high oceanward sea surface slope triggering the biggest calving event in more than 50 years at the Amery Ice Shelf, The Cryosphere, 15, 2147–2165, https://doi.org/10.5194/tc-15-2147-2021, 2021.
Francis, D., Fonseca, R., Nelli, N., Bozkurt, D., Picard, G., and Guan, B.: Atmospheric rivers drive exceptional Saharan dust transport towards Europe, Atmos. Res., 266, 105959, https://doi.org/10.1016/j.atmosres.2021.105959, 2022a.
Francis, D., Fonseca, R., Mattingly, K. S., Marsh, O. J., Lhermitte, S., and Cherif, C.: Atmospheric triggers of the Brunt Ice Shelf calving in February 2021, J. Geophys. Res.-Atmos., 127, e2021JD036424, https://doi.org/10.1029/2021JD036424, 2022b.
Francis, D., Mattingly, K. S., Temimi, M., Massom, R., and Heil, P.: On the crucial role of atmospheric rivers in the two major Weddell Polynya events in 1973 and 2017 in Antarctica, Sci. Adv., 6, eabc2695, https://doi.org/10.1126/sciadv.abc2695, 2020.
Francis, F., Fonseca, R., Mattingly, K. S., Lhermitte, S., and Walker, C.: Foehn winds at Pine Island Glacier and their role in ice changes, The Cryosphere, 17, 3041–3062, https://doi.org/10.5194/tc-17-3041-2023, 2023.
Fraser, A. D., Wongpan, P., Langhorne, P. J., Klekociuk, A. R., Kusahara, K., Lannuzel, D., Massom, R. A., Meiners, K. M., Swadling, K. M., Atwater, D. P., Brett, G. M., Corkill, M., Dalman, L. A., Fiddes, S., Granata, A., Guglielmo, L., Heil, P., Leonard, G. H., Mahoney, A. R., McMinn, A., van der Merwe, P., Weldrick, C. K., and Wienecke, B.: Antarctic landfast sea ice: A review of its physics, biogeochemistry and ecology, Rev. Geophys., 61, e2022RG000770, https://doi.org/10.1029/2022RG000770, 2023.
Gehring, J., Vignon, E., Billault-Roux, A. C., Ferrone, A., Protat, A., Alexander, S. P., and Berne, A.: Orographic flow influence on precipitation during an atmospheric river event at Davis, Antarctica, J. Geophys. Res.-Atmos., 127, e2021JD035210, https://doi.org/10.1029/2021JD035210, 2022.
Ghiz, M.L., Scott, R. C., Vogelmann, A. M., Lenaerts, J. T. M., Lazzara, M., and Lubin, D.: Energetics of surface melt in West Antarctica, The Cryosphere, 15, 3459–3494, https://doi.org/10.5194/tc-15-3459-2021, 2021.
Gilbert, E., Pishniak, D., Torres, J. A., Orr, A., Maclennan, M., Wever, N., and Verro, K.: Extreme precipitation associated with atmospheric rivers over West Antarctic ice shelves: insights from the kilometre-scale regional climate modeling, The Cryosphere, 19, 597–618, https://doi.org/10.5194/tc-19-597-2025, 2025.
Goosse, H., Contador, A., Bitz, C., Blanchard-Wrigglesworth, C. M., Eayrs, E., Fichefet, C., Himmich, T., Huot, K., Klein, P.-V., Marchi, F., Massonnet, S., Mezzina, F., Pelletier, B., Roach, C., Vancoppenolle, L., and van Lipzig, N. P. M.: Modulation of the seasonal cycle of the Antarctic sea ice extent by sea ice processes and feedbacks with the ocean and the atmosphere, The Cryosphere, 17, 407–425, https://doi.org/10.5194/tc-17-407-2023, 2023.
Gorodetskaya, I. V., Van Lipzig, N. P. M., Van den Broeke, M. R., Mangold, A., Boot, W., and Reijmer, C. H.: Meteorological regimes and accumulation patterns at Utsteinen, Dronning Maud Land, East Antarctica: Analysis of two contrasting years, J. Geophys. Res.-Atmos., 118, 1700–1715, https://doi.org/10.1002/jgrd.50177, 2013.
Gorodetskaya, I. V., Silva, T., Schmithusen, H., and Hirasawa, N.: Atmospheric river signatures in radiosonde profiles and reanalyses at the Dronning Maud Land Coast, East Antarctica, Adv. Atmos. Sci., 37, 455-476, https://doi.org/10.1007/s00376-020-9221-8, 2020.
Gorodetskaya, I. V., Duran-Alarcon, C., Gonzalez-Herrero, S., Clem, K. R., Zou, X., Rowe, P., Imazio, P. R., Campos, D., Leroy-Dos Santos, C., Dutrievoz, N., Wille, J. D., Chyhareva, A., Favier, V., Blanchet, J., Pohl, B., Cordero, R. R., Prak, S.-J., Colwell, S., Lazzara, M. A., Carrasco, J., Gulisano, A. M., Krakovska, S., Ralph, F. M., Dethinne, T., and Picard, G.: Record-high Antarctic Peninsula temperatures and surface melt in February 2022: a compound event with an intense atmospheric river, npj Clim. Atmos. Sci., 6, 202, https://doi.org/10.1038/s41612-023-00529-6, 2023.
Gossart, A., Helsen, S., Lenaerts, J. T. M., Vanden Broucke, S., van Lipzig, N. P. M., and Souverijns, N.: An Evaluation of Surface Climatology in State-of-the-Art Reanalyses over the Antarctic Ice Sheet, J. Clim., 32, 6899–6915, https://doi.org/10.1175/JCLI-D-19-0030.1, 2019.
Guest, P. S.: Inside katabatic winds over the Terra Nova Bay polynya: 2. Dynamic and thermodynamic analyses, J. Geophys. Res., 126, e2021JD034904, https://doi.org/10.1029/2021JD034904, 2021.
Haas, C.: Sea ice thickness distribution, in: Sea Ice, edited by: Thomas, D. N., Blackwell Science, https://doi.org/10.1002/9781118778371.ch2, 2017.
Haumann, F. A., Gruber, N., Munnich, M., Frenger, I., and Kern, S.: Sea-ice transport driving Southern Ocean salinity and its recent trends, Nature, 537, 89–92, https://doi.org/10.1038/nature19101, 2016.
Heil, P.: Atmospheric conditions and fast ice at Davis, East Antarctica: A case study, J. Geophys. Res., 111, C05009, https://doi.org/10.1029/2005JC002904, 2006.
Heil, P., Allison, I., and Lytle, V. I.: Seasonal and interannual variations of the oceanic heat flux under a landfast Antarctic sea ice cover, J. Geophys. Res., 101, 25741–25752, https://doi.org/10.1029/96JC01921, 1996.
Hersbach, H., Bell, B., Berrisford, P., Hirahara, S., Horanyi, A., Munoz-Sabater, J., Nicolas, J., Peavey, C., Radu, R., Schepers, D., Simmons, A., Soci, C., Abdalla, S., Abellan, X., Balsamo, G., Bechtold, P., Biavati, G., Bidiot, J., Bonavita, M., De Chiara, G., Dahlgren, P., Dee, D., Diamantakis, M., Dragani, R., Fleming, J., Forbes, R., Fuentes, M., Geer, A., Haimberger, L., Healy, S., Hogan, R. J., Holm, E., Janiskova, M., Keeley, S., Laloyaux, P., Lopez, P., Lulu, C., Radnoti, G., de Rosnay, P., Rozum, I., Vamborg, F., Villaume, S., and Thepaut, J.-N.: The ERA5 global reanalysis, Q. J. R. Meteorol. Soc., 146, 1999–2049, https://doi.org/10.1002/qj.3803, 2020.
Hersbach, H., Bell, B., Berrisford, P., Biavati, G., Horanyi, A., Munoz Sabater, J., Nicolas, J., Peavey, C., Radu, R., Rozum, I., Schepers, D., Simmons, A., Soci, C., Dee, D., and Thepaut, J.-N.: ERA5 hourly data on single levels from 1940 to present, Copernicus Climate Change Service (C3S) Climate Data Store (CDS) [data set], https://doi.org/10.24381/cds.adbb2d47, 2023a.
Hersbach, H., Bell, B., Berrisford, P., Biavati, G., Horanyi, A., Munoz Sabater, J., Nicolas, J., Peavey, C., Radu, R., Rozum, I., Schepers, D., Simmons, A., Soci, C., Dee, D., and Thepaut, J.-N.: ERA5 hourly data on pressure levels from 1940 to present, Copernicus Climate Change Service (C3S) Climate Data Store (CDS) [data set], doi10.24381/cds.bd0915c6, 2023b.
Hines, K. M., Bromwich, D. H., Wang, S.-H., Silber, I., Verlinde, J., and Lubin, D.: Microphysics of summer clouds in central West Antarctica simulated by the Polar Weather Research and Forecasting Model (WRF) an the Antarctic Mesoscale Prediction System (AMPS), Atm. Chem. Phys., 19, 12431–12454, https://doi.org/10.5194/acp-19-12431-2019, 2019.
Hines, K. M., Bromwich, D. H., Silber, I., Russell, L. M., and Bai, L.: Predicting frigid mixed-phase clouds for pristine coastal Antarctica, J. Geophys. Res.-Atmos., 126, e2021JD035112, https://doi.org/10.1029/2021JD035112, 2021.
Hobbs, W., Spence, P., Meyer, A., Schroeter, S., Fraser, A. D., Reid, P., Tian, R. T., Wang, Z., Liniger, G., Doddridge, E. W., and Boyd, P. W.: Observational Evidence for a Regime Shift in Summer Antarctic Sea Ice, J. Clim., 37, 2263–2275, https://doi.org/10.1175/JCLI-D-23-0479.1, 2024.
Hoppmann, M., Nicolaus, M., Hunkeler, P. A., Heil, P., Behrens, L.-K., König-Langlo, G., Gerdes, R.: Seasonal evolution of an ice-shelf influenced fast-ice regime, derived from an autonomous thermistor chain, J. Geophys. Res.-Ocean., 120, 1703–1724, https://doi.org/10.1002/2014JC010327, 2015.
Hoskins, B., Fonseca, R., Blackburn, M., and Jung, T.: Relaxing the Tropics to an “observed” state: analysis using a simple baroclinic model, Q. J. R. Meteorol. Soc., 138, 1618–1626, https://doi.org/10.1002/qj.1881, 2012.
Hoskins, B. J. and Karoly, D. J.: The Steady Linear Response of a Spherical Atmosphere to Thermal and Orographic Forcing, J. Atmos. Sci., 38, 1179–1196, https://doi.org/10.1175/1520-0469(1981)038<1179:TSLROA>2.0.CO;2, 1981.
Hoskins, B. J. and Valdes, P. J.: On the Existence of Storm-Tracks, J. Atmos. Soc., 47, 1854–1864, https://doi.org/10.1175/1520-0469(1990)047<1854:OTEOST>2.0.CO;2, 1990.
Houze Jr., R. A.: Mesoscale convective systems, Rev. Geophys., 42, RG4003, https://doi.org/10.1029/2004RG000150, 2004.
Hu, H., Zhao, J., Heil, P., Qin, Z., Ma, J., Hui, F., and Cheng, X.: Annual evolution of the ice-ocean interaction beneath landfast ice in Prydz Bay, East Antarctica, The Cryosphere, 17, 2231–2244, https://doi.org/10.5194/tc-17-2231-2023, 2023.
Iacono, M. J., Delamere, J. S., Mlawer, E. J., Shephard, M. W., Clough, S. A., and Collins, W. D.: Radiative forcing by long-lived greenhouse gasses: Calculations with the AER radiative transfer models, J. Geophys. Res., 113, D13103, https://doi.org/10.1029/2008JD009944, 2008.
Jackson, K., J. Wilkinson, T. Maksym, D. Meldrum, J. Beckers, C. Haas, and D. Mackenzie: A Novel and Low Cost Sea Ice Mass Balance Buoy, J. Atmos. Ocean. Tech., 30, 2676–2688, https://doi.org/10.1175/JTECH-D-13-00058.1, 2013.
Kacimi, S. and Kwok, R.: The Antarctic sea ice cover from ICESat-2 and CryoSat-2: freeboard, snow depth, and ice thickness, The Cryosphere, 14, 4453–4474, https://doi.org/10.5194/tc-14-4453-2020, 2020.
Kain, J. S.: The Kain-Fritsch convective parameterization: An update, J. Appl. Meteorol., 43, 170–181, 2004.
Kawamura, T., Takizawa, T., Ohshima, K. I., and Ushio, S.: Data of sea-ice cores obtained in Lutzow-Holm Bay from 1990 to 1992 (JARE-31, -32) in the period of Japanese Antarctic climate research, JARE Data Rep. 204 (Glaciol. 24), 42 pp., National Institute of Polar Research, Tokyo, ISSN 0075-3343, 1995.
Koh, T.-Y., Wang, S., and Bhatt, B. C.: A diagnostic suite to assess NWP performance, J. Geophys. Res., 117, D13109, https://doi.org/10.1029/2011JD017103, 2012.
Kuipers Munneke, P., McGrath, D., Medley, B., Luckman, A., Bevan, S., Kulessa, B., Jansen, D., Booth, A., Smeets, P., Hubbard, B., Ashmore, D., Van den Broeke, M., Sevestre, H., Steffen, K., Shepherd, A., and Gourmelen, N.: Observationally constrained surface mass balance of Larsen C ice shelf, Antarctica, The Cryosphere, 11, 2411–2426, https://doi.org/10.5194/tc-11-2411-2017, 2017.
Kurtz, N. T. and Markus, T.: Satellite observations of Antarctic sea ice thickness and volume, J. Geophys. Res., 117, C08025, https://doi.org/10.1029/2012JC008141, 2012.
Lavergne, T., Eastwood, S., Teffah, Z., Schuberg, H., and Breivik, L.-A.: Sea ice motion from low-resolution satellite sensors: an alternative method and its validation in the Arctic, J. Geophys. Res.-Ocean., 115, C10032, https://doi.org/10.1029/2009JC005958, 2010.
Laffin, M. K., Zender, C. S., Singh, S., Van Wessem, J. M., Smeets, C. J. P. P., and Reijmer, C. H.: Climatology and evolution of the Antarctic Peninsula fohn wind-induced melt regime from 1979–2018, J. Geophys. Res.-Atmos., 126, e2020JD033682, https://doi.org/10.1029/2020JD033682, 2021.
Lazzara, M.: AMRDC Repository, Antarctic Meteorological Research Center & Automatic Weather Stations Project [data set], https://amrc.ssec.wisc.edu/ (last access: 12 May 2024), 2024.
Lea, E. J., Jamieson, S. S. R., and Bentley, M. J.: Alpine topography of the Gamburtsev Subglacial Mountains, Antarctica, mapped from ice sheet surface morphology, The Cryosphere, 18, 1733–1751, https://doi.org/10.5194/tc-18-1733-2024, 2024.
Li, H. and Fedorov, A. V.: Persistent freshening of the Arctic Ocean and changes in the North Atlantic salinity caused by Arctic sea ice decline, Clim. Dynam., 57, 2995–3013, https://doi.org/10.1007/s00382-021-05850-5, 2021.
Li, X.-Q., Hui, F.-M., Zhao, J.-C., Zhai, M.-X., and Cheng, X.: Thickness simulation of landfast ice along Mawson Coast, East Antarctica based on a snow/ice high-resolution thermodynamic model, Adv. Clim. Change Res., 13, 375–384, https://doi.org/10.1016/j.accre.2022.05.005, 2022.
Liang, K., Wang, J., Luo, H., and Yang, Q.: The role of atmospheric rivers in Antarctic sea ice variations, Geophys. Res. Lett., 50, e2022GL102588, https://doi.org/10.1029/2022GL102588, 2023.
Liao, S., Luo, H., Wang, J., Shi, Q., Zhang, J., and Yang, Q.: An evaluation of Antarctic sea-ice thickness from the Global Ice-Ocean Modeling and Assimilation System based on it situ and satellite observations, The Cryosphere, 16, 1807–1819, https://doi.org/10.5194/tc-16-1807-2022, 2022.
Liao, Z., Cheng, B., Zhao, J., Vihma, T., Jackson, K., Yang, Q., Yang, Y., Zhang, L., Li, Z., Qiu, Y., and Cheng, X.: Snow depth and ice thickness derived from SIMBA ice mass balance buoy data using an automated algorithm, Int. J. Digit. Earth., 12, 962–979, https://doi.org/10.1080/17538947.2018.1545877, 2018.
Lim, S., Gim, H.-J., Lee, E., Lee, S., Lee, W. Y., Lee, Y. H., Cassardo, C., and Park, S. K.: Optimization of snow-related parameters in the Noah land surface model (v3.4.1) using a micro-genetic algorithm (v1.7a), Geosci. Mod. Dev., 15, 8541–8559, https://doi.org/10.5194/gmd-15-8541-2022, 2022.
Maksym, T. and Markus, T.: Antarctic sea ice thickness and snow-to-ice conversion from atmospheric reanalysis and passive microwave snow depth, J. Geophys. Res., 113, C02S12, https://doi.org/10.1029/2006JC004085, 2008.
Maksym, T., Stammerjohn, S., Ackley, S., and Massom, R.: Antarctic sea ice – A polar opposite?, Oceanography, 25, 140–151, https://doi.org/10.5670/oceanog.2012.88, 2012.
Marengo, J. A., Soares, W. R., Saulo, C., and Nicolini, M.: Climatology of the Low-Level Jet East of the Andes as Derived from the NCEP-NCAR Reanalyses: Characteristics and Temporal Variability, J. Clim., 17, 2261–2280, https://doi.org/10.1175/1520-0442(2004)017<2261:COTLJE>2.0.CO;2, 2004.
Marshall, G. J.: Trends in the Southern Annular Mode from Observations and Reanalyses, J. Clim., 16, 4134–4143, https://doi.org/10.1175/1520-0442(2003)016<4134:TITSAM>2.0.CO;2, 2003.
Massom, R.A., Eicken, H., Haas, C., Jeffries M. O., Drinkwater, M. R., Sturm, M., Worby, A. P., Wu, X., Lytle, V. I., Ushio, S., Morris, K., Reid, P. A., Warren, S., and Allison, I.: Snow on Antarctic sea ice, Rev. Geophys., 39, 413–445, https://doi.org/10.1029/2000RG000085, 2001.
Massom, R. A., Pook, M. J., Comiso, J. C., Adams, N., Turner, J., Lachlan-Cope, T., and Gibson, T. T.: Precipitation over the interior East Antarctic Ice Sheet related to mid-latitude blocking-high activity, J. Clim., 17, 1914–1928, https://doi.org/10.1175/1520-0442(2004)017<1914:POTIEA>2.0.CO;2, 2004.
Massonnet, F., Mathiot, P., Fichefet, T., Goosse, H., Beatty, C. K., Vancopenolle, M., and Lavergne, T.: A model reconstruction of the Antarctic sea ice thickness and volume changes over 1980-2008 using data assimilation, Ocean Model., 64, 67–75, https://doi.org/10.1016/j.ocemod.2013.01.003, 2013.
Matejka, M., Laska, K., Jeklova, K., and Hosek, J.: High-Resolution Numerical Modeling of Near-Surface Atmospheric Fields in the Complex Terrain of James Ross Island, Antarctic Peninsula, Atmosphere, 12, 360, https://doi.org/10.3390/atmos12030360, 2021.
Mathworks: Math, Graphics, Programming, Mathworks [software], https://uk.mathworks.com/products/matlab.html (last access: 18 March 2024), 2024.
Maclennan, M. L., Lenaerts, J. T. M., Shields, C., and Wille, J. D.: Contribution of atmospheric rivers to Antarctic precipitation, Geophys. Res. Lett., 49, e2022GL100585, https://doi.org/10.1029/2022GL100585, 2022.
Maclennan, M. L., Lenaerts, J. T. M., Shields, C. A., Hoffman, A. O., Wever, N., Thompson-Munson, M., Winters, A. C., Pettit, E. C., Scambos, T. A., and Wille, J. D.: Climatology and surface impacts of atmospheric rivers on West Antarctica, The Cryosphere, 17, 865–881, https://doi.org/10.5194/tc-17-865-2023, 2023.
Meredith, M. P., Stammerjohn, S. E., Ducklow, H. W., Leng, M. J., Arrowsmith, C., Brearley, J. A., Venables, H. J., Barham, M., van Wessem, J. M., Schofield, O., and Waite, N.: Local- and large-scale drivers of variability in the coastal freshwater budget of the Western Antarctic Peninsula, J. Geophys. Res.-Ocean., 126, e2021JC017172, https://doi.org/10.1029/2021JC017172, 2021.
Miles, B. W. J., Stokes, C. R., and Jamieson, S. S. R.: Simultaneous disintegration of outlet glaciers in Porpoise Bay (Wilkes Land), East Antarctica, driven by sea ice break-up, The Cryosphere, 11, 427–442, https://doi.org/10.5194/tc-11-427-2017, 2017.
Mills, C. M.: Modification of the Weather Research and Forecasting Model's treatment of sea ice albedo over the Arctic Ocean, WRF3.3.1 Code Submission Doc., 2 pp., http://publish.illinois.edu/catrinmills/files/2012/10/Mills_WRFIceAlbedoProj_Summary.pdf (last access: 19 August 2024), 2011.
Montini, T. L., Jones, C., and Carvalho, L. M. V.: The South American low-level jet: A new climatology, variability, and changes, J. Geophys. Res.-Atmos., 124, 1200–1218, https://doi.org/10.1029/2018JD029634, 2019.
Morrison, H. and Milbrandt, J. A.: Parameterization of Cloud Microphysics Based on the Prediction of Bulk Ice Particle Properties, Part I: Scheme Description and Idealized Tests, J. Atmos. Sci., 72, 287–311, https://doi.org/10.1175/JAS-D-14-0065.1, 2015.
Nakanishi, M. and Niino, H.: An improved Mellor-Yamada level-3 model: Its numerical stability and application to a regional prediction of advection fog, Bound.-Lay. Meteorol., 119, 397–407, https://doi.org/10.1007/s10546-005-9030-8, 2006.
Nelli, N. R., Francis, D., Fonseca, R., Abida, R., Weston, M., Wehbe, Y., and Al Hosary, T.: The atmospheric controls of extreme convective events over the southern Arabian Peninsula during the spring season, Atm. Res., 262, 105788, https://doi.org/10.1016/j.atmosres.2021.105788, 2021.
Niu, G.-Y., Yang, Z.-L., Mitchell, K. E., Chen, F., Ek, M. B., Barlage, M., Kumar, A., Manning, K., Niyogi, D., Rosero, E., Tewari, M., and Xia, Y.: The community Noah land surface model with multiparameterization options (Noah-MP): 1. Model description and evaluation with local-scale measurements, J. Geophys. Res., 116, D12109, https://doi.org/10.1029/2010JD015139, 2011.
NOAA ARL: HYSPLIT for Linux - Public (unregistered) version download, National Oceanic and Atmospheric Administration Air Resources Laboratory [software], https://www.ready.noaa.gov/HYSPLIT_linuxtri (last access: 4 July 2024), 2024.
NOAA/NWS: Cold & Warm Episodes by Season, National Oceanic and Atmospheric Administration/National Weather Service Climate Prediction Center [data set], https://origin.cpc.ncep.noaa.gov/products/analysis_monitoring/ensostuff/ONI_v5.php (last access: 24 July 2024), 2024.
Oliveira, F. N. M., Carvalho, L. M. V., and Ambrizzi, T.: A new climatology for Southern Hemisphere blockings in the winter and the combine defect of ENSO and SAM phases, Int. J. Climatol., 34, 676–1692, https://doi.org/10.1002/joc.3795, 2013.
Oolman, L.: University of Wyoming – atmospheric soundings, Zenodo [data set], https://weather.uwyo.edu/upperair/sounding.html (last access: 4 July 2024), 2025.
Parkinson, C. L.: A 40-y record reveals gradual Antarctic sea ice increases followed by decreases at rates far exceeding the rates seen in the Arctic, Environ. Sci., 116, 14414–14423, https://doi.org/10.1073/pnas.1906556116, 2019.
Parkinson, C. L. and Cavalieri, D. J.: Antarctic sea ice variability and trends, 1979–2010, The Cryosphere, 6, 871–880, https://doi.org/10.5194/tc-6-871-2012, 2012.
Plante, M., Lemieux, J.-F., Tremblay, L. B., Tivy, A., Angnatok, J., Roy, F., Smith, G., Dupont, F., and Turner, A. K.: Using Icepack to reproduce ice mass balance buoy observations in landfast ice: improvements from the mushy-layer thermodynamics, The Cryosphere, 18, 1685–1708, https://doi.org/10.5194/tc-18-1685-2024, 2024.
Pook, M. J., Risbey, J. S., McIntosh, P. C., Ummenhofer, C. C., Marshall, A. G., and Meyers, G. A.: The seasonal cycle of blocking and associated physical mechanisms in the Australian region and relationship with rainfall, Mon. Wea. Rev., 141, 4534–4553, https://doi.org/10.1175/MWR-D-13-00040.1, 2013.
Purich, A. and Doddridge, E. W.: Record low Antarctic sea ice coverage indicates a new sea ice state, Comm. Earth Environ., 4, 314, https://doi.org/10.1038/s43247-023-00961-9, 2023.
PWRF: The Polar WRF, Byrd Polar and Climate Research Center, The Ohio State University [model], https://polarmet.osu.edu/PWRF/ (last access: 8 April 2024), 2024.
Quan, J., Di, Z., Duan, Q., Gong, W., Wang, C., Gan, Y., Ye, A., and Miao, C.: An evaluation of parametric sensitivities of different meteorological variables simulated by the WRF model, Q. J. R. Meterol. Soc., 142, 2925–2934, https://doi.org/10.1002/qj.2885, 2016.
Raphael, M. N., Hobbs, W., and Wainer, I.: The effect of Antarctic sea ice on the Southern Hemisphere atmosphere during the southern summer, Clim. Dynam., 36, 1403–1417, https://doi.org/10.1007/s00382-010-0892-1, 2011.
Rauber, R., M., Hu, H., Dominguez, F., Nesbitt, S. W., McFarquhar, G. M., Zaremba, T. J., and Finlon, J. A.: Structure of an atmospheric river over Australia and the Southern Ocean. Part I: Tropical and midlatitude water vapor fluxes, J. Geophys. Res.-Atmos., 125, e2020JD032513, https://doi.org/10.1029/2020JD032513, 2020.
Reid, P., Stammerjohn, S., Massom, R. A., Barreira, S., Scambos, T., and Lieser, J. L.: Sea-ice extent, concentration, and seasonality [in “State of the Climate in 2023”], Bull. Am. Meteorol. Soc., 105, 350–353, https://doi.org/10.1175/BAMS-D-24-0099.1, 2024.
Riihelä, A., Bright, R. M., and Anttila, K.: Recent strengthening of snow and ice albedo feedback driven by Antarctic sea-ice loss, Nat. Geosci., 14, 832–836, https://doi.org/10.1038/s41561-021-00841-x, 2021.
Roach, L. A., Dorr, J., Holmes, C. R., Massonnet, F., BLockley, E. W., Notz, D., Rackow, T., Raphael, M. N., O'Farrell, S. P., Bailey, D. A., and Bitz, C. M.: Antarctic Sea Ice Area in CMIP6, Geophys. Res. Lett., 47, e2019GL086729, https://doi.org/10.1029/2019GL086729, 2020.
Schroeter, S. and Sandery, P. A.: Large-ensemble analysis of Antarctic sea ice model sensitivity to parameter uncertainty, Ocean Model., 177, 102090, https://doi.org/10.1016/j.ocemod.2022.102090, 2022.
Sledd, A., Shupe, M. D., Solomon, A., Cox, C. J., Perovich, D., and Lei, R.: Snow thermal conductivity and conductive flux in the Central Arctic: Estimates from observations and implications for models, Elementa-Sci. Anthro., 12, 00086, https://doi.org/10.1525/elementa.2023.00086, 2024.
Skamarock, W. C., Klemp, J. B., Dudhia, J., Gill, D. O., Liu, Z., Berner, J., Wang, W., Powers, J. G., Duda, M. G., Barker, D., and Huang, X.-Y.: Description of the Advanced Research WRF Model Version 4.3 (No. NCAR/TN-556+STR), https://opensky.ucar.edu/islandora/object/opensky:2898 (last access: 3 June 2024), 2019.
Spreen, G., Kaleschke, L., and Heygster, G.: Sea ice remote sensing using AMSR-E 89-GHz channels, J. Geophys. Res., 113, C02S03, https://doi.org/10.1029/2005JC003384, 2008.
Stein, A. F., Draxler, R. R., Rolph, G. D., Stunder, B. J. B., Cohen, M. D., and Ngan, F.: NOAA's HYSPLIT atmospheric transport and dispersion modeling system, Bull. Am. Meteorol. Soc., 96, 2059–2077, https://doi.org/10.1175/BAMS-D-14-00110.1, 2015.
Szapiro, N. and Cavallo, S.: TPVTrack v1.0: A watershed segmentation and overlap correspondence method for tracking tropopause polar vortices, Geosci. Model Dev., 11, 5173–5187, https://doi.org/10.5194/gmd-11-5173-2018, 2018.
Takaya, K. and Nakamura, H.: A Formulation of a Phase-Independent Wave-Activity Flux for Stationary and Migratory Quasigeostrophic Eddies on a Zonally Varying Basic Flow, J. Atmos. Sci., 58, 608–627, https://doi.org/10.1175/1520-0469(2001)058<0608:AFOAPI>2.0.CO;2, 2001.
Tewari, K., Mishra, S. K., Salunke, P., Ozawa, H., and Dewan, A.: Potential effects of the projected Antarctic sea-ice loss on the climate system, Clim. Dyn., 60, 589–601, https://doi.org/10.1007/s00382-022-06320-2, 2023.
Tewari, M., Chen, F., Wang, W., Dudhia, J., Lemone, M. A., Mitchell, K. E., Ek, M. B., Gayno, G., Wegiel, J. W., and Cuenca, R.: Implementation and verification of the unified NOAH land surface model in the WRF model, 20th Conference on Weather Analysis and Forecasting/16th Conference on Numerical Weather Prediction, Seattle, W, American Meteorological Society, 14.2.a, https://opensky.ucar.edu/islandora/object/conference:1576 (last access: 25 January 2024), 2004.
Thomas, D: Sea Ice, 3rd Edn., Wiley-Blackwell, New York (USA) and Oxford (UK), 664 pp., ISBN: 978-1-118-77838-8, 2017.
Terpstra, A., Gorodetskaya, I. V., and Sodemann, H.: Linking sub-tropical evaporation and extreme precipitation over East Antarctica: An atmospheric river case study, J. Geophys. Res.-Atmos., 126, e2020JD033617, https://doi.org/10.1029/2020JD033617, 2021.
Trusel, L. D., Kromer, J. D., and Datta, R. T.: Atmospheric Response to Antarctic Sea-Ice Reductions Drives Ice Sheet Surface Mass Balance Increase, J. Clim., 19, 6879–6896, https://doi.org/10.1175/JCLI-D-23-0056.1, 2023.
UoB: University of Bremen, Sea Ice Remote Sensing, data [data set], https://data.seaice.uni-bremen.de/ (last access: 1 August 2024), 2024.
Vignon, E., Traulle, O., and Berne, A.: On the fine vertical structure of the low troposphere over coastal margins of East Antarctica, Atmos. Chem. Phys., 19, 4659–4683, https://doi.org/10.5194/acp-19-4659-2019, 2019.
Vignon, E., Alexander, S. P., DeMott, P. J., Sotiropoulou, G., Gerber, F., Hill, T. C. J., Marchand, R., Nenes, A., and Berne, A.: Challenging and improving the simulation of mid-level mixed-phase clouds over the high-latitude Southern Ocean, J. Geophys. Res.-Atmos., 126, e2020JD033490, https://doi.org/10.1029/2020JD033490, 2021.
Wallace, J. M. and Hobbs, P. V.: Atmospheric science: An introductory survey, 504 pp., Academic Press Inc., second edition, ISBN-10: 012732951X, ISBN-13: 978-0127329512, 2006.
Wang, J., Massonnet, F., Goosse, H., Luo, H., Barthelemy, A., and Wang, Q.: Synergistic atmosphere-ocean-ice influences have driven the 2023 all-time Antarctic sea-ice record low, Comm. Earth Environ., 5, 415, https://doi.org/10.1038/s43247-024-01523-3, 2024.
Wang, M., Linhardt, F., Lion, V., and Oppelt, N.: Melt Pond Evolution along the MOSAiC Drift: Insights from Remote Sensing and Modeling, Remote Sens., 16, 3748, https://doi.org/10.3390/rs16193748, 2024.
Wang, Z., Li, Z., Zeng, J., Liang, S., Zhang, P., Tang, F., Chen, S., and Ma, X.: Spatial and temporal variations of Arctic sea ice from 2002 to 2017, Earth Space Sci., 7, e2020EA001278, https://doi.org/10.1029/2020EA001278, 2020.
Webster, M., Gerland, S., Holland, M., Hunke. E., Kwok, R., Lecomte, O., Masson, R., Perovich, D., and Sturm, M.: Snow in the changing sea-ice system, Nat. Clim. Change, 8, 945–954, https://doi.org/10.1038/s41558-018-0286-7, 2018.
Wille, J. D., Bromwich, D. H., Nigro, M. A., Cassano, J. J., Mateling, M., Lazzara, M. A., and Wang, S.-H.: Evaluation of the AMPS Boundary Layer Simulations on the Ross Ice Shelf with Tower Observations, J. Appl. Meteorol. Clim., 55, 2349–2367, https://doi.org/10.1175/JAMC-D-16-0032.1, 2016.
Wille, J. D., Bromwich, D. H., Cassano, J. J., Nigro, M. A., Mateling, M. E., and Lazzara, M. A.: Evaluation of the AMPS Boundary Layer Simulations on the Ross Ice Shelf, Antarctica, with Unmanned Aircraft Observations, J. Appl. Meteorol. Clim., 56, 2239–2258, https://doi.org/10.1175/JAMC-D-16-0339.1, 2017.
Wille, J. D., Favier, V., Dufour, A., Gorodetskaya, I. V., Turner, J., Agosta, C., and Codron, F.: West Antarctic surface melt triggered by atmospheric rivers, Nat. Geosci., 12, 911–916, https://doi.org/10.1038/s41561-019-0460-1, 2019.
Wille, J. D., Favier, V., Gorodetskaya, I. V., Agosta, C., Kittel, C., Beeman, J. C., Jourdain, N. C., Lenaerts, J. T. M., and Codron, F.: Antarctic atmospheric river climatology and precipitation impacts, J. Geophys. Res.-Atmos., 126, e2020JD033788, https://doi.org/10.1029/2020JD033788, 2021.
Wille, J. D., Alexander, S. P., Amory, C., Baiman, R., Barthelemy, L., Bergstrom, D. M., Berne, A., Binder, H., Blanchet, J., Bozkurt, D., Bracegirdle, T. J., Casado, M., Choi, T., Clem, K. R., Cordron, F., Datta, R., Di Battista, S., Favier, V., Francis, D., Fraser, A. D., Fourre, E., Garreaud, R. D., Genthon, C., Goorodetskaya, I. V., Gonzalez-Herrero, S., Heinrich, V. J., Hubert, G., Joos, H., Kim, S.-J., King, J. C., Kittel, C., Landais, A., Lazzara, M., Leonard, G. H., Lieser, J. L., Maclennan, M., Mikolajczyk, D., Neff, P., Ollivier, I., Picard, G., Pohl, B., Ralph, F. M., Rowe, P., Schlosser, E., Shields, C. A., Smith, I. J., Sprenger, M., Trusel, L., Udy, D., Vance, T., Vignon, E., Walker, C., Wever, N., and Zou, X.: The Extraordinary March 2022 East Antarctica “Heat” Wave, Part I: Observations and Meteorological Drivers, J. Clim., 37, 757–778, https://doi.org/10.1175/JCLI-D-23-0175.1, 2024a.
Wille, J. D., Alexander, S. P., Amory, C., Baiman, R., Barthelemy, L., Bergstrom, D. M., Berne, A., Binder, H., Blanchet, J., Bozkurt, D., Bracegirdle, T. J., Casado, M., Choi, T., Clem, K. R., Cordron, F., Datta, R., Di Battista, S., Favier, V., Francis, D., Fraser, A. D., Fourre, E., Garreaud, R. D., Genthon, C., Goorodetskaya, I. V., Gonzalez-Herrero, S., Heinrich, V. J., Hubert, G., Joos, H., Kim, S.-J., King, J. C., Kittel, C., Landais, A., Lazzara, M., Leonard, G. H., Lieser, J. L., Maclennan, M., Mikolajczyk, D., Neff, P., Ollivier, I., Picard, G., Pohl, B., Ralph, F. M., Rowe, P., Schlosser, E., Shields, C. A., Smith, I. J., Sprenger, M., Trusel, L., Udy, D., Vance, T., Vignon, E., Walker, C., Wever, N., and Zou, X.: The Extraordinary March 2022 East Antarctica “Heat” Wave, Part II: Impacts on the Antarctic Ice Sheet, J. Clim., 37, 779–799, https://doi.org/10.1175/JCLI-D-23-0176.1, 2024b.
Wille, J. D., Pohl, B., Favier, V., Winters, A. C., Baiman, R., Cavallo, S. M., Leroy-Dos Santos, C., Clem, K., Udy, D. G., Vance, T. R., Gorodetskaya, I., Codron, F., and Berchet, A.: Examining atmospheric river life cycles in East Antarctica, J. Geophys. Res.-Atmos., 129, e2023JD039970, https://doi.org/10.1029/2023JD039970, 2024c.
Wille, J. D., Favier, V., Gorodetskaya, I. V., Agosta, C., Baiman, R., Barrett, J. E., Barthelemy, L., Boza, B., Bozkurt, D., Casado, M., Chyhareva, A., Clem, K. R., Codron, F., Datta, R. T., Duran-Alarcon, C., Francis, D., Hoffman, A. O., Kolbe, M., Krakosvska, S., Linscott, G., Maclennan, M. L., Mattingly, K. S., Mu, Y., Pohl, B., Santos, C. L.-D., Shields, C. A., Toker, E., Winters, A. C., Yin, Z., Zou, X., Zhang, C., and Zhang, Z.: Atmospheric rivers in Antarctica, Nat. Rev. Earth Environ., 6, 178–192, https://doi.org/10.1038/s43017-024-00638-7, 2025.
Williams, N., Byrne, N., Feltham, D., Van Leeuwen, P. J., Bannister, R., Schroeder, D., Ridout, A., and Nerger, L.: The effects of assimilating a sub-grid-scale sea ice thickness distribution in a new Arctic sea ice data assimilation system, The Cryosphere, 17, 2509–2532, https://doi.org/10.5194/tc-17-2509-2023, 2023.
Worby, A. P., Steer, A., Lieser, J. L., Heil, P., Yi, D., Markus, T., Allison, I., Massom, R. A., Galin, N., and Zwally, J.: Regional-scale sea-ice and snow thickness distribution from in situ and satellite measurements over East Antarctica during SIPEX 2007, Deep-Sea Res. Pt. II, 58, 1125–1136, https://doi.org/10.1016/j.dsr2.2010.12.001, 2011.
Xie, H., Ackley, S. F., Yi, D., Zwally, H. J., Wagner, P., Weissling, B., Lewis, M., and Ye, K.: Sea-ice thickness distribution of the Bellingshausen Sea from surface measurements and ICESat altimetry, Deep-Sea Res. Pt. II, 58, 1039–1051, https://doi.org/10.1016/j.dsr2.2010.10.038, 2011.
Xue, J., Xiao, Z., Bromwich, D. H., and Bai, L.: Polar WRF V4.1.1 simulation and evaluation for the Antarctic and Southern Ocean, Front. Earth Sci., 16, 1005–1024, https://doi.org/10.1007/s11707-022-0971-8, 2022.
Yang, J., Xiao, X., Liu, J., Li, and Qin, D.: Variability of Antarctic sea ice extent over the past 200 years, Sci. Bull., 66, 2394–2404, https://doi.org/10.1016/j.scib.2021.07.028, 2021.
Zhang, J.: Modeling the Impact of Wind Intensification on Antarctic Sea Ice Volume, J. Cim., 27, 202–214, https://doi.org/10.1175/JCLI-D-12-00139.1, 2014.
Zhang, R. and Screen, J. A.: Diverse Eurasian winter temperature responses to Barents-Kara sea ice anomalies of different magnitudes and seasonality, Geophys. Res. Lett., 48, e2021GL092726, https://doi.org/10.1029/2021GL092726, 2021.
Zeng, X. and Beljaars, A.: A prognostic scheme of sea surface skin temperature for modeling and data assimilation, Geophys. Res. Lett., 32, L14605, https://doi.org/10.1029/2005GL023030, 2005.
Zou, X., Bromwich, D. H., Montenegro, A., Wang, S.-H., and Bai, L.: Major surface melting over the Ross Ice Shelf part I: Foehn effect, Q. J. R. Meteorol. Soc., 147, 2874–2894, https://doi.org/10.1002/qj.4104, 2021a.
Zou, X., Bromwich, D. H., Montenegro, A., Wang, S.-H., and Bai, L.: Major surface melting over the Ross Ice Shelf part II: Surface energy balance, Q. J. R. Meteorol. Soc., 147, 2895–2916, https://doi.org/10.1002/qj.4105, 2021b.
Zou, X., Rowe, P. M., Gorodetskaya, I., Bromwich, D. H., Lazzara, M. A., Cordero, R. R., Zhang, Z., Kawzenuk, B., Cordeira, J. M., Wille, J. D., Ralph, F. M., and Bai, L.-S.: Strong warming over the Antarctic Peninsula during combined atmospheric River and foehn events: Contribution of shortwave radiation and turbulence, J. Geophys. Res.-Atmos., 128, e2022JD038138, https://doi.org/10.1029/2022JD038138, 2023.