the Creative Commons Attribution 4.0 License.
the Creative Commons Attribution 4.0 License.
 | 26 Feb 2025
Brief communication: Potential of satellite optical imagery to monitor glacier surface flow velocity variability in the tropical Andes
Etienne Ducasse
Romain Millan
Jonas Kvist Andersen
Antoine Rabatel
We present an analysis of glacier dynamics in mountain ranges of the tropical Andes of southern Peru and Bolivia using satellite data from 2013 to 2022. Despite the challenges posed by small glaciers (width<500 m), low velocities (), and high cloudiness during the monsoon, we map annually aggregated surface velocities and quantify the seasonal variability in the fastest parts of the glaciers. Limited trends are observed in the annual velocities over the last decade, but significant seasonal changes between the wet and dry seasons are found, likely controlled by the seasonality in meltwater production and the related changes in the hydrological conditions at the glacier–bedrock interface.
- Article
(2732 KB) - Full-text XML
-
Supplement
(2545 KB) - BibTeX
- EndNote


Ice flow velocity is a critical variable characterizing the dynamics of glaciers and ice caps, serving as a valuable indicator of their response to climate change. Ice flow velocity is also of paramount importance, as it enables one to (i) infer various other physical variables of glaciers, such as ice thickness distribution, basal sliding, or friction; (ii) quantify mass fluxes and loss through ice discharge into lakes or into the sea; and (iii) study glacial instability phenomena such as ice avalanches, glacier/ice shelf destabilizations, and glacier surging (Gilbert et al., 2018; Millan et al., 2023; Jager et al., 2024). Until now, available observations of flow velocities for mountain glaciers (excluding ice caps) have been limited to large glaciers, temporally averaged (Millan et al., 2022) and quantified at coarse spatial resolutions of hundreds of metres (GoLIVE, Scambos et al., 2016; ITS_LIVE, Gardner et al., 2024) or at local scale (Van Wyk de Vries et al., 2022). This directly impacts the study of small glacial features in regions such as the tropical Andes, which experience some of the highest mass losses (Hugonnet et al., 2023).
In the tropical Andes, many studies have been dedicated to surface area or volume changes over the last decades to centuries (e.g. Hastenrath and Ames, 1995; Rabatel et al., 2005, 2013; Basantes-Serrano et al., 2022) and to surface mass balance processes and their relationships with climate conditions and particularly the El Niño–Southern Oscillation (ENSO; e.g. Kaser, 2001; Francou et al., 2003; Rabatel et al., 2013), but the spatiotemporal variability in glacier flow in the tropical region has never been explored in detail. This leaves a significant knowledge gap in our understanding of glacier dynamics and their response to changes in surface processes, thermal regime, or subglacial hydrology under tropical conditions, with direct consequences for ice flow modelling capacities. However, tropical glaciers pose greater challenges than other mountain regions because glaciers are much smaller (a few hundred metres wide), much slower (flow velocity typically ), and are present in climate conditions that do not favour continuous optical satellite coverage, e.g. high cloudiness during the monsoon season that typically spans from November–December to March–April in the Andes of Peru and Bolivia where our study is focused (e.g. Rabatel et al., 2012; Autin et al., 2022).
Therefore, we propose to reconstruct and analyse the evolution of the dynamics of glaciers located in tropical mountain ranges in the Andes of southern Peru and Bolivia from the years 2013 to 2022, building on previous mapping from Millan et al. (2019, 2022). We explore the spatial and temporal variabilities in glacier flow at both decadal and seasonal scales, thus providing the first observations of glacier dynamic variability in the tropics.
2.1 Ice velocity processing
The overall workflow we have developed to retrieve glacier surface flow velocity from satellite imagery has been fully described and validated using diverse glaciers in the Andes, the European Alps, and New Zealand (Millan et al., 2019; Mouginot et al., 2023; Rabatel et al., 2023). Here, we only present a short description of the four modules: (1) database creation and image preparation, (2) glacier surface displacement calculation, (3) data calibration, and (4) post-processing with data filtering and averaging to obtain glacier surface velocity maps.
The image preparation module automatically downloads Sentinel-2 (https://cloud.google.com/storage/docs/public-datasets/sentinel-2, last access: 31 May 2024) and Landsat 8 (https://registry.opendata.aws/usgs-landsat/, last access: 31 May 2024) ortho-rectified images and creates pairs of images with repeat cycles ranging from 5 to 400 d, matching acquisitions in the same orbits for each satellite to minimize residual stereoscopic effects. Additionally, we enhance surface features using a Sobel filter on Sentinel-2's NIR band and the panchromatic band of Landsat 8. To derive glacier surface displacement, we calculate the standardized cross-correlation between two images within a pair (details on window size can be found in Millan et al., 2019, and Rabatel et al., 2023). We automatically calibrate glacier surface flow velocity using ice-free areas to mitigate potential biases arising from relative geometric distortions or geolocation errors between image pairs (see Millan et al., 2019). Our region of interest (ROI) is shown in Fig. 1 and encompasses several glacierized cordilleras in the Andes of southern Peru and northern Bolivia. Glacier outlines are taken from V6.0 of the Randolph Glacier Inventory (RGI Consortium, 2017). The ROI is divided into 159 geo-cubes distributed throughout the study region and with an imprint of 250×250 pixels with a spatial resolution of 50 m. As made for the European Alps in Rabatel et al. (2023), this standardized dataset is stored on a common grid to facilitate the extraction of time series of the surface flow velocity or calculate time-averaged maps.
2.2 Annual map production and seasonal signal extraction
For each geo-cube, a temporal pixel-by-pixel filtering is first performed based on different criteria described in Rabatel et al. (2023). Then, the filtered maps are aggregated into annual mosaics, which are spatially filtered following the procedure described in Rabatel et al. (2023). To aggregate the individual velocity measurements, we used the ordinary least squares (OLS) method, also called the linear regression method (Mouginot et al., 2023). Unreliable pixels are flagged if they present a large variability after filtering, using a coefficient of variation above 75 %, or if the standard deviation on the surface flow direction exceeds 2.5°. The trend is considered significant according to a Mann–Kendall test (Rabatel et al., 2023), and a mask is generated on this basis (Fig. 1B, D, and F). The hypothesis of the presence of a monotonic trend in the time series is accepted when the p-value of the test is below 0.05. Finally, a spatial filtering on the trend map that uses a 5×5 median filter is applied. To extract the seasonal signal from time series data, we use locally weighted scatterplot smoothing (LOWESS). The principle is to perform regression on a certain number of points using a linear or quadratic function over a sliding window, the size of which is determined based on the availability of observation data (Derkacheva et al., 2020). This method is used to automatically determine the approximate dates of seasonal peaks from year to year. We only derived the LOWESS fit when we had a sufficient density of observations, more often during dry seasons after 2016 (Fig. 2).
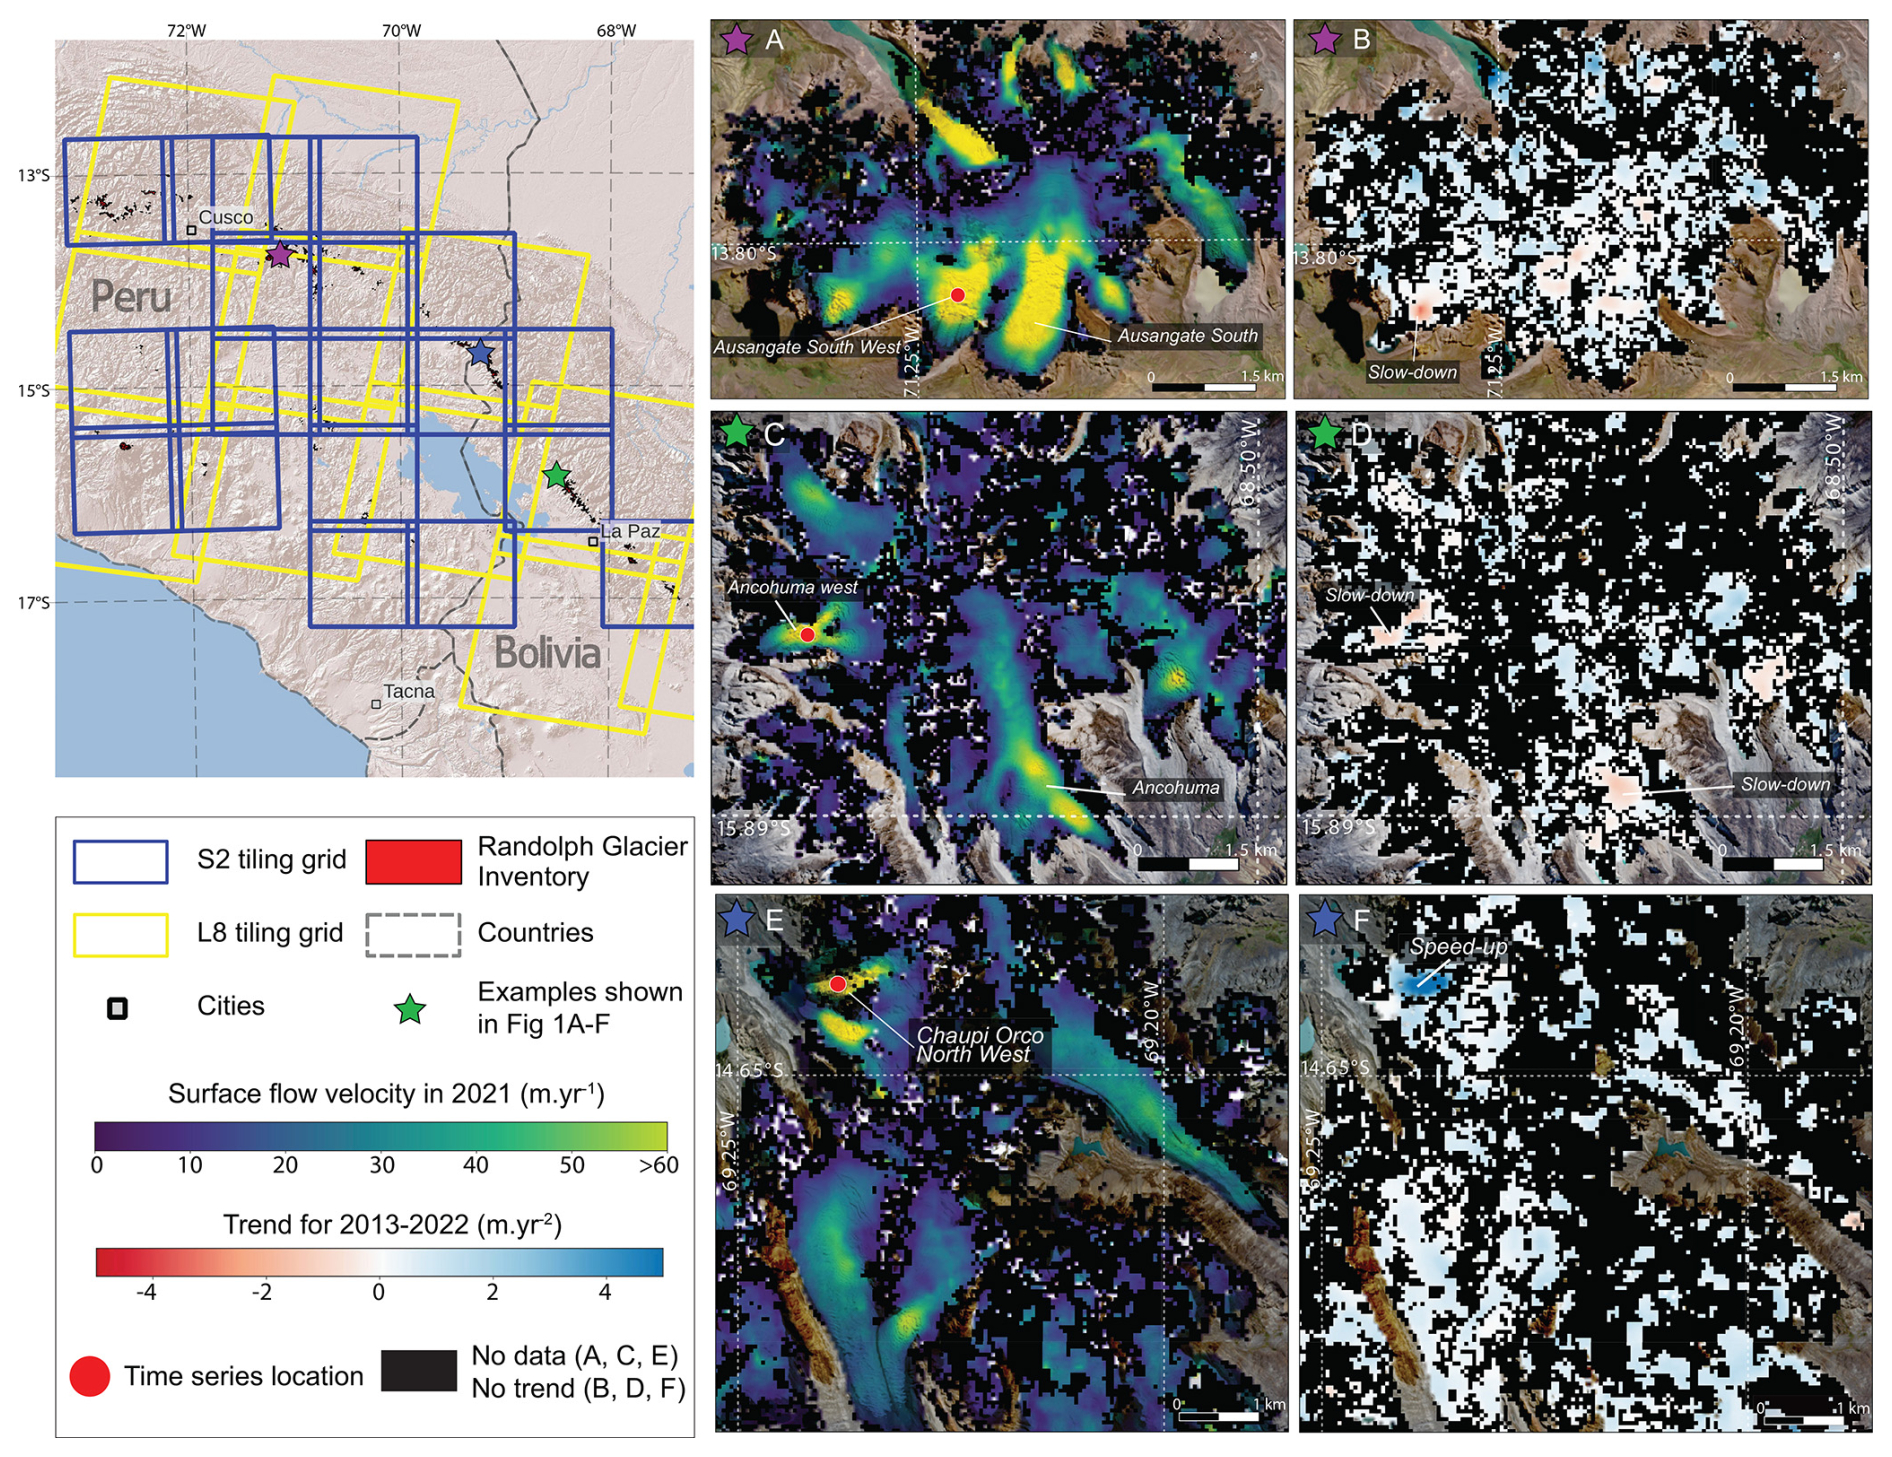
Figure 1Sentinel-2 and Landsat 8 tiles covering the glaciers in the tropical Andes of southern Peru and northern Bolivia considered for glacier surface flow velocity mapping. Panels (a–f) show the mapped ice flow velocity field for 2021 (left) and the velocity trends for the 2013–2022 period (right) for three areas (coloured stars): (a, b) Nevado Ausangate, (c, d) the Ancohuma region, and (e, f) the central part of Cordillera Apolobamba (Ducasse et al., 2024). The background maps for panels (a–f) are cloudless mosaics of Sentinel-2 imagery.
2.3 Evaluation with field measurements
We have evaluated our results by comparing the annually aggregated velocity values with annual in situ d-GNSS measurements of ablation stake displacement located in the lower tongue of the Zongo Glacier in Bolivia, where surface flow velocities range between 5 to 25 m yr−1 (Réveillet et al., 2015). Such velocities are low, and we are reaching the limits of the precision of satellite-derived surface flow velocities (Millan et al., 2019). d-GNSS data are within the level of error of the annually aggregated data, with standard deviations ranging between 10–15 m yr−1. The scatterplot of this comparison can be found in Fig. S1 in the Supplement. Nonetheless, the same kind of comparison was made in the Alps with a larger dataset of d-GNSS measurements made at locations where velocities reach up to 120 m yr−1, hence where the signal-to-noise ratio is more favourable for satellite-derived velocities. In this region, we obtained a very high performance of satellite-derived glacier flow velocity with a root-mean-square error of 10.5 m yr−1 and a coefficient of determination of 0.92 (Rabatel et al., 2023).
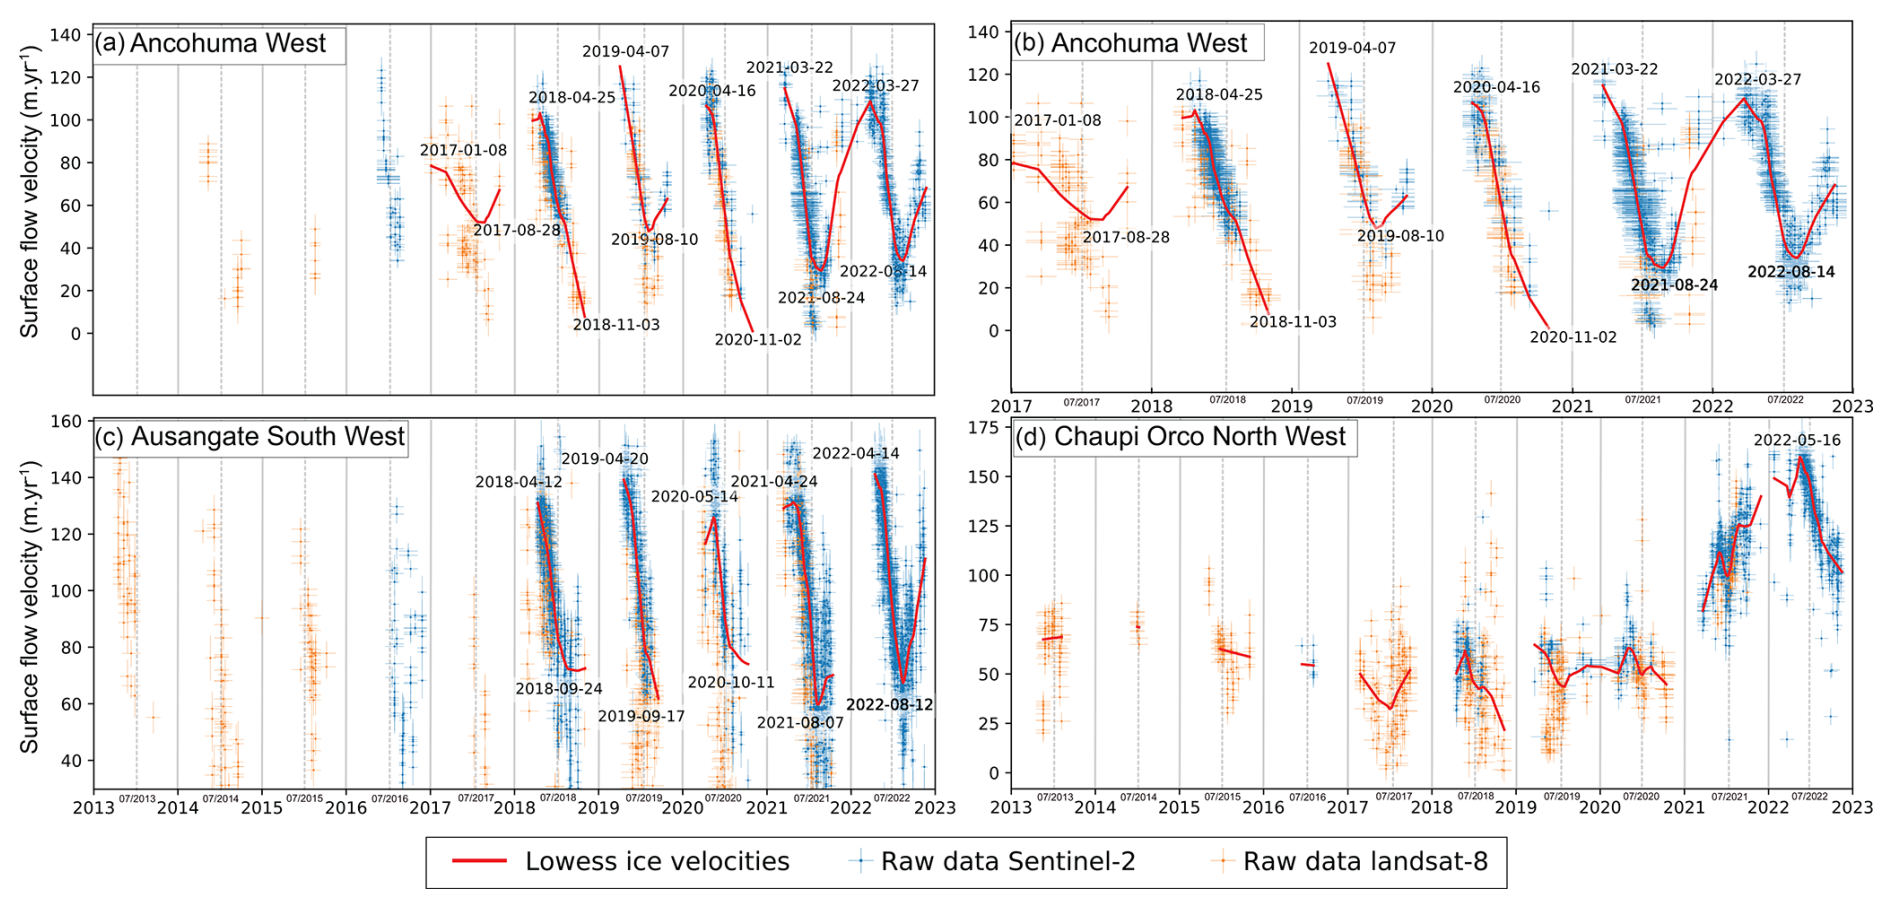
Figure 2Time series of surface flow velocities on selected glaciers shown in Fig. 1 (red dots in Fig. 1A, C, and E). Results for a glacier tongue on the western side of Ancohuma (called Ancohuma West) between 2013 and 2022 (a) and a zoom-in on the 2017–2022 period (b). Results for a glacier located on the southwestern side of Ausangate (called Ancohuma South West) (c) and one located on the northwestern side of Chaupi Orco (d). The velocity is calculated on a window size of 3×3 pixels.
3.1 Overall description and decadal trend
Surface flow velocity maps reveal flow patterns on the smallest glacial features (e.g. 1 km2 on average), where this variable has been measured using medium-resolution satellites (10–15 m pixel size) with global coverage. Generally, surface velocity rarely exceeds 50 m yr−1. However, locally, on the steepest parts of the glacier tongues, velocities can exceed 80 m yr−1, such as on the south of the Ausangate glacier (Cordillera Vilcanota, Peru), with velocities beyond 100 m yr−1 (Fig. 1A); on the lower part of Ancohuma glacier (Cordillera Real, Bolivia), the main tongue of Ancohuma West (Fig. 1C); or on the northwest of the Chaupi Orco glacier located in the Cordillera Apolobamba on the border between Peru and Bolivia (Fig. 1E).
In order to characterize decadal velocity trends, we analyse the regression coefficient values pixel by pixel (Fig. 1B, D, and F). We observe very low trends over the period 2013–2022, with values mostly ranging between −2 and . Some exceptions can be highlighted, notably with an increase in velocities exceeding 6 m yr−2 on the northwest of the Chaupi Orco glacier (Fig. 1F) located on the Nevado Chaupi. In the detailed time series (Fig. 2c and d), we show that this glacier underwent a sudden “surge-like” acceleration in 2020–2022 to reach a maximum velocity on May 2022 of 160 m yr−1. In agreement with the unusual behaviour, one can note that the surface velocities at Chaupi Orco increase during the dry period, i.e. between April–May and October 2021, when a large amount of data is available, lending confidence to this observation. On the contrary, during this period of the year, the velocity of the other glaciers seasonally decreases. For about 18 months, from April 2021 to October 2022, the velocity on the glacier tongue continuously exceeded 100 m yr−1, which is more than twice the average of the period 2013–2020. Chaupi Orco is a lake-terminating glacier: in Fig. S2 in the Supplement, one can note (1) the presence of numerous small icebergs during the event at the proglacial lake surface, contrasting with the years before and after the event, i.e. 2021 and 2024; (2) the widening of the glacier tongue; and (3) a near-disappearance of the debris cover on both sides of the tongue. Although visual and qualitative, these elements go hand in hand with a strong increase in the ice flux. While evidence suggests a possible glacier surge, this phenomenon is quite unusual for tropical glaciers and was only reported once on one of the glaciers on the Antisana volcano in Ecuador (Basantes-Serrano et al., 2022). Further work would be needed to confirm that a surge occurred on the Chaupi Orco glacier.
3.2 Seasonal changes in surface flow velocities
For the glaciers presented in Fig. 2, we observe a strong seasonality in the surface velocities, particularly between the wet season (from approximately November to March) and the dry season (from approx. April to October). For Ancohuma West, the surface flow velocity decreases from 120 m yr−1 in May to 20 m yr−1 in September, representing a reduction of over 80 %. Similar variations are observed throughout the study area, with, for example, a decrease in surface velocities of 60 % for the glaciers located on the southern flank of the Ausangate summit (see Fig. 1). This seasonality is repeated year after year and is observed for a large number of other glaciers in the ROI (not shown). However, it is important to note that the Ancohuma and Ausangate glaciers are among those where it is possible to observe the beginning of the acceleration marking the transition to the wet season in 2021 and 2022, generally occurring in September–October (Fig. 2).
For the first time, we highlight the spatiotemporal variability in glacier dynamics in the tropical Andes. In addition to the decadal changes, we also identify the existence of a seasonal cycle in velocities between the wet and dry seasons that has never been observed before (Fig. 2). We measure a unique dynamical behaviour with significant velocity variations over scales ranging from 4 to 5 months, with reductions of up to 80 % (Fig. 2). It is worth noting that we only observe the glacier surface flow velocities over the period between March–April and October–November (i.e. between the end of the wet season and beginning of the next one). Indeed, the very high cloudiness of the monsoon regime affecting South America during the wet season (i.e. between November–December and March–April) strongly limits the use of optical satellite imagery.
Therefore, there are uncertainties concerning the timing and magnitude of maximum velocity peak, which may occur earlier in the wet season. The use of radar interferometry would be required to measure these flow changes more accurately, specifically for small moving regions (e.g. on ice caps) and during the wet season. However, this remains very challenging due to the pronounced topography (shadowing/layover) and climatic conditions favouring temporal loss of coherence (high precipitation rates and surface melting). These difficulties in recovering phase coherence are illustrated with examples of interferograms provided in Figs. S3 and S4 in the Supplement.
The strong seasonal cycle observed in the glacier surface velocity data can be explained in light of the glaciological regime of the tropical glaciers. On the basis of 27 years of continuous monthly measurements of the surface mass balance of the Zongo glacier (Bolivian Cordillera Real), Autin et al. (2022) showed that the surface mass balance is strongly negative during the transition period between the dry and wet seasons, i.e. from September to December, with the most negative values reached in November. Melting remains high during the wet season, counterbalancing in the ablation area of the glacier the intense snowfalls occurring during the monsoon. From April to August, ablation is limited and largely occurs through sublimation, thus strongly limiting the water production. Therefore, the progressive increase in melting at the glacier surface from September to November leads to a strong water inflow inside and at the bedrock interface of the glacier when the drainage system is particularly inefficient after the dry season. This leads to increasing water pressure and progressively increasing basal sliding, which result in an increase in surface flow velocities as seen in Fig. 2 for the Ausangate and Ancohuma glaciers, particularly for the last 2 years of observation. Then, the strong surface melt rates during the wet season maintain high meltwater discharge that promotes the development of efficient subglacial drainage networks. At the end of the wet season (i.e. in March–April), decreasing melt rates at the glacier surface limit the water discharge, thus explaining the large slowdown in glacier flow velocities. Even if the glaciological regime differs in the tropics in comparison to the mid-latitudes, such a seasonal pattern is consistent with what was described by Gilbert et al. (2022) on the Argentière Glacier in the French Alps.
The changes in glacier flow in the Andes are close to the limits of what can be accurately measured using Landsat 8 and Sentinel-2 satellites (Millan et al., 2019). This is due to the very small size of the glaciers and their very slow flow velocities, typically lower than 50 m yr−1. High-resolution measurements of glacier flow (e.g. SPOT, Pléiades) and continuous field measurements (e.g. d-GNSS) would be useful for strengthening the analysis presented here. However, our study sheds light on previously unexplored dynamic processes in tropical glaciers with implications for understanding their dynamical response to changes in surface melt and subglacial hydrology.
Finally, it should be noted that glaciers in the mountain ranges studied here are not debris-covered. In other cordilleras of the tropical Andes, such as Peru's Cordillera Blanca, debris-covered glaciers are more numerous, and in situ velocity measurements have taken place on some of them (e.g. Hubbard and Clemmens, 2008). Although these debris-covered glacier tongues have low velocities, generally less than a few tens of metres per year, their surface texture (linked to the debris) and temporal persistence mean that correlation algorithms using long temporal baselines (e.g. 1 year or more) can allow us to retrieve consistent velocity values, as shown by Cusicanqui et al. (2024) using Landsat data on rock glaciers in Chile.
Our study demonstrates the feasibility of using satellite optical imagery to monitor glacier surface flow velocity in the tropical Andes, despite challenges posed by small glacier size, low velocities, and extensive cloud cover. While limited decadal trends were observed over the study period, satellite optical sensors from the Sentinel-2 and Landsat 8 missions are able to detect significant seasonal variations in surface flow velocities, providing valuable insights into tropical glacier dynamics. We also emphasize the need for complementary measurements (e.g. repeat high-resolution imagery, continuous d-GNSS monitoring, ground radar interferometry) to enhance our understanding of ice dynamic variability, particularly during the monsoon season, when satellite optical imagery data are most scarce.
Annual surface flow velocity maps for 2013–2022, along with velocity direction, trends, and error maps, are available at https://doi.org/10.57745/OJBTSE (Ducasse et al., 2024).
The supplement related to this article is available online at https://doi.org/10.5194/tc-19-911-2025-supplement.
RM and AR designed the study. RM, ED, and JKA developed the code and processed and analysed the data. ED prepared the article with contributions from all co-authors.
The contact author has declared that none of the authors has any competing interests.
Publisher's note: Copernicus Publications remains neutral with regard to jurisdictional claims made in the text, published maps, institutional affiliations, or any other geographical representation in this paper. While Copernicus Publications makes every effort to include appropriate place names, the final responsibility lies with the authors.
This work was performed at the Institut des Géosciences de l'Environnement and at the University of Copenhagen. Etienne Ducasse, Romain Millan, and Antoine Rabatel acknowledge funding from the OSUG LabEx. Jonas Kvist Andersen acknowledges funding from the Villum Foundation. We acknowledge the Service National d'Observation GLACIOCLIM (UGA-OSUG, CNRS-INSU, IRD, INRAE, Météo-France, IPEV) and its counterpart in Bolivia (UMSA-IGEMA, Alvaro Soruco) for the long-term monitoring of the Zongo glacier. This work is dedicated to Jérémie Mouginot, co-PI of the LabEx project, who passed away in September 2022.
This research has been supported by LabEx OSUG@2020 (Investissement d’Avenir, ANR-10-LABX-56) and the Villum Foundation (Villum Young Investigator grant no. 29456).
This paper was edited by Wesley Van Wychen and reviewed by Andres Rivera and Whyjay Zheng.
Autin, P., Sicart, J. E., Rabatel, A., Soruco, A., and Hock, R.: Climate controls on the interseasonal and interannual variability of the surface mass and energy balances of a tropical glacier (Zongo Glacier, Bolivia, 16° S): new insights from the multi-year application of a distributed energy balance model, J. Geophys. Res.-Atmos., 127, e2021JD035410, https://doi.org/10.1029/2021JD035410, 2022.
Basantes-Serrano, R., Rabatel, A., Francou, B., Vincent, C., Soruco, A., Condom, T., and Ruíz, J. C.: New insights into the decadal variability in glacier volume of a tropical ice cap, Antisana (0°29′ S, 78°09′ W), explained by the morpho-topographic and climatic context, The Cryosphere, 16, 4659–4677, https://doi.org/10.5194/tc-16-4659-2022, 2022.
Cusicanqui, D., Lacroix, P., Bodin, X., Robson, B. A., Kääb, A., and MacDonell, S.: Detection and reconstruction of rock glaciers kinematic over 24 years (2000–2024) from Landsat imagery, EGUsphere [preprint], https://doi.org/10.5194/egusphere-2024-2393, 2024.
Derkacheva, A., Mouginot, J., Millan, R., Maier, N., and Gillet-Chaulet, F.: Data reduction using statistical and regression approaches for ice velocity derived by Landsat-8, Sentinel-1 and Sentinel-2, Remote Sens.-Basel, 12, 1935, https://doi.org/10.3390/rs12121935, 2020.
Ducasse, E., Millan, R., and Rabatel, A.: Annual glacier surface flow velocity product from Sentinel-2 data for some mountain ranges in the Tropical Andes, Recherche Data Gouv [data set], https://doi.org/10.57745/OJBTSE, 2024.
Francou, B., Vuille, M., Wagnon, P., Mendoza, J., and Sicart, J. E.: Tropical climate change recorded by a glacier in the central Andes during the last decades of the twentieth century: Chacaltaya, Bolivia, 16° S, J. Geophys. Res.-Atmos., 108, 4154, https://doi.org/10.1029/2002JD002959, 2003.
Gardner, A. S., Fahnestock, M. A., and Scambos, T. A.: MEaSUREs ITS_LIVE Landsat image-pair glacier and ice sheet surface velocities: Version 1, National Snow and Ice Data Center [data set], https://doi.org/10.5067/IMR9D3PEI28U, 2024.
Gilbert, A., Leinss, S., Kargel, J., Kääb, A., Gascoin, S., Leonard, G., Berthier, E., Karki, A., and Yao, T.: Mechanisms leading to the 2016 giant twin glacier collapses, Aru Range, Tibet, The Cryosphere, 12, 2883–2900, https://doi.org/10.5194/tc-12-2883-2018, 2018.
Gilbert, A., Gimbert, F., Thøgersen, K., Schuler, T. V., and Kääb, A.: A consistent framework for coupling basal friction with subglacial hydrology on hard-bedded glaciers, Geophys. Res. Lett., 49, e2021GL097507, https://doi.org/10.1029/2021GL097507, 2022.
Hastenrath, S. and Ames, A.: Recession of Yanamarey glacier in Cordillera Blanca, Peru, during the 20th century, J. Glaciol., 41, 191–196, https://doi.org/10.3189/S0022143000017883, 1995.
Hubbard, B. and Clemmens, S.: Recent high-resolution surface velocities and elevation change at a high-altitude, debris-covered glacier: Chacraraju, Peru, J. Glaciol., 54, 479–486, https://doi.org/10.3189/002214308785837057, 2008.
Hugonnet, R., Millan, R., Mouginot, J., Rabatel, A., and Berthier, E.: Un atlas mondial pour caractériser la réponse des glaciers au changement climatique, La Météorologie, 120, 037, https://doi.org/10.37053/lameteorologie-2023-0015, 2023.
Jager, E., Gillet-Chaulet, F., Mouginot, J., and Millan, R.: Validating ensemble historical simulations of Upernavik Isstrøm (1985–2019) using observations of surface velocity and elevation, J. Glaciol., 70, 1–18, https://doi.org/10.1017/jog.2024.10, 2024.
Kaser, G.: Glacier-climate interaction at low latitudes, J. Glaciol., 47, 195–204, https://doi.org/10.3189/172756501781832296, 2001.
Millan, R., Mouginot, J., Rabatel, A., Jeong, S., Cusicanqui, D., Derkacheva, A., and Chekki, M.: Mapping surface flow velocity of glaciers at regional scale using a multiple sensors approach, Remote Sens.-Basel, 11, 2498, https://doi.org/10.3390/rs11212498, 2019.
Millan, R., Mouginot, J., Rabatel, A., and Morlighem, M.: Ice velocity and thickness of the world's glaciers, Nat. Geosci. 15, 124–129, https://doi.org/10.1038/s41561-021-00885-z, 2022.
Millan, R., Jager, E., Mouginot, J., Wood, M. H., Larsen, S. H., Mathiot, P., Jourdain, N. C., and Bjørk, A.: Rapid disintegration and weakening of ice shelves in North Greenland, Nat. Commun., 14, 6914, https://doi.org/10.1038/s41467-023-42198-2, 2023.
Mouginot, J., Rabatel, A., Ducasse, E., and Millan, R.: Optimization of cross correlation algorithm for annual mapping of alpine glacier flow velocities; application to Sentinel-2, IEEE T. Geosci. Remote, 61, 1–12, https://doi.org/10.1109/TGRS.2022.3223259, 2023.
Rabatel, A., Jomelli, V., Naveau, P., Francou, B., and Grancher, D.: Dating of Little Ice Age glacier fluctuations in the tropical Andes: Charquini glaciers, Bolivia, 16° S, C. R. Geosci., 337, 1311–1322, https://doi.org/10.1016/j.crte.2005.07.009, 2005.
Rabatel, A., Bermejo, A., Loarte, E., Soruco, A., Gomez, J., Leonardini, G., Vincent, C., and Sicart, J. E.: Can the snowline be used as an indicator of the equilibrium line and mass balance for glaciers in the outer tropics?, J. Glaciol., 58, 1027–1036, https://doi.org/10.3189/2012JoG12J027, 2012.
Rabatel, A., Francou, B., Soruco, A., Gomez, J., Cáceres, B., Ceballos, J. L., Basantes, R., Vuille, M., Sicart, J.-E., Huggel, C., Scheel, M., Lejeune, Y., Arnaud, Y., Collet, M., Condom, T., Consoli, G., Favier, V., Jomelli, V., Galarraga, R., Ginot, P., Maisincho, L., Mendoza, J., Ménégoz, M., Ramirez, E., Ribstein, P., Suarez, W., Villacis, M., and Wagnon, P.: Current state of glaciers in the tropical Andes: a multi-century perspective on glacier evolution and climate change, The Cryosphere, 7, 81–102, https://doi.org/10.5194/tc-7-81-2013, 2013.
Rabatel, A., Ducasse, E., Millan, R., and Mouginot, J.: Satellite-derived annual glacier surface flow velocity products for the European Alps, 2015–2021, Data, 8, 66, https://doi.org/10.3390/data8040066, 2023.
Réveillet, M., Rabatel, A., Gillet-Chaulet, F., Soruco, A.: Simulations of changes to Glaciar Zongo, Bolivia (16° S), over the 21st century using a 3-D full-Stokes model and CMIP5 climate projections, Ann. Glaciol., 56, 89–97, https://doi.org/10.3189/2015AoG70A113, 2015.
RGI Consortium: Randolph Glacier Inventory – A Dataset of Global Glacier Outlines: Version 6.0: Technical Report, Global Land Ice Measurements from Space, https://doi.org/10.7265/N5-RGI-60, 2017.
Scambos, T., Fahnestock, M., Moon, T., Gardner, A., and Klinger, M.: Global land ice velocity extraction from Landsat 8 (GoLIVE), Version 1, Boulder, Colorado USA. NASA National Snow and Ice Data Center Distributed Active Archive Center [data set], https://doi.org/10.7265/N5ZP442B, 2016.
Van Wyk de Vries, M., Carchipulla-Morales, D., Wickert, A. D., and Minaya, V. G.: Glacier thickness and ice volume of the Northern Andes, Sci. Data, 9, 342, https://doi.org/10.1038/s41597-022-01446-8, 2022.