the Creative Commons Attribution 4.0 License.
the Creative Commons Attribution 4.0 License.
 | 16 Dec 2025
Kinetic grain growth in firn induced by meltwater infiltration on the Greenland Ice Sheet
Kirsten L. Gehl
Joel T. Harper
Neil F. Humphrey
The microstructure of polar firn governs its porosity, permeability, and compaction rate, and is thus critical to understanding surface elevation change, heat and gas exchange, and meltwater infiltration on ice sheets. At high-elevation, dry firn locations, kinetic grain growth is known to occur when very large temperature gradients cause vapor transport within the firn. Previous studies identify warm katabatic winds in winter and solar insolation in summer as drivers of kinetic grain growth, though both produce only millimetre-scale layers near surface. Here, we demonstrate that meltwater infiltration in the percolation zone of the Greenland Ice Sheet (GrIS) can also cause temperature gradients sufficient for kinetic grain growth, explaining our observations of centimetre- to decimetre-scale layers of kinetic grain forms (ranging from faceted crystals to depth hoar) persisting to depths of up to 16 m. We analysed subsurface temperature time series from a transect on the western GrIS to resolve thermal regimes associated with infiltration-driven kinetic grain growth. Two distinct mechanisms responsible for faceting were identified: one associated with the onset of the wet layer, the other with preferential meltwater flow events. For both mechanisms, elevated vapor fluxes were calculated and diminished grain sphericity was observed in SNOWPACK model simulations, implying each can facilitate kinetic grain growth. Wet layer onset was the dominant mechanism, producing pronounced reductions in sphericity and the most enduring faceted layers. Additionally, the rate of wetting front propagation influenced the longevity of faceted layers, with rapid infiltration preferentially producing lasting, lower-sphericity firn grains. As surface melt expands across the GrIS, constraining the influence of these faceted layers on meltwater storage, surface elevation change, and chemical transport will become increasingly important.
- Article
(8836 KB) - Full-text XML
-
Supplement
(595 KB) - BibTeX
- EndNote


The microstructure of snow and firn encompasses its optical, mechanical and physical characteristics, including the geometries of ice grains, bonds, and pore spaces (e.g., Colbeck, 1987), all of which are fundamental to understanding the evolutionary processes of the firn column. Key properties such as grain size and form influence the firn column's permeability and porosity (Adolph and Albert, 2014; The Firn Symposium Team, 2024). Microstructural characteristics, therefore, govern the exchange of heat and mass (Adolph and Albert, 2014; Calonne et al., 2019) through the movement of air, water, and vapor (Davis et al., 1996), as well as the transport of chemical species (Johnsen et al., 2000). Furthermore, microstructure plays a critical role in the physics controlling the rate of firn compaction (Anderson and Benson, 1963; Salamatin et al., 2009), an essential aspect of all studies concerning surface elevation change of ice sheets.
Persistent katabatic winds along the flanks of the Greenland Ice Sheet (GrIS) typically result in a deposited snowpack consisting of wind-packed, sub-millimetre, broken crystal fragments (e.g., Benson, 1962). Coupled mechanical and thermodynamic processes increase density with burial, eventually forming firn and, later, glacial ice (Cuffey and Paterson, 2010). In addition to grain deformation and mutual displacement, the size, shape, and bonding between grains evolves relatively rapidly. Molecular movement – via volume and surface diffusion – reduces curvature variation between grains and facilitates grain rounding (Colbeck, 1980, 1982a; Yosida, 1955). Bonds enlarge at grain contacts, primarily driven by vapor transport via sublimation due to high vapor pressure over ice (Colbeck, 1980, 1983). Additionally, larger-radius grains grow at the expense of smaller ones, reducing total surface energy (Colbeck, 1980). After aging and burial to several metres' depth, firn grains become rounded with maximum diameters falling near 2 mm (e.g., Benson, 1962; Vandecrux et al., 2022).
Despite prevailing rounding processes in the firn column, observations of near-surface, centimetre-scale layers of depth hoar on the Antarctic Ice Sheet (Albert et al., 2004; Gow, 1968; Grootes and Steig, 1992; Watanabe et al., 1997) and the Greenland Ice Sheet (Alley et al., 1990; Benson, 1962; Steffen et al., 1999) imply that kinetic grain growth can occur in some circumstances. Kinetic grain growth is the increased evaporitic sublimation and condensation of water from one snow crystal to another (e.g., Akitaya, 1974; Colbeck, 1982b) due to heightened vapor fluxes favoured by strong temperature gradients, which facilitate the formation of faceted crystals (e.g., Akitaya, 1974; Colbeck, 1982b, 1983; Marbouty, 1980). In some circumstances, convective vapor transport may influence kinetic grain growth (Jafari et al., 2022; Jafari and Lehning, 2023). The spectrum of resulting forms ranges from grains with squared sides to cup-shaped pyramids (Fierz et al., 2009; Fierz and Baunach, 2000) (the latter often called “depth hoar”). In the case of polar ice sheets, observed thin faceted layers are attributed to strong temperature gradients that develop in low-density, near-surface snow in high-elevation, dry firn environments. These surface temperature gradients are driven by warm katabatic winds during winter or by solar insolation in summer (Albert et al., 2004; Alley et al., 1990; Steffen et al., 1999). Facets formed by these mechanisms are preserved up to ∼2 m depth before elimination by rounding processes and overburden-driven compaction processes.
Rare observations of highly developed faceted crystals occurring in centi- to decimetre-scale layers at depths of up to ∼5 m have been reported in the GrIS percolation zone (McDowell et al., 2023; Nghiem et al., 2005). In addition, in this paper we present detailed documentation of faceted crystals in firn cores from the GrIS percolation zone including individual layers of up to 1 m thick and identifiable as deep as 16 m below the surface. These findings are inconsistent with previously proposed mechanisms for GrIS kinetic growth, which are limited to thin, near-surface layers under cold and dry conditions (Albert et al., 2004; Alley et al., 1990; Steffen et al., 1999). Instead, alternative mechanisms – potentially driven by the unique interplay of wet and cold conditions in the percolation zone – may be responsible for the development and preservation of kinetic grain forms.
In the percolation zone, meltwater generated at the surface infiltrates the underlying firn, which remains significantly colder due to the preceding winter cold wave. Widespread meltwater forms a 0 °C wet layer that penetrates downward up to several meters depth and persists for weeks or more during the summer melt season (e.g., Saito et al., 2024). Additionally, preferential flow paths (pipes) locally route additional meltwater up to several meters below the wetting front (Colbeck, 1972; Humphrey et al., 2012; Marsh and Woo, 1984a, b). Meltwater infiltration therefore advects heat into cold firn, potentially establishing localized temperature gradients sufficient to support kinetic grain growth. Kinetic grain growth has previously been linked to wet snow layers and melt-freeze crusts in laboratory studies (e.g., Hammonds et al., 2015; Jamieson and Fierz, 2004) and in seasonal snowpacks (e.g., Dick et al., 2023; Jamieson, 2006).
Here, we document extensive faceting within the firn column of the GrIS percolation zone. We investigate the mechanisms driving kinetic grain growth under the unique temperature gradients generated by meltwater infiltration into cold firn. Using nearly a decade of in situ temperature time-series data, we characterize temperature gradients and vapor fluxes associated with wetting fronts and preferential flow paths. To constrain kinetic growth under observed conditions, we apply the one-dimensional multi-layer firn model, SNOWPACK (Bartelt and Lehning, 2002; Lehning et al., 2002), to evaluate changes in grain sphericity
2.1 Study area and observation period
Field observations were collected along the Expéditions Glaciologiques Internationales au Groenland (EGIG) line (Finsterwalder, 1959) in the western GrIS percolation zone. The transect ranges from 1401–2102 m a.s.l. (Fig. 1) and data were collected from 2007–2009, 2017–2020, and 2022–2024. While melt across the transect decreases with increasing elevation, winter accumulation is relatively equal across the region, averaging about 0.5 (RACMO, Noël, 2019). In situ temperature measurements throughout the firn column reveal that the summer heat wave penetrates more deeply at lower transect elevations, driven by increased latent heat transfer (Saito et al., 2024) and higher thermal conductivity resulting from greater firn density (Harper et al., 2012), the former dominating the heat balance. These processes produce steeper temperature gradients in the deep firn, enhancing heat flux into the underlying ice (Saito et al., 2024).
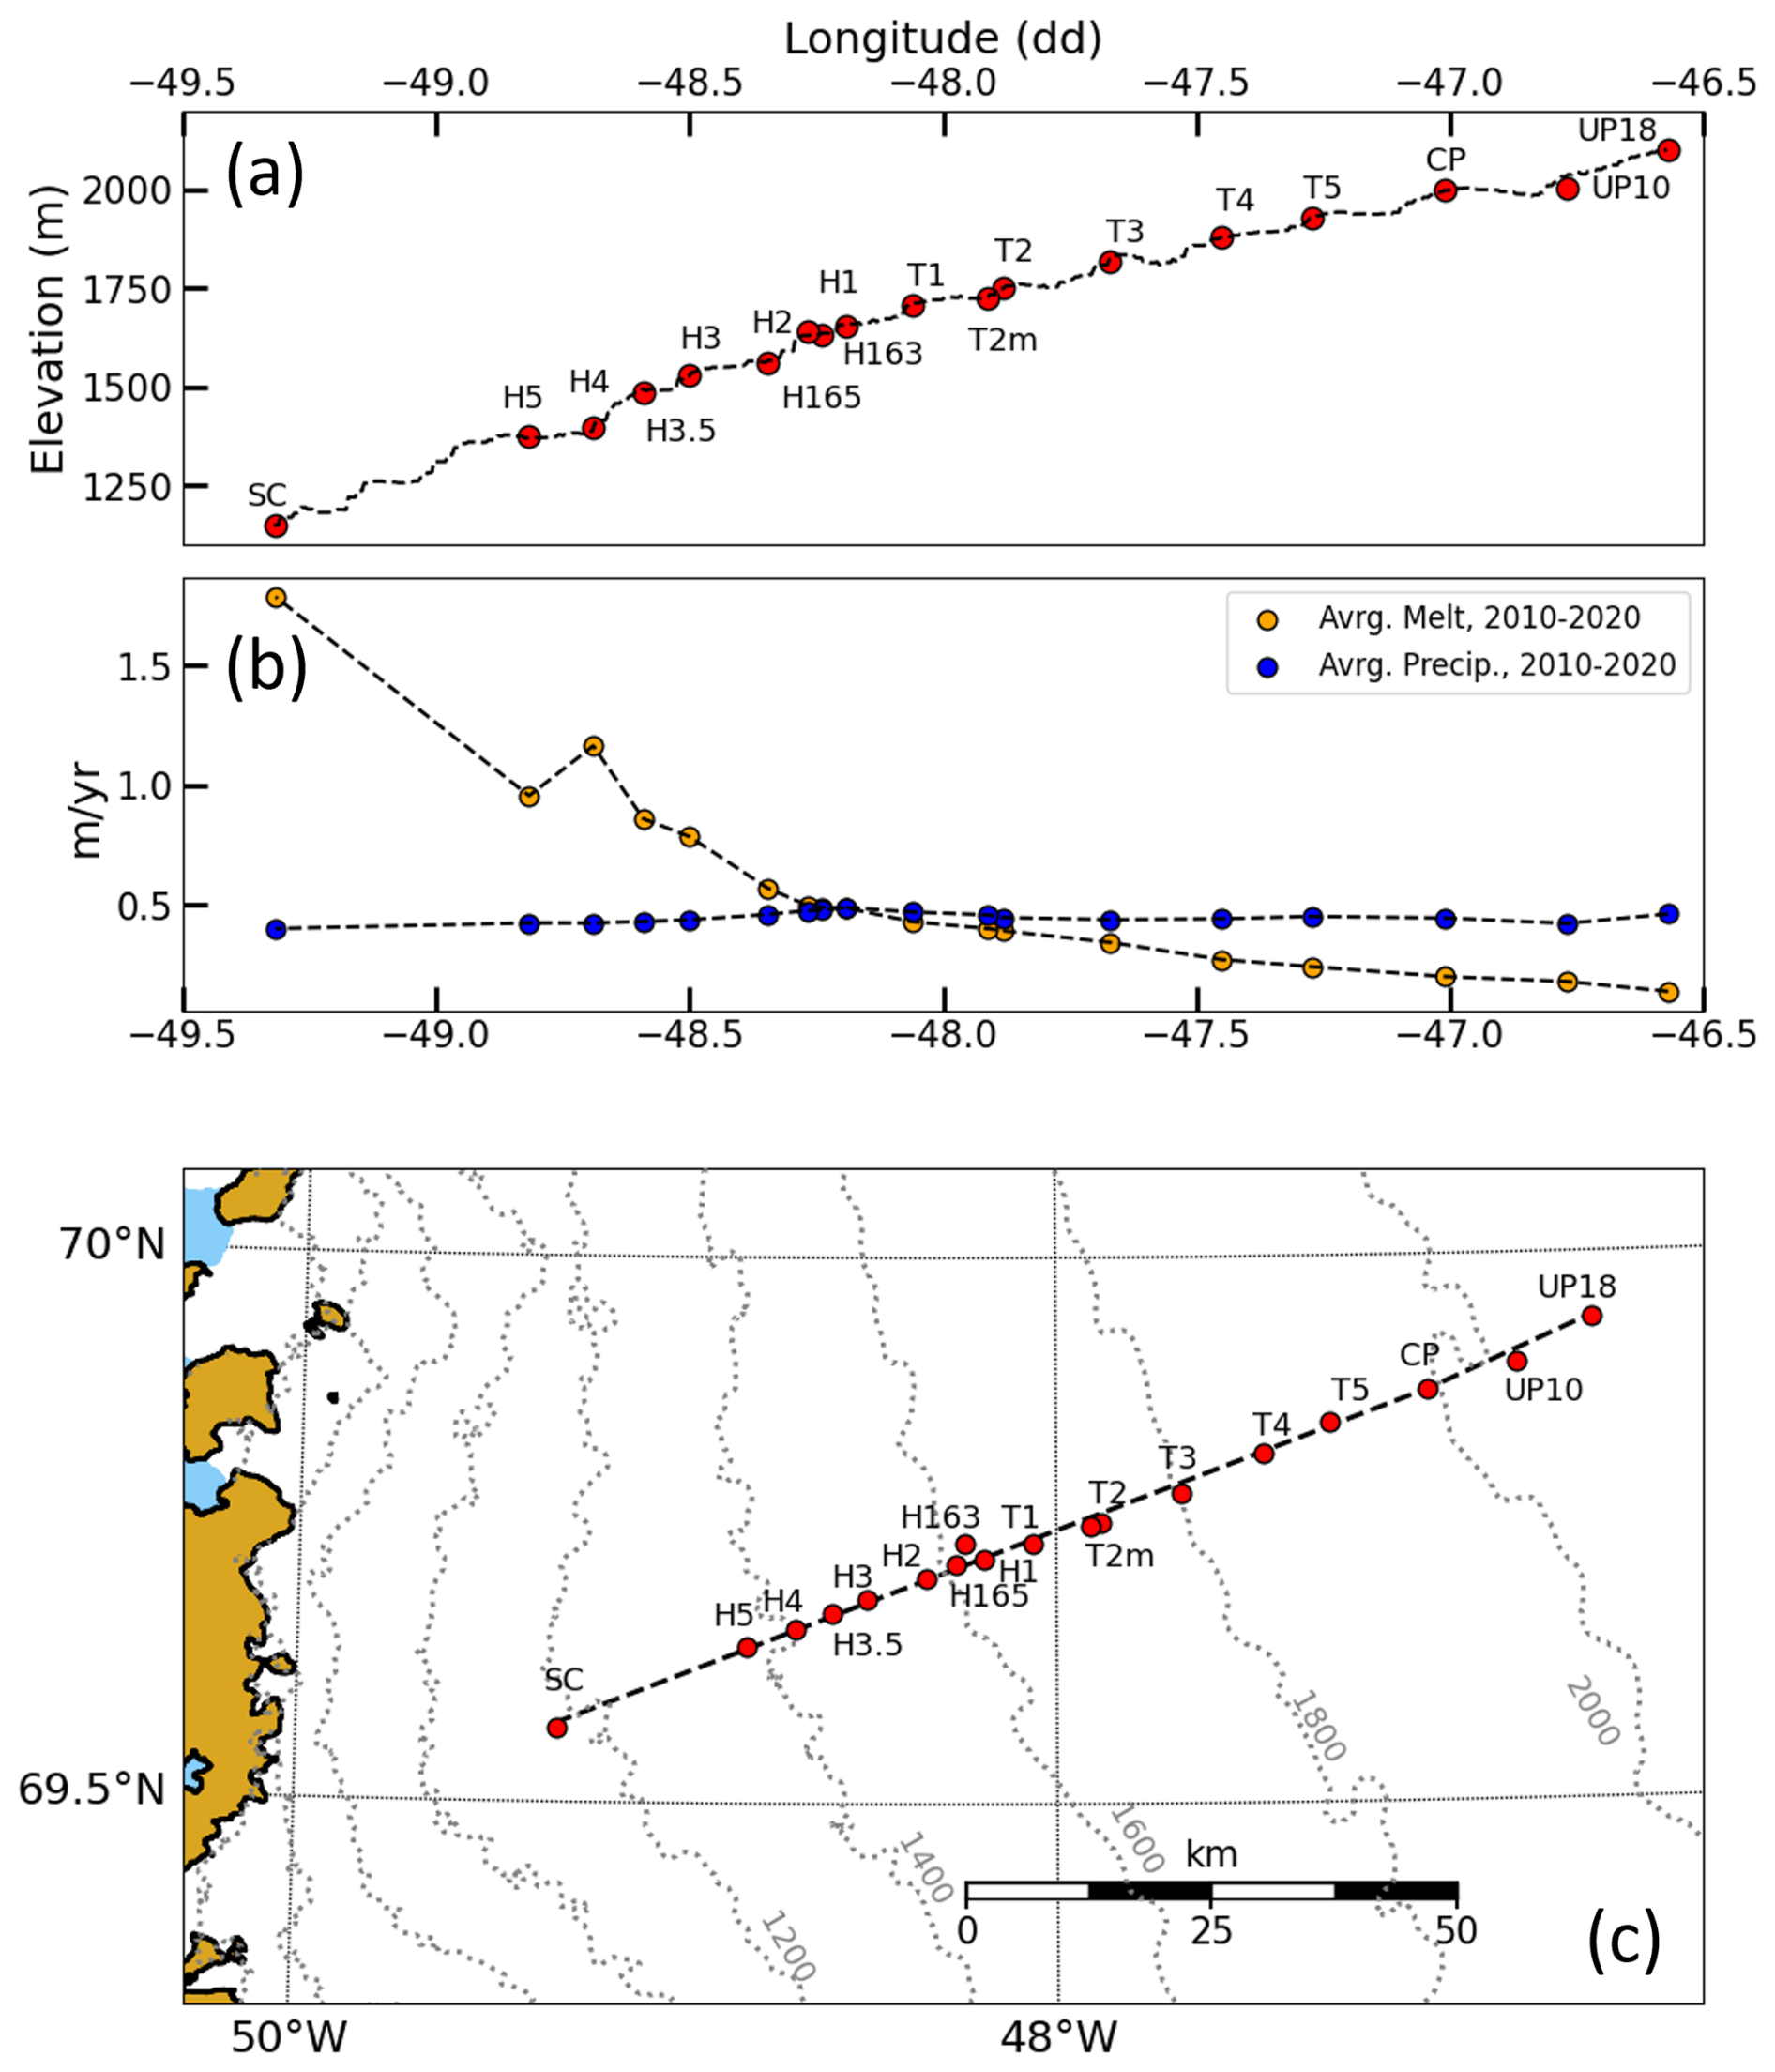
Figure 1Study area. (a) Elevation profile, (b) annual melt and precipitation amounts, and (c) plan-view map of sites in the study area. SC (Swiss Camp) is not a part of this study but is the lowest elevation site on the EGIG. Precipitation and melt data were averaged from year-resolution RACMO datasets from 2010–2020.
2.2 Firn core measurements
A total of 38 firn cores with 79 mm diameter were drilled to depths from 4–32 m, with 95 % of cores ≥10 m and 50 % of cores ≥25 m depth. Cores were processed in the field to measure density, ice content, and microstructural characteristics including grain size, grain form, and specific surface area (SSA) on some occasions. SSA (mm−1) measurements were collected using the infraSNOW device (Gergely et al., 2014) from which optical equivalent grain diameter (OED, mm) can be calculated (e.g., Gergely, 2011; Montpetit et al., 2011). Grain forms were categorized as faceted, depth hoar, rounded, or ice. Core sections were weighed with an electronic balance with 1 gram resolution and lengths were measured with 1 cm resolution, providing mean density of sections.
2.3 Kinetic grain growth
Strong temperature gradients produce large vapor pressure gradients which drive mass transfer between snow grains and facilitate kinetic grain growth (Colbeck, 1982b, a; Perla and Ommanney, 1985). Higher snowpack temperatures allow for greater vapor pressures and potential crystal growth, with vapor concentrations at −15 °C almost 1000x larger than at −65 °C (Kamata et al., 1999). However, measuring vapor pressure is challenging and prone to high error, thus it is widely accepted that working with temperature is best practice (Colbeck, 1987). We therefore adopt the approach of numerous prior studies (e.g., Colbeck, 1987; LaChapelle and Armstrong, 1977; Marbouty, 1980) that associate grain faceting with a threshold temperature gradient of °C m−1. Here, we use the term Critical Temperature Gradient (CTG) to refer to any temperature gradient above the threshold that is therefore indicative of facet-forming conditions.
2.3.1 Temperature gradients
Temperature strings were installed in 24 core holes at 17 sites (Fig. 1) over the observational record. Holes were backfilled with fine-grained cold snow following installation. Strings installed in 2019 and 2022–2024 were fitted with digital temperature chips spaced from 0.125–1 m apart, depending on year, with accuracy of 0.1 °C and resolution of 0.0078 °C. Thermistor strings were installed from 2007–2009 with sealed 50k ohm thermistors at nominal 0.5 m spacing. Because thermistors are more sensitive to calibration and drift, accuracy is estimated at <0.5 °C with measurement precision of 0.02 °C. Data were recorded every 20–30 min (depending on location and year) by data loggers installed on poles at the surface. Given staggered installation and data downloading, time series cover varying intervals.
Central-differenced temperature gradients () were calculated at single timesteps from temperature time series. Gradients exceeding the °C m−1 threshold were identified and categorized as a CTG. The CTGs associated with either (a) wetting fronts or (b) preferential flow mechanisms of infiltration were classified by manual inspection of temperature time series, based on positioning and duration. For example, wetting front CTGs were immediately beneath the 0 °C, surface-propagating isotherm and persisted for weeks, whereas the CTGs associated with piping events were far below the wetting front and lasted for hours to days. Site conditions and interannual variability of meltwater percolation also contributed to variability in the depths and durations of CTGs – because of this, cumulative CTG characteristics affiliated with the two infiltration mechanisms were reported on a site-by-site basis and were not normalized. In some cases, larger-magnitude gradients °C m−1 were subset for comparisons. Due to sensor spacing, we emphasize that CTGs that occurred at finer vertical resolutions (<0.125 m) are not represented in our datasets. This is a limitation in subsequent analyses, as thermal conditions may allow for fine-scale CTG formation that were undetectable provided our methodologies.
2.3.2 Vapor fluxes
Provided our study sites are colder than typical seasonal snowpacks where most temperature gradient metamorphism studies are performed (e.g., the mean annual air temperature at CP-1998m is about −16.5 °C), we expect relatively reduced rates of kinetic grain growth in GrIS percolation zone firn. We therefore calculate vapor fluxes from temperature to assure that temperature gradients are sufficient to drive vapor flux amidst cool ambient temperatures. Using the Clausius-Clapeyron relation and the non-linear dependence of equilibrium water vapor density on temperature, vapor flux can be predicted from temperature (Colbeck, 1983; Sturm and Benson, 1997). We calculate equilibrium vapor density using Sturm and Benson (1997)'s 1D vapor diffusion model for a subarctic snowpack, which assumes a constant thermal conductivity with snowpack height, heat/vapor flow only in the upwards direction, and that vapor density is in thermal equilibrium with the surrounding snow, a common assumption (Colbeck, 1982b). Approximate equilibrium vapor density can then be expressed as:
where ρv0 is the equilibrium vapor density at the melting point ( kg m−3), L is the latent heat of sublimation ( J kg−1), T0=273.15 K, T is the measured temperature (Kelvin), and R is a gas constant (461.9 ). From Eq. (1), we can then solve for vapor flux using Fick's First Law (Colbeck, 1983; Pinzer et al., 2012):
where Jv is the vapor flux (), Deff is the effective vapor diffusivity in the air component of snow ( m2 s−2) (Pinzer et al., 2012), and is the equilibrium vapor density gradient between two neighboring temperature sensors within a temperature profile. Because temperatures in our study area are like those of a subarctic snowpack, we compared modelled vapor fluxes to those reported by Sturm and Benson (1997).
2.4 SNOWPACK simulations
To constrain sphericity changes in grain forms due to infiltration driven metamorphism, we utilized the 1D multi-layer snow physics model, SNOWPACK (Bartelt and Lehning, 2002; Lehning et al., 2002). SNOWPACK performs reliably under conditions where meltwater is present (Wever et al., 2015, 2016), making it suitable for simulating the percolation zone. Moon et al. (2025) found good agreement between wet layer depth and duration simulated by SNOWPACK with similar configurations to our approach and values derived from in situ measurements. SNOWPACK simulates grain sphericity evolution over time – the most quantitative indicator of kinetic grain growth, as facets exhibit low sphericity – enabling us to test the effectiveness of various meltwater-induced temperature regimes in reducing sphericity. For old, dry snow, sphericity change in SNOWPACK occurs in two regimes dictated primarily by and, secondarily, ambient snowpack temperature. The transition between the two regimes is arbitrary, and readers are referred to Lehning et al. (2002) for details. A site-specific simulation was run based on weather and firn stratigraphy data to evaluate temperature gradient metamorphism under observed conditions at the CP-1998m site. Additionally, idealized simulations were run to test two observed temperature gradient scenarios (described in the Results section) independent of site-specific ice layer stratigraphy or weather events.
2.4.1 Site-specific simulation
We simulated a summer melt season at site CP-1998m to assess sphericity changes in a complex firn structure subjected to highly variable and transient atmospheric forcing. The model was run from 1 March–31 December 2019 and forced with data from the ECMWF Reanalysis v5 (ERA5) climate model (Muñoz Sabater, 2019; Hersbach et al., 2020), as in-situ GC-NET PROMICE (Steffen et al., 2022) weather data at the site in 2019 lacked incoming LWR values. ERA5 forcings were provided at hourly timesteps. We initialized the model with spring conditions using data from a firn density profile measured in a core drilled in May 2023 and a temperature profile measured on 1 March 2024. Microstructural properties ascribed to the firn profile are provided in Table S1 in the Supplement. SNOWPACK was configured in its “Polar” variant (Steger et al., 2017), utilizing Richard's equation for water transport (Lehning et al., 2002; Wever et al., 2015), and with mass transport by vapor flow (Jafari et al., 2020). Precipitation was set to reaccumulate at each timestep and internal timesteps were set to 20 min with outputs every hour.
2.4.2 Synthetic simulations
To investigate whether meltwater can systematically induce kinetic grain growth and faceting, we conducted two synthetic firn column simulations under idealized initial conditions and meteorological forcings. Both simulations were initialized using a 50-year spin-up with sinusoidal, annual-wavelength meteorological forcings that excluded melt. The spin-up was initialized with a 15 m-deep synthetic firn profile using the Herron and Langway formulation for increasing firn density with depth (Herron and Langway, 1980), assuming a constant new snow density of 315 kg m−3 (Fausto et al., 2018; Howat, 2022) mean annual accumulation rate of 0.4 (RACMO, Noël, 2019), and pure ice density of 917 kg m−3. A vertical temperature profile and lower Dirichlet boundary condition of −16.5 °C (Saito et al., 2024) was ascribed to the firn column, the mean annual air temperature (MAAT) of site CP-1998m. Universal microstructural parameters reflective of percolation zone properties were also provided (Table S2 in the Supplement). The spin up was forced with a sinusoidal air temperature curve with a 1 year wavelength starting/ending on 1 April, amplitude of 14.5 °C, max temperature of −2 °C and minimum of −31 °C. The MAAT of these temperature forcings reflect that of site CP-1998m (∼2000 m a.s.l.). All other forcings were set constant except precipitation, which occurred randomly and amounted to 0.4–0.5 (Table S2), and were provided at hourly timesteps. The resulting firn column following spin-up on 1 April, for example, exhibited a near-vertical deep temperature profile of −16.5 °C and a smooth density profile. SNOWPACK was configured identically to the site-specific simulation during the spin-up and additional parameterizations are provided in the Supplement (Table S2 and Fig. S1).
The first of the two transient synthetic simulations, referred to as the Wetting Front simulation, modelled the downward propagation of the 0 °C isotherm over the summer melt season. The spin-up output on 1 April was used as the starting firn profile for the transient run. Generalized air temperature and shortwave/longwave radiation forcings were applied at hourly timesteps, using average values measured from 1995–2020 by the GC-NET PROMICE station at CP-1998m (Fig. S1) (Steffen et al., 2022). Average hourly air temperature was computed and fit with a sinusoidal, year-length temperature curve and a secondary, diurnally fluctuating sinusoid (Fig. S1). Longwave radiation was calculated directly from temperature using the Stefan-Boltzmann Law. Shortwave radiation values were also averaged hourly and trimmed with two sinusoidal envelopes to smooth local minima and maxima (Fig. S1). Winter shortwave radiation values were set to 0 (Fig. S1). Precipitation occurred randomly and amounted to 0.5 . Wind speed, direction, and relative humidity were set equal to spin-up values (Fig. S1). The simulation was run from 1 April–31 December, with model configurations identical to that of the site-specific simulation.
The second simulation, termed the Preferential Flow (Piping) simulation, was designed to reproduce a thermal signature characteristic of a piping event, where isolated deep warming results from liquid water traveling through preferential flow paths and refreezing above an impermeable layer. The spin-up output on 1 July was used as the starting firn profile. Because preferential flow physics are not well represented in SNOWPACK, a simplified workaround was employed by inserting a ∼10 cm-thick layer composed of 13 % liquid water, 85 % ice, and 2 % air, between 2.0–2.1 m depth and directly above a 1 cm-thick, 100 % ice layer. Three microstructural parameters – grain radius, sphericity, and “mk” – were modified prior to the insertion of this layer. As melt was not produced during the spin-up, grain radii were universally smaller than those typically observed in the percolation zone. To address this, we uniformly increased grain radii by a factor of 1.5, resulting in average sizes slightly smaller than those reported by McDowell et al. (2023). Initial sphericity values were also modified and set to 0.5 throughout the firn column. The “mk” microstructural parameter (SNOWPACK marker, see Lehning et al., 2002) was set to 1, indicating snow had become faceted. All other firn properties were retained from the 1 July spin-up output. This simulation was run for 15 d (1–15 July) using the same meteorological forcings as the Wetting Front simulation (Fig. S1), but with 10 min internal timesteps to better resolve rapid thermal responses.
3.1 Faceted Grains
We observed faceted grains ranging from endmember, hexagonally-shaped depth hoar to, more commonly, square-shaped grains or grains with angular sides (Fig. 2). When viewed in core sections, faceted layers were distinct due to their rough, jagged outer surface (Fig. 2). In some circumstances, faceted layers were friable and disintegrated in the core drill. Notably, small, vertical ice pipes were occasionally observed in core sections and did not display identifiable faceted grains along their margins. Faceted grain diameters ranged from 1–5.5 mm, with a mean diameter of 2.6 mm (n=231). At 11.6 m depth at site UP10-2005m, the optical equivalent diameter (OED) of faceted firn grains ranged from 1.15–2.4 mm, with a mean OED of 1.33 mm. Our faceted grain sizes and OED values were larger than the grain diameters of ∼0.9–1.2 mm observed at high-elevation percolation zone sites by McDowell et al. (2023), or the 0.8–1.7 mm OED values in a dry firn core drilled at Summit Station (Linow et al., 2012). Facets were identified at 9 sites along the transect and within 19 individual cores (Fig. 3). Generally, faceted layers were less noticeable and more challenging to identify with increasing depth. Faceted layers were observed from 0 to 16 m depth with thicknesses of up to 1 m (Fig. 3). Most faceted layers were located within 5 m of the surface, but notable layers at 6 sites were identified >10 m below surface (Fig. 3).
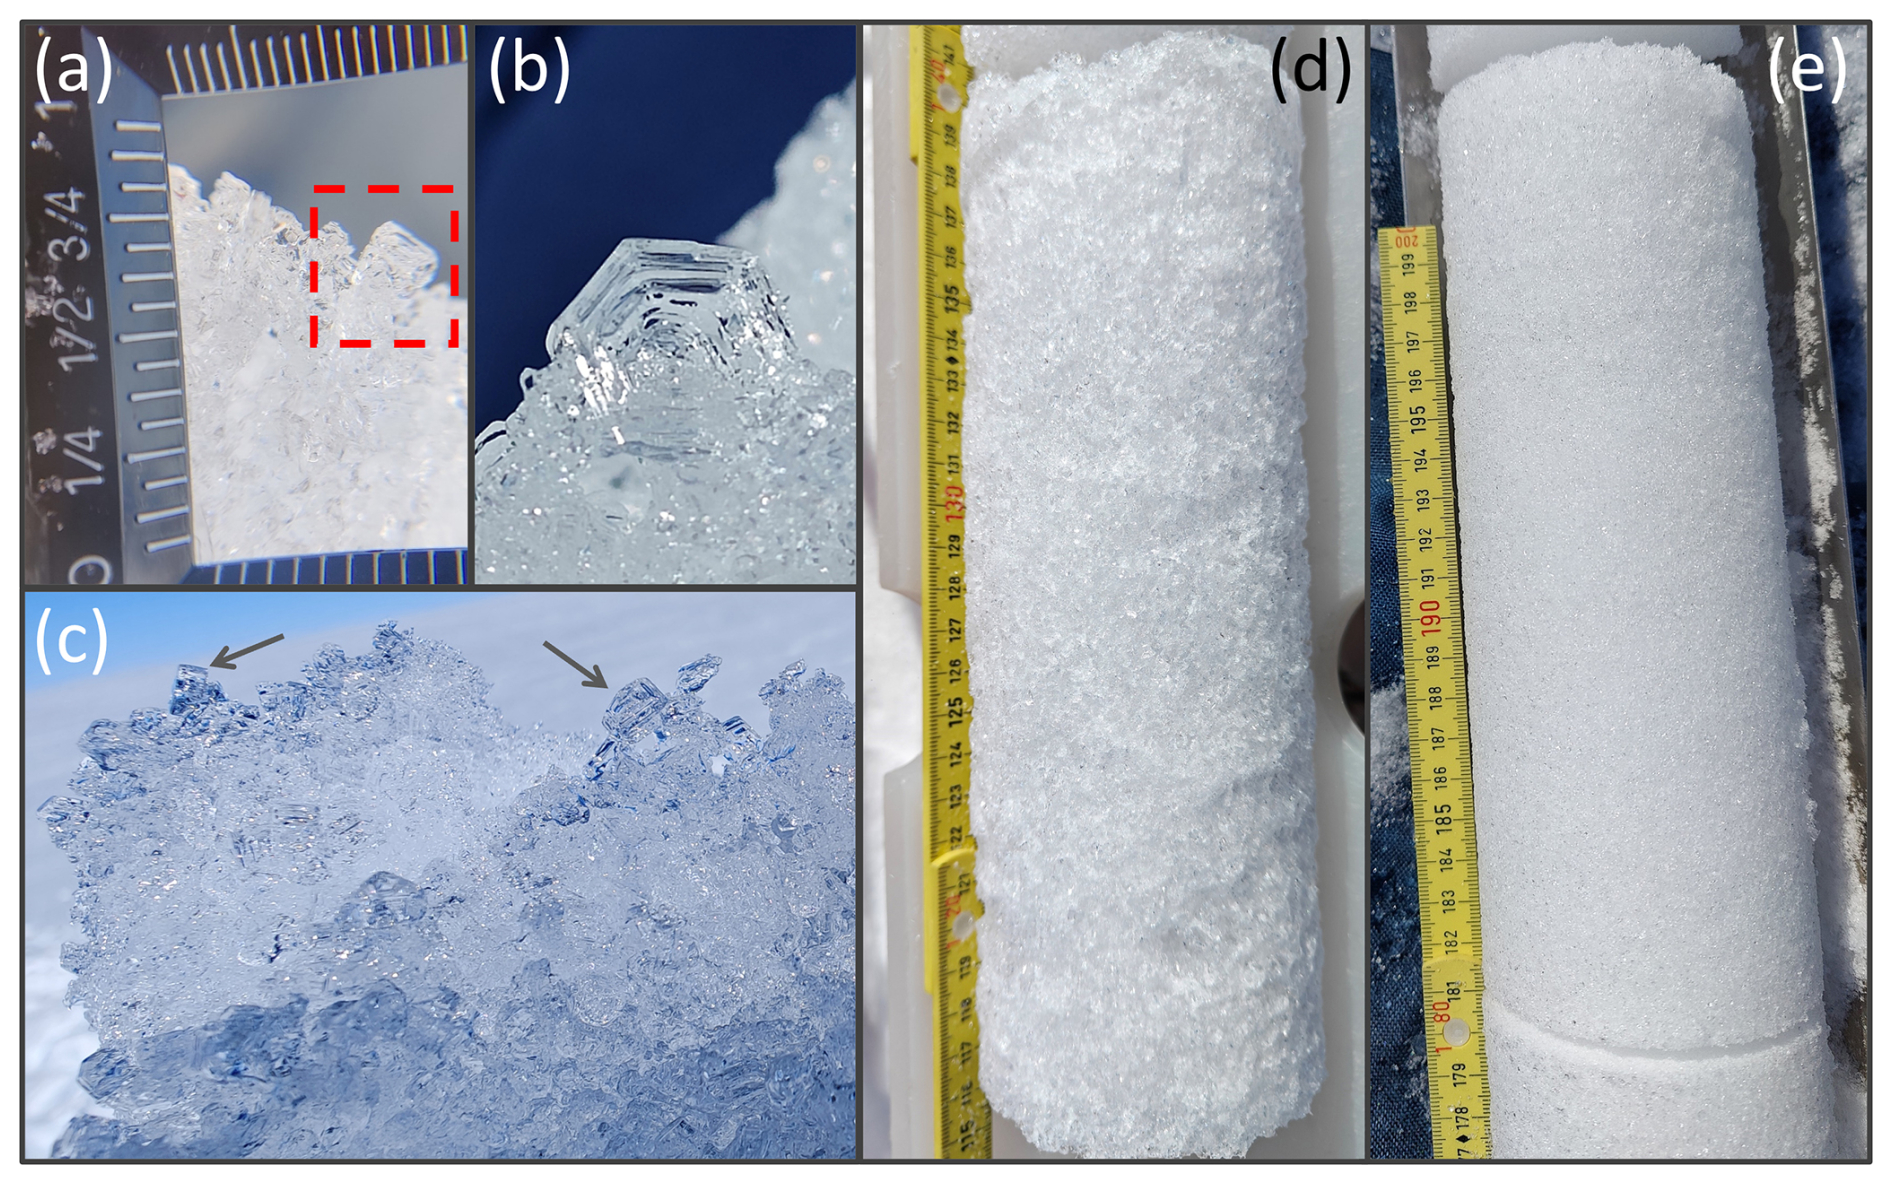
Figure 2Photographs of faceted grains. (a) Square, faceted firn grain observed at site T3-1818m at 6.9 m depth, spring 2022. The straight, upward-facing edge of the grain within the red dashed box measures ∼3–4 mm in length (see scale). (b) Depth hoar grain observed at site CP-1998m at 1.5 m depth, spring 2024. The grain was located beneath the previous year's summer melt surface, with an estimated grain size of ∼4 mm. This grain shape represents an end-member kinetic growth form. (c) Example of friable, faceted grain clusters pulled from a core section. Arrows point to two square, faceted grains. (d) Coarse, faceted firn grains within a rough, bumpy core section (site CP-1998m, spring 2023, 11 m depth), compared to (e), fine, ∼1 mm diameter rounded firn grains in core section (site CP-1998m, spring 2022, 10 m depth).
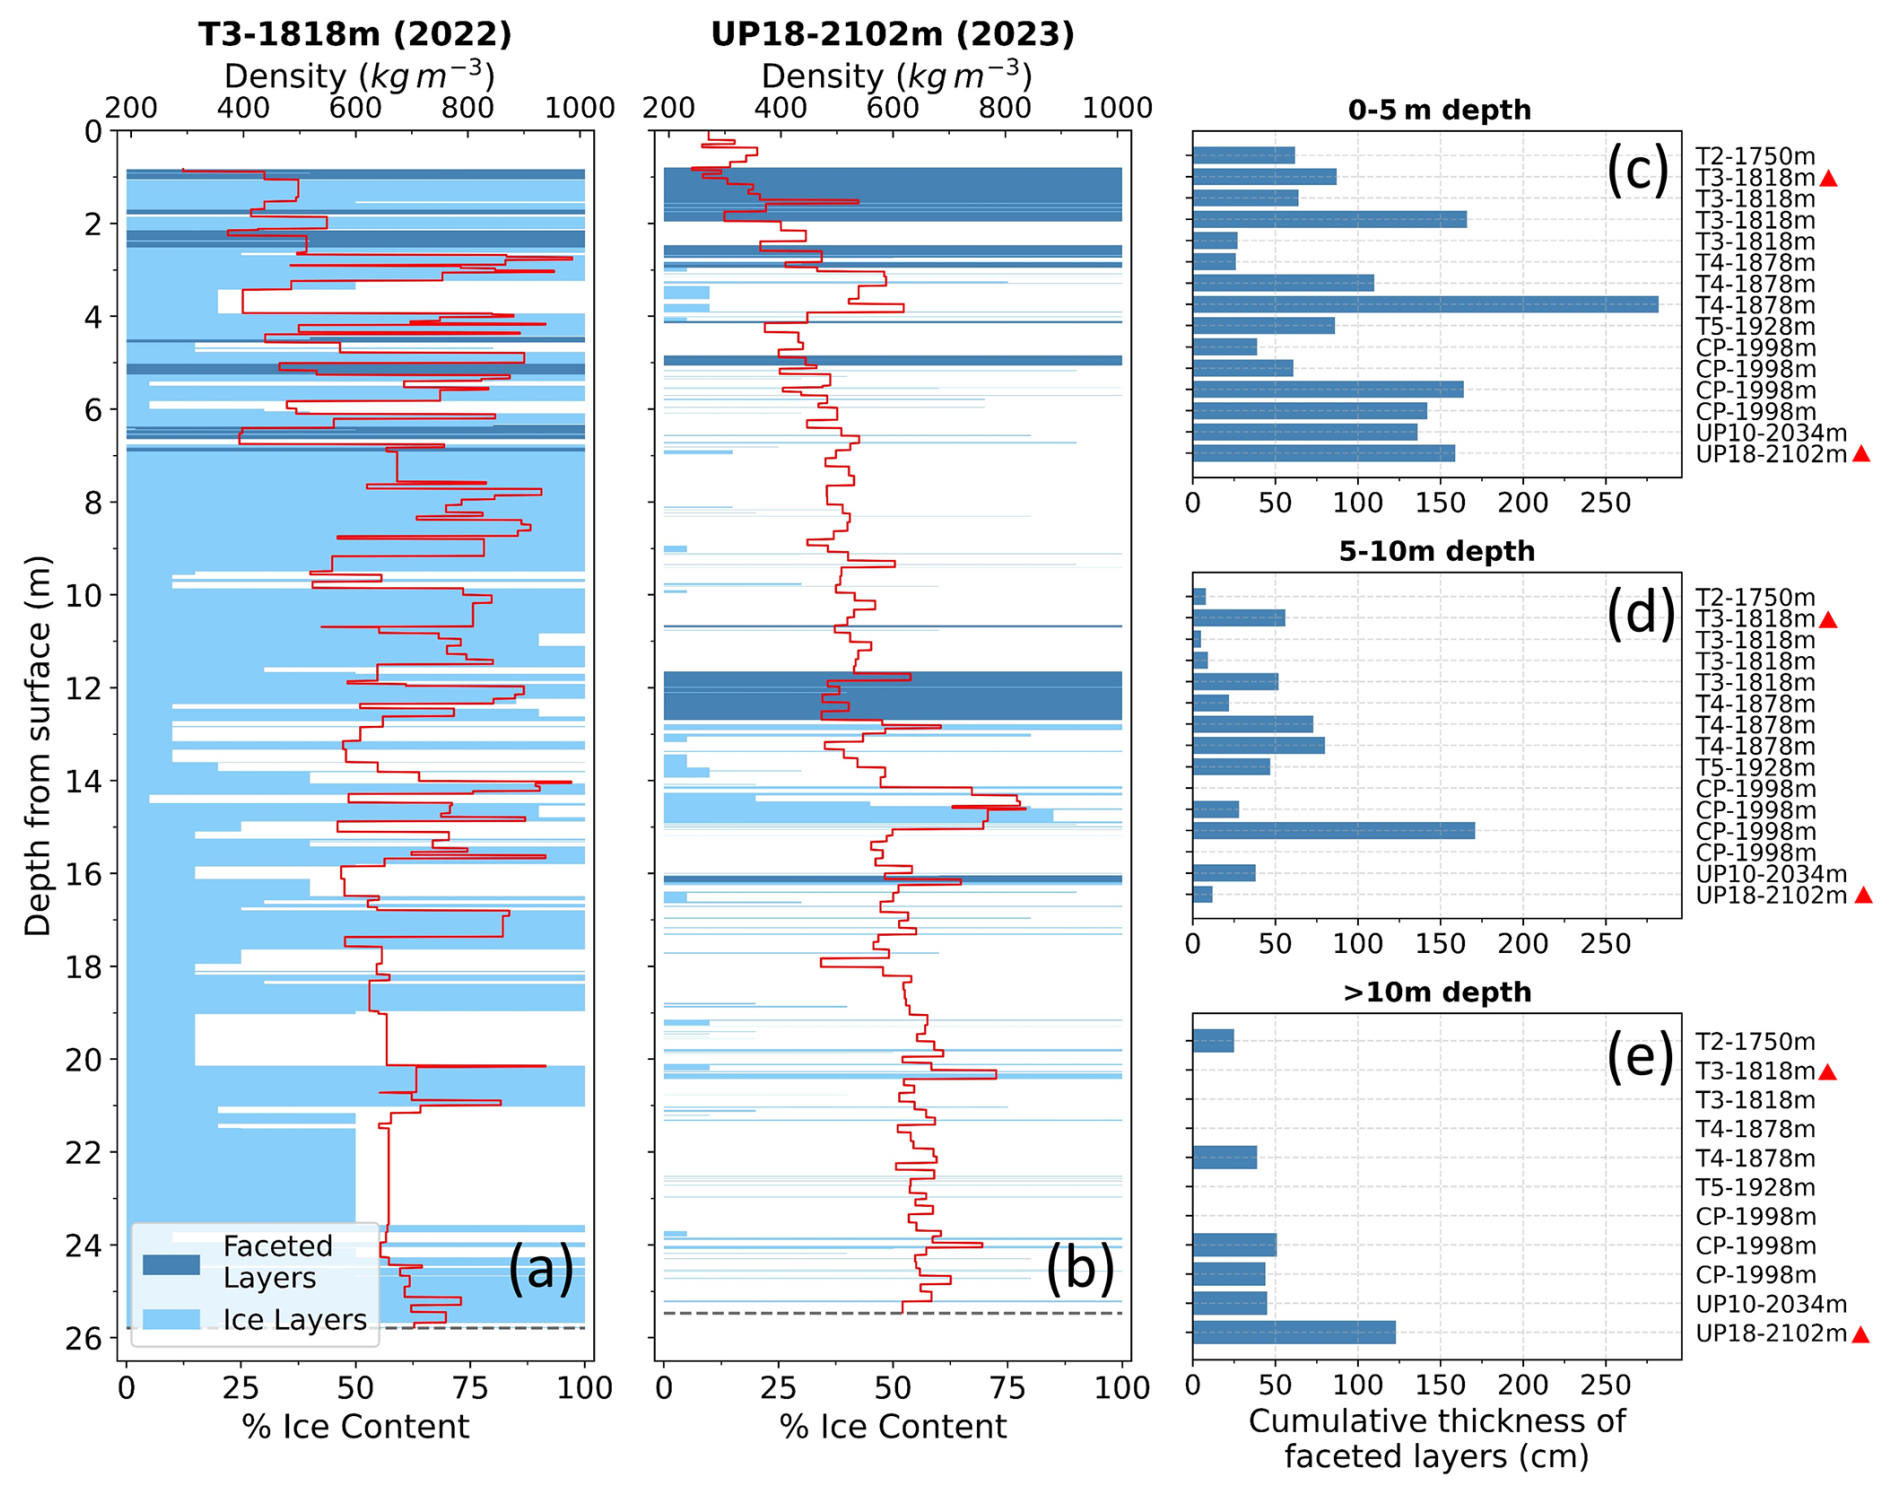
Figure 3Firn core profiles and depth distribution of observed faceted layers. (a, b) Ice content, faceted layers, and density stratigraphy from two cores: (a) T3-1818m, drilled 2022 and (b) UP18-2102m, drilled 2023, where light blue horizontal bars indicate approximate % ice content and dark blue bars indicate faceted layers. Density at a given point in the firn core is denoted by red lines. (c–e) Cumulative thickness of observed faceted layers in individual cores from (c) 0–5 m depth, (d) 5–10 m depth and (e) >10 m depth. Cores are labelled by “Site I.D.-Elevation” and are in order of elevation; repeated labels imply multiple cores were drilled at the site in different years. Cores with red triangles next to their names are displayed in (a) and (b).
3.2 Temperature gradients
The temperature gradients measured in our network of time series exceeded the critical threshold of °C m−1 in most years with measurements and at numerous depths and locations. CTGs were measured in 23 individual core holes and at 14 locations along the transect, and from 0–12.5 m depth below surface. CTG magnitudes ranged from −159 to −10 °C m−1 and from 10 to 132 °C m−1, with the strongest CTGs occurring closer to surface (Fig. 4). The depths at which CTGs occurred varied with season, with CTGs seen anywhere from 0–12.5 m depth June–September and from 0–2 m depth September–May. While seasonal temperature swings produced temperature gradients in the firn column (Fig. 5a), gradient magnitudes were typically sub-threshold, except near the surface in May at one site (Fig. 5b). The shallow CTG signal was due to diurnal air temperature fluctuations, which were also observed for shorter periods at other sites and times of year.
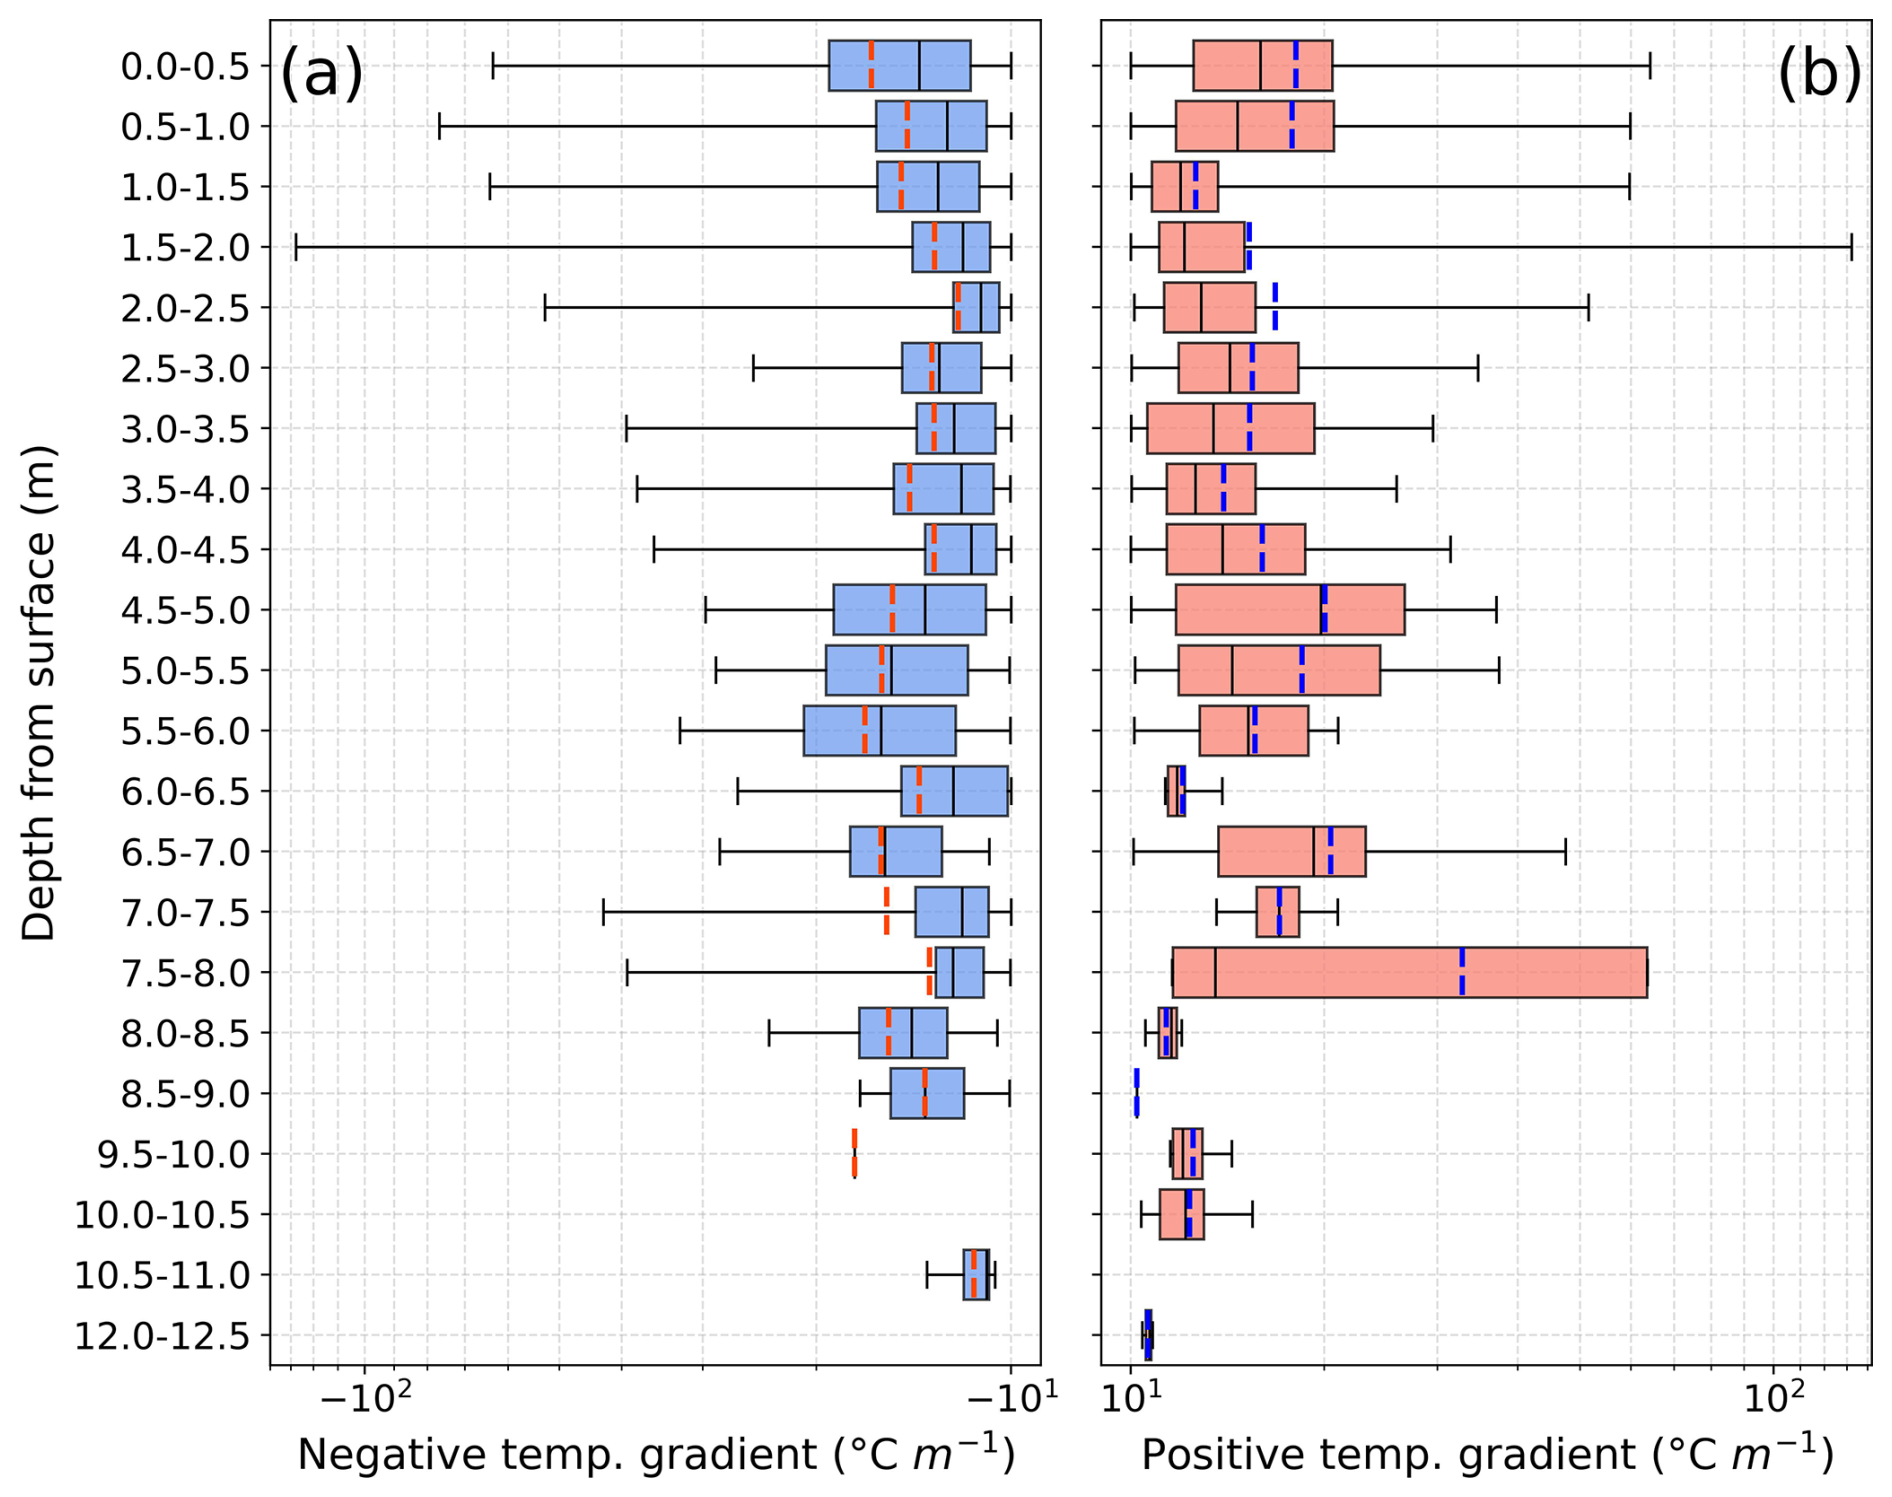
Figure 4Box and whisker plots of both (a) negative and (b) positive CTG magnitudes and their frequencies over the observational record. The x axes use a logarithmic scale for values and a linear scale for values . Whiskers cover the entire range of each dataset. Red or blue vertical bars within boxes denote means; black vertical lines denote medians. Sample sizes for each box are not equal and decrease with depth.
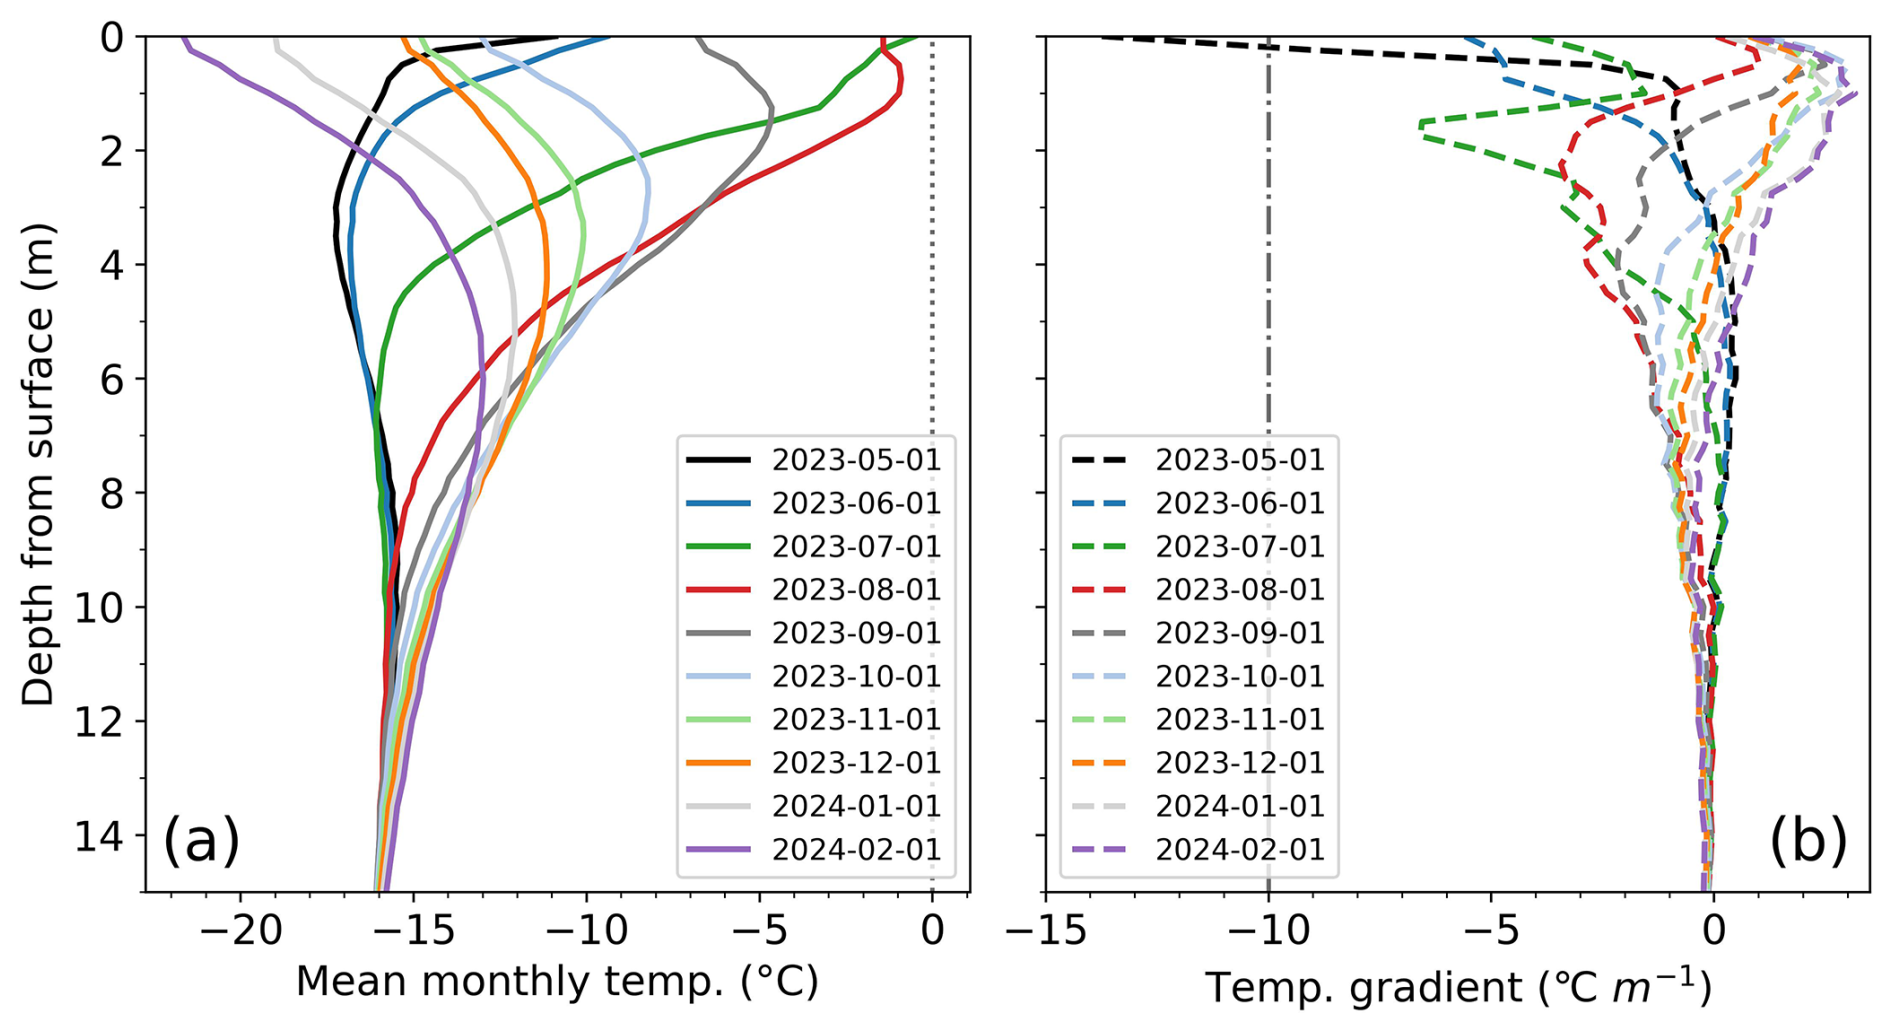
Figure 5Example of a seasonal firn temperature cycle at site CP-1998m (May 2023–February 2024). (a) Mean monthly temperature profiles and (b) temperature gradients calculated from monthly means. Profiles in (a) and (b) were assigned first-of-month dates. The dotted line in (a) denotes 0 °C and the dashed-dot line in (b) the negative CTG threshold. Monthly average temperature gradients in (b) only surpass the CTG threshold in May (black line) near-surface.
The two mechanisms of meltwater infiltration, (1) the onset of a surface wet layer, and (2) preferential flow/piping, generated temperature gradients conducive to kinetic grain growth (CTGs). Additionally, a third recurring pattern of CTGs was linked to near-surface diurnal temperature fluctuations; however, due to their short duration and the likelihood of subsequent wet metamorphism, we do not further consider diurnal processes. CTGs associated with wet layers and piping were identified in 17 of 24 sites (Fig. 6, Table S3 in the Supplement), all of which experienced summer melt, indicating that meltwater infiltration alone was insufficient to generate gradients above the threshold. We structure further analysis of kinetic grain growth around the two primary meltwater-driven mechanisms.
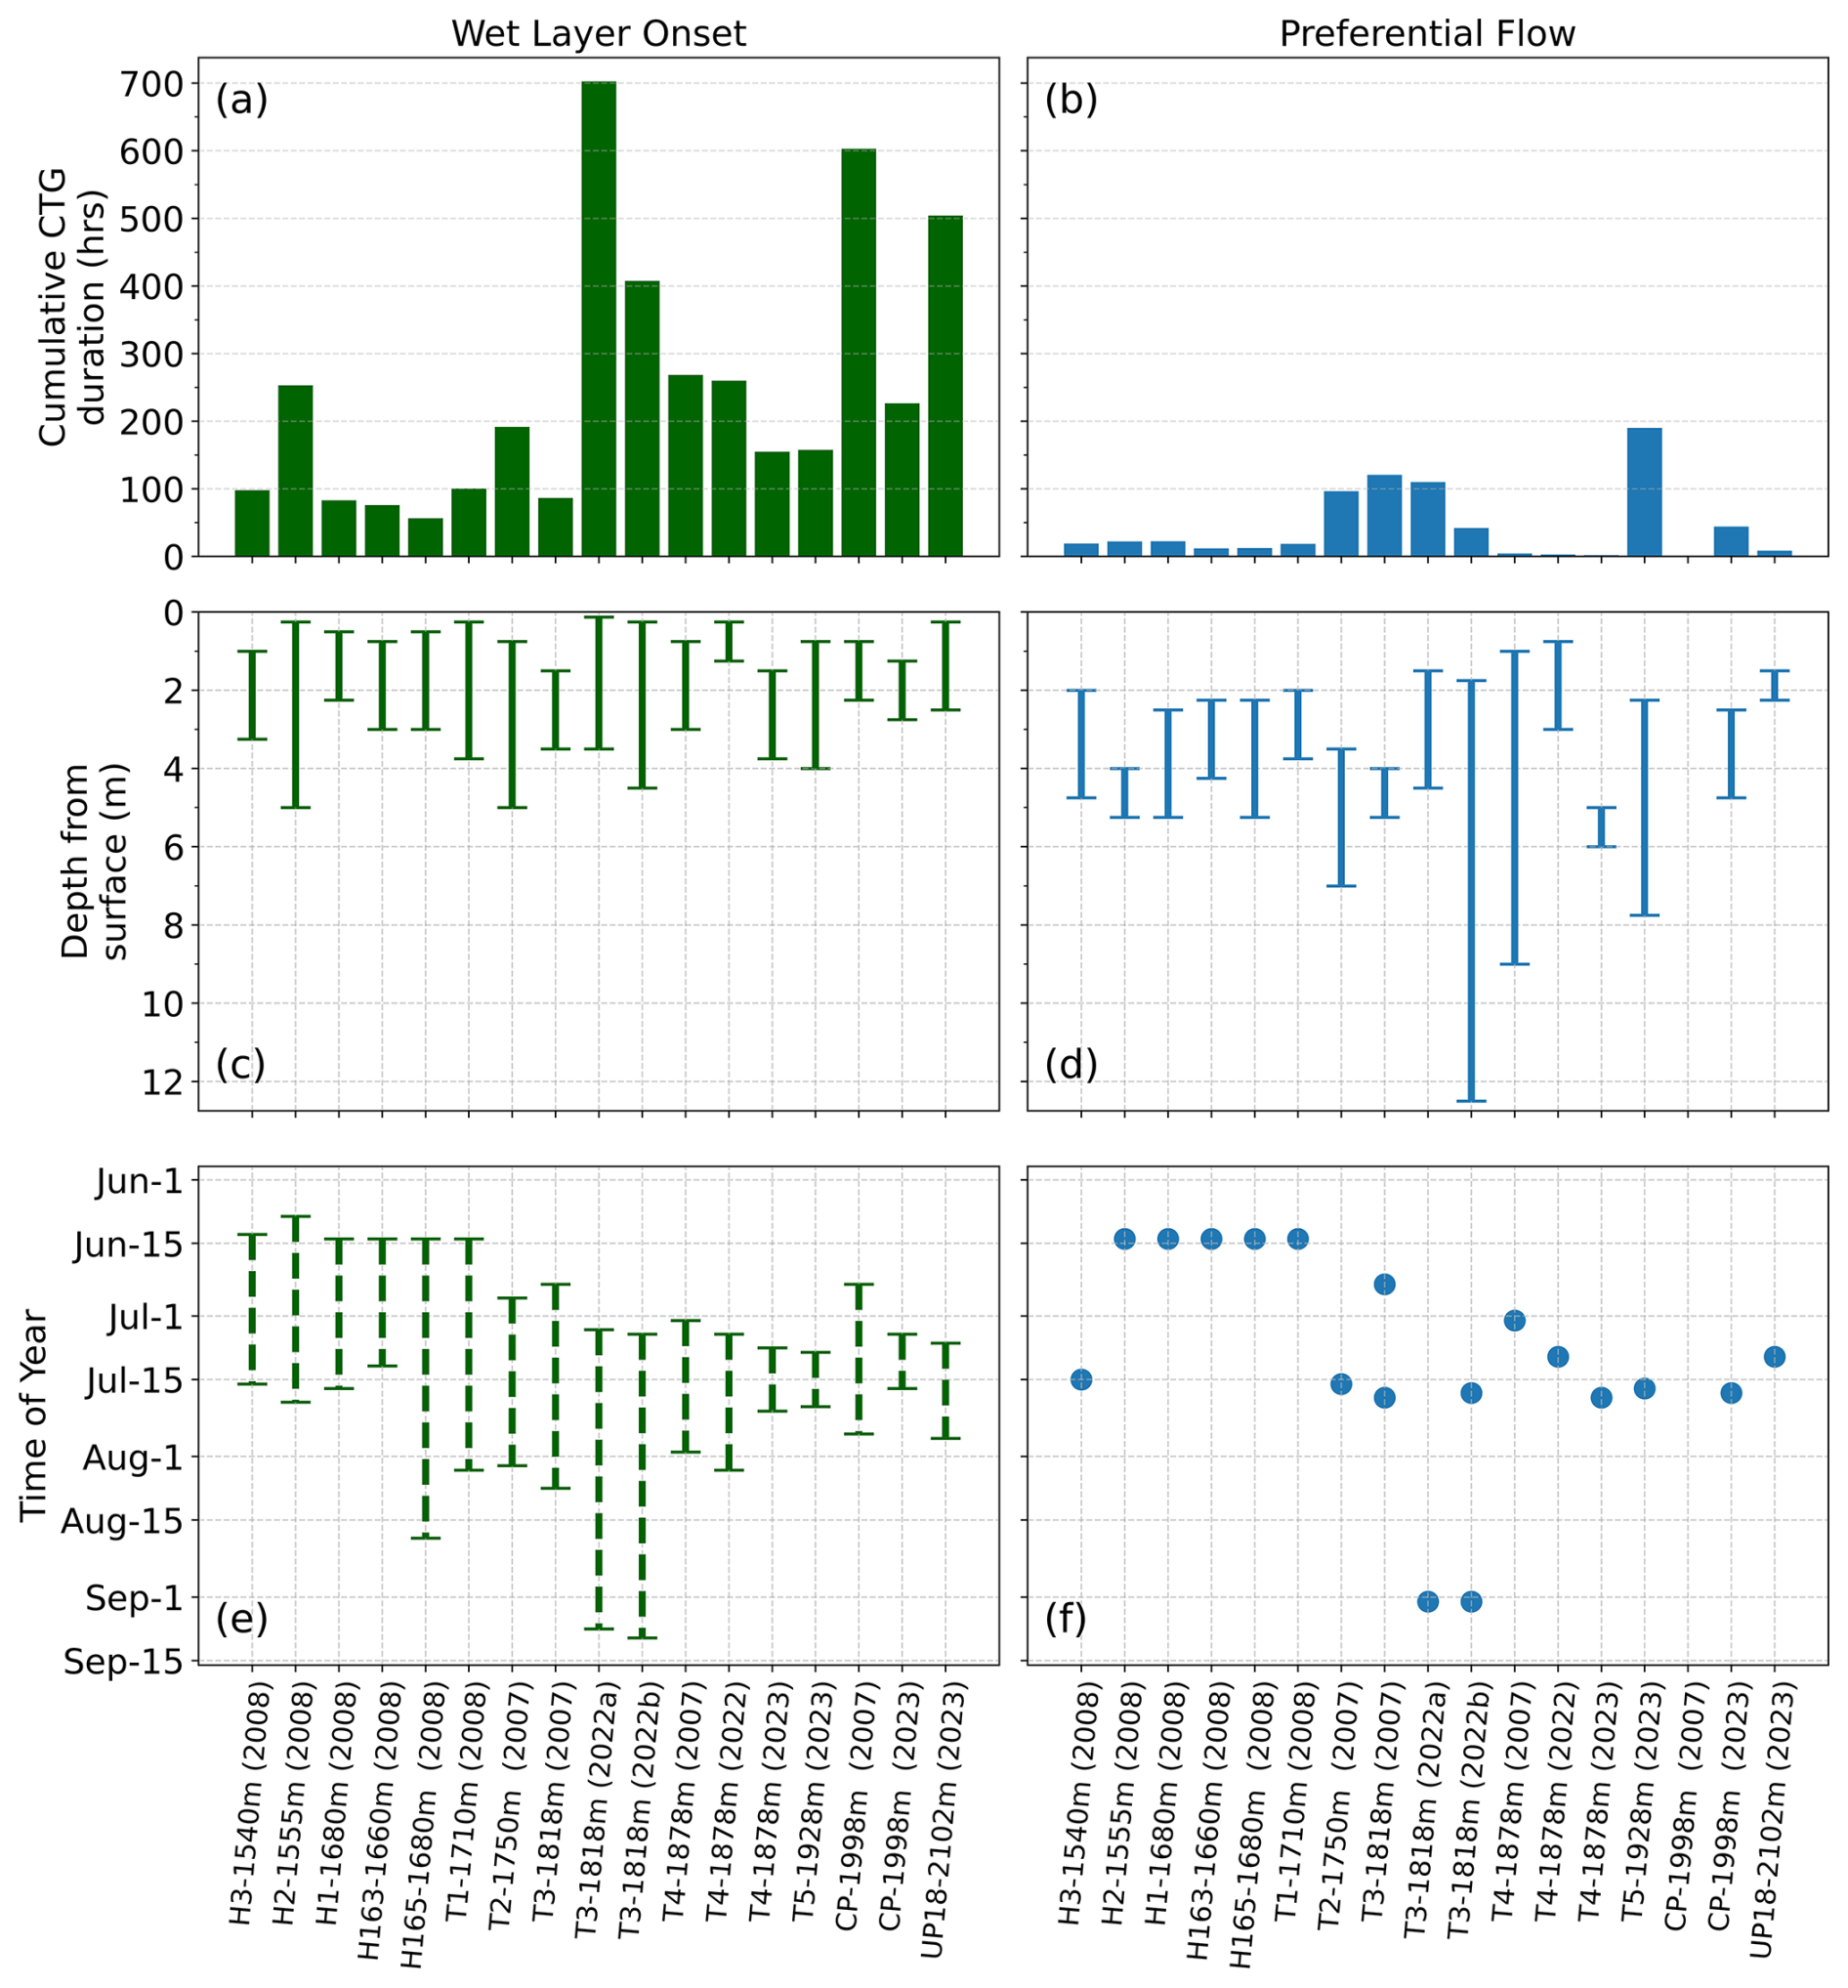
Figure 6Duration, timing, and depth characteristics of meltwater-induced faceting mechanisms, wet layer onset (left column) and preferential flow (right column), at each site (where observed). (a, b) Cumulative time that critical temperature gradients (CTGs) were observed at each site. (c, d) Range of depths where CTGs associated with mechanisms were observed. (e) Time periods where CTGs associated with wet layers were observed. (f) Dates where CTGs associated with preferential flow events were observed. CTG durations are reported as observed and were not normalized as to emphasize the variability of kinetic growth conditions.
3.3 Wet layer onset
Meltwater infiltration via surface wetting fronts reached depths ranging from approximately 0 to 4 m. Wetting fronts tended to advance as stepped, rapid pulses over the course of several days, penetrating from decimetres to several metres. Only the highest elevation sites during the coldest years lacked significant wetting fronts. In most cases, a single distinct wet layer formed per melt season; however, in rare instances, a second wetting front developed following the refreezing of the first, triggered by a late-season warm spell or rain event (e.g., Harper et al., 2023).
The large temperature contrast between the 0 °C isotherm at the wetting front and the underlying cold firn produced strong, negative-signed temperature gradients (Fig. 7). Critically, CTGs associated with wetting fronts tended to coincide with the onset of infiltration rather than persisting throughout the entire life of the wetting front. The depth of wetting-front CTG formation varied by site and year, ranging from 0.13 to 5 m (Fig. 6). Cumulative CTG durations spanned from 57 to 703 h, with a mean of 264 h (Table S3). CTG duration also varied with elevation, with notably shorter durations occurring at lower-elevation sites (Fig. 6). The longest durations – recorded at sites T3-1818m, CP-1998m, and UP18-2102m (Fig. 6) – were comparable to the durations of above-threshold temperature gradients known to produce depth hoar in seasonal snowpacks (Giddings and LaChapelle, 1962). In addition, vapor fluxes produced by wet layer onset were substantial, ranging from ∼0.5 to , mirroring temperature gradient distribution (Fig. 7) and comparable in magnitude to those observed in a cold, subarctic snowpack with a large temperature gradient that produced depth hoar (Sturm and Benson, 1997).
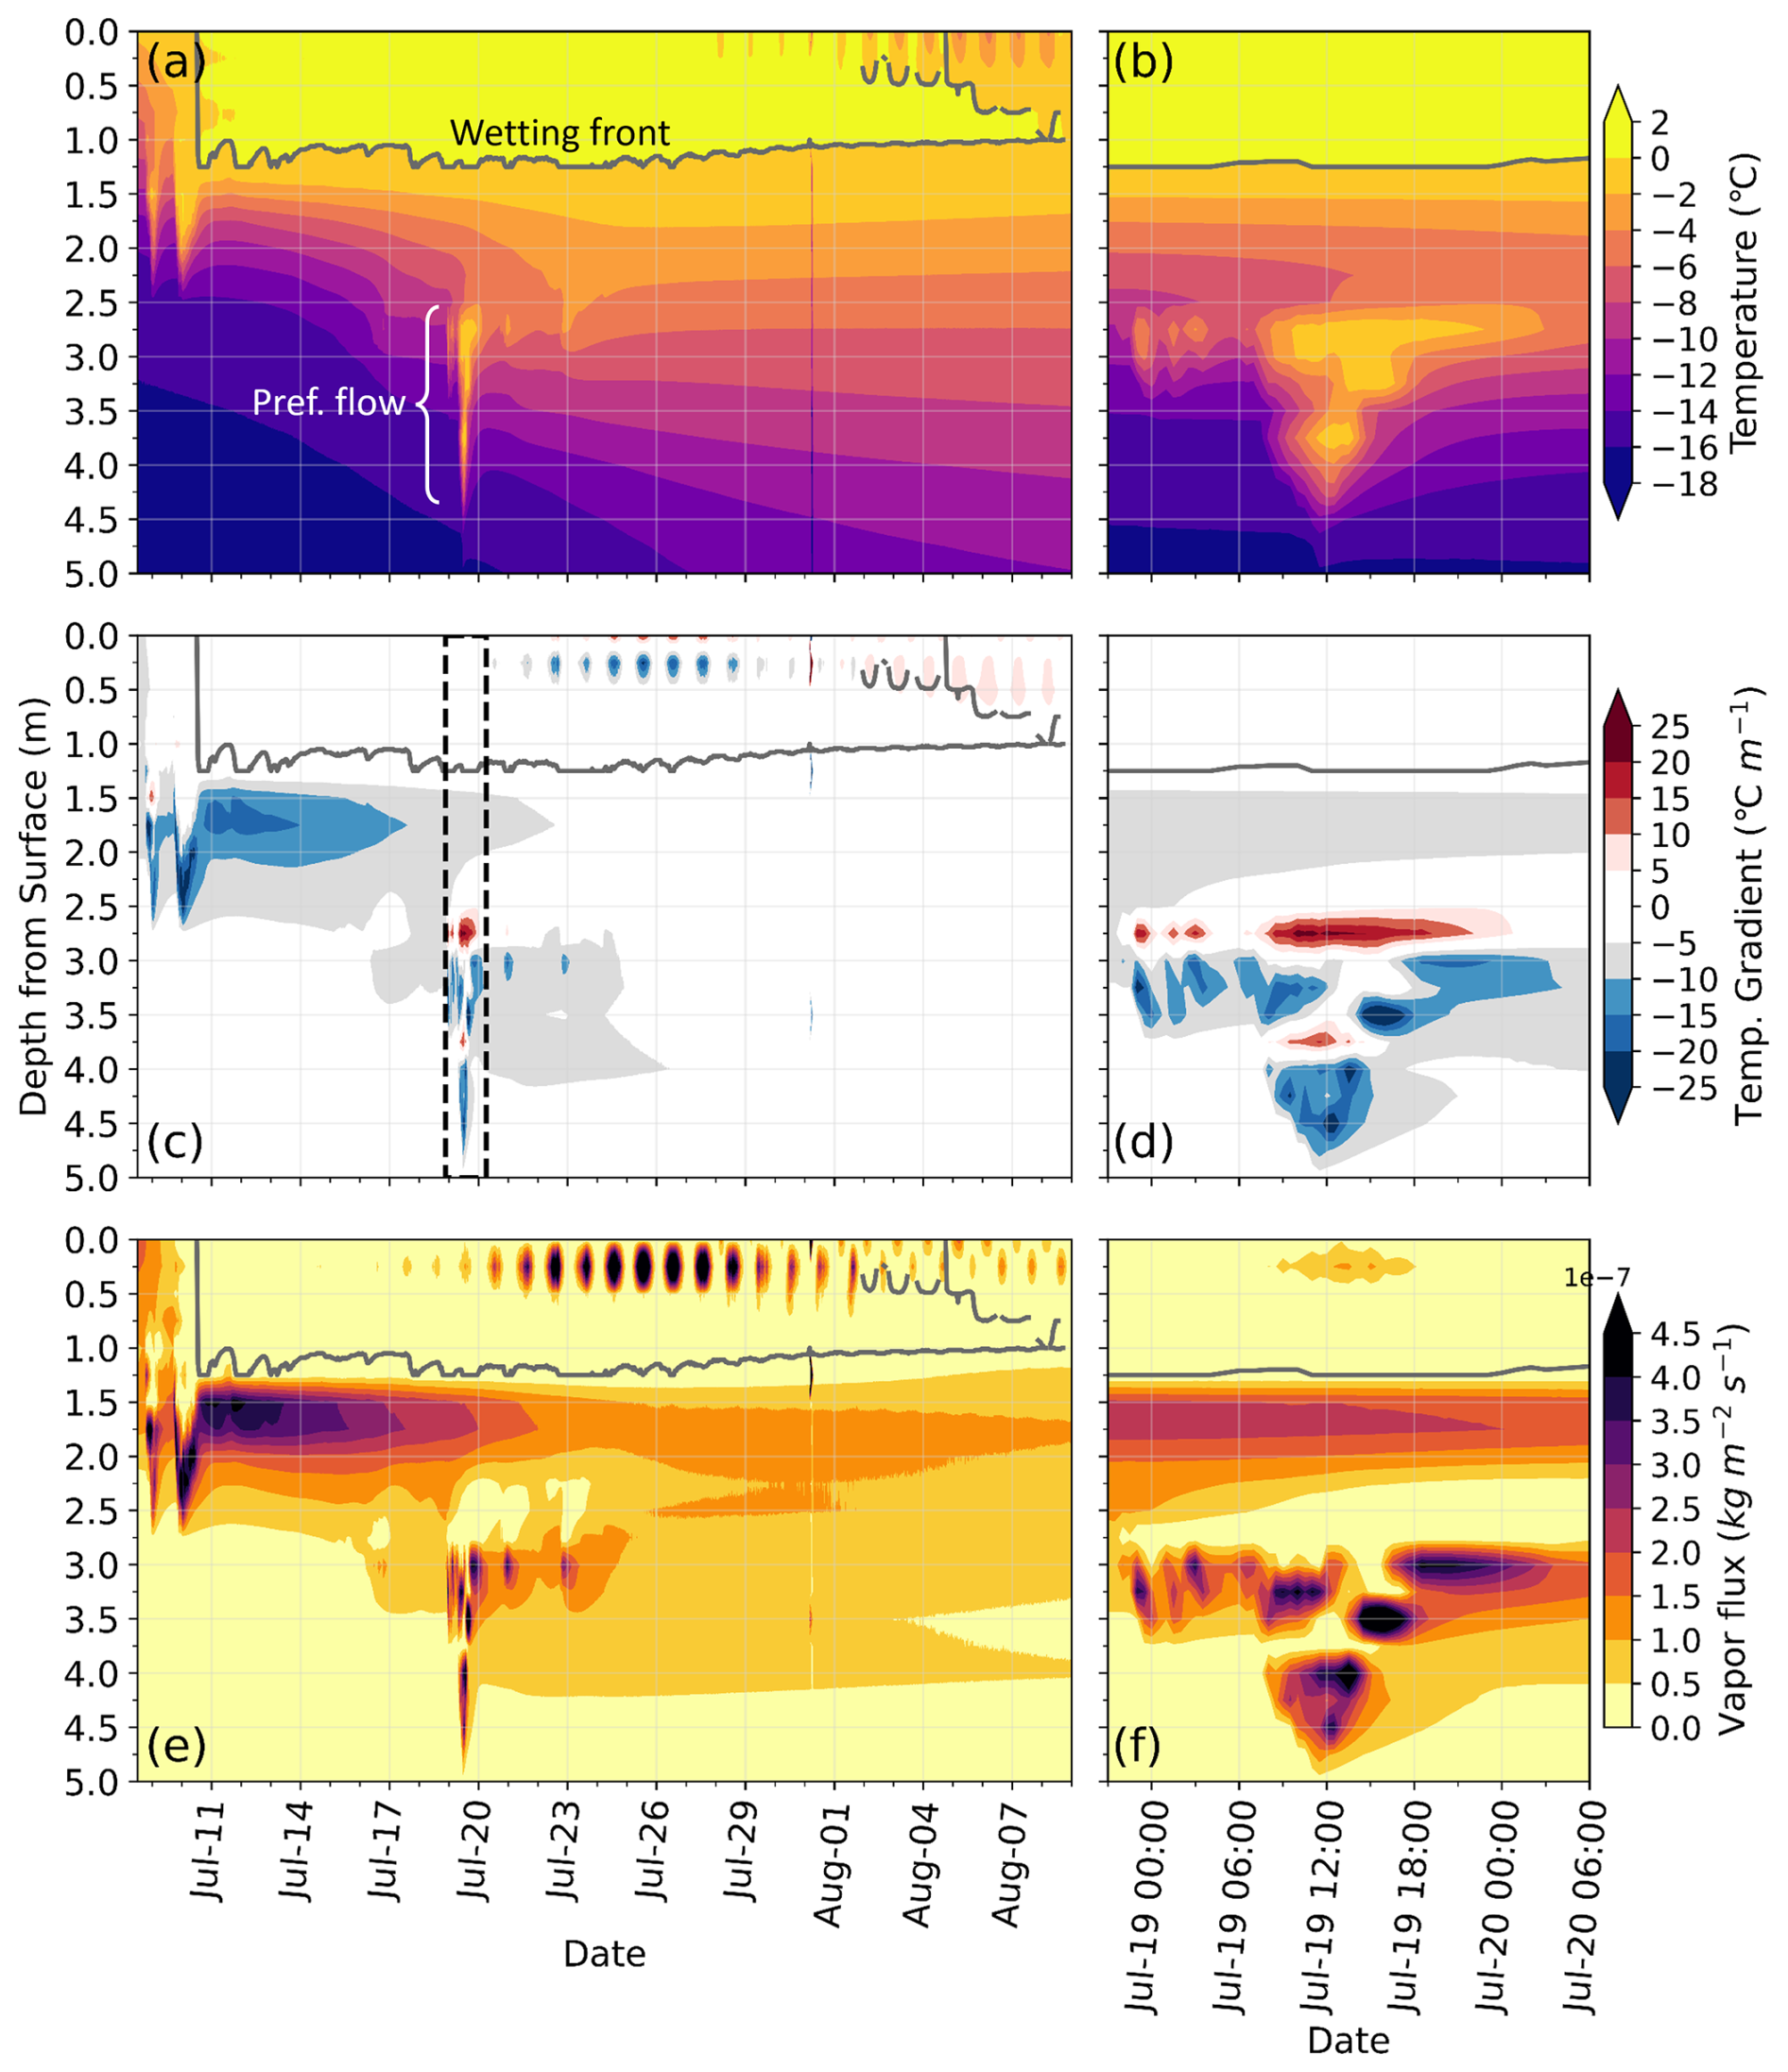
Figure 7Observations through time from site CP-1998m (2023) showcasing wet layer onset (left column) and preferential flow (right column) faceting mechanisms. The black box in (c) highlights data displayed in (b), (d), and (f). Grey lines denote the general extent of the contiguous wet layer at a given time. (a, b) Contour plots of ambient firn temperatures. (c, d) Contour plots of temperature gradients. Blue and red regions indicate CTGs. (e, f) Contour plots of calculated vapor fluxes.
Modelling results demonstrate that rapid wetting front descent is critical for generating enduring layers of kinetic grain growth. In the synthetic simulation, the wetting front descended slowly over ∼15 d – compared to an observed average of 3.4 d at site CP-1998m – and produced CTGs lasting 1101 h, falling below −20 °C m−1 for 25 % of that time (Fig. 8). Modelled vapor fluxes associated with wet layer onset CTGs were of equivalent magnitude to those calculated from observational data, as well as those reported by Sturm and Benson (1997). The strongest sphericity reductions occurred before and during descent, rather than beneath the wetting front's maximum depth, and were largely reversed by wet snow metamorphism as the slowly descending front overtook earlier-formed facets. Furthermore, sphericity reductions that did occur below the maximum wetting front extent were of lower magnitude and were subsequently re-rounded. These results indicate that rapid wetting front descent is necessary to prevent the overprinting of kinetic grain forms.
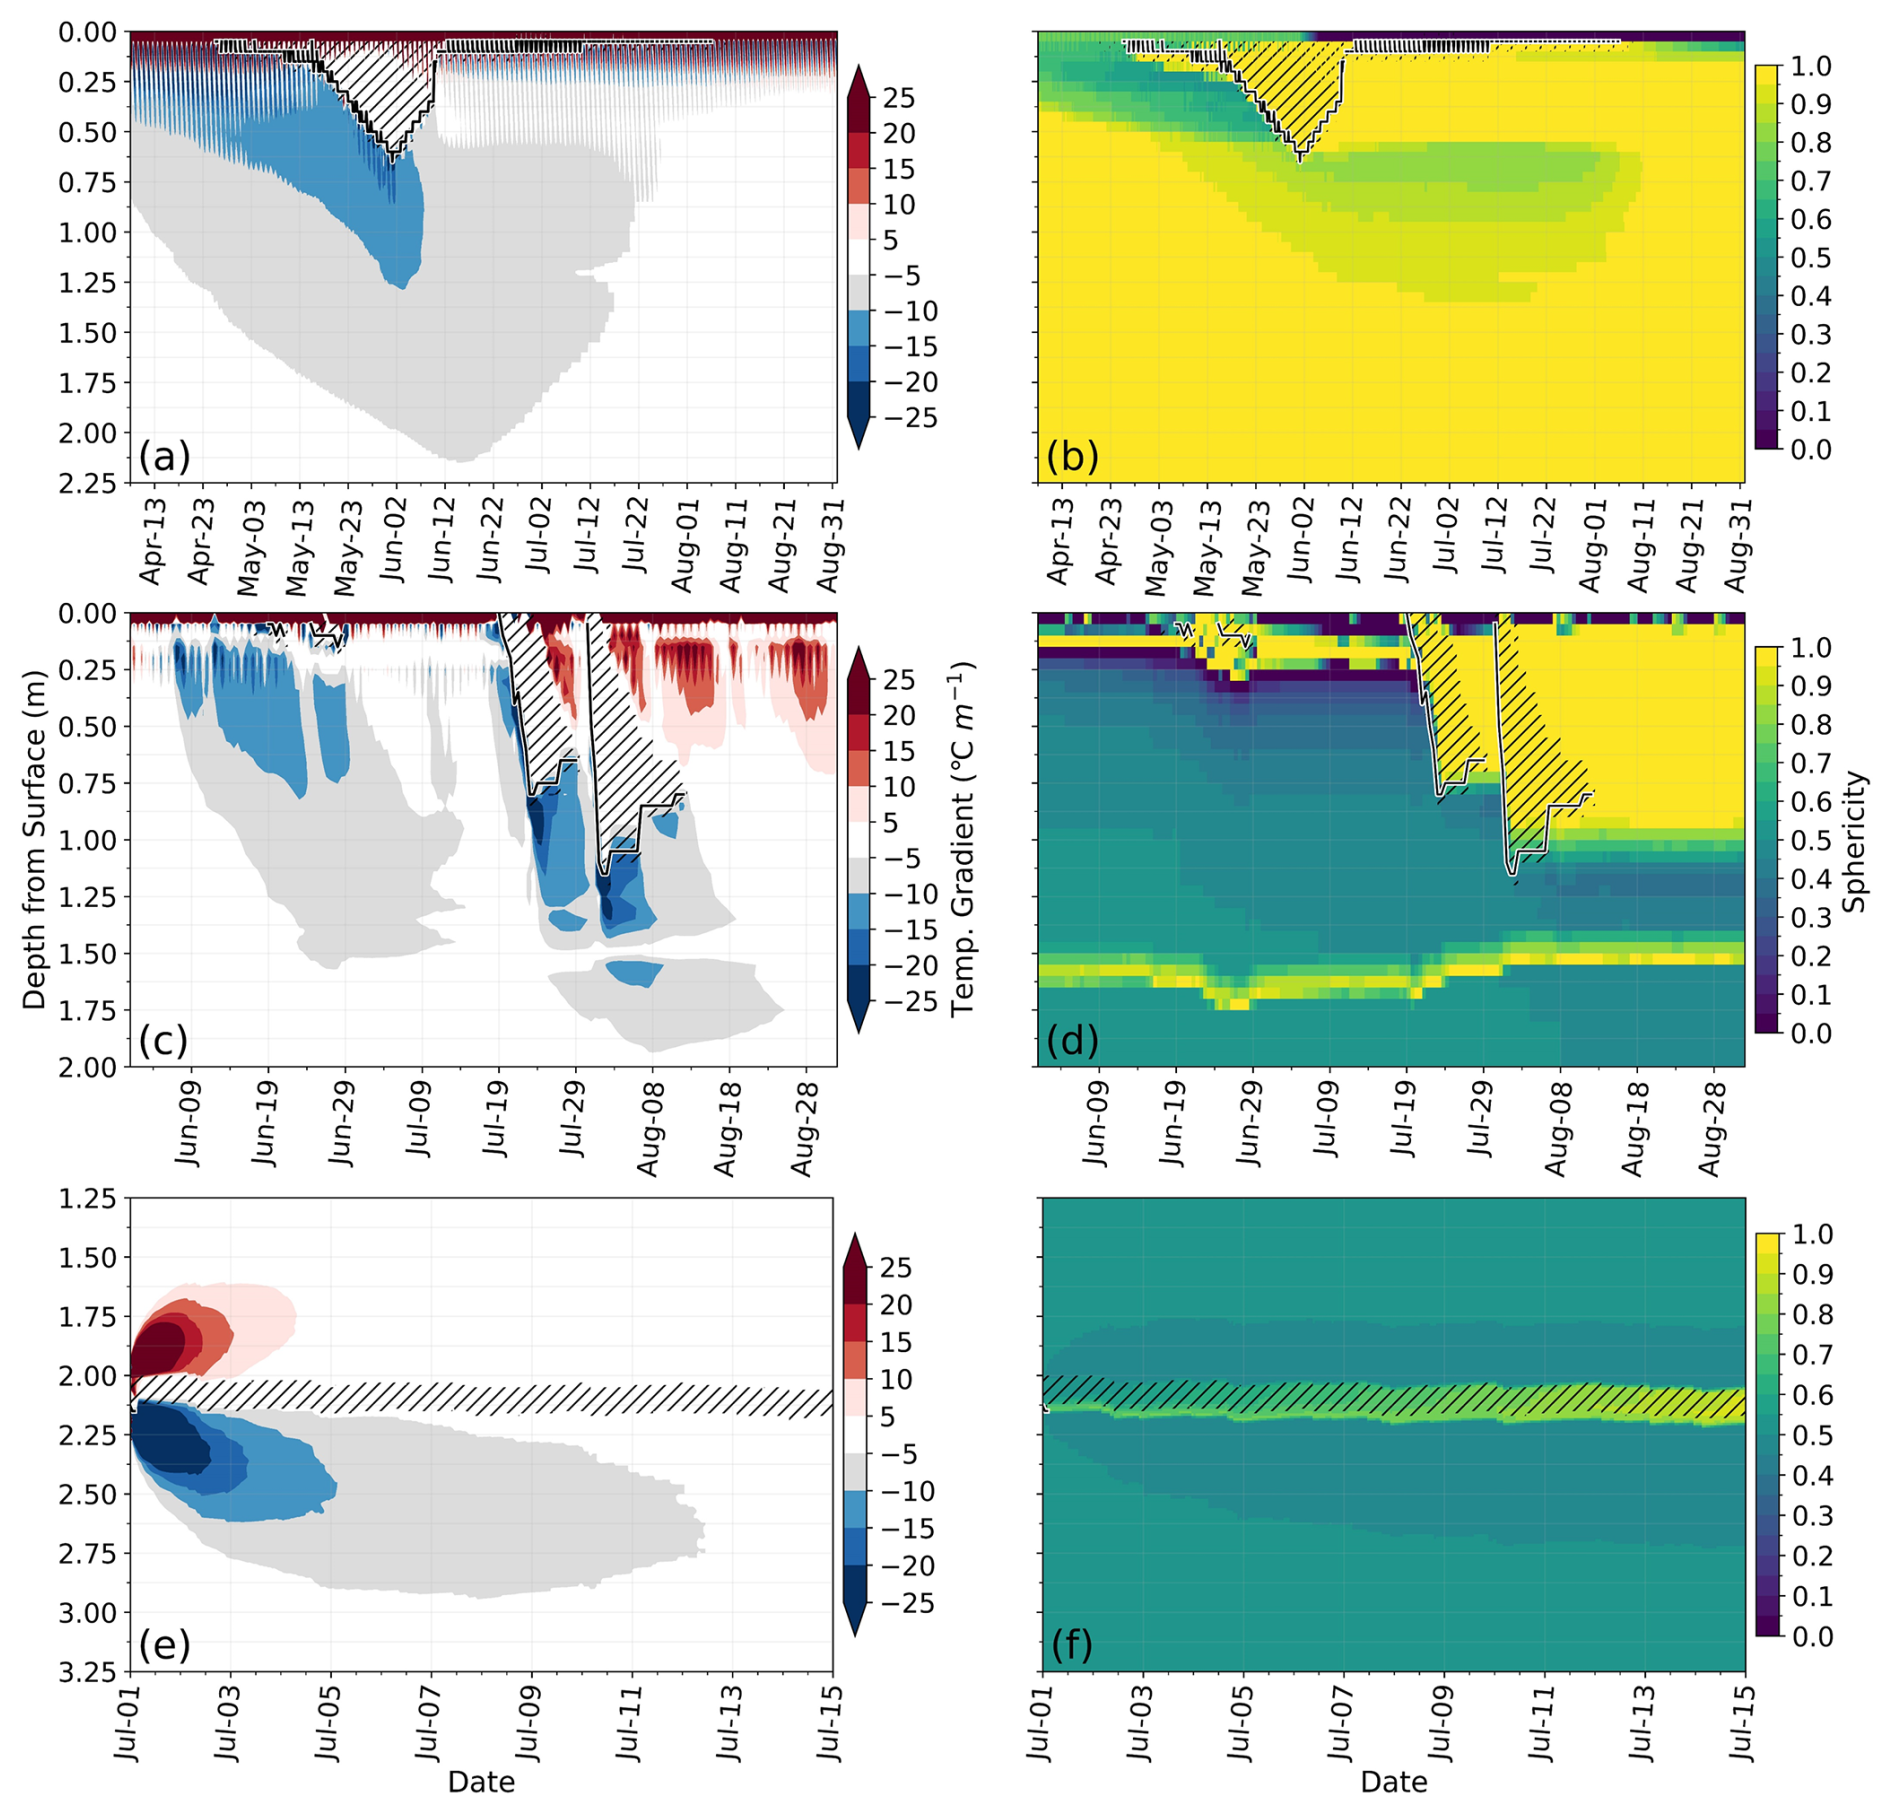
Figure 8Model outputs of temperature gradient (left column) and sphericity time series (right column): (a, b) synthetic wet layer simulation, (c, d) site-specific simulation, and (e, f) synthetic preferential flow simulation. Zero-degree regions in (a)–(d) are denoted by black hatching; approximate wetting front position is indicated by black lines with white outlines. The depth ranges where the liquid water layer was input in (e) and (f) are indicated by black hatching. Note the overprinting of facets by the wetting front from 18 May to 2 June (b) and 19 July (d).
The site-specific simulation produced two wet layers that descended more rapidly, over ∼2–4.5 d, generating CTGs lasting 894 h that were lower than −20 °C m−1 for 26 % of the time (Fig. 7). In this case, sphericity beneath the maximum extent of the wetting front declined from 0.5 to 0.35 and did not re-round, resulting in a layer of kinetic grains that persisted for the remainder of the simulation. Although both simulations produced similarly strong CTGs, those in the site-specific case were more spatially confined and temporally persistent, leading to (1) more localized kinetic grain growth (compared to broader sphericity reductions in the synthetic simulation) and (2) layer preservation in the firn column.
3.4 Preferential flow/piping
Our temperature time series showed numerous, short-duration episodes of near-0 °C temperatures that were localized beneath and disconnected from the surface wet layer (Fig. 7), which we attribute to latent heat release due to preferential flow infiltration events. These events spanned narrow depth intervals between 0.75 and 12.5 m below surface (Fig. 6), and generated CTGs of ranging from 2 to 190 h. The refreezing at depth occurred within a temperature field that warmed toward the surface, resulting in both positive (above) and negative (below) CTGs around the 0 °C layer. Vapor fluxes during the events were also very high ( ), but relatively short-lived (Fig. 7).
Our synthetic piping simulation revealed a limited degree of kinetic grain growth due to a typical piping event (Fig. 8e and f). A 10 cm-thick liquid water layer introduced at 2 m depth generated CTGs spanning ∼1.0 m of the firn column, from ∼1.6 to 2.6 m. Positive CTGs formed above the refreezing layer, lasting ∼72 h and spanning ∼0.25 m, while negative CTGs developed below, lasting ∼120 h and spanning ∼0.5 m. These durations are consistent with observed CTGs associated with piping events (Fig. 6). Similar sphericity reductions, modestly decreasing from 0.5 to ∼0.45, took place above and below the refreezing layer. Overall, model results are consistent with firn core observations: faceted grains were not identified along the margins of vertical ice pipes that were occasionally observed in core sections.
Our findings indicate that kinetic grain growth in the GrIS percolation zone is primarily driven by the onset and initial descent of surface wetting fronts, which juxtapose the 0 °C isotherm with underlying cold firn (Figs. 6 and 7). Rapid infiltration produces strong thermal contrasts, whereas slower wetting front advancement allows conductive heat transfer to warm the firn below, thereby reducing the strength and duration of temperature gradients (Fig. 8). Fast penetration of wetting fronts is common in our dataset, facilitated by abrupt onset of warm air temperatures as well as preconditioning of firn temperature by preferential piping events, which locally warms the firn causing faster vertical propagation of the wetting front.
While our study identified specific scenarios for meltwater-induced faceting, additional processes may also contribute to kinetic grain growth and the preservation of faceted grains in the firn column. For instance, a sudden and prolonged cold snap in late summer could expose the warm, rounded grains in the surface wet layer to a cold atmosphere, causing partial or complete faceting. However, preservation is critical: faceted grains formed near the surface in one year may be overprinted by melt and rounding in the following melt season. Interannual variability is therefore a key factor – preservation of faceted layers is most likely when a year of strong faceting is followed by minimal melt the next year.
Our observations indicate that conditions conducive to kinetic grain growth are induced by meltwater infiltration, which might suggest that increases in the extent, duration, and intensity of surface melt on ice sheets enhance faceting in firn layers. However, our findings show that infiltration-induced faceting is not a simple or direct function of melt amount (i.e., Figs. 3 and 6). Antecedent firn microstructure plays a critical role in determining where and when meltwater is retained (e.g., Marsh Woo, 1984a; Humphrey et al., 2012), and influences both the rate of wetting front propagation and the partitioning of water between matrix and preferential flow pathways (Pfeffer and Humphrey, 1996; Moure et al., 2023). The thermal state of the firn is also a key factor: we observed less faceting at lower elevations, despite higher melt totals, because the temperature contrast between the 0 °C isotherm and relatively warmer firn was less pronounced. Taken together, these findings suggest that as surface melt intensifies and migrates to higher elevations, the firn conditions most favorable for kinetic grain growth may similarly shift upward.
Widely used firn densification models (e.g., Herron and Langway, 1980) are based on empirical relationships derived from dry firn conditions and do not explicitly incorporate the mechanical behaviour or densification mechanisms of faceted grains and depth hoar, which differ substantially from those of rounded grains (Fourteau et al., 2024; Hagenmuller et al., 2015; Hirashima et al., 2011). As melt-altered firn microstructures become more prevalent, the validity of applying these models to interpret surface elevation changes across increasing portions of the GrIS is increasingly uncertain. Furthermore, as interpreting melt-affected ice and firn cores becomes more common (Moser et al., 2024), understanding the effects of kinetic grain growth on isotopic fractionation is growing in importance. The presence of faceted layers may also alter meltwater infiltration processes, as these grains affect firn capillary properties and porosity (e.g., The Firn Symposium Team, 2024; Colbeck, 1974; Zermatten et al., 2014), which may regulate subsequent infiltration and, in turn, ensuing faceting.
This study presents extensive observations of faceted crystals within the firn column of the GrIS percolation zone, ranging from squared forms to depth hoar, found at depths up to 16 m, and in layers with thickness up to 1 m. These findings are incompatible with previous explanations of kinetic grain growth in firn, which were limited to thin, near-surface layers in cold and dry environments. We explored the mechanisms responsible for forming these faceted grains using a variety of approaches, including analysing nearly a decade of in-situ temperature time series data, calculating vapor fluxes, and conducting model simulations of grain growth.
Our analysis identified two primary mechanisms for meltwater-induced kinetic grain growth: surface wet layer penetration and preferential flow events. Both produced critical temperature gradients and elevated vapor fluxes sufficient to drive faceting, with wet layer onset affecting a larger portion of the firn column for longer durations, resulting in more kinetic grain growth. The rate of wetting front propagation strongly influenced the establishment of faceted layers in the firn column, as rapid infiltration promoted the formation and, critically, the preservation of low-sphericity grains. However, faceting was not a direct function of melt amount; rather, it depended on the interplay between firn microstructure, thermal state, and infiltration processes. These findings have implications for modelling surface elevation change across much of Greenland and parts of Antarctica, as empirically based firn densification models do not account for the distinct mechanical properties of firn grains impacted by meltwater processes.
All firn core and temperature data presented in this manuscript are archived with full metadata description and are available for public download from Harper et al. (2012) or the N.S.F. Arctic Data Centre (Harper and Humphrey, 2023, https://doi.org/10.18739/A2DB7VR82; Harper and Humphrey, 2024a, https://doi.org/10.18739/A2J38KK4S; Harper and Humphrey, 2024b, https://doi.org/10.18739/A2DB7VS0N; Harper and Humphrey, 2024c, https://doi.org/10.18739/A28K74Z5S; Harper and Humphrey, 2024d, https://doi.org/10.18739/A2JM23H8X). ERA5 data used in forcing SNOWPACK and associated metadata are available for public download at https://doi.org/10.24381/cds.e2161bac (Muñoz Sabater, 2019). GC-NET PROMICE data and metadata, also used in forcing SNOWPACK, are available for public download at https://doi.org/10.22008/FK2/VVXGUT (Steffen et al., 2022).
The supplement related to this article is available online at https://doi.org/10.5194/tc-19-6791-2025-supplement.
JTH and NFH acquired funding for this research. All authors aided in data acquisition and processing, as well as in grain form assessment. KLG and JTH conceptualized temperature and temperature gradient analyses, while KLG carried them out. KLG conceptualized and designed code for vapor flux calculations. KLG and JTH conceptualized SNOWPACK model simulations; KLG designed model code and operated model simulations. All interpretations (raw data, SNOWPACK results) were made by KLG and JTH. Data visualization and initial draft preparation was completed by KLG. Drafts (prior to article registration) were edited and reviewed by all authors.
The contact author has declared that none of the authors has any competing interests.
Publisher's note: Copernicus Publications remains neutral with regard to jurisdictional claims made in the text, published maps, institutional affiliations, or any other geographical representation in this paper. While Copernicus Publications makes every effort to include appropriate place names, the final responsibility lies with the authors. Views expressed in the text are those of the authors and do not necessarily reflect the views of the publisher.
The authors extend their gratitude to the many individuals who have contributed to the field work involved in data collection over the years.
This research has been supported by the National Science Foundation (grant no. 2113391).
This paper was edited by Marie Dumont and reviewed by Peter Kuipers Munneke and Mahdi Jafari.
Adolph, A. C. and Albert, M. R.: Gas diffusivity and permeability through the firn column at Summit, Greenland: measurements and comparison to microstructural properties, The Cryosphere, 8, 319–328, https://doi.org/10.5194/tc-8-319-2014, 2014.
Akitaya, E.: Studies on Depth Hoar, Contributions from the Institute of Low Temperature Science, 26, 1–67, 1974.
Albert, M. R., Shuman, C., Courville, Z., Bauer, R., Fahnestock, M., and Scambos, T.: Extreme firn metamorphism: impact of decades of vapor transport on near-surface firn at a low-accumulation glazed site on the East Antarctic plateau, Ann. Glaciol., 39, 73–78, 2004.
Alley, R. B., Saltzman, E. S., Cuffey, K. M., and Fitzpatrick, J. J.: Summertime formation of Depth Hoar in central Greenland, Geophys. Res. Lett., 17, 2393–2396, 1990.
Anderson, D. L. and Benson, C. S.: The densification and diagenesisof snow, in: Ice and Snow: Properties, Processes, and Applications, edited by: Kingery, W. D., MIT Press, Cambridge, MA, 391–411, 1963.
Bartelt, P. and Lehning, M.: A physical SNOWPACK model for the Swiss avalanche warning Part I: numerical model, Cold Reg. Sci. Technol., 35, 123–145, 2002.
Benson, C. S.: Stratigraphic studies in the snow and firn of the Greenland ice sheet, CRREL, No. RR70, 1962.
Calonne, N., Milliancourt, L., Burr, A., Philip, A., Martin, C. L., Flin, F., and Geindreau, C.: Thermal Conductivity of Snow, Firn, and Porous Ice From 3-D Image-Based Computations, Geophys. Res. Lett., 46, 13079–13089, https://doi.org/10.1029/2019GL085228, 2019.
Colbeck, S. C.: A Theory of Water Percolation in Snow, J. Glaciol., 11, 369–385, https://doi.org/10.3189/s0022143000022346, 1972.
Colbeck, S. C.: A Study of Glacier Flow for an Open-Pit Mine: An Exercise in Applied Glaciology, J. Glaciology, 13, 401–414, https://doi.org/10.3189/s0022143000023182, 1974.
Colbeck, S. C.: Thermodynamics of snow metamorphism due to variations in curvature, J. Glaciology, 26, 291–301, https://doi.org/10.3189/s0022143000010832, 1980.
Colbeck, S. C.: An overview of seasonal snow metamorphism, Rev. Geophys. Space GE, 20, 45–61, https://doi.org/10.1029/RG020i001p00045, 1982a.
Colbeck, S. C.: Growth of faceted crystals in a snow cover, CRREL, Report 82-29, https://apps.dtic.mil/sti/html/tr/ADA122792/ (last access: 1 March 2024), 1982b.
Colbeck, S. C.: Theory of metamorphism of dry snow, J. Geophys. Res., 88, 5475–5482, https://doi.org/10.1029/JC088iC09p05475, 1983.
Colbeck, S. C.: A review of the metamorphism and classification of seasonal snow cover crystals, in: Avalanche Formation, Movement and Effects, edited by: Salm, B. and Gubler, H., IAHS Publication No. 162, Davos, Wallingford, Oxfordshire, UK, 3–34, ISBN: 0947571965, 1987.
Cuffey, K. and Paterson, W. S. B.: The Physics of Glaciers, 4th edn., Elsevier, Inc., ISBN: 9780080919126, 2010.
Davis, R. E., Arons, E. M., and Albert, M. R.: Metamorphism of Polar Firn: Significance of Microstructure in Energy, Mass, and Chemical Species Transfer, in: Chemical Exchange Between the Atmosphere and Polar Snow, vol. 43, edited by: Wolff, E. W. and Bales, R. C., Springer, Heidelberg, Germany, ISBN: 3540612807, 1996.
Dick, O., Viallon-Galinier, L., Tuzet, F., Hagenmuller, P., Fructus, M., Reuter, B., Lafaysse, M., and Dumont, M.: Can Saharan dust deposition impact snowpack stability in the French Alps?, The Cryosphere, 17, 1755–1773, https://doi.org/10.5194/tc-17-1755-2023, 2023.
Fausto, R. S., Box, J. E., Vandecrux, B., van As, D., Steffen, K., Macferrin, M. J., Machguth, H., Colgan, W., Koenig, L. S., McGrath, D., Charalampidis, C., and Braithwaite, R. J.: A snow density dataset for improving surface boundary conditions in Greenland ice sheet firn modelling, Front. Earth Sci., 6, https://doi.org/10.3389/feart.2018.00051, 2018.
Fierz, C. and Baunach, T.: Quantifying grain-shape changes in snow subjected to large temperature gradients, Ann. Glaciol., 31, 439–442, https://doi.org/10.3189/172756400781820516, 2000.
Fierz, C., Armstrong, R. L., Durand, Y., Etchevers, P., Greene, E., McClung, D. M., Nishimura, K., Satyawali, P. K., and Sokratov, S. A.: Appendix A: Grain Shape Classification, in: The international classification for seasonal snow on the ground, IHP-VII Technical Documents in Hydrology No. 83, IACS Contribution No. 1, UNESCO-IHP, Paris, https://unesdoc.unesco.org/ark:/48223/pf0000186462 (last access: 3 June 2024), 2009.
Finsterwalder, R.: Expédition Glaciologique Internationale Au Groenland 1957–60 (E. G. I. G.), J. Glaciol., 3, 542–546, https://doi.org/10.3189/s0022143000017299, 1959.
Fourteau, K., Freitag, J., Malinen, M., and Löwe, H.: Microstructure-based simulations of the viscous densification of snow and firn, The Cryosphere, 18, 2831–2846, https://doi.org/10.5194/tc-18-2831-2024, 2024.
Gergely, M.: Snow Characterization by Optical Properties, PhD, University of Heidelberg, Heidelberg, Germany, 107 pp., 2011.
Gergely, M., Wolfsperger, F., and Schneebeli, M.: Simulation and validation of the infraSnow: An instrument to measure snow optically equivalent grain size, IEEE T. Geosci. Remote, 52, 4236–4247, https://doi.org/10.1109/TGRS.2013.2280502, 2014.
Giddings, J. C. and LaChapelle, E.: The formation rate of depth hoar, J. Geophys. Res., 67, 2377–2383, https://doi.org/10.1029/jz067i006p02377, 1962.
Gow, A. J.: Deep core studies of the accumulation and densification of snow at Byrd Station and Little America V, Antarctica, CRREL, RR-197, AD0669248, https://apps.dtic.mil/sti/html/tr/AD0669248/index.html (last access: 8 December 2025), 1968.
Grootes, P. M. and Steig, E. J.: Taylor Dome ice-core study, Antarct. J., 25, 57–58, 1992.
Hagenmuller, P., Chambon, G., and Naaim, M.: Microstructure-based modeling of snow mechanics: a discrete element approach, The Cryosphere, 9, 1969–1982, https://doi.org/10.5194/tc-9-1969-2015, 2015.
Hammonds, K., Lieb-Lappen, R., Baker, I., and Wang, X.: Investigating the thermophysical properties of the ice–snow interface under a controlled temperature gradient: Part I: Experiments & Observations, Cold Reg. Sci. Technol., 120, 157–167, https://doi.org/10.1016/j.coldregions.2015.09.006, 2015.
Harper, J. and Humphrey, N.: Firn core density and ice content at sites along the lower Expéditions Glaciologiques Internationales au Groenland (EGIG) line, Western Greenland, 2023, Arctic Data Center [data set], https://doi.org/10.18739/A2DB7VR82, 2023.
Harper, J. and Humphrey, N.: Firn density and ice content at two sites along the west Expéditions Glaciologiques Internationales au Groenland (EGIG) line, Greenland, 2024, Arctic Data Center [data set], https://doi.org/10.18739/A2J38KK4S, 2024a.
Harper, J. and Humphrey, N.: Firn temperature-time series to 25 m depth at two sites along the west Expéditions Glaciologiques Internationales au Groenland (EGIG) line, Greenland 2022–2023, Arctic Data Center [data set], https://doi.org/10.18739/A2DB7VS0N, 2024b.
Harper, J. and Humphrey, N.: Firn temperature-time series to 25 or 32 m depth at sites along the west Expéditions Glaciologiques Internationales au Groenland (EGIG) line, Greenland 2023–2024, Arctic Data Center [data set], https://doi.org/10.18739/A28K74Z5S, 2024c.
Harper, J. and Humphrey, N.: Firn temperature-time series to 30 m depth at five sites along the west Expéditions Glaciologiques Internationales au Groenland (EGIG) line, Greenland summer of 2019, Arctic Data Center [data set], https://doi.org/10.18739/A2JM23H8X, 2024d.
Harper, J., Humphrey, N., Pfeffer, W. T., Brown, J., and Fettweis, X.: Greenland ice-sheet contribution to sea-level rise buffered by meltwater storage in firn, Nature, 491, 240–243, https://doi.org/10.1038/nature11566, 2012.
Harper, J., Saito, J., and Humphrey, N.: Cold Season Rain Event Has Impact on Greenland's Firn Layer Comparable to Entire Summer Melt Season, Geophys. Res. Lett., 50, https://doi.org/10.1029/2023GL103654, 2023.
Herron, M. M. and Langway, C. C.: Firn Densification: An Empirical Model, J. Glaciology, 25, 373–385, https://doi.org/10.3189/s0022143000015239, 1980.
Hersbach, H., Bell, B., Berrisford, P., Hirahara, S., Horányi, A., Muñoz-Sabater, J., Nicolas, J., Peubey, C., Radu, R., Schepers, D., Simmons, A., Soci, C., Abdalla, S., Abellan, X., Balsamo, G., Bechtold, P., Biavati, G., Bidlot, J., Bonavita, M., De Chiara, G., Dahlgren, P., Dee, D., Diamantakis, M., Dragani, R., Flemming, J., Forbes, R., Fuentes, M., Geer, A., Haimberger, L., Healy, S., Hogan, R. J., Hólm, E., Janisková, M., Keeley, S., Laloyaux, P., Lopez, P., Lupu, C., Radnoti, G., de Rosnay, P., Rozum, I., Vamborg, F., Villaume, S., and Thépaut, J. N.: The ERA5 global reanalysis, Q. J. Roy. Meteor. Soc., 146, 1999–2049, https://doi.org/10.1002/qj.3803, 2020.
Hirashima, H., Abe, O., and Sato, A.: Parameterization of the shear strength of faceted crystals during equi-temperature metamorphism, Ann. Glaciol., 52, 111–118, https://doi.org/10.3189/172756411797252310, 2011.
Howat, I. M.: Temporal variability in snow accumulation and density at Summit Camp, Greenland ice sheet, J. Glaciol., 68, 1076–1084, https://doi.org/10.1017/jog.2022.21, 2022.
Humphrey, N. F., Harper, J. T., and Pfeffer, W. T.: Thermal tracking of meltwater retention in Greenland's accumulation area, J. Geophys. Res. Earth Surf., 117, https://doi.org/10.1029/2011JF002083, 2012.
Jafari, M. and Lehning, M.: Convection of snow: when and why does it happen?, Front. Earth Sci., 11, https://doi.org/10.3389/feart.2023.1167760, 2023.
Jafari, M., Gouttevin, I., Couttet, M., Wever, N., Michel, A., Sharma, V., Rossman, L., Maass, N., Nicolaus, M., and Lehning, M.: The impact of diffusive water vapor transport on snow profiles in deep and shallow snow covers and on sea ice, Front. Earth Sci., 8, https://doi.org/10.3389/feart.2020.00249, 2020.
Jafari, M., Lehning, M., and Sharma, V.: Convection of water vapor in snowpacks, J. Fluid Mech., 394, A38, https://doi.org/10.1017/jfm.2021.1146, 2022.
Jamieson, B.: Formation of refrozen snowpack layers and their role in slab avalanche release, Rev. Geophys., 44, https://doi.org/10.1029/2005RG000176, 2006.
Jamieson, B. and Fierz, C.: Heat flow from wet to dry snowpack layers and associated faceting, Ann. Glaciol., 38, 187–194, 2004.
Johnsen, S. J., Clausen, H. B., Cuffey, K. M., Hoffmann, G., Schwander, J., and Creyts, T.: Diffusion of stable isotopes in polar firn and ice: the isotope effect in firn diffusion, in: Physics of Ice Core Records, edited by: Hondoh, T., Hokkaido Univ. Press, 121–140, ISBN-13: 9784832902824, 2000.
Kamata, Y., Sokratov, S. A., and Sato, A.: Temperature and temperature gradient dependence of snow recrystallization in depth hoar snow, in: Lecture Notes in Physics, 395–402, https://doi.org/10.1007/bfb0104197, 1999.
LaChapelle, E. R. and Armstrong, R. L.: Temperature patterns in an alpine snow cover and their influence on snow metamorphism, U.S. Army Research Office, Inst. Arct. Alp. Res., Univ. Colo., Boulder, CO, ADA040169, https://apps.dtic.mil/sti/citations/ADA040169 (last access: 8 December 2025), 1977.
Lehning, M., Bartelt, P., Brown, B., Fierz, C., and Satyawali, P.: A physical SNOWPACK model for the Swiss avalanche warning Part II. Snow microstructure, Cold Reg. Sci. Technol., 35, 147–167, 2002.
Linow, S., Hörhold, M. W., and Freitag, J.: Grain-size evolution of polar firn: A new empirical grain growth parameterization based on X-ray microcomputer tomography measurements, J. Glaciol., 58, 1245–1252, https://doi.org/10.3189/2012JoG11J256, 2012.
Marbouty, D.: An Experimental Study of Temperature-Gradient Metamorphism, J. Glaciol., 26, 303–312, https://doi.org/10.3189/s0022143000010844, 1980.
Marsh, P. and Woo, M. K.: Wetting front advance and freezing of meltwater within a snow cover: 1. Observations in the Canadian Arctic, Water Resour. Res., 20, 1853–1864, https://doi.org/10.1029/WR020i012p01853, 1984a.
Marsh, P. and Woo, M. K.: Wetting front advance and freezing of meltwater within a snow cover: 2. A simulation model, Water Resour. Res., 20, 1865–1874, https://doi.org/10.1029/WR020i012p01865, 1984b.
McDowell, I. E., Keegan, K. M., Wever, N., Osterberg, E. C., Hawley, R. L., and Marshall, H. P.: Firn Core Evidence of Two-Way Feedback Mechanisms Between Meltwater Infiltration and Firn Microstructure From the Western Percolation Zone of the Greenland Ice Sheet, J. Geophys. Res. Earth Surf., 128, https://doi.org/10.1029/2022JF006752, 2023.
Montpetit, B., Royer, A., Langlois, A., Chum, M., Cliche, P., Roy, A., Champollion, N., Picard, G., Dominé, F., and Obbard, R.: In-situ Measurements for Snow Grain Size and Shape Characterization Using Optical Methods, in: 68th Eastern Snow Conference, edited by: Langlois, A., McGill Univ., Montreal, Quebec, Canada, ISBN-13: 9780920081334, 2011.
Moon, T., Harper, J., Colliander, A., Hossan, A., and Humphrey, N.: L-band radiometric measurement of liquid water in Greenland's firn: Comparative analysis with in situ measurements and modeling, Ann. Glacio., 66, e15, 1–9, https://doi.org/10.1017/aog.2025.10012, 2025.
Moser, D. E., Thomas, E. R., Nehrbass-Ahles, C., Eichler, A., and Wolff, E.: Review article: Melt-affected ice cores for polar research in a warming world, The Cryosphere, 18, 2691–2718, https://doi.org/10.5194/tc-18-2691-2024, 2024.
Moure, A., Jones, N., Pawlak, J., Meyer, C., and Fu, X.: A Thermodynamic Nonequilibrium Model for Preferential Infiltration and Refreezing of Melt in Snow, Water Resour. Res., 59, https://doi.org/10.1029/2022WR034035, 2023.
Muñoz Sabater, J.: ERA5-Land hourly data from 1950 to present, Copernicus Climate Change Service (C3S) Climate Data Store (CDS) [data set], https://doi.org/10.24381/cds.e2161bac, 2019.
Nghiem, S. V., Steffen, K., Neumann, G., and Huf, R.: Mapping of ice layer extent and snow accumulation in the percolation zone of the Greenland ice sheet, J. Geophys. Res. Earth Surf., 110, https://doi.org/10.1029/2004JF000234, 2005.
Noël, B. P.: Rapid ablation zone expansion amplifies north Greenland mass loss: modelled (RACMO2) and observed (MODIS) data sets, PANGAEA [data set], https://doi.org/10.1594/PANGAEA.904428, 2019.
Perla, R. and Ommanney, C. S. L.: Snow in strong or weak temperature gradients. Part I: Experiments and qualitative observations., Cold Reg. Sci. Technol., 11, 23–35, 1985.
Pfeffer, W. T. and Humphrey, N. F.: Determination of timing and location of water movement and ice-layer formation by temperature measurements in sub-freezing snow, J. Glaciol., 42, 292–304, https://doi.org/10.3189/s0022143000004159, 1996.
Pinzer, B. R., Schneebeli, M., and Kaempfer, T. U.: Vapor flux and recrystallization during dry snow metamorphism under a steady temperature gradient as observed by time-lapse micro-tomography, The Cryosphere, 6, 1141–1155, https://doi.org/10.5194/tc-6-1141-2012, 2012.
Saito, J., Harper, J., and Humphrey, N.: Uptake and Transfer of Heat Within the Firn Layer of Greenland Ice Sheet's Percolation Zone, J. Geophys. Res. Earth Surf., 129, https://doi.org/10.1029/2024JF007667, 2024.
Salamatin, A. N., Lipenkov, V. Y., Barnola, J. M., Hori, A., Duval, P., and Hondoh, T.: Snow/firn densification in polar ice sheets, in: Physics of Ice Core Records II: Papers Collected After the 2nd International Workshop on Physics of Ice Core Records, Sapporo, Japan, 2–6 February 2007 (Low Temperature Science; 68(Suppl.)), edited by: Hondoh, T., Institute of Low Temperature Science, Hokkaido University, Sapporo, 195–222, 2009.
Steffen, K., Abdalati, W., and Sherjal, I.: Faceted crystal formation in the northeast Greenland low-accumulation region, J. Glaciol., 45, 63–68, 1999.
Steffen, K., Vandecrux, B., Houtz, D., Abdalati, W., Bayou, N., Box, J. E., Colgan, W. T., Espona Pernas, L., Griessinger, N., Haas-Artho, D., Heilig, A., Hubert, A., Iosifescu Enescu, I., Johnson-Amin, N., Karlsson, N. B., Kurup Buchholz, R., McGrath, D., Cullen, N. J., Naderpour, R., Molotch, N. P., Pedersen, A. Ø., Perren, B., Philipps, T., Plattner, G. K., Proksch, M., Revheim, M. K., Særrelse, M., Schneebli, M., Sampson, K., Starkweather, S., Steffen, S., Stroeve, J., Watler, B., Winton, Ø. A., Zwally, J., and Ahlstrøm, A.: GC-Net Level 1 historical automated weather station data, Version V8, GEUS Dataverse [data set], https://doi.org/10.22008/FK2/VVXGUT, 2022.
Steger, C. R., Reijmer, C. H., van den Broeke, M. R., Wever, N., Forster, R. R., Koenig, L. S., Munneke, P. K., Lehning, M., Lhermitte, S., Ligtenberg, S. R. M., Miège, C., and Noël, B. P. Y.: Firn meltwater retention on the greenland ice sheet: A model comparison, Front. Earth Sci., 5, https://doi.org/10.3389/feart.2017.00003, 2017.
Sturm, M. and Benson, C. S.: Vapor transport, grain growth and depth-hoar development in the subarctic snow, J. Glaciol., 43, 42–58, https://doi.org/10.3189/s0022143000002793, 1997.
The Firn Symposium Team: Firn on ice sheets, Nat. Rev. Earth. Environ., 5, 79–99, https://doi.org/10.1038/s43017-023-00507-9, 2024.
Vandecrux, B., Box, J. E., Wehrlé, A., Kokhanovsky, A. A., Picard, G., Niwano, M., Hörhold, M., Faber, A. K., and Steen-Larsen, H. C.: The Determination of the Snow Optical Grain Diameter and Snowmelt Area on the Greenland Ice Sheet Using Spaceborne Optical Observations, Remote Sens., 14, 932, https://doi.org/10.3390/rs14040932, 2022.
Watanabe, O., Shimada, W., Narita, H., Miyamoto, A., Tayukj, K., Hondoh, T., Kawamura, T., Fujita, S., Shoji, H., Enomoto, H., Kameoa, T., Kawada, K., and Yokoyama, K.: Preliminary discussion of physical properties of the Dome Fuji shallow ice core in 1993, Antarctica, Proc. NIPR Symp. Polar Meteorol. Glaciol, 11, 1–8, 1997.
Wever, N., Schmid, L., Heilig, A., Eisen, O., Fierz, C., and Lehning, M.: Verification of the multi-layer SNOWPACK model with different water transport schemes, The Cryosphere, 9, 2271–2293, https://doi.org/10.5194/tc-9-2271-2015, 2015.
Wever, N., Würzer, S., Fierz, C., and Lehning, M.: Simulating ice layer formation under the presence of preferential flow in layered snowpacks, The Cryosphere, 10, 2731–2744, https://doi.org/10.5194/tc-10-2731-2016, 2016.
Yosida, Z.: Physical Studies on Deposited Snow. 1. Thermal Properties, Contributions from the Institute of Low Temperature Science, 7, 19–74, 1955.
Zermatten, E., Schneebeli, M., Arakawa, H., and Steinfeld, A.: Tomography-based determination of porosity, specific area and permeability of snow and comparison with measurements, Cold Reg. Sci. Technol., 97, 33–40, https://doi.org/10.1016/j.coldregions.2013.09.013, 2014.