the Creative Commons Attribution 4.0 License.
the Creative Commons Attribution 4.0 License.
 | 11 Feb 2025
An examination of changes in autumn Eurasian snow cover and its relationship with the winter Arctic Oscillation using 20th Century Reanalysis version 3
Gareth J. Marshall
Utilising the 20th Century Reanalysis version 3 (20CRv3), we examine changes in the extent and rate of autumn Eurasian snow cover (SC) advance and the temporal variability in the SC–Arctic Oscillation (AO) relationship. Novel aspects are (i) analysis back to 1836, (ii) adjusting the reanalysis SC through comparison with observations, and (iii) analysing the statistical significance of the frequency of periods of significant SC–AO relationships to determine whether these connections can be distinguished from stochastic processes. Across the full span of 20CRv3, there is a small increase in mean September Eurasian SC. In contrast, there have been significant decreases in both October and November SC. Trends over the past 50 years demonstrate a slowing and accelerating of snow advance in October and November, respectively, corresponding to a postponement of SC onset. Robust relationships exist between September and October Eurasian SC and the winter AO across the 180-year span of 20CRv3. Within Eurasia, we reveal a strong SC–AO relationship with September SC in northeastern Eurasia, which has not been noted previously. The associated spatial pattern of September tropospheric height anomalies closely matches the positive phase of the western Pacific teleconnection pattern. As many other factors are known to impact the winter AO, and these predominantly occur in October or November, the residual September SC signal-to-noise ratio in the winter atmosphere is small. Therefore, model experiments in which only the magnitude of September SC is perturbed will be necessary to elucidate the processes behind this newly described SC–AO relationship.
- Article
(10321 KB) - Full-text XML
-
Supplement
(1109 KB) - BibTeX
- EndNote


While it has long been established that the Arctic has been warming significantly faster than the global average, recent studies have revealed that this “Arctic amplification” is even greater than previously thought, being a factor of 3 to 4 over the past half-century (Rantanen et al., 2022; Zhou et al., 2024). Seasonally, Arctic amplification is strongest during October–December, in response to enhanced upwelling of longwave radiation and turbulent heat fluxes into the atmosphere from greater areas of open water. This seasonal maximum coincides with the onset of the remarkable autumnal expansion of Eurasian snow cover (SC) (Fig. 1), an important and rapidly changing component of the Earth's climate system. SC has a pronounced local climate impact, resulting from its high surface reflectivity, thermal emissivity, and ground-insulating properties (e.g. Henderson et al., 2018). It can have a significant effect on both the socio-economic activities of Arctic societies – often via natural hazards such as avalanches and flooding – and the natural environment (e.g. Callaghan et al., 2011).
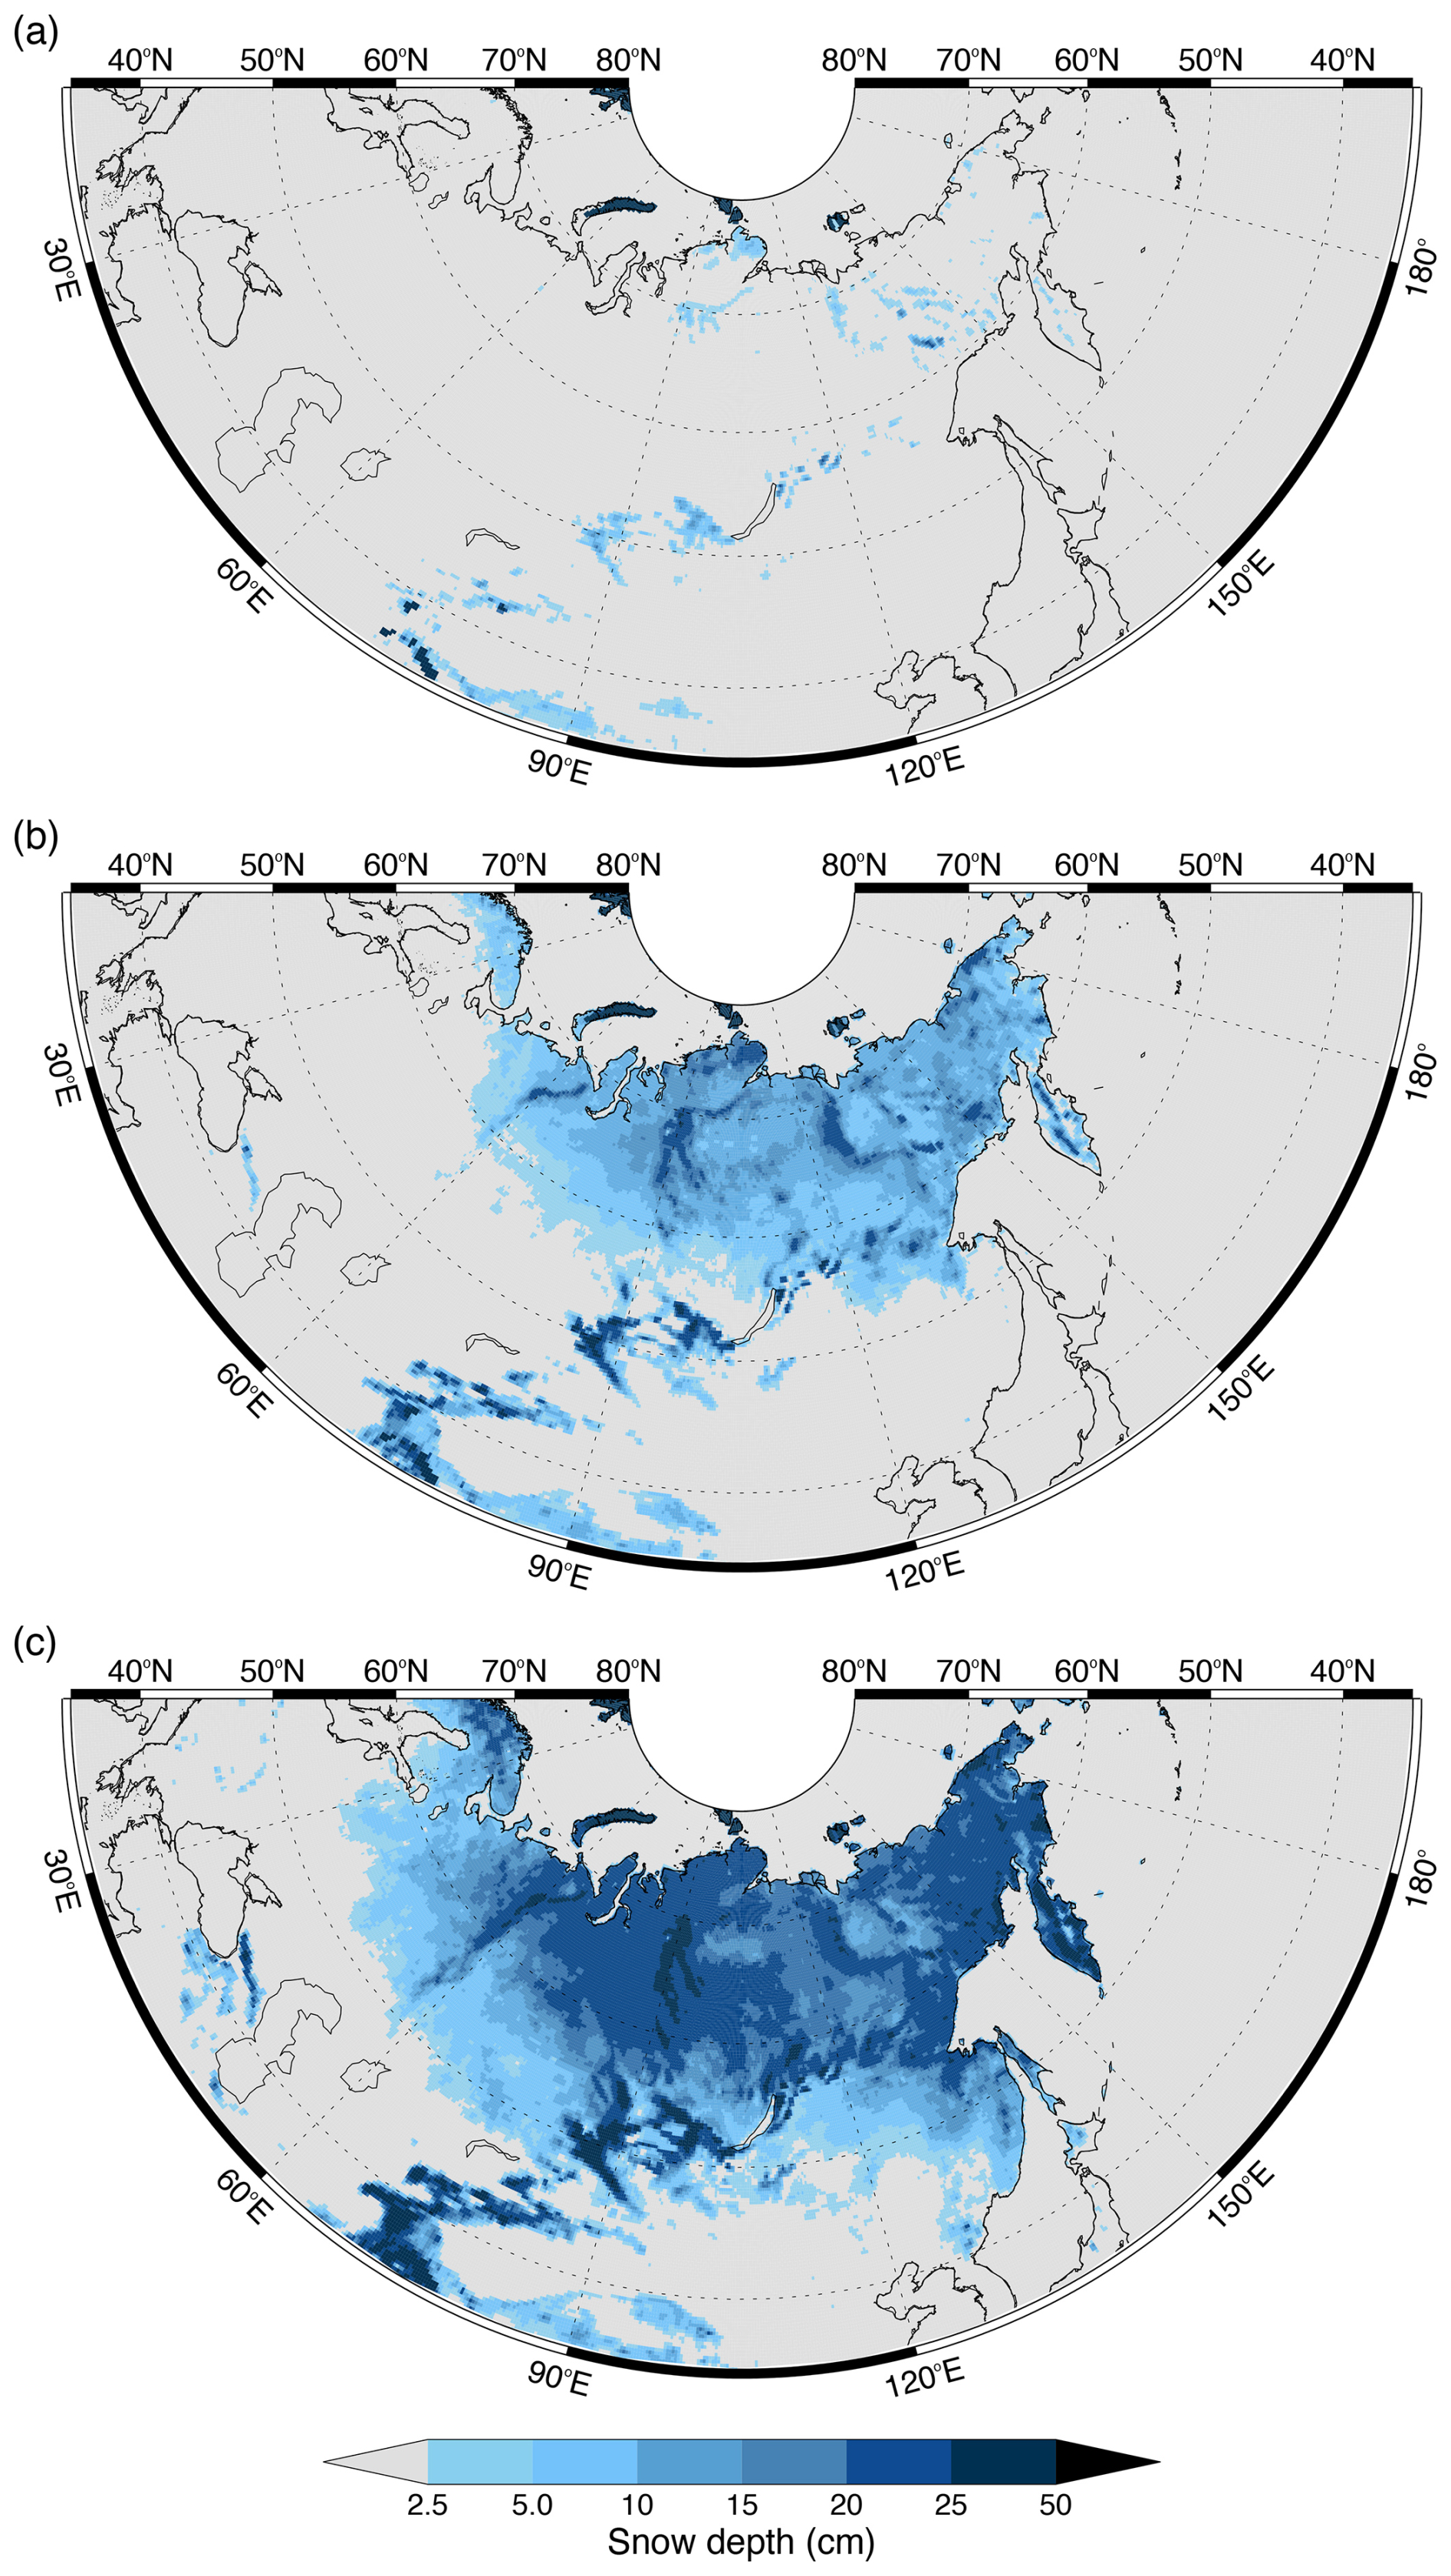
Figure 1Median SD from the European Centre for Medium-Range Weather Forecasts (ECMWF) fifth-generation reanalysis (ERA5) 2003–2022 on (a) 30 September, (b) 31 October, and (c) 30 November. Based on the definition used in this analysis, the 2.5 cm SD approximates to SC extent. The SC extent increases from 1.53×10⁶ km2 at the end of September through 12.77×10⁶ km2 at the end of October to 20.26×10⁶ km2 by the end of November.
Snowfall depends on the regional concurrence of sufficient concentrations of water vapour within the atmosphere together with suitably low temperature and pressure, while, at ground level, SC is contingent on low surface temperatures and an absence of scouring winds (e.g. Mudryk et al., 2017; Allchin and Déry, 2020). Clark et al. (1999) stated that SC variability over Europe and southwestern Asia is largely controlled by temperature, while in eastern Asia it is primarily determined by precipitation availability. However, Kitaev et al. (2002) suggested that, in the late 20th century, the role of low air temperatures in the formation of Eurasian SC has diminished, while that of high precipitation has increased. Conversely, Mokhov and Parfenova (2021) found an increasingly strong negative relationship between October SC and SAT across Eurasia as a whole.
It should be noted that the latter analysis utilised the National Oceanic and Atmospheric Administration Climate Data Record (NOAA CDR) satellite-based SC dataset (Estilow et al., 2015). Due to the length of this dataset, back to 1966, it has often been employed in past studies to examine trends in Eurasian SC and demonstrates an increase in autumn SC (e.g. Cohen et al., 2012). However, comparison against independent datasets has revealed that the upward trend in CDR-derived SC from 1992 to 2015 is an artefact resulting from the increasing accuracy of the product as higher-resolution satellite data became available (Brown and Derksen, 2013; Mudryk et al., 2017; Urraca and Gobron, 2023). In reality, observations indicate that autumn SC, SC onset (SCO), and snow depth (SD) have decreased in recent decades across much of Eurasia (e.g. Bulygina et al., 2009; Urraca and Gobron, 2023), consistent with the observed Arctic warming. Unfortunately, there are often temporal discontinuities in SC datasets assimilating satellite data and ground-based observations that compromise their ability to provide the temporally homogeneous datasets required for long-term studies of SC change.
Autumn snow accumulation is associated with regional cyclonic activity. In the western part of the Russian Arctic, the weather systems bringing snowfall often start over the North Atlantic, while in the east they originate from the Bering Sea, the Okhotsk Sea, or the North Pacific. In November there is often a west–east dipole in SC anomalies across Eurasia, with one pole in eastern Europe and the other in southeastern Siberia and northern Mongolia (e.g. Gastineau et al., 2017; Han and Sun, 2018; Zhang et al., 2023). Cyclogenesis may also occur locally along the border between different air masses, with very cold air originating from the climatological continental Siberian High, contrasting with Arctic air from the north, which is often warmer and always more humid than the continental air (Bednorz and Wibig, 2016). In southern Siberia (50–60° N), these cyclones transport cold air into the region from the north or east and induce negative temperature anomalies that allow SC to persist (Bednorz and Wibig, 2017). In addition, Allchin and Déry (2020) suggested that incidences of earlier Eurasian SCO may result from northward advection of moisture by stronger southerly winds, driven by altered gradients in geopotential height north of the Himalayas. The spatial variability in the different air masses that give rise to the cyclogenesis of snow-bearing weather systems is primarily associated with low-frequency macro-scale atmospheric circulation variability, which can be expressed as a series of teleconnection patterns that are, in turn, driven predominantly by either internal atmospheric dynamics or atmosphere–ocean–ice interactions (e.g. Marshall, 2021). One of the principal teleconnection patterns affecting the autumn Eurasian SC is the Arctic Oscillation (AO) (e.g. Thompson and Wallace, 1998). We note that, while the North Atlantic Oscillation (NAO) and the AO are defined quite differently, they often have similar climatic impacts across Eurasia (e.g. Yu et al., 2017); therefore, in this study, we consider them to be the same pattern and simply refer to them as the AO.
In addition to the local climate impact of autumn Eurasian SC, it may also modulate and thus help predict Northern Hemisphere (NH) climate variability at much larger spatial scales. A substantial amount of scientific literature has focused on the influence that autumn SC variability may have on the following winter AO, an idea first proposed by Cohen and Entekhabi (1999) and reviewed in detail by Henderson et al. (2018). The proposed conceptual mechanism through which SC variability is coupled to the atmosphere is summarised in several papers (e.g. Cohen et al., 2007, 2014; Furtado et al., 2015; Henderson et al., 2018). In brief, an expanded October Eurasian SC cools the surface and raises isentropic surfaces in the stable lower atmosphere, leading to higher pressure. This pressure anomaly amplifies the regional atmospheric wave pattern such that it favours ridging near the Barents and Kara seas and the Urals and troughing further east, a spatial configuration that provides a local source of upward-propagating Rossby waves into the stratosphere. Here, anomalous momentum and heat fluxes are deposited, inducing a westward torque that weakens the polar vortex and can lead to sudden stratospheric warming events in winter. The circulation anomalies subsequently descend into the troposphere over a period of weeks, eventually manifesting as a negative-polarity AO. In summary, greater autumn Eurasian SC precedes a negative winter AO that is generally associated with a warmer Arctic but colder and more severe winter conditions in NH mid-latitudes. Case studies of the 2009/10 cold winter demonstrated that Eurasian SC changes provided significant skill in predicting the record-low values of the coincident AO (Cohen et al., 2010; Orsolini et al., 2016).
However, modelling studies that have attempted to reproduce the SC–AO linkages have had mixed success. “Free-running” models generally fail to replicate the mechanism (e.g. Furtado et al., 2015; Handorf et al., 2015; Peings et al., 2017), while model runs with bias corrections and imposed SC anomalies do better (e.g. Allen and Zender, 2011; Tyrrell et al., 2020). In the “middle ground”, Wegmann et al. (2021) compared free-running models with different initial SC regimes and demonstrated a small but measurable impact on the winter AO. Henderson et al. (2018) concluded that current models are especially poor at capturing the planetary wave generation and stratosphere–troposphere coupling components of the SC–AO mechanism. Further potential causes of the poor model skill include the signal being masked by substantial internal Arctic climate variability (e.g. Peings et al., 2021); the existence of the mechanism having a state dependence such as through the phase of the Quasi-Biennial Oscillation (QBO) (Garfinkel et al., 2010; Peings et al., 2013; Overland et al., 2016); and other “competing” but not necessarily independent factors that also impact the AO, such as variability in Arctic Ocean sea ice (e.g. Handorf et al., 2015; Delhaye et al., 2024), Ural Blocking (e.g. Peings, 2019), and North Atlantic sea surface temperatures (e.g. Tao et al., 2023).
The Eurasian SC–AO relationship identified by Cohen and Entekhabi (1999) and expanded in successive papers by Cohen and co-authors was necessarily based on a relatively limited period of recent data (e.g. 1973–2012) because of the shortness of the SC record. However, longer time series of spatial SC have subsequently become available as output fields from global reanalyses that extend back to the 19th century. Using the National Oceanographic and Atmospheric Administration (NOAA) 20th Century Reanalysis (20CR) back to 1900, Peings et al. (2013) demonstrated that the SC–AO relationships observed in the recent period were not temporally invariant (stationary), with the past few decades having the most robust and continuously significant relationships. For most of the 20th century there was no statistically significant SC–AO relationship. Douville et al. (2016) and Wegmann et al. (2020) examined the SC–AO relationship in an additional reanalysis, the European Centre for Medium-Range Weather Forecasts (ECMWF) 20th Century Reanalysis (ERA-20C). Wegmann et al. (2017) established that, pre-1950, the two reanalysis products diverted towards different base states, with 20CR and ERA20-C having SDs that were too high and too low, respectively. Therefore, in conclusion, Douville et al. (2016) proposed that the temporal modulation of the Eurasian SC–AO relationship might arise simply from stochastic noise and/or from an external physical driver such as the QBO or low-frequency modes of oceanic variability. However, in contrast, Wegmann et al. (2020) determined that a negative AO signal following a strong November west-to-east SC gradient was valid throughout the last 150 years. Moreover, the strongest correlations occurred during periods of high November snow variability coincident with strong Arctic warming at the beginning and end of the 20th century.
In this study, we utilise the latest version of the 20CR reanalysis version 3 (hereinafter 20CRv3) to (i) examine changes in autumn Eurasian SC, both in terms of its extent and rate of advance (Cohen and Jones, 2011), and (ii) revisit the spatial and temporal variability in the magnitude and sign of the SC–AO relationship. There are several novel aspects to our work compared to previous studies. Firstly, the use of 20CRv3 allows our analyses to go back to 1836, earlier than previous studies. Secondly, in order to reduce bias and detect temporal discontinuities in 20CRv3 SC, we adjust it by comparison with ECMWF fifth-generation reanalysis (ERA5) SC data, which in turn have been validated against SD observations. Thirdly, we analyse the statistical significance of the frequency of periods of significant SC–AO relationships to determine whether the connection can be distinguished from simply arising by chance.
In Sect. 2, we define the five different SC indices examined in this analysis and how they are calculated and describe the different data types employed: observed SD data, reanalysis data, and teleconnection indices. In Sect. 3, we explain the methodology used to remove the bias in SC within 20CRv3 and the various statistical methods applied in this analysis. The results are presented in three sections: in Sect. 4.1 we examine the trends in the SC indices derived from 20CRv3, in Sect. 4.2 we explore the spatial and temporal variability in the Eurasian SC–AO relationships, and in Sect. 4.3 we focus on a previously unknown and apparently robust relationship between September SC and the AO. In Sect. 5, we set our new results in the context of previous SC–AO analyses in the literature and determine whether these findings are reproducible in 20CRv3. Finally, in Sect. 6, we summarise our principal conclusions.
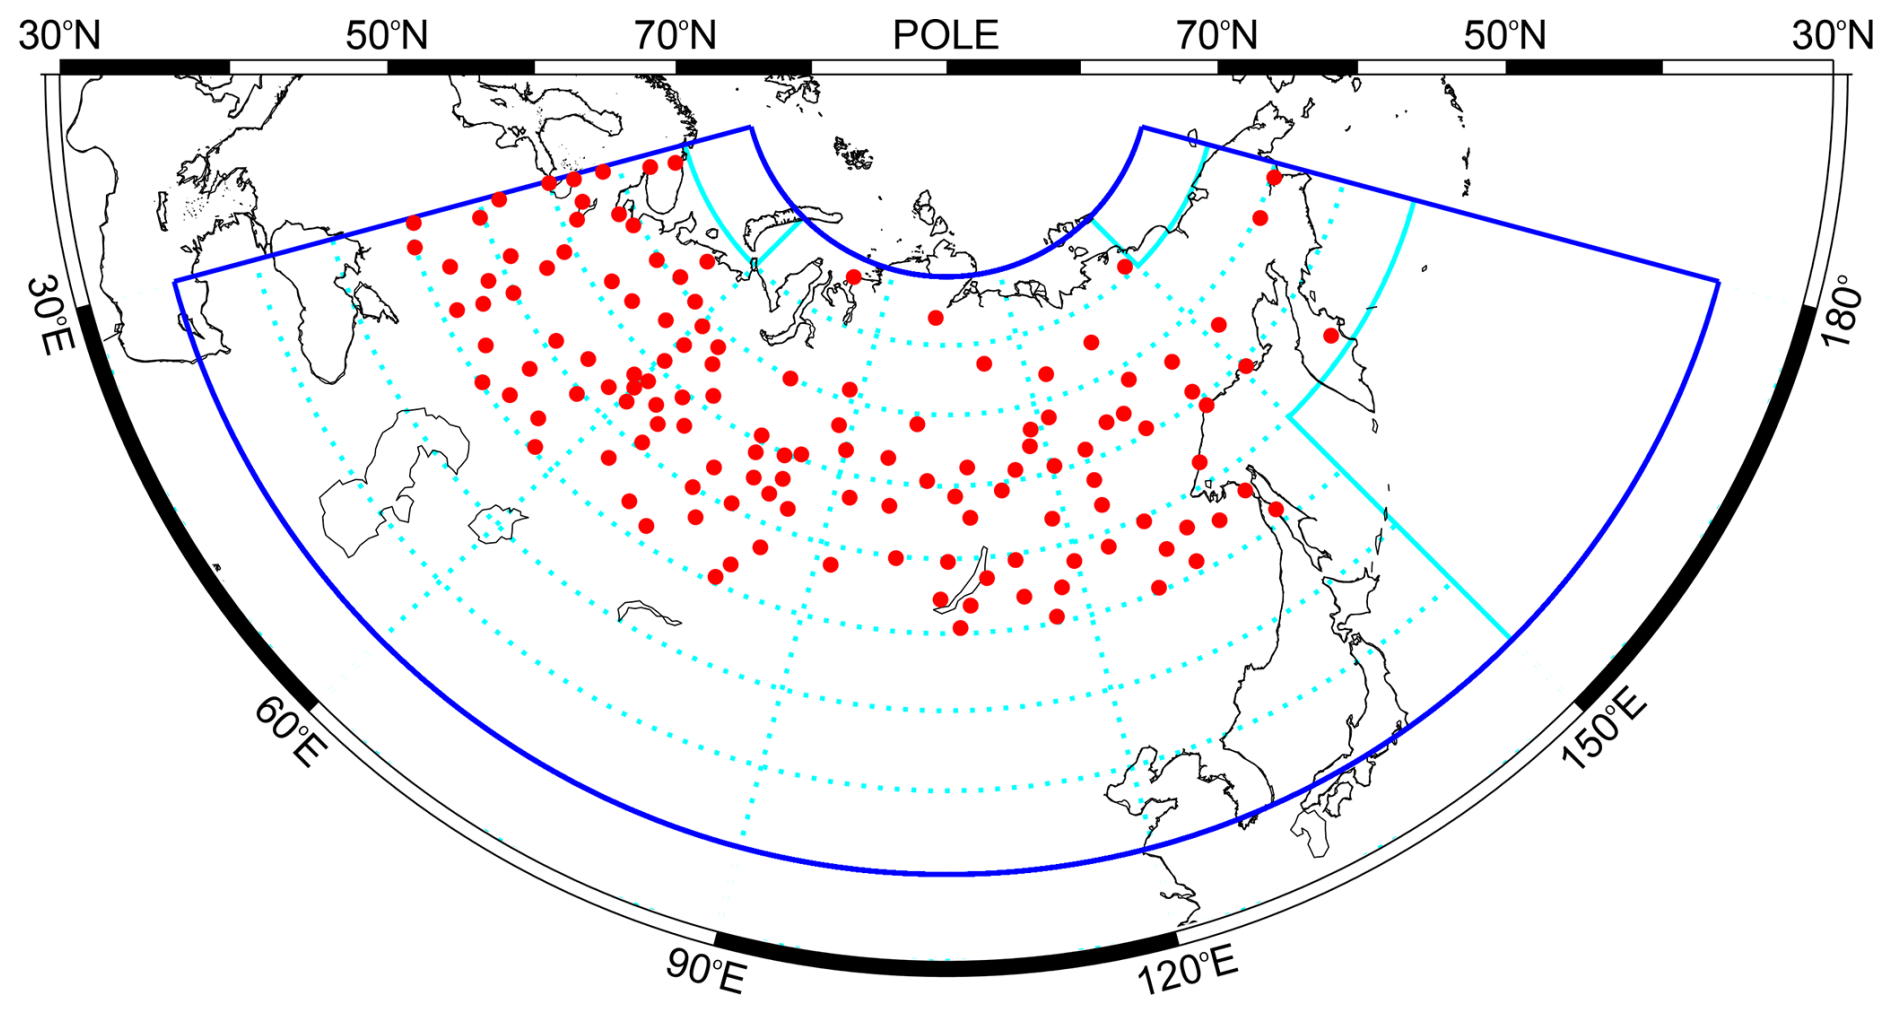
Figure 2Red dots are the locations of the 133 stations with daily snow depth observations used to validate ERA5. The thick blue line shows Eurasia, as defined in this study, while the dashed cyan lines denote the 34 subregions (5° latitude by 30° longitude) analysed individually.
Table 1The snow cover indices examined and their acronyms used in the paper.
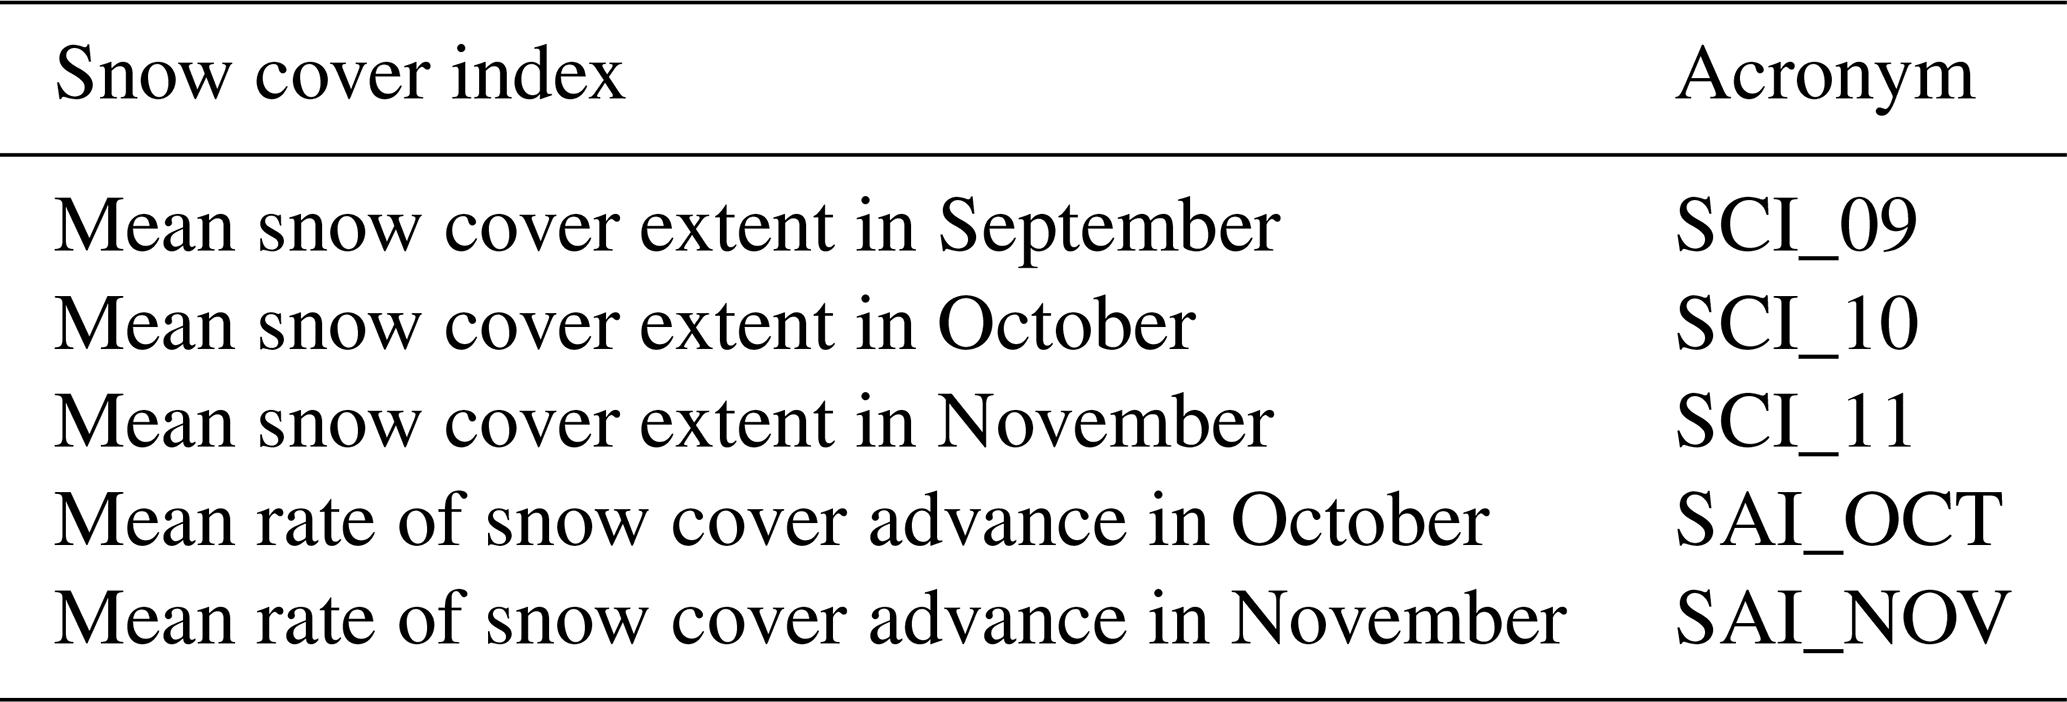
2.1 Snow cover indices
In this study we examine trends and Eurasian SC–AO relationships for five different SC indices. Eurasia is defined as the region bounded by 35–75° N and 30–180° E. In order to examine spatial variability in the SC indices and their relationship to the AO, this region was subdivided into 40 areas (5° latitude by 30° longitude). Note that some of these subregions actually contain little or no SC data, as they are predominantly or wholly ocean (Fig. 2); thus only 34 subregions are analysed individually. The SC indices are listed, together with their acronyms, in Table 1. They comprise three monthly SC extent indices (SCIs) and two monthly SC advance indices (SAIs). The monthly SCIs are calculated as the mean of the daily SC data in that month, while, following Cohen and Jones (2011), the monthly SAIs are computed as the regression coefficient of the least-squares linear trend through the daily SC data for that month. However, unlike Cohen and Jones, the regression coefficient is not multiplied by −1; therefore, in this study, a higher SAI corresponds to a faster snow advance and vice versa.
In order to calculate the SC, we need to define the SCO. Here, the SCO is defined as the first day of the first period of 5 or more consecutive days in the snow year (August to July) when the SD is greater than or equal to 2.5 cm. The 2.5 cm definition for SD was chosen following the analysis of SC fraction and SD by Urraca and Gobron (2023): they found that an SD of 2.5 cm typically equates to an SC fraction of 50 %, which is used as the threshold in many analyses of SC extent (e.g. Hori et al., 2017). While the period of 5 d is shorter than used in some other studies (e.g. Bender et al., 2020), and there will, of course, be some instances of subsequent periods without SC, it matches the definition in other previous analyses of SC (e.g. Peng et al., 2013). Moreover, we found that using a longer period than 5 d meant that there were several years without an SCO at some of the more southerly meteorological stations (Sect. 2.2). Using the above definition for SCO, the number of times when there was no SCO was limited to six examples among four stations.
2.2 Daily snow depth observations
The daily SD data utilised to test the accuracy of SC in the ERA5 reanalysis were observed at meteorological stations in the former Soviet Union and comprise part of the Historical Soviet Daily Snow Depth (HSDSD) version 2 dataset (Armstrong, 2001). Today the significant majority of these stations are located within Russia, but some used in this analysis are now situated in Kazakhstan or Ukraine. The HSDSD dataset spans the time period from 1881–1995, so the daily snow depth data were appended to 2022 using data obtained via the Global Telecommunication System (GTS). These data were acquired from either the UK Met Office Integrated Archive System (MIDAS) Land and Marine Stations Data (Met Office, 2012) or the Spanish Ogimet website. The original measurements were taken as an average from three permanent snow stakes surrounding each station (Ye, 2001), with no changes in procedures since 1965 (Bulygina et al., 2011). The snow depth from the HSDSD stations is provided to the nearest centimetre.
While quality control of the HSDSD data has been undertaken (Armstrong, 2001), some “gross” errors remain. For example, there are still a small number of instances where “factor of 10” errors occur, and these were corrected as appropriate. It was also noted that, across most stations for the period from 1966–1975, there were a lot of SD values of “999” at the beginning and end of the periods of SC, which means that the value was rejected or that an observation was not made. However, after comparing with more recent years, it appears highly likely that these SD data were originally reported as <0.5 cm (WMO code 997), and they were given an SD value of zero.
To maximise the number of years for which SCO could be calculated, small gaps of missing data were infilled using the following methodology. To ensure that the estimated SD could not deviate too much from possible likely actual values, infilling was only undertaken if the gap (days) multiplied by the difference in SD (cm) between the days preceding and following the gap was less than or equal to 20. In such cases, a linear fit was used to estimate the SD to the nearest centimetre. As an example, for station 30636, the daily SD is missing for 30 and 31 December 1939. The SD values on 29 December 1939 and 1 January 1940 were 20 cm and 12 cm, respectively. As 2×8 is less than 20, the missing data were infilled and given estimated SD values of 17 and 15 cm for 30 and 31 December 1939, respectively.
To minimise the impact of temporal changes in the availability of validating data, meteorological stations were only included in the analysis if at least 90 % of years with SCO data are available in both the 2003–2022 and 1966–2022 periods. The first of these periods is that over which the ERA5 SD data are most accurate (see Sect. 3.1), and the second is when the observational SDs are considered homogeneous (e.g. Bulygina et al., 2011). Based on these criteria and the requirement to be located within our definition of Eurasia (35–75° N, 30–180° E), a total of 133 meteorological stations were chosen. We only examined stations north of 50° N, as there are very few former Soviet stations south of this latitude, and those that are often have missing SCO data, as SC is limited. The locations of the 133 SD observation stations are shown in Fig. 2, and further details are provided in Table S1.
2.3 20th Century Reanalysis version 3 (20CRv3)
The 20CRv3 reanalysis is the latest version of the NOAA 20CR, described by Compo et al. (2011), with the improvements to version 3 outlined by Silvinski et al. (2019). It uses the National Centers for Environmental Prediction (NCEP) Global Forecast System v14.0.1 that was operational in 2017. Daily SD data for the 180 years from 1836–2015 were obtained on a 1° × 1° latitude/longitude grid. In addition, monthly 1000 hPa geopotential height (hereinafter gpht) data were utilised to develop a winter AO index (see Sect. 2.5), while 500 hPa gpht fields were employed in further analysis. Although 20CRv3 has 80 ensemble members, the spread of which provides an internal measure of reanalysis uncertainty, in this study we only utilise data from the ensemble mean.
This reanalysis only assimilates surface pressure data and does not include an analysis of surface conditions. Key updates in 20CRv3 include an upgraded assimilation scheme, which incorporates a 4D incremental update analysis and uses an adaptive rather than fixed localisation length for quality control, a higher-resolution forecast model, and a larger set of pressure observations made available through various data-mining projects. Of particular relevance to the current study, this has resulted in a marked reduction in the negative-pressure biases found across much of western Eurasia in earlier versions of 20CR (Silvinski et al., 2019). Snow is represented as a separate layer on top of the soil layer with independent prognostic thermal and mass content, but liquid water content is not accounted for (Wegmann et al., 2017).
Two previous studies have compared snow parameters in earlier versions of 20CR with observations over Eurasia. Peings et al. (2013) found that, by treating SC simply as a binary dataset, 20CRv2 was able to represent the daily advance of SC in October and November throughout the 20th century. Wegmann et al. (2017) evaluated SD in four long-term reanalyses, including two earlier versions of 20CR. While the 20CR reanalyses generally overestimated SD, they did demonstrate a moderate daily correlation (0.6–0.7) with observations across the whole 20th century and provided a good representation of both spatial and temporal variability in SD in the second half. In particular, the authors noted relatively high correlations with observed SD in 20CRv2 in October–November (ON).
2.4 ECMWF fifth-generation reanalysis (ERA5)
ERA5 is the current global reanalysis product produced by ECMWF, with data available from 1940 to the present. It is based on the Integrated Forecasting System (IFS) Cy41r2, which was operational in 2016 (Hersbach et al., 2020), and has hourly output of global fields on 137 vertical pressure levels at a spatial resolution of ∼31 km. In combination with improved modelling of surface conditions and more consistent sea ice analyses, this helps it generally better reproduce Arctic climate than its predecessors, including improved total snowfall (e.g. Wang et al., 2019).
In ERA5, assimilation of both in situ and satellite snow observations is undertaken using a 2D optimal interpolation system as part of the land data assimilation scheme (LDAS) (Hersbach et al., 2020). From 2004 onwards, it also employs information on SC over the Northern Hemisphere derived from the Interactive Multisensor Snow and Ice Mapping System (IMS). This is a 4 km resolution binary product produced by NOAA that combines microwave, visible, and infrared satellite images and manual analysis input: an SD of 5 cm is assigned to all IMS snow-covered pixels below 1500 m. Mortimer et al. (2020) and Urraca and Gobron (2023) described a 2003/04 discontinuity in ERA5 SD and snow mass, respectively, which is associated with the start of the assimilation of IMS data. The authors of the second of these papers also demonstrated two earlier stepwise improvements in ERA5 SD bias in 1977–1980 and 1991/92: these were linked to the assimilation of the first satellite products and a wider and more complete series of SD observations in Russia and China (e.g. Clelland et al., 2024), respectively.
Here, ERA5 daily SD (cm) was computed from the mean daily SD in water equivalent and mean daily snow density, which, in turn, were calculated as the average of 24-hourly output fields.
2.5 Teleconnection indices
We used two winter (December–January–February, DJF) AO indices to examine the relationship between Eurasian SC and the AO. The first of these is taken from the monthly AO index available at the Climate Prediction Center (CPC), obtained by projecting monthly 1000 hPa gpht anomalies poleward of 20° N onto the loading pattern of the AO, which is the leading Empirical Orthogonal Function (EOF) as derived from the NCEP/National Center for Atmospheric Research (NCAR) reanalysis for 1979–2000. These data are only available from 1950 onwards. Therefore, in order to investigate the Eurasian SC–AO relationship prior to this, a winter AO was derived from 20CRv3 1000 hPa gpht fields using a similar methodology. In addition, the western Pacific (WP) pattern index for September was also acquired from the CPC.
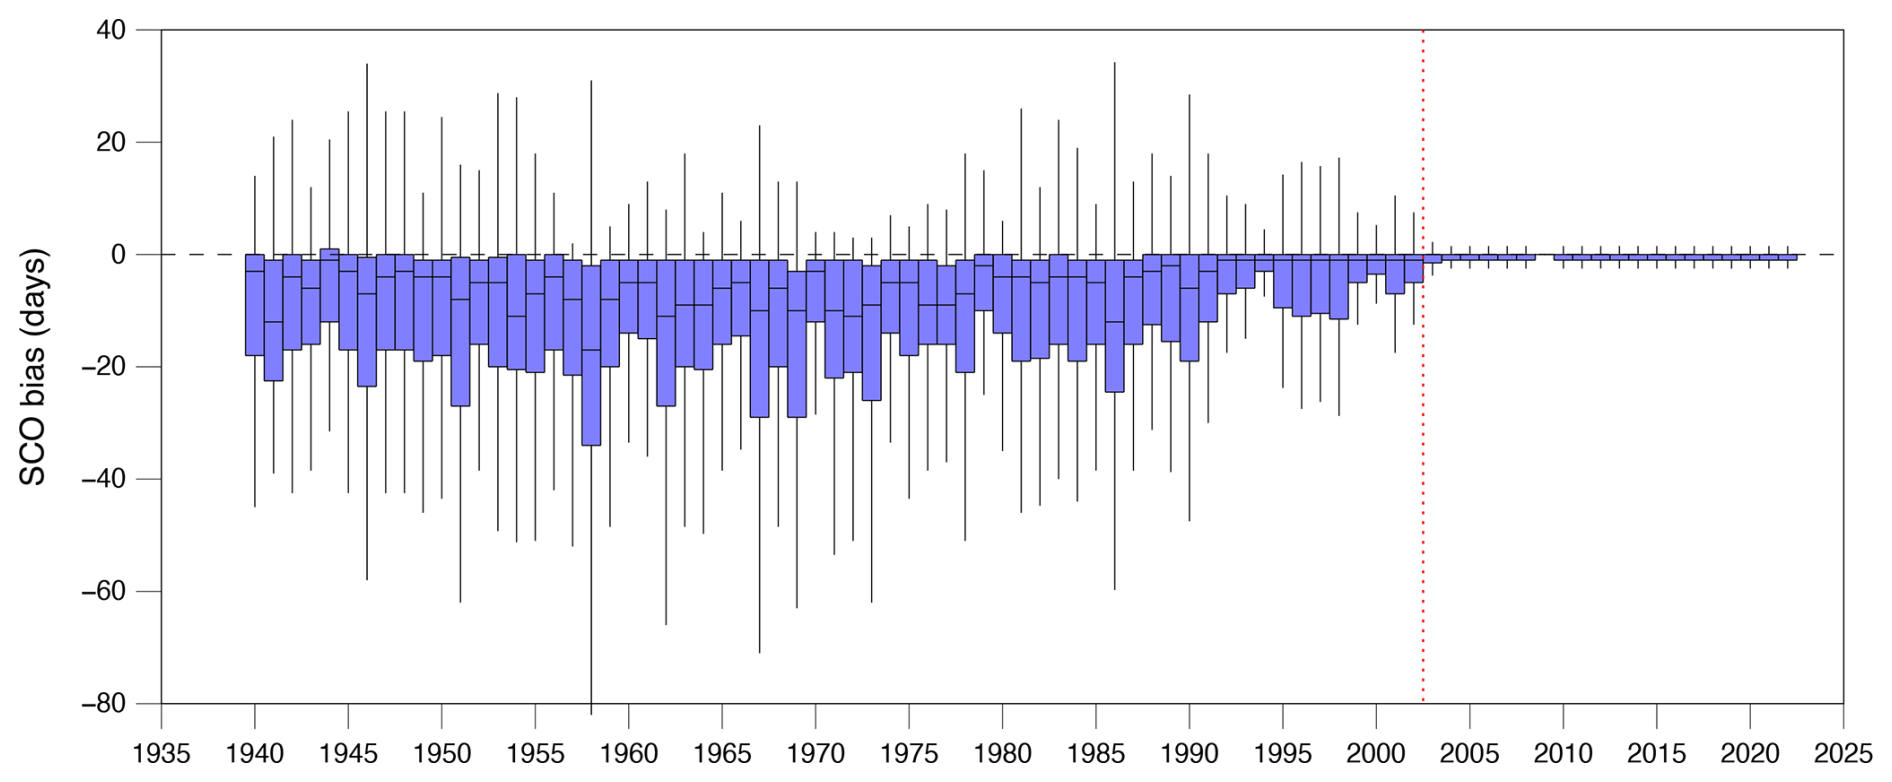
Figure 3Annual bias statistics in SCO in ERA5 (1940–2022). The horizontal black line represents the median bias, the blue boxes show the interquartile range in the bias, and the whiskers show the larger (smaller) of either the upper (lower) quartile plus (minus) 1.5 times the interquartile range or the maximum (minimum) value. The vertical dashed red line indicates when the final discontinuity occurs (2003), after which ERA5 SCO is considered accurate.
3.1 Removing bias and recognising temporal discontinuities in 20CRv3 SC
The first stage of the methodology is to examine temporal changes in the accuracy of the ERA5 reanalysis by comparing the SCO determined from daily SD data, interpolated bilinearly to a station location, against that derived from observations at the 133 meteorological stations for the October–November (ON) period (1940–2022). Figure 3 demonstrates that there is a marked improvement in the bias in ERA5 SCO between 2002 and 2003, after which the significant majority of the station locations have zero bias. Therefore, we consider ERA5 SCO to be “accurate” for the 20-year period from 2003–2022 (hence the period chosen for Fig. 1).
The timing of the improvement in ERA5 SCO in 2003 is close to but does not exactly match the 2003/04 discontinuity in other ERA5 snow parameters previously described by Mortimer et al. (2020) and Urraca and Gobron (2023), which is associated with the start of the assimilation of IMS data. In addition, temporary improvements in ERA5 SCO bias occur at similar times to the earlier stepwise improvements in ERA5 SD bias in 1977–1980 and 1991/92 noted by Urraca and Gobron (2023). However, in the case of SCO, the bias subsequently worsens slightly until the next step change in accuracy.
SD in earlier versions of 20CR is known to be biased high (Wegmann et al., 2017). To determine whether 20CRv3 is more accurate, both 20CRv2c and 20CRv3 SD data were compared directly to SD measurements at 125 of the meteorological stations employed in this analysis. The eight missing stations are a consequence of being located on the “wrong side” of the land–sea mask of the coarser spatial resolution of 20CRv2c. Time series of the mean daily October–November (ON) bias for the two versions of 20CR are shown in Fig. S1, which indicates there is no improvement in the high bias in autumn SC in 20CR. In fact, 20CRv3 is slightly worse: the mean SD bias across the whole ON dataset is 6.2 and 8.3 cm for 20CRv2c and 20CRv3, respectively. Therefore, the second component of the methodology is to calculate the offset in 20CRv3 SD required to minimise the difference in daily SC between that reanalysis and ERA5 for ON during the period of overlap in which the latter SCO is considered accurate (2003–2015). We note that the coarser spatial resolution of 20CRv3 versus ERA5 is likely also a contributing factor to the offset. Changes in the bias and RMSE for offsets from 2.5–10.0 cm are shown in Fig. S2, which reveals that an offset of 9.0 cm provides the best statistics. Thus, when calculating the various SC indices in the following analyses, 9.0 cm is removed from the 20CRv3 SD.
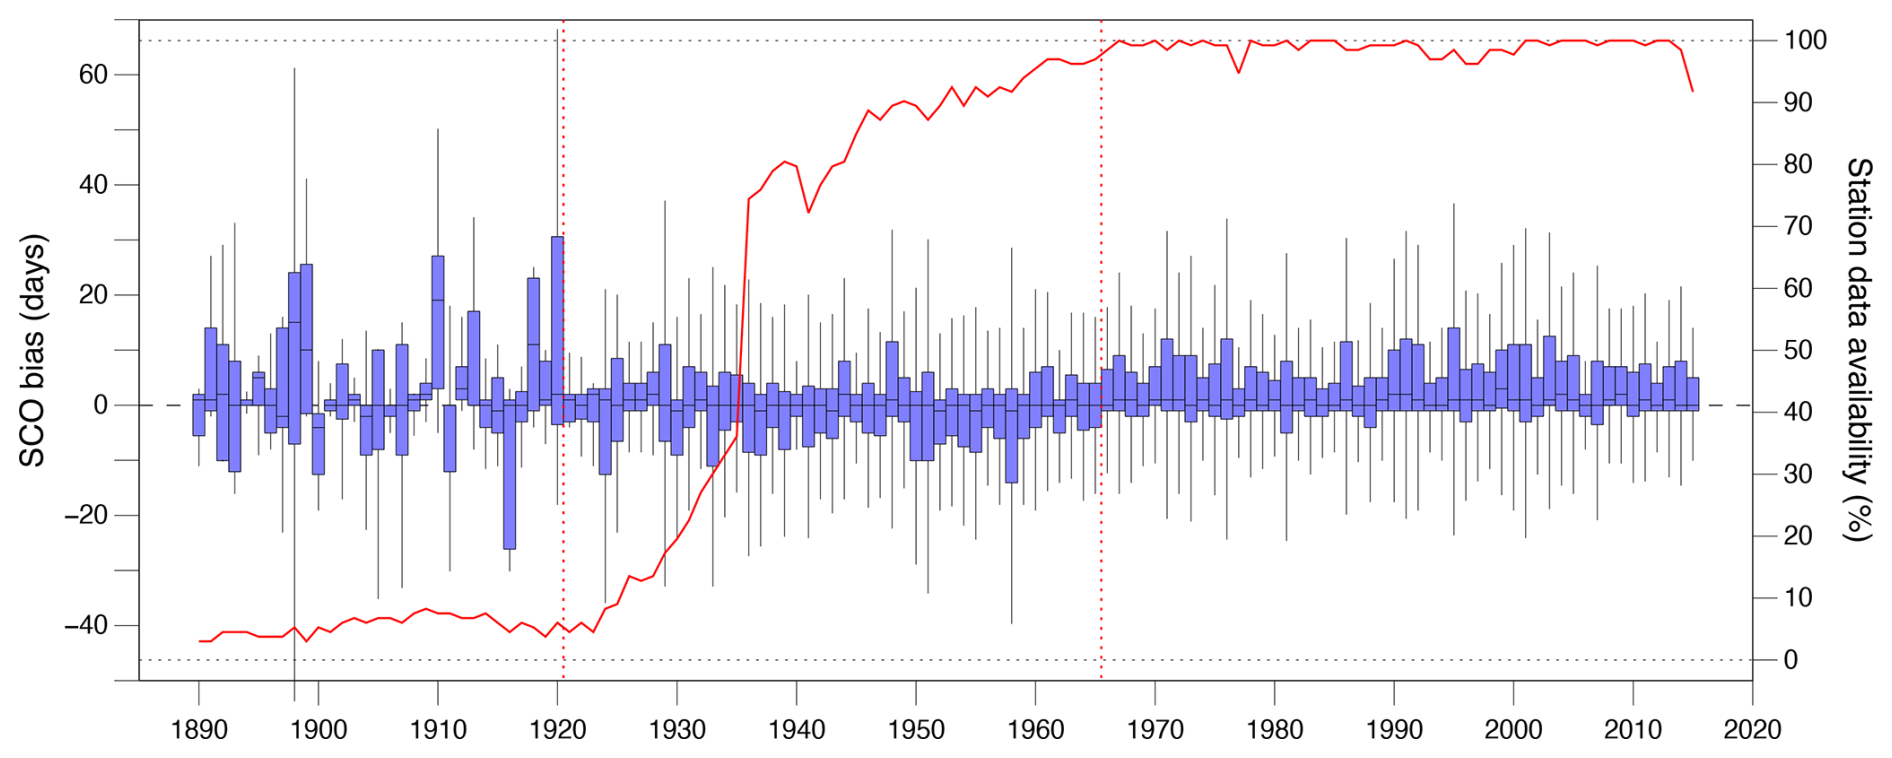
Figure 4As in Fig. 3 but for SCO in 20CRv3 (1881–2015) with an assumed 9.0 cm bias in SD removed. The red line is the proportion of the 133 in situ station measurements available for comparison. The vertical dashed red lines are positioned at 1921 and 1966, which represent the start of different periods of likely 20CRv3 SD accuracy (see text).
A comparison of the offset 20CRv3 SCO bias versus that derived from the meteorological stations is shown in Fig. 4. The median bias is generally within 1 or 2 d of zero since the early 1920s, but there are temporal changes in the distribution of the bias values. For example, while the interquartile range is typically ∼10 d from the 1920s onwards, the distributions are predominantly negatively skewed, with bias values generally negative (SCO too early) until ∼1966, after which they become consistently positively skewed, with bias values mostly positive (SCO too late). The timing of the switch aligns with both the beginning of homogeneous SD measurements at the stations (Bulygina et al., 2011) and when there is almost 100 % data availability of these validation data (see Fig. 4). Equivalent analysis of the top 10 % of stations with the most years of SCO data available (not shown) reveals that this improvement is not simply an artefact of the number of stations available for validation. Thus, we consider the SC indices derived from 20CRv3 to be most accurate from 1966 onwards. In addition, the lower and more consistent SCO bias distributions from 1921 onwards suggests that the reanalysis is more accurate in this period than prior to this date, when there is much greater variability in the bias, both between years and between stations. Therefore, in this analysis, we examine the SC indices across three separate periods: (a) 1836–2015 (the whole range of 20CRv3), (b) 1921–1965, and (c) 1966–2015. Based on Fig. 4, results can be considered to be likely increasingly accurate from (a) to (c): nevertheless, with periods (b) and (c) being of similar length, we also compare changes in the SC indices between these two periods.
3.2 Statistical methods
Trends in the SC indices were calculated using the non-parametric “Sen's slope” method (Sen, 1968) that reduces the sensitivity to outliers. Furthermore, we employed the Mann–Kendall test to calculate the significance of the trends because the data may not be normally distributed as there are limits of 0 % and 100 % for the SC indices. We considered utilising prewhitening of the data to eliminate the effects of any autocorrelation. However, while this method removes the possibility of finding a significant trend in the Mann–Kendall test when there is none, it also has the disadvantage of potentially accepting the null hypothesis of no trend with a high probability when a trend does exist. Based on the results of the simulation study of Bayazit and Önöz (2007), we decided not to use prewhitening in our analyses as it would reduce the power of the Mann–Kendall test in the majority of the trends examined. Trends were only calculated when at least 50 % of potential data were available: “missing” reanalysis data result from a region having either 0 % or 100 % SC on all days in a month, giving an SAI of zero and thus making trend analysis problematic if there is a high proportion of such data.
Decadal correlations between the SC indices and the AO were calculated once both datasets had been detrended. To calculate the significance of (i) the frequency of decades with significant SC–AO correlations and (ii) the mean decadal correlation coefficient, we utilise a form of the Monte Carlo method: the AO time series was scrambled 10 000 times, and probability distribution functions (PDFs) of the frequency of significant positive and negative decadal SC–AO relationships (based on a one-tailed test at p<0.10) were derived separately (see Fig. S3 for an example). The observed frequency or correlation coefficient was then compared to the appropriate PDF to determine its level of statistical significance. As there is the potential for running-window statistics to give a false impression of low-frequency variability because of the inherent autocorrelation in the data, we test the robustness of the results by repeating the SC–AO correlation analysis using a 21-year running window, as commonly used in the literature (e.g. Peings et al., 2013; Wegmann et al., 2020). We note that, despite the data providing statistical evidence for a connection between some autumn SC indices and the following winter AO, the possibility remains that the temporal variations in the strength of the SC–AO relationships are due to pure chance.
In addition to temporal variability, we investigate whether there is any marked spatial variation in the strength of SC–AO relationships across Eurasia by subdividing it into the subregions described in Sect. 2.1. We note that the statistical power of computing the correlations for the subregions separately is potentially compromised by the discrete nature of each test and ignores the fact that the fraction of true null hypotheses is unknown and that some false null hypotheses may be rejected (e.g. Wilks, 2016). Furthermore, in plots showing spatial correlations, the statistical significance is calculated using the false discovery rate (FDR) method described by Wilks (2016): as the correlation data exhibit moderate to strong autocorrelation, αFDR=2αglobal, where α is the significance level.
Table 2Decadal trends of the snow indices derived from 20CRv3 for the three time periods examined. Units for the SCIs are in km2×106 dec−1, and the SCA indices are in dec−1. Asterisks denote trends that are statistically significant: * p<0.10, ** p<0.05, and *** p<0.01.
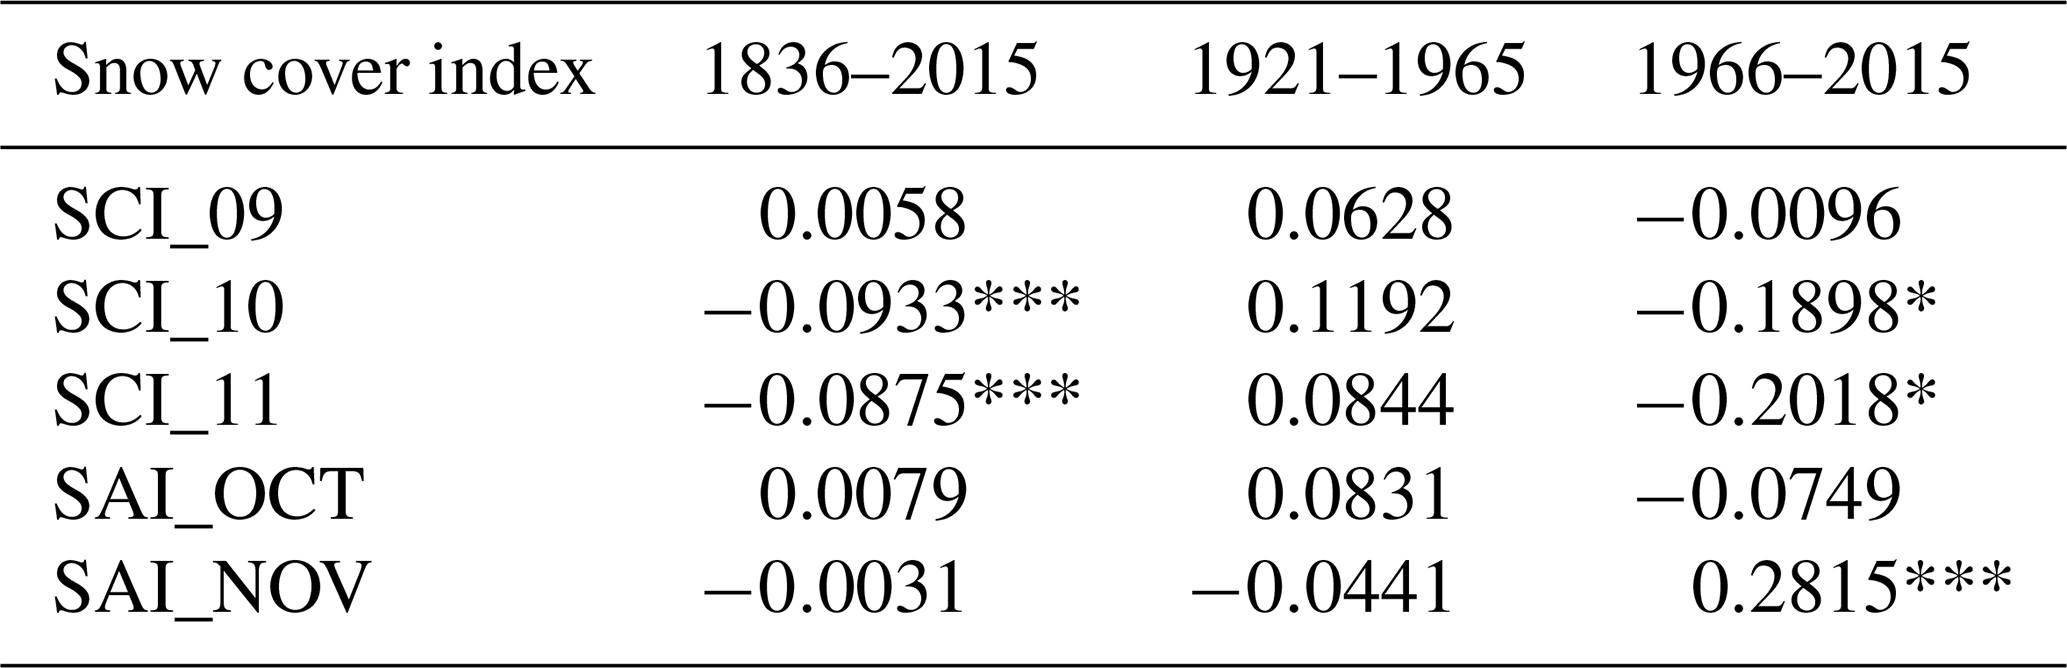
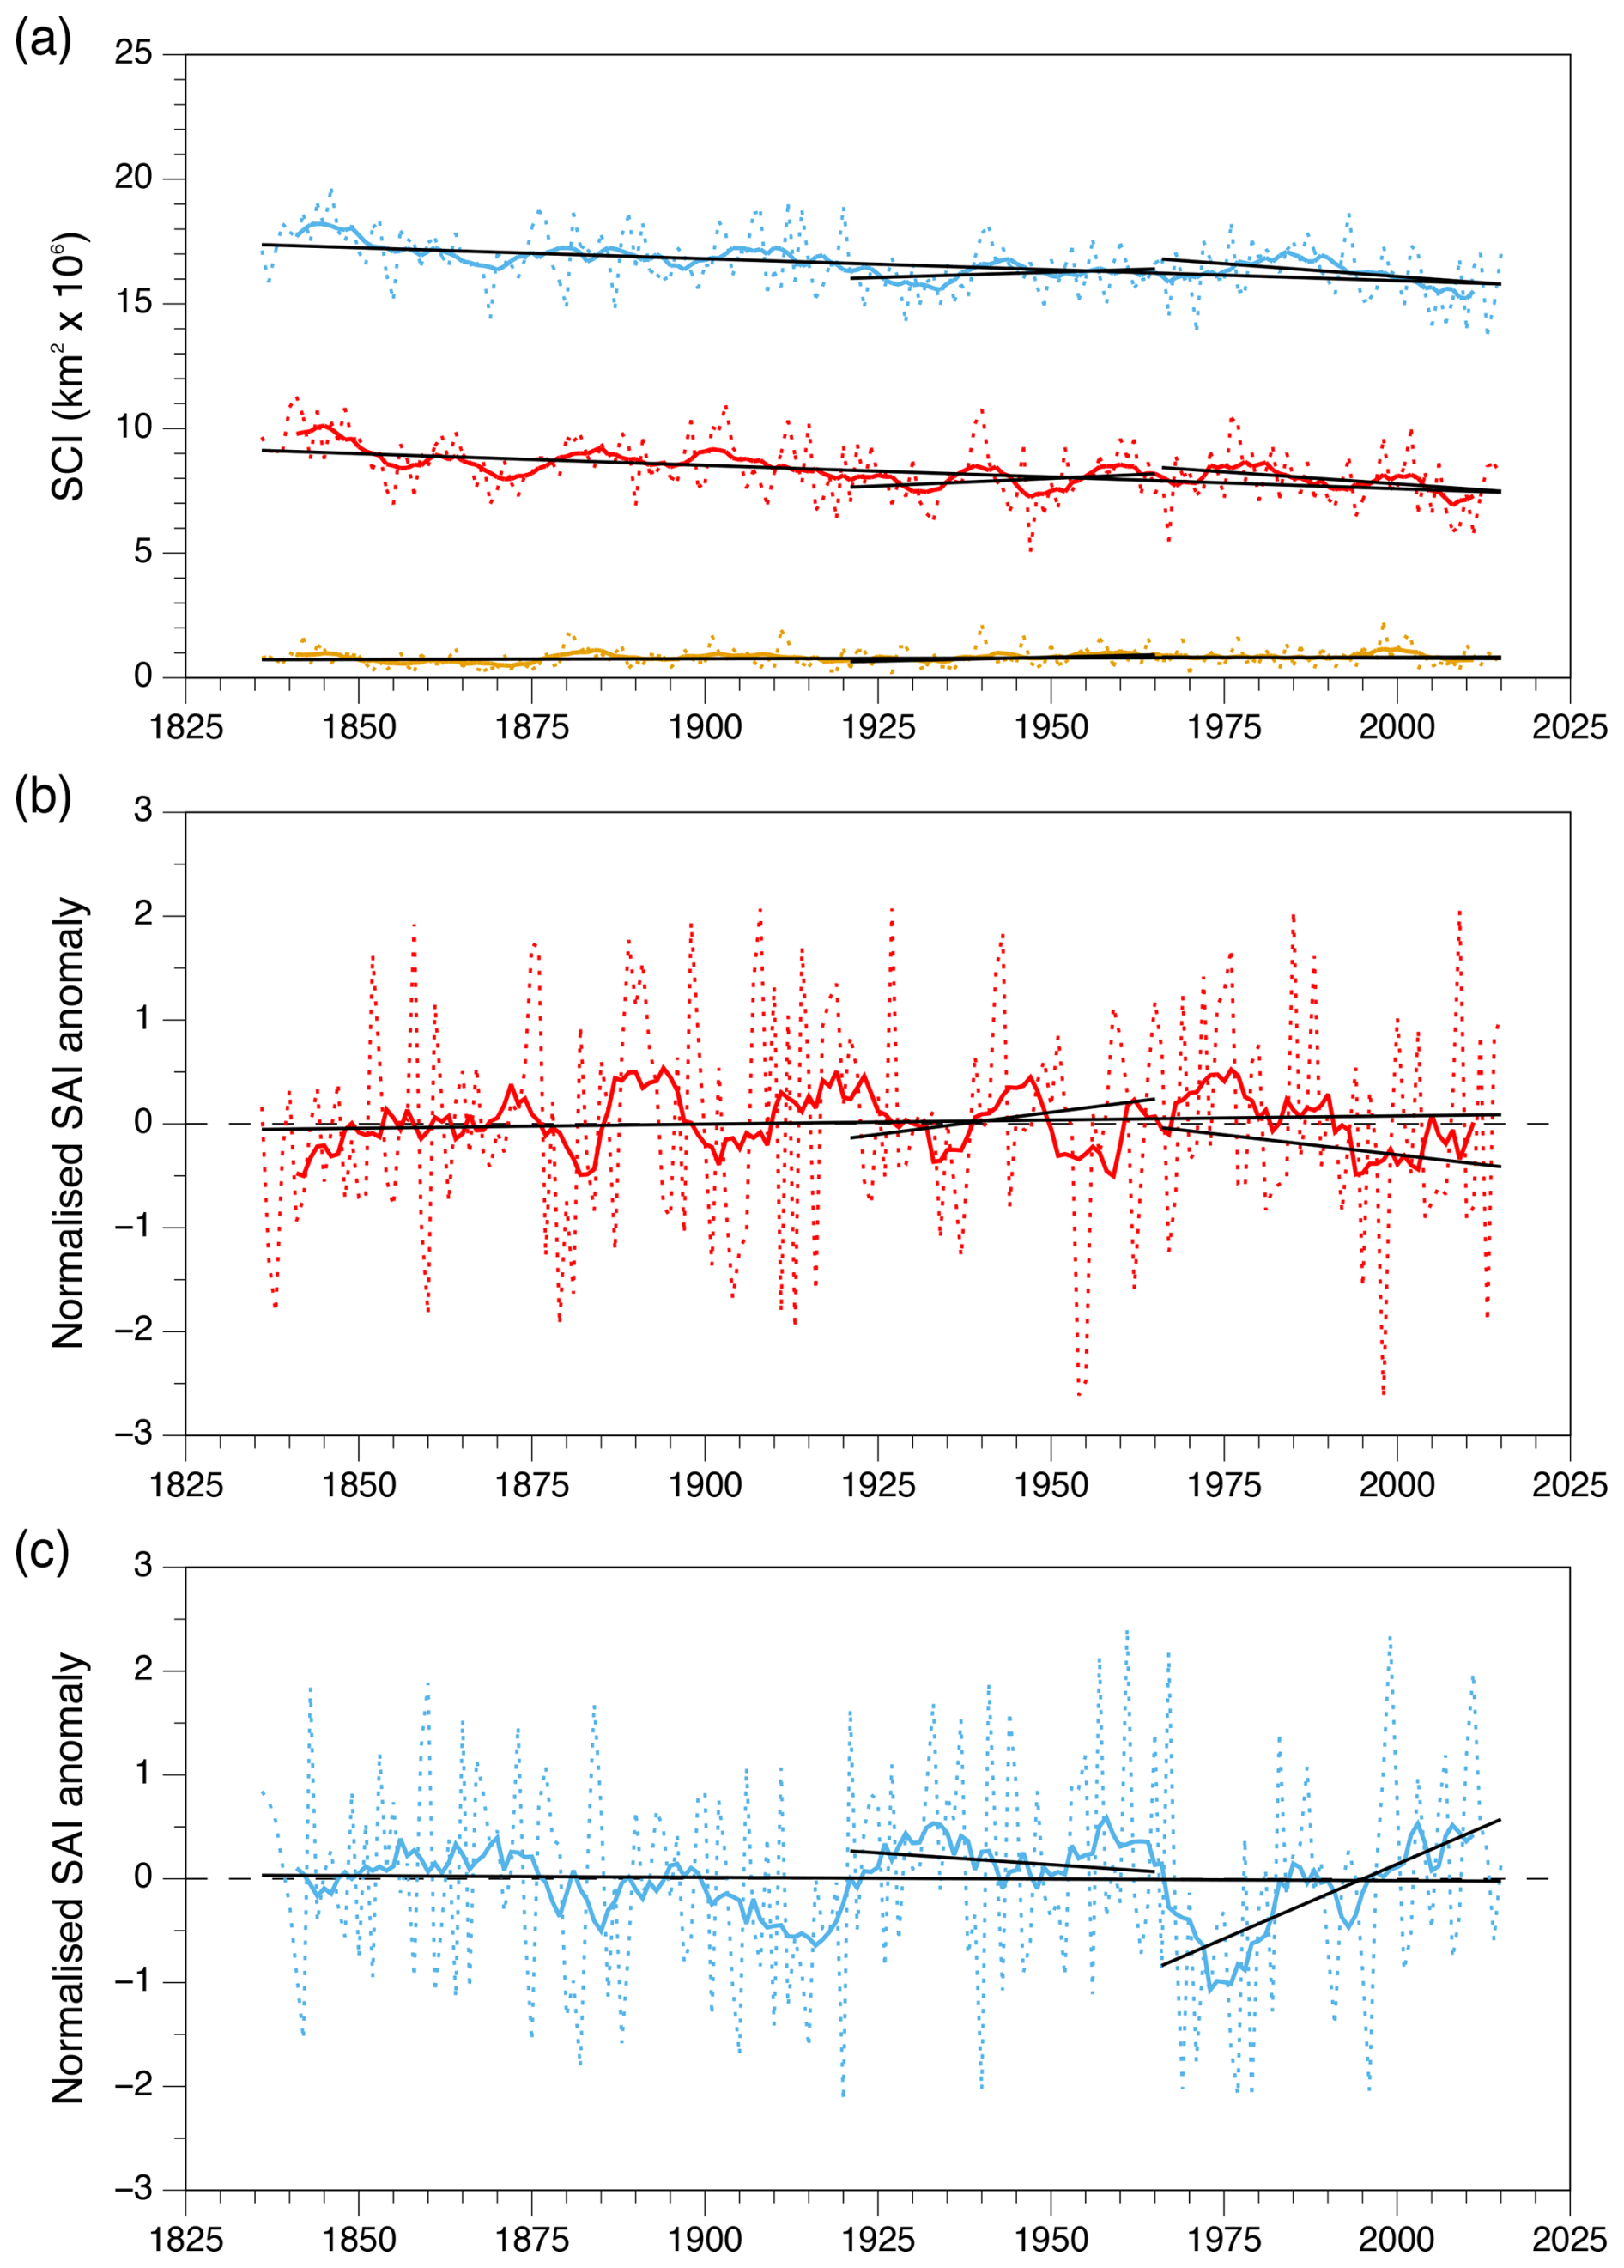
Figure 5Annual Eurasian SC index data from 20CRv3. (a) SCI_09 (brown), SCI_10 (red), and SCI_11 (blue). (b) SCA_OCT. (c) SCA_NOV: annual data (dotted lines) and running decadal means (full lines). Black lines show trends for 1836–2015, 1921–1965, and 1966–2015.
4.1 SC trends
Full 20CRv3 time series of the SCIs, SAI_OCT, and SAI_NOV are shown in Fig. 5a, b, and c, respectively, and trends for the SC indices for the three periods examined are given in Table 2. Across the 180 years of reanalysis data, there is a small increase in mean September Eurasian SC. In contrast, there have been statistically significant decreases in both mean October and November SC (p<0.01). Trends in the two SCAs across the entire 180 years are not significant.
For the 1921–1965 period, none of the SC indices have significant trends, but it is worth noting that all three SCIs have positive trends. SAI_OCT and SAI_NOV have trends of opposite sign, suggesting that a more rapid snow advance in October necessarily contributes to a slower advance in November, as more area is already snow-covered at the beginning of the month and vice versa. However, as there is also a contemporaneous increase in SCI_11, other factors such as changes in regional climate are also likely involved.
Interestingly, Fig. 5 and Table 2 reveal that the trends in 1921–1965 and 1966–2015 are of opposite sign for all five SC indices. Thus, 20CRv3 demonstrates a decrease in mean SC in all 3 autumn months for 1966–2015, being statistically significant in October and November (p<0.10). In these 2 months, the trend magnitude is also much greater than in the preceding period, contributing to the significantly negative trends across the whole span of 20CRv3 (see Fig. 5a and Table 2). The trends in the SAIs exhibit a decrease in SAI_OCT (slower advance) and an increase in SAI_NOV (p<0.01) (faster advance) over 1966–2015, which corresponds to a greater contemporaneous decrease in SC in October than November (see Table 2) and thus an overall postponement of SCO in this time period. Figure 5c shows that the marked increase in SAI_NOV in 1966–2015 results from a switch from the lowest decadal values of the entire 20CRv3 time series in the 1970s to the highest in the 2000s. The negative trends in autumn months from 20CRv3 for 1966–2015 match those derived from satellite data for shorter periods within these 50 years (e.g. Brown and Derksen, 2013; Hori et al., 2017), while the switch in sign of the SC trends across the two recent periods was also noted in earlier studies (e.g. Callaghan et al., 2011).
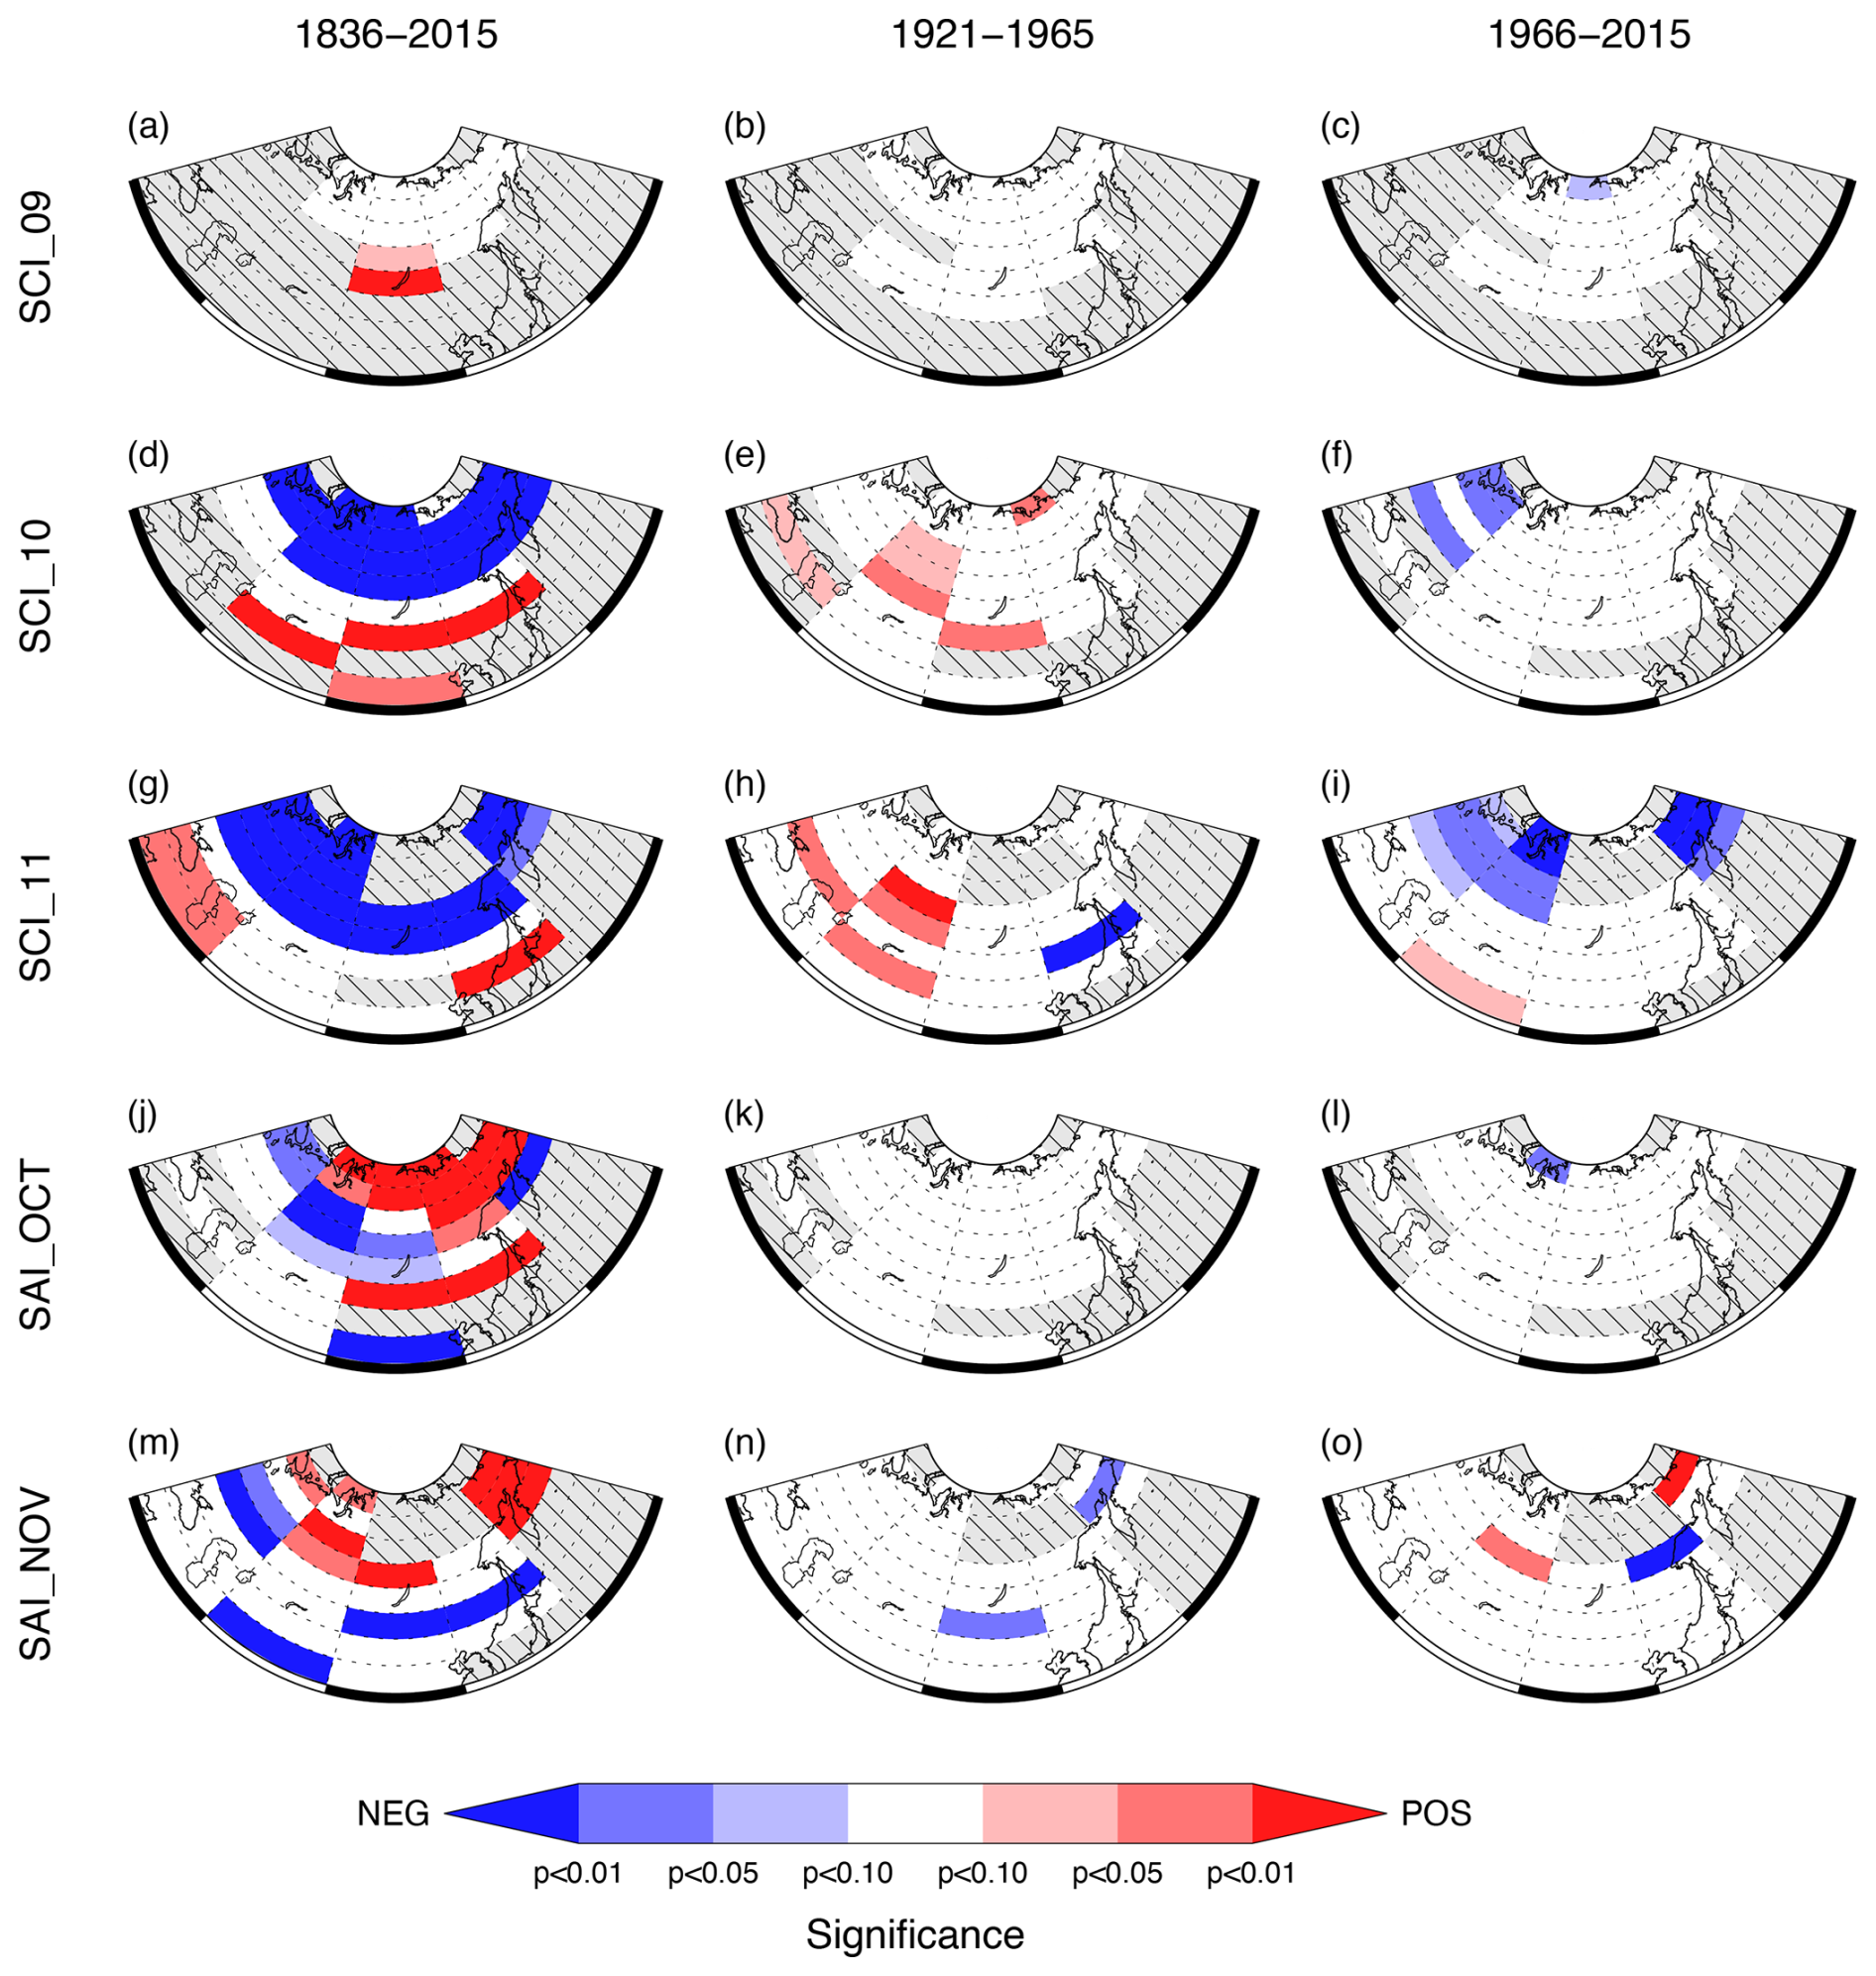
Figure 6Statistical significance of trends in SC indices: SCI_09 (a–c), SCI_10 (d–f), SCI_11 (g–i), SAI_OCT (j–l), and SAI_NOV (m–o) for 1836–2015 (first column), 1921–1965 (second column), and 1966–2015 (third column). Hatched subregions are where no value was calculated because data availability was less than 50 %.
Next, we examine the statistical significance of SCI trends in the subregions of Eurasia to evaluate whether there are any distinct spatial patterns of change contributing to the overall trends in Eurasian SC. These results are presented in Fig. 6. Unsurprisingly, given the very limited SC in September (Fig. 1a), there are relatively few subregions with enough data to provide 50 % of data for trends in SCI_09. The overall increase in SCI_09 for 1836–2015 appears driven by increases in the region around Lake Baikal (Fig. 6a), although this region does not demonstrate a significant trend in either of the two shorter periods. Figure 6 reveals that trends in SCI_10 and SCI_11 have broadly similar spatial patterns of significant trends across all three periods examined. For 1836–2015, there is a distinct latitudinal division, with statistically significant trends towards less SC in most of the northern subregions and more SC in some of the subregions in the south (Fig. 6d and g). In 1921–1965, all the subregions with significant trends in SCI_10 and SCI_11 (with one exception) have positive trends. For SCI_10, there is no clear spatial pattern to these areas, whereas, for SCI_11, they are all located west of 90° E (Fig. 6e and h). Comparison with Fig. 1a and b indicates that the majority of subregions with these trends are located beyond the limit of the monthly median SC for 2003–2022, suggesting that the spatial pattern of the trends during this period is primarily associated with a southern expansion of autumn SC in western Eurasia. For the most recent period (1966–2015), the subregions with statistically significant negative trends in SCI_10 and SCI_11 are more spatially coherent, being confined to northern Eurasia, similar to SCI_09, but also extending south to 50° N in the west of the region (Fig. 6f and i), a pattern that is broadly equivalent to the trends for 1966–2007 described by Bulygina et al. (2009).
Both SAIs have many subregions with significant trends across 1836–2015 (Fig. 6j and m). However, as there are similar numbers of subregions with positive and negative trends, there is no trend for Eurasia as a whole for either SC index (see Table 2). There is some spatial coherence to the distribution of subregions with a significant trend in one sign, but it is markedly less distinct than for SCI_10 and SCI_11. For SAI_OCT, the general pattern is for negative trends to the west and positive trends to the east, whereas, for SAI_NOV, it is predominantly negative (positive) trends in the south and west (north and east) of Eurasia.
During the two shorter periods examined, there are very few subregions with statistically significant trends in the monthly SAIs, and these are primarily located in northern Eurasia (Fig. 6k, l, n, and o). While there are several examples when a subregion has significant trends of SAI_OCT and SAI_NOV of opposite sign for the 1836–2015 period, comparable to Eurasia as a whole, a comparison of Fig. 6j and m indicates that this is not always the case, and indeed there can be significant trends of the same sign (e.g. 60–70° N, 150–180° E).
Table 3Proportion of running decades that the 20CRv3 SC indices have positive and negative correlations with the 20CRv3 AO and the proportion that are statistically significant based on a one-tailed test (p<0.10). The significance of the proportion of decades with a significant SC–AO correlation is determined based on a probability distribution function derived from 10 000 scrambled AO time series using a one-tailed test for each sign of correlation: *** is p<0.01, ** is p<0.05, and * is p<0.10. The period covered is 1836–1845 to 2005–2014.
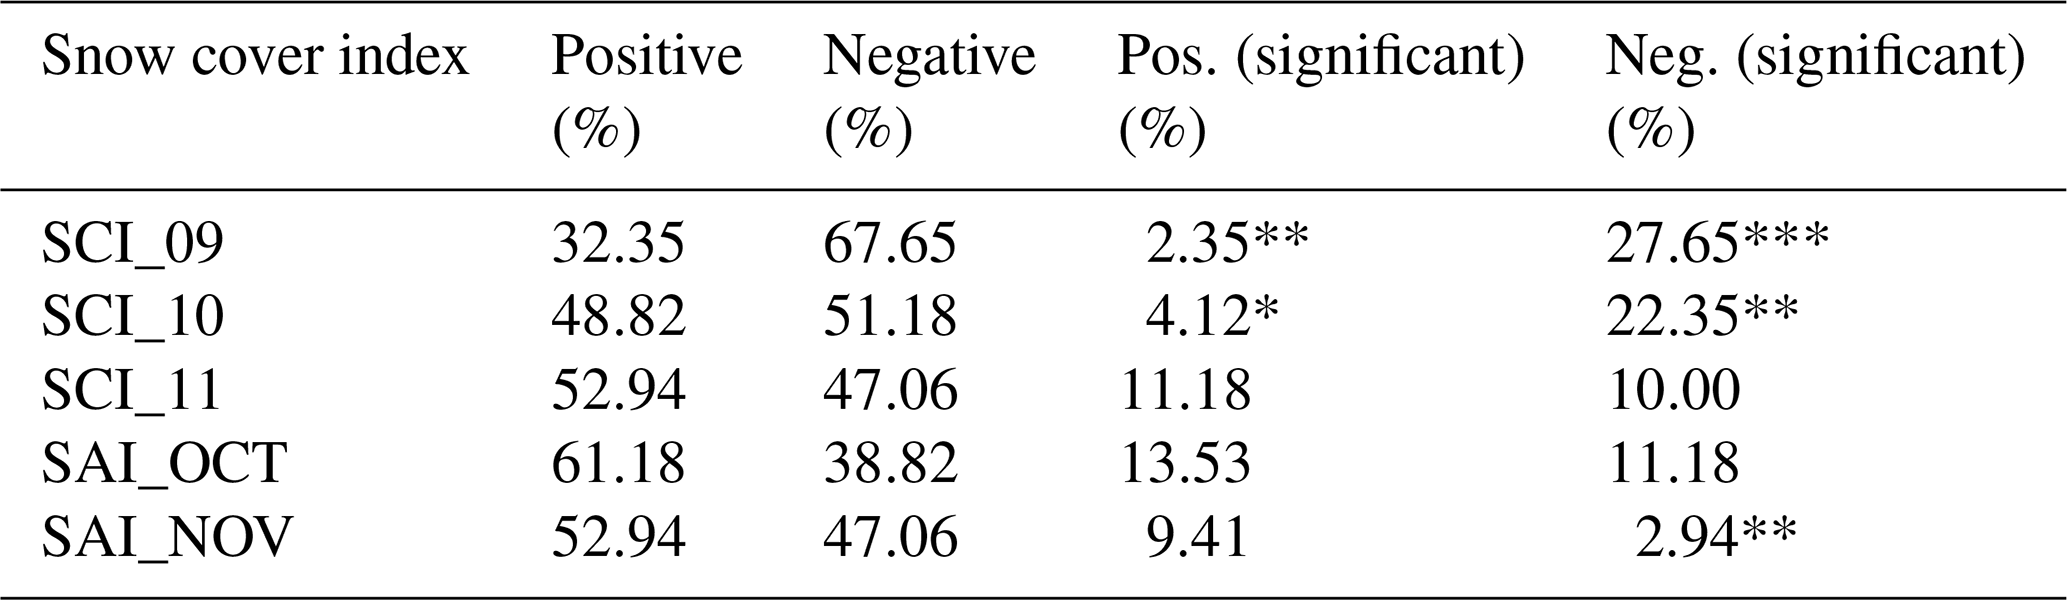
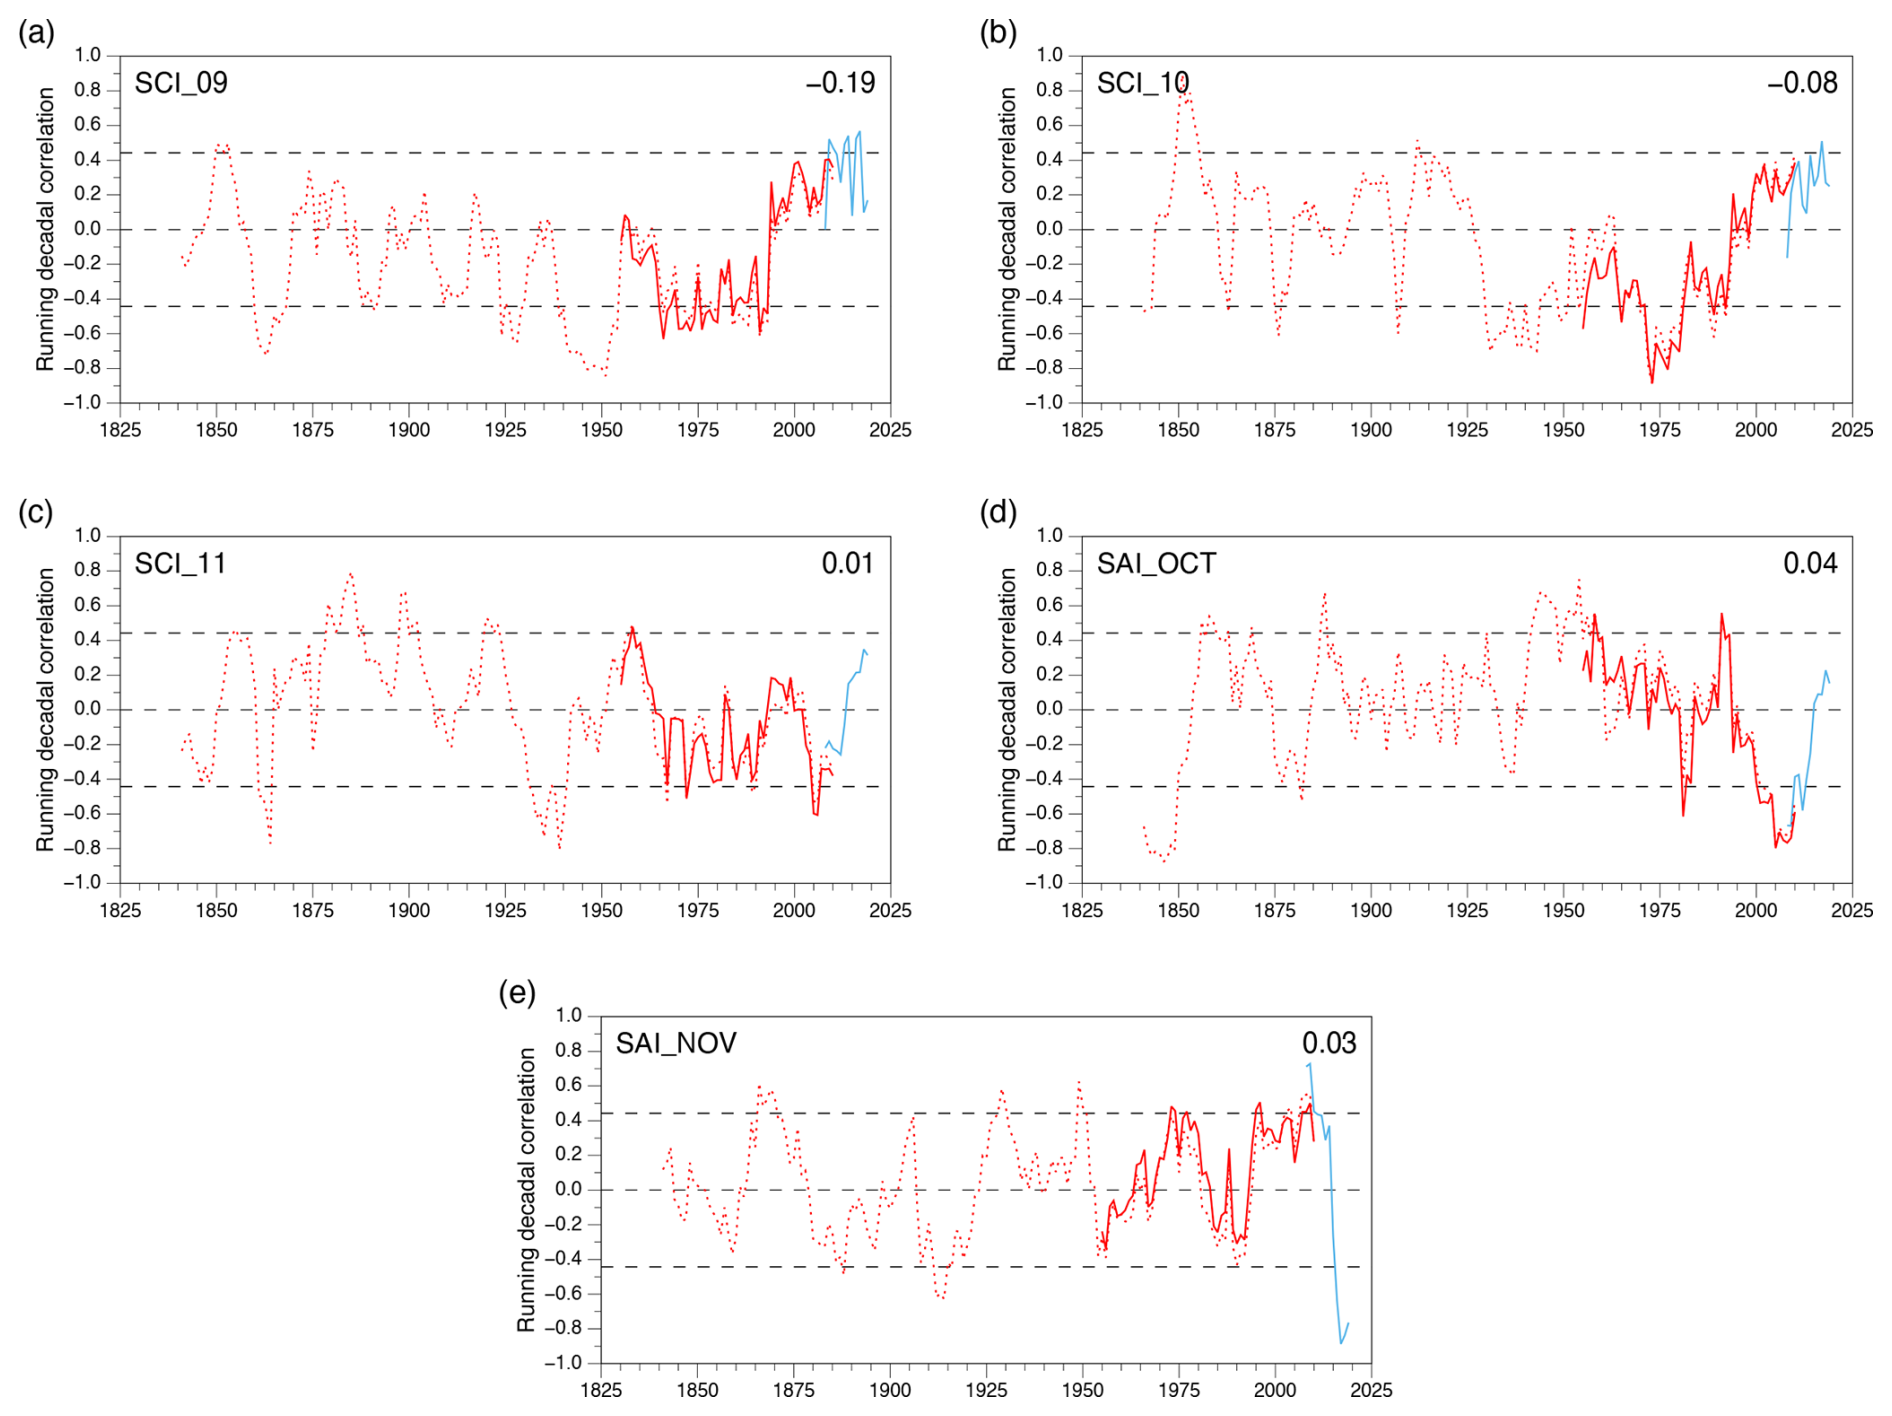
Figure 7Running decadal correlations between snow cover indices and winter AO: (a) SCI_09, (b) SCI_10, (c) SCI_11, (d) SAI_OCT, and (e) SAI_NOV. Snow cover indices from 20CRv3 and ERA5 (2003–2012 to 2012–2021) are shown as red and blue lines, respectively. Correlations with winter AO from the CPC and derived from 20CRV3 are shown as full and dashed lines, respectively. The dashed black horizontal lines indicate significance levels at p<0.10 based on a one-tailed test for each sign of correlation for each decade considered independently. The figure in the top-right corner is the mean correlation coefficient across all decades, which is significant at p<0.01 for SCI_09.
4.2 SC relationship with the AO
Time series of decadal correlation coefficients (r) between the 20CRV3 SC indices and the two AO indices – from 20CRV3 (1836–2015) and CPC (1950–2015) – are illustrated in Fig. 7. Equivalent data derived from ERA5 (2003 onwards) and the CPC AO are also shown in order to bring the data up to date. Figure 7 indicates little difference in the r values between the two AO indices for the period of overlap. Differences between the AO correlations using 20CRv3 and ERA5 SC indices are also generally small, with the largest deviation for SCI_10 during the 2003–2012 decade (see Fig. 7b). Table 3 summarises the proportion of decades with a positive or negative SC–AO relationship and those that are statistically significant (p<0.10). Equivalent data based on a 21-year period rather than a decade are provided in Fig. S4 and Table S2.
Figure 7a and b indicate broad similarities in the temporal variability in the SCI_09–AO and SCI_10–AO relationships. Moreover, both SC indices have statistically significant high (low) frequencies of decades with negative (positive) correlations with the winter AO (see Table 3). This is also true for 21-year period data except for the low frequency of periods with positive SCI_10–AO correlations (see Table S2), indicating it is a robust result, especially for SCI_09, which has no 21-year periods with a significant positive correlation to the AO. However, the mean decadal correlation is only statistically significant for SCI_09: while the value of −0.19 is significant at p<0.01, based on the Monte Carlo analysis, for the complete time series it appears a weak predictor. Both these SC indices also demonstrate a distinct trend from significantly negative to positive correlations (significant in ERA5) from the 1970s to recent decades, also seen in the 21-year data and in Peings et al. (2013; their Fig. 3b). Neither the frequency of significant positive nor negative decadal correlation values between SCI_11 and the AO are statistically significantly high or low, so they cannot be discriminated from having arisen through chance. The recent positive trend present in the earlier SCIs is also absent. Figure 7c indicates that the principal period of significant decadal correlations was in the 1930s, with very short periods at other times.
The running decadal correlations between the SAI_OCT and AO and SAI_NOV and AO are shown in Fig. 7d and e, respectively. In the former, there are significantly more positive than negative values (Table 3), suggesting that the period of strong positive (negative as defined here) correlations that occurred in the 1990s and 2000s, as described by Cohen and Jones (2011), was a rather exceptional event, as previously noted by Peings et al. (2013). Indeed, the frequency of decades with significant SCA_OCT–AO correlations of either sign are not significant. In addition to the recent period in the 2000s, Fig. 7d reveals a period of significant negative correlations centred in the 1840s, also present in the 21-year data (Fig. S4d). Finally, the ERA5 data reveal that the recent period of the statistically significant negative relationship between SAI_OCT and the AO has ended: the most recent decades have positive r values. Interestingly, Table 3 reveals that, while there are statistically significantly few decades with negative SAI_NOV–AO correlations (also true for the 21-year data), there are also relatively few decades with positive correlations. There are a number of short periods of significantly positive and negative correlations in the decadal data (Fig. 7e), which almost disappear in the 21-year data (see Fig. S4e and Table S2). However, the ERA5 data indicate a very rapid change from statistically significant positive values (0.73 for 2004–2013) to significant negative values (−0.89 for 2012–2021). As the ERA5 SAI_NOV–AO correlations immediately prior to 2003–2012 (not shown) are broadly similar to those from 20CRv3, and with the caveat that the ERA5 SC data are not temporally homogeneous, this implies a stronger and perhaps more variable relationship between SAI_NOV and winter AO in recent decades. Likewise, Yang and Fan (2021) observed a strengthened relationship between November Siberian SC and the winter Siberian High and related it to changes in troposphere–stratosphere coupling and associated changes in the AO.
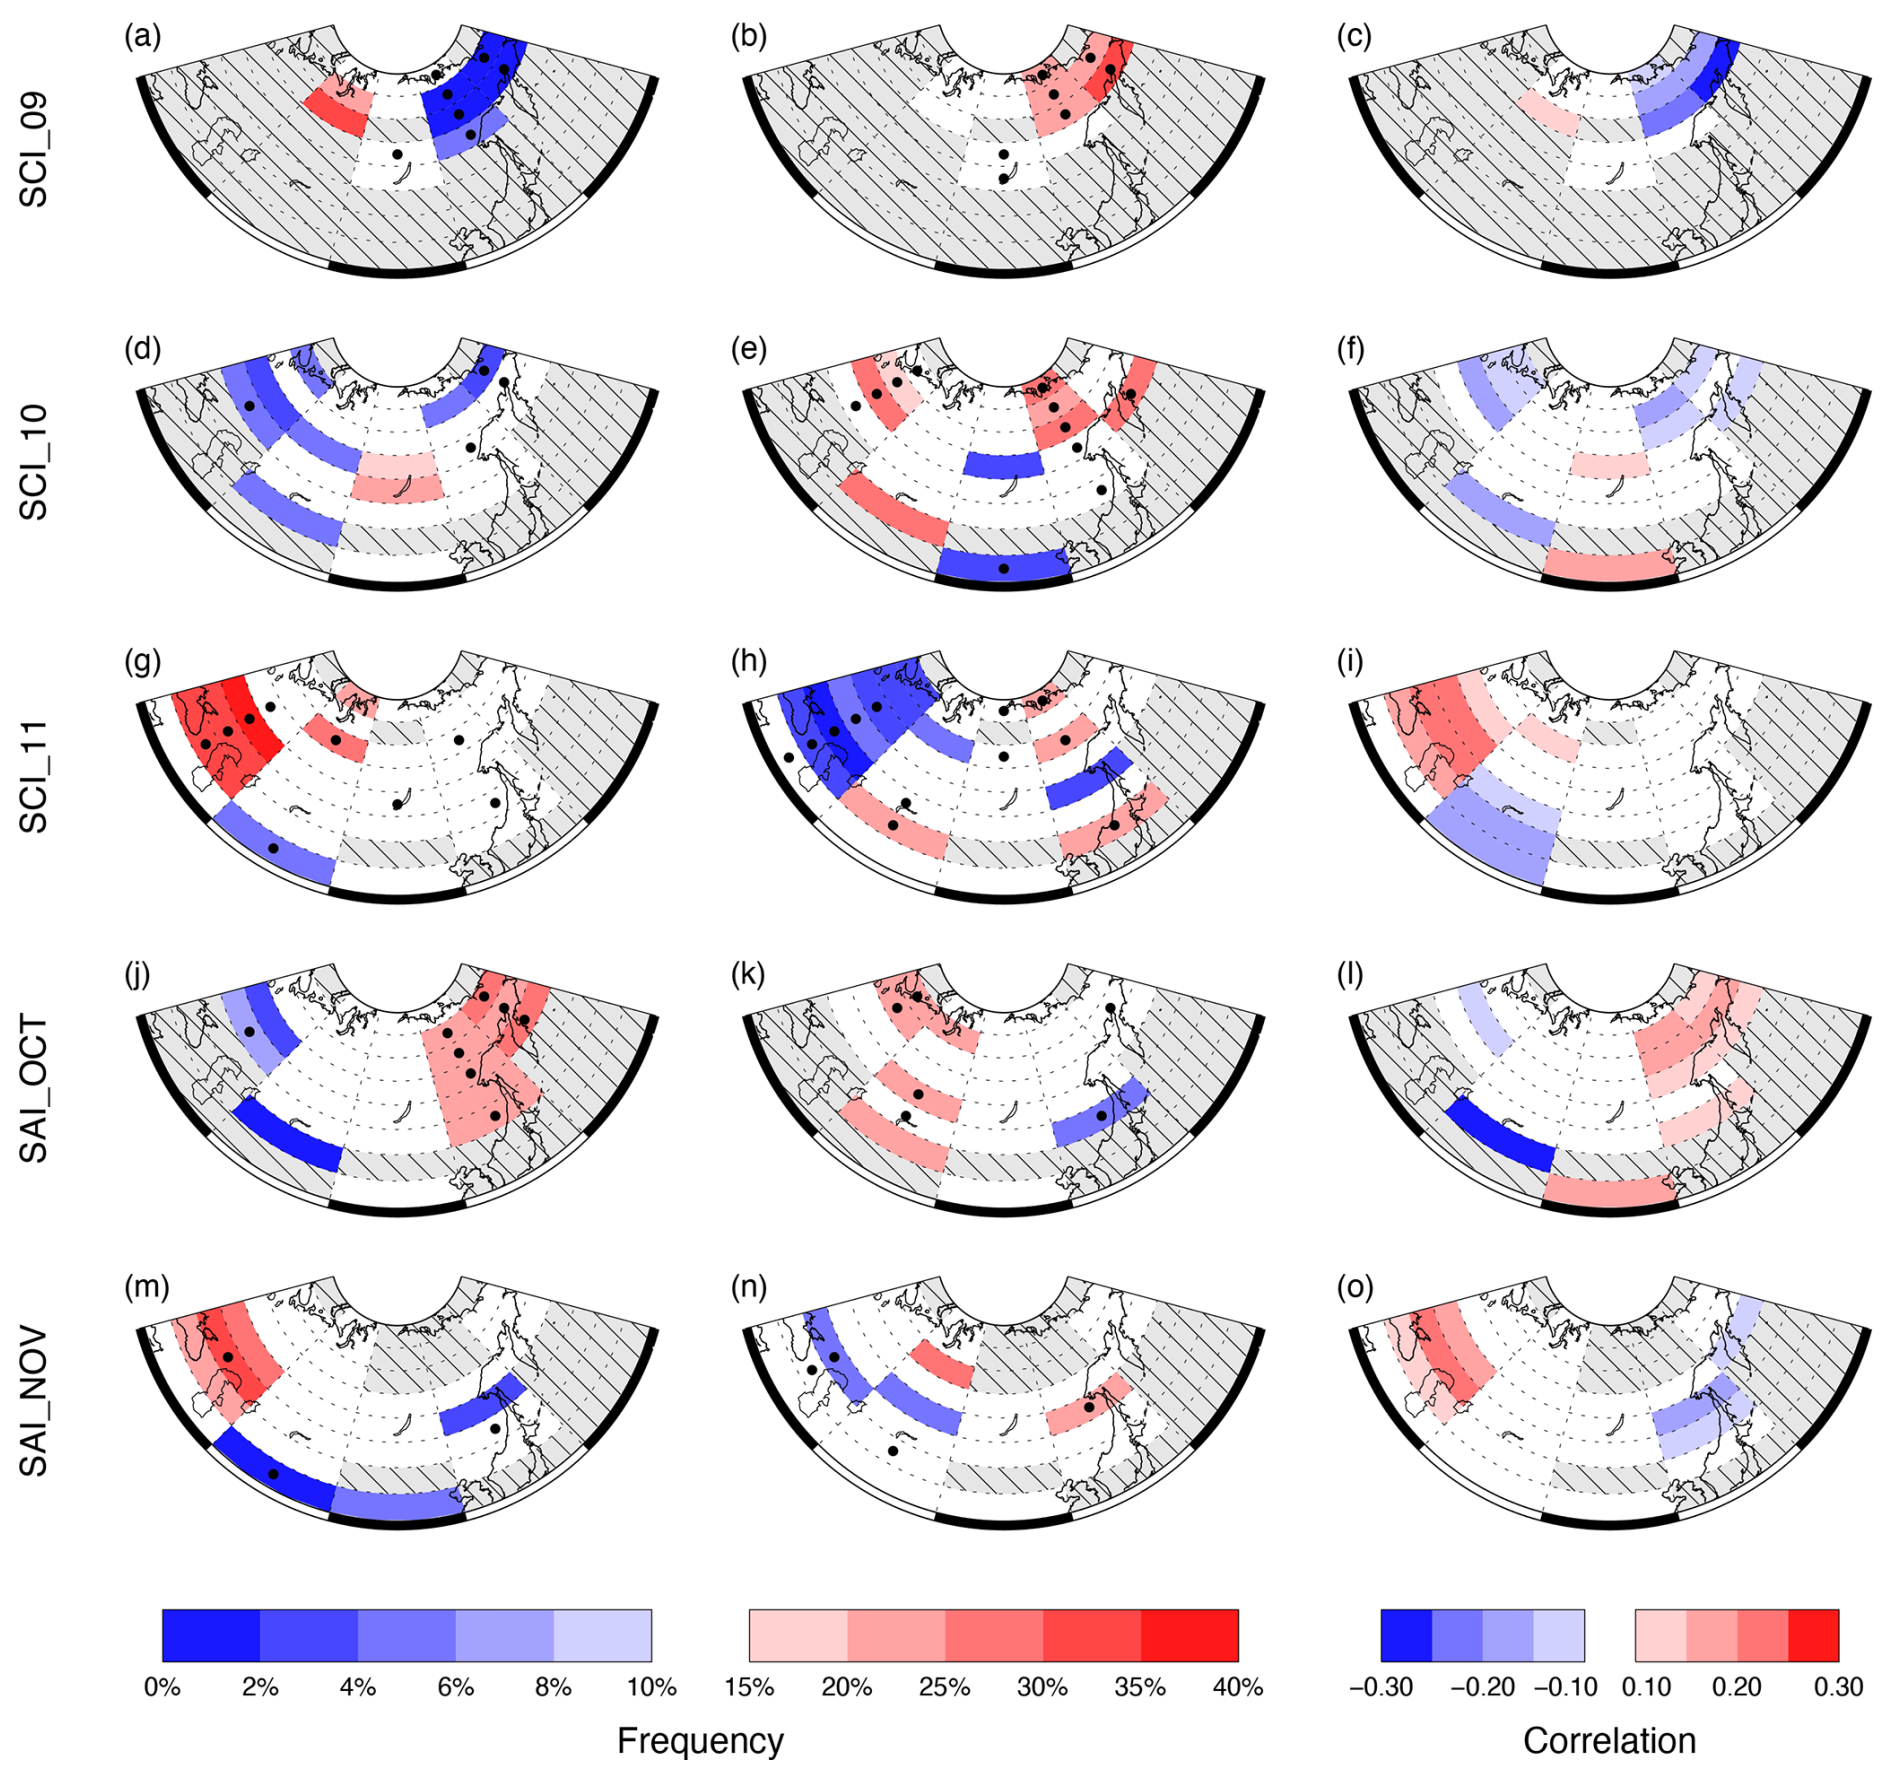
Figure 8The frequency of running decades with statistically significant correlations with the AO and the mean decadal correlation coefficient from the 20CRv3 data (1836–1845 to 2005–2014) for the five SC indices. Frequencies for positive SC–AO correlations are shown on the left, frequencies for negative SC–AO correlations are shown in the centre, and mean decadal correlation values are shown on the right. Only subregions with statistically significant frequencies/correlation coefficients are shaded (p<0.10): high/positive in red and low/negative in blue. Hatched subregions are where no value was calculated because data availability was less than 50 %. Subregions with a black dot in the first two columns are those where the frequency is statistically significant using a 21-year smoothing window.
Next, we investigate the spatial variability in the frequency of significant decadal relationships between the SC indices and the AO across Eurasia and compare them with equivalent data obtained using a 21-year period (Fig. 8). The SCI_09 data indicate that, within the northerly subregions, where there are sufficient decades with SCI_09 correlations to provide a reliable value (≥50 %), there is a pattern of statistically high (low) frequencies of significant positive decadal correlations with the AO in the west (east) of northern Eurasia (Fig. 8a). However, only the northeast has a similarly strong reversed relationship for negative correlations with the AO (Fig. 8b), and this robust regional SCI_09–AO relationship is also observed in the data from the 21-year period. This region also contains the subregion with the mean decadal SC–AO correlation of greatest magnitude across all the SC subregion combinations (−0.29 for 60–65° N, 150–180° E; see Fig. 8c). In contrast, the pattern of regions with statistically significant frequencies between the SCI_10 and AO show less spatial coherence. Subregions having significantly low frequencies of periods with significantly positive relationships with the AO tend to be located more in western Eurasia, but only one is also present in the 21-year data (Fig. 8d), while those with a significantly high fraction of significant negative relationships are situated in both the northwest and the northeast of Eurasia, the latter similar to SCI_09 (see Fig. 8b and e) and all of which are seen in the 21-year data.
There is a statistically high (low) frequency of significant decadal relationships between SCI_11 and the positive (negative) winter AO across much of the 30–60° E longitudinal band of Eurasia (cf. Fig. 8g and h), and, south of 60° N ,they are also present in the 21-year data and have a relatively high mean decadal correlation coefficient (Fig. 8i). There are no subregions with significantly high or low frequencies of relationships with a positive AO east of 90° E, while there are some between 120–150° E for negative AO, with those subregions having a significantly high frequency also doing so based on the 21-year data.
For the frequency of significant SAI_OCT relationships with positive AO, there is a clear longitudinal dipole, with low (high) values in the west (east) of Eurasia (Fig. 8j), with almost all the latter also present in the 21-year data and having significant mean decadal correlation coefficients (Fig. 8l). However, while the broad spatial pattern is reversed for relationships with negative AO (Fig. 8k), the subregions with statistically significant high or low frequencies are less spatially coherent and far fewer in number in the east of the region. Unsurprisingly, the subregions with significantly high or low frequencies of significant decadal SAI_NOV–AO relationships are predominantly located in the southern half of Eurasia, as most of the region is already snow-covered prior to this month (Fig. 1b). The region of statistically high frequencies of positive relationships with the AO in southeastern Eurasia exactly matches that for SCI_11 (see Fig. 8g and m), but the equivalent region of statistically low frequencies for negative AO is not present (see Fig. 8h and n). Elsewhere, the distribution of subregions with extreme frequencies is sporadic, with few present in the 21-year data.
Based on Fig. 8, there appear to be two especially robust SC–AO relationships within the subregions, contingent on their (i) having statistically high and low frequencies of significant decades with opposite signs of the AO, (ii) having similar relationships based on the 21-year data, and (iii) having at least three adjacent subregions with the properties outlined in (i) and (ii). These are, firstly, for SCI_09, a region in northeastern Eurasia (60–70° N, 120–180° E) (see Fig. 8a and b), hereinafter SCI_09 NE, and, secondly, for SCI_11, a region in southwestern Eurasia (40–55° N, 30–60° E) (hereinafter SCI_11 SW) (see Fig. 8g and h). We note that the latter region is similar to the western correlation centre of the dipole described by Gastineau et al. (2017) and Han and Sun (2018), and it will be considered in this context in the Discussion (Sect. 5). The following section, Sect. 4.3, will focus on SCI_09 NE, as a September SC–AO linkage has not been described in detail previously.
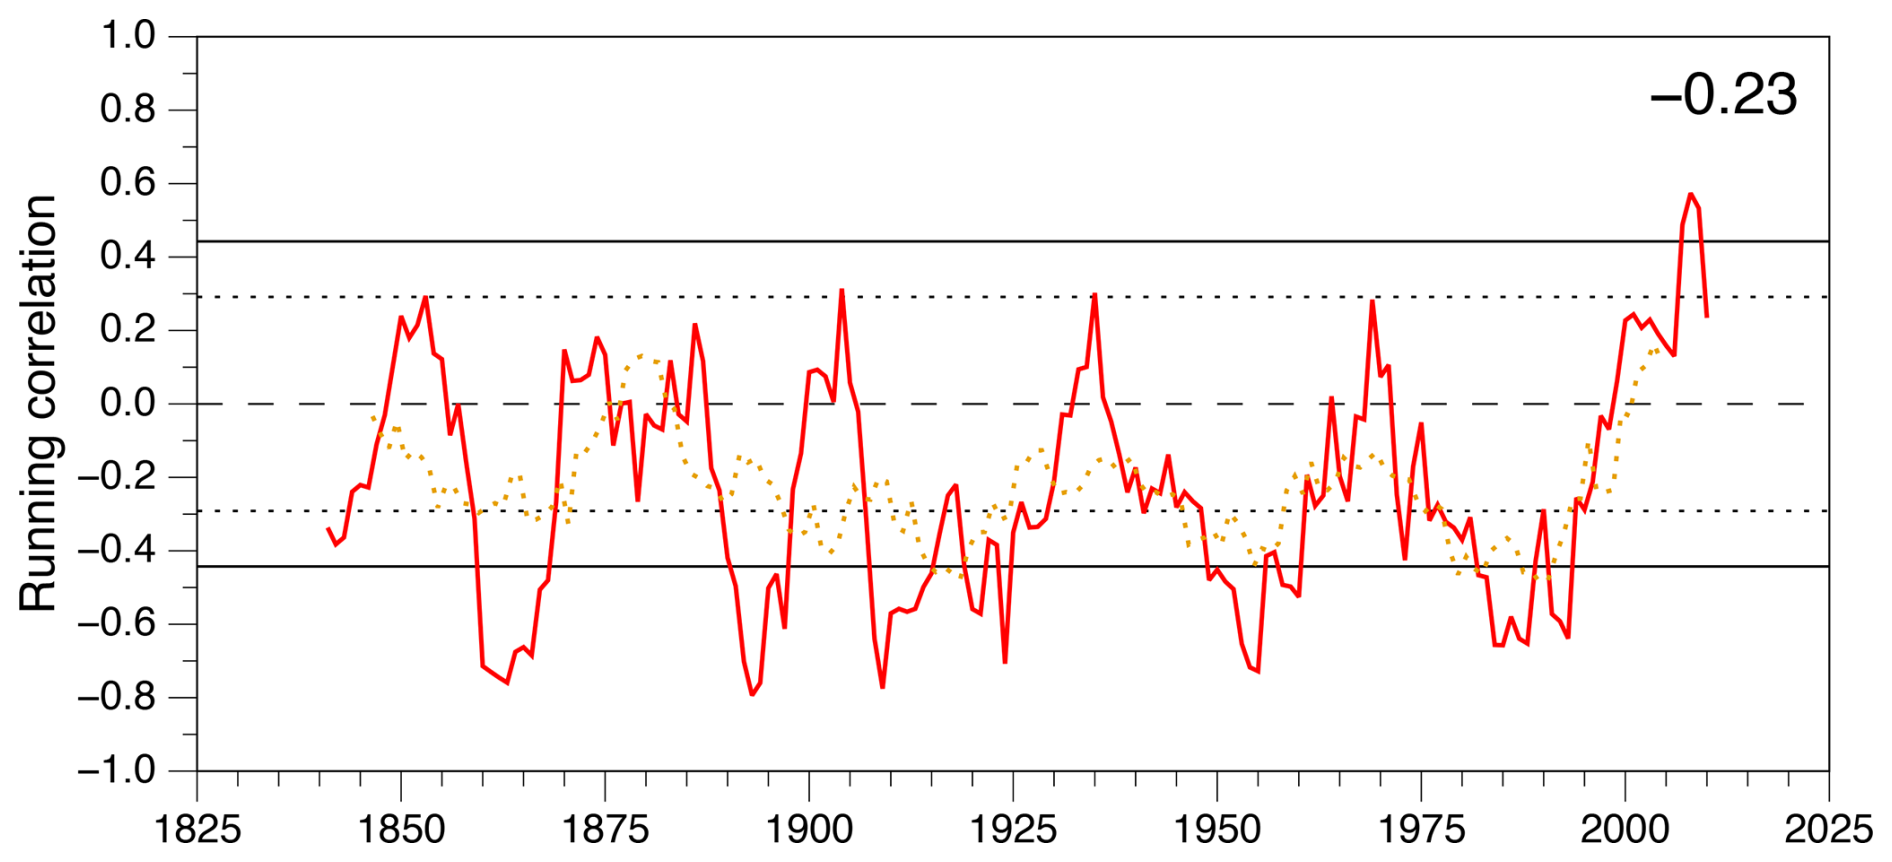
Figure 9Running correlations between SCI_09 NE and the winter AO derived from 20CRv3. Running decadal correlations (full red line) and 21-year periods (dotted brown line) are shown with similar black lines indicating the appropriate p<0.10 significance level. The figure in the top-right corner is the mean correlation coefficient across all decades, which is significant at p<0.01.
4.3 The SCI_09 NE–AO relationship
The overall mean decadal correlation between SCI_09 NE and the winter AO over the 179-year period of the 20CRv3 data (1836–2014) is −0.23 (p<0.01), with ∼75 % of decades having a negative correlation (93 % for 21-year periods). The proportion of statistically high and low frequencies of decades (21-year periods) with significant relationships with the positive and negative AO are 1.8 % and 27.6 %, respectively (0.0 % and 32.7 %, respectively). Figure 9 reveals several periods when the running decadal correlations were statistically negative and one short period with significantly positive SC–AO correlations in the early 2000s. Naturally, the statistically significantly negative periods in the 21-year data are generally longer, as the correlations vary at a lower frequency. Most coincide with those in the decadal data, particularly in the 1910s, the 1950s, and the 1980–1990s. There are no periods of significantly positive SC–AO correlations, possibly simply because the 21-year data end too soon.
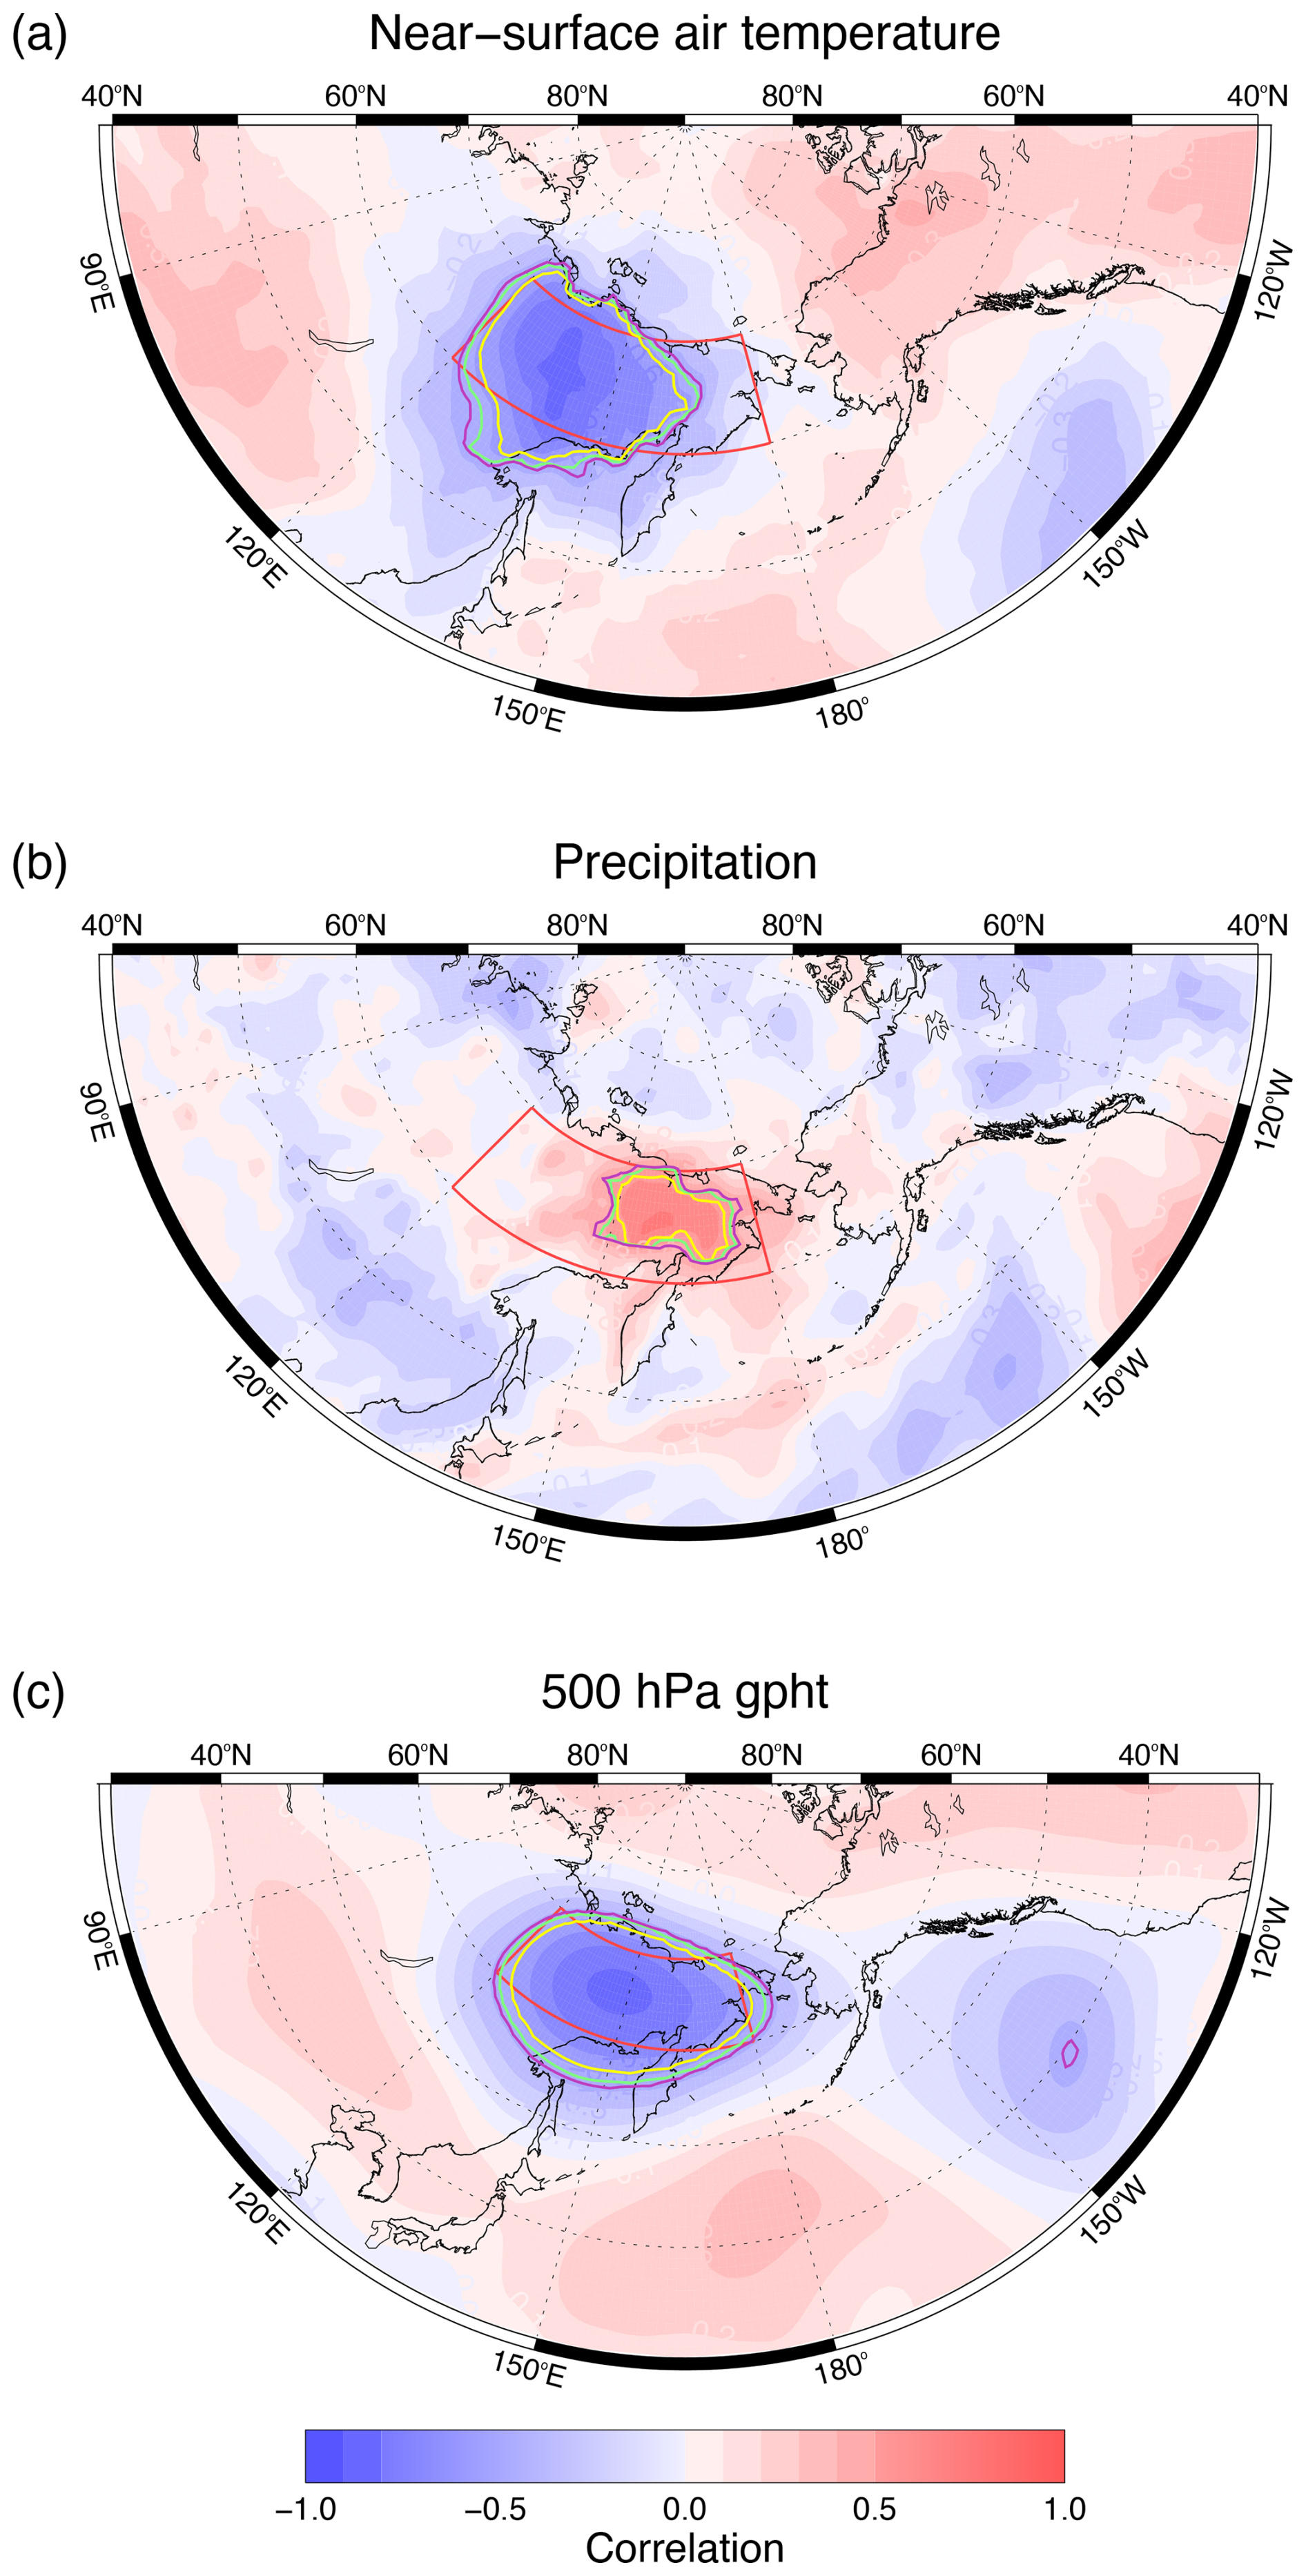
Figure 10The correlation between SCI_09 NE and (a) September SAT, (b) September precipitation, and (c) September 500 hPa gpht. Data for 1966–2015 derived from 20CRv3. Statistical significance values are p<0.10 (purple), p<0.05 (green), and p<0.01 (yellow). The SCI_09 NE region is delineated by the red box.
Figure 10a and b show the spatial relationship between SCI_09 NE and SAT and precipitation, respectively. They indicate that SAT is significantly related to September SC across much of the SCI_09 NE region but especially strongly in the western half. In contrast, precipitation is significantly related to SC in a smaller area in the eastern half of the region, which essentially encompasses the lower elevation areas. Thus, both SAT and precipitation have a hand in controlling SCI_09 NE, matching the conclusions of Ye and Wu (2017) for Eurasian September SC as a whole. However, Fig. 1a indicates that there is typically relatively little SC in the SCI_09 NE region by the end of September, being principally confined to high-elevation areas such as the Verkhoyansk and Chersky mountains. In the 20CRv3 data, the mean SCI_09 NE value is equivalent to an SC of only 11 % of the region, with the range from 1 %–34 % for the 1966–2015 period when the reanalysis data are consistently accurate. Furthermore, despite Arctic September sea-ice loss being most pronounced in the East Siberian and Chukchi seas (e.g. Ding et al., 2017), to the north and east of the SCI_09 NE region, respectively, thus providing more potential for increased moisture flux, there is no marked contemporaneous trend in SC in this region (see Fig. 6c). Therefore, it is likely that it is principally the climatic conditions driving SC variability in this region that subsequently have an impact on the winter AO, rather than changes caused by the SC itself.
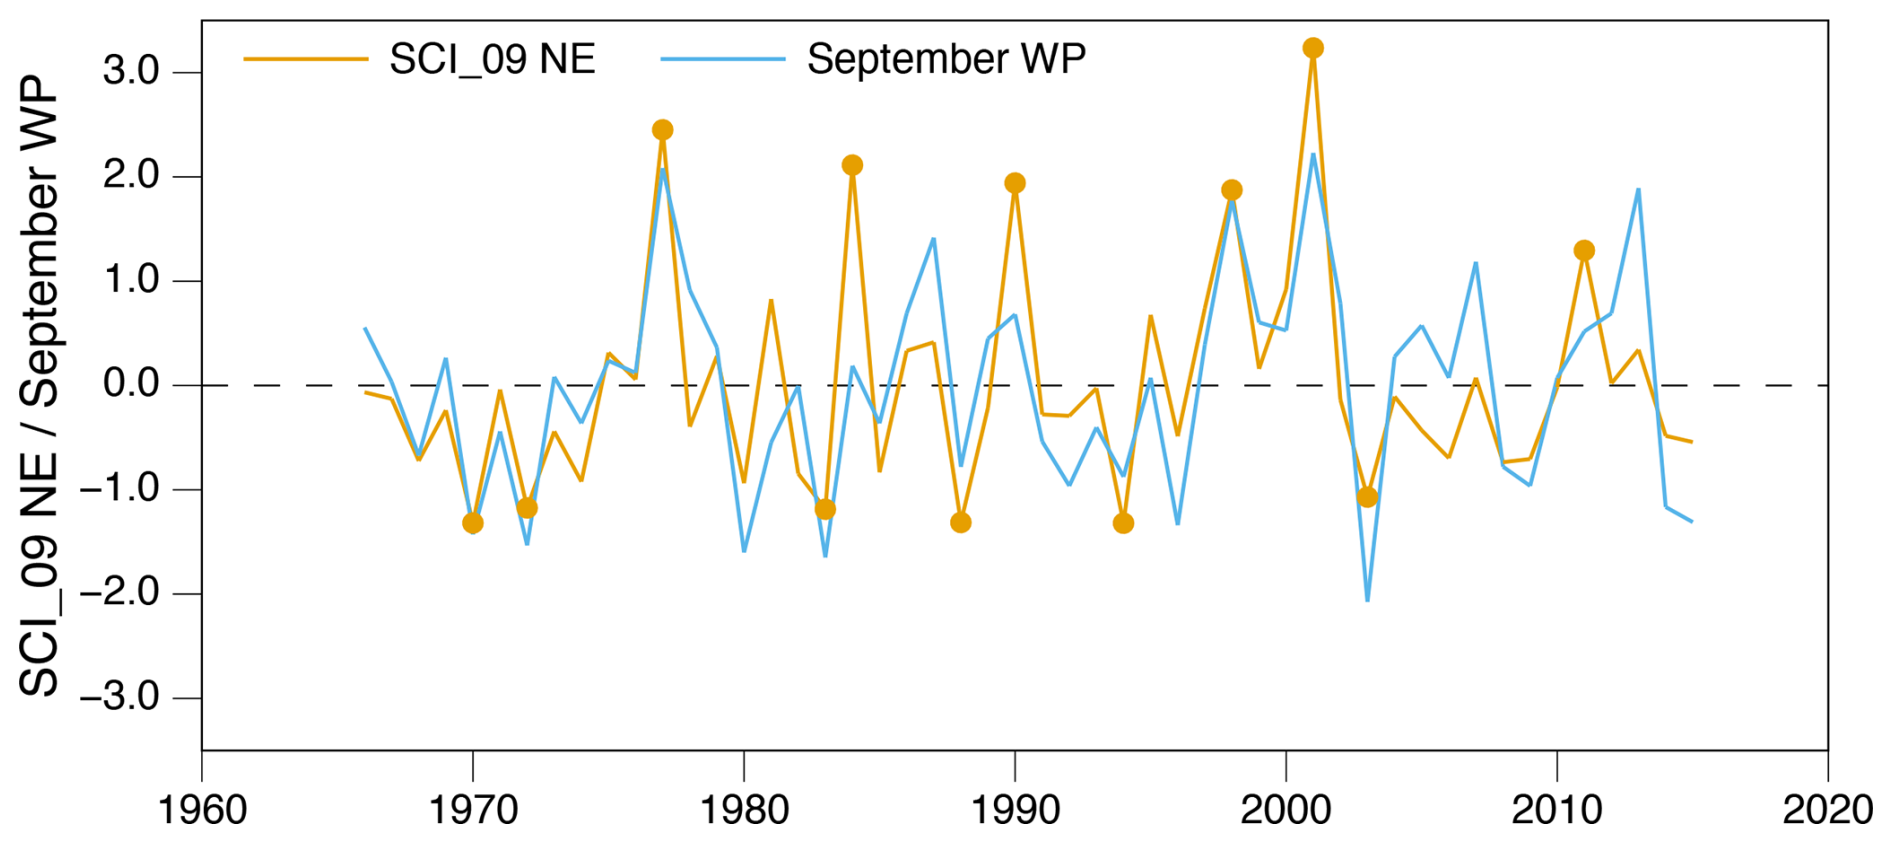
Figure 11Normalised SCI_09 NE and September WP teleconnection pattern, 1966–2015 (r=0.73, p<0.01). Years marked with a dot are those higher than 1.0 or lower than −1.0 and are used to produce Fig. S5.
The September 500 hPa gpht correlation with SCI_09 NE (Fig. 10c) reveals a distinct spatial pattern: regions with significant negative correlations located over the entire SCI_09 NE region and also off the west coast of the United States, while to the south is situated a broad region of positive correlations, encompassing parts of southeastern Asia and the western subtropical North Pacific. This spatial pattern is very similar to that of the positive phase of the western Pacific (WP) teleconnection pattern (e.g. Dai and Tan, 2019), which is when there is a cyclonic anomaly over eastern Siberia. The WP is generally associated with colder and wetter conditions in this region during winter (e.g. Linkin and Nigam, 2008; Marshall, 2021). Importantly, the positive WP pattern interferes constructively with the climatological wavenumber-1, which enhances upward-propagating wave activity and reduces the strength of the polar vortex (Nishii et al., 2010; Dai and Tan, 2019) and thus provides a potential mechanism linking positive SCI_09 NE to a negative winter AO. Figure 11 displays the very close relationship between SAI_09 NE and the September WP (r=0.73, p<0.01).
Following previous work by Wegmann et al. (2020, 2021), we assess whether there is any evidence of a stratospheric signal associated with the statistical relationship between SCI_09 NE and the winter AO. Figure S5 shows monthly zonal-mean cross-sections of the difference in temperature and zonal wind speed between high (>1) and low () years of the normalised SCI_09 NE index (cf. Fig. 11) from September to February. Figure S5a shows cooling in the lower troposphere in the SCI_09 NE region and warming over the Arctic Ocean to the north during September. There is also a contemporaneous change in the zonal wind field, with significantly faster (slower) speeds from 850 hPa into the lower stratosphere between ∼45–60° N (∼65–85° N), the former indicative of a ∼10° poleward shift of the polar jet relative to climatology (Fig. S5b). Subsequent months demonstrate marked variability in the differences in both atmospheric temperature and zonal wind speed between high and low SCI_09 NE but with few regions of statistically significant differences in the polar stratosphere, suggesting there is no clear residual signal of SCI_09 NE variability (Fig. S5c–l). Furthermore, while the pattern of differences in the winter months is broadly similar to those demonstrated by Wegmann et al. (2020, 2021) with regard to the November dipole of Han and Sun (2018) (a weaker and warmer polar vortex), any significant differences at high latitudes are predominantly restricted to the troposphere. Therefore, although the close relationship between SCI_09 NE with the WP teleconnection provides a mechanism through which the SC signal might influence the winter AO, this is not immediately apparent in the zonal mean data, likely because the many other factors that are known to impact the AO mean the signal-to-noise ratio is very small. A climate model experiment in which only the magnitude of SCI_09 NE is changed is required to examine the mechanism in isolation.
As previously described, there have been several other autumn Eurasian SC indices developed from other SC datasets that have been found to have an association with the following winter AO. Here we focus on two: firstly, the SAI of Cohen and Jones (2011) (hereinafter SAI_OCT_CJ) and, secondly, the Nov_SNOWI index developed by Han and Sun (2018). We recalculate them using the 20CRv3 data, and this allows us to (i) see how the strength of their relationship with the AO in 20CRv3 compares with other datasets, (ii) extend the available time series of SC–AO relationships further back than previously possible, and (iii) examine the strength and stationarity of their SC–AO relationships compared to the two “robust” SC–AO relationships described in the present paper.
The SAI_OCT_CJ was originally computed from CDR data for 1973–2010 and is equivalent to SAI_OCT but calculated over 0–180° E and 20–65° N and multiplied by −1. Cohen and Jones (2011) limited their index to the lower latitudes of Eurasia, as these had the strongest correlations with the winter AO. Subsequently, Peings et al. (2013) produced a near-identical index based on earlier 20CR data and showed that the SC–AO relationship was not stationary, the strong relationship with the AO in the period examined by Cohen and Jones (2011) being the exception rather than the rule. Nov_SNOWI was also derived from the CDR SC dataset and is a dipole structure comprising November SC anomalies of opposite sign over Mongolia (40–56° N, 80–130° E) and eastern Europe (48–58° N, 30–60° E) (Han and Sun, 2018). Wegmann et al. (2020) demonstrated that Nov_SNOWI has a consistent negative relationship with the winter AO back to 1900 in 20CRv2c based on 21-year smoothing, but this is not the case with the ECMWF ERA20C reanalysis, which has some periods with positive SC–AO correlations. Running SC–AO correlations for SAI_OCT_CJ and Nov_SNOWI derived from 20CRv3 are shown in Fig. 12, while Table 4 summarises the proportion of decades with a positive or negative SC–AO relationship and those that are statistically significant (p<0.10) for these and the two robust indices from the current analysis. Equivalent data based on a 21-year period – the smoothing factor used by Peings et al. (2013) and Wegmann et al. (2020) – are provided in Table S3.
Table 4Proportion of running decades that various SC indices derived from 20CRv3 have positive and negative correlations with the 20CRv3 AO and the proportion that are statistically significant based on a one-tailed test (p<0.10). SCI_09 NE and SCI_11 SW developed in this study, the SAI_OCR_CJ index of Cohen and Jones (2011), and Nov_SNOWI defined in Han and Sun (2018). The significance of the proportion of decades with a significant SC–AO correlation is determined based on a probability distribution function derived from 10 000 scrambled AO time series using a one-tailed test for each sign of correlation: *** is p<0.01, ** is p<0.05, and * is p<0.10. The period covered is 1836–1845 to 2006–2015.
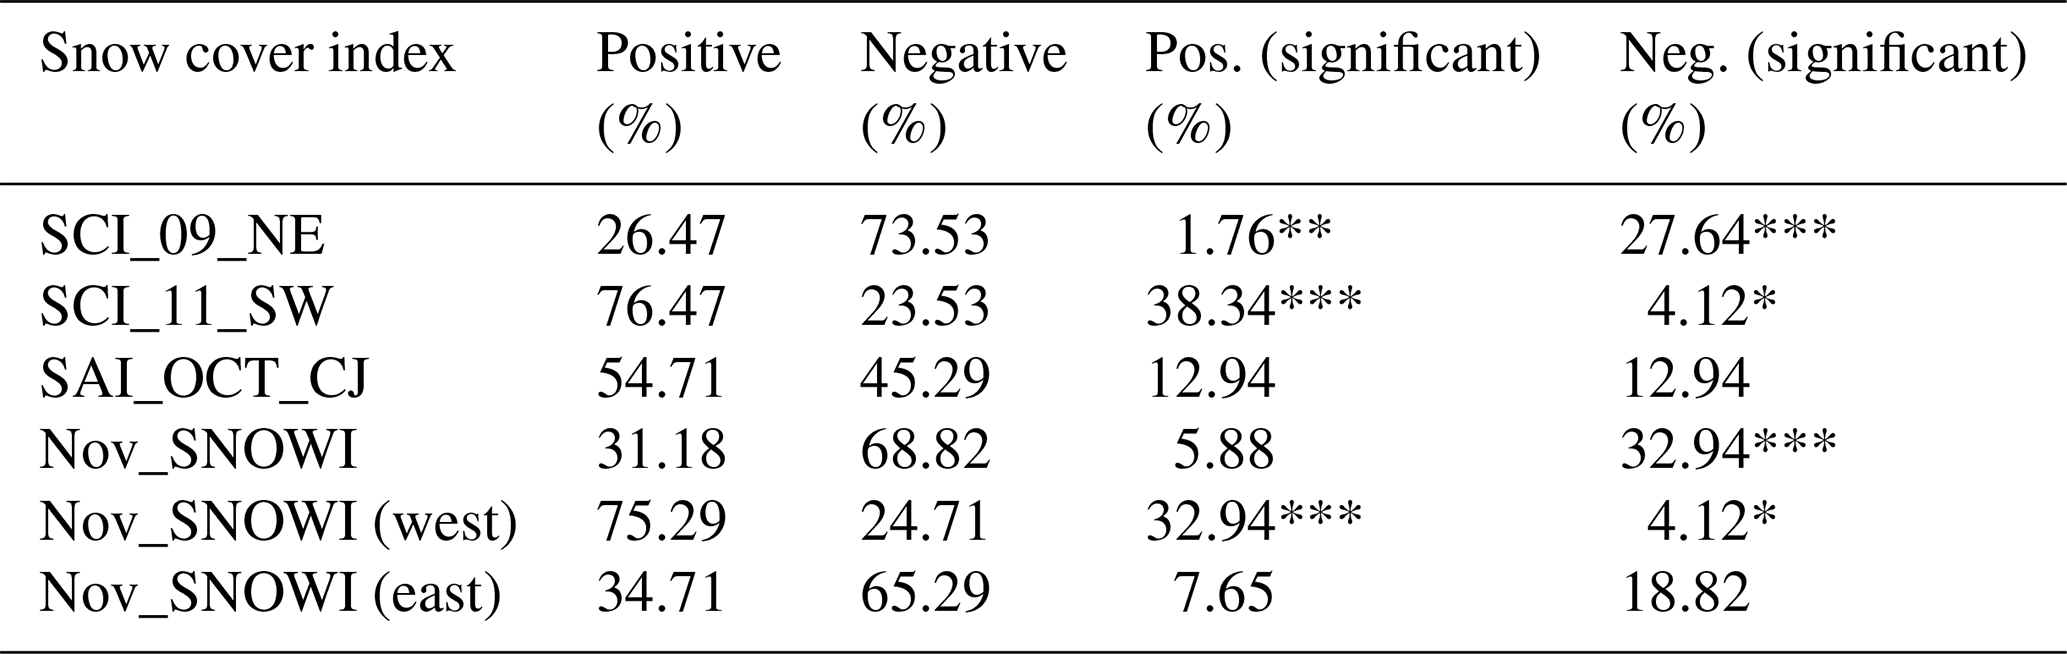
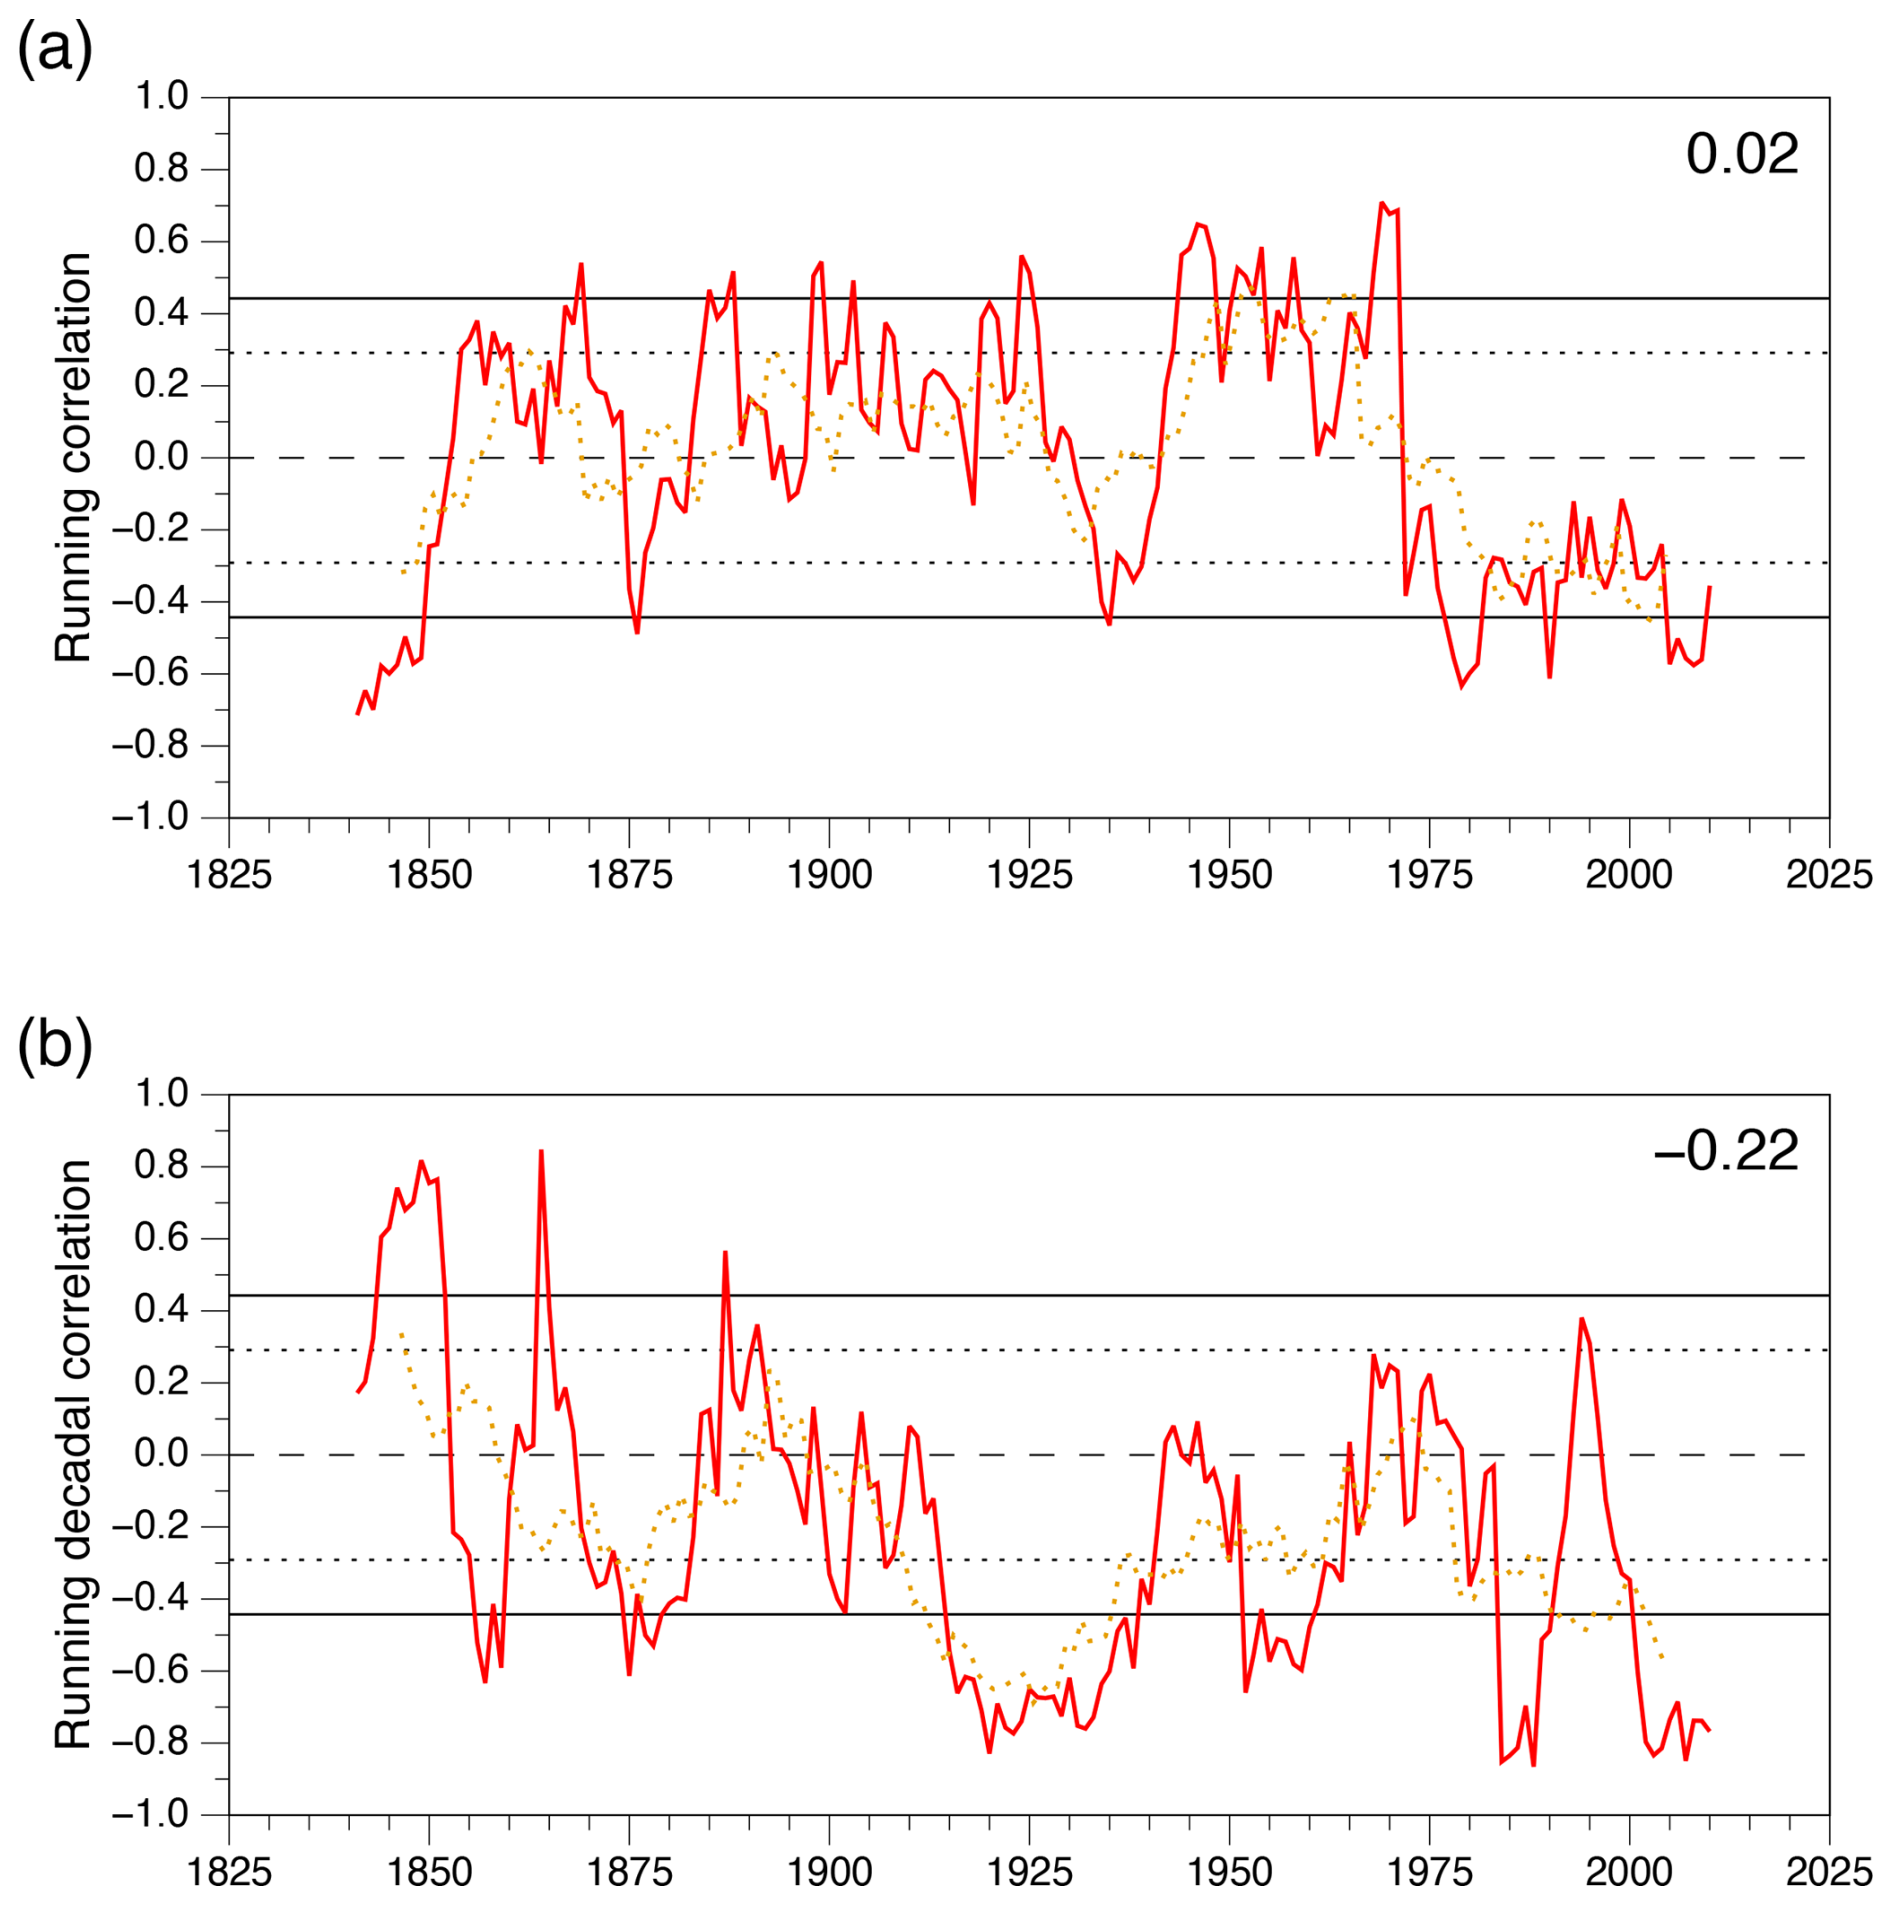
Figure 12Running correlations between (a) the SAI_OCT_CJ index of Cohen and Jones (2011) and (b) the November dipole index of Han and Sun (2018) with the winter AO, all derived from 20CRv3. Running decadal correlations (full red line) and 21-year periods (dotted brown line) are shown with similar black lines indicating the appropriate p<0.10 significance level. The figure in the top-right corner is the mean correlation coefficient across all decades, which is significant at p<0.01 for the November dipole index.
Figure 12a and the two tables confirm the findings of Peings et al. (2013) regarding the lack of stationarity in the SAI_OCT_CJ–AO relationship, similar to SAI_OCT in this study (Fig. 7d). The latter indicate no markedly favoured sign of the SC–AO relationship and hence no significantly high or low frequencies for either sign. However, interestingly, Fig. 12a does demonstrate that the period of recent significant (negative as defined here) correlations, as described by Cohen and Jones (2011), was immediately preceded by a period of similar length with significant correlations of the other sign. Seen for the first time is another period of statistically significant negative SC–AO correlations before 1850, with the caveat regarding the accuracy of the 20CRv3 SC at the beginning of the dataset.
The relationship between the Nov_SNOWI index and the AO is displayed in Fig. 12b, and the 21-year plot is broadly similar to Fig. 7b from Wegmann et al. (2020). In detail, the 20CRv3 data lie somewhere between those derived from 20CRv2c and ERA20C: (i) there are periods of significantly negative correlations in both the 1920s and the 1990s onwards, while ERA20C only has the latter, and (ii) there is a period of positive correlations at ∼1975, while ERA20C has an additional earlier period and 20CRv2c has neither. In the 19th century, earlier than Wegmann et al. (2020) examined, there is an additional period of significant negative correlations at ∼1875 and also a period of significant positive SC–AO relationship at the beginning of the 20CRv3 dataset at ∼1850. There are no decades with a significant positive Nov_SNOWI index after 1900, confirming the robustness of this SC–AO relationship after this time. Wegmann et al. (2021) noted that the western domain of Nov_SNOWI carries most of the signal, with the relationship with the AO in an ensemble of atmosphere-only models, and the same is the case for 20CRv3 (see Fig. 8e and f). In the decadal data, the eastern domain has no significantly high or low frequencies (Table 4) and only a significantly high frequency of 21-year correlations with negative AO (Table S3). In contrast, the western domain has significantly high (low) frequencies of both decades and 21-year periods of positive (negative) correlations with the AO. Overall, there is very little difference in the SC–AO frequencies of the Nov_SNOWI dipole and only its western domain, although the low frequency of decades with a significant negative relationship with the AO is statistically significant in the latter, while the equivalent value for a significant positive SC–AO relationship in the former is not (Table 4).
Unsurprisingly, given the above and the relatively similar regions of the western domain of Nov_SNOWI and SCI_11_SW, the two tables indicate comparable levels of SC–AO relationship robustness between these three indices. Table 4 reveals that SCI_11_SW has a higher proportion of decades with significant positive SC–AO correlations than the others: 38 % compared to 33 %. However, in the 21-year data, the Nov_SNOWI dipole has a slightly higher proportion of periods with significant negative correlations than either the western domain or SCI_11_SW (cf. Table S3). While the high frequencies of SC–AO periods in the November SC indices are greater than for SCI_09_NE, the latter generally has a smaller proportion of low frequencies; hence the statistical significance of the high (low) frequencies is at least as strong or stronger for the November SC indices (SCI_09_NE). Overall, SCI_09_NE, SCI_11_SW, and the Nov_SNOWI dipole index of Han and Sun (2018) can be considered similarly robust across the 180 years of 20CRv3: indeed, the mean decadal correlation coefficients for these three SC indices are −0.23, 0.25, and −0.22, respectively. Thus, while these values all indicate a significant relationship with the following winter AO (at p<0.01, based on the Monte Carlo analysis), their relatively small magnitude demonstrates the ephemeral nature of the relationships.
In this study, we have investigated spatial and temporal changes in autumn Eurasian SC and its relationship with the following winter AO. We utilised the 20CRv3 reanalysis, which allowed our analyses to go back as far as 1836. Comparable to earlier versions of 20CR (Wegmann et al., 2017), there is a marked overestimation of SD in 20CRv3, so we calibrated SC extent against ERA5 data, which, in turn, were validated against SCO data derived from SD observations. An offset of −9.0 cm provided the most similar 20CRv3 SC values to ERA5. Comparison of 20CRv3 SCO against observations allowed a qualitative analysis of the temporal homogeneity and likely accuracy of the reanalysis SC data. Lower and more consistent SCO bias distributions from 1921 onwards suggest that the reanalysis is more accurate in this period than prior to this date. However, the most accurate and homogeneous data are post-1966, which aligns with the beginning of the period of homogeneous SD measurements at the stations (Bulygina et al., 2011).
We examined five SC indices – three monthly SC extent indices (SCIs) and two monthly SC advance indices (SAIs) – across Eurasia as a whole and also as separate subregions of 5° latitude by 30° longitude. We considered trends in these SC indices across three time periods: the full 20CRv3 time period (1836–2015) and two shorter periods with likely improved accuracies of the 20CRv3 SC data (1921–1965 and 1966–2015). Across the full 180 years there is a small – but nevertheless statistically significant (p<0.10) – increase in mean September Eurasian SC. In contrast, there have been significant decreases in both mean October and mean November SC (p<0.01). Trends in the two SCA indices across the entire 180 years are not significant.
For 1921–1965, none of the SC indices have significant trends. Trends for Eurasia in 1966–2015 are of opposite sign to 1921–1965 for all five SC indices, with the later period having a decrease in mean SC in all 3 autumn months, statistically significant in October and November. In these 2 months, the magnitude of the trends is greater than in the preceding period, contributing to the significantly negative SC trends across all of 20CRv3. The trends in the SAIs demonstrate a slowing in October snow advance and an accelerating snow advance in November (p<0.01) over the past 50 years, corresponding to a greater contemporaneous decrease in SC extent in October than November and thus an overall postponement of SCO in this time period.
Regarding trends within Eurasia, for 1836–2015 there is a latitudinal division in October and November, with statistically significant trends towards less SC in the north and more SC in parts of the south. Positive trends in SCI_10 and SCI_11 dominate for 1921–1965, with the majority in subregions located beyond the limit of the monthly median SC for 2003–2022, indicating that the spatial pattern of the trends is primarily associated with a southern expansion of autumn SC in western Eurasia. For 1966–2015, the subregions with statistically significant negative trends in SCI_10 and SCI_11 are more spatially coherent, being confined to northern Eurasia, but also extend south to 50° N in the west of the region. There are several examples when a subregion has significant trends in SAI_10 and SAI_11 of opposite sign in the same time period, implying that a more rapid (slower) snow advance in October necessarily contributes to a slower (more rapid) advance in November, as more (less) area is snow-covered than normal at the beginning of November. However, there are also examples of significant trends of the same sign in both months, which points to an expansion or contraction of SC in that subregion.
We next examined the temporal and spatial relationship between the SC indices and the subsequent winter AO to determine whether the frequency of periods with a statistically significant relationship with one sign of the AO was itself significant and, therefore, not simply the result of stochastic processes. For Eurasia as a whole, there are general similarities in the temporal variability in the SCI_09–AO and SCI_10–AO relationships: overall, both indices have significantly high (low) frequencies of decades with significant negative (positive) correlations with the AO, although both also demonstrate a trend from negative to positive correlation values from the 1970s to recent decades. Thus, these SC–AO relationships are robust over the period encompassed by 20CRv3. This is not the case for the SCI_11–AO relationship. Moreover, even though the proportion of positive running decadal SAI_OCT–AO correlations exceeds two-thirds, the frequencies of periods with significant correlations are not significant for either sign of the AO. In contrast, the proportions of positive and negative decadal correlations for SAI_NOV–AO are similar in 20CRv3, yet the fraction of decades with significantly negative correlations is itself significantly low.
Analysing the spatial variability in these relationships among the subregions, two especially robust SC–AO relationships are apparent in the 20CRv3 data. These are a region in northeastern Eurasia for SCI_09 (60–70° N, 120–180° E) (SCI_09 NE) and, for SCI_11, a region in southwestern Eurasia (40–55° N, 30–60° E) (SCI_11 SW). The former has not been noted previously and provides an earlier forecast of the winter AO and its associated weather than other predictors in the literature, while the latter is similar to the western domain of the dipole defined by Han and Sun (2018).
Over the entire length of the 20CRv3 data, the annual SCI_09 NE–AO correlation is statistically significant (p<0.01), with ∼75 % of decades having a negative correlation and the proportion of statistically high and low frequencies of decades with significant relationships with the positive and negative AO being 1.8 % and 27.6 %, respectively. While both temperature and precipitation have a hand in controlling SCI_09 NE, there is typically relatively little SC in the SCI_09 NE region by the end of September. Therefore, it is likely that it is principally the climatic conditions driving SC variability in this region that subsequently have an impact on the winter AO, rather than changes caused by the SC itself. The spatial pattern of September tropospheric gpht anomalies associated with SCI_09 NE closely matches that of the positive phase of the WP teleconnection pattern. This WP pattern enhances upward-propagating wave activity and reduces the strength of the polar vortex, thus providing a potential mechanism linking positive SCI_09 NE to a negative winter AO, similar to that proposed by Cohen et al. (2007). Analysis of differences between high and low SCI_09 NE years indicates a contemporaneous signature in the September temperature and zonal wind, with the latter demonstrating a 10° poleward shift in the polar jet. However, although subsequent months demonstrate marked variability between high and low SCI_09 NE, there are few regions of statistically significant differences in the polar stratosphere, suggesting there is no clear residual signal of SCI_09 NE variability. There are many other factors that have been found to impact the winter AO, and these predominantly occur in October or November, so the SCI_09 NE–AO signal-to-noise ratio is very small. Therefore, a climate model experiment in which only the magnitude of SCI_09 NE is perturbed is likely necessary to elucidate the processes behind this newly described SC–AO relationship apparent in 20CRv3.
All the datasets employed in this study are publicly available and were accessed during 2023/2024.
Snow depth observations:
-
Historical Soviet Daily Snow Depth (HSDSD), Version 2, https://doi.org/10.7265/N5JW8BS3 (Armstrong, 2001);
-
Met Office Integrated Data Archive System (MIDAS) Land and Marine Surface Stations Data, https://cataologue.ceda.ac.uk/uuid/220a65615218d5c9cc9e4785a3234bd0 (Met Office, 2012);
-
Ogimet, https://www.ogimet.com/gsynres.phtml.en (Ogimet, 2023).
Reanalysis data:
-
ERA5, https://doi.org/10.24381/cds.adbb2d47 (Hersbach et al., 2023);
-
20CRV3, https://www.psl.noaa.gov/data/gridded/data.20thC_ReanV3.html (NOAA Physical Sciences Laboratory, 2024).
AO Index:
CPC AO and WP data, https://www.cpc.ncep.noaa.gov/data/teledoc/telecontents.shtml (Climate Data Center, 2024).
The supplement related to this article is available online at https://doi.org/10.5194/tc-19-663-2025-supplement.
The author has declared that there are no competing interests.
Publisher's note: Copernicus Publications remains neutral with regard to jurisdictional claims made in the text, published maps, institutional affiliations, or any other geographical representation in this paper. While Copernicus Publications makes every effort to include appropriate place names, the final responsibility lies with the authors.
I thank the three reviewers for their constructive comments and helpful suggestions that have significantly improved the final article.
This study has been funded by the UK Natural Environment Research Council (NERC) Climate Change in the Arctic and North Atlantic Region and Impacts on the UK (CANARI) project (grant no. NE/W004984/1).
This paper was edited by Masashi Niwano and reviewed by three anonymous referees.
Allchin, M. I. and Déry, S. J.: The climatological context of trends in the onset of Northerrn Hemisphere seasonal snow cover, 1972–2017, J. Geophys. Res.-Atmos., 125, e2019JD032367, https://doi.org/10.1029/2019JD032367, 2020.
Allen, R. J. and Zender, C. S.: Forcing of the Arctic Oscillation by Eurasian snow cover, J. Climate, 24, 6528–6539, https://doi.org/10.1175/2011JCLI4157.1, 2011.
Armstrong, R.: Historical Soviet Daily Snow Depth (HSDSD), 1881–1995 (G01092, Version 2), Boulder, Colorado USA, National Snow and Ice Data Center [data set], https://doi.org/10.7265/N5JW8BS3, 2001.
Bayazit, M. and Önöz, B.: To prewhiten or not to prewhiten in trend analysis?, Hydrol. Sci. J., 52, 611–624, https://doi.org/10.1623/hysj.52.4.611, 2007.
Bednorz, E. and Wibig, J.: Spatial distribution and synoptic conditions of snow accumulation in the Russian Arctic, Polar Res., 35, 25916, https://doi.org/10.3402/polar.v35.25916, 2016.
Bednorz, E. and Wibig, J.: Circulation patterns governing October snowfalls in southern Siberia, Theor. Appl. Climatol., 128, 129–139, https://doi.org/10.1007/s00704-015-1696-3, 2017.
Bender, E., Lehning, M., and Fiddes, J.: Changes in climatology, snow cover and ground temperatures at high alpine locations, Front. Earth Sci., 8, 100, https://doi.org/10.3389/feart.2020.00100, 2020.
Brown, R. D. and Derksen, C.: Is Eurasian October snow cover extent increasing?, Enviorn. Res. Lett., 8, 024006, https://doi.org/10.1088/1748-9326/8/2/024006, 2013.
Bulygina, O. N., Razuvaev, V. N., and Korshunova, N. N.: Changes in snow cover over Northern Eurasia in the last few decades, Environ. Res. Lett., 4, 045026, https://doi.org/10.1088/1748-9326/4/4/045026, 2009.
Bulygina, O. N., Groisman, P. Y., Razuvaev, V. N., and Korshunova, N. N.: Changes in snow cover characteristics over Northern Eurasia since 1966, Environ. Res. Lett., 6, 045204, https://doi.org/10.1088/1748-9326/6/4/045204, 2011.
Callaghan, T. V., Johansson, M., Brown, R. D., Groisman, P. Y., Labba, N., Radionov, V., Barry, R. G., Bulygina, O. N., Essery, R. L. H., Frolov, D. M., Golubev, V. N., Grenfell, T. C., Petrushina, M. N., Razuvaev, V. N., Robinson, D. A., Romanov, P., Shindell, D., Shmakin, A. B., Sokratov, S. A., Warren, S., and Yang, D.: The changing face of Arctic snow cover: a synthesis of observed and projected changes, Ambio, 40, 17–31, https://doi.org/10.1007/s13280-011-0212-y, 2011.
Clark, M. P., Serreze, M. C., and Robinson, D. A.: Atmospheric controls on Eurasian snow extent, Int. J. Climatol., 19, 27–40, https://doi.org/10.1002/(SICI)1097-0088(199901)19:1<27::AID-JOC346>3.0.CO;2-N, 1999.
Clelland, A. A., Marshall, G. J., and Baxter, R.: Evaluating the performance of key ERA-Interim, ERA5 and ERA5-Land climate variables across Siberia, Int. J. Climatol., 44, 2318–2342, https://doi.org/10.1002/joc.8456, 2024.
Climate Data Center: Northern Hemisphere teleconnection patterns, NOAA [data set], https://www.cpc.ncep.noaa.gov/data/teledoc/telecontents.shtml, last access: 24 September 2024.
Cohen, J. and Entekhabi, D.: Eurasian snow cover variability and Northern Hemisphere climate predictability, Geophys. Res. Lett., 26, 345–348, 1999.
Cohen, J. and Jones, J.: A new index for more accurate winter predictions, Geophys. Res. Lett., 38, L21701, https://doi.org/10.1029/2011GL049626, 2011.
Cohen, J., Barlow, M., Kushner, P. J., and Saito, K.: Stratosphere-troposphere coupling and links with Eurasian land surface variability, J. Climate, 20, 5335–5343, https://doi.org/10.1175/2007JCLI1725.1, 2007.
Cohen, J., Foster, J., Barlow, M., Saito, K., and Jones, J.: Winter 2009–2010: a case study of an extreme Arctic Oscillation event, Geophys. Res. Lett., 37, L17707, https://doi.org/10.1029/2010GL044256, 2010.
Cohen, J. L., Furtado, J. C., Barlow, M. A., Alexeev, V. A., and Cherry, J. E.: Arctic warming, increasing snow cover and widespread boreal winter cooling, Environ. Res. Lett., 7, 014007, https://doi.org/10.1088/1748-9326/7/1/014007, 2012.
Cohen, J., Screen, J. A., Furtado, J. C., Barlow, M., Whittleston, D., Coumou, D., Francis, J., Dethloff, K., Entekhabi, D., Overland, J., and Jones, J.: Recent Arctic amplification and extreme mid-latitude weather, Nat. Geosci., 7, 627–637, https://doi.org/10.1038/NGEO2234, 2014.
Compo, G. P., Whitaker, J. S., Sardeshmukh, P. D., Matsui, N., Allan, R. J., Yin, X., Gleason, B. E., Vose, R. S., Rutledge, G., Bessemoulin, P., Brönnimann, S., Brunet, M., Crouthamel, R. I., Grant, A. N., Groisman, P. Y., Jones, P. D., Kruk, M. C., Kruger, A. C., Marshall, G. J., Maugeri, M., Mok, H. Y., Nordli, Ø, Ross, T. F., Trigo, R. M., Wang, X. L., Woodruff, S. D., and Worley, S. J.: The Twentieth Century Reanalysis project, Q. J. Roy. Meteor. Soc., 137, 1–28, https://doi.org/10.1002/qj.776, 2011.
Dai, Y. and Tan, B.: Two types of the western Pacific pattern, their climate impacts, and the ENSO modulations, J. Climate, 32, 823–841, https://doi.org/10.1175/JCLI-D-17-0618.1, 2019.
Delhaye, S., Massonnet, F., Fichefet, T., Msadek, R., Terray, L., and Screen, J.: Dominant role of early winter Barents-Kara sea ice extent anomalies in subsequent atmospheric circulation changes in CMIP6 models, Clim. Dynam., 62, 2755–2778, https://doi.org/10.1007/s00382-023-06904-6, 2024.
Ding, Q., Schweigher, A., L'Heureux, M., Battisti, D. S., Po-Chedley, S., Johnson, N. C., Blanchard-Wrigglesworth, E., Harnos, K., Zhang, Q., Eastman, R., and Steig, E. J.: Influence of high-latitude atmospheric circulation changes on summertime Arctic sea ice, Nat. Clim. Change, 7, 289–295, https://doi.org/10.1038/nclimate3241, 2017.
Douville, H., Peings, Y., and Saint-Martin, D.: Snow-(N)AO relationship revisited over the whole twentieth century, Geophys. Res. Lett., 44, 569–577, https://doi.org/10.1002/2016GL071584, 2016.
Estilow, T. W., Young, A. H., and Robinson, D. A.: A long-term Northern Hemisphere snow cover extent data record for climate studies and monitoring, Earth Syst. Sci. Data, 7, 137–142, https://doi.org/10.5194/essd-7-137-2015, 2015.
Furtado, J. C., Cohen, J. L., Butler, A. H., Riddle, E. E., and Kumar, A.: Eurasian snow cover variability and links to winter climate in the CMIP5 models, Clim. Dynam., 45, 2591–2605, https://doi.org/10.1007/s00382-015-2494-4, 2015.
Garfinkel, C. I., Hartmann, D. L., and Sassi, F.: Tropospheric precursors of anomalous Northern Hemisphere stratospheric polar vortices, J. Climate, 23, 3282–3299, https://doi.org/10.1175/2010JCLI3010.1, 2010.
Gastineau, G., Garćia-Serrano, J., and Frankignoul, C.: The influence of autumnal Eurasian snow cover on climate and its link with Arctic sea ice cover, J. Climate, 30, 7599–7619, https://doi.org/10.1175/JCLI-D-16-0623.1, 2017.
Han, S. and Sun, J.: Impacts of autumnal Eurasian snow cover on predominant modes of boreal winter surface air temperature over Eurasia, J. Geophys. Res. Atmos., 123, 10076–10091, https://doi.org/10.1029/2018JD028443, 2018.
Handorf, D., Jaise, R., Dethloff, K., Rinke, A., and Cohen, J.: Impacts of Arctic sea ice and continental snow cover changes on atmospheric winter teleconnections, Geophys. Res. Lett., 42, 2367–2377, https://doi.org/10.1002/2015GL063203, 2015.
Henderson, G. R., Peings, Y., Furtado, J. C., and Kushner, P. J.: Snow-atmosphere coupling in the Northern Hemisphere, Nat. Clim. Change, 9, 954–963, https://doi.org/10.1038/s41558-018-0295-6, 2018.
Hersbach, H., Bell, B., Berrisford, P., Hirahara, S., Horányi, A., Muñoz-Sabater, J., Nicolas, J., Peubey, C., Radu, R., Schepers, D., Simmons, A., Soci, C., Abdalla, S., Abellan, X., Balsamo, G., Bechtold, P., Biavati, G., Bidlot, J., Bonavita, M., De Chiara, G., Dahlgren, P., Dee, D., Diamantakis, M., Dragani, R., Flemming, J., Forbes, R., Fuentes, M., Geer, A., Haimberger, L., Healy, S., Hogan, R. J., Hólm, E., Janisková, Keeley, S., Laloyaux, P., Lupu, C., Radnoti, G., de Rosnay, P., Rozum, I., Vamborg, F., Villaume, S., and Thépaut, J.-N.: The ERA5 global reanalysis, Q. J. Roy. Meteor. Soc., 146, 1999–2049, https://doi.org/10.1002/qj.3803, 2020.
Hersbach, H., Bell, B., Berrisford, P., Biavati, G., Horányi, A., Muñoz Sabater, J., Nicolas, J., Peubey, C., Radu, R., Rozum, I., Schepers, D., Simmons, A., Soci, C., Dee, D., and Thépaut, J.-N.: ERA5 hourly data on single levels from 1940 to present, Copernicus Climate Change Service (C3S) Climate Data Store (CDS) [data set], https://doi.org/10.24381/cds.adbb2d47, 2023.
Hori, M., Sugiura, K., Kobayashi, K., Aoki, T., Tanikawa, T., Kuchiki, K., Niwano, M., and Enomoto, H.: A 38-year (1978–2015) Northern Hemisphere daily snow cover extent product derived using consistent objective criteria from satellite-borne optical sensors, Rem. Sens. Environ., 191, 402–418, https://doi.org/10.1016/j.rse.2017.01.023, 2017.
Kitaev, L., Kislov, A., Krenke, A., Razuvaev, V., Martuganov, R., and Konstantinov, I.: The snow cover characteristics of northern Eurasia and their relationship to climatic parameters, Boreal Environ. Res., 7, 437–445, 2002.
Linkin, M. E. and Nigam, S.: The North Pacific Oscillation-West Pacific teleconnection pattern: mature-phase structure and winter impacts, J. Climate, 21, 1979–1997, https://doi.org/10.1175/2007JCLI2048.1, 2008.
Marshall, G. J.: Decadal variability in the impact of atmospheric circulation patterns on the winter climate of northern Russia, J. Climate, 34, 1005–1021, https://doi.org/10.1175/JCLI-D-20-0566.1, 2021.
Met Office: Met Office Integrated Data Archive System (MIDAS) Land and Marine Surface Stations Data (1853–current), NCAS British Atmospheric Data Centre [data set], https://cataologue.ceda.ac.uk/uuid/220a65615218d5c9cc9e4785a3234bd0 (last access: 21 February 2024), 2012.
Mokhov, I. I. and Parfenova, M. M.: Changes in the snow cover extent in Eurasia from satellite data in relation to hemispheric and regional temperature changes, Doklady Earth Sci., 501, 78–85, https://doi.org/10.1134/S1028334X21110106, 2021.
Mortimer, C., Mudryk, L., Derksen, C., Luojus, K., Brown, R., Kelly, R., and Tedesco, M.: Evaluation of long-term Northern Hemisphere snow water equivalent products, The Cryosphere, 14, 1579–1594, https://doi.org/10.5194/tc-14-1579-2020, 2020.
Mudryk, L. R., Kushner, P. J., Derksen, C., and Thackeray, C.: Snow cover response to temperature in observational and climate model ensembles, Geophys. Res. Lett., 44, 919–926, https://doi.org/10.1002/2016GL071789, 2017.
Nishii, K., Nakamura, H., and Orsolini, Y. J.: Cooling of the wintertime Arctic stratosphere induced by the western Pacific teleconnection pattern, Geophys. Res. Lett., 37, L13805, https://doi.org/10.1029/2010GL043551, 2010.
NOAA Physical Sciences Laboratory: NOAA/CIRES/DOE 20th Century Reanalysis (V3), https://www.psl.noaa.gov/data/gridded/data.20thC_ReanV3.html (last access: 27 November 2024), 2024.
Ogimet: OGIMET, Ogimet [data set], https://www.ogimet.com/gsynres.phtml.en, last access: 30 May 2023.
Orsolini, Y. J., Senan, R., Vitart, F., Balsamo, G., Weisheimer, A., and Doblas-Reyes, F. J.: Influence of the Eurasian snow on the negative North Atlantic Oscillation in subseasonal forecasts of the cold winter 2009/2010, Clim. Dynam., 47, 1325–1334, https://doi.org/10.1007/s00382-015-2903-8, 2016.
Overland, J. E., Dethloff, K., Francis, J. A., Hall, R. J., Hanna, E., Kim, S.-J., Screen, J. A., Shepherd, T. G., and Vihma, T.: Nonlinear response of mid-latitude weather to the changing Arctic, Nat. Clim. Change, 6, 992–999, https://doi.org/10.1038/NCLIMATE3121, 2016.
Peings, Y.: Ural blocking as a driver of early-winter stratospheric warmings, Geophys. Res. Lett., 46, 5460–5468, https://doi.org/10.1029/2019GL082097, 2019.
Peings, Y., Brun, E., Mauvais, V., and Douville, H.: How stationary is the relationship between Siberian snow and Arctic Oscillation over the 20th century?, Geophys. Res. Lett., 40, 183–188, https://doi.org/10.1029/2012GL054083, 2013.
Peings, Y., Douville, H., Colin, J., Saint Martin, D., and Magnusdottir, G.: Snow-(N)AO teleconnection and its modulation by the Quasi-Biennial Oscillation, J. Climate, 30, 10211–10235, https://doi.org/10.1175/JCLI-D-17-0041.1, 2017.
Peings, Y., Labe, Z. M., and Magnusdottir, G.: Are 100 ensemble members enough to capture the remote atmospheric response to a +2° C Arctic sea ice loss? J. Climate, 34, 3751–3769, https://doi.org/10.1175/JCLI-D-20-0613.1, 2021.
Peng, S., Piao, S., Ciais, P., Friedlingstein, P., Zhou, L., and Wang, T.: Change in snow phenology and its potential feedback to temperature in the Northern Hemisphere over the last three decades, Environ. Res. Lett., 8, 014008, https://doi.org/10.1088/1748-9326/8/1/014008, 2013.
Rantanen, M., Karpechko, A. Y., Lipponen, A., Nordling, K., Hyvärinen, O., Ruosteenoja, K., Vihmom, T., and Laaksonen, A.: The Arctic has warmed nearly four time faster than the globe since 1979, Commun. Earth Environ., 3, 168, https://doi.org/10.1038/s43247-022-00498-3, 2022.
Sen, P. K.: Estimates of the regression coefficient based on Kendall's Tau, J. A. Stat. Assoc., 63, 1379–1389, https://doi.org/10.1080/01621459.1968.10480934, 1968.
Silvinski, L. C., Compo, G. P., Whitaker, J. S., Sardeshmukh, P. D., Giese, B. S., McColl, C., Allan, R., Yin, X., Vose, R., Titchner, H., Kennedy, J., Spencer, L. J., Brönnimann, S., Brunet, M., Camuffo, D., Cornes R., Cram, T. A., Crouthamel, R., Domínguez-Castro, F., Freeman, J. E., Gergis, J., Hawkins, E., Jones, P. D., Jourdain, S.. Kaplan, A., Kubota, H., Le Blancq, F., Lee, T.-C., Lorrey, A., Luterbacher, J., Maugeri, M., Mock, C. J., Moore, G. W. K., Przybylak, R., Pudmenzky, C., Reason, C., Slonosky, V. C., Smith, C. A., Tinz, B., Trewin, B., Valente, M. A., Wang, X. L., Wilkinson, C., Wood, K., and Wyszyński, P.: Towards a more reliable historical reanalysis: improvements for version 3 of the Twentieth Century Reanalysis system, Q. J. Roy. Meteor. Soc., 145, 2876–2908, https://doi.org/10.1002/qj.3598, 2019.
Tao, L., Fang, J., Yang, X.-Q., Cai, D., and Wang, Y.: Role of North Atlantic tripole SST in mid-winter reversal of NAO. Geophys. Res. Lett., 50, e2023GL103502, https://doi.org/10.1029/2023GL103502, 2023.
Thompson, D. W. J. and Wallace, J. M.: The Arctic Oscillation signature in the wintertime geopotential height and temperature fields, Geophys. Res. Lett., 25, 1297–1300, https://doi.org/10.1029/98GL00950, 1998.
Tyrrell, N. T., Karpechko, A. Y., and Rast, S.: Siberian snow forcing in a dynamically bias-corrected model, J. Climate, 33, 10455–10467, https://doi.org/10.1175/JCLI-D-19-0966.1, 2020.
Urraca, R. and Gobron, N.: Temporal stability of long-term satellite and reanalysis products to monitor snow cover trends, The Cryosphere, 17, 1023–1052, https://doi.org/10.5194/tc-17-1023-2023, 2023.
Wang, C., Graham, R. M., Wang, K., Gerland, S., and Granskog, M. A.: Comparison of ERA5 and ERA-Interim near-surface air temperature, snowfall and precipitation over Arctic sea ice: effects on sea ice thermodynamics and evolution, The Cryosphere, 13, 1661–1679, https://doi.org/10.5194/tc-13-1661-2019, 2019.
Wegmann, M., Orsolini, Y., Dutra, E., Bulygina, O., Sterin, A., and Brönnimann, S.: Eurasian snow depth in long-term climate reanalyses, The Cryosphere, 11, 923–935, https://doi.org/10.5194/tc-11-923-2017, 2017.
Wegmann, M., Rohrer, M., Santolaria-Otín, M., and Lohmann, G.: Eurasian autumn snow link to winter North Atlantic Oscillation is strongest for Arctic warming periods, Earth Syst. Dynam., 11, 509–524, https://doi.org/10.5194/esd-11-509-2020, 2020.
Wegmann, M., Orsolini, Y., Weisheimer, A., van den Hurk, B., and Lohmann, G.: Impact of Eurasian autumn snow on the winter North Atlantic Oscillation in seasonal forecasts of the 20th century, Weather Clim. Dynam., 2, 1245–1261, https://doi.org/10.5194/wcd-2-1245-2021, 2021.
Wilks, D.: “The stippling shows statistically significant grid points”: How research results are routinely overstated. overinterpreted and what to do about it, B. Am. Meteorol. Soc., 97, 2263–2273, https://doi.org/10.1175/BAMS-D-15-00267.1, 2016.
Yang, H. and Fan, K.: Strengthened impacts of November snow cover over Siberia on the out-of-phase change in the Siberian High between December and January since 2000 and implication for intraseasonal climate prediction, Front. Earth Sci., 9, 748484, https://doi.org/10.3389/feart.2021.748484, 2021.
Ye, H.: Increases in snow season length due to earlier first snow and later last snow dates over north central and northwest Asia during 1937–94, Geophys. Res. Lett., 28, 551–554, https://doi.org/10.1029/2000GL012036, 2001.
Ye, K. and Wu, R.: Autumn snow cover variability over northern Eurasia and roles of atmospheric circulation, Adv. Atmos, Sci., 34, 847–858, https://doi.org/10.1007/s00376-017-6287-z, 2017.
Yu, L., Sui, C., Lenschow, D. H., and Zhou, M.: The relationship between wintertime extreme temperature events north of 60° N and large-scale atmospheric circulations, Int. J. Climatol., 37, 597–911, https://doi.org/10.1002/joc.5024, 2017.
Zhang, T., Feng, Y., and Chen, H.: Revealing the formation of the dipole mode of Eurasian snow cover variability during late autumn, J. Geophys. Res.-Atmos., 128, 22022JD038233, https://doi.org/10.1029/2022JD038233, 2023.
Zhou, W., Leung, L. R., and Lu, J.: Steady threefold Arctic amplification of externally forced warming masked by natural variability, Nat. Geosci., 17, 508–515, https://doi.org/10.1038/s41561-024-01441-1, 2024.