the Creative Commons Attribution 4.0 License.
the Creative Commons Attribution 4.0 License.
 | 05 Dec 2025
Estimation of annual runoff using supraglacial channel geometry derived from UAV surveys of Qiyi Glacier, northern Tibetan Plateau
Longjiang Xie
Ninglian Wang
Anan Chen
Shiqiang Zhang
Due to difficulties in direct field observation and uncertainties in glacier runoff models, accurately estimating the glacier runoff remains one of the foremost challenges in cryospheric science. Using a digital elevation model (DEM) and orthophotos (both with a resolution of 5 cm) obtained from an unmanned aerial vehicle (UAV), this study developed a novel remote sensing method for estimating the annual discharge of the supraglacial channel over Qiyi Glacier in the northern Tibetan Plateau, which contributes to the majority of the glacier runoff. Our results showed that the catchment areas of the six main supraglacial channels covered 92.02 % of the total glacier area and transported 89.43 % of the annual surface meltwater yield (each ranging from 0.07×10⁶ to 0.66×10⁶ m3). Some geometric parameters of the supraglacial channels (including lateral deviation, gradient, and width) were selected to predict the annual discharge using a stepwise regression model, which explained ∼78.2 % of the variance in the measurement-based glacier annual discharge, with the explained variance increasing to 81.8 % after five-point moving average filtering. In comparison, a nonlinear regression model incorporating only the lateral deviation and specific gradient, which were more easily obtained practically, performed somewhat less well, accounting for 66.2 % of the discharge variation; however, the explained variance increased to 81.4 % after five-point filtering. If satellite remote sensing data with meter-level spatial resolution are available for a specific glacier research area, our regression models, based solely on the UAV-derived supraglacial channel network, will be a promising solution for monitoring changes in annual glacier discharge.
- Article
(7081 KB) - Full-text XML
-
Supplement
(450 KB) - BibTeX
- EndNote


In the context of global warming, most mountain glaciers worldwide are suffering from accelerated retreat with substantial influences on the glacier-fed rivers, especially for the “water tower of Asia” (Tibetan Plateau), which seriously threatens the livelihoods of hundreds of millions of people downstream with rising risks to water resource safety (Bolch et al., 2012; Huss, 2011; Immerzeel et al., 2020; Nie et al., 2021; Wang et al., 2021; Yao et al., 2022; Zemp et al., 2019). Emergent remote sensing data from different types of spaceborne sensors have been widely used to study various aspects of the influence of climate change on glaciers (Paul et al., 2015; Xu et al., 2025), such as glacier area (Burns and Nolin, 2014), ice mass change (Curran et al., 2025; Kääb et al., 2012), equilibrium line altitude (ELA) (Rabatel et al., 2013), glacier surface velocity (Dehecq et al., 2019; Kraaijenbrink et al., 2016), and glacier surface temperature (Ren et al., 2024; Wu et al., 2019). However, there is still a lack of remote sensing retrieval methods for glacier runoff that link glacier changes directly to the water supply for downstream human communities, which has become a major obstacle for understanding the patterns of glacier runoff changes for practical water resource management and policy-making at the watershed or larger scale.
The supraglacial stream and channel network, one of the most common landscapes on the surfaces of continental ice sheets and mountain glaciers, is formed by the incision and erosion effects of glacial meltwater, which has been shown to have river morphology and processes similar to those of terrestrially based bedrock rivers (Knighton, 1981; Pitcher and Smith, 2019) with the discharge closely related to the channel geometry (e.g., width and depth) (Jarosch and Gudmundsson, 2012). However, compared with the relatively sophisticated methods for estimating terrestrial river runoff by retrieving the water level, river width, channel slope, and flow velocity from satellite remote sensing data (Bjerklie et al., 2018; Xu et al., 2024), the retrieval methods for meltwater runoff of mountain glaciers remain less developed, mainly for two reasons. First, most supraglacial rivers of mountain glaciers are very narrow (sub-meter or meter scale), making it difficult to be identified from the commonly used satellite images with meters or tens of meters pixel sizes, even though these satellite images have been widely used to extract the spatial distribution of relatively wider supraglacial rivers on the Greenland Ice Sheet (GrIS) and other large polar glaciers (e.g., Bell et al., 2017; Legleiter et al., 2014; Yang and Smith, 2016; Zhang et al., 2023). Second, it remains challenging to obtain continuous field measurements or estimations of supraglacial river discharge from those ice sheets or mountain glaciers under relatively harsh environmental and climatic conditions (Gleason et al., 2016). To date, estimates of meltwater runoff at basin or larger scales have often relied either on the limited field observations (Gleason et al., 2016; Smith et al., 2017, 2021) or on glacier runoff models driven by coarse-resolution climate data (Beamer et al., 2016; Hock, 2005; Sicart et al., 2008; Wang et al., 2024; Yang et al., 2025). Although in situ meteorological observations from weather stations are used in some glacier studies, such data are often unavailable or sparse for remote glacierized regions, leading to uncertainties in modeled runoff that hinder a robust quantitative analysis of its relationship with supraglacial channel geometry (Smith et al., 2017). Furthermore, during the ablation season, supraglacial channels can terminate in meltwater lakes, moulins, and crevasses (Colgan et al., 2011; Smith et al., 2015; Yang and Smith, 2016), further complicating the estimation of meltwater runoff of supraglacial rivers.
Currently, uncrewed aerial vehicle (UAV) remote sensing has been widely used to monitor glacier changes by combining its optical images and digital elevation model (DEM) data or airborne synthetic aperture radar (SAR) images, which are performed at a centimeter-level spatial resolution (Bhardwaj et al., 2016; Dall'Asta et al., 2017; Hugenholtz et al., 2013; Immerzeel et al., 2014; Kraaijenbrink and Immerzeel, 2025; Śledź et al., 2021; Wang et al., 2025). Although UAVs are generally equipped with visible light cameras, which have limited ability to discriminate water bodies from the surrounding narrow and deep supraglacial channels on mountain glaciers, UAV remote sensing data have great strengths in identifying supraglacial channel networks and their cross-sectional geometry. According to studies based on UAV field observations, channel migration and curvature adjustments occur annually in supraglacial rivers in polar glaciers (Bergstrom et al., 2021; Rippin et al., 2015; St Germain and Moorman, 2019). Similarly, significant interannual variability in supraglacial rivers has also been reported in the Ganglongjiama Glacier on the central Tibetan Plateau using a terrestrial laser scanner (TLS) data (Xue et al., 2024). Our field observations at the Qiyi Glacier also revealed that supraglacial channel adjustment appears to be positively related to the intensity of ice melting on an annual timescale: years of more intense melting are generally characterized by stronger surface meltwater erosion with deeper and wider channels, and vice versa. This phenomenon inspired us to investigate the relationship between the channel morphology and annual discharge of supraglacial rivers. Therefore, in this study, using a DJI M300 series UAV, a 5 cm spatial resolution DEM and orthomosaic map over the Qiyi Glacier were obtained to extract the channel geometric parameters at different elevations, which were used to explore their relationships with meltwater discharge calculated by field observations rather than the glacier runoff model.
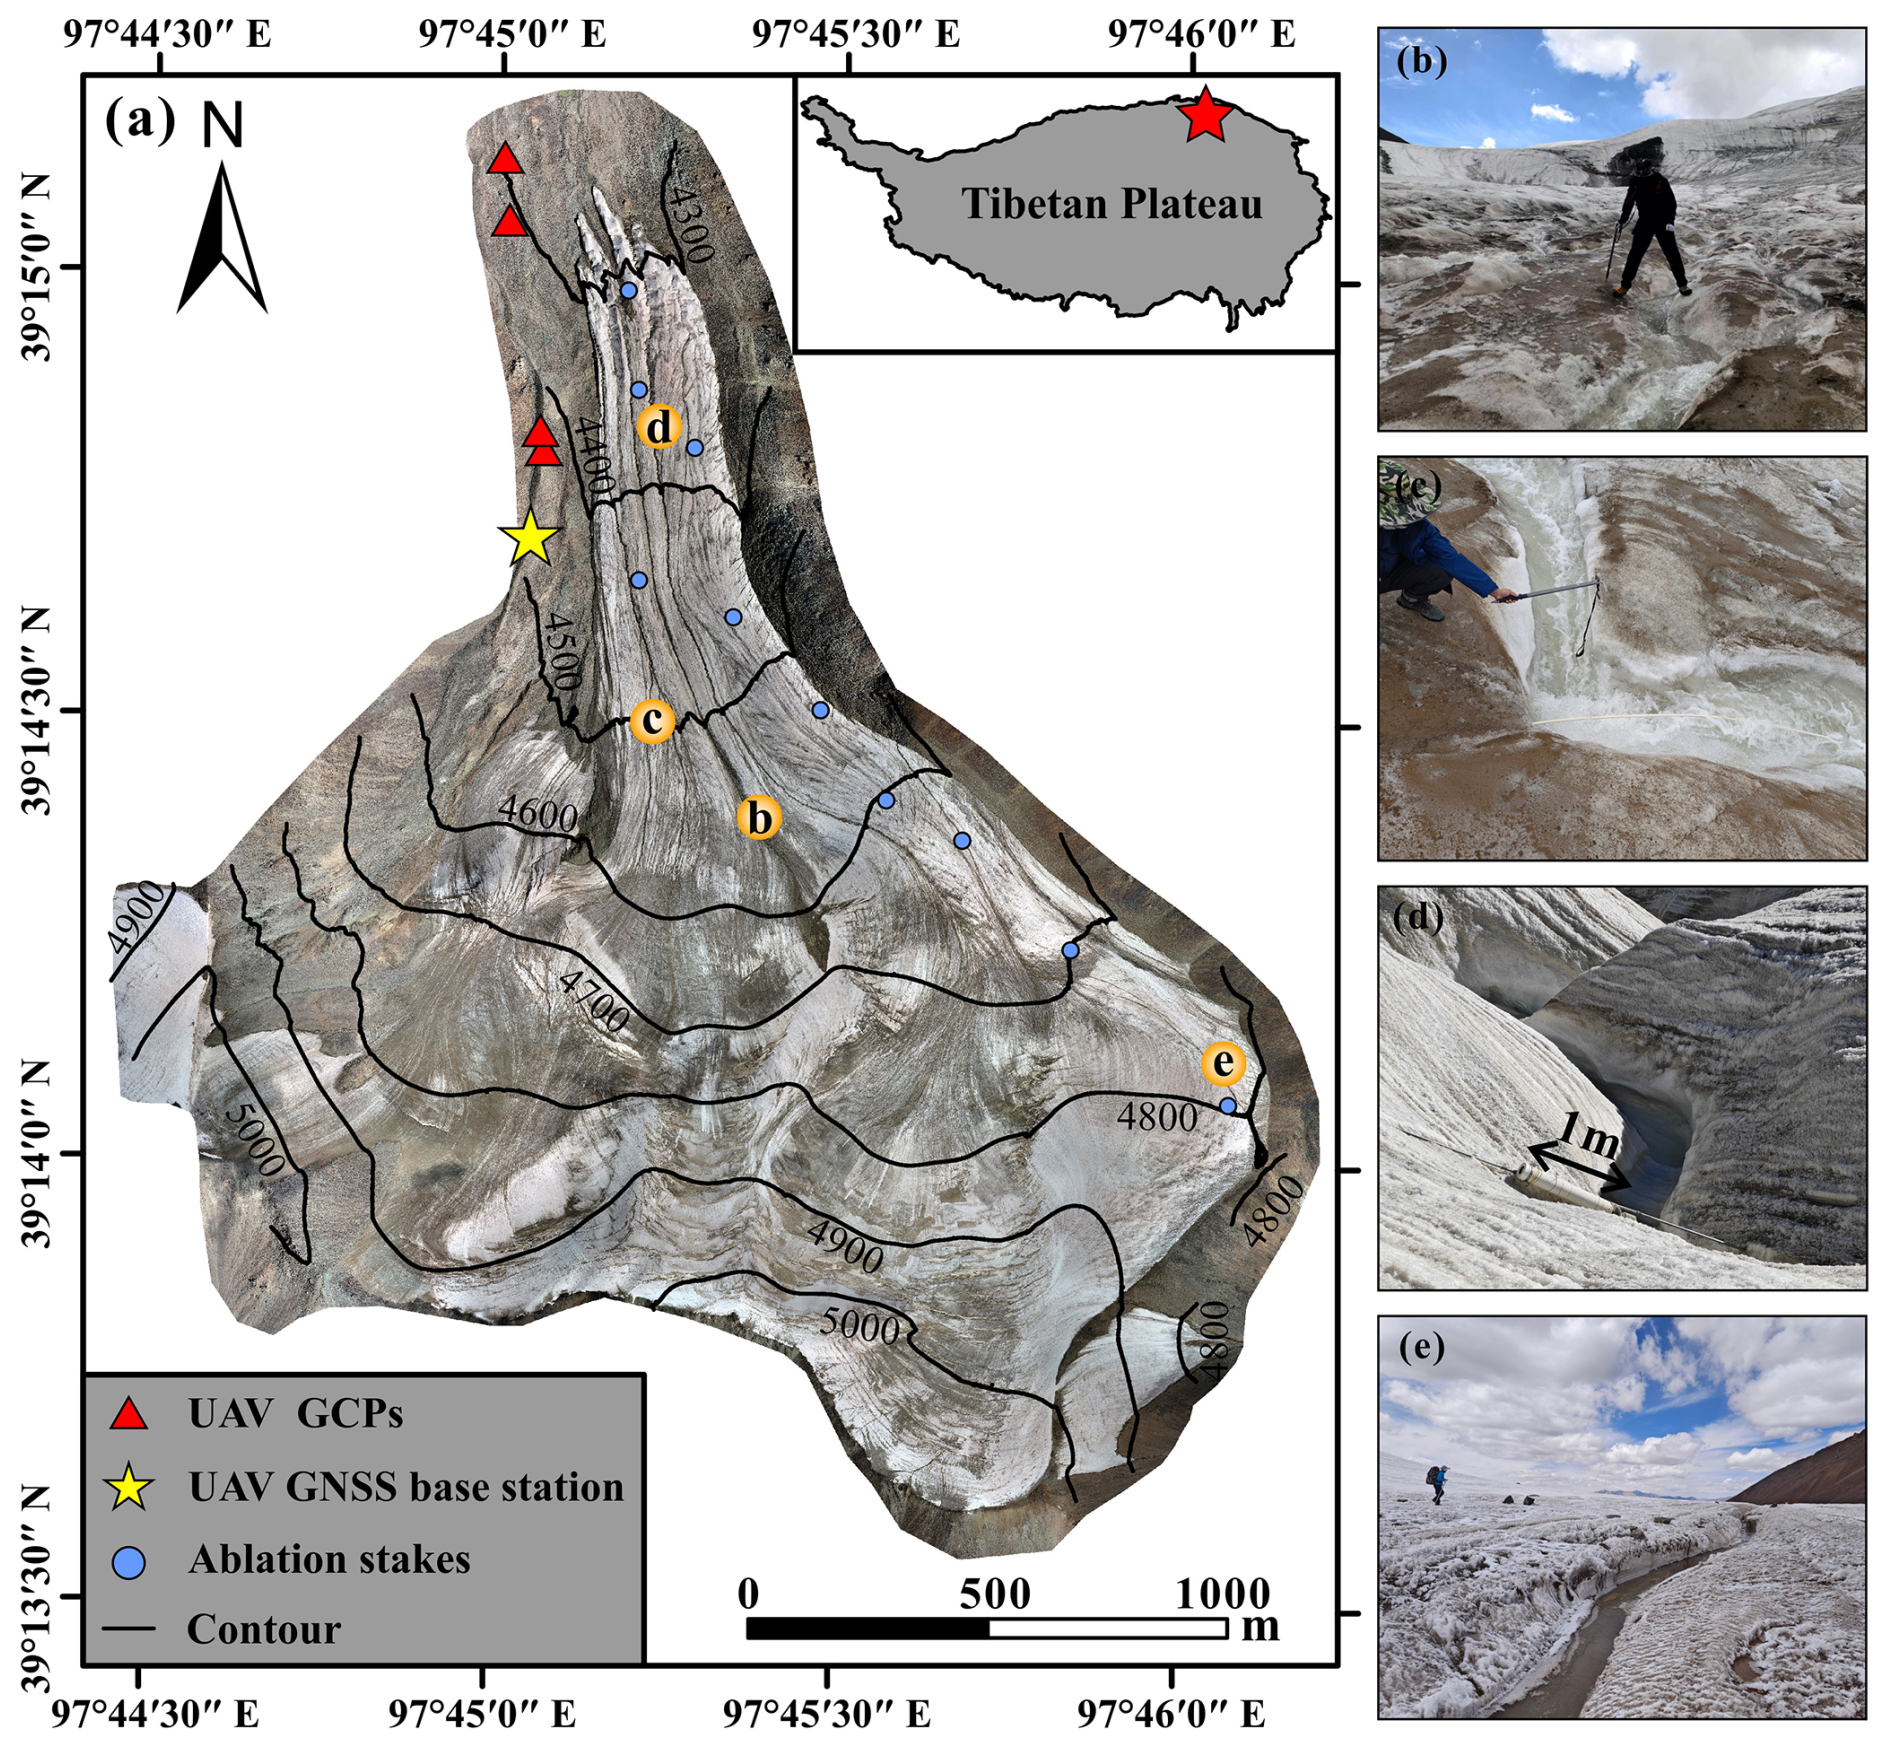
Figure 1Location of the Qiyi Glacier and photos of its typical supraglacial stream channels. (a) Orthomosaic map of the Qiyi Glacier generated from UAV data (5 cm spatial resolution), with red triangles marking the locations of ground control points (GCPs) each with a fixed solution for UAV flights, yellow stars indicating the Global Navigation Satellite System (GNSS) base station of UAV, blue dots representing the locations of ablation stakes on the glacier, and orange circles showing the locations where photos (b)–(e) were taken.
2.1 Study area
The Qiyi Glacier, located in the Qilian Mountains (39°14′13′′ N, 97°45′18′′ E), is a typical polythermal mountain glacier of the Tibetan Plateau (Fig. 1). The elevation of the Qiyi Glacier ranges from 4322 to 5158 m a.s.l., with a total area of approximately 2.69 km2 and length of 2.9 km in 2023. Since 1975, the glacier area has shrunk by approximately 4.5 %, with the terminus continuously receding by 235 m. Mountain glaciers (including the Qiyi Glacier) offer important water resources to the downstream arid regions over the Hexi Corridor, with glacier meltwater accounting for approximately 20 % of the runoff of the Beida River (Wang et al., 2017). We have undertaken regular meteorological, hydrological, and mass balance observations on Qiyi Glacier from June to August since 2002, which have demonstrated an increase in melt, particularly since 2016 (Chen et al., 2024). Over the past decade, the acceleration of glacial melting has increased surface meltwater runoff, which has contributed to the deepening and widening of supraglacial stream channels.
2.2 UAV data acquisition and processing
A DJI Matrice300 real time kinematic (RTK) UAV was used to produce the DEM and orthophotos (both with a resolution of 5 cm) of the Qiyi Glacier. The UAV was equipped with a Zenmuse L1 lens integrating a visible-light camera and a light detection and ranging (LiDAR) sensor. From 15 August to 20 August 2023, 2585 photographs and LiDAR data were collected at a flight altitude of 100 m to cover the entire Qiyi Glacier. The geolocation accuracy requirements of the DEM and orthomosaic map were ensured by ground control points (GCPs), and Hi-Target RTK was used to obtain fixed solutions for high-precision geolocation information.
Pix4D Mapper 4.5.6 software was used to process the visible light images, including data preprocessing, aerial triangulation, and point cloud encryption. The root mean square errors (RMSE) in x, y, and z directions for the positions of the GCPs were 0.24, 0.09, and 0.35 m, respectively. The LiDAR data were processed using the CloudCompare and Lidar360 software, including denoising, smoothing, thinning, and rasterizing the point cloud. It should be noted that it is relatively difficult to identify homologous image points on the snow surface of the upper glacier under visible light, and the density of the point cloud data generated from visible light images is very low, while for the photons actively emitted by the lidar sensor, due to their property of being easily absorbed by the liquid water, the density of the point cloud is very low in the region of the lower glacier where the melting is strong. Therefore, these two types of point-cloud data have good spatial complementarity for generating a complete high-precision point-cloud dataset for glacier surfaces. The iterative closest point (ICP) algorithm was applied to register these two, and the merged point-cloud data were rasterized to the final DEM with a spatial resolution of 0.05 m.
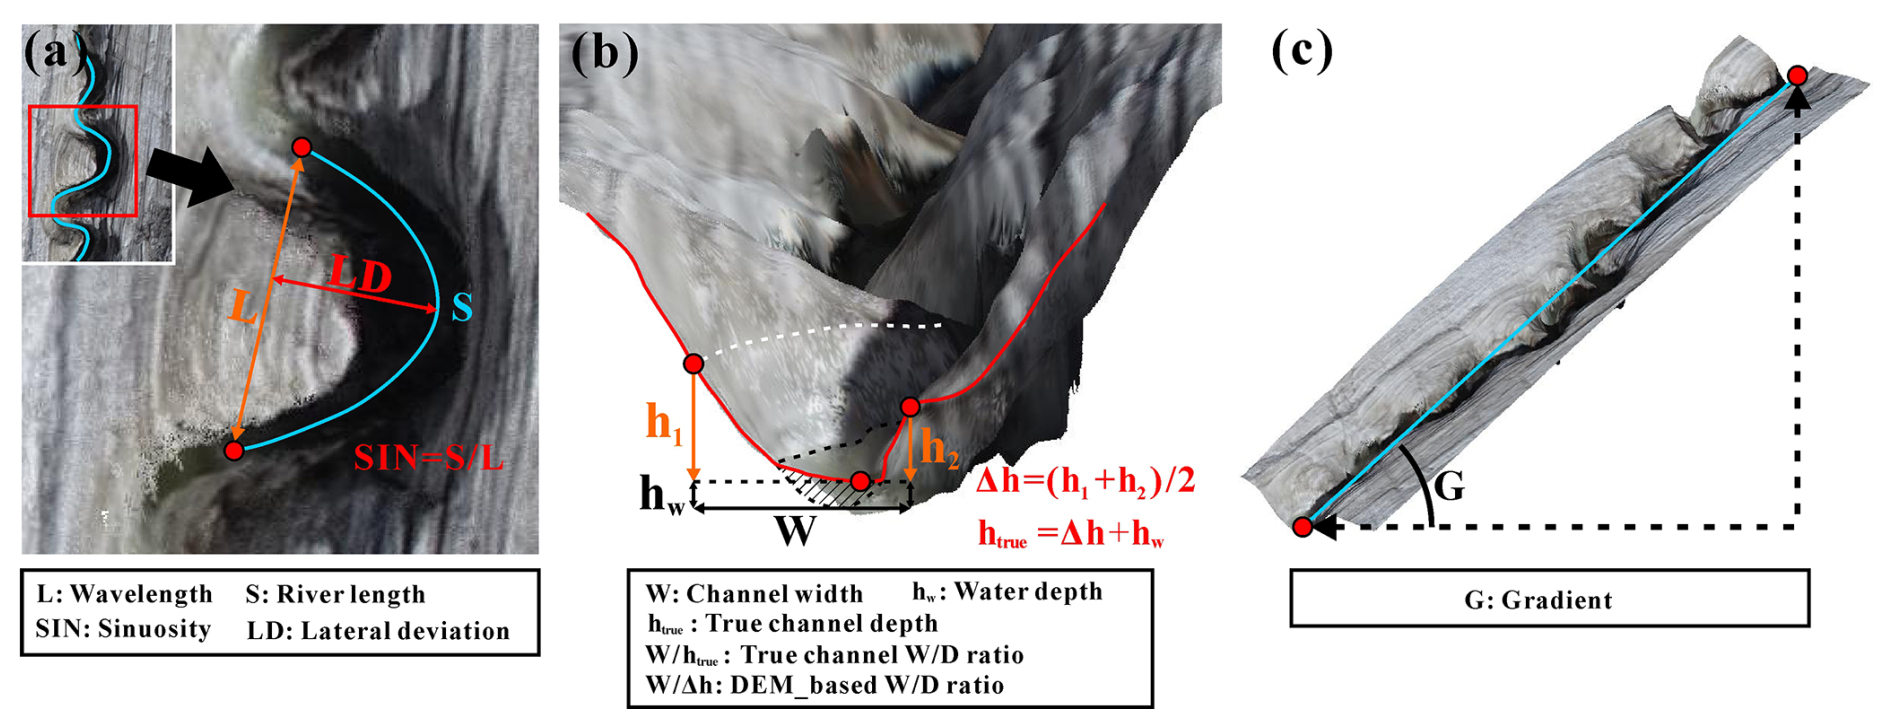
Figure 2Diagrams showing the process of obtaining the channel geometric parameters: (a) sinuosity and lateral deviation of an individual meander; (b) geometry of the channel profile (width, depth, and width/depth ratio); the white dashed line indicates the maximum slope, and the black dashed line and shaded area indicate the water surface and underwater channel profile, respectively; (c) the channel gradient.
2.3 Extraction of morphological characteristics of supraglacial channels
The supraglacial channel network was extracted from UAV-derived DEM data by using the hydrological analysis module of the ArcGIS platform and Global Mapper software, from which we extracted several morphological characteristics, including channel sinuosity (SIN), lateral deviation (LD), channel gradient (G), and cross-section geometry (width W, depth Δh, and width depth ratio) (Fig. 2). To ensure consistency in defining channel geometry, we applied a standardized approach to determine channel width and depth. Since supraglacial channels are continuously eroded by rapid water flow, there are relatively distinct inflection points in the slope of the cross-section. The two points on the cross-section with the steepest slope gradients were designated as h1 and h2. Channel depth (Δh) was defined as the average vertical distance from these two points to the lowest point of the channel, whereas channel width (W) was defined as the horizontal distance between h1 and h2. A representative cross-section (channel A at 4350 m) has been included in the Supplement (Fig. S1) to illustrate the positions of h1 and h2.
Supraglacial rivers can terminate in crevasses and moulins, potentially leading to the misidentification of channels. Although crevasses also exist in the Qiyi Glacier, they are generally small in size and mainly distributed in the steep area of the upper glacier as well as the edge area of the middle and lower parts; therefore, they have a minor influence on the process of river confluence and continuity of the river channel (Fig. 1). After several comparative trials, a minimum drainage area of 0.02 km2 was determined as the threshold for the automatic extraction method. The automated algorithm identified a total of 33 channel segments, including not only the six main channels (labeled A–F in Fig. 4a) but also smaller, low-order tributaries. To ensure the realism of the extracted channels, all automatically derived streams were carefully compared with the orthophotos, channels that could not be clearly identified in the orthophotos were truncated, particularly small tributaries and river sections at the upstream headwaters. Finally, six main supraglacial channels on the Qiyi Glacier were correctly identified and extracted, from which the glacier was divided into six catchments (Fig. 4a).
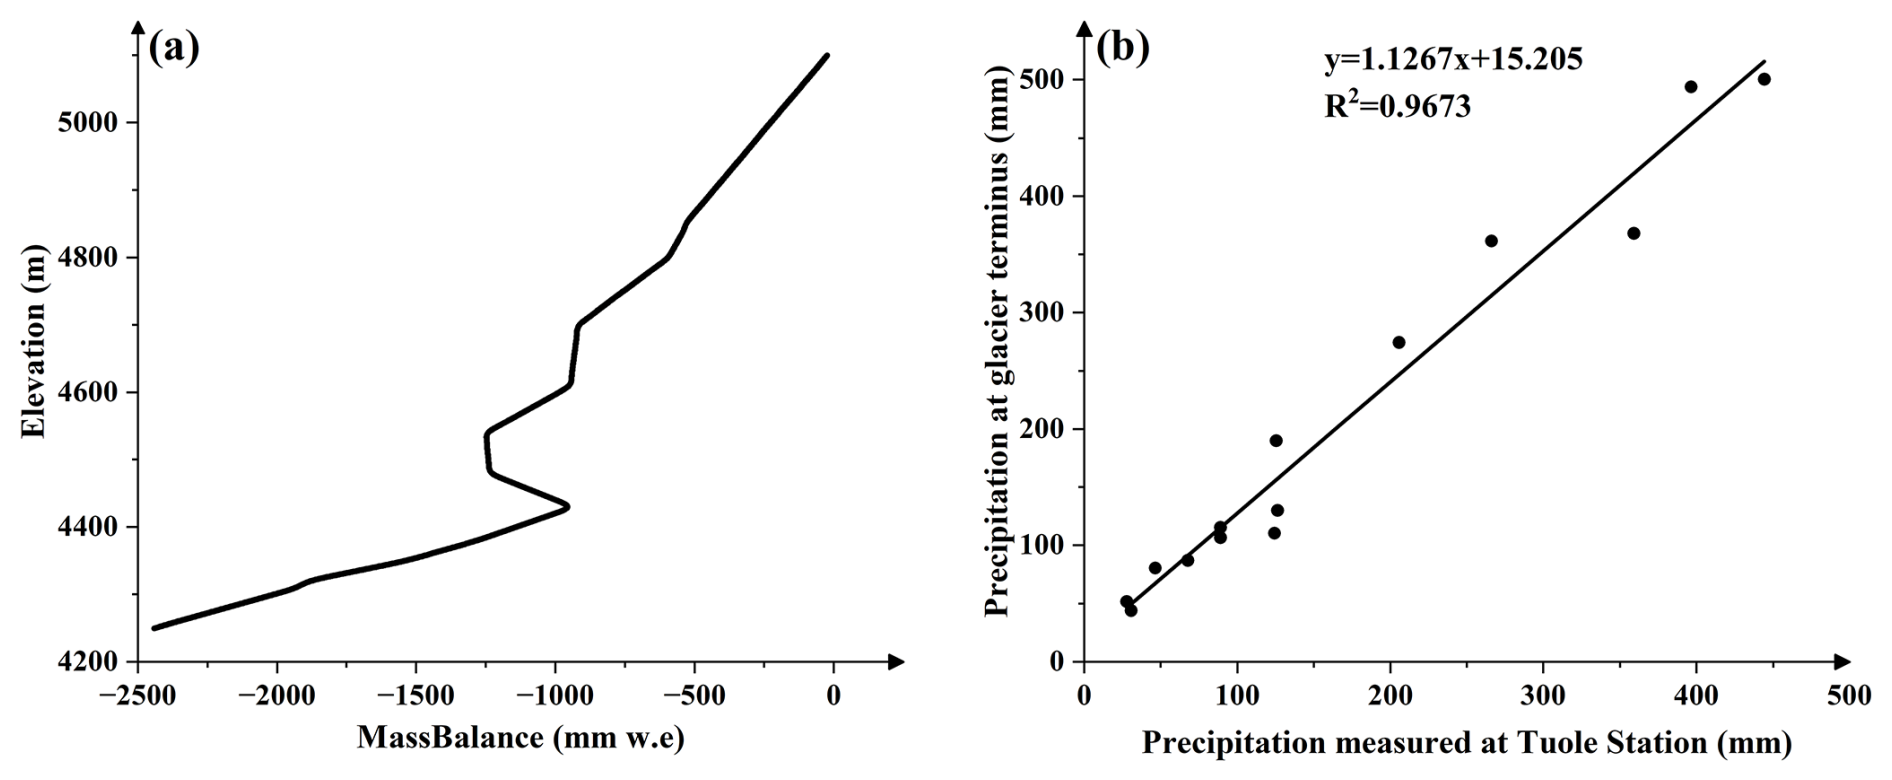
Figure 3(a) Variations in mass balance of the Qiyi Glacier reconstructed from ablation stake measurements with elevation in 2023. (b) Comparisons of monthly/annual precipitation between Tuole station records and rain gauge observations at the terminus of Qiyi Glacier during 2006–2013.
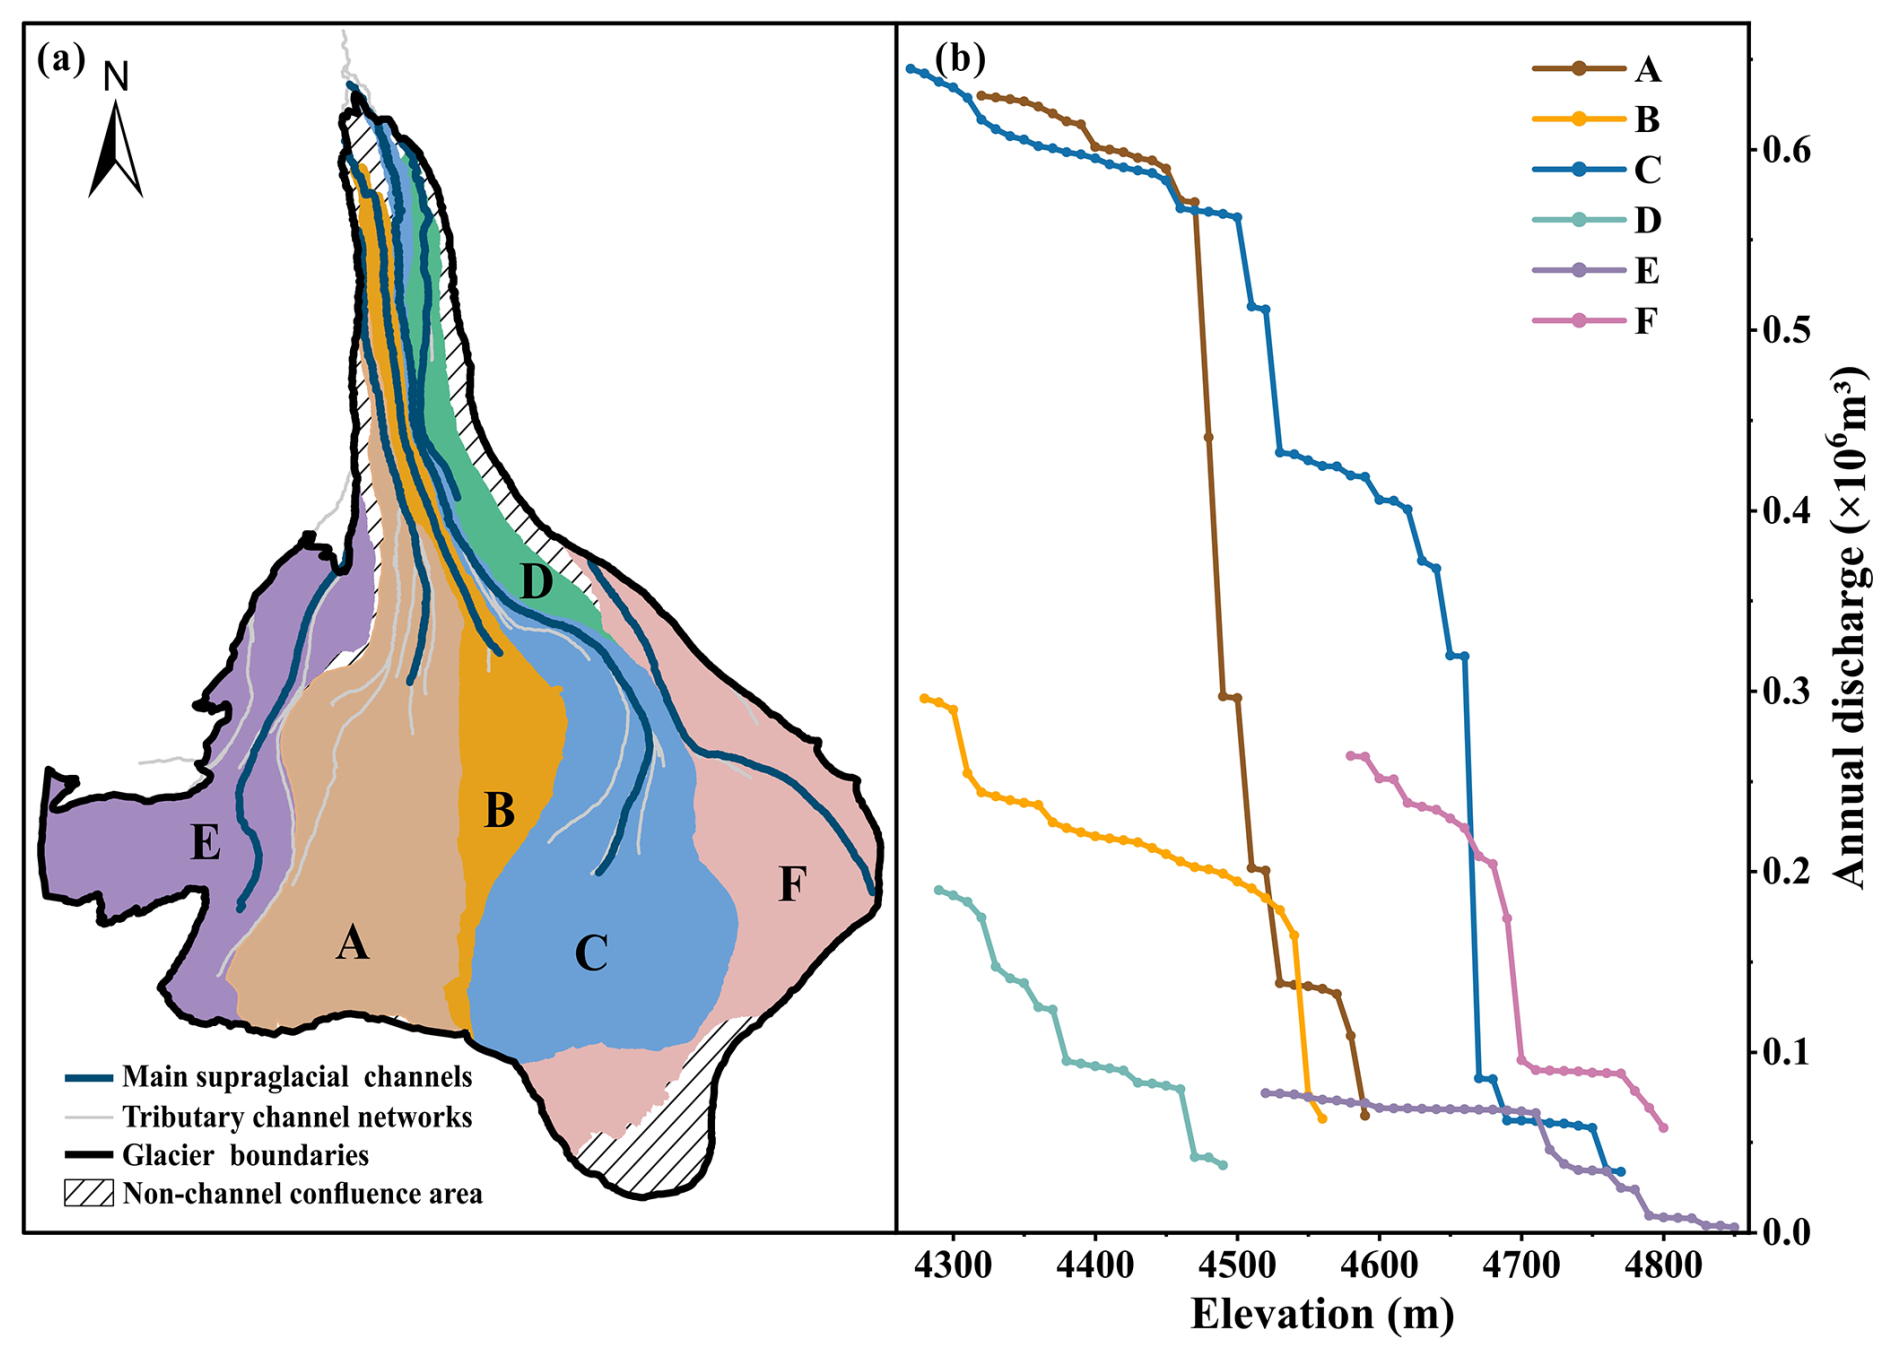
Figure 4(a) Supraglacial channel network over the Qiyi Glacier and (b) variations in the annual discharge of six main supraglacial channels with elevation changes at a 10 m elevation interval. The catchment areas of the main channels are filled with different colors.
2.4 Calculation of the annual glacial discharge transported by supraglacial channels
Excluding the negligible glacier mass loss due to surface sublimation, the annual meltwater yield of a given pixel (5 cm × 5 cm) on the glacier can be estimated as follows:
where P0 is the precipitation at the glacier terminus based on field observations, MB and H represent the glacier mass balance and the elevation of the pixel, mass balance is expressed in millimeters water equivalent (mm w.e.), with negative values indicating mass loss. 4310 (m) means the elevation of the glacier terminus, S denotes the area of the pixel, and 6.8 mm (100 m) is the precipitation gradient regressed from rain gauge networks on the Qiyi Glacier (Jiang et al., 2010).
From the nine ablation stakes across the glacier with long-term mass balance (MB) measurements, the MB of all pixels was calculated using spatial extrapolation (Fig. 3a). The stakes were measured at annual intervals. Several new ablation stakes were installed on 20 July 2022, and subsequently measured and maintained on 24 August 2023. Detailed information for each stake data, including stake ID, position, elevation, and mass balance records, are provided in Supplement (Table S1). The uncertainty of the mass balance based on the ablation stakes is discussed in detail in Sect. 4.2.
Because our rain gauge observations at the glacier terminus were not collected every year, precipitation data from a neighboring weather station (Tuole Station, ∼70 km from the Qiyi Glacier) were used to establish a relationship to reconstruct the precipitation at the glacier terminus. Comparisons between two sets of precipitation data during the period 2006–2013 (Fig. 3b) showed a good linear relationship, with the coefficient of determination (R2) value as high as 0.967; therefore, the annual precipitation (P0) of 2023 at the glacier terminus (4310 m) can be inferred from the precipitation data at the Tuole station (Pt) as follows:
Equations (1) and (2) were used to calculate the meltwater yield for each pixel. From the upper to the lower glacier, the volume of discharge transported by the ice channel at each 10 m elevation decrease can be determined from watershed analysis by placing outlets at each elevation interval (10 m).
2.5 Statistical modeling methods
Pearson's correlation (r) and Spearman's rank correlation (ρ) were used to analyze the correlation between the morphological characteristics of the supraglacial channels and the annual meltwater discharge transported by these channels at different elevations. Because previous studies found that the total energy of the flowing water (including pressure energy, gravitational potential energy, and kinetic energy) is the initial driving force for the channel formation (Rodríguez–Iturbe et al., 1992) and that discharge and slope are the most influential fluvial factors (St Germain and Moorman, 2019), here we took the product of gradient G and annual discharge Qa as the water potential energy factor GQa in the correlation analysis.
In addition to the water flow conditions (discharge and water potential energy), the morphology of supraglacial channels is influenced by other factors, such as pre-existing ice structure (e.g. fractures and moulins), thermal differences (ice and water temperatures and channel frictional heat), topographic relief (slope, roughness, and surface albedo), and ice velocity (Pitcher and Smith, 2019). To eliminate the influence of discharge and water potential energy, Qa and GQa were used as control variables to conduct a partial correlation analysis for each pair of morphological characteristics.
The fitting model was developed using only morphological characteristics that showed a strong correlation with the discharge, and the regression methods included simple linear regression, stepwise regression, and nonlinear least squares (NLS). The coefficient of determination (R2), root mean square error (RMSE), mean absolute error (MAE), and normalized root mean square error (nRMSE) evaluated the performance of the fitting models. Specific details of the regression model and error analysis can be found in Sects. 3.4 and 4.2.
3.1 Supraglacial channel network and annual discharge
The watersheds of the six main supraglacial channels covered 92.02 % of the total area of the Qiyi Glacier (Fig. 4a) with an annual discharge volume of about 2.4×10⁶ m3 (each ranging from 0.07–0.66×10⁶ m3), which contributed 89.43 % to the total meltwater of the glacier surface (2.68×10⁶ m3) during the hydrological year from August 2022 to August 2023. Approximately 63.21 % of the channel discharge was transported to the glacial terminus (by channels A, B, C, and D). In particular, the discharge in the lower reaches of channels A and C was significantly higher than that in the other channels (Fig. 4b), accounting for approximately 45.30 % of the total glacial discharge. Channel F was the only river that was newly formed during the summer of 2023 because two separate smaller catchments merged into one larger catchment, reflecting how supraglacial rivers reshape the surface topography in a short period as meltwater flow increases.
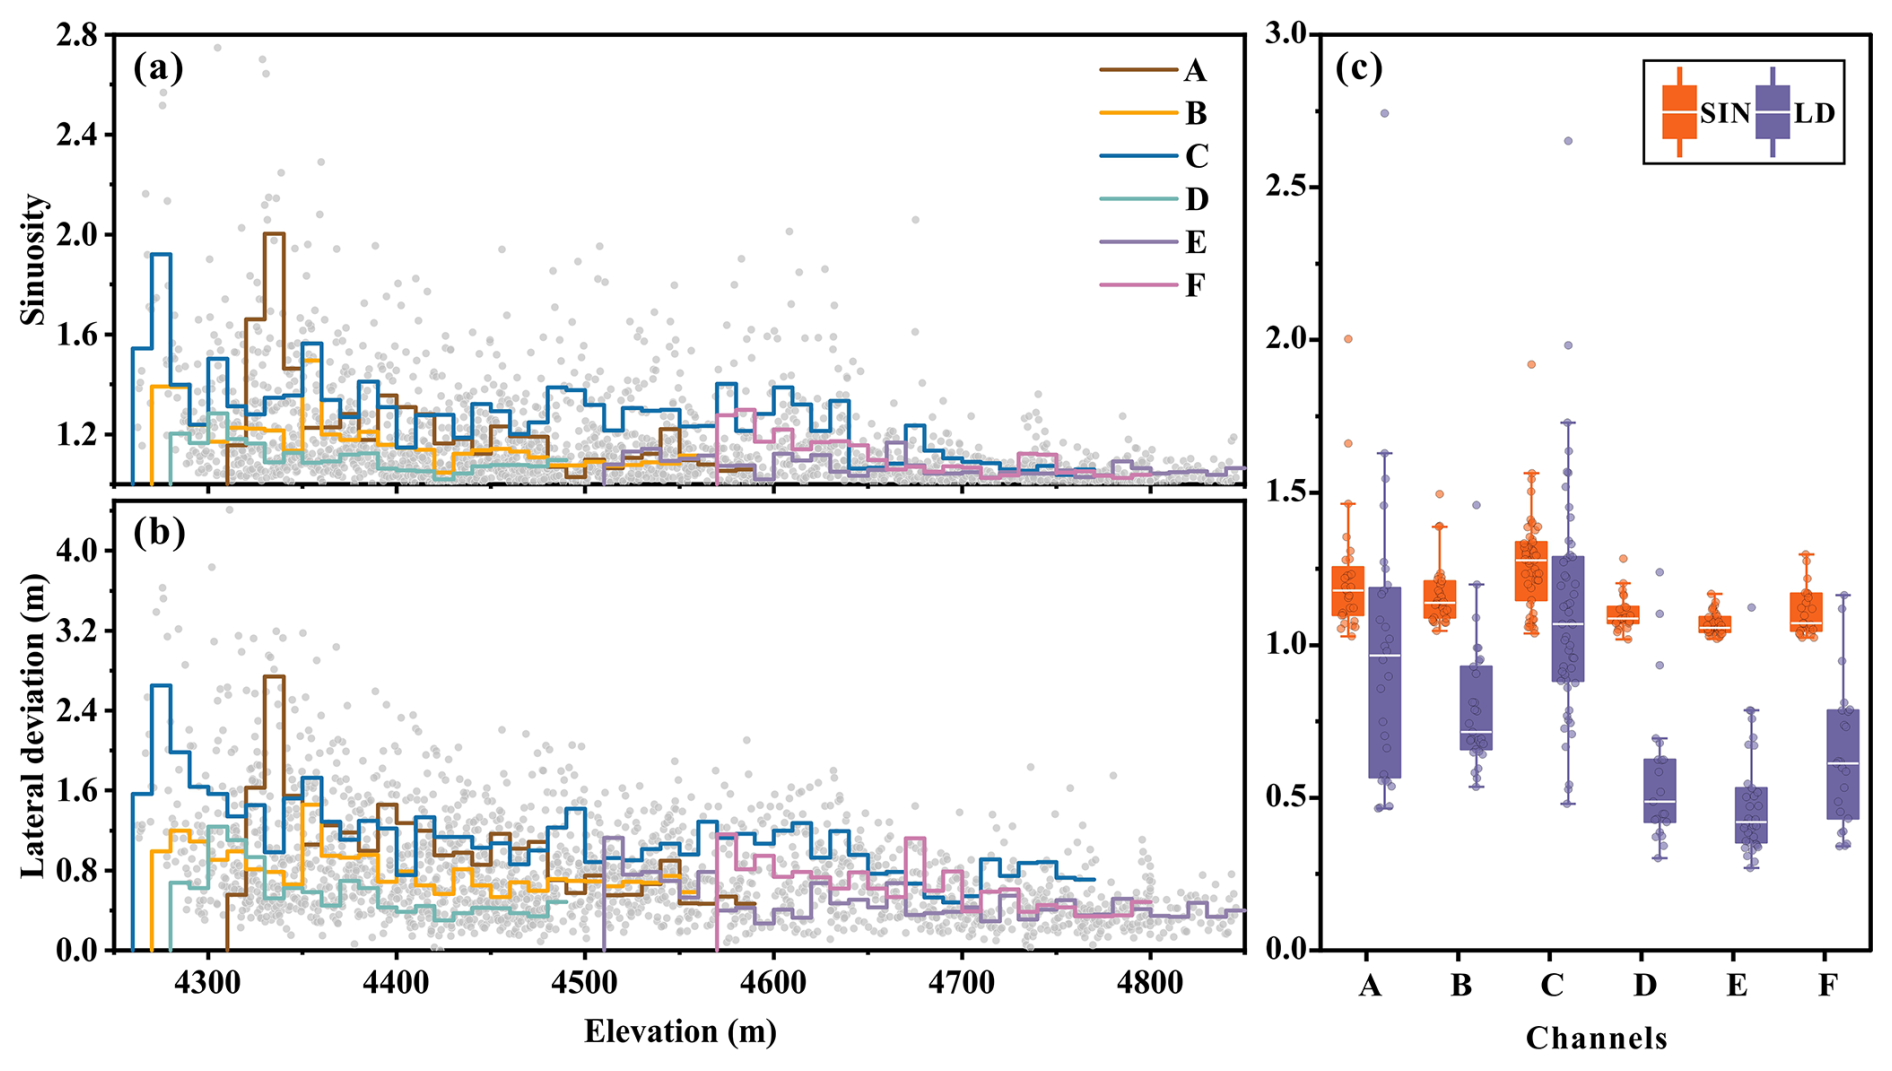
Figure 5Variations in the (a) sinuosity and (b) lateral deviation of six supraglacial channels (gray dots indicate values at each meandering) and their mean at a 10 m elevation interval (colored stairs); (c) box plot of 10 m average sinuosity and lateral deviation for six supraglacial channels, where the box represents the interquartile range (IQR), the whiskers denote 1.5 times the IQR from both ends of the box, and the white horizontal line shows the median; the labeling A to F corresponds to channels A to F as shown in Fig. 4a.
3.2 Spatial variability of morphological characteristics of supraglacial channels
3.2.1 Variations in the sinuosity and lateral deviation
The mean sinuosity and mean lateral deviation integrated with a 10 m elevation interval show similar variation trends among the six main supraglacial channels, and both are lower in the upper reaches and higher in the lower reaches (Fig. 5a and b). The median of 10 m average sinuosity and lateral deviation ranges from 1.05 to 1.27 and 0.42 to 1.06, respectively. The maximum sinuosity and lateral deviation were observed near the outfalls of channels C (2.75) and D (4.41), respectively. In general, channels with relatively higher discharge (channels A and C) tended to have larger sinuosity and lateral deviation in both their median and mean, while those with relatively lower discharge (e.g., channels D and E) had lower sinuosity and lateral deviation (Fig. 5c), suggesting a possible positive correlation between the discharge and sinuosity/lateral deviation of the supraglacial channel.
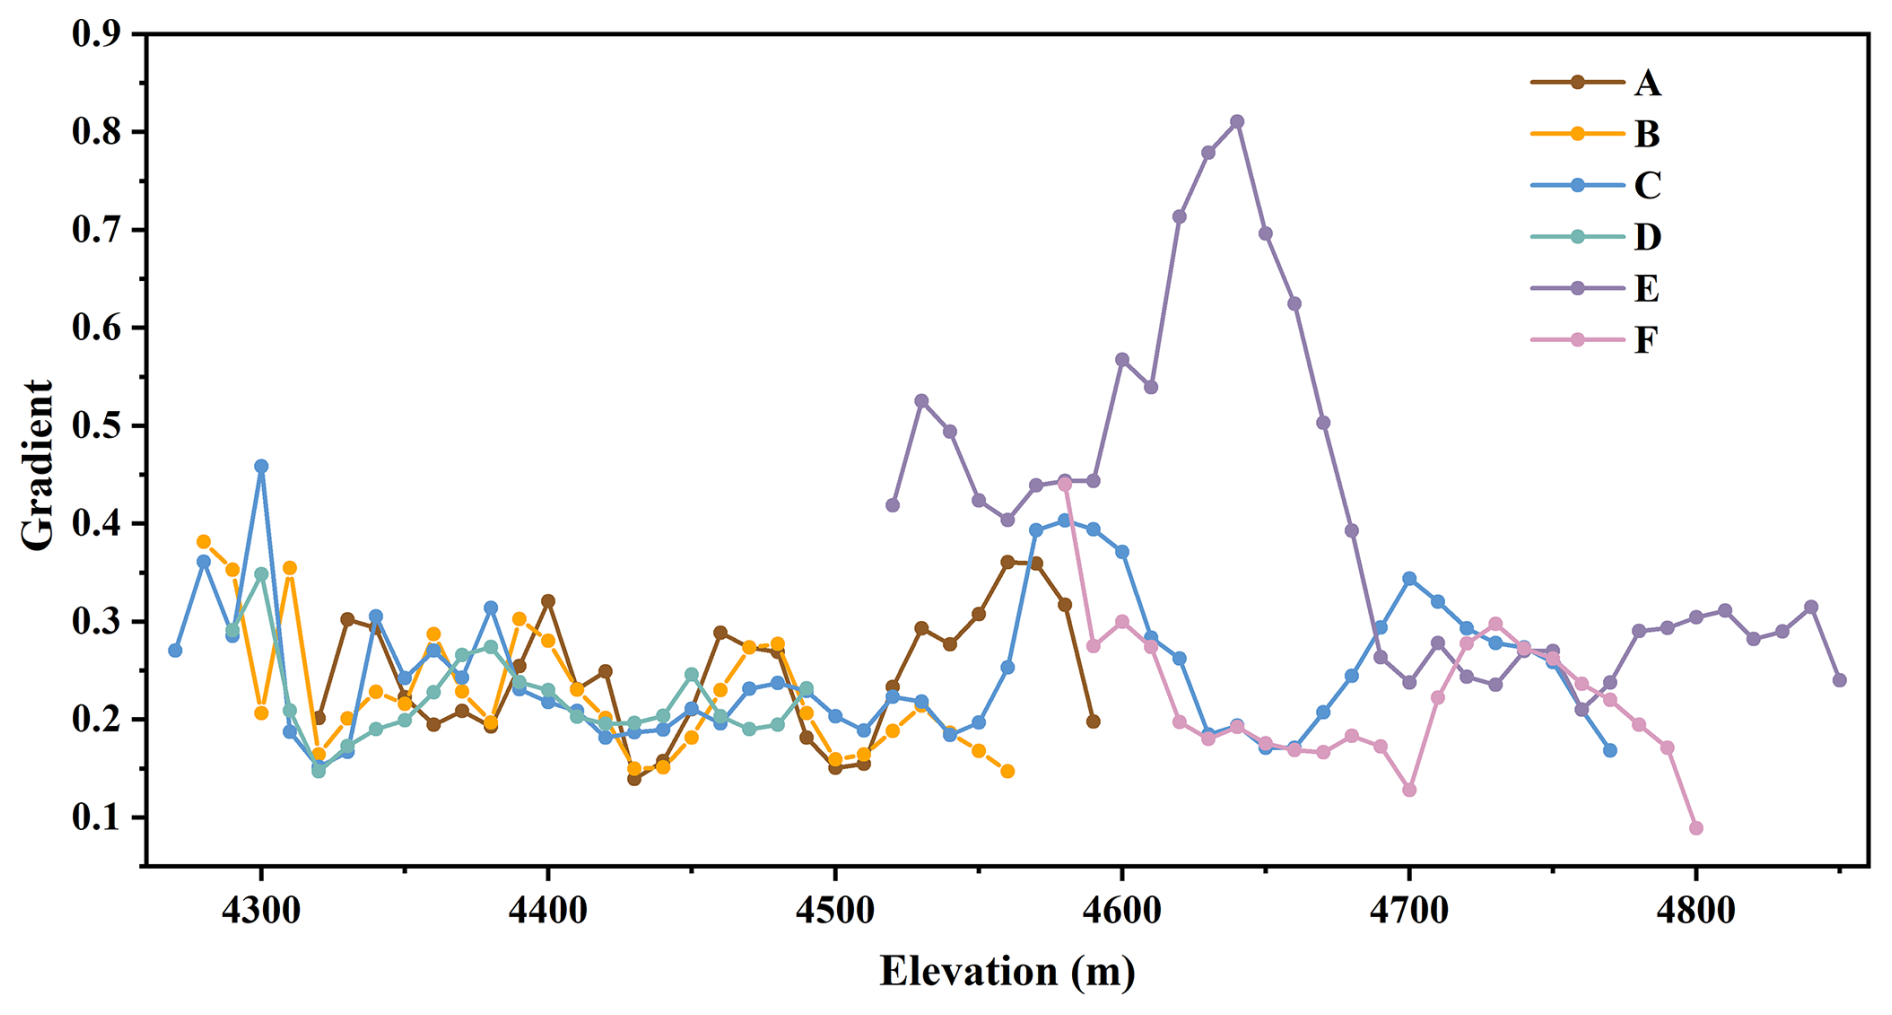
Figure 6Variations in the gradient of six supraglacial channels with elevation at a 10 m interval (the labeling A to F corresponds to channels A to F as shown in Fig. 4a).
3.2.2 Variations in the channel gradient
The incision depth (no more than 1 m) of supraglacial rivers is much shallower than the ice thickness of the Qiyi Glacier (tens to hundreds of meters), which implies that their incision ability is relatively limited. Changes in the gradients of the six supraglacial channels showed a relatively consistent pattern because they were influenced by the complex undulating topography of the glacier surface (Fig. 6). The mean gradient of the six supraglacial channels ranges from 0.22 to 0.41, with channel E having the steepest mean gradient. For a 10 m elevation interval, the maximum channel gradient (0.81) was observed at an elevation of 4640 m in channel E, while the minimum channel gradient (0.09) was found in channel F near the glacier-covered mountain pass.
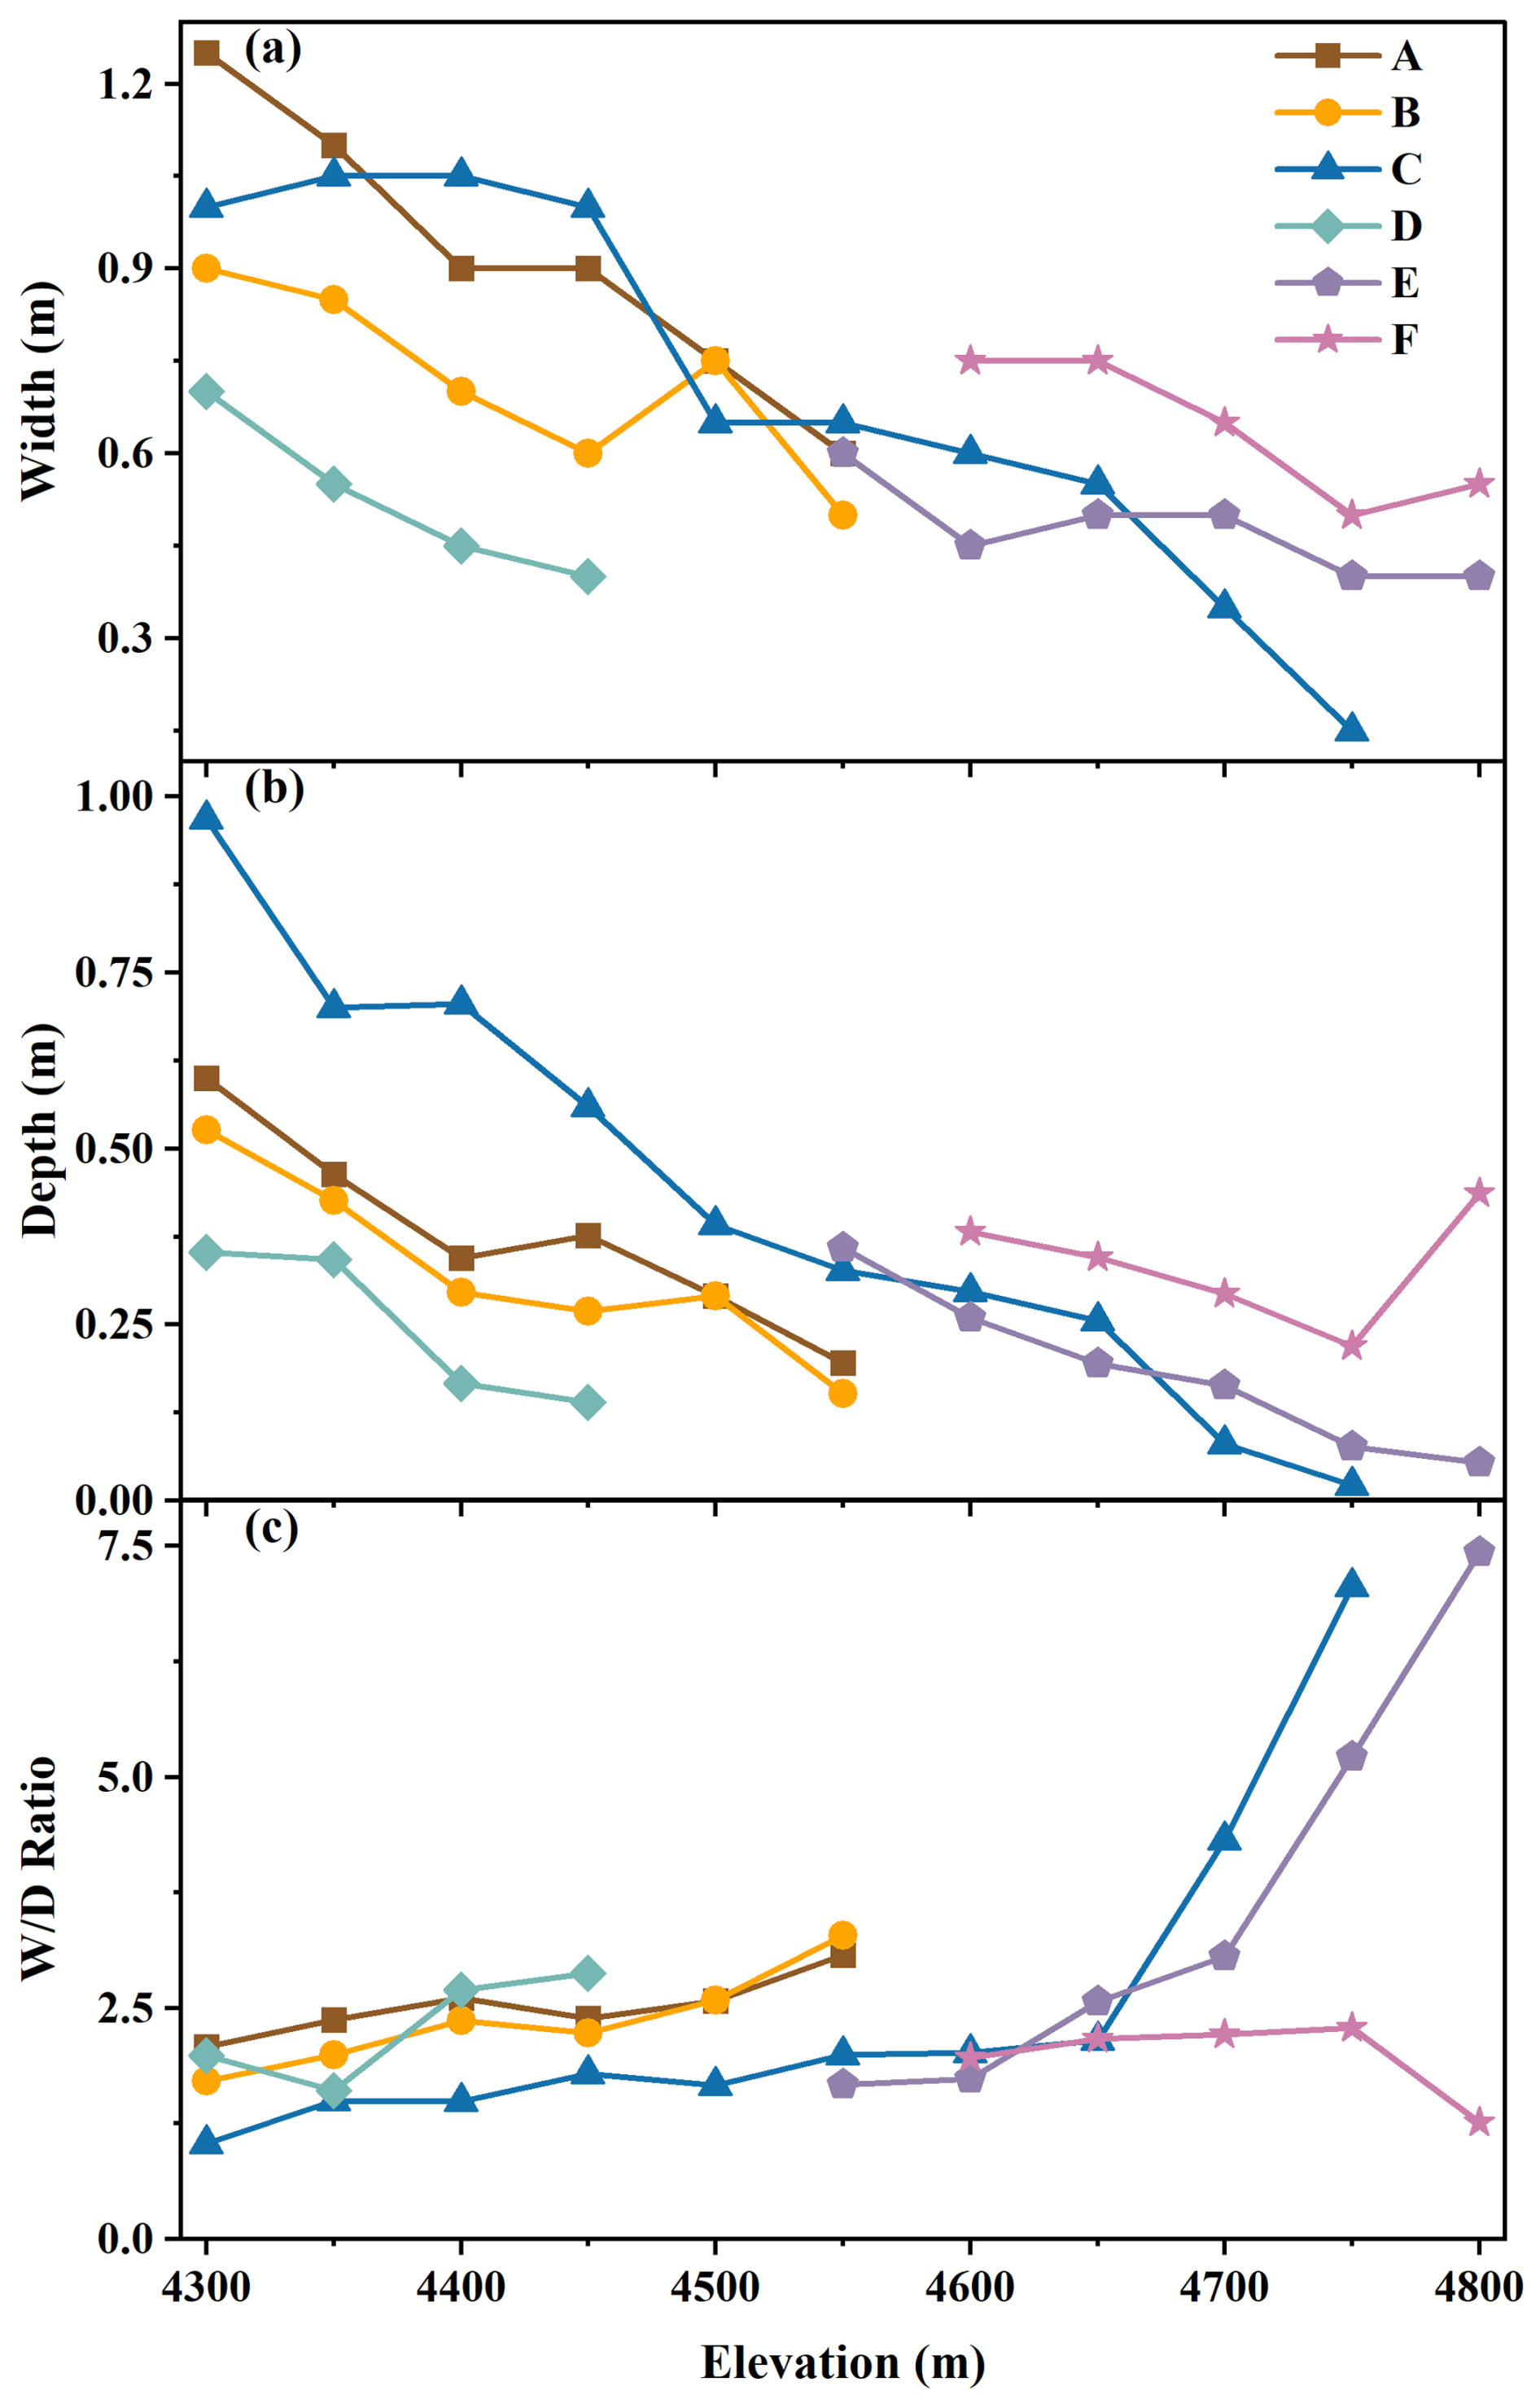
Figure 7Variations in (a) width, (b) depth, and (c) ratio of six supraglacial channels with elevation changes at a 50 m elevation interval.
3.2.3 Variations in the geometry of the channel cross section
Both channel width and depth of all six supraglacial channels generally show decreasing trends with increasing elevation (Fig. 7a and b), with the maximum channel width and depth (1.25 and 1.00 m, respectively) observed near the channel outfall at the glacier terminus. In general, for a given channel, its width increases with depth and vice versa; however, exceptions are found for the lower reaches of channel C, which does not have the widest channel near the outlet with the deepest channel. Another noteworthy point is that, instead of the outlet, channel F has the deepest and relatively wider channel at its headwater at 4800 m a.s.l., possibly because its headwater is a shallow supraglacial lake over a relatively flat mountain pass that provides warmer meltwater to the channel.
Assuming a constant ratio of water depth to channel depth (water depth + Δh), the ratio of width to Δh was calculated as a surrogate for the true channel width depth () ratio. In general, the ratio increased with elevation for all channels, except the upper reaches of channel F, which may have been influenced by the supraglacial lake at the headwater (Fig. 7c). The distribution pattern of the ratio with elevation suggests that regions with a larger discharge in the lower part of the glacier may experience stronger downward erosion than lateral erosion.
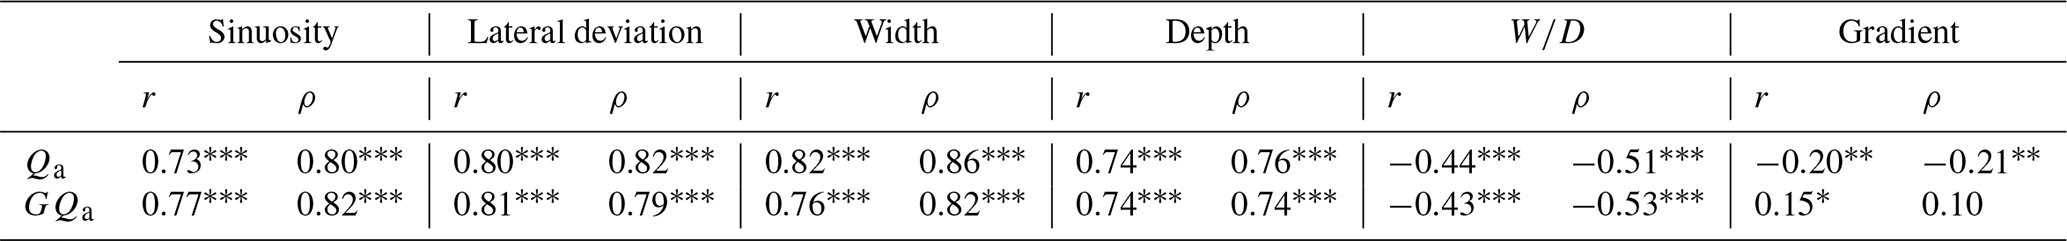
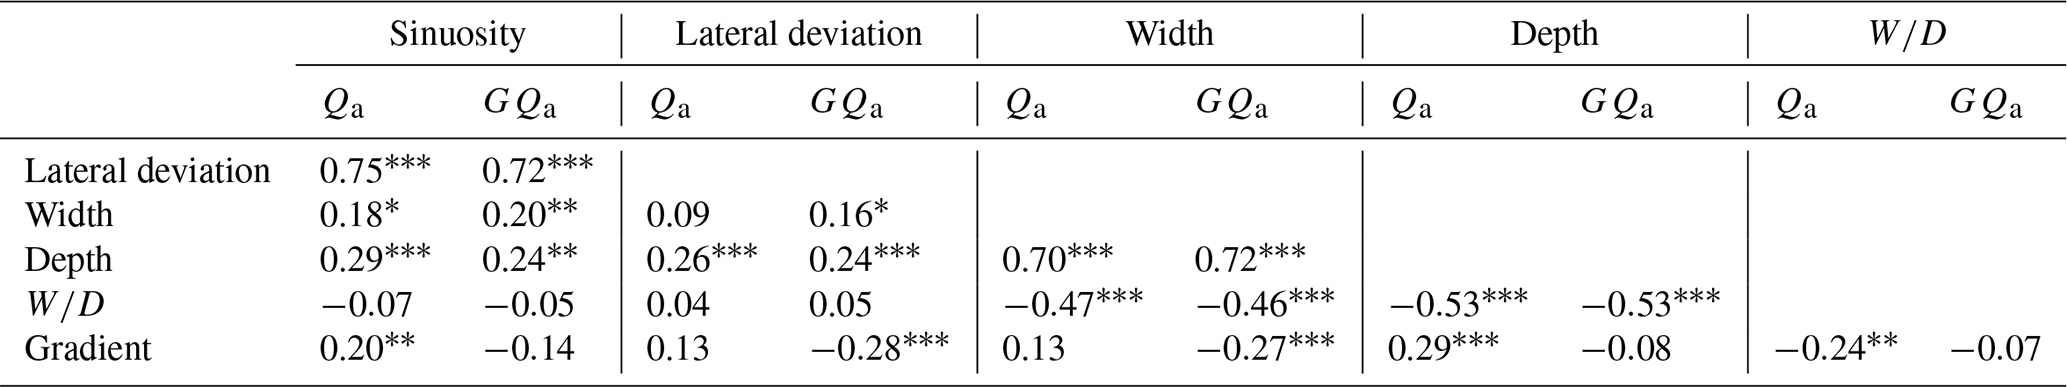
Table 1Pearson's (r) and Spearman's rank (ρ) coefficients of geometric parameters with discharge Qa and water potential energy GQa, all coefficients that are significant at a minimum level of 0.05, 0.01, and 0.001 are labeled with *, **, and ***, respectively.
3.3 Relationships between channel geometry and annual discharge
Both the Pearson and Spearman correlations showed that annual discharge (Qa) was significantly positively correlated with sinuosity, lateral deviation, channel width and depth, but significantly negatively correlated with width to depth ratio () and gradient (Table 1). The water potential energy (GQa) showed a correlation pattern similar to that of discharge. Among all the geometric parameters, channel width showed the strongest correlation with discharge in both Pearson (r=0.82) and Spearman (ρ=0.86) correlation analyses, followed by lateral deviation (r=0.80, ρ=0.82), which was very similar to those of water potential energy despite of some slight differences. This suggests that both the channel profile and the meander of supraglacial channels were closely correlated with the discharge and water potential energy, and thus could be considered as indicators of changes in them.
Partial correlation analysis, after excluding the effects of discharge and water potential energy, further revealed an inherent connection between the geometric parameters (Table 2). When discharge was considered the control variable, the highest correlation coefficient was found between sinuosity and lateral deviation (0.75), followed by that between width and depth (0.70). When water potential energy was used as the control variable, the highest correlation was observed between width and depth (0.72), as well as between sinuosity and lateral deviation (0.72). Regardless of whether discharge or water potential energy was used as the controlling factor, after removing their influence, strong correlations remained between sinuosity and lateral deviation, width and depth, indicating that both channel meander and profile characteristics exhibited stable internal variation patterns. Furthermore, the relatively weak correlation between channel meander characteristics and width or depth showed that their variations may not be synergistic, and thus can be jointly used to estimate discharge. These findings provided a crucial reference for the selection of independent variables in discharge regression models.
3.4 Regression models of annual discharge of the supraglacial channels
As stated in Sect. 2.5, both linear and nonlinear regression models were used to fit the annual discharge Qa of the supraglacial channels using geometric parameters with significant correlations with Qa. For the linear regression method, all variables were initially included to obtain an optimal fit of Qa; then, a stepwise regression method was used to establish a more efficient linear fitting formula by excluding variables with minimal impact on the regression results. For the nonlinear regression method, the focus was on the robustness of the NLS model, which was fitted using a minimal number of parameters that are easier to obtain without significantly reducing the simulation results.
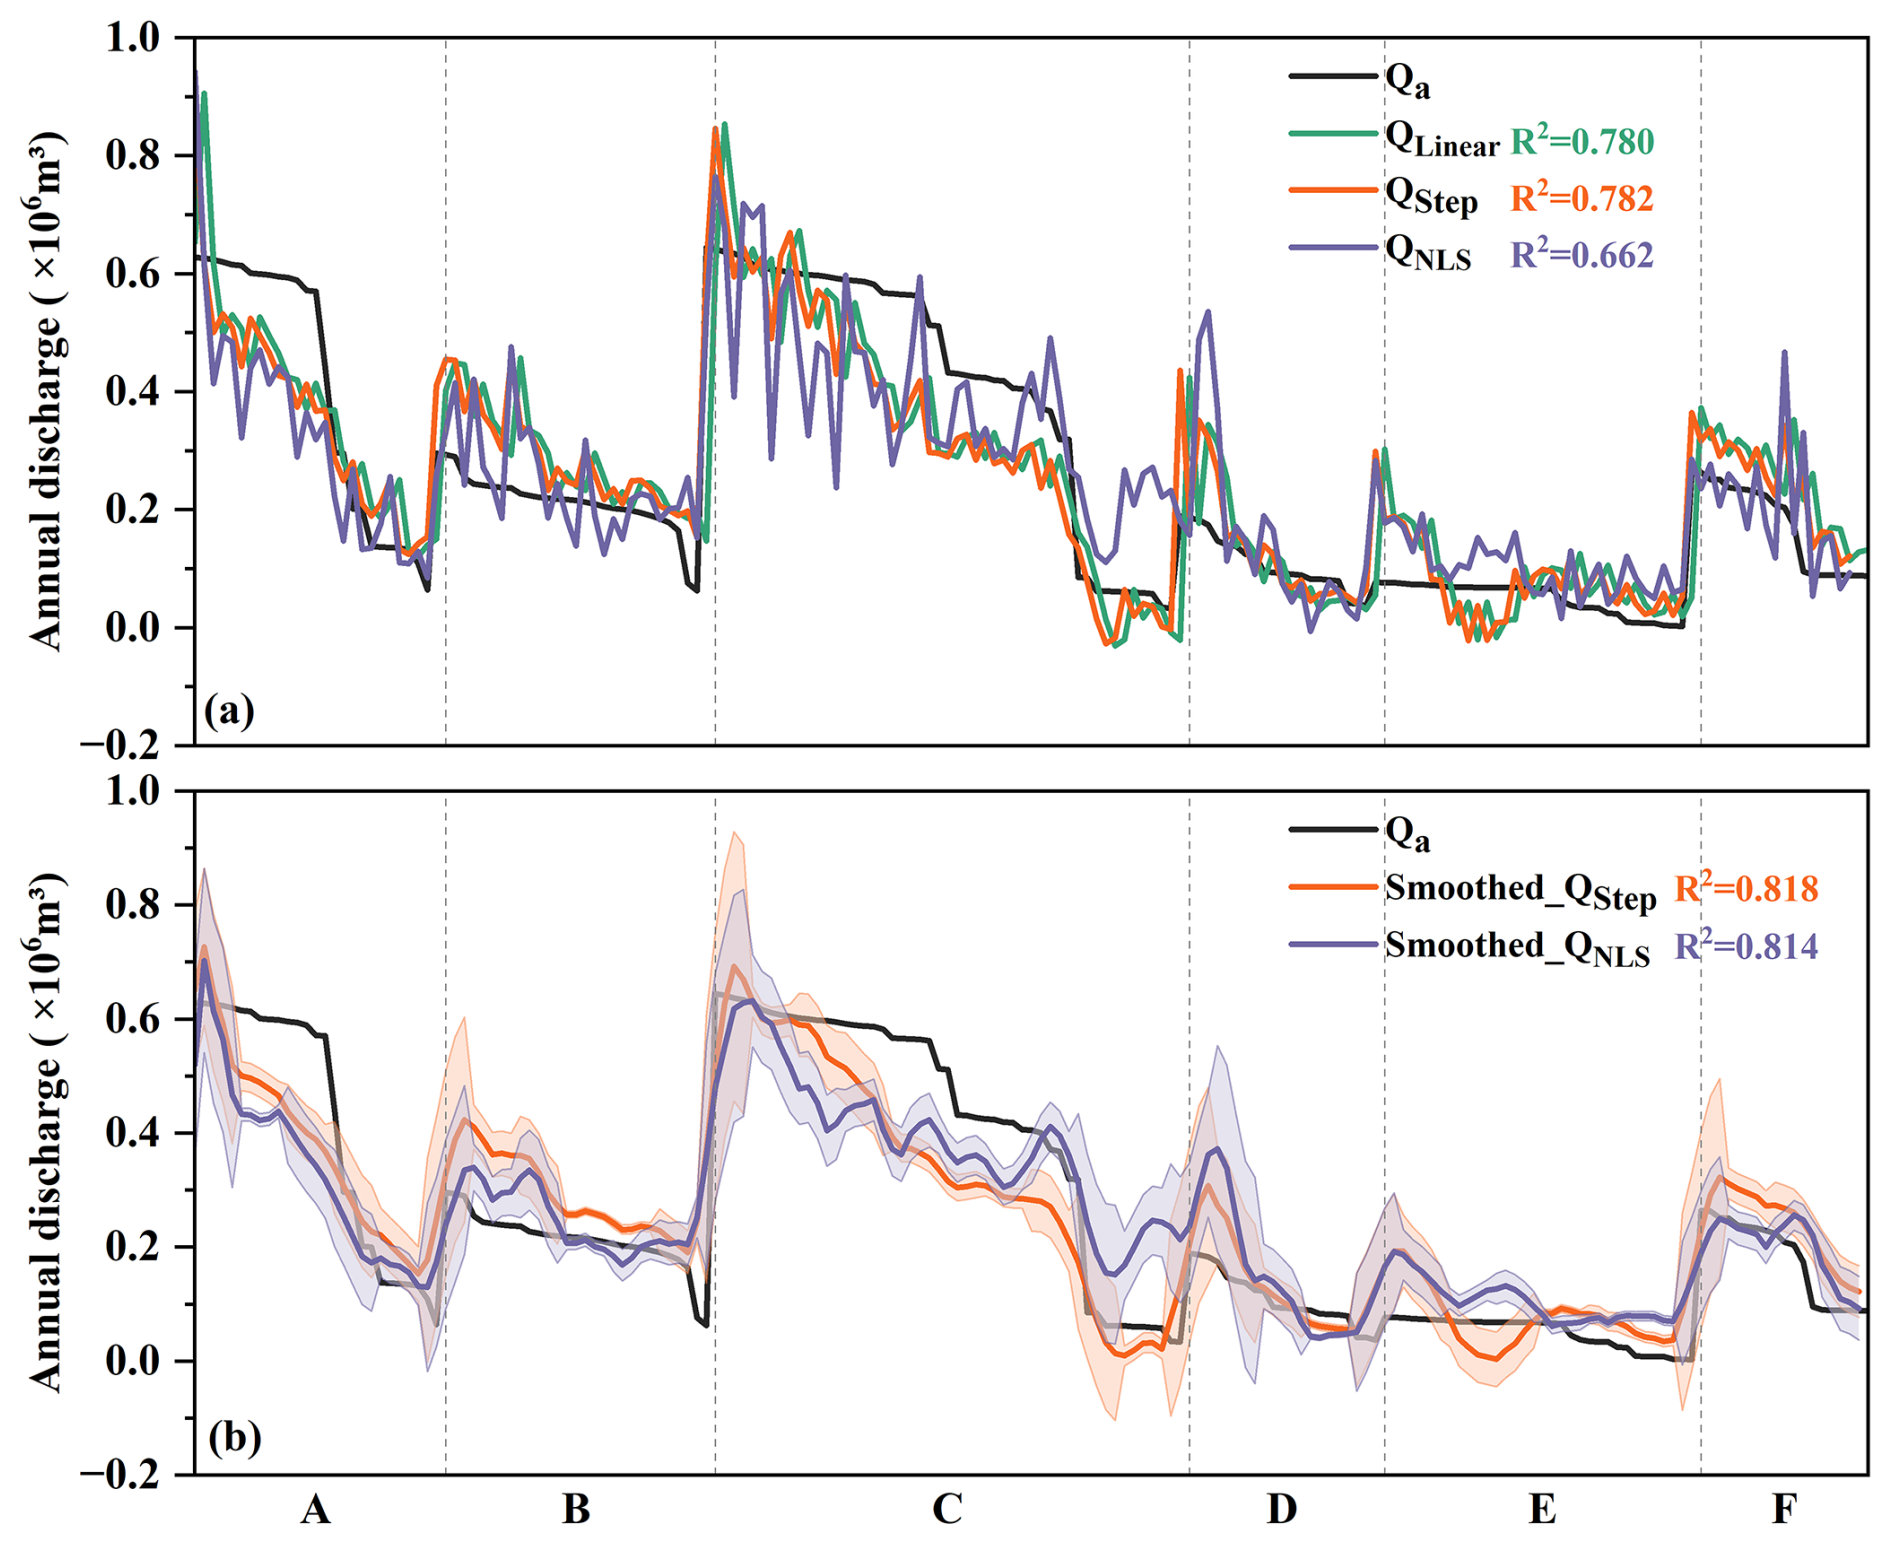
Figure 8Comparison between observed annual discharge (Qa) and (a) original results and (b) five-point moving average fitted results using linear, stepwise, and NLS regression models. The shaded error bands indicate twice the standard deviation range. The x axis is arranged at an order of increasing elevation for each channel meander, and each channel is divided by vertical gray dashed lines.
As illustrated in Fig. 8a, the linear regression model incorporating all variables (SIN, LD, G, W, D, β, and Elevation) showed a similar R2 value to that of the stepwise regression model including only LD, G, and W (0.780 vs. 0.782), with RMSE of 0.096 and 0.097×10⁶ m3, MAE of 0.077 and 0.076×10⁶ m3, and nRMSE of 10.64 % and 10.60 %, respectively. This indicates that the inclusion of Elevation, D, and β in the linear regression model does not improve the explanation of the variation in the annual discharge. The stepwise regression model was expressed as follows:
In contrast to the difficulty in obtaining width W in Eq. (3) from high-spatial-resolution satellite images, LD and SIN are the most easily and accurately extracted supraglacial channel characteristics from the digitized river network. According to the correlation analysis described in Sect. 3.3, the r values of LD and SIN with GQa were both improved compared with those of Qa, particularly for LD, which showed the highest r value with GQa. Therefore, it may be more appropriate to develop a regression model using a nonlinear relationship. LD was selected as the independent variable using a simple linear regression model.
where a and b are the regression coefficients. The nonlinear equation can be obtained by transforming Eq. (4) as follows:
where the regression coefficients are a=0.108, , and c=0.137 in our study area and QNLS is the annual discharge predicted using the nonlinear model. The R2, RMSE, MAE, and nRMSE values in Eq. (5) are 0.662, 0.122×10⁶ m3, 0.091×10⁶ m3, and 12.87 %, respectively.
When compared with the observed annual discharge, both the linear and nonlinear models exhibited large fluctuations. Therefore, the stepwise and NLS methods were smoothed using a five-point moving average, and the filtered results were more consistent than the original curves, with R2 increasing to 0.818 and 0.814, respectively. Their RMSE, MAE, and nRMSE values were 0.091 and 0.099×10⁶ m3, 0.073 and 0.077×10⁶ m3, and 12.58 % and 15.11 %, respectively. The NLS model is more robust and can be more widely applied as its input parameters require only LD and the channel gradient G, which can be easily calculated from the DEM data.
Smith et al. (2015) highlighted that the processes of meltwater generation, storage and transport on the surface of the Greenland Ice Sheet “remain one of the least studied hydrological processes on Earth”. This knowledge gap is also significant for mountain glaciers. The extreme lack of field observations and challenges associated with data collection have resulted in significant uncertainties in our understanding and estimation of meltwater discharge volume from mountain glaciers, particularly in the Tibetan Plateau region. Previous studies have primarily estimated supraglacial runoff through direct discharge observations or runoff models driven by meteorological data (Muthyala et al., 2022; Yang et al., 2019). Yang and Smith (2016) demonstrated that catchment area is a dominant control on runoff, with larger basins generally producing greater discharge. However, when catchments originate from high elevation mountain glaciers, steep and complex glacier surfaces may weaken the dominant relationship between catchment area and glacier runoff. The supraglacial channel morphology is more strongly influenced by local topography, which is one of the reasons we retained gradient as a variable. Building on established physical principles, given the significant correlations of Qa and GQa with the geometric parameters of the supraglacial channels (Tables 1, 2 and Fig. 8a, b), we innovatively used these geometric parameters to predict the surface meltwater discharge in mountain glacier and establish quantitative relationship between supraglacial channel geometry and annual glacier runoff. Our results are significant for estimating meltwater discharge over mountain glaciers with complex topography. In the following sections, we will further discuss the uncertainties of the supraglacial channel parameters, limitations of the regression models, and the applicability of these models.
Table 2The partial correlation coefficient between each two geometric parameters, with discharge Qa and water potential energy GQa as control variables. Significance levels of 0.05, 0.01, and 0.001 are denoted by *, **, and ***, respectively.
4.1 Uncertainties in supraglacial channel parameters
The sinuosity and lateral deviation of supraglacial channels can be derived from DEM data based on hydrological analysis or digitization of the orthomosaic map (Fig. 2a). If the spatial resolution requirements of visible-light images are satisfied, the sinuosity and lateral deviation are the easiest parameters to obtain. However, the identification of other parameters such as river width, depth and gradient requires DEM data with a higher spatial resolution (Fig. 2b). While the width is discernible in certain regions from visible light images (e.g., the wider parts of the river at the lower reaches of the glacier), discriminating the spectral character between the narrower channel and the adjacent bank over the upper and middle parts of the glacier remains a challenge, making it difficult to extract complete width data across the entire glacier based on the visible light image alone.
In addition, during the glacial ablation season, part of the supraglacial river channel is often occupied by flowing water, making it difficult to derive the true channel depth from UAV-based DEM data. Therefore, the UAV-based depth (Δh) represents the channel depth by considering the water surface as the “bottom” of the glacier (Fig. 2b). This might exert a greater influence in the shallower channel over the upper glacier but a relatively minor influence for the deeper channel over the lower parts. This study assumes a constant ratio of true channel depth to depth above the water surface (i.e., Δh), although this assumption inevitably introduces some error when compared to actual conditions. Furthermore, the channel depth was not included in the stepwise regression model, but this does not necessarily mean that the true channel depth cannot improve the predictive ability of the regression model. Nevertheless, the depth of the supraglacial channel depends on centimeter-level DEM data, which remains a challenge given the current development trend of high-resolution commercial optical satellites.
The channel gradient must also be derived from DEM data. In regions without UAV data, deriving the channel gradient from lower resolution DEMs (e.g., 30 m GDEM, SRTM) requires careful evaluation. Therefore, sinuosity and lateral deviation are currently the most promising and accurate supraglacial channel parameters that can be obtained using commercial optical satellite imagery at centimetre scale resolution.
4.2 Uncertainties in the calculation of glacier annual discharge and regression model
The reliability of glacier discharge calculations depends heavily on the accuracy of the observed glacier mass balance and precipitation data. The estimation of the distributed glacier mass balance is hampered by a lack of true validation values, which complicates the error assessment of spatial patterns in mass balance calculations based on single-point measurements of ablation stakes (Kaser et al., 2006; Xu et al., 2019). Specifically, the uncertainties of stake-based mass balance can be classified into three groups: (1) errors in field observations; (2) errors related to spatial extrapolation over the entire glacier; and (3) error due to unaccounted interannual changes in glacier area (Dyurgerov et al., 2002). Among these, (1) is very small (centimeter scale) and negligible at the annual scale, and (3) typically arises in multi-year studies. Since this study focuses solely on Qiyi Glacier's 2023 data, it is also excluded. The primary error is spatial extrapolation from ablation stakes, which typically requires higher resolution DEMs (e.g., obtained by TLS laser scanning (Xue et al., 2024)) for assessment, but such data were unavailable for Qiyi Glacier in 2022–2023 due to the absence of the UAV-derived high-resolution DEM in 2022. However, given the geographic proximity, similar glacier types, and comparable elevation range covered by stakes, we adopted the error assessment from Urumqi Glacier No.1 reported by Xu et al. (2019) as a reference, where the error of traditional stake-based mass balance was about ±0.12 m w.e., within 17 %.
Regarding the error in the precipitation pattern over mountain glaciers, although the elevation effect of precipitation is obtained from in situ precipitation observations, the influence of wind and local topography also introduces some uncertainty in the precipitation distribution. To evaluate the combined effect of uncertainties in mass balance and precipitation on glacier discharge calculations, the meltwater volume of each pixel of the Qiyi Glacier was manually changed by a range of ±5 %, ±10 %, and ±20 % for both stepwise regression and NLS model results. Based on the reference from Xu et al. (2019), we set the maximum uncertainty range of our stake-based mass balance estimates at ±20 %. Under the maximum uncertainty scenario (20 %), when compared with the original models without additional errors, the mean absolute error (MAE) for both stepwise and NLS methods remained very small (0.092 and 0.109×10⁶ m3). The RMSE increased slightly from 0.097 and 0.122×10⁶ m3 to 0.117 and 0.146×10⁶ m3, while the nRMSE rose from 10.60 % and 12.87 % to 19.68 % and 17.06 % (Fig. 9), showing reasonable robustness of the two current regression methods. These results indicate that although spatial extrapolation uncertainty is the dominant error source, it does not affect our finding that channel geometry can be used to estimate glacier runoff.
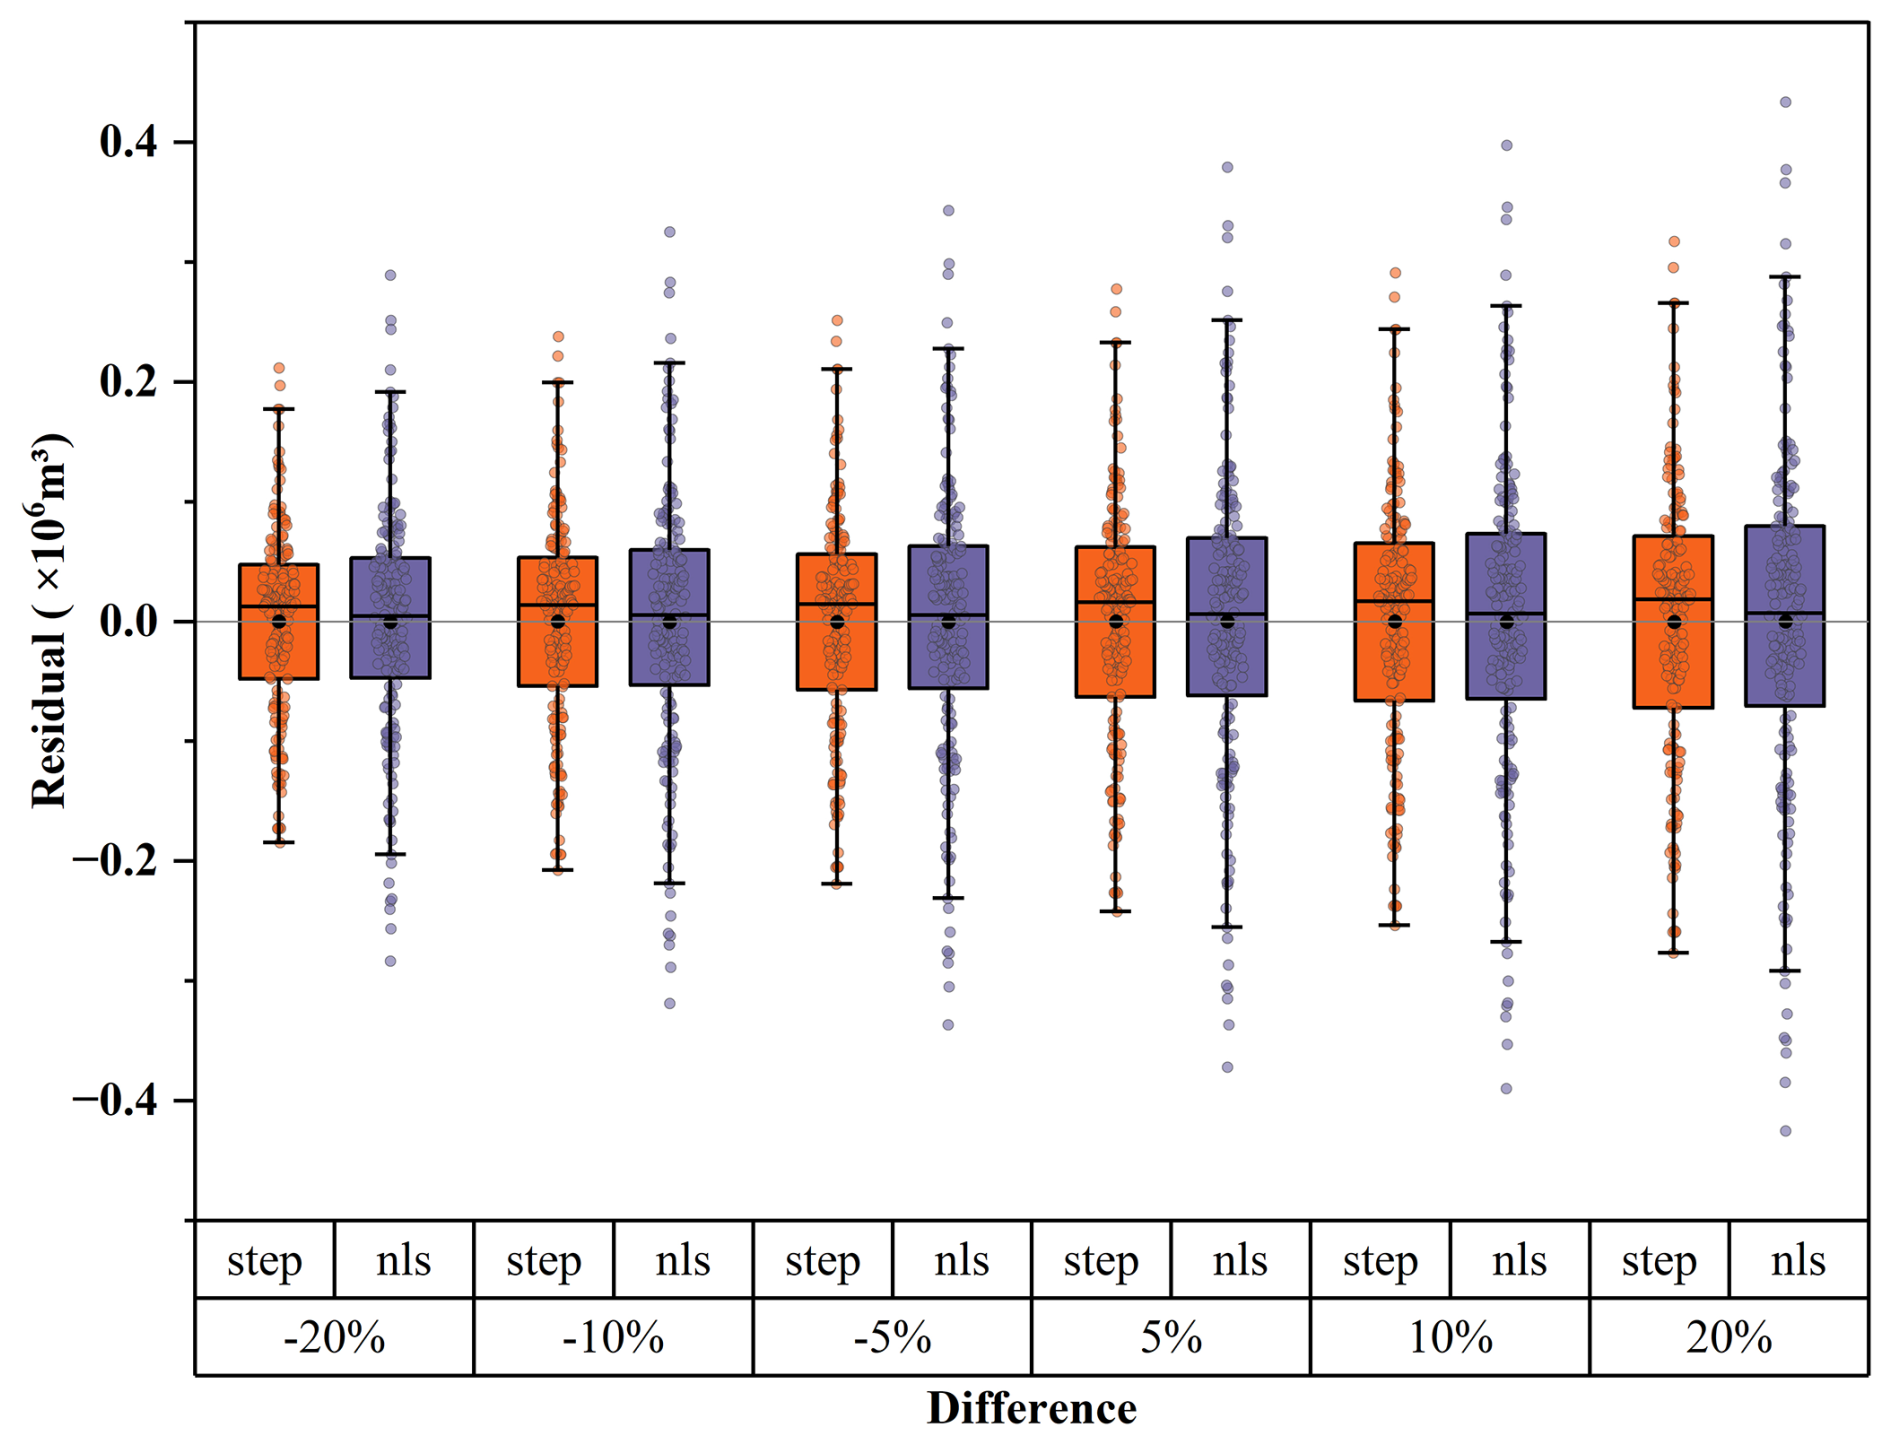
Figure 9Residual distribution for two regression methods under three artificial error scenarios (±5 %, ±10 %, and ±20 %). The black dots and black short lines of the box plots are the mean and median of the residuals, respectively; the whiskers denote 1.5 times the IQR from both ends of the box.
4.3 Limitations of statistical regression methods
There is still a lack of studies on the physical theories of the formation of each morphological characteristic, which hinders us from proposing an ideal nonlinear statistical regression model framework, even after several attempts. For instance, we tried to consider the effect of ice temperature on erosion intensity by incorporating normalized elevation as well as more complex regression models from the physical symbolic optimization (PhySO) framework, but their performance did not improve evidently compared to our simple regression models. According to a theoretical model of channel meander formation (Karlstrom et al., 2013), for a given supraglacial channel with a fixed cross section, runoff, and ice temperature, a bender channel meander tends to produce more heat by flowing water, which favors ice melting and lateral migration at the vertex. This implies that, in addition to the influence of external forces, such as water discharge, the channel morphology itself has a complex self-feedback process. Although Pitcher and Smith (2019) emphasized the importance of integrating thermal forcing models (ice and water temperature), topography, and hydraulic parameters because they are helpful in understanding the physical mechanism behind the formation of supraglacial river systems, the framework of physical-based models or more appropriate forms of nonlinear models that can help improve the performance of predicted discharge using only the geometric parameters of channels are still unavailable.
4.4 Applicability and perspective of regression model
The Qiyi Glacier is a typical subcontinental glacier on the Tibetan Plateau with weak subglacial hydrological processes. As a result, meltwater mainly originates from the glacier surface and flows across the surface, forming a relatively continuous channel network. Thus, we infer that this approach is well suited to polythermal or cold-based glaciers with limited subglacial hydrological activity or surface structures. However, it may be less applicable to maritime glaciers with large crevasses or numerous active moulins, such as those on the southern Tibetan Plateau and the Greenland Ice Sheet. But the model still has positive implications for supraglacial river segments between crevasses and moulins. The drainage areas of supraglacial river segments can be obtained by watershed delineation, and the meltwater discharge of each drainage area can be estimated from their geometry.
It should also be emphasized that, while channel geometric parameters can be derived from remote sensing data alone, the establishment of this regression model require mass balance data for calibrating the coefficients in runoff estimation due to scaling differences among glaciers. Therefore, the broader application of this method to other glaciers must be accompanied by reliable mass balance data.
Accurate estimation of glacier meltwater runoff is of great importance for quantifying the effects of climate change on glacier dynamics and evaluating the impacts of glacier changes on downstream water resource security. Based on high-precision UAV orthophotos and LiDAR data, this study derived a comprehensive supraglacial channel network over the Qiyi Glacier for the first time, from which a series of channel morphological characteristics were used to predict the meltwater discharge using different regression methods. Compared with traditional methods based on field observations or glacier runoff models, our study provides a novel perspective for accurately estimating annual glacier discharge for larger glaciated areas without meteorological and hydrological observations. The stepwise regression model incorporating the parameters of lateral deviation, channel gradient, and width of the supraglacial channel performed better, explaining approximately 78.2 % of the variation in the observed meltwater discharge. The regression accuracy improved to 81.8 % after the five-point moving average filtering. The NLS regression model using only the more readily available parameters of lateral deviation and channel gradient performed slightly less well, explaining 66.2 % of the variation in meltwater discharge, whereas the explained variance was improved to 81.4 % after applying a five-point moving average. In recent years, centimeter-scale multi-satellite constellations with predominantly onboard optical sensors, such as the WorldView Legion satellites, Pelican-2 satellite, and Gen-3 constellation, have become an important development trend. Our study indicated that although the skill of the stepwise regression model incorporating lateral deviation, channel gradient, and width was higher than that of the NLS regression model using only lateral deviation and channel gradient, their performances were nearly the same after five-point moving average filtering. When using centimeter scale resolution satellite remote sensing data to predict glacier meltwater yield over larger areas, it is recommended to use a nonlinear fitting model with a minimum amount of input data and higher reliability.
The UAV-processed data (orthomosaic and DEM), supraglacial channel line vectors, and regression data (including geometric parameters and regression results) are available online (https://doi.org/10.5281/zenodo.15314578; Xie and Wu, 2025).
The supplement related to this article is available online at https://doi.org/10.5194/tc-19-6577-2025-supplement.
Conceptualisation: YW. Methodology: LX, YW, AC. Investigation: LX, YW, AC. Project administration: NW, SZ. Resources: NW, SZ. Software: HS. Visualisation: LX, HS. Writing (original draft): LX. Writing (review and editing): YW.
The contact author has declared that none of the authors has any competing interests.
Publisher's note: Copernicus Publications remains neutral with regard to jurisdictional claims made in the text, published maps, institutional affiliations, or any other geographical representation in this paper. While Copernicus Publications makes every effort to include appropriate place names, the final responsibility lies with the authors. Views expressed in the text are those of the authors and do not necessarily reflect the views of the publisher.
We thank all members who contributed to the field data collection, including but not limited to Huidong Liu, Huiyong Liu, and Jiangtao Chen. We are also sincerely grateful to the editor, Elizabeth Bagshaw, for their attention and support throughout the review process. We further thank Rob Storrar and the anonymous reviewer; their valuable comments and suggestions greatly improved the quality of the manuscript.
This research has been supported by the National Natural Science Foundation of China (grant nos. 42171139 and 42130516), the Second Tibetan Plateau Scientific Expedition and Research Program (grant no. 2019QZKK020102), and the Open Research Fund of National Cryosphere Desert Data Center (grant no. 2024NCDC001).
This paper was edited by Elizabeth Bagshaw and reviewed by Rob Storrar and one anonymous referee.
Beamer, J. P., Hill, D. F., Arendt, A., and Liston, G. E.: High-resolution modeling of coastal freshwater discharge and glacier mass balance in the Gulf of Alaska watershed, Water Resour. Res., 52, 3888–3909, https://doi.org/10.1002/2015WR018457, 2016.
Bell, R. E., Chu, W., Kingslake, J., Das, I., Tedesco, M., Tinto, K. J., Zappa, C. J., Frezzotti, M., Boghosian, A., and Lee, W. S.: Antarctic ice shelf potentially stabilized by export of meltwater in surface river, Nature, 544, 344–348, https://doi.org/10.1038/nature22048, 2017.
Bergstrom, A., Gooseff, M., Fountain, A., and Hoffman, M.: Long-term shifts in feedbacks among glacier surface change, melt generation and runoff, McMurdo Dry Valleys, Antarctica, Hydrol. Process., 35, e14292, https://doi.org/10.1002/hyp.14292, 2021.
Bhardwaj, A., Sam, L., Akanksha, Martín-Torres, F. J., and Kumar, R.: UAVs as remote sensing platform in glaciology: Present applications and future prospects, Remote Sens. Environ., 175, 196–204, https://doi.org/10.1016/j.rse.2015.12.029, 2016.
Bjerklie, D. M., Birkett, C. M., Jones, J. W., Carabajal, C., Rover, J. A., Fulton, J. W., and Garambois, P.-A.: Satellite remote sensing estimation of river discharge: Application to the Yukon River Alaska, J. Hydrol., 561, 1000–1018, https://doi.org/10.1016/j.jhydrol.2018.04.005, 2018.
Bolch, T., Kulkarni, A., Kääb, A., Huggel, C., Paul, F., Cogley, J. G., Frey, H., Kargel, J. S., Fujita, K., Scheel, M., Bajracharya, S., and Stoffel, M.: The State and Fate of Himalayan Glaciers, Science, 336, 310–314, https://doi.org/10.1126/science.1215828, 2012.
Burns, P. and Nolin, A.: Using atmospherically-corrected Landsat imagery to measure glacier area change in the Cordillera Blanca, Peru from 1987 to 2010, Remote Sens. Environ., 140, 165–178, https://doi.org/10.1016/j.rse.2013.08.026, 2014.
Chen, J., Wang, N., Wu, Y., Chen, A., Shi, C., Zhao, M., and Xie, L.: Quantifying Qiyi Glacier Surface Dirtiness Using UAV and Sentinel-2 Imagery, Remote Sens., 16, https://doi.org/10.3390/rs16173351, 2024.
Colgan, W., Steffen, K., McLamb, W. S., Abdalati, W., Rajaram, H., Motyka, R., Phillips, T., and Anderson, R.: An increase in crevasse extent, West Greenland: Hydrologic implications, Geophys. Res. Lett., 38, https://doi.org/10.1029/2011GL048491, 2011.
Curran, J. H., Rick, B., Littell, J. S., and Sass, L. C.: Streamflow Response to Glacier Mass Loss Varies With Basin Precipitation Across Alaska, Water Resour. Res., 61, e2024WR037859, https://doi.org/10.1029/2024WR037859, 2025.
Dall'Asta, E., Forlani, G., Roncella, R., Santise, M., Diotri, F., and Cella, U. M. di: Unmanned Aerial Systems and DSM matching for rock glacier monitoring, ISPRS J. Photogramm. Remote Sens., 127, 102–114, https://doi.org/10.1016/j.isprsjprs.2016.10.003, 2017.
Dehecq, A., Gourmelen, N., Gardner, A. S., Brun, F., Goldberg, D., Nienow, P. W., Berthier, E., Vincent, C., Wagnon, P., and Trouvé, E.: Twenty-first century glacier slowdown driven by mass loss in High Mountain Asia, Nat. Geosci., 12, 22–27, https://doi.org/10.1038/s41561-018-0271-9, 2019.
Dyurgerov, M.: Glacier mass balance and regime: Data of measurements and analysis, Occasional Paper 55, Institute of Arctic and Alpine Research, University of Colorado, Boulder, CO, 2002.
Gleason, C. J., Smith, L. C., Chu, V. W., Legleiter, C. J., Pitcher, L. H., Overstreet, B. T., Rennermalm, A. K., Forster, R. R., and Yang, K.: Characterizing supraglacial meltwater channel hydraulics on the Greenland Ice Sheet from in situ observations, Earth Surf. Process. Landf., 41, 2111–2122, https://doi.org/10.1002/esp.3977, 2016.
Hock, R.: Glacier melt: a review of processes and their modelling, Prog. Phys. Geogr., 29, 362–391, 2005.
Hugenholtz, C. H., Whitehead, K., Brown, O. W., Barchyn, T. E., Moorman, B. J., LeClair, A., Riddell, K., and Hamilton, T.: Geomorphological mapping with a small unmanned aircraft system (sUAS): Feature detection and accuracy assessment of a photogrammetrically-derived digital terrain model, Geomorphology, 194, 16–24, https://doi.org/10.1016/j.geomorph.2013.03.023, 2013.
Huss, M.: Present and future contribution of glacier storage change to runoff from macroscale drainage basins in Europe, Water Resour. Res., 47, https://doi.org/10.1029/2010WR010299, 2011.
Immerzeel, W. W., Kraaijenbrink, P. D. A., Shea, J. M., Shrestha, A. B., Pellicciotti, F., Bierkens, M. F. P., and de Jong, S. M.: High-resolution monitoring of Himalayan glacier dynamics using unmanned aerial vehicles, Remote Sens. Environ., 150, 93–103, https://doi.org/10.1016/j.rse.2014.04.025, 2014.
Immerzeel, W. W., Lutz, A. F., Andrade, M., Bahl, A., Biemans, H., Bolch, T., Hyde, S., Brumby, S., Davies, B. J., Elmore, A. C., Emmer, A., Feng, M., Fernández, A., Haritashya, U., Kargel, J. S., Koppes, M., Kraaijenbrink, P. D. A., Kulkarni, A. V., Mayewski, P. A., Nepal, S., Pacheco, P., Painter, T. H., Pellicciotti, F., Rajaram, H., Rupper, S., Sinisalo, A., Shrestha, A. B., Viviroli, D., Wada, Y., Xiao, C., Yao, T., and Baillie, J. E. M.: Importance and vulnerability of the world's water towers, Nature, 577, 364–369, https://doi.org/10.1038/s41586-019-1822-y, 2020.
Jarosch, A. H. and Gudmundsson, M. T.: A numerical model for meltwater channel evolution in glaciers, The Cryosphere, 6, 493–503, https://doi.org/10.5194/tc-6-493-2012, 2012.
Jiang, X., Wang, N., He, J., Wu, X., and Song, G.: A distributed surface energy and mass balance model and its application to a mountain glacier in China, Chin. Sci. Bull., 55, 2079–2087, https://doi.org/10.1007/s11434-010-3068-9, 2010.
Kääb, A., Berthier, E., Nuth, C., Gardelle, J., and Arnaud, Y.: Contrasting patterns of early twenty-first-century glacier mass change in the Himalayas, Nature, 488, 495–498, https://doi.org/10.1038/nature11324, 2012.
Karlstrom, L., Gajjar, P., and Manga, M.: Meander formation in supraglacial streams, J. Geophys. Res. Earth Surf., 118, 1897–1907, https://doi.org/10.1002/jgrf.20135, 2013.
Kaser, G., Cogley, J. G., Dyurgerov, M. B., Meier, M. F., and Ohmura, A.: Mass balance of glaciers and ice caps: Consensus estimates for 1961–2004, Geophys. Res. Lett., 33, https://doi.org/10.1029/2006GL027511, 2006.
Knighton, A. D.: Asymmetry of river channel cross-sections: Part I. Quantitative indices, Earth Surf. Process. Landf., 6, 581–588, https://doi.org/10.1002/esp.3290060607, 1981.
Kraaijenbrink, P., Meijer, S. W., Shea, J. M., Pellicciotti, F., De Jong, S. M., and Immerzeel, W. W.: Seasonal surface velocities of a Himalayan glacier derived by automated correlation of unmanned aerial vehicle imagery, Ann. Glaciol., 57, 103–113, https://doi.org/10.3189/2016AoG71A072, 2016.
Kraaijenbrink, P. D. A. and Immerzeel, W. W.: Spatial and Temporal Variability of the Surface Mass Balance of Debris-Covered Glacier Tongues, J. Geophys. Res.-Earth Surf., 130, e2024JF007935, https://doi.org/10.1029/2024JF007935, 2025.
Legleiter, C. J., Tedesco, M., Smith, L. C., Behar, A. E., and Overstreet, B. T.: Mapping the bathymetry of supraglacial lakes and streams on the Greenland ice sheet using field measurements and high-resolution satellite images, The Cryosphere, 8, 215–228, https://doi.org/10.5194/tc-8-215-2014, 2014.
Muthyala, R., Rennermalm, Å. K., Leidman, S. Z., Cooper, M. G., Cooley, S. W., Smith, L. C., and van As, D.: Supraglacial streamflow and meteorological drivers from southwest Greenland, The Cryosphere, 16, 2245–2263, https://doi.org/10.5194/tc-16-2245-2022, 2022.
Nie, Y., Pritchard, H. D., Liu, Q., Hennig, T., Wang, W., Wang, X., Liu, S., Nepal, S., Samyn, D., Hewitt, K., and Chen, X.: Glacial change and hydrological implications in the Himalaya and Karakoram, Nat. Rev. Earth Environ., 2, 91–106, https://doi.org/10.1038/s43017-020-00124-w, 2021.
Paul, F., Bolch, T., Kääb, A., Nagler, T., Nuth, C., Scharrer, K., Shepherd, A., Strozzi, T., Ticconi, F., Bhambri, R., Berthier, E., Bevan, S., Gourmelen, N., Heid, T., Jeong, S., Kunz, M., Lauknes, T. R., Luckman, A., Merryman Boncori, J. P., Moholdt, G., Muir, A., Neelmeijer, J., Rankl, M., VanLooy, J., and Van Niel, T.: The glaciers climate change initiative: Methods for creating glacier area, elevation change and velocity products, Remote Sens. Environ., 162, 408–426, https://doi.org/10.1016/j.rse.2013.07.043, 2015.
Pitcher, L. H. and Smith, L. C.: Supraglacial Streams and Rivers, Annu. Rev. Earth Planet. Sci., 47, 421–452, https://doi.org/10.1146/annurev-earth-053018-060212, 2019.
Rabatel, A., Letréguilly, A., Dedieu, J.-P., and Eckert, N.: Changes in glacier equilibrium-line altitude in the western Alps from 1984 to 2010: evaluation by remote sensing and modeling of the morpho-topographic and climate controls, The Cryosphere, 7, 1455–1471, https://doi.org/10.5194/tc-7-1455-2013, 2013.
Ren, S., Jia, L., Miles, E. S., Menenti, M., Kneib, M., Shaw, T. E., Buri, P., McCarthy, M. J., Yang, W., Pellicciotti, F., and Yao, T.: Observed and projected declines in glacier albedo across the Third Pole in the 21st century, One Earth, 7, 1587–1599, https://doi.org/10.1016/j.oneear.2024.08.010, 2024.
Rippin, D. M., Pomfret, A., and King, N.: High resolution mapping of supra-glacial drainage pathways reveals link between micro-channel drainage density, surface roughness and surface reflectance, Earth Surf. Process. Landf., 40, 1279–1290, https://doi.org/10.1002/esp.3719, 2015.
Rodríguez–Iturbe, I., Ijjász-Vásquez, E. J., Bras, R. L., and Tarboton, D. G.: Power law distributions of discharge mass and energy in river basins, Water Resour. Res., 28, 1089–1093, https://doi.org/10.1029/91WR03033, 1992.
Sicart, J. E., Hock, R., and Six, D.: Glacier melt, air temperature, and energy balance in different climates: The Bolivian Tropics, the French Alps, and northern Sweden, J. Geophys. Res.-Atmos., 113, 2008JD010406, https://doi.org/10.1029/2008JD010406, 2008.
Śledź, S., Ewertowski, M. W., and Piekarczyk, J.: Applications of unmanned aerial vehicle (UAV) surveys and Structure from Motion photogrammetry in glacial and periglacial geomorphology, Geomorphology, 378, 107620, https://doi.org/10.1016/j.geomorph.2021.107620, 2021.
Smith, L. C., Chu, V. W., Yang, K., Gleason, C. J., Pitcher, L. H., Rennermalm, A. K., Legleiter, C. J., Behar, A. E., Overstreet, B. T., Moustafa, S. E., Tedesco, M., Forster, R. R., LeWinter, A. L., Finnegan, D. C., Sheng, Y., and Balog, J.: Efficient meltwater drainage through supraglacial streams and rivers on the southwest Greenland ice sheet, P. Natl. Acad. Sci. USA, 112, 1001–1006, https://doi.org/10.1073/pnas.1413024112, 2015.
Smith, L. C., Yang, K., Pitcher, L. H., Overstreet, B. T., Chu, V. W., Rennermalm, Å. K., Ryan, J. C., Cooper, M. G., Gleason, C. J., Tedesco, M., Jeyaratnam, J., van As, D., van den Broeke, M. R., van de Berg, W. J., Noël, B., Langen, P. L., Cullather, R. I., Zhao, B., Willis, M. J., Hubbard, A., Box, J. E., Jenner, B. A., and Behar, A. E.: Direct measurements of meltwater runoff on the Greenland ice sheet surface, P. Natl. Acad. Sci. USA, 114, E10622–E10631, https://doi.org/10.1073/pnas.1707743114, 2017.
Smith, L. C., Andrews, L. C., Pitcher, L. H., Overstreet, B. T., Rennermalm, Å. K., Cooper, M. G., Cooley, S. W., Ryan, J. C., Miège, C., Kershner, C., and Simpson, C. E.: Supraglacial River Forcing of Subglacial Water Storage and Diurnal Ice Sheet Motion, Geophys. Res. Lett., 48, e2020GL091418, https://doi.org/10.1029/2020GL091418, 2021.
St Germain, S. L. and Moorman, B. J.: Long-term observations of supraglacial streams on an Arctic glacier, J. Glaciol., 65, 900–911, https://doi.org/10.1017/jog.2019.60, 2019.
Wang, K., Wu, Y., Qiu, X., Zhu, J., Zheng, D., Shangguan, S., Pan, J., Liu, Y., Jiang, L., and Li, X.: A novel airborne TomoSAR 3-D focusing method for accurate ice thickness and glacier volume estimation, ISPRS J. Photogramm. Remote Sens., 220, 593–607, https://doi.org/10.1016/j.isprsjprs.2025.01.011, 2025.
Wang, L., Yao, T., Chai, C., Cuo, L., Su, F., Zhang, F., Yao, Z., Zhang, Y., Li, X., Qi, J., Hu, Z., Liu, J., and Wang, Y.: TP-River: Monitoring and Quantifying Total River Runoff from the Third Pole, B. Am. Meteorol. Soc., 102, E948–E965, https://doi.org/10.1175/BAMS-D-20-0207.1, 2021.
Wang, L., Liu, H., Bhlon, R., Chen, D., Long, J., and Sherpa, T. C.: Modeling glacio-hydrological processes in the Himalayas: A review and future perspectives, Geogr. Sustain., 5, 179–192, https://doi.org/10.1016/j.geosus.2024.01.001, 2024.
Wang, S., Yao, T., Tian, L., and Pu, J.: Glacier mass variation and its effect on surface runoff in the Beida River catchment during 1957–2013, J. Glaciol., 63, 523–534, https://doi.org/10.1017/jog.2017.13, 2017.
Wu, Y., Wang, N., Li, Z., Chen, A., Guo, Z., and Qie, Y.: The effect of thermal radiation from surrounding terrain on glacier surface temperatures retrieved from remote sensing data: A case study from Qiyi Glacier, China, Remote Sens. Environ., 231, 111267, https://doi.org/10.1016/j.rse.2019.111267, 2019.
Xie, L. and Wu, Y.: Unmanned aerial vehicle data of Qiyi Glacier for 2023, Zenodo [data set], https://doi.org/10.5281/zenodo.15314578, 2025.
Xu, C., Li, Z., Li, H., Wang, F., and Zhou, P.: Long-range terrestrial laser scanning measurements of annual and intra-annual mass balances for Urumqi Glacier No. 1, eastern Tien Shan, China, The Cryosphere, 13, 2361–2383, https://doi.org/10.5194/tc-13-2361-2019, 2019.
Xu, J., Wang, L., Yao, T., Chen, D., Wang, G., Jing, Z., Zhang, F., Wang, Y., Li, X., Zhang, Y., Wang, Y., Zeng, T., Chai, C., Liu, H., Liu, R., Long, J., Fan, X., Bhlon, R., and Xu, B.: Totaling river discharge of the third pole from satellite imagery, Remote Sens. Environ., 308, 114181, https://doi.org/10.1016/j.rse.2024.114181, 2024.
Xu, M., Wang, P., Zhang, X., Ma, T., Jin, J., Kang, S., Han, H., Wu, H., Hou, Z., Li, X., and Wu, X.: Impacts of glacier shrinkage on peak melt runoff at the sub-basin scale of Northwest China, J. Hydrol., 654, 132953, https://doi.org/10.1016/j.jhydrol.2025.132953, 2025.
Xue, Y., Hong, X., He, X., Kang, S., Wang, S., and Ding, Y.: An evaluation of TLS-based glacier change assessment in the central Tibetan plateau, Int. J. Digit. Earth, 17, 2375527, https://doi.org/10.1080/17538947.2024.2375527, 2024.
Yang, K. and Smith, L. C.: Internally drained catchments dominate supraglacial hydrology of the southwest Greenland Ice Sheet, J. Geophys. Res. Earth Surf., 121, 1891–1910, https://doi.org/10.1002/2016JF003927, 2016.
Yang, K., Smith, L. C., Fettweis, X., Gleason, C. J., Lu, Y., and Li, M.: Surface meltwater runoff on the Greenland ice sheet estimated from remotely sensed supraglacial lake infilling rate, Remote Sens. Environ., 234, 111459, https://doi.org/10.1016/j.rse.2019.111459, 2019.
Yang, Z., Bai, P., Tian, Y., and Liu, X.: Glacier Coverage Dominates the Response of Runoff and Its Components to Climate Change in the Tianshan Mountains, Water Resour. Res., 61, e2024WR037947, https://doi.org/10.1029/2024WR037947, 2025.
Yao, T., Bolch, T., Chen, D., Gao, J., Immerzeel, W., Piao, S., Su, F., Thompson, L., Wada, Y., Wang, L., Wang, T., Wu, G., Xu, B., Yang, W., Zhang, G., and Zhao, P.: The imbalance of the Asian water tower, Nat. Rev. Earth Environ., 3, 618–632, https://doi.org/10.1038/s43017-022-00299-4, 2022.
Zemp, M., Huss, M., Thibert, E., Eckert, N., McNabb, R., Huber, J., Barandun, M., Machguth, H., Nussbaumer, S. U., Gärtner-Roer, I., Thomson, L., Paul, F., Maussion, F., Kutuzov, S., and Cogley, J. G.: Global glacier mass changes and their contributions to sea-level rise from 1961 to 2016, Nature, 568, 382–386, https://doi.org/10.1038/s41586-019-1071-0, 2019.
Zhang, W., Yang, K., Smith, L. C., Wang, Y., van As, D., Noël, B., Lu, Y., and Liu, J.: Pan-Greenland mapping of supraglacial rivers, lakes, and water-filled crevasses in a cool summer (2018) and a warm summer (2019), Remote Sens. Environ., 297, 113781, https://doi.org/10.1016/j.rse.2023.113781, 2023.