the Creative Commons Attribution 4.0 License.
the Creative Commons Attribution 4.0 License.
 | 03 Dec 2025
Distribution and characteristics of supraglacial channels on mountain glaciers in Valais, Switzerland
Holly Wytiahlowsky
Chris R. Stokes
Rebecca A. Hodge
Caroline C. Clason
Stewart S. R. Jamieson
Supraglacial channels form a key component of glacier hydrology, transporting surface meltwater to englacial and proglacial positions, which impacts ice flow dynamics, surface mass balance and the hydrochemistry of glacial runoff. The presence of supraglacial channels is well-documented on ice sheets using satellite imagery, but much less is known about their properties on mountain glaciers. Here we use high-resolution (0.1 m) orthophotos to identify channels across 285 glaciers in Valais Canton, Switzerland. For the 85 glaciers with visible supraglacial drainage networks, we map 1890 channels (>0.5 m wide) and investigate their distribution and characteristics. We find that mean elevation and slope exert the strongest influence on glacier drainage density, with glaciers characterised by shallow slopes (which have fewer crevasses) and a large portion of their area at lower elevations (resulting in a higher meltwater supply) exhibiting higher drainage densities. There is also significant inter-glacier variability in channel termini locations. On average, 80 % of channels drain across the glacier surface and directly onto proglacial areas, with only 20 % terminating englacially. However, 48 % of glaciers contain no englacially-terminating channels and 3.5 % of glaciers host channels that all terminate englacially. Lastly, most channels on glaciers in Valais are only slightly sinuous, with higher sinuosities typically occurring in flatter areas and associated with patchy debris cover. Future research should assess the importance of channels below our mapping resolution and investigate how drainage networks may evolve under continued climatic warming.
- Article
(11814 KB) - Full-text XML
- BibTeX
- EndNote


Glaciers and ice caps are losing mass rapidly (Wouters et al., 2019; Hugonnet et al., 2021; Tepes et al., 2021; The GlaMBIE Team, 2025), resulting in sea level rise, which is anticipated to continue throughout the 21st century and beyond (Bamber et al., 2019; Edwards et al., 2021; Rounce et al., 2023). Glaciers in the lower latitudes (e.g., the European Alps, Caucasus, New Zealand, the USA) are particularly vulnerable to atmospheric warming and may experience complete deglaciation by 2100 under a strong warming scenario (e.g., RCP8.5) (Zekollari et al., 2019; Rounce et al., 2023). In populated mountain regions, these changes will have profound impacts, as glaciers and snowpacks act as vital water towers, supplying freshwater to the 1.9 billion people worldwide who live in or downstream of glacial catchments (Carey et al., 2017; Zemp et al., 2019; Immerzeel et al., 2020; Sommer et al., 2020; Hugonnet et al., 2021; Clason et al., 2023). Glacier meltwater that feeds proglacial rivers is commonly transported to the proglacial margin by supraglacial channels, which are an important component of the glacial hydrological system. The presence and distribution of supraglacial channels have implications for a range of glacio-hydrological processes as they affect how efficiently meltwater is routed over, through and under glaciers, and can also affect suspended sediment concentrations and hydrochemistry of proglacial rivers. Higher suspended sediment concentrations pose harm to downstream ecosystems and proglacial reservoirs, with concentrations generally higher if meltwater is routed via the bed (Swift et al., 2002), rather than transported across the glacier surface. The presence or absence of channels that route meltwater to the bed also affects the supply of subglacial meltwater, which has implications for subglacial water pressure, the onset of subglacial channelisation and, potentially, ice motion (e.g., Willis, 1995; Jobard and Dzikowski, 2006; Banwell et al., 2016). Despite the importance of meltwater routing, the controls and patterns of meltwater transport on mountain glaciers remain relatively understudied compared to, for example, the Greenland Ice Sheet (GrIS). Notably, the spatial distribution of supraglacial channels is not yet fully understood (Pitcher and Smith, 2019), nor are the controls on their distribution.
The term “supraglacial stream” was first coined in the 1970s and 1980s from observations of channels in Scandinavia and the European Alps (e.g., Knighton, 1972, 1981, 1985; Ferguson, 1973; Hambrey, 1977; Seaberg et al., 1988), with their morphology (i.e., channel shape and structure) often compared to terrestrial streams. However, these early studies only provided small-scale, local observations of channels on individual glaciers. By comparison, a recent revival in supraglacial channel research has primarily focused on large-scale remote-sensing observations of the GrIS (e.g., Smith et al., 2015; Karlstrom and Yang, 2016; Gleason et al., 2021; Yang et al., 2015, 2016, 2018, 2019, 2020, 2021, 2022), and, to a lesser extent, Antarctica (e.g., Bell et al., 2017; Kingslake et al., 2017; Chen et al., 2024). Recent remote sensing techniques for channel detection on the GrIS (e.g., Yang and Smith, 2013; King et al., 2016) have rarely been applied to mountain environments, as most channels on mountain glaciers are likely to be smaller than those on the GrIS. Observations are limited to very small sample sizes but have shown that they tend to be less than a metre wide (Knighton, 1972, 1981, 1985; Ferguson, 1973), and would, therefore, fall below the resolution of even the highest-resolution freely available satellite platforms (e.g., Sentinel-2, ∼10 m). As a result, it is not known whether the characteristics of channels on ice sheets and the controls on their distribution are comparable to those on mountain glaciers. Mountain glaciers are also limited in the surface area available for channel formation (compared to ice sheets), tend to have a larger debris coverage, and typically contain steeper and more complex topography compared to ice sheet surfaces.
Whilst much remains to be known about supraglacial channel distribution in mountainous environments (i.e., where they form and their densities), previous research has established some fundamental principles (e.g., Knighton, 1972, 1981; Ferguson, 1973; Yang et al., 2016). The formation of supraglacial channels is thought to occur when channel incision via thermal erosion exceeds the rate of surface lowering (Marston, 1983). Channel formation is also influenced by surface topography, with channels tending to form parallel to the steepest ice flow direction (Irvine-Fynn et al., 2011; Mantelli et al., 2015). On a smaller scale, micro- to macro-scale structures have also been suggested to influence meltwater routing (Irvine-Fynn et al., 2011), and areas of higher roughness appear to be correlated with, and may be caused by, higher channel densities (Rippin et al., 2015). Surface topography may reinforce itself, as once an incised channel forms, the higher incision rates may result in an increasingly topographically constrained channel that reactivates annually. Incision rates typically increase with discharge and slope (St Germain and Moorman, 2019). However, incised channel profiles are not typically uniform, and most channels commonly exhibit asymmetric cross-profiles due to the dominant direction of solar radiation (St Germain and Moorman, 2019). Additionally, discharge is thought to be a strong control on channel form, especially sinuosity, with channels observed to increase in sinuosity throughout the melt season (e.g., Dozier, 1976; Hambrey, 1977; St Germain and Moorman, 2019). Similar to terrestrial river networks, supraglacial channels generally follow Horton's laws, meaning that higher-order channels (i.e., where the highest-order is the main channel) are longer, have lower slopes, and are comprised of a lower number of channel segments (Horton, 1945; Yang et al., 2016). However, much of what we know about supraglacial channels was established from observations of a small number of individual glaciers, especially those that are cold-based or polythermal (e.g., Knighton, 1972, 1981, 1985; Gleason et al., 2016; St Germain and Moorman, 2019).
In this paper, we investigate a range of potential controls on channel distribution and properties for a large sample of glaciers (n=285) in a region characterised by high melt rates. We use high-resolution (∼0.1 m) orthophoto imagery from 2020 to produce the first comprehensive inventory of 1890 supraglacial channels in a mountain glacier environment, with a focus on Valais Canton, Switzerland. Our aim is to characterise the morphometry (i.e., quantitative measurements of channel geometry) of supraglacial channels on mountain glaciers, providing insight into where and why they form. This is important for understanding how mass is transported through and away from glaciers, and for determining the extent to which surface hydrological characteristics (e.g., channel transport pathways) are uniform between glaciers, which is beneficial for informing modelling of glacier hydrology and ice motion. Using GIS software, we extract channel metrics (length, sinuosity, slope, elevation, terminus type, proximity to debris) and glacier surface characteristics (aspect, size, drainage density, elevation, crevassed extent), which are supplemented by qualitative observations of channel morphology and distribution. We then explore the relationship between glacier and channel characteristics using statistical measures and infer whether glacier surface characteristics can explain the presence or absence of channels.
Compared to many glacierised regions, Switzerland has the largest repository of high spatial and temporal resolution national LiDAR and orthophoto surveys, providing excellent coverage for mapping supraglacial channels. We focus on Valais Canton in southern Switzerland, which contains 303 glaciers over 0.1 km2, covering a total area of 545 km2 in 2015 (Fig. 1; Linsbauer et al., 2021). It is the most glacierised Swiss canton, and in 2015, glaciers in Valais had a mean area of 1.8 km2, a median of 0.43 km2 and a maximum of 77.3 km2 (Grosser Aletschgletscher) (Linsbauer et al., 2021). We identified the Valais Canton as a suitable study site because its glacier size distribution is comparable to that of Switzerland as a whole, and the glaciers range from shallow to steep gradients, have differing hypsometries (ice area-elevation distributions), and varying crevasse densities. Thus, this study site captures a wide range of potential influences on channel distributions and characteristics. Valais is comprised of the Bernese Alps to the north and the Pennine Alps in the south, separated by the Rhône Valley (Fig. 1). Glaciers in the Bernese Alps are the largest in the canton and most exhibit a south-to-southeast aspect (mean: 163°). In contrast, the largest glaciers in the Pennine Alps have a north and west aspect (mean: 347°). Glaciers in Valais have an average maximum elevation of 3450 m a.s.l. (min: 2356, max: 4599) and an overall mean elevation of 3091 m a.s.l. (min: 2267, max: 4025).
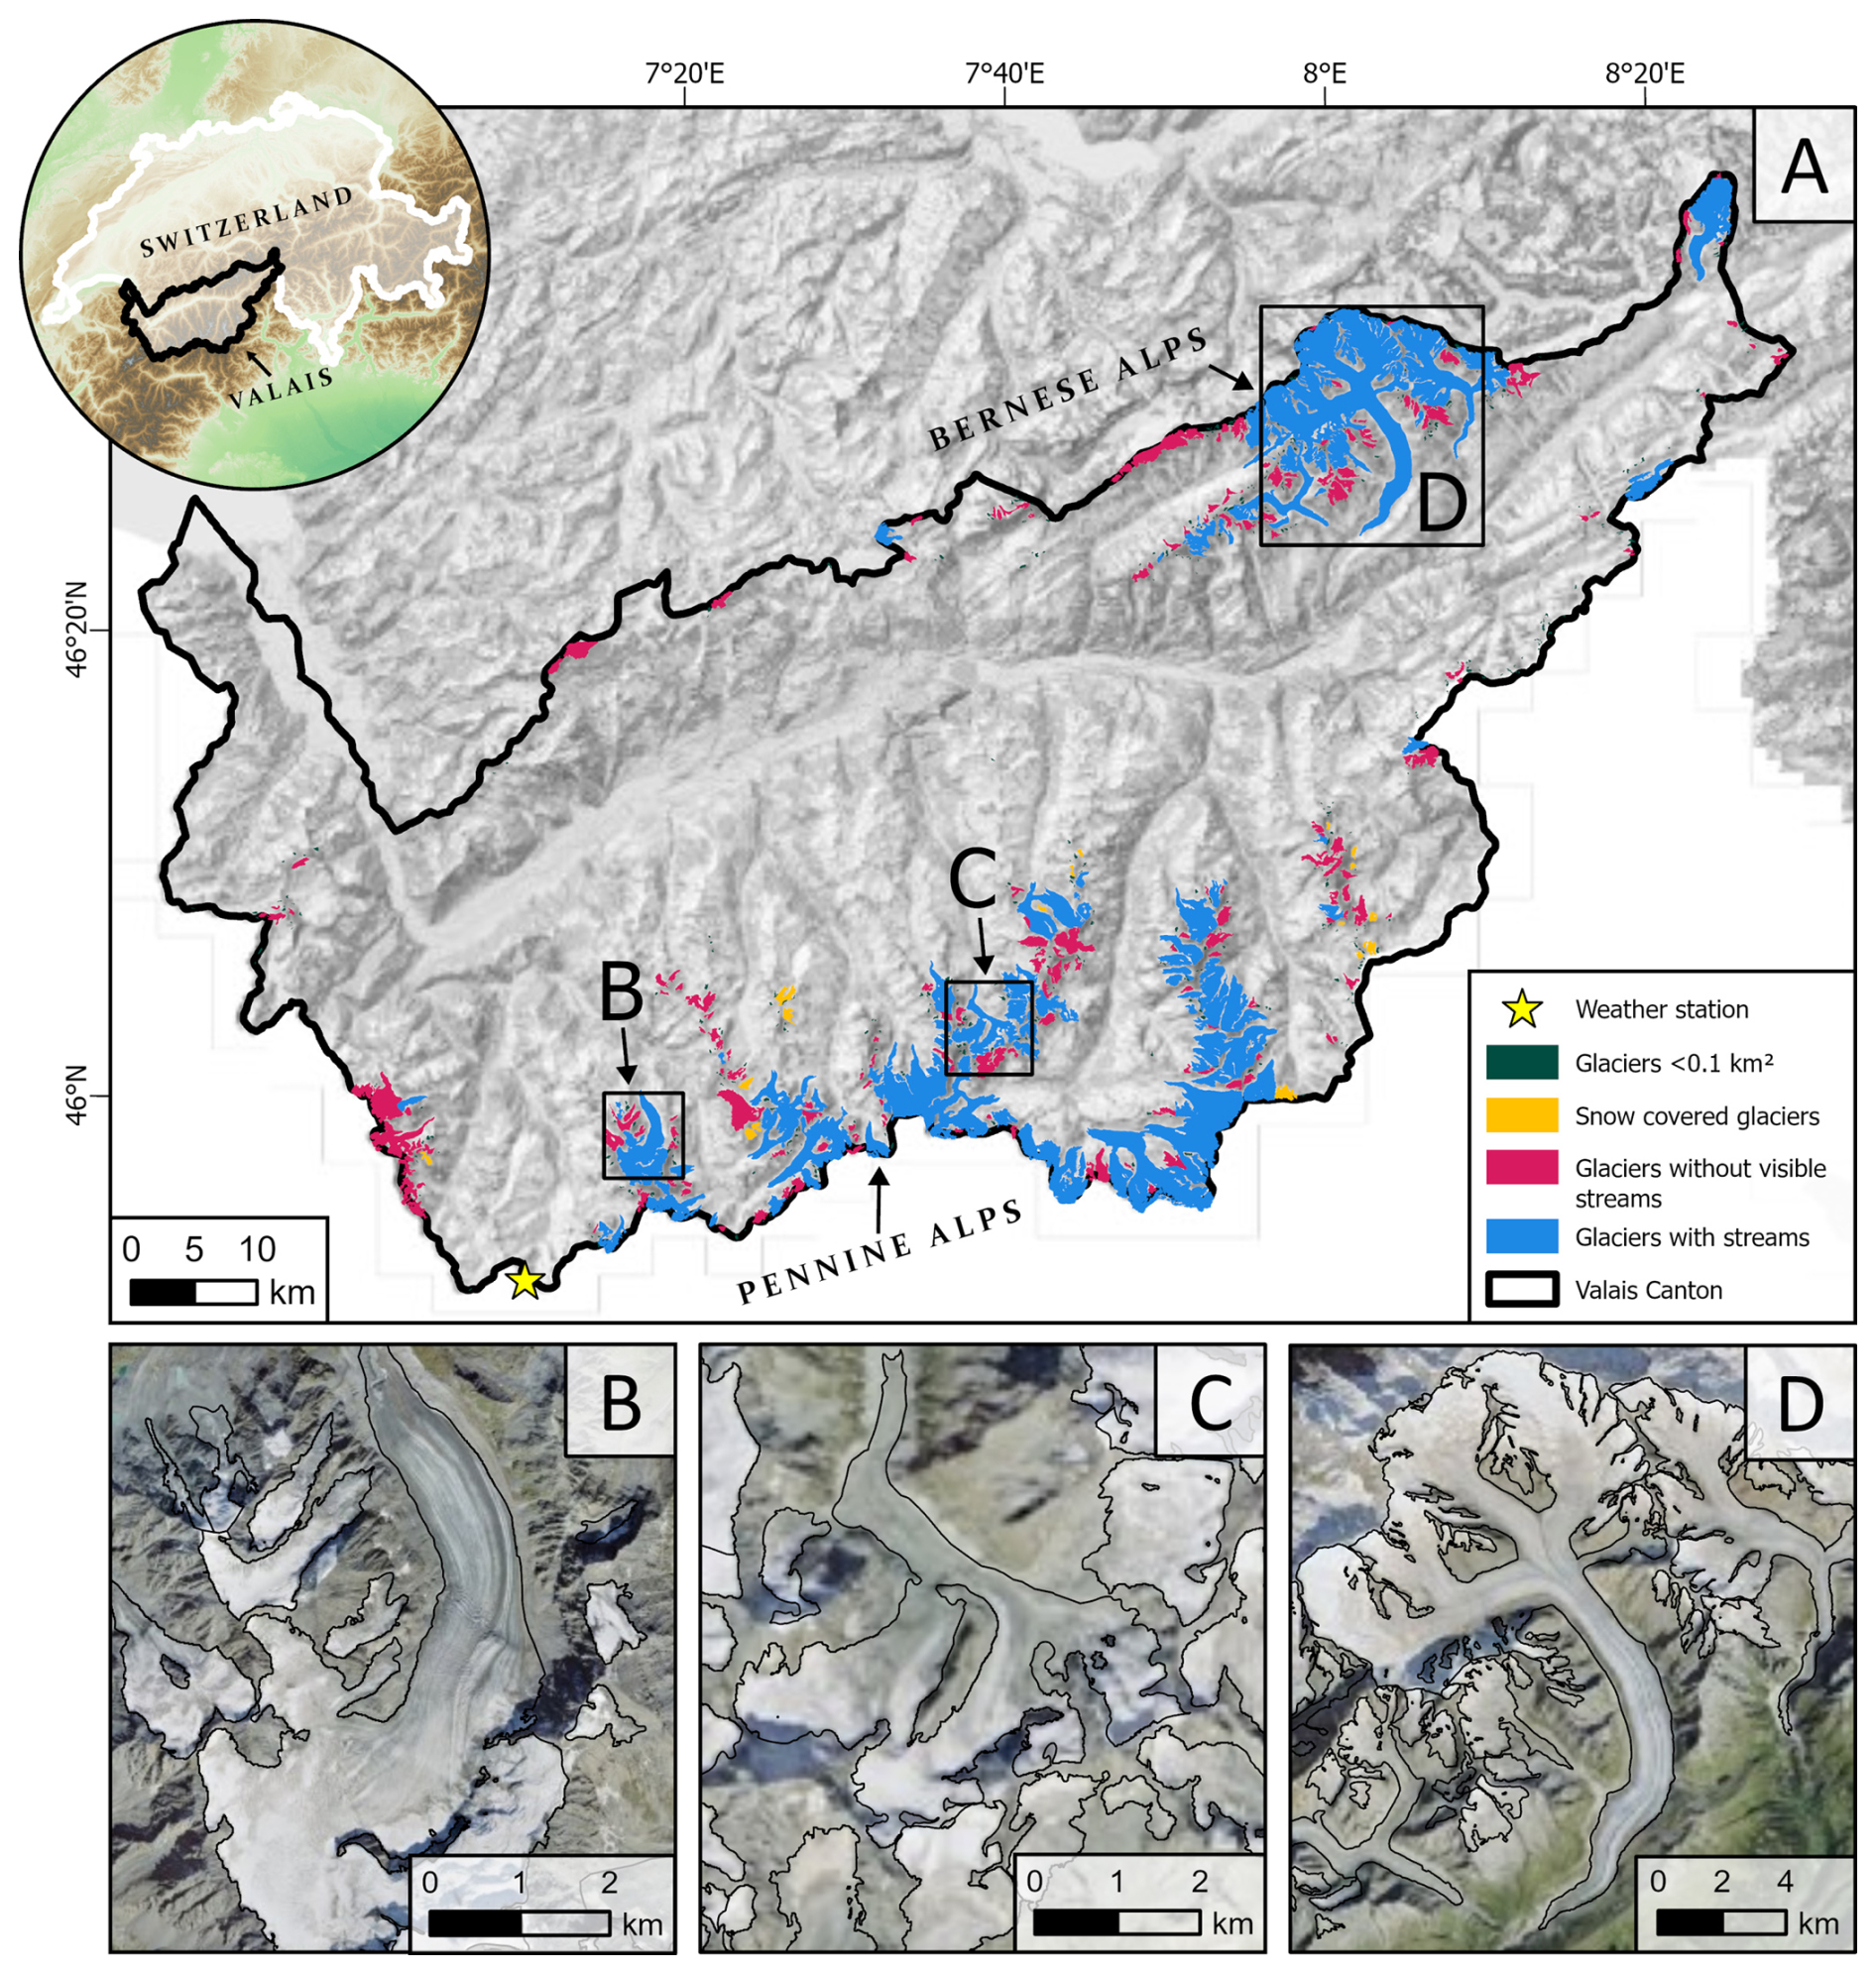
Figure 1The study site area, which contains 303 glaciers >0.1 km2. (A) The location of Valais Canton (black) is shown within southwest Switzerland. Glaciers containing visible streams (>0.5 m wide) are shown in blue, glaciers without visible streams are in pink, glaciers fully covered by snow are in yellow, and all glaciers <0.1 km2 (which we omit from this study) are shown in dark green; (B) an example of a large valley glacier (Glacier de Corbassière), with smaller glaciers at higher elevations; (C) the debris-covered tongue of Glacier du Grand Cornier and surrounding smaller glaciers; and (D) the larger glaciers (e.g., Grosser Aletschgletscher, centre) in the north of Valais. The location of Col du Grand St-Bernard meteorological weather station is indicated by a yellow star. Glacier outlines used are from the Swiss Glacier Inventory (SGI2016), with glacier extent shown for 2015–2016. The outlines are overlayed on basemap imagery sourced from Esri (2024).
Within Valais, the only meteorological station with a similar elevation to many glacier termini is Col du Grand St-Bernard (2472 m a.s.l.) in the Pennine Alps (Fig. 1), which (between 1991 and 2020) recorded mean August air temperatures (2 m) of 8.6 °C, mean January temperatures of −6.9 °C, and mean annual temperatures of −0.1 °C. At Col du Grand St-Bernard, August averages 136 mm of precipitation (1991–2020) compared to a January average of 242 mm. However, Switzerland's climate is changing and mean air temperatures between 2013 and 2022 were 2.5 °C warmer than pre-industrial temperatures (MeteoSwiss, 2024), which has greatly impacted the mass balance of Swiss glaciers in recent decades (Fischer et al., 2015; Davaze et al., 2020).
3.1 Imagery acquisition and channel delineation
The method commonly used for automated channel detection, developed by Yang and Smith (2013) for delineating water bodies on the GrIS from WorldView-2 imagery (1.84 m), uses a normalised difference water index adapted for ice (NDWIice). Following Yang and Smith (2013), we applied a modified NDWIice approach to a high-resolution (0.1 m) orthophoto tile (1 km by 1 km) on the Grosser Aletschgletscher. However, our NDWIice output predominantly detected water-filled crevasses, and whilst it was able to detect some channels >0.5 m in width, it typically identified only the largest channels (mostly >1 m). It also missed many channels that were visible but contained very small amounts of water, or incised channels where the water surface was not visible. This method is likely better suited to coarser imagery (less visible crevasses) in less complex terrain and/or for simply using a threshold to extract higher-order channels. As a result, we undertook manual mapping, which in some instances is sevenfold more accurate in ascertaining channel density compared to automated methods (King et al., 2016).
We obtained high-resolution cloud-free orthophoto imagery (0.10 m resolution) from SwissTopo (Federal Office of Topography swisstopo, 2020; https://www.swisstopo.admin.ch/, last access: 7 September 2024), which is primarily comprised of imagery acquired in August 2020 (5, 7–8, 15, 21 and 27 August). The remaining area is covered by imagery captured on 4 September, including a few small glaciers in southwest Valais and part of the Grosser Aletschgletscher's ablation area, which, despite their later acquisition dates, do not appear to have abnormally high drainage densities. All imagery was captured toward the end of the 2020 melt season, which lasted from April to September, when mean monthly temperatures were above 0 °C at Col du Grand St-Bernard. Snow conditions at Col du Grand St-Bernard during summer 2020 were likely to be lower than average, as the precipitation of the preceding winter (total across December, January, February) was 570 mm compared to the 2010 to 2020 mean of 704 mm. May temperatures were warmer than average (2020 mean: 3.4 °C; 2010–2020 mean: 1.7 °C), followed by a colder than average June (2020 mean: 4.8 °C; 2010–2020 mean: 6.3 °C), meaning that whilst there was less winter snowfall, it may have melted more slowly than previous years. We first removed all glaciers in Valais smaller than 0.1 km2 from our study sample (582 reduced to 303 glaciers). This is because they are likely too small to form channels large enough to be detected in our imagery, and because many of the small glaciers listed in the Swiss Glacier Inventory (SGI2016) are unlikely to meet the criteria for classification as glaciers (Leigh et al., 2019). At the time of imagery acquisition, 6 % of the remaining 303 glaciers were still completely snow-covered and were omitted from further analyses as the presence or absence of channels could not be detected, leaving 285 glaciers. Within these glaciers, the mean snow-free area was 38.9 % in August/September 2020, with some variation in snow cover across different elevation bands. For example, glaciers with a mean elevation between 2500 and 2800 m a.s.l. had an average snow-free area of 45.0 %, compared to 36.6 % at elevations between 3100 and 3400 m a.s.l. The lowest percentage of snow-free area was 4.9 % at a high elevation cirque, and five glaciers were completely snow-free by August/September, but were all under 0.7 km2.
Each glacier was systematically surveyed for supraglacial channels in QGIS (e.g., Fig. 2). Of the 285 glaciers that we surveyed, 85 supported supraglacial channels above our mapping threshold. Only channels confidently visible at a 1:1000 scale were delineated for the purpose of consistency, meaning the minimum channel width we delineated was ∼0.5 m. We solely focus on these larger channels because of difficulties in delineating small channels objectively, which include problems differentiating complex rill networks from structural features (e.g., fractures). Additionally, smaller channels may have widths that periodically fall below the pixel resolution, which may require subjective judgments to be made. Whilst we do not map channels below the scale defined above, many of the glaciers likely contain smaller channels that are not sufficiently clear to map. These smaller channels may form a key hydrological component of these glaciers, but we anticipate that the channels we have mapped carry the bulk of the meltwater. Individual channels were mapped from their downstream end until they were no longer clearly visible or when channels could not be confidently and objectively mapped. When channels have tributaries above the mapping resolution, the main channels were mapped as one segment, continuing up the largest channel at each confluence. Each tributary channel was then subsequently mapped as a new individual segment. Once mapped, each entire channel segment was assigned a code based on its attributes and whether it was on bare ice, surrounded by patchy debris, or on a debris-covered part of the glacier. The type of terminus was assigned to each channel, which was one of: running off the glacier terminus, terminating in a moulin, crevasse, lake, the glacier periphery, adjoins another channel, or disappears beyond the resolution (i.e., the channel terminus is not visible and cannot be confidently inferred).
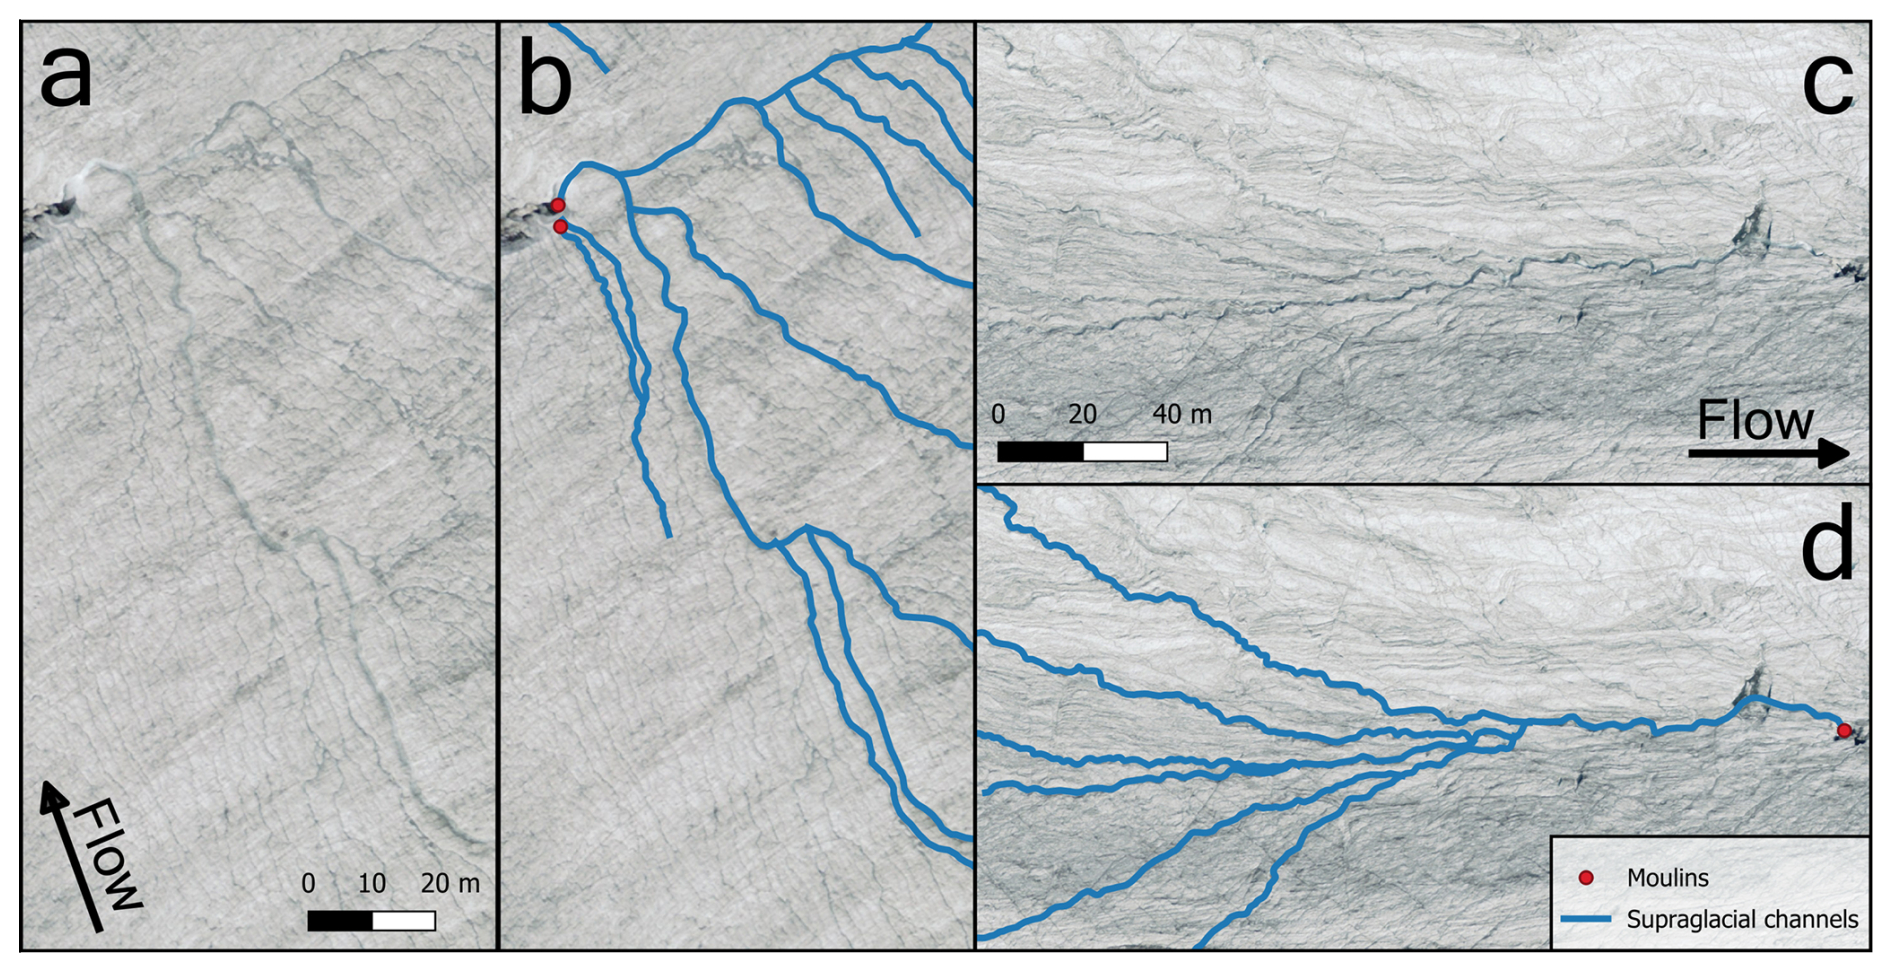
Figure 2Examples of the mapped output and corresponding orthophoto. Channels are shown in blue, and moulins are represented by red circles when a mapped channel is moulin-terminating. Arrows indicate the direction of ice flow. Examples of supraglacial channels are shown for Glacier de Moiry (a, b) and for Allalingletscher (c, d). Imagery source: Federal Office of Topography Swisstopo.
To ensure consistency, all mapping and the error assessment were conducted by the same individual. We quantified the repeatability of our mapping by re-delineating channels from the same image of the Rhonegletscher used in our original mapping, months after mapping was completed. This revealed a 2.6 % difference in calculated drainage density and a 0.21 % decrease in total channel length compared to the original mapping (Fig. B1). The error from our repeat mapping may have been lower if the mapping had been repeated immediately after the original mapping, whereas the original mapping was conducted consistently over an approximately 6-month period. However, the error margin is small enough for us to conclude that the original mapping provided a good representation of each glacier's drainage density. Both sets of mapping also clearly identified where channels terminate. The primary source of uncertainty stems from knowing when to stop mapping up-channel and the total channel length. We therefore took a conservative approach to avoid over-interpreting channel pathways and only mapped the up-glacier channel limit to where we were confident that it exists.
3.2 Metrics
A total of 1890 channel segments (polylines) were mapped across the 85 glaciers that contained channels. We then used the high-resolution (0.5 m) SwissALTI3D DEM (2019) from https://www.swisstopo.admin.ch/ (last access: 8 December 2023; Federal Office of Topography swisstopo, 2019) (1σ accuracy of ±0.3 m for each dimension) to extract morphometric characteristics from each channel segment. The DEM is coarser than the orthophotos used for channel delineation, and there is a one-year offset between their acquisition dates. However, we consider the difference in acquisition dates to be short enough that it is unlikely to affect the overall results, which focus on relative differences in elevation, both on and between glaciers, rather than absolute values. Additionally, the DEM closely reflects the glacier surface topography at the time of mapping, and no major changes are observed over that year. Extracted channel metrics included geodetic segment length, obtained from ArcGIS without a DEM input, and straight-line distance, calculated from DEM-derived minimum and maximum elevations. Elevation differences and segment length were used to calculate channel slope. We also calculated sinuosity for each segment (channel length divided by straight-line distance), together with the total channel length per glacier, which was used to calculate glacier drainage density (total channel length divided by glacier area). For glacier drainage density, we used the snow-free glacier area at the time of mapping, which yielded higher values than if the entire glacier area had been used.
Glacier characteristics were obtained from the most up-to-date inventory of Swiss glaciers, which provides full coverage of all Valais glaciers in 2015 (Paul et al., 2019). From this inventory, we extracted aspect and elevation data to characterise each glacier in its entirety, and only these values are used when referencing glacier elevation and aspect throughout. However, glacier area and slope refer only to the snow-free portion as this represents the area available for channel formation at the time of image acquisition. To calculate snow-free values, we clipped the 2015 glacier polygons at their snowline and extracted the snow-free area and slope (mean, minimum, and maximum) using zonal statistics in QGIS. Additionally, we assigned codes to each glacier based on the size of the crevassed area due to its potential impact on channel formation. This included the following classes: little to no crevasses (less than 10 % of the snow-free area), moderately crevassed (10 %–50 % covered), and heavily crevassed (covers >50 % of the snow-free area).
3.3 Statistical tests
To determine whether there is a relationship between channel morphometry and glacier characteristics, we produced a correlation matrix using Spearman's rank correlation (ρ) (e.g., St Germain and Moorman, 2019). Each metric used in this analysis comprises 1890 values, each representing an individual channel segment. The analysis used the following channel variables: segment length, channel slope, sinuosity, minimum elevation, maximum elevation and elevation range, as well as the following glacier variables: drainage density, aspect, minimum elevation, mean elevation, maximum elevation, snow-free area, and its mean slope. For each of the glacier variables, all channel segments on the same glacier were allocated the same value. A one-way ANOVA was performed to determine the significance of the relationship between the three debris-cover classes and sinuosity. In addition, a Principal Component Analysis (PCA) was conducted to examine the relationships between the variables used in our correlation matrix and identify the main drivers of variance in the dataset, with data normalised to enhance pattern detection. A secondary PCA and cluster analysis were also conducted to further explore relationships between glacier properties. Unsupervised k-means clustering was used to separate glaciers based on their slope, elevation (minimum, mean, maximum), drainage density, and channel termini locations. The resulting clusters were then visualised using a PCA biplot.
4.1 Glacier observations
Glaciers with channels (n=85) have a larger mean area than glaciers without channels (n=200) (mean area = 5 vs. 0.6 km2) and all glaciers larger than 5.6 km2 contain channels >0.5 m wide (Table 1, Fig. 3a). However, the modal glacier area is 0.1 to 1 km2 for glaciers both with and without visible channels (Fig. 3a). Glaciers containing channels typically have lower slopes compared to those without channels (mean slope: 21 vs. 28°) (Fig. 3b). Glaciers with channels generally have longer tongues that terminate at lower elevations (mean minimum elevation = 2797 vs. 2936 m) and have higher maximum elevations (mean max elevation = 3637 vs. 3555 m). The mean drainage density of glaciers with channels is 2.4 km km−2, with a maximum of 15.2 km km−2. The latter was found on Oberer Theodulgletscher, which has the lowest glacier slope in the dataset (13°) (Figs. 3c, 4a).
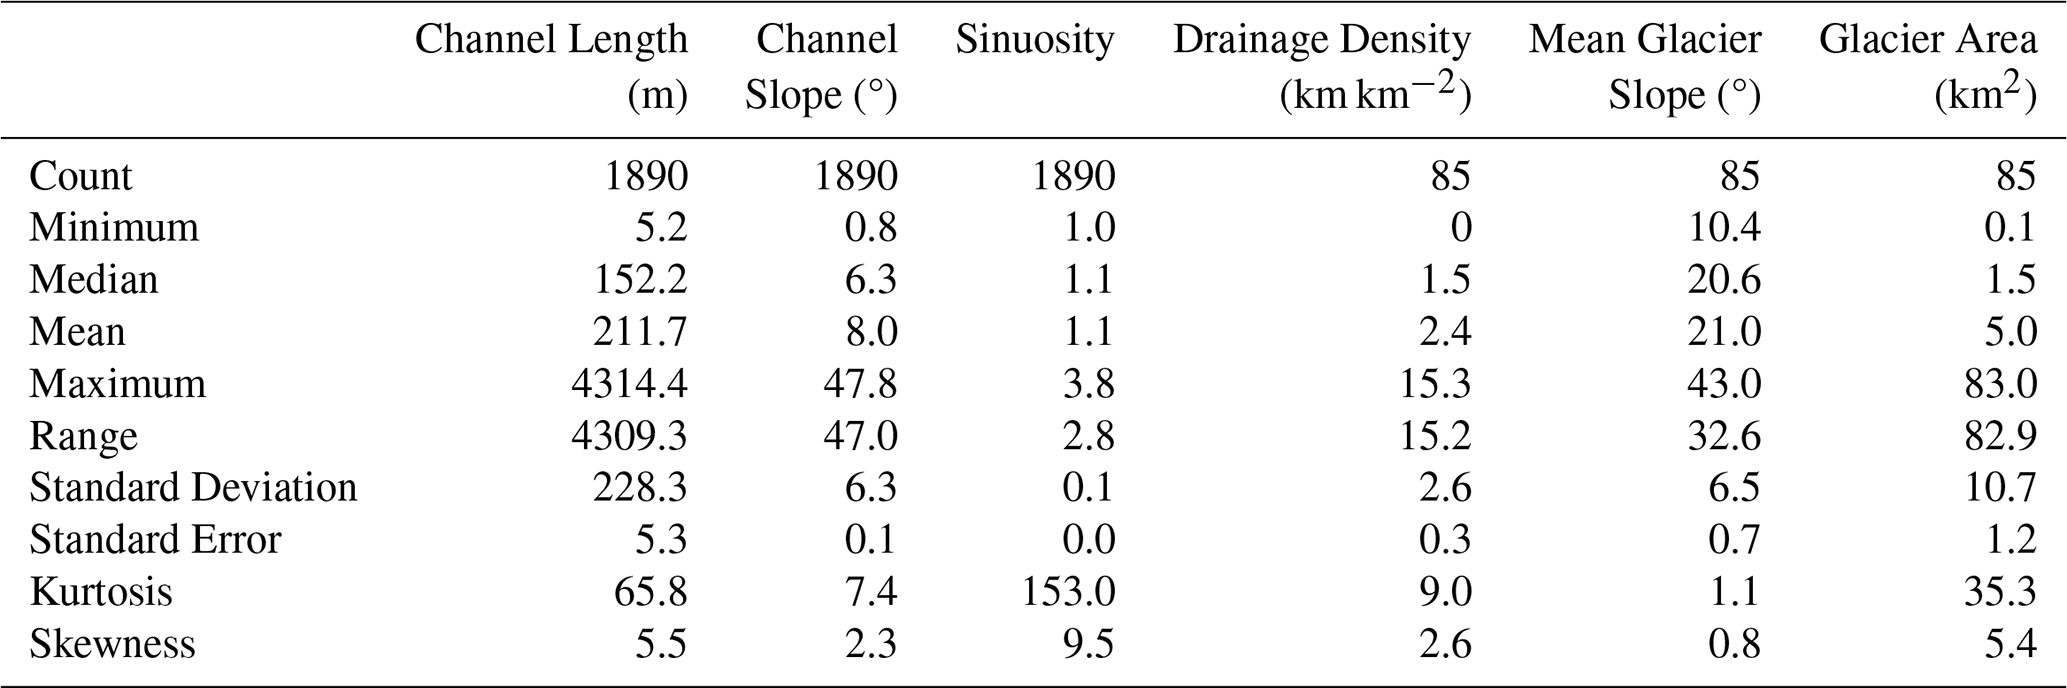
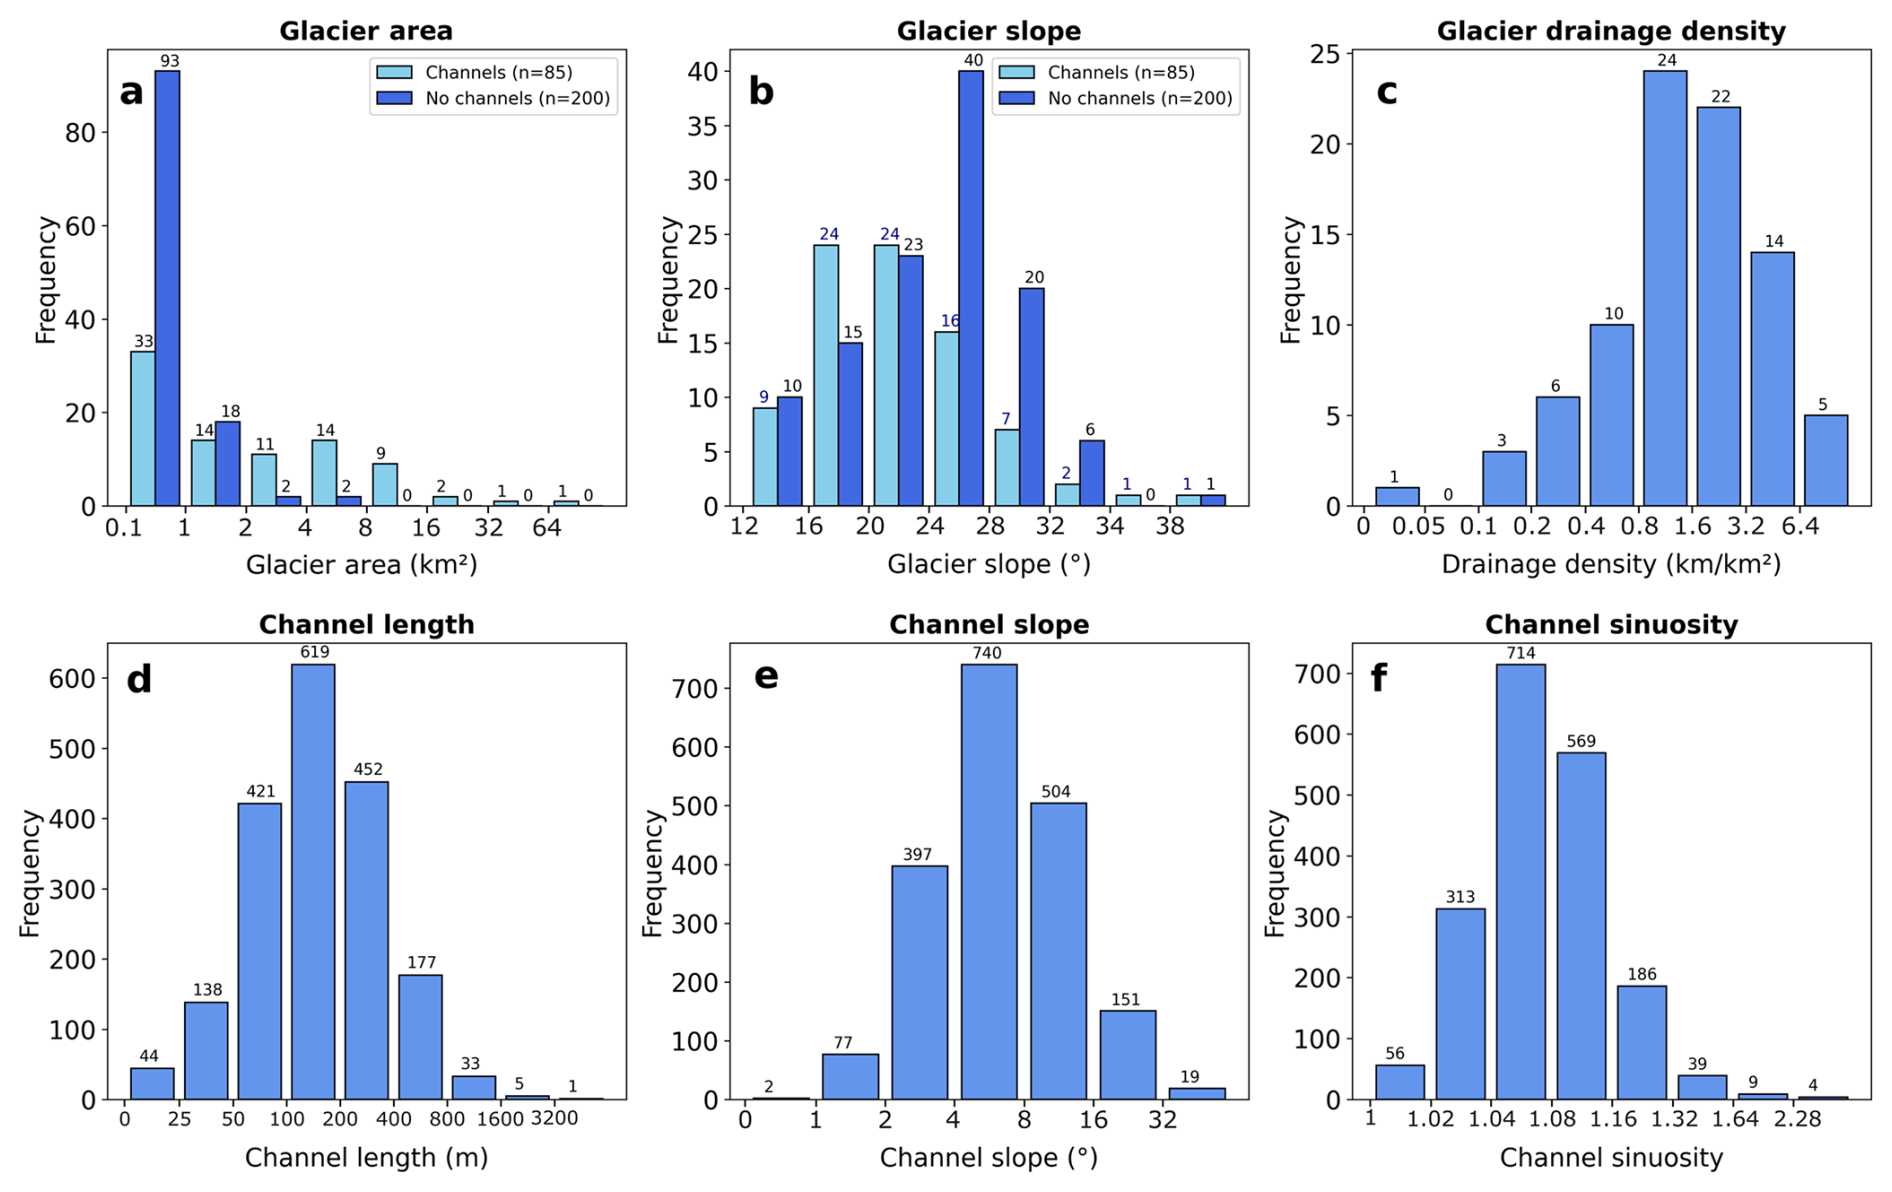
Figure 3Histograms of extracted metrics. Note that the x axis uses a log scale (except for panel b) and the numbers above each bar represent the number of channels/glaciers within each class. The range shown by each bar is indicated by the x axis values to either side. The range is exclusive of the lower value and inclusive of the higher one (e.g., >1–≤2). (a) Glacier area (km2); (b) glacier slope (°); (c) glacier drainage density (km km−2); (d) channel segment length (m); (e) channel slope (°); and (f) channel sinuosity.
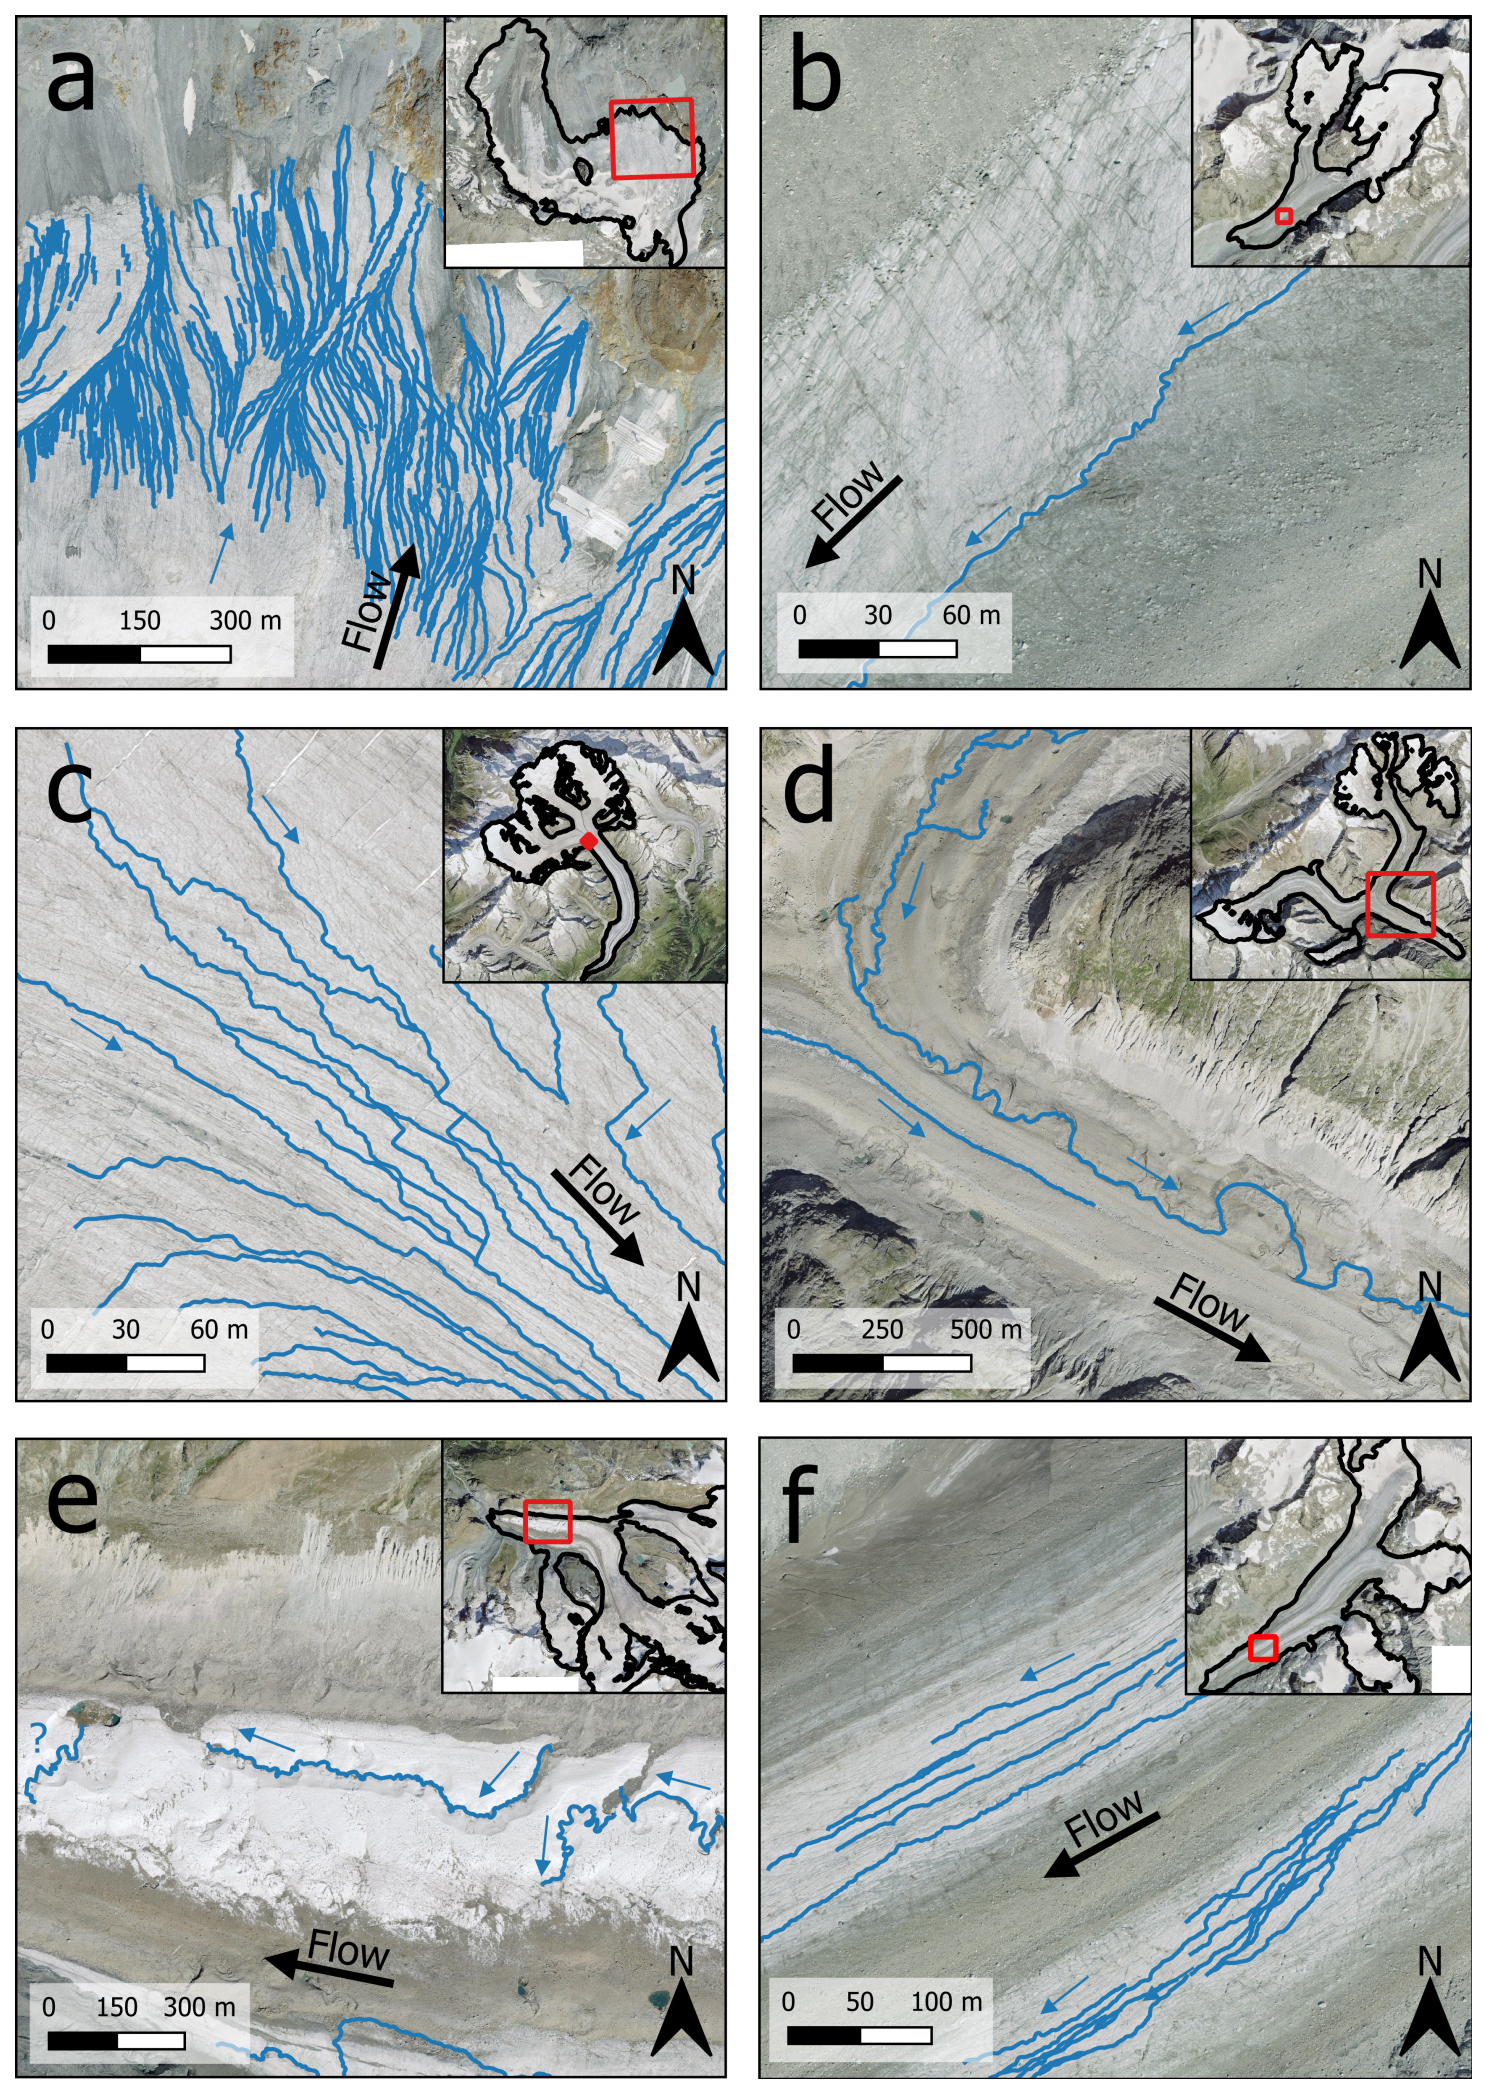
Figure 4Examples of supraglacial channels. Channel location is shown in relation to the whole glacier in the top right of each panel, with the panel extent shown in red. (a) Channels on the Oberer Theodulgletscher; (b) a channel at the interface between bare ice and debris-covered ice on Glacier du Brenay; (c) channels on the Grosser Aletschgletscher – note the straight segments where crevasses have been exploited; (d) channels on the debris-covered terminus of the Oberaletschgletscher; (e) sinuous channels towards the terminus of Gornergletscher, including an example of a small supraglacial lake (left); and (f) channel networks on Glacier d'Otemma. The black arrows indicate the glacier flow direction, and the blue arrows indicate the water flow direction. A question mark is shown when the water flow direction is unclear in the DEM. Imagery source: Federal Office of Topography, Swisstopo.
4.2 Channel characteristics
Individual channel segments have a mean length of 212 m, with a positively skewed leptokurtic distribution (Fig. 3d; Table 1). Few segments exceed 1600 m, as the snow-free areas of most glaciers are smaller than this. The channel segments have a mean slope of 8°, and most exhibit slopes between 4 and 16° (Fig. 3e; Table 1). The maximum channel slope is 48°, but the overall distribution is positively skewed towards smaller slope values. The sinuosity index of each channel ranges from 1 (straight line) to a maximum of 3.8, with a mean value of 1.1, which is classified as sinuous (1.05–1.25), but not high enough to be defined as meandering (>1.25) (Table 1) (Brice and Blodgett, 1978). Sinuosity is the most positively skewed variable, with a highly leptokurtic distribution, as most channels are not very sinuous (Fig. 3f).
Channels terminate in a range of settings, with 47 % joining another channel, 15 % terminating in crevasses, 14 % terminating in moulins, 13 % disappearing below the mapping resolution, 8 % running off at the glacier terminus, 2 % running off the side of the glacier, and 1 % terminating in a supraglacial lake (e.g., Fig. 4e). When only considering terminal segments (i.e., channels not adjoining another channel or disappearing below the mapping resolution), 72 % of segments terminate englacially (crevasses or moulins), 25 % run-off (glacier terminus or periphery), and 3 % terminate in a supraglacial lake. However, larger glaciers with higher drainage densities disproportionately impact these values. For example, 582 out of the 1890 mapped channel segments are on the Grosser Aletschgletscher, where no visible channels reach the terminus; hence, englacially terminating channels may be overrepresented by a single glacier. By comparison, when the proportion of channels terminating in each location (i.e., englacially or running directly off the glacier terminus) at every glacier is averaged across the entire dataset, the resulting “average” glacier is characterised by 80 % of channels terminating proglacially and 20 % terminating englacially. Overall, 48 % of glaciers have no englacially-terminating channels (i.e., all channels remain supraglacial and run directly off the glacier), with only 3.5 % of glaciers solely containing englacially terminating channels.
Qualitative observations suggest that glacier surface properties and ice marginal features influence channel distribution and morphology, and that channel networks display variation in drainage patterns across the dataset. For example, channels often occur along the interface between debris-covered and bare ice (e.g., Fig. 4b), particularly adjacent to moraines, where channels are confined to a topographic depression or “gutter”, commonly occurring at the confluence between two tributaries or at the ice margin. The influence of glacier surface features on channel morphology is also observed where trace or shallow crevasses are exploited to produce long, straight channel sections (e.g., Fig. 4c). By comparison, the most sinuous channels tend to occur at low elevations, appear to be highly incised, and typically form on large flat areas close to the glacier terminus (Fig. 4e). Channel network patterns also vary, with some networks appearing more dendritic and interconnected (e.g., Fig. 4a), while others are more parallel and show reduced connectivity (e.g., Fig. 4f)
4.3 Relationships between channel and glacier characteristics
Here, we investigate links between different supraglacial channel and glacier characteristics. Previous studies informed our choice of variables to test for potential relationships, with a focus on how glacier properties (slope, area and elevation) are related to glacier drainage density (e.g., Yang et al., 2016) and channel morphometry, such as sinuosity and channel segment length (e.g., St Germain and Moorman, 2019). We find that the most sinuous channels are more likely to occur on shallow slopes (0 to 10°), with channels on steeper slopes (>20°) unlikely to exhibit a sinuosity over 1.3 (Fig. 5a). Statistically significant differences in channel sinuosity are also observed between our debris classes (p<0.05; one-way ANOVA) (Fig. 5c). Channels on patchy (“proximal”) debris cover tend to be the most sinuous and are statistically different (p<0.05; Tukey Honest Significant Difference test) from channels on continuous debris cover (“debris”) and those on bare ice (“clean”). The “debris” class generally contains more sinuous channels than the “clean” class, but this difference is not statistically significant. Additionally, channel segment length tends to increase on shallower slopes (Fig. 5b). This relationship is clearly defined by an upper limit, where channels >500 m are confined to slopes of <20° and no channels occur on slopes >50°, except for one outlier (Fig. 5b). Channel segments that terminate in moulins tend to be the longest (mean: 341 m, max: 1999 m), followed by channels that disappear below the mapping resolution (mean: 259 m, max: 4314 m), and then channels reaching the glacier terminus (mean: 214 m, max: 1193 m) (Fig. 5d). The very few (1 %) channels that terminate in supraglacial lakes tend to be short (mean: 109 m, max: 260 m), as do channels that adjoin a higher-order channel (mean: 169 m, max: 1174 m) (Fig. 5d).
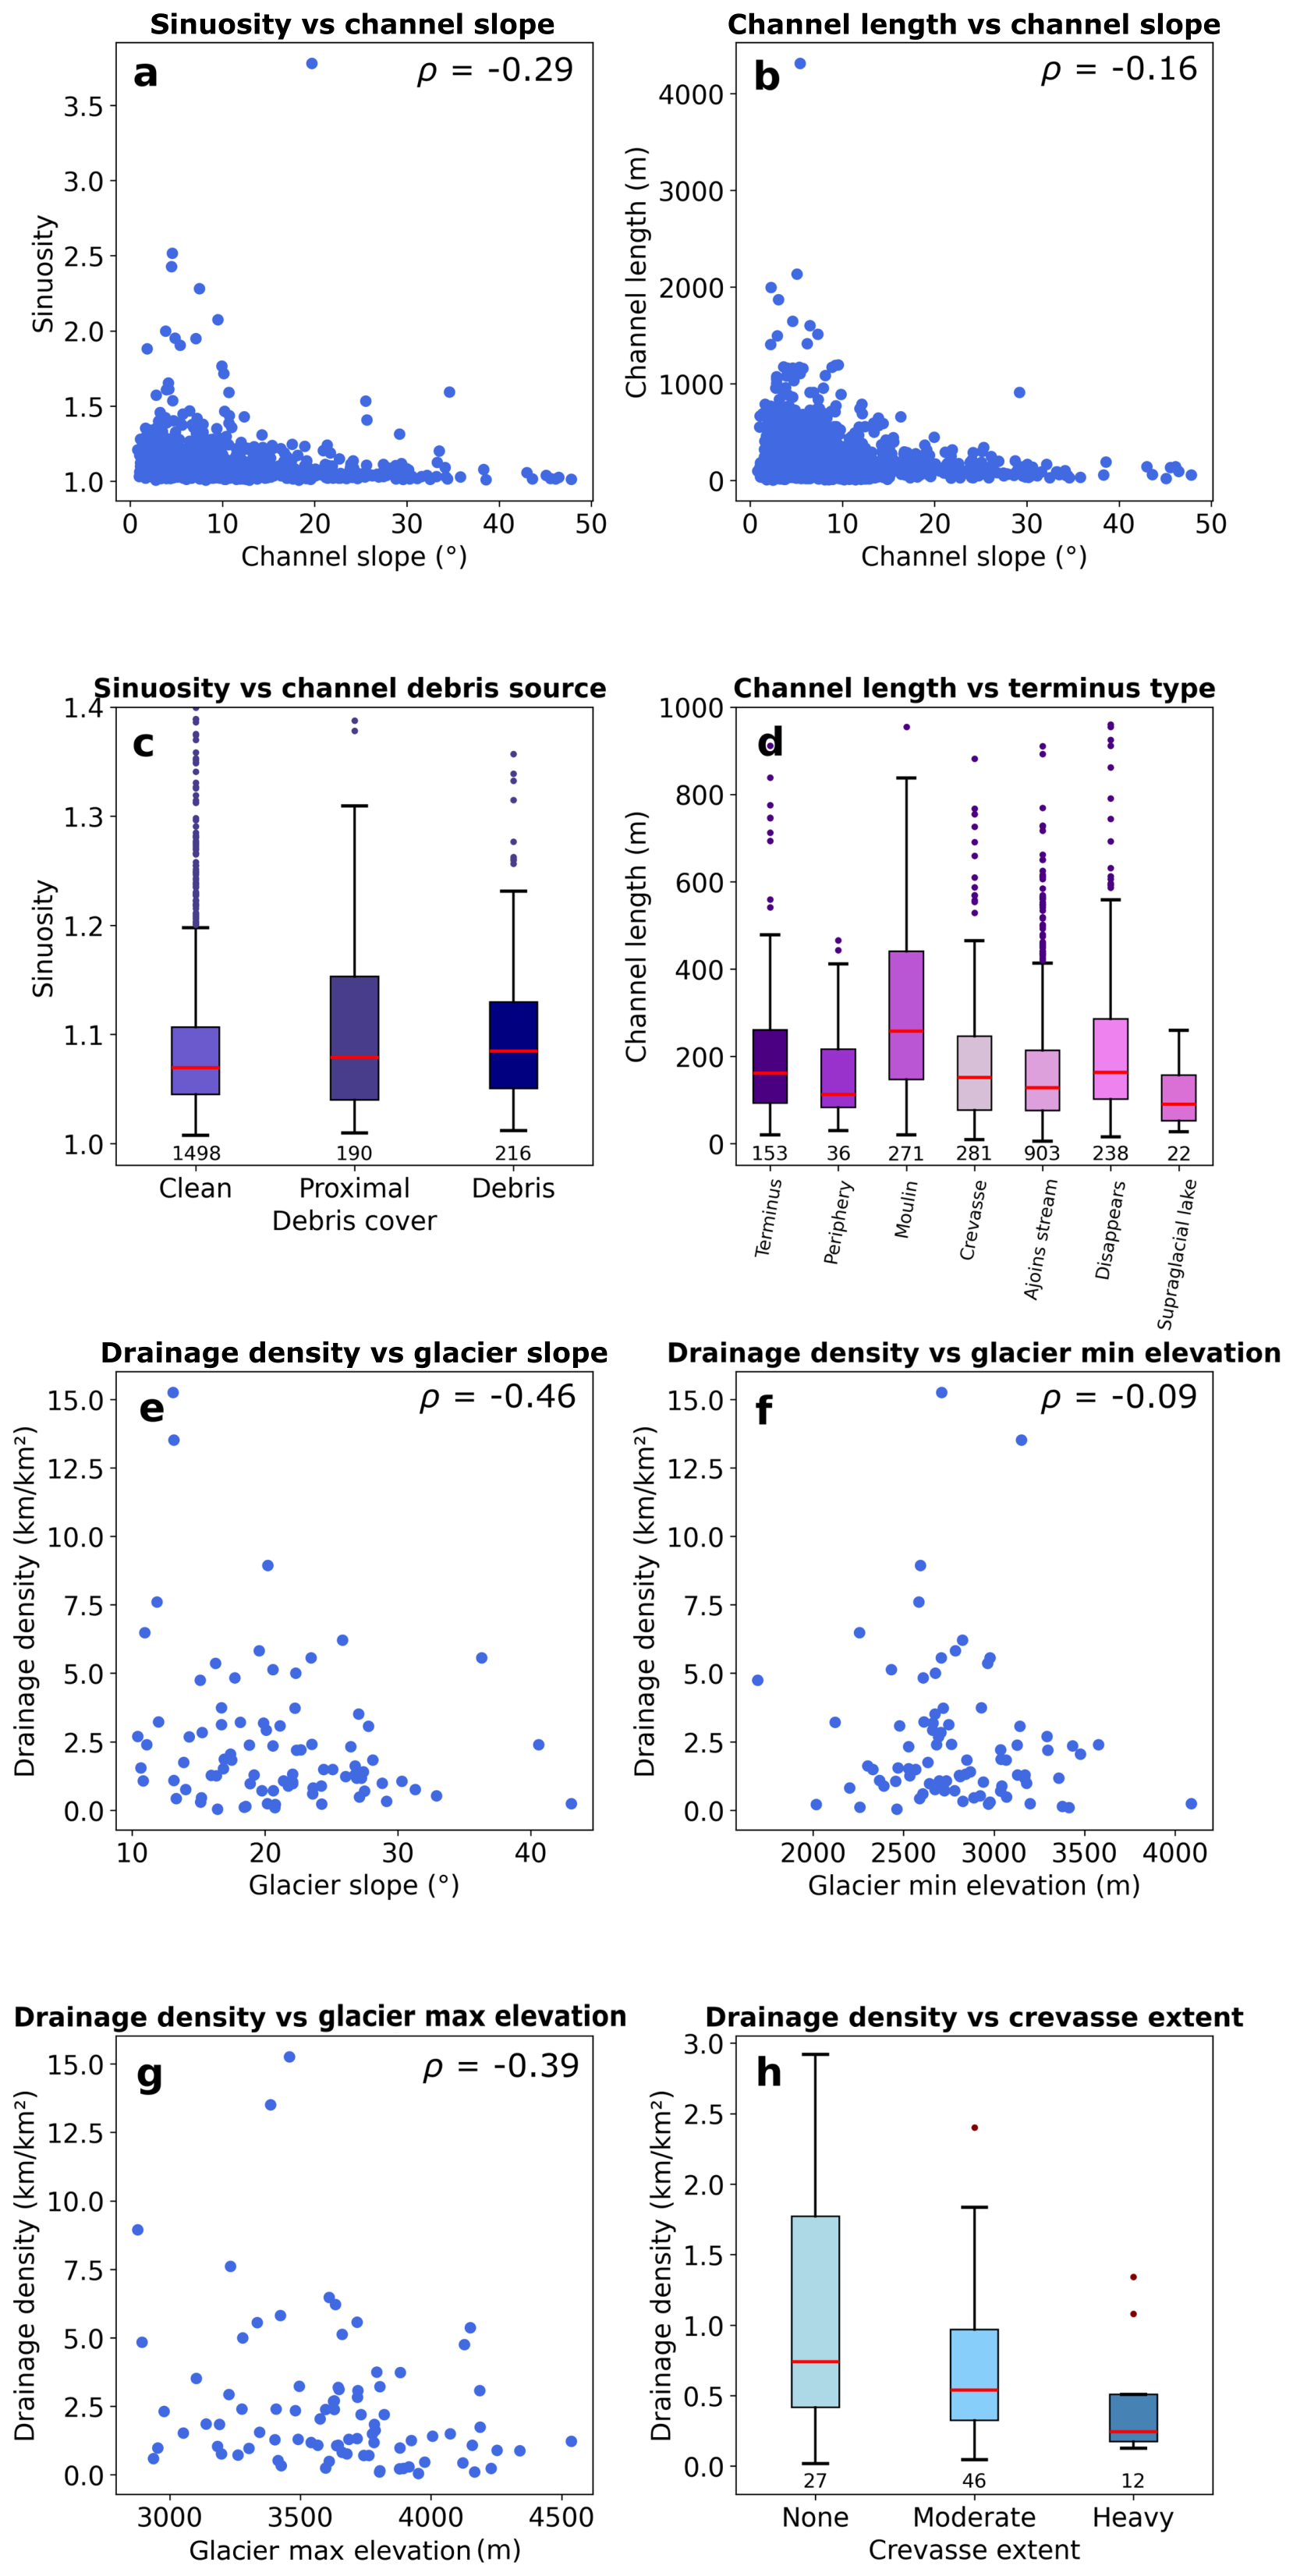
Figure 5Relationships between channel characteristics (a–d) and glacier metrics (e–h). Plots (a)–(d) contain data from 1890 channels, and plots (e)–(h) contain data for the 85 glaciers with visible channels. Spearman's rank (ρ) values are included for all scatterplots, each of which is statistically significant (p<0.05). (a) Sinuosity vs. channel slope (°); (b) channel segment length (m) vs. channel slope (°); (c) sinuosity vs. channel debris source; (d) channel segment length (m) vs. channel terminus type; (e) drainage density (km km−2) vs. glacier slope (°); (f) drainage density (km km−2) vs. minimum glacier elevation; (g) drainage density (km km−2) vs. maximum glacier elevation; and (h) drainage density (km km−2) vs. crevasse extent.
Relationships between glacier metrics (Fig. 5e–h) are less clear than for channel characteristics (Fig. 5a–d), which may be due to the lower number of data points (85 glaciers compared to 1890 channels). However, a moderate negative correlation between drainage density and glacier slope exists, with the highest drainage densities occurring on the lowest surface slopes (Fig. 5e). A relationship between drainage density and minimum glacier elevation is less obvious (Fig. 5f), but there appears to be a peak in drainage density between 2600 and 3100 m a.s.l., which would require further validation from a larger sample of glaciers. By comparison, there is less evidence of a relationship between glacier drainage density and maximum glacier elevation (Fig. 5g). Likewise, there is no statistically significant relationship between glacier aspect and drainage density (Kruskal-Wallis test: p=0.61). Glacier drainage density also tends to be higher on glaciers containing fewer crevasses (Fig. 5h).
4.4 Spearman's rank and Principal Component Analysis
We examined associations between channel morphometry and drainage density by calculating a correlation matrix. We use Spearman's rank correlation (ρ) and significance values (p), as many of our relationships are not linear. Given our large dataset and the fact that most p values are <0.05, even modest correlations are statistically significant and likely reflect genuine relationships.
The strongest association with glacier drainage density is glacier mean elevation (, p≤0.001), with relatively higher drainage densities observed when a larger portion of the glacier area exists at lower elevations (Fig. 6), followed by glacier mean slope (, p≤0.001). This is consistent with Fig. 5e, where the highest drainage densities are observed at glaciers with very low slope angles (e.g., Oberer Theodulgletscher; Fig. 4a).
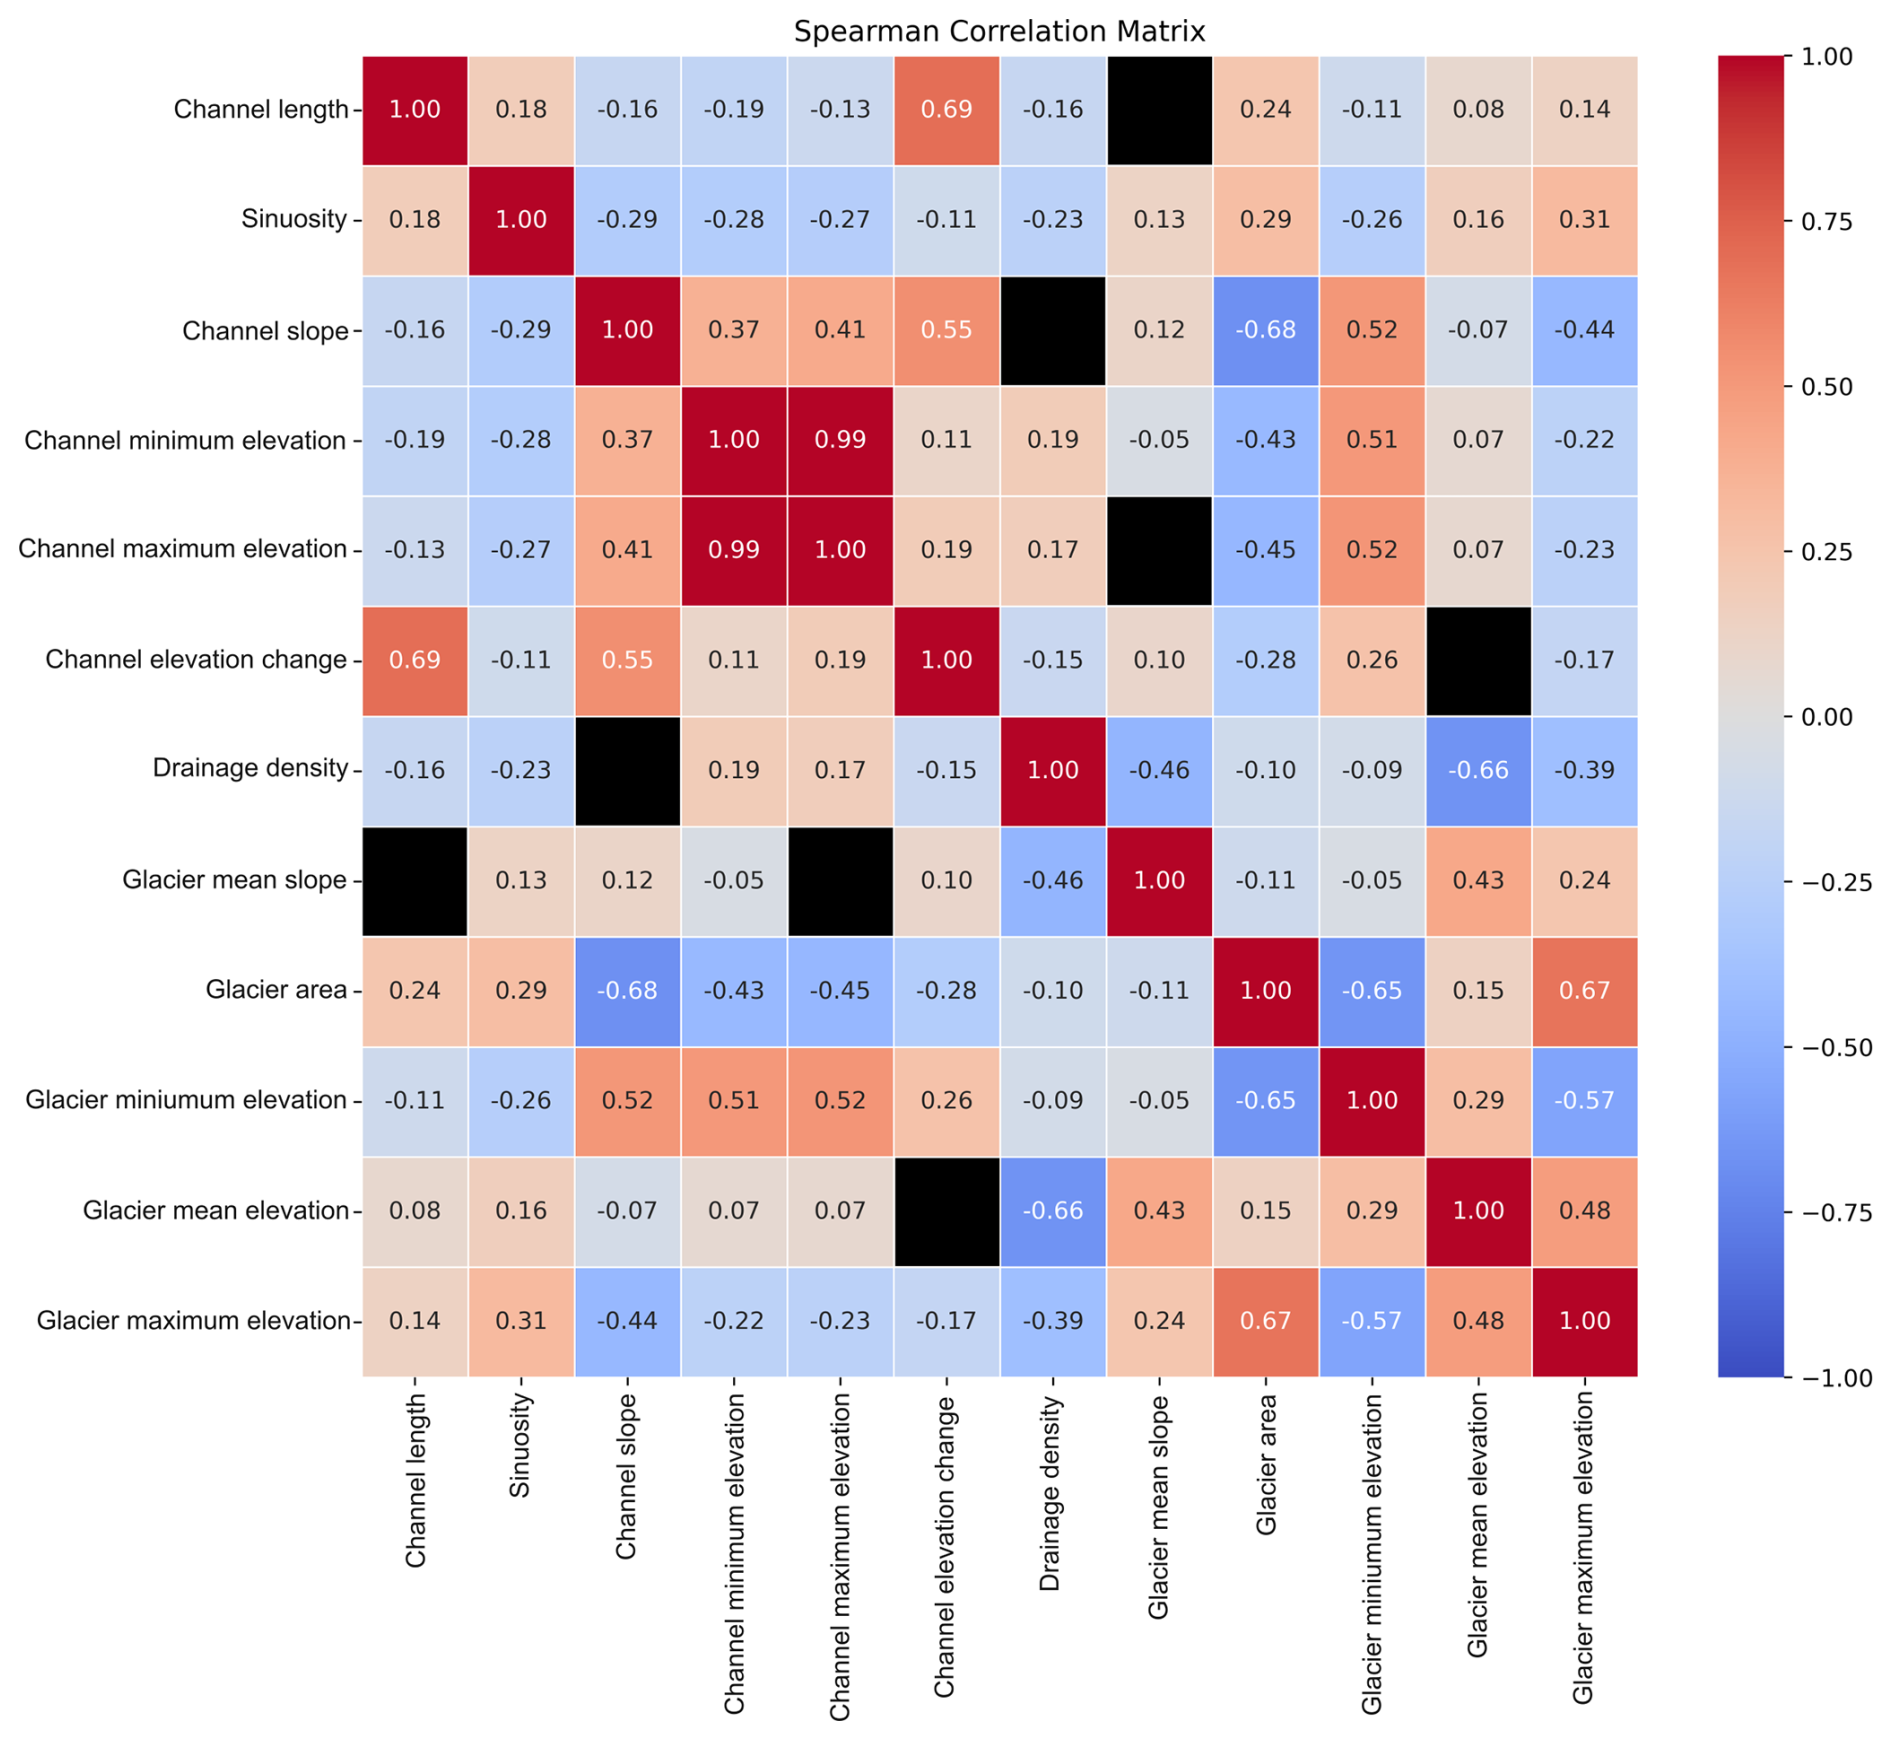
Figure 6A heatmap matrix of Spearman's rank correlation showing the relationship between glacier and channel characteristics. Correlation values are scaled along a colour ramp, and non-significant relationships (p>0.05) are coloured black.
By comparison, channel morphometry is characterised by more complex and weaker relationships between variables. For example, channel sinuosity shows no strong correlation with other variables but does exhibit multiple weak correlations. These show that sinuosity values tend to increase with a decrease in channel slope (, p≤0.001), and the most sinuous channels occur on larger glaciers (ρ=0.29, p≤0.001) with lower minimum elevations (, p≤0.001) (Fig. 6). Channel slope shows strong associations with glacier characteristics. Channels with higher slopes are most common on smaller glaciers (, p≤0.05) that terminate at higher elevations (ρ=0.52, p≤0.05), meaning the steepest channels are likely found at high elevation cirques and hanging glaciers.
To assess the relationship between variables and determine the drivers of variance, we conducted a Principal Component Analysis (PCA) using all channel and glacier variables included in our correlation matrix (Fig. 6). The PCA loadings show that glacier area has a large negative loading on Principal Component (PC) 1, closely followed by strong positive loadings from minimum glacier elevation and channel elevation (maximum and minimum) (Table A1). By comparison, PC 2 shows a strong positive loading from drainage density, and large negative loadings from mean glacier slope and glacier mean elevation (Table A1). PC 1 explains 32 % of the variance in the dataset, followed by PC 2 with 18 %. Together, PCs 1–5 explain 84 % of the variance (Table A1). Given the complexity of the dataset, our analysis using both channel and glacier variables reveals no clear visual clustering of data, but the PCA loadings show an expected relationship between elevation variables and slope variables. However, drainage density is not closely related to any other variable (Fig. A2). Overall, this PCA analysis reveals no single, primary driver of variance; instead, it is apparent that there is a complex, yet interlinked relationship between all variables that explain the distribution and appearance of supraglacial channels.
To further investigate how glacier characteristics affect the properties of channel networks (specifically drainage density and channel termini locations), we conducted an additional PCA and clustering analysis using only glacier characteristics found to have clear associations with drainage density (specifically slope and elevation) based on Spearman's rank correlation (Fig. 6). The clustering analysis revealed that glaciers with visible channels fall into three distinct classes: 51 % are Type A, 43 % are Type B, and 6 % are Type C. Type A glaciers typically contain the steepest slopes (mean: 23.1°), terminate at high elevations (mean: 2,810 m a.s.l.), and have the lowest drainage density in our dataset (mean: 1.8 km km−2) (Type A; Fig. 7). Most channels on these glaciers tend to run directly off the glacier terminus (mean: 95 %). Type B glaciers are typically less steep (mean: 18.9°) and have a lower minimum elevation (mean: 2774 m a.s.l.) than Type A glaciers, along with a slightly higher drainage density (mean: 2.2 km km−2) (Type B; Fig. 7). Most channels on Type B glaciers terminate englacially (87 %), although a small percentage run off at the glacier terminus (13 %). The few glaciers that are classified as Type C have the lowest minimum elevation (mean: 2659 m a.s.l.) and slope (mean: 15.5) in the dataset, and the highest drainage density (mean: 10.4 km km−2) (Type C; Fig. 7). At Type C glaciers, the number of channels that run off at the terminus (49 %) and terminate englacially (51 %) tends to be similar.
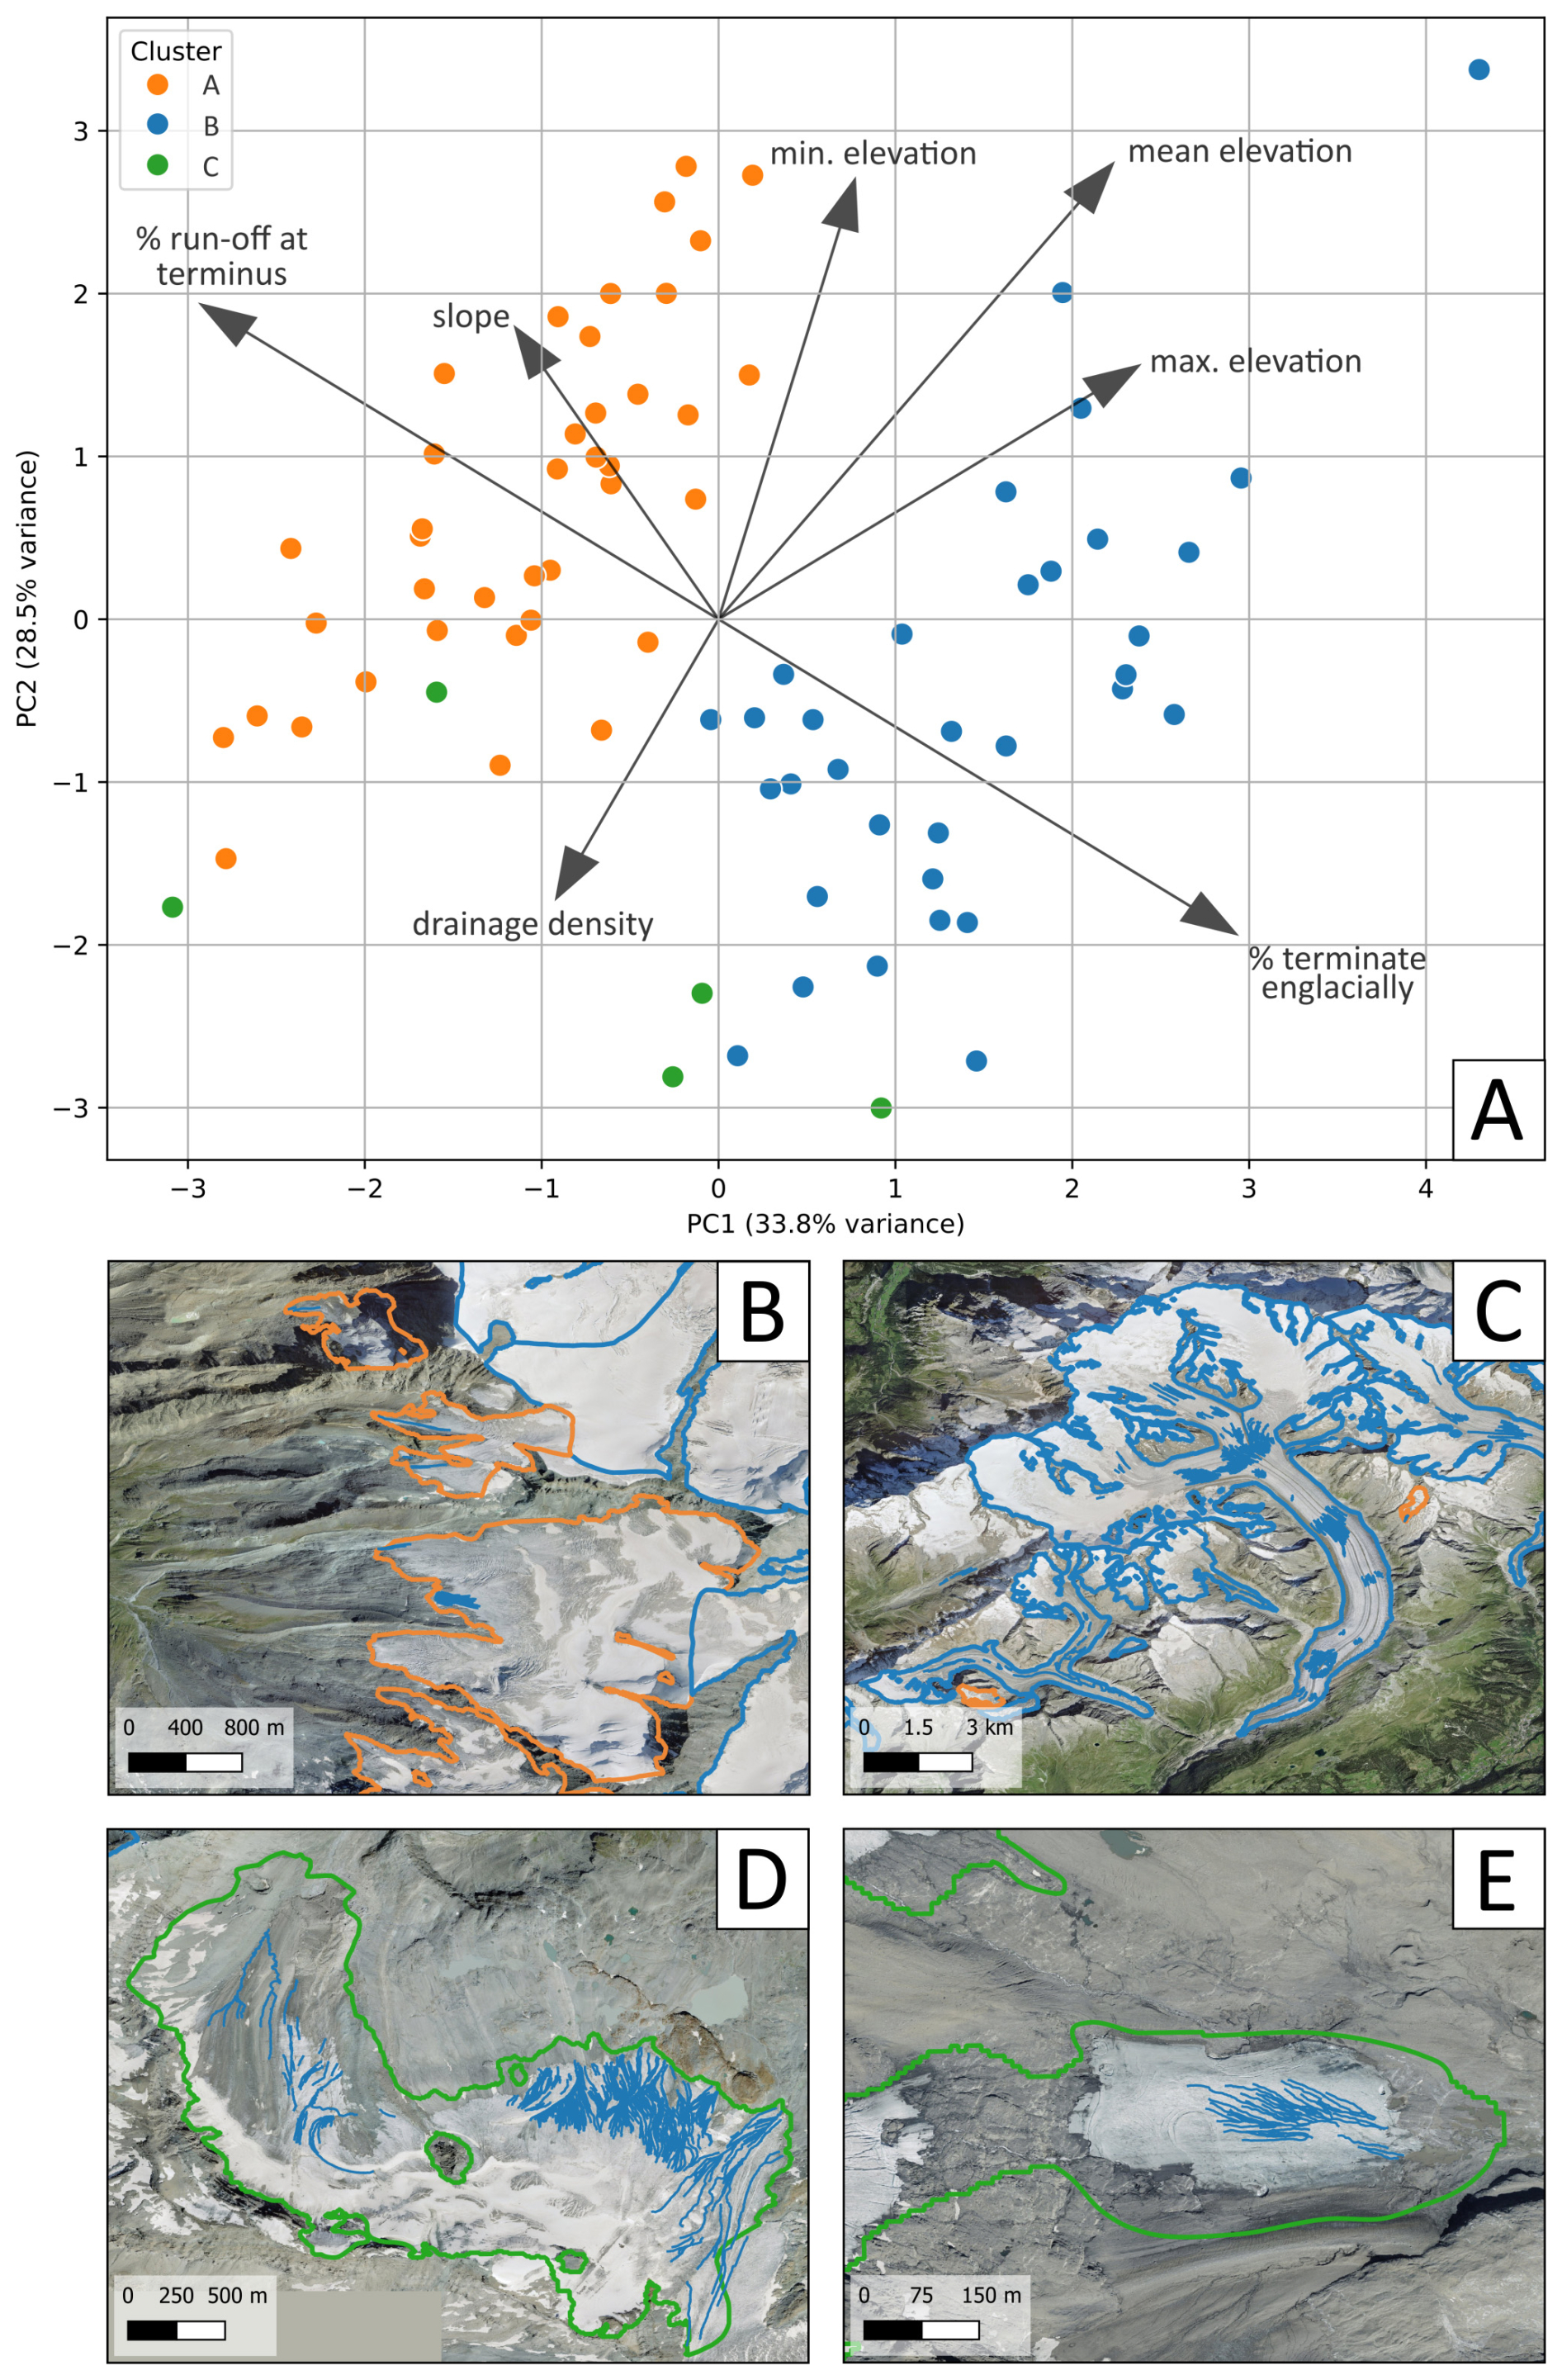
Figure 7Glacier types across Valais categorised according to their terminus locations and characteristics. (A) A principal component analysis biplot of glacier characteristics overlayed with a loading plot. Each point is coloured based on its respective cluster (B). A group of type A glaciers, the largest being Mellichgletscher (centre right). (C) Several type B glaciers, e.g., Grosser Aletschgletscher (center right) and Oberaletschgletscher (far left). (D) An example of a Type C glacier – the Oberer Theodulgletscher. (E) A disconnection that has occurred from the main part of Wildstrubelgletscher. Both parts of the glacier are still treated as one connected mass based on the glacier outlines used, and are classified as Type C.
5.1 The influence of glacier characteristics on supraglacial channel networks
Of the 285 glaciers in our study area, 85 contained channels (>0.5 m) visible in high-resolution imagery (0.1 m) from August/September 2020. All of the largest glaciers (>8 km2) contained visible channels (Fig. 3a), yet there was no clear relationship between glacier size and drainage density (Fig. 6). Instead, we find that drainage density has the strongest associations with glacier elevation (mean and maximum) and mean slope (Fig. 6). Our PCA (PC2; see Table A1 and Fig. A1) further revealed that higher drainage densities (e.g. generally >10 km km−2) are typically found on glaciers with lower mean elevations (e.g. ∼3000 m a.s.l.) and gentler slopes (mean: ∼15°) We interpret the influence of elevation on drainage density as reflecting its control on surface melt rates, with lower-elevation glaciers more likely to support channel development because higher meltwater production is available for widespread channel incision. However, glaciers with a high meltwater supply may not have a high drainage density if the majority of meltwater is intercepted by crevasses (Fig. 5h). This is supported by our finding of lower drainage densities (e.g., ∼2 km km−2) on steeper glaciers (Fig. 6), as steeper slopes typically contain a higher density of crevasses (Jiskoot et al., 2017). In Valais, steep, high-elevation glaciers are typically the smallest glaciers in the region, in the range of 0.1 to 1 km2 (mean slope: 24.6°, mean minimum elevation: 2962 m a.s.l.). These glaciers may contain channel networks below our mapping resolution as channels are likely to be wider where meltwater supply is greater; nevertheless, we suggest that their drainage densities are likely lower than those of other Valais glaciers as our results indicate that even on glaciers with visible channels, high mean elevation and steeper slopes are less favourable for channel formation (Fig. 6).
Our dataset also reveals large inter-glacier variability in meltwater transport pathways. Most of the channels terminate englacially (72 %); however, this is not the case for all glaciers. This figure is skewed by the fact that a few glaciers contain a large proportion of all mapped channels. The percentage of channels terminating englacially differs significantly when calculated for each individual glacier and averaged across the dataset, primarily because the largest glacier (Grosser Aletschgletscher) contains only englacially terminating channels. For this “average” glacier value, approximately 80 % of channels run directly off the glacier terminus, while the remaining 20 % terminate englacially. We also find that a large proportion of glaciers (48 %) only contain channels that run off directly at the glacier terminus, compared to just 3.5 % of glaciers that only contain englacially terminating channels. This inter-glacier variability in channel termini locations is best explained by the range of glacier characteristics present in our dataset. We find that steep, high-elevation glaciers are likely to exhibit the greatest proportion of channels that run directly off the glacier (mean: 95 %) (Type A; Fig. 7). These glaciers are often characterised by heavily crevassed terrain at higher elevations, which appears to inhibit channel formation due to the high density of crevasses intercepting meltwater before channelisation occurs. Where channels do form, they are typically confined to the few lower-relief areas close to the terminus and tend to run directly off it (e.g., Fig. 7B). In contrast, glaciers that largely contain channels that terminate englacially (mean: 87 %) tend to have slightly lower relief slopes and terminate at a lower elevation (Type B; Fig. 7). These glaciers often exhibit a valley glacier configuration and typically contain a combination of heavily crevassed areas (e.g., icefalls) and lower relief zones (e.g., Fig. 7C). Therefore, it is likely that only channels forming down-glacier of densely crevassed areas, or those not intercepted by moulins, reach the glacier terminus. While less common in our dataset, glaciers characterised by particularly shallow slopes (e.g. ∼15°) and low minimum elevations (e.g. ∼2700 m) tend to exhibit a more even balance between channel termini locations (mean: 49 % run off at the glacier terminus, 51 % terminate englacially) (Type C; Fig. 7). We suggest that fewer crevasses may result in a larger proportion of channels reaching the terminus, but where crevasses do occur, they are more likely to intercept channels, as low relief, low elevation glaciers typically have a high drainage density.
The conceptual schematic presented in Fig. 8 characterises glaciers in Valais into three distinct types based on our cluster analysis of glacier properties: Type A, B, and C (Fig. 7). Glacier drainage density is predicted to progressively increase from Type A to C, coinciding with a decrease in glacier slope and lower minimum elevation (Fig. 8). The proportion of meltwater entering englacially is also predicted to decrease from Type A to C, which we suggest is likely to produce distinctly different runoff hydrographs at each glacier type. At Type A glaciers, runoff in response to surface melt is likely characterised by a small, earlier peak from a few supraglacial channels (light blue shading in Fig. 8A) or a slightly delayed peak as crevasses capture meltwater and route it through the en- (and -sub) glacial drainage systems (medium blue shading in Fig. 8A) (e.g., Clason et al., 2015). By comparison, Type B glaciers tend to contain more supraglacial channels; however, these channels are often intercepted by crevassed zones or icefalls. This may result in an initial peak from the few channels that run-off directly at the terminus, followed by a higher peak associated with meltwater that is routed en- (and sub-) glacially (Fig. 8B). Over the melt season, the lag time between meltwater production and peak proglacial discharge typically decreases due to increased subglacial drainage network efficiency (Nienow et al., 1998). Additionally, some Type B glaciers contain small supraglacial and ice marginal lakes (e.g., Gornergletscher and Grosser Aletschgletscher), which may experience infrequent drainage events (e.g., Huss et al., 2007), leading to a sudden peak in proglacial river discharge. Whilst less common in Valais, Type C glaciers are characterised by large shallow sloping areas that often contain extensive supraglacial drainage networks that capture the majority of surface melt (Fig. 8C). This is because shallow slopes typically have smaller and fewer crevasses than most valley glaciers. They tend to have the “flashiest” hydrograph because the supraglacial drainage network rapidly transfers melt off the glacier surface. Interception of this drainage by crevasses or moulins will increase the lag and decrease the amplitude of the hydrograph response.
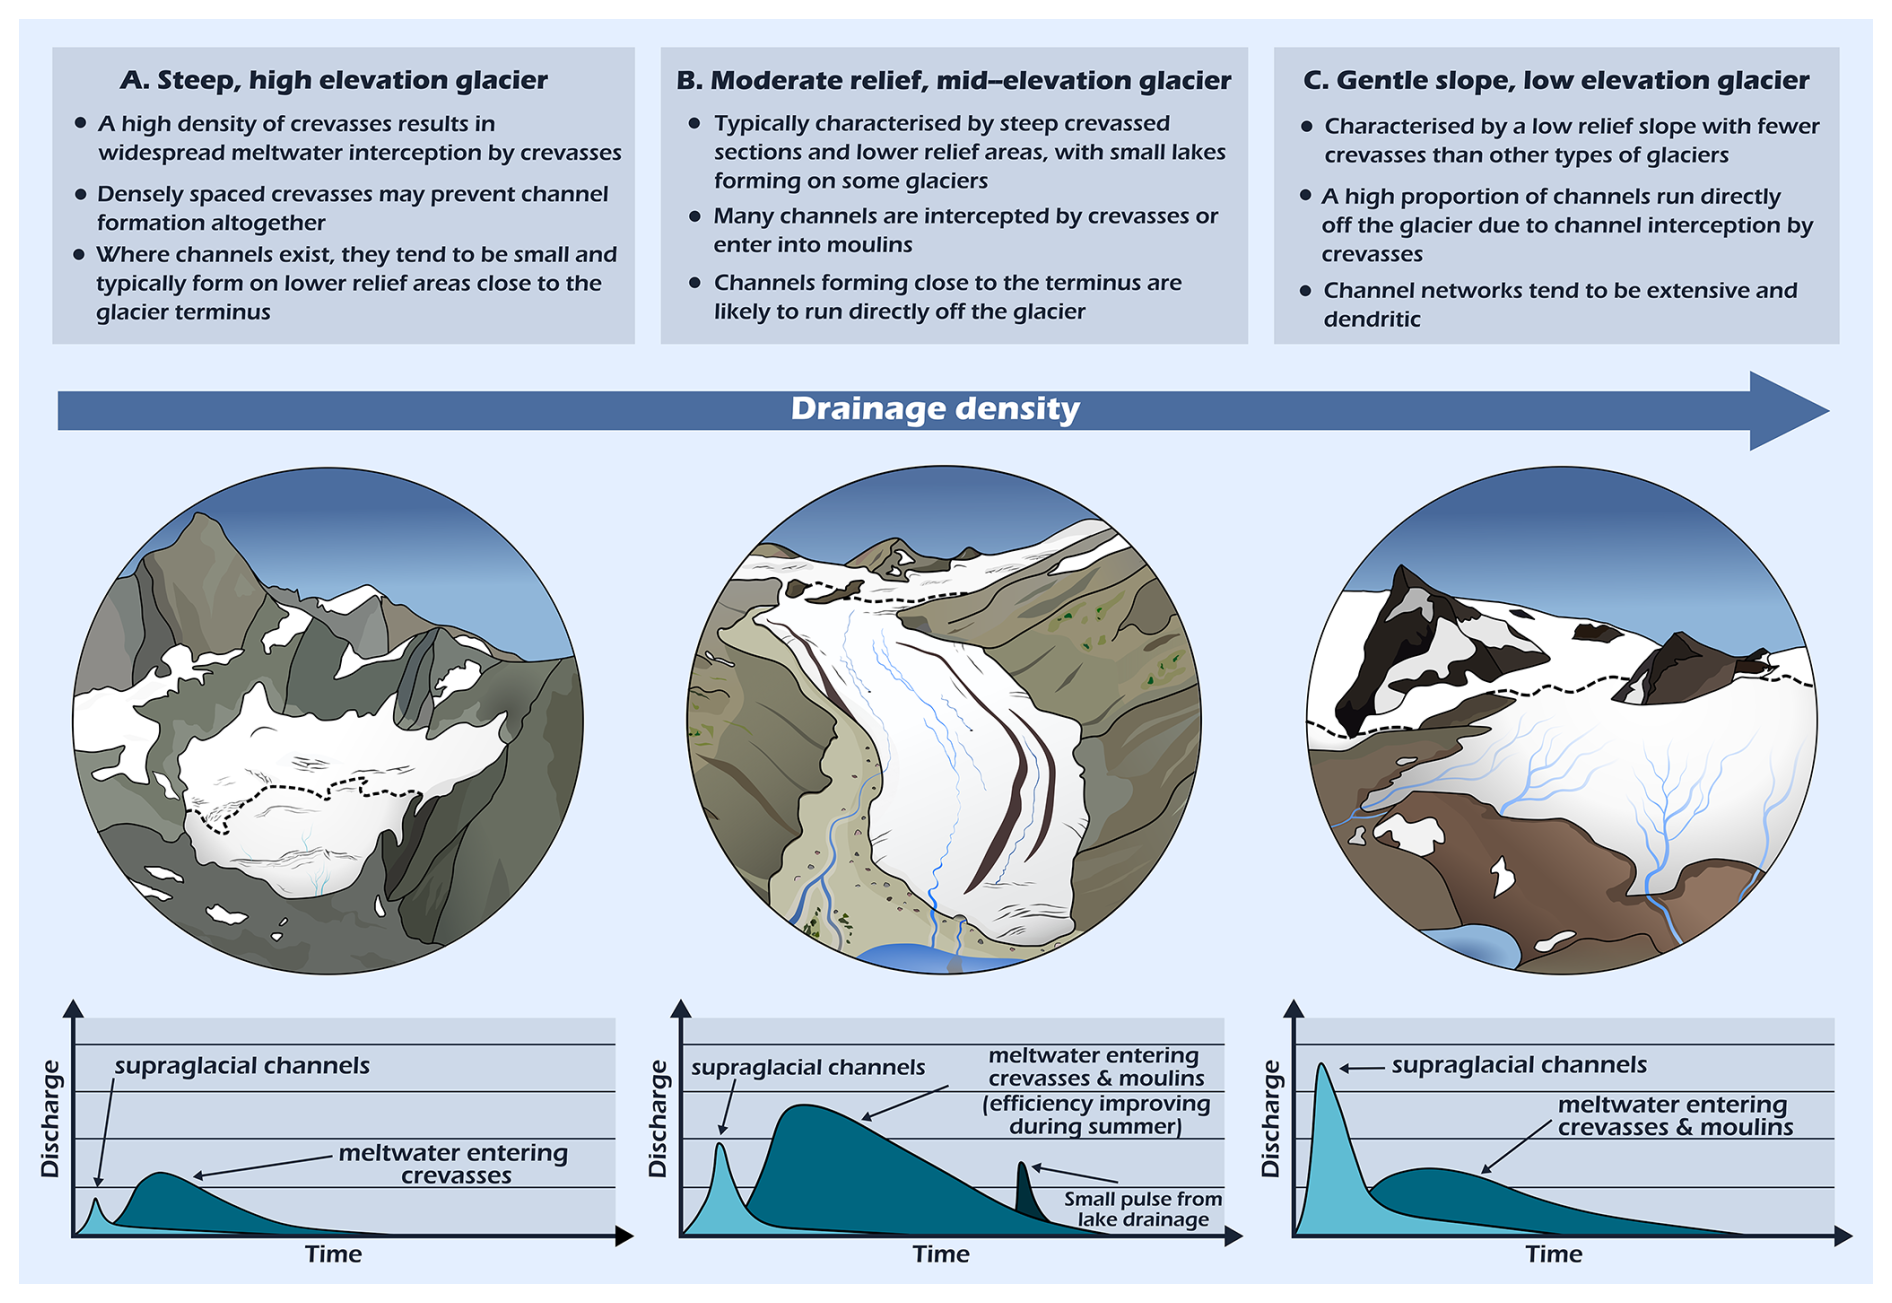
Figure 8A schematic depicting the range of glacier types (A–C) and their respective characteristics, increasing in drainage density from left to right. Each glacier type corresponds to a hypothesised hydrograph (bottom) depicting changes in proglacial channel discharge over an unknown time period (ranging from minutes to days) as a response to a surface melt event. The hydrographs are hypothesised to represent the general characteristics of each glacier's runoff regime (see text for discussion) and do not reflect the complexities of individual measured proglacial stream discharge. Light blue shading shows the hypothesised hydrograph if all the meltwater were to be transported via supraglacial channels, whereas those shown in medium blue show the hydrograph where the bulk of meltwater is transported englacially/subglacially. Dark blue in panel (B) shows a lake drainage event.
We also suggest that categorising glaciers based on their characteristics may allow for first-order predictions to be made about the extent of surface-to-bed meltwater transfer and relative proglacial stream sediment concentrations. For example, glaciers that contain the highest proportion of channels that terminate englacially, i.e., Type B glaciers, are likely to have a higher proportion of surface melt reaching the glacier bed. This may have implications for ice dynamics. Observations of seasonal speed-ups in ice flow velocity at the Grosser Aletschgletscher (Type B; Leinss and Bernhard, 2021), for example, may be more pronounced because all its mapped channels terminate englacially. Additionally, increased meltwater presence at the glacier bed has also been linked to higher rates of subglacial sediment excavation based on model simulations (Delaney and Adhikari, 2020). If subglacial till is present, this could result in higher proglacial stream sediment concentrations if streams are not diluted by freshwater flux from proglacially terminating supraglacial channels. In regions such as the Alps, this is important because proglacial stream sediment concentrations can directly impact agriculture and hydropower infrastructure (Micheletti and Lane, 2016).
5.2 Potential controls on channel morphometry
In Valais, there is a large variation in sinuosity values, with sinuous channels (1.05–1.25) occurring on some glaciers but not others. We find a clear negative association between channel slope and sinuosity, with the most sinuous channels (2.5–1.5) tending to have a low slope (0 to 10°) (Figs. 5a, 6; Table A2); in contrast, steeper channels (>20°) typically do not exhibit a sinuosity over 1.3. This aligns with observations of fluvial systems, where rivers on steeper terrain tend to be less sinuous and have a narrower range of sinuosity values (Schumm, 1963; Frasson et al., 2019). The exact cause and mechanisms of meander formation are still disputed in fluvial systems (Finotello et al., 2024); however, many of these explanations focus on sediment transport (Rhoads and Welford, 1991). While it is apparent that sinuous supraglacial channels can form on areas with and without high volumes of sediment (e.g., Fig. 4d–e), we find some distinct differences in sinuosity between channels with differing proximity to debris. For example, channels are typically least sinuous on debris-free ice, slightly more sinuous on thicker debris cover, and the most sinuous on moderately debris-covered ice (Fig. 5c). It is likely that channels on or close to debris sources contain sediment, which may amplify channel sinuosity, as supported by previous findings of increased sediment transport producing higher sinuosity channels on an Alaskan glacier (Boyd et al., 2024). However, further research is required to better understand the impact of sediment in supraglacial channels on channel properties, as this remains poorly understood. We also find that the relationship between slope and channel sinuosity in our study contrasts with findings from a High Arctic glacier. St Germain and Moorman (2019) reported a positive relationship, suggesting that sinuosity increases with slope. In contrast, our observations indicate that sinuosity typically increases as slope decreases (Fig. 5a). Given the large number of channels we delineated, we are confident that we have reliably captured the relationships among variables in our dataset. We suggest that this discrepancy may be due to differences in sample size or environmental conditions.
5.3 Comparison between Valais glaciers and the Greenland Ice Sheet
Previous research on supraglacial channel networks has predominantly focused on the GrIS (e.g., Smith et al., 2015; Karlstrom and Yang, 2016; Yang and Smith, 2016; Yang et al., 2016, 2021, 2022). We find some similarities between Valais glaciers and the Greenland Ice Sheet (GrIS). For example, both environments show a negative correlation between drainage density and mean elevation (Yang et al., 2016), although this correlation is more pronounced on Valais glaciers (Fig. 6). Channel networks also appear to exhibit visually similar drainage patterns. In Valais, many glaciers exhibit dendritic drainage patterns (e.g., Fig. 4a), similar to the drainage patterns observed on the southwest GrIS, which were found to broadly follow Horton's laws, i.e., mean river length increases with channel order and mean slope decreases with channel order (Yang et al., 2016). However, Valais also contains some more parallel weakly interconnected channel networks (e.g., Fig. 4f). Where parallel channel networks occur on the GrIS, particularly in regions such as Inglefield Land, they tend to be long (<55 km), straight, and are typically found in areas with minimal elevation change and slow ice flow, unlike dendritic channels on the southwest GrIS, which occur on more undulating topography (Yang et al., 2019). Like the GrIS, the range of drainage patterns on Valais glaciers may relate to variations in glacier surface topography. However, it is not known whether parallel networks on Valais glaciers simply occur due to constraints on channel length and density (i.e., glacier area, high crevasse density) (Figs. 5h, 6), or whether, given sufficient distance, these channels would have coalesced to form dendritic patterns.
We also find large inter-glacier variability in channel termini locations between Valais glaciers, whereas this appears to be more regionally consistent on the GrIS (Yang et al., 2019). In Valais, distinct glacier types tend to be characterised by different proportions of channel termini locations (i.e., englacially terminating vs running off at the terminus) (Figs. 7, 8). Hence, the extent of surface-to-bed connections likely varies amongst the Valais dataset, particularly as some glaciers only support englacially-terminating channels (3.5 %) or channels that all run off the glacier (48 %). By comparison, on the southwest GrIS, virtually all higher-order channels terminate in moulins (Smith et al., 2015). Supraglacial lakes also exist in abundance on the GrIS, providing potential for interannual storage and rapid meltwater drainage to the bed (Chu, 2014). Given few channels in Valais terminate in lakes (Fig. 5d), except for small lakes on Gornergletscher and Grosser Aletschgletscher (e.g., Fig. 4e), it is likely that proglacial stream discharge here is more closely linked to surface melt and rainfall.
More extensive debris cover on Valais glaciers compared to the GrIS could also result in differences in channel morphology and distribution. For instance, we find that more sinuous channels often occur close to debris accumulations (see Sect. 5.2), which may suggest that channel sinuosity is, in part, modulated by its sediment content. Widespread debris cover will also affect surface topography. For example, larger-scale features (e.g., medial and lateral moraines) may influence meltwater transport by restricting the pathways for meltwater runoff. It might also be expected that the topographic depressions that typically occur at this ice-debris interface influence the accumulation of high amounts of meltwater. Therefore, large channels may be expected to disproportionately form parallel to moraines (e.g., Fig. 4b). On a smaller scale, the presence of debris may notably affect surface roughness, which in some cases has been associated with higher channel densities (Rippin et al., 2015). Hence, debris may play a significant role in controlling channel distribution and morphology, particularly in mountainous regions where debris is more abundant than in ice sheet settings. Nevertheless, even on the GrIS, where debris cover is comparatively limited, the presence of dust, black carbon, algae, and cryoconite deposits may still exert an influence on channel distribution and morphometry (e.g., Ryan et al., 2018; Leidman et al., 2021; Khan et al., 2023).
5.4 Outlook and future evolution of supraglacial channel systems
The impact of climatic warming on supraglacial drainage networks is not fully understood, but previous research on ice sheets suggests that supraglacial drainage networks are likely to continue expanding to higher elevations due to rising equilibrium lines (Leeson et al., 2015). Whether discharge in current channels increases or decreases depends on the rates of glacier retreat and surface lowering, driven by ablation. It is likely that larger glaciers will see an increase in channel discharge due to rising equilibrium lines and associated higher rates of surface melt (St Germain and Moorman, 2019). However, the reduction in area for smaller glaciers may be sufficient to prevent the formation of efficient drainage networks. Changes in glacier slope could also result in a reconfiguration of the drainage system (e.g., new crevasses may intercept channels that formerly reached the glacier terminus), which may affect drainage density (Fig. 5e). This may also result in increased disconnections (i.e., separation of the accumulation and ablation area), as observed at a Type C glacier (Fig. 7E). Such disconnections (see Davies et al., 2024) may result in high channel densities on the isolated ice mass due to accelerated downwasting. Additionally, glaciers in some mountain environments are undergoing an increase in debris cover (e.g., Glasser et al., 2016; Fleischer et al., 2021), and it is not fully understood how changes in debris cover will affect surface meltwater supply and transport, channel morphometry and morphology, and surface albedo (e.g., Leidman et al., 2021).
Future research could benefit from utilising the growing repository of high-resolution orthophoto surveys to improve our understanding of supraglacial hydrology in mountain glacier settings. Increased understanding of seasonal and interannual channel evolution is needed to better inform modelling of glacier hydrology. For example, it is not clear whether our findings would also apply to regions with larger glaciers and lower rates of surface lowering (e.g., the Arctic), so future studies could repeat our work in such regions. Lastly, further in-situ measurements would be beneficial to determine whether the channels delineated as part of this study represent the majority of meltwater transport on Valais glaciers or whether channels below our mapping resolution also play a key role in meltwater transport.
This study presents the first comprehensive dataset on the distribution and characteristics of supraglacial channels at a regional scale in a mountain glacier environment. From a sample of 285 glaciers in Valais Canton, Switzerland, we identified 85 glaciers that contained channels above our mapping resolution (0.5 m wide). We found that while glaciers containing visible channels have a larger mean area (5 km2) than those without (0.6 km2), glacier area alone is not a good predictor of drainage density. Rather, our findings suggest that variability in drainage density is most strongly controlled by glacier surface slope and mean elevation. These variables enabled the classification of glaciers in Valais into distinct types, each characterised by different drainage densities. Type C glaciers are characterised by both low mean elevations and low-angle slopes, and they exhibit the highest drainage densities, likely due to a greater meltwater supply and fewer crevasses, which can fragment channel networks or, when present at high densities, inhibit channel formation altogether. Type B glaciers are intermediate between Types C and A, the latter of which typically contain very few channels and are the steepest and highest-elevation glaciers in Valais.
There is also notable inter-glacier variability in the proportion of channels terminating englacially (i.e., in moulins or crevasses), which is also consistent with our glacier classification. The highest proportion of channels that run directly off the glacier is observed at steep, high-elevation glaciers. The few channels that are present tend to form close to the terminus on flatter, less crevassed terrain, meaning that almost all channels run off the terminus. In contrast, up-glacier, most meltwater is captured prior to channelisation due to densely spaced crevasses. Glaciers with moderate relief slopes and mid-range mean elevations tend to have the highest proportion of englacially terminating channels and typically have a moderate drainage density. Many of these channels are intercepted by crevassed zones before they reach the terminus. In contrast, low-relief, low-elevation glaciers display a mixture of channel termination types. These glaciers often have very high drainage densities, and, due to fewer crevasses, many channels run off the terminus. However, where crevasses are present, they are more likely to intercept channels. Consequently, hydrograph responses to surface melt and the extent of surface-to-bed connections are likely to vary between different glacier types. This contrasts with the Greenland Ice Sheet, where channels frequently terminate in lakes, which is uncommon in Valais. We also suggest that proglacial stream discharge in Valais likely exhibits a more immediate response to melt events, with reduced lag times due to minimal opportunity for supraglacial storage.
Lastly, we observe that channel and drainage network characteristics vary across our dataset. We find that higher channel sinuosities tend to occur on lower glacier surface slopes, consistent with observations from fluvial systems. Our findings also suggest that the transport of sediment into channels from nearby sources may increase sinuosity, although further research is needed to investigate the influence of debris cover on channel morphometry. The networks we observe commonly exhibit dendritic patterns, which closely resemble those on the southwest Greenland Ice Sheet that have been found to broadly follow Horton's Laws. Additionally, some less-connected channel networks are observed, which also occur on ice sheets. It is not known whether these less-connected networks form due to topographic controls, as in ice sheet settings, or whether they could become dendritic in the absence of controls on their length (i.e., glacier area or crevasse and moulin capture). Lastly, future research should investigate how drainage networks on rapidly thinning glaciers, such as those in the Alps, will evolve under climate warming, as alterations in glacier slope, elevation, and debris cover are likely to impact drainage density and the routing of meltwater.
Table A1The eigenvectors for Principal Components 1 to 6 from a PCA analysis of glacier and channel characteristics, with Principal Component 1 being the most significant. The three largest loadings for each principal component are in bold.
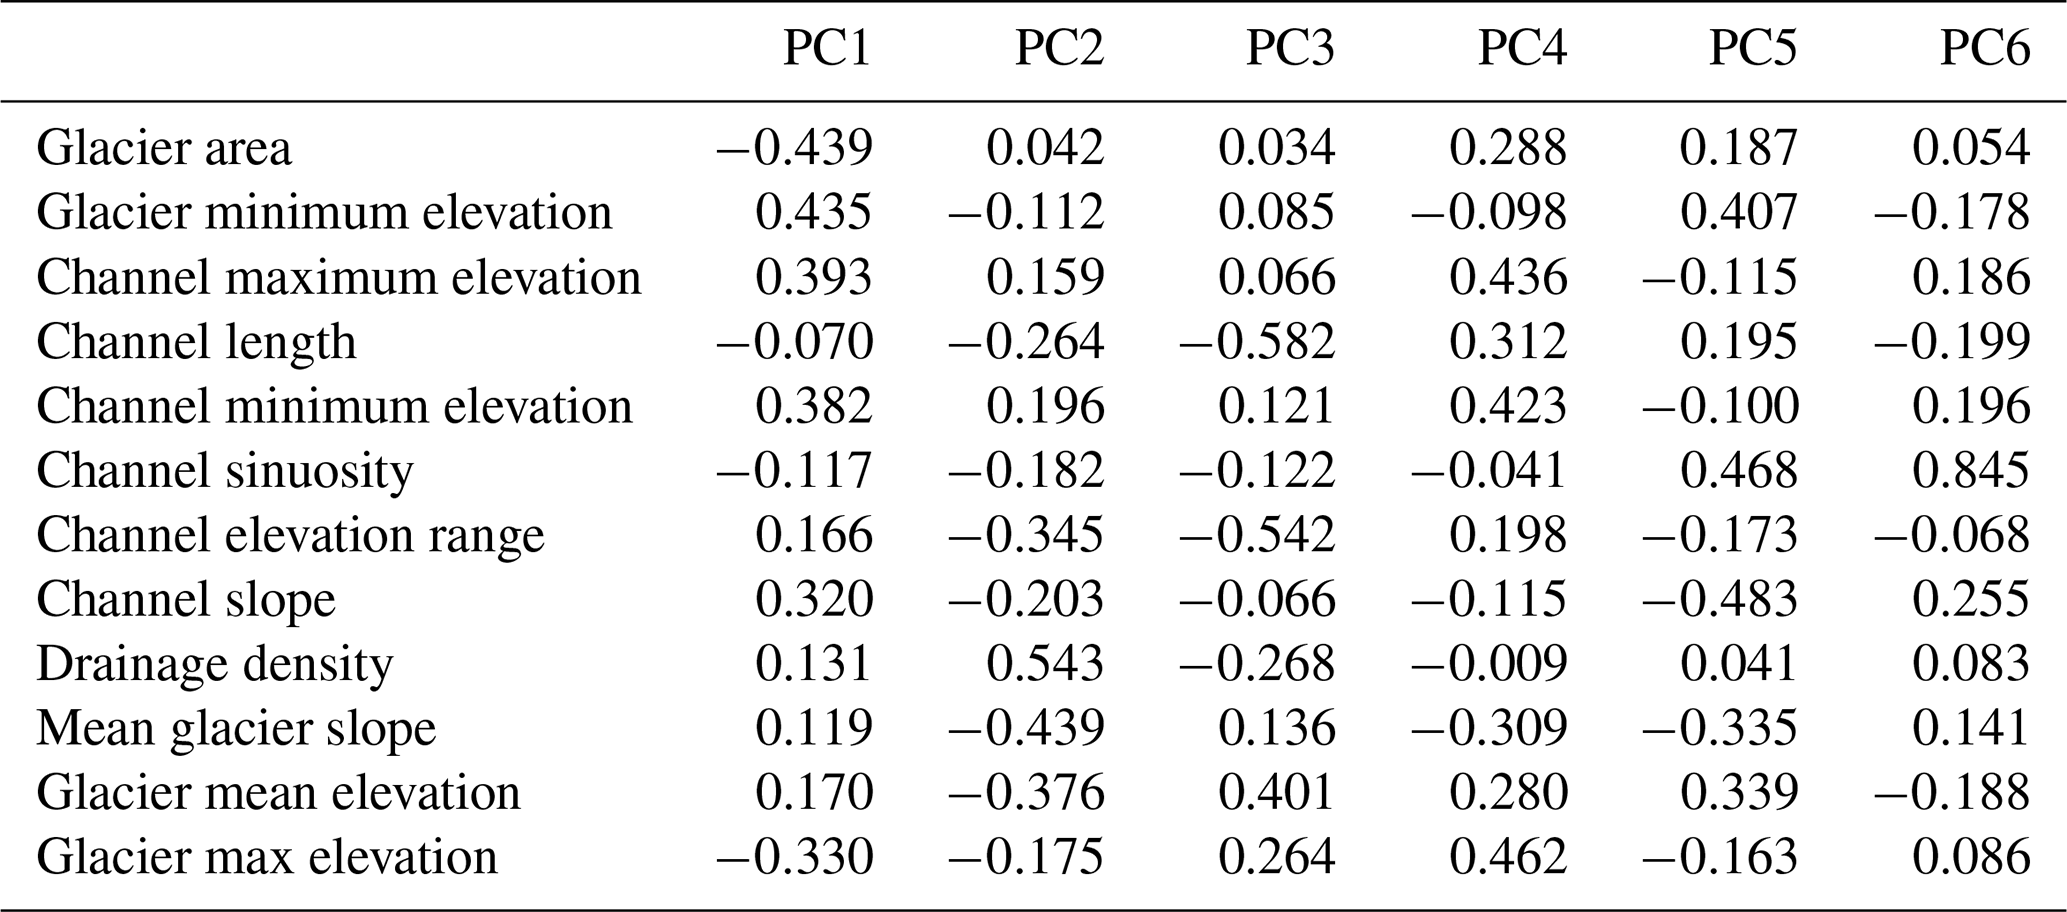
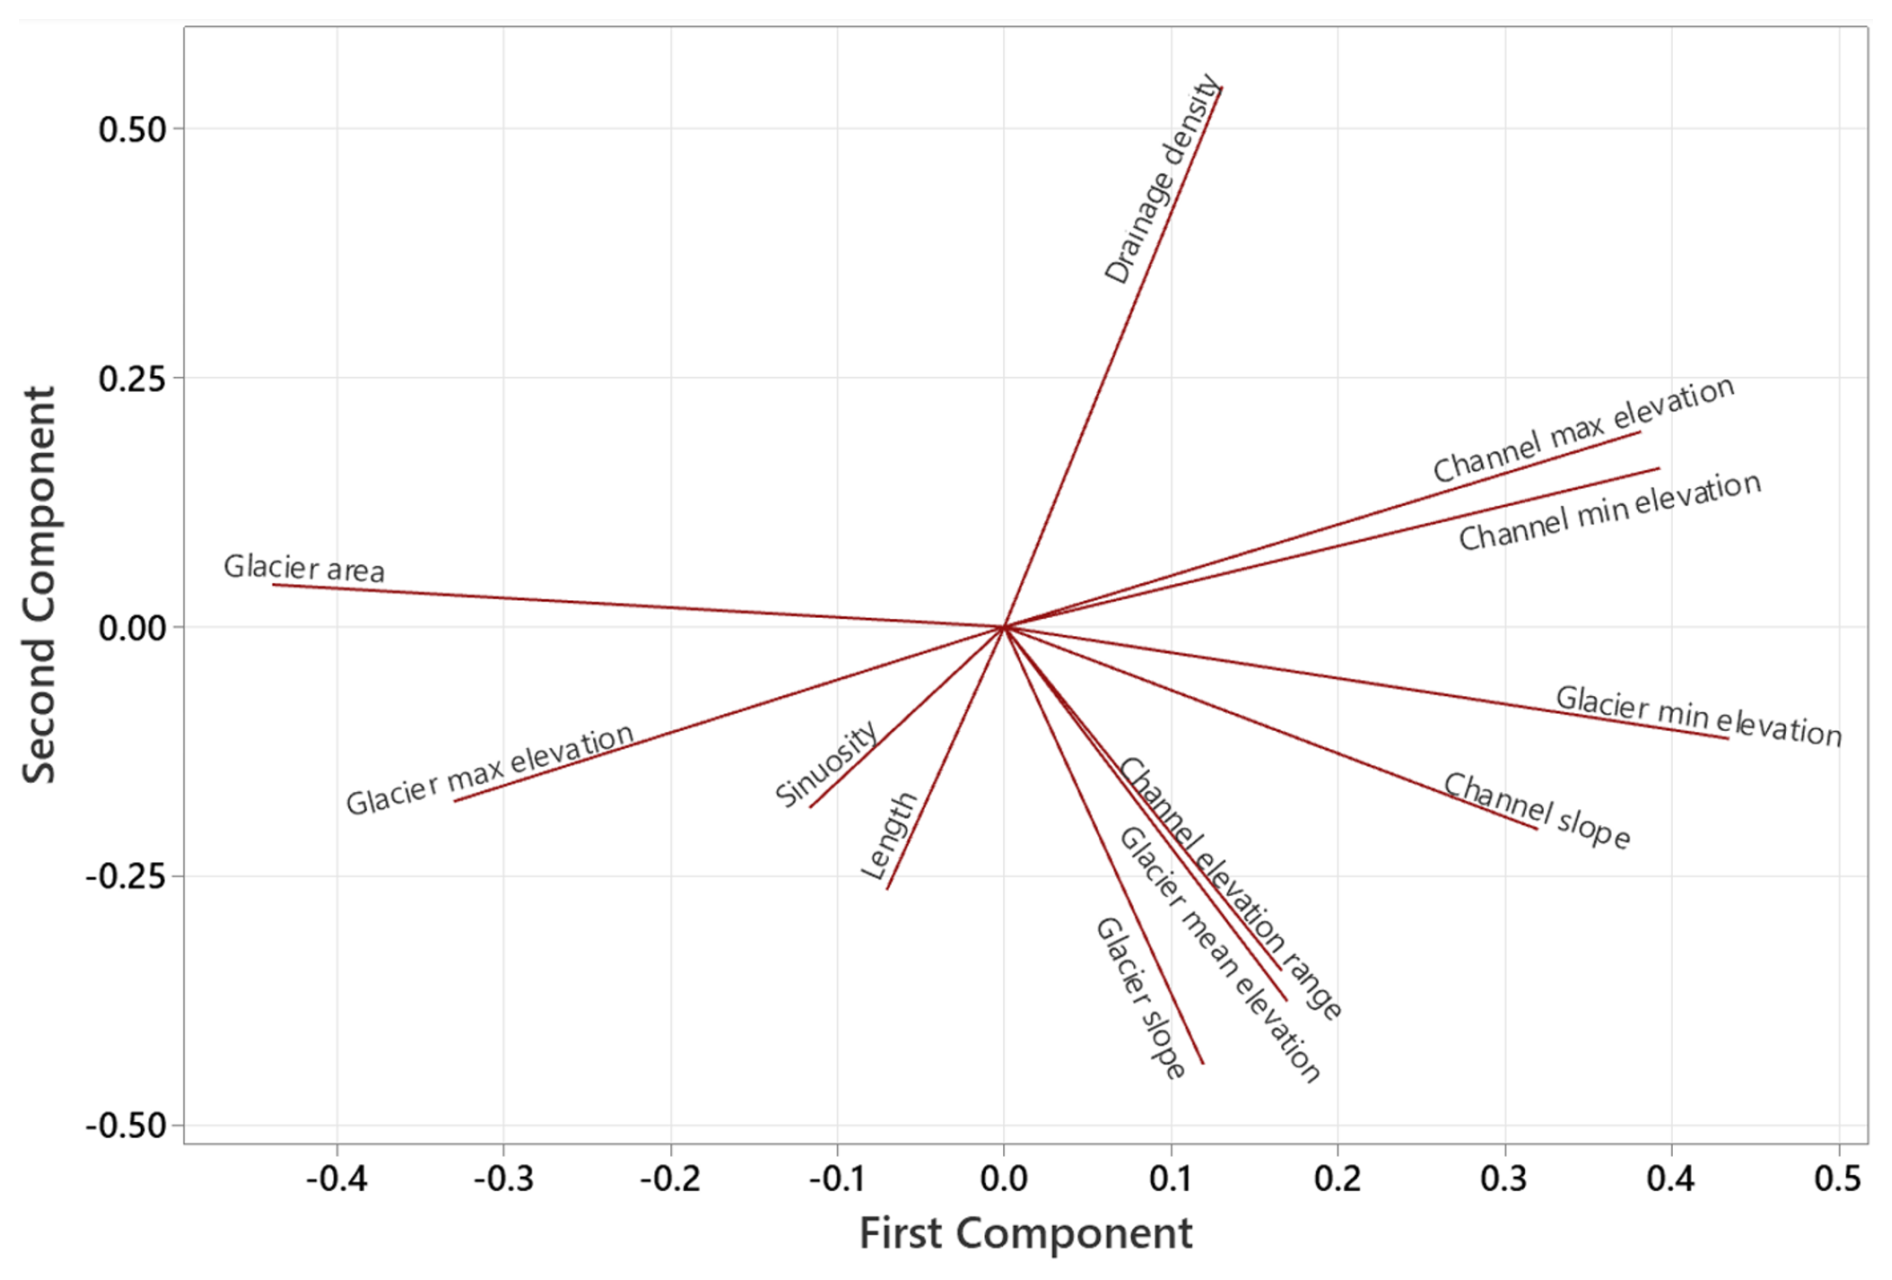
Figure A1Loading plot for Principal Components 1 and 2 from a PCA analysis of glacier and channel characteristics.
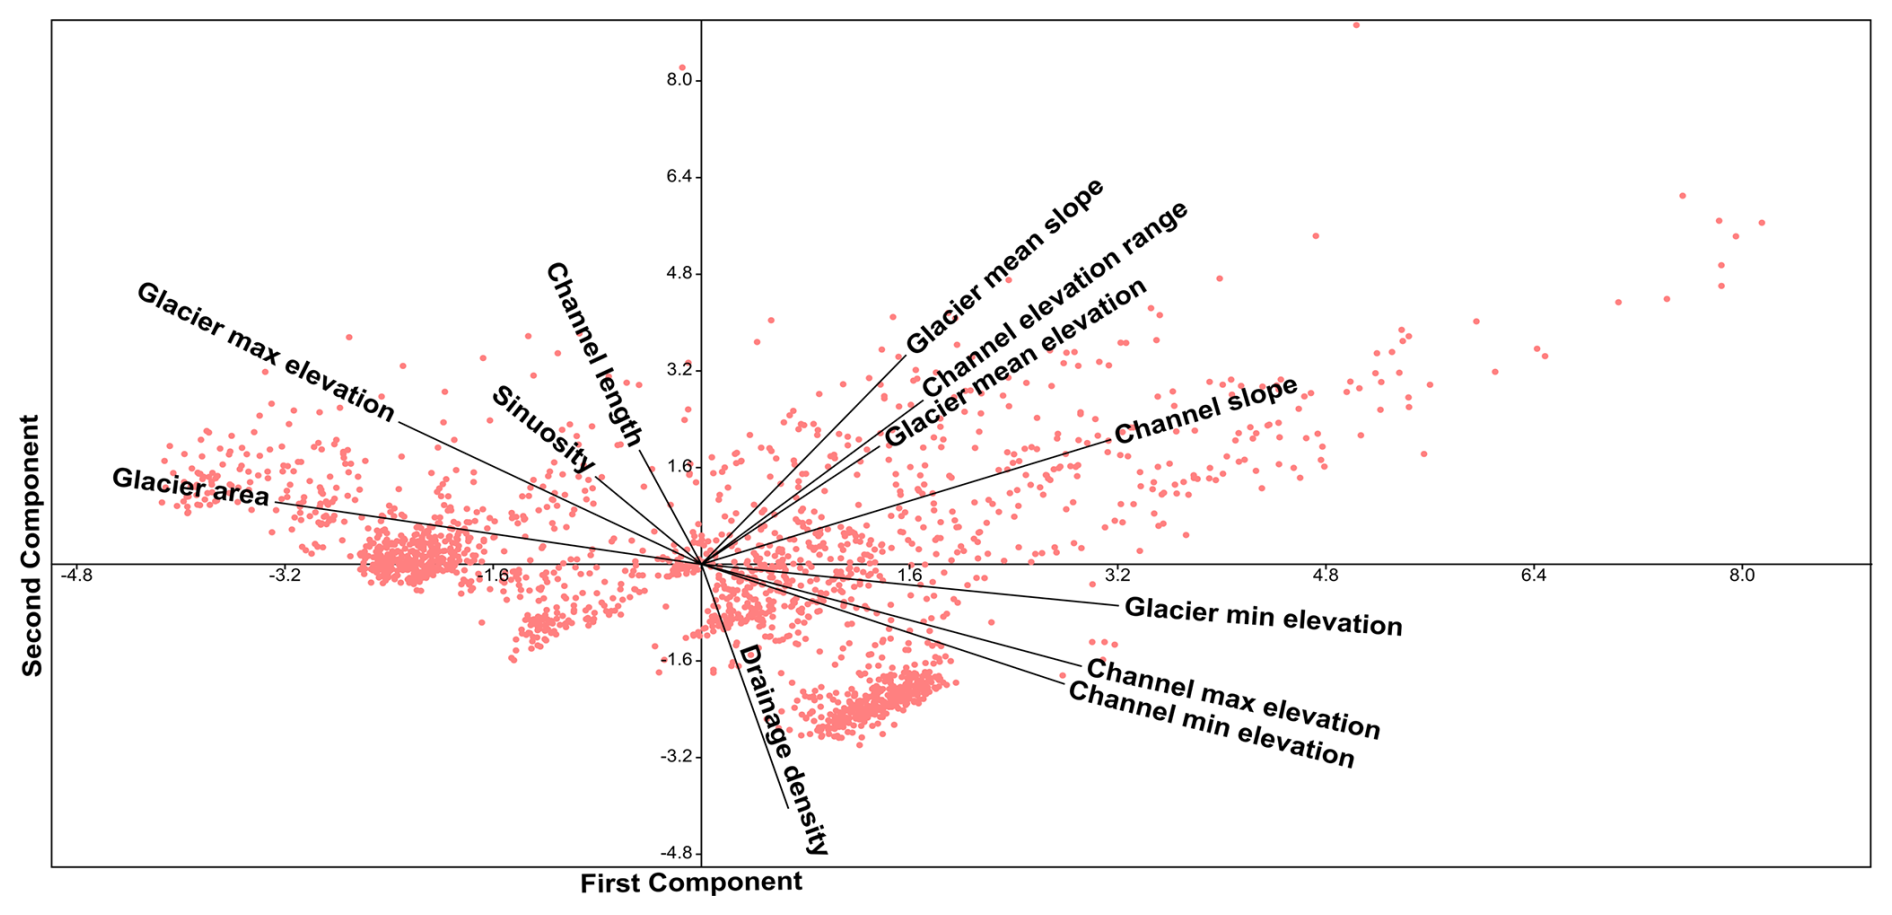
Figure A2A biplot from a PCA analysis showing Principal Components 1 and 2, which were used for visually identifying clusters and overlayed with a loading plot (see Fig. A1).
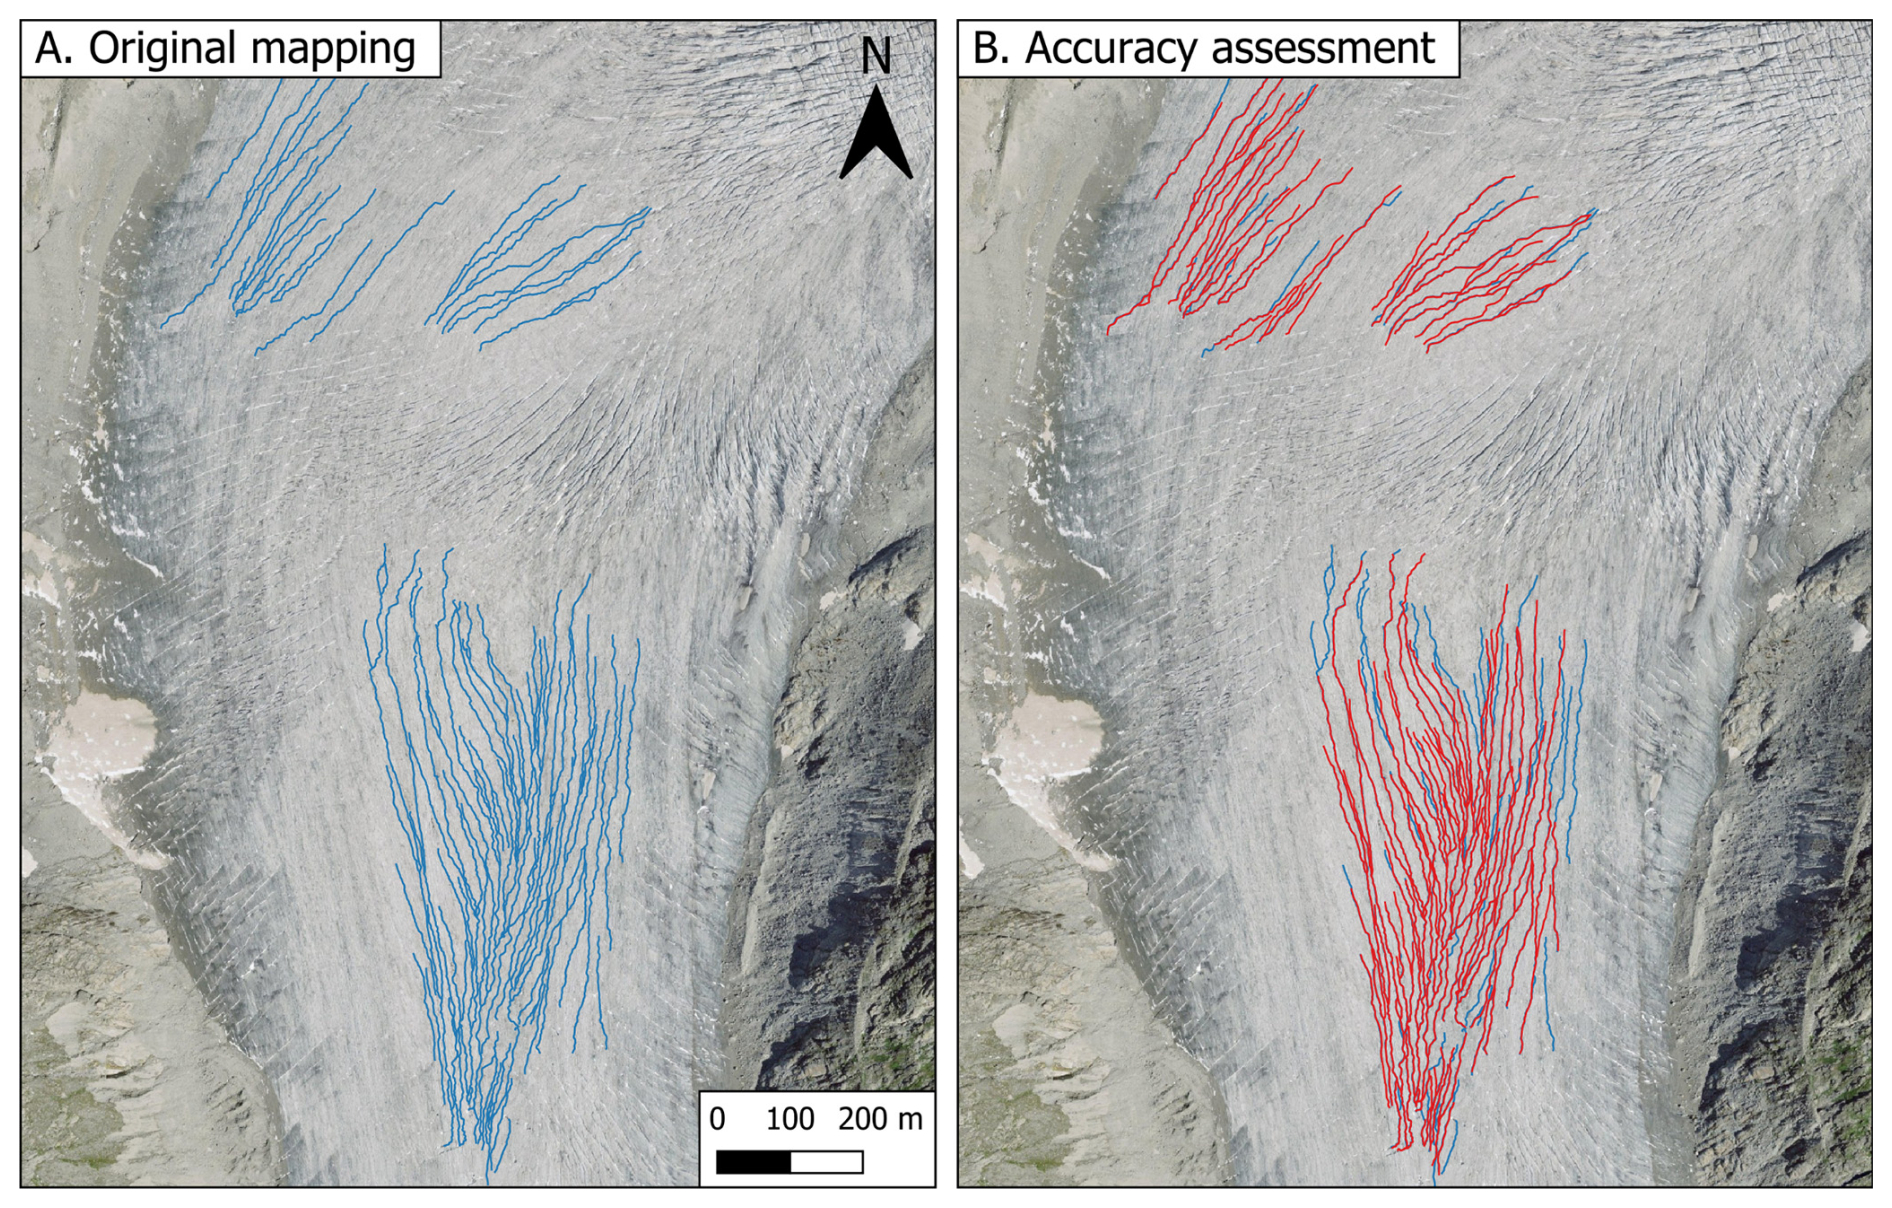
Figure B1Repeat mapping of the Rhonegletscher used to determine mapping accuracy. (A) Mapping from this dataset is shown in blue. (B) A comparison between the repeat mapping (red) and the original mapping (blue) was undertaken independently after several weeks had elapsed.
The orthophoto and DEM data used in this study are freely available on the SwissTopo website (https://www.swisstopo.admin.ch/, last access: 7 September 2024). Outlines of glaciers in Valais were obtained from Glacier Monitoring in Switzerland (GLAMOS) and are available online (https://glamos.ch/, last access: 14 January 2024). The produced supraglacial channel data is available upon request from the corresponding author (Holly Wytiahlowsky: holly.e.wytiahlowsky@durham.ac.uk).
All authors contributed to the conceptualisation of this project. HW conducted the mapping, analysis and data visualisation under the supervision of CRS, RAH, CCC and SSRJ. HW led manuscript writing with comments and edits provided by all authors.
At least one of the (co-)authors is a member of the editorial board of The Cryosphere. The peer-review process was guided by an independent editor, and the authors also have no other competing interests to declare.
Publisher's note: Copernicus Publications remains neutral with regard to jurisdictional claims made in the text, published maps, institutional affiliations, or any other geographical representation in this paper. While Copernicus Publications makes every effort to include appropriate place names, the final responsibility lies with the authors. Views expressed in the text are those of the authors and do not necessarily reflect the views of the publisher.
This work was supported by the Natural Environment Research Council via an IAPETUS2 PhD studentship held by Holly Wytiahlowsky. We thank SwissTopo for making their orthophotos and DEM data open access. We thank two anonymous reviewers and Ian Willis for their constructive feedback, which has helped to improve this paper, and Kang Yang for acting as editor for the manuscript.
This research has been supported by the UK Research and Innovation (grant no. NE/S007431/1).
This paper was edited by Kang Yang and reviewed by Ian Willis and two anonymous referees.
Bamber, J. L., Oppenheimer, M., Kopp, R. E., Aspinall, W. P., and Cooke, R. M.: Ice sheet contributions to future sea-level rise from structured expert judgment, P. Natl. Acad. Sci. USA, 116, 11195–11200, https://doi.org/10.1073/pnas.1817205116, 2019.
Banwell, A., Hewitt, I., Willis, I., and Arnold, N.: Moulin density controls drainage development beneath the Greenland ice sheet, J. Geophys. Res.-Earth Surf., 121, 2248–2269, https://doi.org/10.1002/2015JF003801, 2016.
Bell, R. E., Chu, W., Kingslake, J., Das, I., Tedesco, M., Tinto, K. J., Zappa, C. J., Frezzotti, M., Boghosian, A., and Lee, W. S.: Antarctic ice shelf potentially stabilized by export of meltwater in surface river, Nature, 544, 344–348, https://doi.org/10.1038/nature22048, 2017.
Boyd, B., Goetz, S. L., and Ham, N. R.: Supraglacial stream incision into debris-covered ice, Matanuska Glacier, AK, Geol. Soc. Am. Abstr., 36, 11, https://gsa.confex.com/gsa/2004NC/webprogram/Paper71537.html (last access: 1 December 2025), 2024.
Brice, J. and Blodgett, J.: Countermeasures for hydraulic problems at bridges, volume I: analysis and assessment, Federal Highway Administration, Washington, report no. FHWA-RD-78-162, https://rosap.ntl.bts.gov/view/dot/25311 (last access: 1 December 2025), 1978.
Carey, M., Molden, O. C., Rasmussen, M. B., Jackson, M., Nolin, A. W., and Mark, B. G.: Impacts of glacier recession and declining meltwater on mountain societies, Ann. Am. Assoc. Geogr., 107, 350–359, https://doi.org/10.1080/24694452.2016.1243039, 2017.
Chen, J., Hodge, R. A., Jamieson, S. S. R., and Stokes, C. R.: Distribution and morphometry of supraglacial channel networks on Antarctic ice shelves, J. Glaciol., https://doi.org/10.1017/jog.2024.99, 2024.
Chu, V. W.: Greenland Ice Sheet hydrology: A review, Prog. Phys. Geogr., 38, 19–54, https://doi.org/10.1177/0309133313507075, 2014.
Clason, C. C., Coch, C., Jarsjö, J., Brugger, K., Jansson, P., and Rosqvist, G.: Dye tracing to determine flow properties of hydrocarbon-polluted Rabots glaciär, Kebnekaise, Sweden, Hydrol. Earth Syst. Sci., 19, 2701–2715, https://doi.org/10.5194/hess-19-2701-2015, 2015.
Clason, C. C, Rangecroft, S., Owens, P. N., Łokas, E., Baccolo, G., Selmes, N., Beard, D., Kitch, J., Dextre, R. M., Morera, S., and Blake, W.: Contribution of glaciers to water, energy and food security in mountain regions: current perspectives and future priorities, Ann. Glaciol., 63, 73–78, https://doi.org/10.1017/aog.2023.14, 2023.
Davaze, L., Rabatel, A., Dufour, A., Hugonnet, R., and Arnaud, Y.: Region-wide annual glacier surface mass balance for the European Alps from 2000 to 2016, Front. Earth Sci., 8, https://doi.org/10.3389/feart.2020.00149, 2020.
Davies, B., McNabb, R., Bendle, J., Carrivick, J., Ely, J., Holt, T., Markle, B., McNeil, C., Nicholson, L., and Pelto, M.: Accelerating glacier volume loss on Juneau Icefield driven by hypsometry and melt-accelerating feedbacks, Nat. Commun., 15, 5099, https://doi.org/10.1038/s41467-024-49269-y, 2024.
Delaney, I. and Adhikari, S.: Increased subglacial sediment discharge in a warming climate: consideration of ice dynamics, glacial erosion, and fluvial sediment transport, Geophys. Res. Lett., 47, e2019GL085672, https://doi.org/10.1029/2019GL085672, 2020.
Dozier, J.: An examination of the variance minimization tendencies of a supraglacial stream, J. Hydrol., 31, 359–380, https://doi.org/10.1016/0022-1694(76)90134-7, 1976.
Edwards, T. L., Nowicki, S., Marzeion, B., Hock, R., Goelzer, H., Seroussi, H., Jourdain, N. C., Slater, D. A., Turner, F. E., Smith, C. J., McKenna, C. M., Simon, E., Abe-Ouchi, A., Gregory, J. M., Larour, E., Lipscomb, W. H., Payne, A. J., Shepherd, A., Agosta, C., Alexander, P., Albrecht, T., Anderson, B., Asay-Davis, X., Aschwanden, A., Barthel, A., Bliss, A., Calov, R., Chambers, C., Champollion, N., Choi, Y., Cullather, R., Cuzzone, J., Dumas, C., Felikson, D., Fettweis, X., Fujita, K., Galton-Fenzi, B. K., Gladstone, R., Golledge, N. R., Greve, R., Hattermann, T., Hoffman, M. J., Humbert, A., Huss, M., Huybrechts, P., Immerzeel, W., Kleiner, T., Kraaijenbrink, P., Le clec'h, S., Lee, V., Leguy, G. R., Little, C. M., Lowry, D. P., Malles, J.-H., Martin, D. F., Maussion, F., Morlighem, M., O'Neill, J. F., Nias, I., Pattyn, F., Pelle, T., Price, S. F., Quiquet, A., Radić, V., Reese, R., Rounce, D. R., Rückamp, M., Sakai, A., Shafer, C., Schlegel, N.-J., Shannon, S., Smith, R. S., Straneo, F., Sun, S., Tarasov, L., Trusel, L. D., Van Breedam, J., van de Wal, R., van den Broeke, M., Winkelmann, R., Zekollari, H., Zhao, C., Zhang, T., and Zwinger, T.: Projected land ice contributions to twenty-first-century sea level rise, Nature, 593, 74–82, https://doi.org/10.1038/s41586-021-03302-y, 2021.
Esri: “Imagery” [basemap], Scale Not Given, “World Imagery”, 10 October 2024, https://www.arcgis.com/home/item.html?id=10df2279f9684e4a9f6a7f08febac2a9, last access: 22 October 2024.
Federal Office of Topography swisstopo: swissALTI3D, Federal Office of Topography swisstopo [data set], https://www.swisstopo.admin.ch (last access: 8 December 2023), 2019.
Federal Office of Topography swisstopo: SWISSIMAGE, Federal Office of Topography swisstopo [data set], https://www.swisstopo.admin.ch (last access: 7 September 2024), 2020.
Ferguson, R. I.: Sinuosity of supraglacial streams, Geol. Soc. Am. Bull., 84, 251–256, https://doi.org/10.1130/0016-7606(1973)84<251:SOSS>2.0.CO;2, 1973.
Finotello, A., Durkin, P. R., and Sylvester, Z.: Meandering streamflows across landscapes and scales: a review and discussion, Geological Society, London, Special Publications, 540, 1–41, https://doi.org/10.1144/SP540-2024-33, 2024.
Fischer, M., Huss, M., and Hoelzle, M.: Surface elevation and mass changes of all Swiss glaciers 1980–2010, The Cryosphere, 9, 525–540, https://doi.org/10.5194/tc-9-525-2015, 2015.
Fleischer, F., Otto, J.-C., Junker, R. R., and Hölbling, D.: Evolution of debris cover on glaciers of the Eastern Alps, Austria, between 1996 and 2015, Earth Surf. Process. Landf., 46, 1673–1691, https://doi.org/10.1002/esp.5065, 2021.
Frasson, R. P. D. M., Pavelsky, T. M., Fonstad, M. A., Durand, M. T., Allen, G. H., Schumann, G., Lion, C., Beighley, R. E., and Yang, X.: Global Relationships Between River Width, Slope, Catchment Area, Meander Wavelength, Sinuosity, and Discharge, Geophysical Research Letters, 46, 3252–3262, https://doi.org/10.1029/2019GL082027, 2019.
Glasser, N. F., Holt, T. O., Evans, Z. D., Davies, B. J., Pelto, M., and Harrison, S.: Recent spatial and temporal variations in debris cover on Patagonian glaciers, Geomorphology, 273, 202–216, https://doi.org/10.1016/j.geomorph.2016.07.036, 2016.
Gleason, C. J., Smith, L. C., Chu, V. W., Legleiter, C. J., Pitcher, L. H., Overstreet, B. T., Rennermalm, A. K., Forster, R. R., and Yang, K.: Characterizing supraglacial meltwater channel hydraulics on the Greenland Ice Sheet from in situ observations, Earth Surf. Process. Landf., 41, 2111–2122, https://doi.org/10.1002/esp.3977, 2016.
Gleason, C. J., Yang, K., Feng, D., Smith, L. C., Liu, K., Pitcher, L. H., Chu, V. W., Cooper, M. G., Overstreet, B. T., Rennermalm, A. K., and Ryan, J. C.: Hourly surface meltwater routing for a Greenlandic supraglacial catchment across hillslopes and through a dense topological channel network, The Cryosphere, 15, 2315–2331, https://doi.org/10.5194/tc-15-2315-2021, 2021.
Hambrey, M. J.: Supraglacial drainage and its relationship to structure, with particular reference to Charles Rabots Bre, Okstindan, Norway, Nor. Geogr. Tidsskr., 31, 69–77, https://doi.org/10.1080/00291957708545319, 1977.
Horton, R. E.: Erosional development of streams and their drainage basins; hydrophysical approach to quantitative morphology, Geol. Soc. Am. Bull., 56, 275–370, https://doi.org/10.1130/0016-7606(1945)56[275:EDOSAT]2.0.CO;2, 1945.
Hugonnet, R., McNabb, R., Berthier, E., Menounos, B., Nuth, C., Girod, L., Farinotti, D., Huss, M., Dussaillant, I., Brun, F., and Kääb, A.: Accelerated global glacier mass loss in the early twenty-first century, Nature, 592, 726–731, https://doi.org/10.1038/s41586-021-03436-z, 2021.
Huss, M., Bauder, A., Werder, M., Funk, M., and Hock, R.: Glacier-dammed lake outburst events of Gornersee, Switzerland, J. Glaciol., 53, 189–200, doi.org:10.3189/172756507782202784, 2007.
Immerzeel, W. W., Lutz, A. F., Andrade, M., Bahl, A., Biemans, H., Bolch, T., Hyde, S., Brumby, S., Davies, B. J., Elmore, A. C., Emmer, A., Feng, M., Fernández, A., Haritashya, U., Kargel, J. S., Koppes, M., Kraaijenbrink, P. D. A., Kulkarni, A. V., Mayewski, P. A., Nepal, S., Pacheco, P., Painter, T. H., Pellicciotti, F., Rajaram, H., Rupper, S., Sinisalo, A., Shrestha, A. B., Viviroli, D., Wada, Y., Xiao, C., Yao, T., and Baillie, J. E. M.: Importance and vulnerability of the world's water towers, Nature, 577, 364–369, https://doi.org/10.1038/s41586-019-1822-y, 2020.
Irvine-Fynn, T. D. L., Hodson, A. J., Moorman, B. J., Vatne, G., and Hubbard, A. L.: Polythermal glacier hydrology: a review, Rev. Geophys., 49, https://doi.org/10.1029/2010RG000350, 2011.
Jiskoot, H., Fox, T. A., and Wychen, W. V.: Flow and structure in a dendritic glacier with bedrock steps, J. Glaciol., 63, 912–928, https://doi.org/10.1017/jog.2017.58, 2017.
Jobard, S. and Dzikowski, M.: Evolution of glacial flow and drainage during the ablation season, J. Hydrol., 330, 663–671, https://doi.org/10.1016/j.jhydrol.2006.04.031, 2006.
Karlstrom, L. and Yang, K.: Fluvial supraglacial landscape evolution on the Greenland Ice Sheet, Geophys. Res. Lett., 43, 2683–2692, https://doi.org/10.1002/2016GL067697, 2016.
Khan, A. L., Xian, P., and Schwarz, J. P.: Black carbon concentrations and modeled smoke deposition fluxes to the bare-ice dark zone of the Greenland Ice Sheet, The Cryosphere, 17, 2909–2918, https://doi.org/10.5194/tc-17-2909-2023, 2023.
King, L., Hassan, M. A., Yang, K., and Flowers, G.: Flow routing for delineating supraglacial meltwater channel networks, Remote Sens., 8, 988, https://doi.org/10.3390/rs8120988, 2016.
Kingslake, J., Ely, J. C., Das, I., and Bell, R. E.: Widespread movement of meltwater onto and across Antarctic ice shelves, Nature, 544, 349–352, https://doi.org/10.1038/nature22049, 2017.
Knighton, A. D.: Channel form and flow characteristics of supraglacial streams, Austre Okstindbreen, Norway, Arct. Alp. Res., 13, 295, https://doi.org/10.2307/1551036, 1981.
Knighton, A. D.: Channel form adjustment in supraglacial streams, Austre Okstindbreen, Norway, Arct. Antarct. Alp. Res., 17, 451, https://doi.org/10.2307/1550870, 1985.
Knighton, A. D.: Meandering habit of supraglacial streams, Geol. Soc. Am. Bull., 83, 201–204, https://doi.org/10.1130/0016-7606(1972)83[201:MHOSS]2.0.CO;2, 1972.
Leeson, A. A., Shepherd, A., Briggs, K., Howat, I., Fettweis, X., Morlighem, M., and Rignot, E.: Supraglacial lakes on the Greenland Ice Sheet advance inland under warming climate, Nat. Clim. Change, 5, 51–55, https://doi.org/10.1038/nclimate2463, 2015.
Leidman, S. Z., Rennermalm, Å. K., Muthyala, R., Guo, Q., and Overeem, I.: The presence and widespread distribution of dark sediment in Greenland Ice Sheet supraglacial streams implies substantial impact of microbial communities on sediment deposition and albedo, Geophys. Res. Lett., 48, 2020GL088444, https://doi.org/10.1029/2020GL088444, 2021.
Leigh, J. R., Stokes, C. R., Carr, R. J., Evans, I. S., Andreassen, L. M., and Evans, D. J. A.: Identifying and mapping very small (<0.5 km2) mountain glaciers on coarse to high-resolution imagery, J. Glaciol., 65, 873–888, https://doi.org/10.1017/jog.2019.50, 2019.
Leinss, S. and Bernhard, P.: TanDEM-X:Deriving InSAR height changes and velocity dynamics of Great Aletsch Glacier, IEEE J. Sel. Top. Appl. Earth Obs. Remote Sens., 14, 4798–4815, https://doi.org/10.1109/JSTARS.2021.3078084, 2021.
Linsbauer, A., Huss, M., Hodel, E., Bauder, A., Fischer, M., Weidmann, Y., Bärtschi, H., and Schmassmann, E.: The new Swiss glacier inventory SGI2016: from a topographical to a glaciological dataset, Front. Earth Sci., 9, https://doi.org/10.3389/feart.2021.704189, 2021.
Mantelli, E., Camporeale, C., and Ridolfi, L.: Supraglacial channel inception: modeling and processes, Water Resour. Res., 51, 7044–7063, https://doi.org/10.1002/2015WR017075, 2015.
Marston, R. A.: Supraglacial stream dynamics on the Juneau Icefield, Ann. Am. Assoc. Geogr., 73, 597–608, https://doi.org/10.1111/j.1467-8306.1983.tb01861.x, 1983.
MeteoSwiss: https://www.meteoswiss.admin.ch/, last access: 1 February 2024.
Micheletti, N. and Lane, S. N.: Water yield and sediment export in small, partially glaciated Alpine watersheds in a warming climate, Water Resour. Res., 52, 4924–4943, https://doi.org/10.1002/2016WR018774, 2016.
Nienow, P., Sharp, M., and Willis, I.: Seasonal changes in the morphology of the subglacial drainage system, Haut Glacier d'Arolla, Switzerland, Earth Surf. Process. Landf., 23, 825–843, https://doi.org/10.1002/(SICI)1096-9837(199809)23:9<825::AID-ESP893>3.0.CO;2-2, 1998.
Paul, F., Rastner, P., Azzoni, R. S., Diolaiuti, G., Fugazza, D., Le Bris, R., Nemec, J., Rabatel, A., Ramusovic, M., Schwaizer, G., and Smiraglia, C.: Glacier inventory of the Alps from Sentinel-2, shape files, PANGAEA [data set], https://doi.org/10.1594/PANGAEA.909133, 2019
Pitcher, L. H. and Smith, L. C.: Supraglacial Streams and Rivers, Annu. Rev. Earth Planet. Sci., 47, 421–452, https://doi.org/10.1146/annurev-earth-053018-060212, 2019.
Rhoads, B. L. and Welford, M. R.: Initiation of river meandering, Progress in Physical Geography: Earth and Environment, 15, 127–156, https://doi.org/10.1177/030913339101500201, 1991.
Rippin, D. M., Pomfret, A., and King, N.: High resolution mapping of supra-glacial drainage pathways reveals link between micro-channel drainage density, surface roughness and surface reflectance, Earth Surf. Process. Landf., 40, 1279–1290, https://doi.org/10.1002/esp.3719, 2015.
Rounce, D. R., Hock, R., Maussion, F., Hugonnet, R., Kochtitzky, W., Huss, M., Berthier, E., Brinkerhoff, D., Compagno, L., Copland, L., Farinotti, D., Menounos, B., and McNabb, R. W.: Global glacier change in the 21st century: Every increase in temperature matters, Science, 379, 78–83, https://doi.org/10.1126/science.abo1324, 2023.
Ryan, J. C., Hubbard, A., Stibal, M., Irvine-Fynn, T. D., Cook, J., Smith, L. C., Cameron, K., and Box, J.: Dark zone of the Greenland Ice Sheet controlled by distributed biologically-active impurities, Nat. Commun., 9, 1065, https://doi.org/10.1038/s41467-018-03353-2, 2018.
Seaberg, S. Z., Seaberg, J. Z., Hooke, R. L., and Wiberg, D. W.: Character of the englacial and subglacial drainage system in the lower part of the ablation area of Storglaciären, Sweden, as Revealed by Dye-Trace Studies, J. Glaciol., 34, 217–227, https://doi.org/10.3189/S0022143000032263, 1988.
Schumm, S. A.: Sinuosity of alluvial rivers on the Great Plains, Geol. Soc. Am. Bull., 74, 1089–1100, https://doi.org/10.1130/0016-7606(1963)74[1089:SOAROT]2.0.CO;2, 1963.
Smith, L. C., Chu, V. W., Yang, K., Gleason, C. J., Pitcher, L. H., Rennermalm, A. K., Legleiter, C. J., Behar, A. E., Overstreet, B. T., Moustafa, S. E., Tedesco, M., Forster, R. R., LeWinter, A. L., Finnegan, D. C., Sheng, Y., and Balog, J.: Efficient meltwater drainage through supraglacial streams and rivers on the southwest Greenland Ice Sheet, P. Natl. Acad. Sci. USA, 112, 1001–1006, https://doi.org/10.1073/pnas.1413024112, 2015.
Sommer, C., Malz, P., Seehaus, T. C., Lippl, S., Zemp, M., and Braun, M. H.: Rapid glacier retreat and downwasting throughout the European Alps in the early 21st century, Nat. Commun., 11, 3209, https://doi.org/10.1038/s41467-020-16818-0, 2020.
St Germain, S. L. and Moorman, B. J.: Long-term observations of supraglacial streams on an Arctic glacier, J. Glaciol., 65, 900–911, https://doi.org/10.1017/jog.2019.60, 2019.
Swift, D. A., Nienow, P. W., Spedding, N., and Hoey, T. B.: Geomorphic implications of subglacial drainage configuration: rates of basal sediment evacuation controlled by seasonal drainage system evolution, Sediment. Geol., 149, 5–19, https://doi.org/10.1016/S0037-0738(01)00241-X, 2002.
Tepes, P., Gourmelen, N., Nienow, P., Tsamados, M., Shepherd, A., and Weissgerber, F.: Changes in elevation and mass of Arctic glaciers and ice caps, 2010–2017, Remote Sens. Environ., 261, 112481, https://doi.org/10.1016/j.rse.2021.112481, 2021.
The GlaMBIE Team: Community estimate of global glacier mass changes from 2000 to 2023, Nature, 1–7, https://doi.org/10.1038/s41586-024-08545-z, 2025.
Willis, I. C.: Intra-annual variations in glacier motion: a review, Prog. Phys. Geogr., 19. https://doi.org/10.1177/030913339501900104, 1995.
Wouters, B., Gardner, A. S., and Moholdt, G.: Global glacier mass loss during the GRACE satellite mission (2002–2016), Front. Earth Sci., 7, https://doi.org/10.3389/feart.2019.00096, 2019.
Yang, K. and Smith, L. C.: Supraglacial streams on the Greenland Ice Sheet delineated from combined spectral-shape information in high-resolution satellite imagery, IEEE Geosci. Remote Sens. Lett., 10, 801–805, https://doi.org/10.1109/LGRS.2012.2224316, 2013.
Yang, K. and Smith, L. C.: Internally drained catchments dominate supraglacial hydrology of the southwest Greenland Ice Sheet, J. Geophys. Res.-Earth Surf., 121, https://doi.org/10.1002/2016JF003927, 2016.
Yang, K., Smith, L. C., Chu, V. W., Gleason, C. J., and Li, M.: A caution on the use of surface digital elevation models to simulate supraglacial hydrology of the Greenland Ice Sheet, IEEE J. Sel. Top. Appl. Earth Observ. Remote Sens., 8, 5212–5224, https://doi.org/10.1109/JSTARS.2015.2483483, 2015.
Yang, K., Smith, L. C., Chu, V. W., Pitcher, L. H., Gleason, C. J., Rennermalm, A. K., and Li, M.: Fluvial morphometry of supraglacial river networks on the southwest Greenland Ice Sheet, GISci. Remote Sens., 53, 459–482, https://doi.org/10.1080/15481603.2016.1162345, 2016.
Yang, K., Smith, L. C., Cooper, M. G., Pitcher, L. H., As, D. van, Lu, Y., Lu, X., and Li, M.: Seasonal evolution of supraglacial lakes and rivers on the southwest Greenland Ice Sheet, J. Glaciol., 67, 592–602, https://doi.org/10.1017/jog.2021.10, 2021.
Yang, K., Smith, L. C., Karlstrom, L., Cooper, M. G., Tedesco, M., van As, D., Cheng, X., Chen, Z., and Li, M.: A new surface meltwater routing model for use on the Greenland Ice Sheet surface, The Cryosphere, 12, 3791–3811, https://doi.org/10.5194/tc-12-3791-2018, 2018.
Yang, K., Smith, L. C., Sole, A., Livingstone, S. J., Cheng, X., Chen, Z., and Li, M.: Supraglacial rivers on the northwest Greenland Ice Sheet, Devon Ice Cap, and Barnes Ice Cap mapped using Sentinel-2 imagery, Int. J. Appl. Earth Obs. Geoinf., 78, 1–13, https://doi.org/10.1016/j.jag.2019.01.008, 2019.
Yang, K., Sommers, A., Andrews, L. C., Smith, L. C., Lu, X., Fettweis, X., and Li, M.: Intercomparison of surface meltwater routing models for the Greenland ice sheet and influence on subglacial effective pressures, The Cryosphere, 14, 3349–3365, https://doi.org/10.5194/tc-14-3349-2020, 2020.
Yang, K., Smith, L. C., Andrews, L. C., Fettweis, X., and Li, M.: Supraglacial drainage efficiency of the Greenland Ice Sheet estimated from remote sensing and climate models, J. Geophys. Res.-Earth Surf., 127, e2021JF006269, https://doi.org/10.1029/2021JF006269, 2022.
Zekollari, H., Huss, M., and Farinotti, D.: Modelling the future evolution of glaciers in the European Alps under the EURO-CORDEX RCM ensemble, The Cryosphere, 13, 1125–1146, https://doi.org/10.5194/tc-13-1125-2019, 2019.
Zemp, M., Huss, M., Thibert, E., Eckert, N., McNabb, R., Huber, J., Barandun, M., Machguth, H., Nussbaumer, S. U., Gärtner-Roer, I., Thomson, L., Paul, F., Maussion, F., Kutuzov, S., and Cogley, J. G.: Global glacier mass changes and their contributions to sea-level rise from 1961 to 2016, Nature, 568, 382–386, https://doi.org/10.1038/s41586-019-1071-0, 2019.