the Creative Commons Attribution 4.0 License.
the Creative Commons Attribution 4.0 License.
 | 18 Nov 2025
Brief communication: Sharp precipitation gradient on the southern edge of the Tibetan Plateau during cold season
Titouan Biget
Fanny Brun
Walter Immerzeel
Léo Martin
Hamish Pritchard
Emily Collier
Yanbin Lei
Tandong Yao
The Tibetan Plateau is a high-altitude arid region, where limited in-situ precipitation measurements are available. In this communication, we document a strong precipitation gradient at the southern edge of the Paiku Co catchment (southern Tibetan Plateau) from in-situ data and atmospheric model outputs. In particular, we use water pressure time series from proglacial lakes, two automatic weather stations, and data from ERA5-Land reanalysis and CORDEX-FPS-CPTP ensemble. We show that precipitation totals can vary by one order of magnitude over a short distance of 10 km in a rather smooth terrain during the cold season. This large precipitation gradient marks the transition between the great Himalayas and the Tibetan Plateau.
- Article
(4293 KB) - Full-text XML
-
Supplement
(642 KB) - BibTeX
- EndNote


The Tibetan Plateau is a high-altitude region characterized by a dry and arid climate, and by the presence of multiple lakes and glaciers (Yang et al., 2014). Most of the lakes of the Tibetan Plateau have been expanding rapidly since the mid-1990s, representing an additional terrestrial water storage of 6 to 9 Gt yr−1 (Zhang et al., 2017). However, some lakes located on the southern edge of the plateau have shrunk for the last three decades (Lei et al., 2018; Zhang et al., 2021). The changes in lake volume are mostly attributed to decadal changes in precipitation (Zhang et al., 2021). Precipitation measurements are scarce on the Tibetan Plateau, and thus analysis of climate and meteorology relies largely on reanalysis, remote sensing products, and climate models (e.g., Collier et al., 2024).
The challenges associated with precipitation measurements are numerous in mountainous regions, especially when a substantial fraction falls in solid forms. Precipitation gauges suffer from large underestimations of solid precipitation, 42.6 % on average for unshielded gauges and 30.6 % for single-Alter shielded gauges (Kochendorfer et al., 2017). These underestimations can be much larger in cases of strong winds (Goodison et al., 1998).To overcome these issues, recent studies suggested that solid precipitation could be also estimated from frozen lake water pressure changes (Pritchard et al., 2021). This method relies on the assumption that the catchment is frozen, making the surface run-off and the evaporation negligible due to the cold conditions. Since lakes are used as sensors, the size of the sensor is 6 to 9 orders of magnitude above the size of common precipitation gauges, thus providing a spatially averaged estimate of precipitation that is expected to be less sensitive to undercatch and to spatial variability of precipitation (Pritchard et al., 2021), at the cost of application over only a few months of the year.
In this study, we report new observations of lake level changes during the cold season (December to May) of a catchment located on the southern edge of the Tibetan Plateau. From the lake water pressure time series, we reconstruct precipitation estimates based on Pritchard et al. (2021)'s method and compare them to conventional gauge measurements located on both sides of the orographic barrier of the Himalaya. We then compare these observations to precipitation estimates from two datasets, ERA5-Land reanalysis (, ) and simulations from the Coordinated Regional Climate Downscaling Experiment Flagship Pilot Study (CORDEX-FPS) Convection-Permitting Third Pole (CPTP) project (Collier et al., 2024; Prein et al., 2023), to discuss the added value of kilometer-scale convection-permitting atmospheric models.
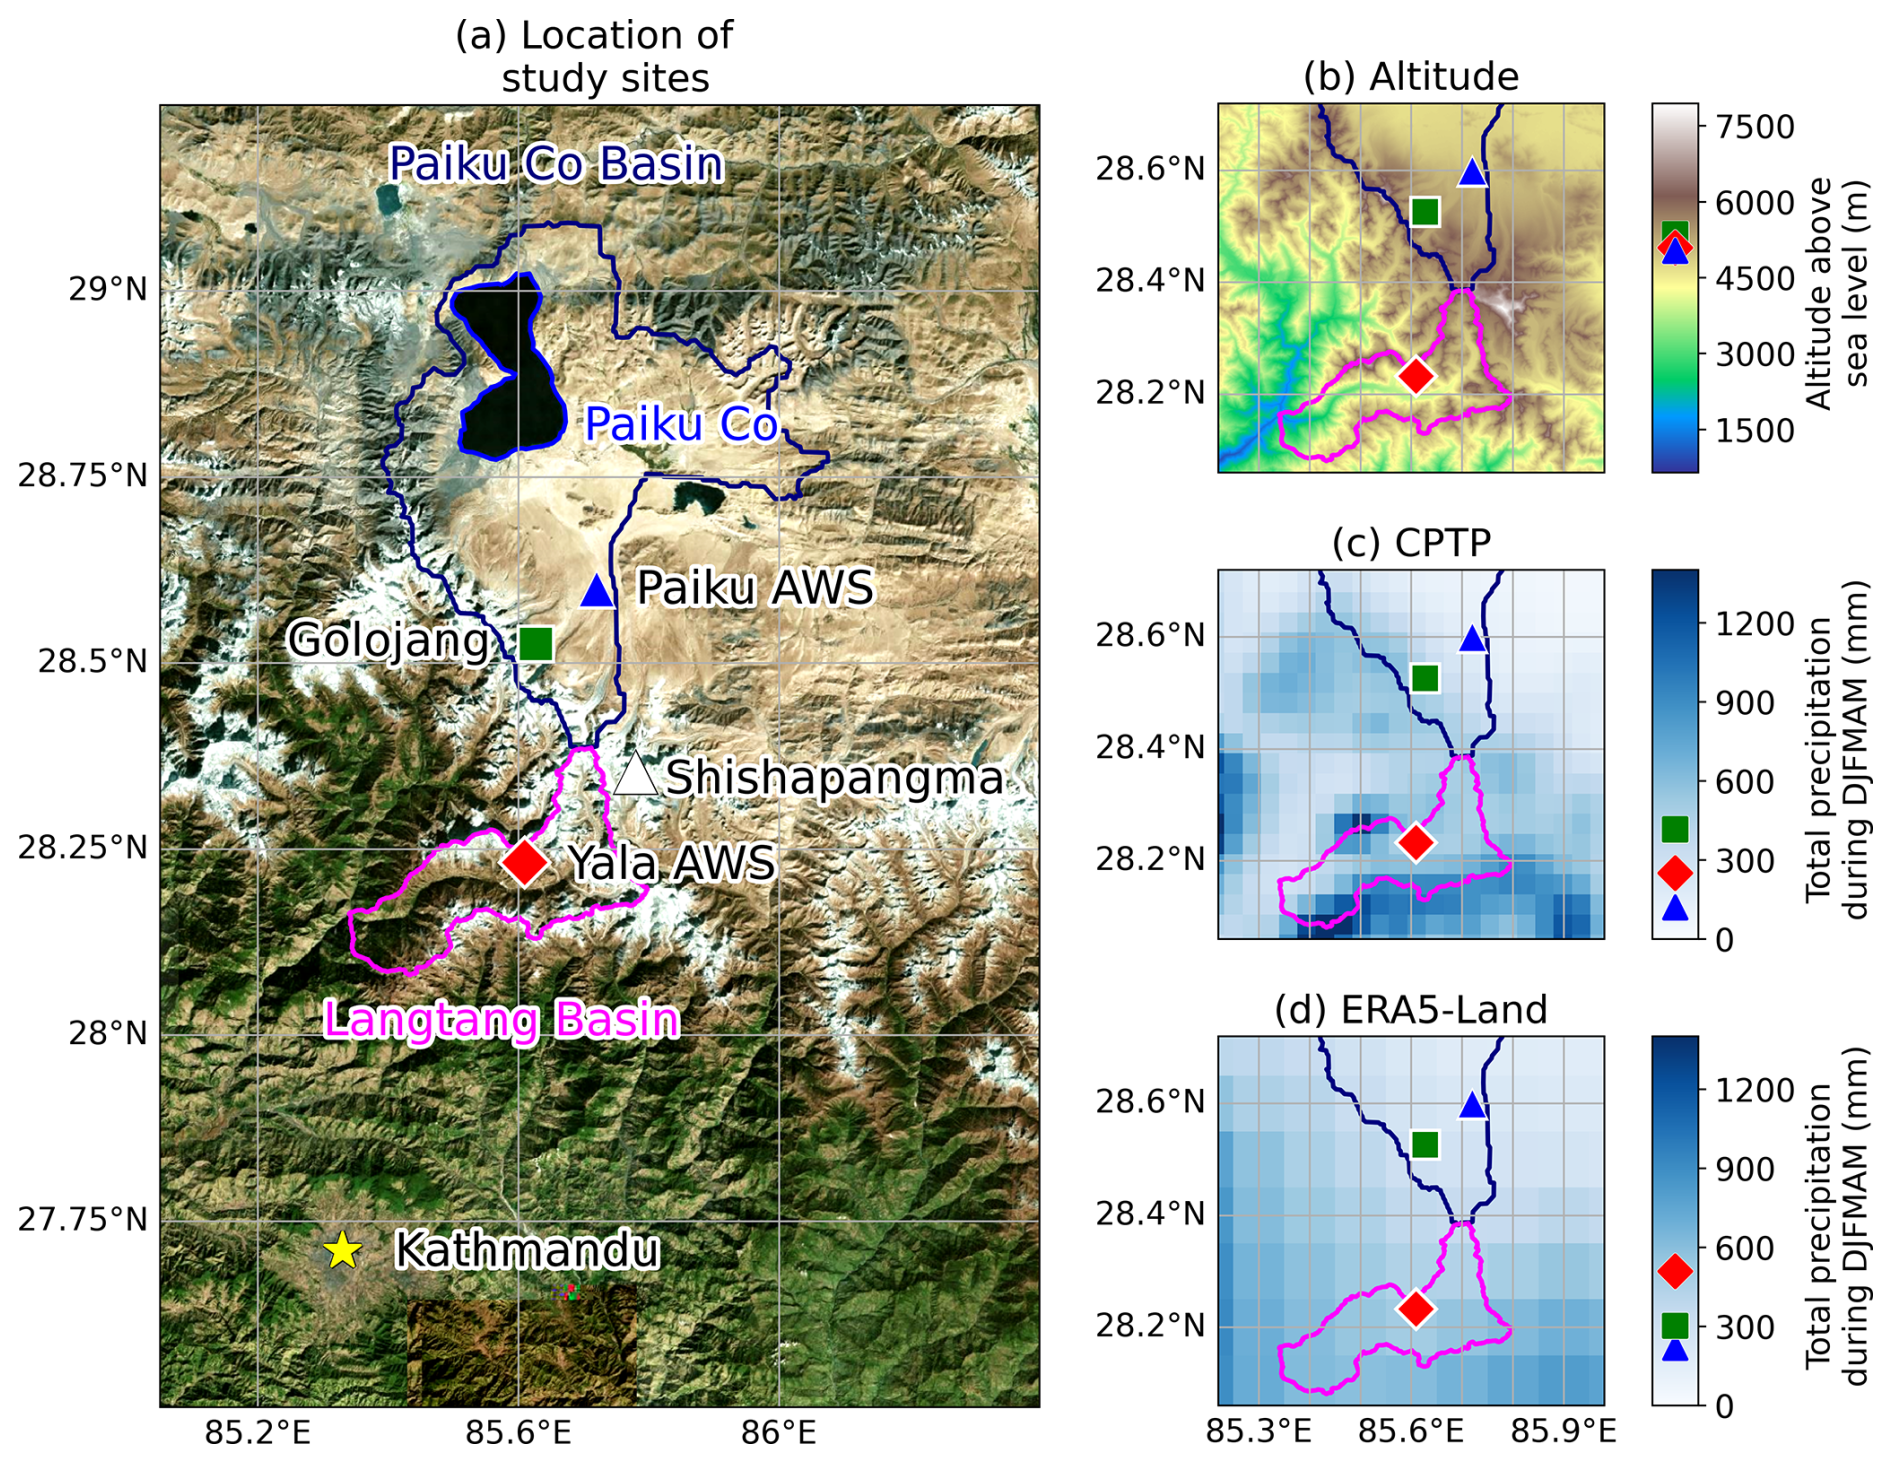
Figure 1(a) Location of study sites. (b) Elevation and (c, d) spatial distribution of total precipitation over the study area from CPTP and ERA5-Land models from 5 December 2019 to 15 July 2020. On the maps, the symbols show the locations of the in-situ recordings. On the color bars on the right side of the maps, symbols indicate interpolated values of precipitation at the study sites. The solid lines mark the boundary of Langtang and Paiku Co basins.
The in-situ measurements were collected in the southern Paiku basin (Fig. 1a), on the southern Tibetan Plateau (China). The basin drains into Paiku Co, an endorheic alpine lake at 4590 m a.s.l. with an area of 270 km2, slightly over one tenth of the catchment (2376 km2). Paiku Co is partly fed by 41 glaciers (Lei et al., 2018). While Paiku Co has shrunk in recent decades, proglacial lakes higher in the basin have expanded over the last 50 years due to glacier retreat (Lei et al., 2018).
We focus on Golojang Co, a proglacial lake in the south of the catchment at 5357 m a.s.l., with an area of 5.54 km2 (Fig. 1a). It remains frozen through winter (DJF), pre-monsoon (MAM), and part of the monsoon (JJAS), breaking up in July. Its outlet flows through a moraine to the Nijile river. The lake fills an over-deepening from glacier retreat, and glaciers still calve small icebergs into it. Orography may enhance snow accumulation on the frozen lake surface.
In Paiku Co catchment, annual precipitation below 5000 m a.s.l. ranges from 150–300 mm, with winter contributing ∼10 % (Lei et al., 2018, 2021; Martin et al., 2023). These estimates come from two AWS: one near Paiku Co at 4600 m a.s.l. (Lei et al., 2018), and another 10 km south at 5030 m a.s.l. (Martin et al., 2023).
To estimate the precipitation around Paiku Co catchment, we use a collection of datasets from in-situ observations and from models.
3.1 Precipitation from meteorological stations
We use meteorological data from two AWS located on different sides of the Himalayas: on the northern side, within Paiku Co catchment in China, we use the Paiku AWS (5033 m a.s.l., Martin et al., 2023), and on the southern side, we use Yala AWS (5090 m a.s.l., Immerzeel et al., 2014) located in Langtang National Park in Nepal (Fig. 1a), near Yala Peak, base camp.
Both stations record standard meteorological variables: temperature, humidity, wind speed, radiation, pressure, snow thickness (Campbell SR50), and precipitation (OTT Pluvio2). Paiku AWS operated continuously from 29 October 2019 to May 2022, with antifreeze and oil added to the gauge to prevent freezing/evaporation. Yala AWS has run since October 2015, but data were lost from 18 November 2019 to 27 March 2020; records are continuous thereafter. Its gauge had antifreeze but no oil, so evaporation occurred, corrected by setting decreasing water levels to neutral. Both gauges are wind-shielded.
3.2 Precipitation from lake water pressure
Three Hobo U20 pressure transducers (PT) were installed in Golojang Co (1 November 2019–14 April 2022), with a fourth outside the lake as atmospheric pressure reference. The immersed PTs recorded water pressure and temperature every 30 min at depths of 50–80 cm, sometimes freezing in winter. Only one PT remained unfrozen and was used for analysis. The signal was smoothed with a 48 h rolling mean due to strong noise.
It has been demonstrated that such water pressure time series can be interpreted as direct measurements of the precipitation falling onto the lake during winter-like conditions (Pritchard et al., 2021). This method relies on the assumption that the surface and sub-surface runoffs are at their minimum due to freezing conditions, and limited evaporation from the lake due to its ice cover, although it does not have to be necessarily entirely frozen if the evaporation is neglected. In these conditions, pressure variations in the lake are attributed only to the precipitation over the surface of the lake and its drainage. The typical pressure signal expected is a constant slow decrease due to the drainage of the lake, with some quick jumps due to precipitation. We used two criteria to verify the frozen assumption: (i) we extrapolate the temperature from Paiku AWS to the elevation of Golojang Co, assuming an −6.5 K km−1 environmental lapse rate, and keep days with a mean temperature below 0 °C; and (ii) we map the ice cover extent of Golojang Co from Landsat 7, 8, and Sentinel-2 images using the Google Earth Engine Digitisation Tool (GEEDiT; Lea, 2018) and keep periods with more than 90 % of the surface frozen.
We followed the method developed by Pritchard et al. (2021) to estimate the precipitation amount over Golojang Co. When the lake is frozen, the pressure measured by the PT sensor (p in Pa) follows the hydrostatic equation:
with ρw (in kg m−3) being the density of liquid water, g (in m s−2) being the acceleration of gravity, hw (in m) the depth of the sensor relative to surface, hswe (in m) being the water equivalent height of the snow and ice above the surface, and p0 (in Pa) being an arbitrary constant. We assume that, at the time scale of a snowfall event (from a few hours to 4 d), changes in p (named dp) are solely due to changes in hswe (named dhswe), due to precipitation and to changes in hw due to the lake drainage (named dhw). Following Pritchard et al. (2021), we assume a constant drainage that is estimated by extrapolating p just before and after the event using a linear regression on the time series fitted with a least square method. The date of the beginning, the date of the ending, and the duration of the extrapolation were determined manually. For the rest of the study, we express changes in the total water column (dh in m) as:
We assume that the uncertainty εswe on the measurement of precipitation during an event is the sum of εD1 and εD2, which are respectively the uncertainties on the regression on the drainage before and after the snowfall. The uncertainty arising from the drifting of the PT is neglected since we estimated that the drifting is small enough to be considered as a systematic bias on the scale of a single event.
3.3 Precipitation from atmospheric models
We use daily precipitation from CORDEX-FPS CPTP (Collier et al., 2024) and ERA5-Land (Muñoz Sabater et al., 2021). CPTP includes 13 ERA5-driven simulations for October 2019–September 2020 at 2.2–4 km resolution, reprojected to ∼4 km, and averaged across ensemble members. ERA5-Land provides ∼10 km gridded total_precipitation for October 2019–May 2022. For both datasets, we extracted daily precipitation at the grid point closest to the lake outlet or AWS (Figs. 1, 3).
Our observational record is very short (<2.5 years). In order to discuss whether the observed patterns are persistent on a climatological scale (30 years), we also investigated ERA5-Land reanalysis data from 1993 to 2022 of both monthly precipitation and integrated vapour transport over the region of Nepal and Tibet.
4.1 Hydrological cycle of Golojang Co
Golojang Co water level has a strong seasonal cycle with an amplitude of approximately 70–80 cm (Fig. 2a). The lake level appears to plateau at low values from late winter (February) to pre-monsoon (April), several months after freeze-up in December, as it approaches the local hydrological base level (the minimum height at the lake outlet). The water temperature increases from 1–2 °C to a maximum of 6 °C in September. The increase in lake level and temperature is linked to the larger water input when the catchment unfreezes and when the monsoon brings most of the annual precipitation (Lei et al., 2018).
Golojang Co seasonal level cycle is more pronounced than the cycle of Paiku Co (Lei et al., 2021). During 2013 to 2017, Paiku Co water level had an average amplitude of 51 cm, and had a near constant decrease rate of 7 cm month−1 during the post-monsoon and the winter on average. Paiku Co level rises sharply at the end of pre-monsoon (Lei et al., 2018), but its level decreases slower than Golojang Co during post-monsoon with a decrease rate greater than 23 cm month−1 during 2021 and 2022, and a much lower rate of 4 cm month−1 during the winter.
4.2 Precipitation estimates from Golojang Co pressure time series
To apply Pritchard et al. (2021)'s method – requiring frozen catchment conditions so that precipitation is stored as snow – we monitored lake ice cover and estimated air temperature. Ice cover is known for 375 d (20 September 2019–10 May 2022, one image per 2.6 d); the lake was >90 % frozen on 250 d (Fig. 2a). In 2019–2020 and 2020–2021, it was partially frozen December–July (∼7 months), with the catchment frozen (≥90 % ice cover and <0 °C) from late December to mid-June. Precipitation from lake pressure could thus be estimated for DJFMAM.
Total precipitation was estimated at 420±46 mm (December 2019–May 2020), 307±27 mm (December 2020–May 2021), and 211±9 mm (December 2021–14 April 2022) (Fig. 3a, b, c). Events on 21 May 2021 and 22 March 2022 were excluded due to likely runoff under high temperatures. These values are probably underestimated, as detected events were mainly wet spells lasting on average 73 h. Short snowfalls may have been masked by signal noise and the 48 h smoothing.
No detailed study exists yet on Golojang Co, including its bathymetry or glacier–lake interface. Calving impacts on lake pressure cannot be quantified, but calving produces abrupt mass additions unlike the slower, sustained pressure changes from snowfall (Pritchard et al., 2021). Satellite images show very limited calving on the frozen lake during the study period.
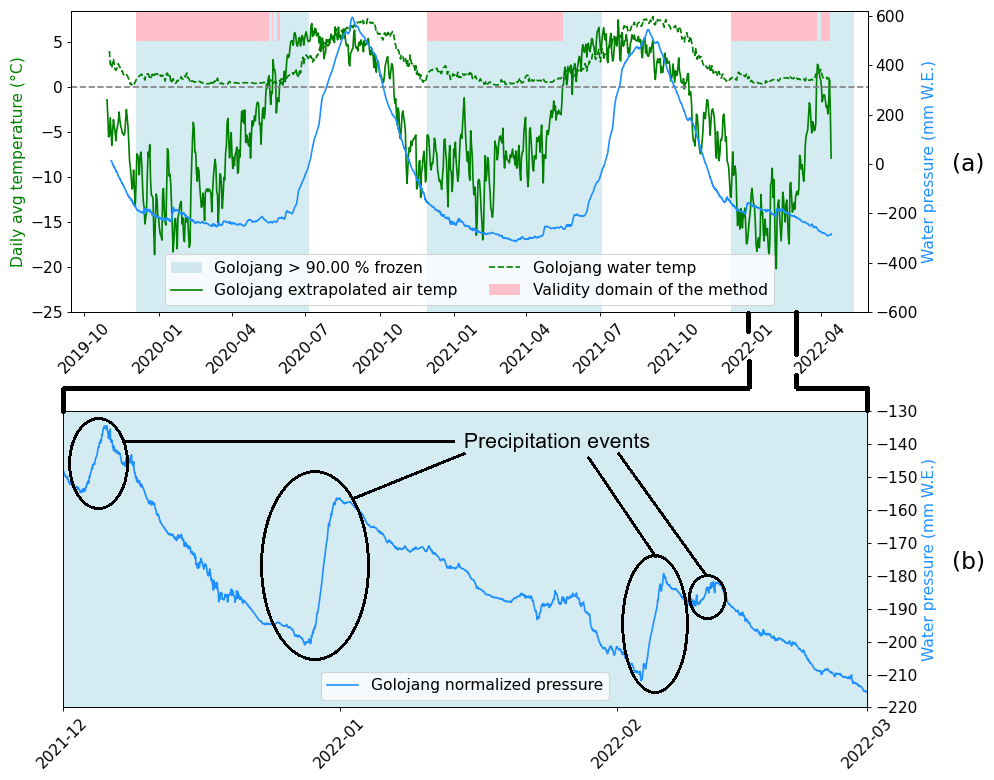
Figure 2Water and extrapolated air temperature, validity domains of Pritchard et al. (2021)'s method and normalized pressure of Golojang from 31 November 2019 to 14 April 2022. Some examples of precipitation events on the pressure time series are highlighted on the bottom figure.
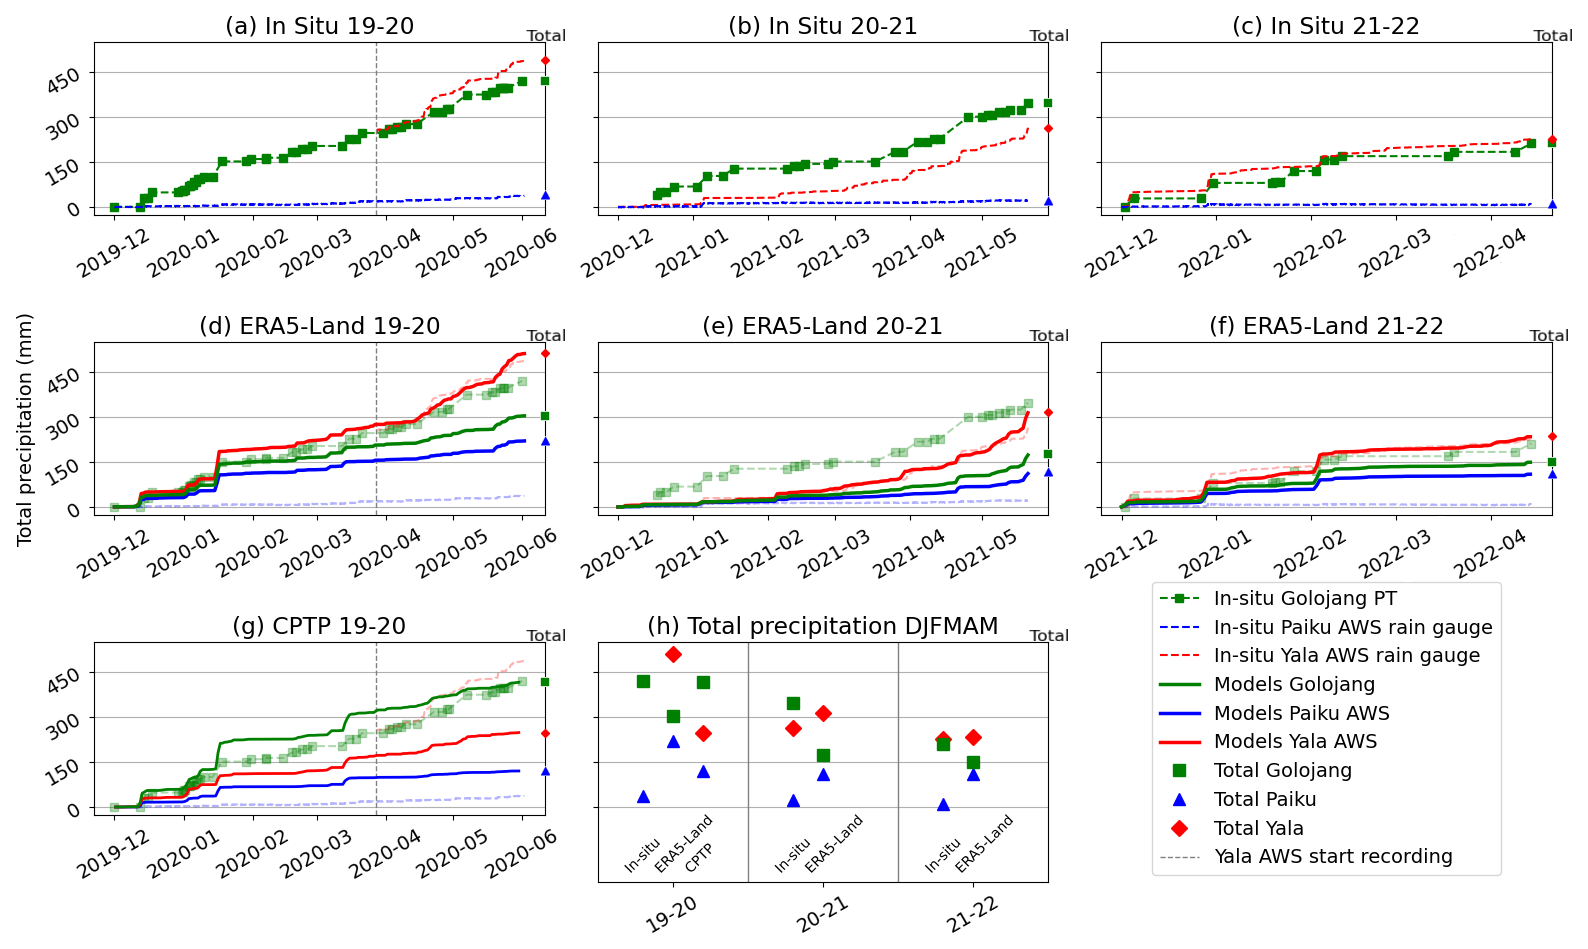
Figure 3In-situ and model precipitation at the lake and both AWS locations. We note that the CORDEX FPS CPTP simulations are only available for the hydrological year of 2019–2020. Since Yala AWS started recording in April 2020, we choose to set its initial value to the same as in-situ Golojang during the middle of the year. The total cumulative precipitation for each period is shown on the right-hand bar of each graph and is summarized in (h).
4.3 Measured precipitation at the automatic weather stations
When overlapping, Golojang snowfall totals can be compared with AWS records. In DJFMAM 2019–2020, Paiku AWS measured only 35 mm (9 % of Golojang). In 2020–2021, Yala AWS recorded 289 mm (94 % of Golojang) while Paiku AWS recorded 25 mm (8 %). From December 2021 to April 2022, Yala measured 226 mm (107 % of Golojang) versus 12 mm at Paiku (6 %) (Fig. 3a, b, c).
Yala and Golojang snowfall totals are similar, but Paiku AWS recorded much less, consistent with the 150–200 mm previously measured near Paiku Co (Lei et al., 2018). This implies winter and pre-monsoon precipitation in the southern, higher catchment is ∼10 times greater than in the lower basin. The gradient is sharp, as Golojang is only 10 km from Paiku AWS and 350 m higher in elevation. Most major events occur at both Yala and Golojang with similar intensity, but are much weaker at Paiku (Fig. 3a, b, c).
Both AWS had wind shields but likely underestimated snowfall due to wind. During snowfalls, mean wind speed was 2.3 m s−1 at Yala (q0.8 = 2.7 m s−1) and 5.9 m s−1 at Paiku (q0.8 = 7.2 m s−1). To assess wind impact at Paiku, we compared its precipitation to Golojang estimates for 11 low-wind events (<4.4 m s−1) and 11 high-wind events (>7.2 m s−1): ratios were 28 % and 18 % respectively. Even accounting for undercatch, Golojang snowfall remains an order of magnitude higher than at Paiku.
4.4 Precipitation from reanalysis and atmospheric models
Both ERA5-Land and CPTP strongly overestimate precipitation at Paiku AWS. ERA5-Land cumulative DJFMAM totals are on average 11 times higher than in situ (Fig. 3d, e, f), while CPTP is closer but still 3.4 times higher (Fig. 3g). Such differences cannot be explained by gauge undercatch and exceed the 15–30 mm winter precipitation previously estimated (Lei et al., 2021, 2018).
At Yala, ERA5-Land reproduces cumulative DJFMAM precipitation well, with in situ values only 8 % greater than AWS during 2020–2021 and 2021–2022 (Fig. 3e, f). By contrast, Yala AWS was not operating for most of the CPTP simulation year, missing the entire winter (it resumed 27 March 2020). For the overlapping period (27 March–31 May 2020), Yala recorded 241 mm (Fig. 3a), while CPTP simulated only 76 mm (Fig. 3g), a strong underestimation.
At Golojang Co, CPTP provides a DJFMAM cumulative snowfall estimate differing by only 1.2 % from the PT record in 2019–2020, though it slightly overestimates early-season and underestimates late-season precipitation (Fig. 3g). ERA5-Land, in contrast, is much too low: PT estimates are on average 1230 % higher across the three winters (Fig. 3d, e, f).
Although PT estimates are used as reference, they are likely underestimated because the pressure time series mainly captured wet spells lasting on average 73 h, while short snowfalls were masked by noise and the rolling average. For example, from December 2020 to May 2021 (the only complete year with all sensors working), Yala AWS recorded 26 events, 18 of which lasted <2 d and accumulated <10 mm. At Golojang, 23 events were identified over the same period, but only 7 matched Yala's short events.
4.5 Spatial distribution of precipitation
ERA5-Land and CPTP show contrasting DJFMAM precipitation patterns over southern Paiku Co basin and northern Langtang National Park. Thanks to finer resolution, CPTP better resolves terrain influence (Collier et al., 2024), showing larger spatial variability than ERA5-Land, with higher precipitation above 5000 m a.s.l. and on southern Himalayan slopes, consistent with orographic effects (Roe, 2005). ERA5-Land instead shows a smoother southwest–northeast gradient (Fig. 1b, c).
Given the limited in situ data and the short CPTP run (one year), it is unclear whether CPTP or ERA5-Land better represent winter precipitation on the southern Tibetan Plateau. Nonetheless, CPTP’s ability to simulate sharp local gradients is promising, as our results suggest such gradients occur. However, high-resolution models can show large positive biases in precipitation (He et al., 2019). More in situ measurements are needed to confirm whether CPTP's strong gradients are realistic or exaggerated, though observation networks rarely match model scales.
4.6 Climatological analysis
Our results indicate non-negligible DJFMAM precipitation at Golojang Co, suggesting a greater glacier accumulation contribution than extrapolated from ERA5-Land or Paiku catchment AWS (Martin et al., 2023). Since our method applies only in winter, we cannot assess whether such sharp gradients persist during the monsoon, which is the wettest season. This is the reason why we rely on long-term reanalyses (ERA5, ERA5-Land).
ERA5-Land monthly data (1993–2023) show a marked seasonal cycle with Paiku/Yala precipitation ratio is 0.5–0.6 in winter, decreases to 0.3–0.4 during monsoon, then increases again (Fig. S1). The Paiku/Golojang ratio varies little, only ∼20 % between its August minimum and April maximum. ERA5 integrated water vapor flux patterns are consistent: in winter and pre-monsoon, gradients are strong and homogeneous north–south, whereas in monsoon (JJA) they are more heterogeneous over Nepal (Fig. S2). These results suggest seasonal shifts in precipitation distribution over southern Tibet and northern Nepal, with sharper gradients in winter and pre-monsoon.
In this communication, we studied the hydro-meteorology of the northern Langtang National Park in Nepal and the Southern Paiku Co basin in Tibet using in-situ and modeled data from conventional and recent methods. Using Pritchard et al. (2021) method, we estimated the snowfalls over the proglacial lake Golojang from 12 December 2019 to 9 April 2022, in the southern part of Paiku Co basin during the period DJFMAM. With this method, we converted the pressure time series of the lake that were recorded into estimates of the cumulative snowfalls when the lake is frozen. However, smaller events may not have been detected because their signals were too weak compared to the measurement noise. Our results highlight the potential of lakes to be used as precipitation gauges, which is especially valuable in data-scarce regions.
The snowfalls over the lake were compared to the precipitation recorded by AWS located on the southern side of the Himalaya (Yala Peak AWS in Langtang National Park) and on the Paiku Co catchment. During the three years of recording, it seems that Golojang Co cumulative snowfall during DJFMAM (200–400 mm) is closer to Yala AWS than to Paiku AWS (5–35 mm), despite its proximity to Paiku AWS.
We compared our results with precipitation data computed by reanalysis and atmospheric models (ERA5-Land and CORDEX-FPS CPTP). Both products largely overestimate the precipitation inside the Paiku Co basin compared to the automatic weather stations' recordings and our estimates based on pressure variations. Still, CPTP estimates are consistent with the DJFMAM precipitation recorded at Golojang during the meteorological year 2019–2020. ERA5-Land DJFMAM cumulative precipitation is surprisingly very close to the recording of Yala AWS.
The in-situ data we gathered are thus not matching any model at all three locations at once. However, CPTP shows the best ability to reproduce the spatial distribution of the precipitation as it is recorded between the lake and the AWS. On the other hand, ERA5-Land was not matching any of the precipitation recorded in the Paiku Co basin.
An analysis of the long term precipitation was performed over the three sites using ERA5-Land data from 1993 to 2022. Even though we show that ERA5-Land is not the better fit for a study on such a scale, it revealed a seasonal variation of the spatial distribution of the precipitation, with a stronger gradient between Yala and the Paiku basin during the coldest part of the year (December to May). This analysis suggests that we cannot extend our findings about precipitation gradients outside the cold season, due to different moisture origins and circulation systems.
The code used to calculate precipitation and its uncertainties can be accessed together with the event dates and Golojang Co pressure time series at https://doi.org/10.5281/zenodo.14894819 (Biget et al., 2025).
The supplement related to this article is available online at https://doi.org/10.5194/tc-19-5863-2025-supplement.
Conceptualization: TB, FB, LM and WI; Data Curation: TB (lake pressure data), YL (lake pressure and meteorological data) and EC (CORDEX-FPS-CPTP data); Formal Analysis: TB; Funding Acquisition: WI and TY; Methodology: HP; Supervision: FB, LM and WI; Writing: all authors.
At least one of the (co-)authors is a member of the editorial board of The Cryosphere. The peer-review process was guided by an independent editor, and the authors also have no other competing interests to declare.
Publisher's note: Copernicus Publications remains neutral with regard to jurisdictional claims made in the text, published maps, institutional affiliations, or any other geographical representation in this paper. While Copernicus Publications makes every effort to include appropriate place names, the final responsibility lies with the authors. Views expressed in the text are those of the authors and do not necessarily reflect the views of the publisher.
This research has been supported by the Ministère de l'Education Nationale, de l'Enseignement Supérieur et de la Recherche (agence nationale de la recherche and Chaire de professeur junior).
This paper was edited by Thomas Mölg and reviewed by two anonymous referees.
Biget, T., Brun, F., lei, and yanbin: Brief communication: Sharp precipitation gradient on the southern edge of the Tibetan Plateau during cold season – Code and Data, Zenodo [code] and [data set], https://doi.org/10.5281/zenodo.14894819, 2025. a
Collier, E., Ban, N., Richter, N., Ahrens, B., Chen, D., Chen, X., Lai, H.-W., Leung, R., Li, L., Medvedova, A., Ou, T., Pothapakula, P. K., Potter, E., Prein, A. F., Sakaguchi, K., Schroeder, M., Singh, P., Sobolowski, S., Sugimoto, S., Tang, J., Yu, H., and Ziska, C.: The first ensemble of kilometer-scale simulations of a hydrological year over the third pole, Climate Dynamics, 62, 7501–7518, https://doi.org/10.1007/s00382-024-07291-2, 2024. a, b, c, d
Copernicus Climate Change Service: ERA5-Land hourly data from 1950 to present, Copernicus Climate Change Service (C3S) Climate Data Store (CDS) [data set], https://doi.org/10.24381/cds.e2161bac (last access: 2 August 2024), 2022. a
Goodison, B. E., Louie, P. Y., and Yang, D.: WMO solid precipitation measurement intercomparison, World Meteorological Organization, https://library.wmo.int/idurl/4/28336 (last access: 3 July 2025), 1998. a
He, C., Chen, F., Barlage, M., Liu, C., Newman, A., Tang, W., Ikeda, K., and Rasmussen, R.: Can Convection-Permitting Modeling Provide Decent Precipitation for Offline High-Resolution Snowpack Simulations Over Mountains?, Journal of Geophysical Research: Atmospheres, 124, 12631–12654, https://doi.org/10.1029/2019JD030823, 2019. a
Immerzeel, W. W., Petersen, L., Ragettli, S., and Pellicciotti, F.: The importance of observed gradients of air temperature and precipitation for modeling runoff from a glacierized watershed in the Nepalese Himalayas, Water Resour. Res., 50, 2212–2226, https://doi.org/10.1002/2013wr014506, 2014. a
Kochendorfer, J., Nitu, R., Wolff, M., Mekis, E., Rasmussen, R., Baker, B., Earle, M. E., Reverdin, A., Wong, K., Smith, C. D., Yang, D., Roulet, Y.-A., Buisan, S., Laine, T., Lee, G., Aceituno, J. L. C., Alastrué, J., Isaksen, K., Meyers, T., Brækkan, R., Landolt, S., Jachcik, A., and Poikonen, A.: Analysis of single-Alter-shielded and unshielded measurements of mixed and solid precipitation from WMO-SPICE, Hydrol. Earth Syst. Sci., 21, 3525–3542, https://doi.org/10.5194/hess-21-3525-2017, 2017. a
Lea, J. M.: The Google Earth Engine Digitisation Tool (GEEDiT) and the Margin change Quantification Tool (MaQiT) – simple tools for the rapid mapping and quantification of changing Earth surface margins, Earth Surf. Dynam., 6, 551–561, https://doi.org/10.5194/esurf-6-551-2018, 2018. a
Lei, Y., Yao, T., Yang, K., Bird, B. W., Tian, L., Zhang, X., Wang, W., Xiang, Y., Dai, Y., Lazhu, Zhou, J., and Wang, L.: An integrated investigation of lake storage and water level changes in the Paiku Co basin, central Himalayas, Journal of Hydrology, 562, 599–608, https://doi.org/10.1016/j.jhydrol.2018.05.040, 2018. a, b, c, d, e, f, g, h, i
Lei, Y., Yao, T., Yang, K., Lazhu, Ma, Y., and Bird, B. W.: Contrasting hydrological and thermal intensities determine seasonal lake-level variations – a case study at Paiku Co on the southern Tibetan Plateau, Hydrol. Earth Syst. Sci., 25, 3163–3177, https://doi.org/10.5194/hess-25-3163-2021, 2021. a, b, c
Martin, L. C. P., Westermann, S., Magni, M., Brun, F., Fiddes, J., Lei, Y., Kraaijenbrink, P., Mathys, T., Langer, M., Allen, S., and Immerzeel, W. W.: Recent ground thermo-hydrological changes in a southern Tibetan endorheic catchment and implications for lake level changes, Hydrol. Earth Syst. Sci., 27, 4409–4436, https://doi.org/10.5194/hess-27-4409-2023, 2023. a, b, c, d
Muñoz-Sabater, J., Dutra, E., Agustí-Panareda, A., Albergel, C., Arduini, G., Balsamo, G., Boussetta, S., Choulga, M., Harrigan, S., Hersbach, H., Martens, B., Miralles, D. G., Piles, M., Rodríguez-Fernández, N. J., Zsoter, E., Buontempo, C., and Thépaut, J.-N.: ERA5-Land: a state-of-the-art global reanalysis dataset for land applications, Earth Syst. Sci. Data, 13, 4349–4383, https://doi.org/10.5194/essd-13-4349-2021, 2021. a
Prein, A. F., Ban, N., Ou, T., Tang, J., Sakaguchi, K., Collier, E., Jayanarayanan, S., Li, L., Sobolowski, S., Chen, X., Zhou, X., Lai, H.-W., Sugimoto, S., Zou, L., Hasson, S. u., Ekstrom, M., Pothapakula, P. K., Ahrens, B., Stuart, R., Steen-Larsen, H. C., Leung, R., Belusic, D., Kukulies, J., Curio, J., and Chen, D.: Towards Ensemble-Based Kilometer-Scale Climate Simulations over the Third Pole Region, Climate Dynamics, 60, 4055–4081, https://doi.org/10.1007/s00382-022-06543-3, 2023. a
Pritchard, H. D., Farinotti, D., and Colwell, S.: Measuring Changes in Snowpack SWE Continuously on a Landscape Scale Using Lake Water Pressure, Journal of Hydrometeorology, 22, 795–811, https://doi.org/10.1175/JHM-D-20-0206.1, 2021. a, b, c, d, e, f, g, h, i, j
Roe, G. H.: OROGRAPHIC PRECIPITATION, Annual Review of Earth and Planetary Sciences, 33, 645–671, https://doi.org/10.1146/annurev.earth.33.092203.122541, 2005. a
Yang, K., Wu, H., Qin, J., Lin, C., Tang, W., and Chen, Y.: Recent climate changes over the Tibetan Plateau and their impacts on energy and water cycle: A review, Global and Planetary Change, 112, 79–91, https://doi.org/10.1016/j.gloplacha.2013.12.001, 2014. a
Zhang, G., Yao, T., Shum, C. K., Yi, S., Yang, K., Xie, H., Feng, W., Bolch, T., Wang, L., Behrangi, A., Zhang, H., Wang, W., Xiang, Y., and Yu, J.: Lake volume and groundwater storage variations in Tibetan Plateau's endorheic basin, Geophysical Research Letters, 44, 5550–5560, https://doi.org/10.1002/2017GL073773, 2017. a
Zhang, G., Bolch, T., Chen, W., and Crétaux, J.-F.: Comprehensive estimation of lake volume changes on the Tibetan Plateau during 1976–2019 and basin-wide glacier contribution, Science of The Total Environment, 772, 145463, https://doi.org/10.1016/j.scitotenv.2021.145463, 2021. a, b