the Creative Commons Attribution 4.0 License.
the Creative Commons Attribution 4.0 License.
 | 17 Nov 2025
Challenges in surface mass balance estimation at Dome C: stake farm comparisons, measurement uncertainties, and station-induced biases
Claudio Stefanini
Barbara Stenni
Mauro Masiol
Giuliano Dreossi
Vincent Favier
Francesca Becherini
Claudio Scarchilli
Virginia Ciardini
Gabriele Carugati
Massimo Frezzotti
In this study, surface mass balance (SMB) is estimated from snow accumulation data collected in the nearby area of Concordia Station, Antarctica. Results from the Italian and French stake farms are jointly analysed. The Italian stake farm consists of 13 stakes; continuous observations started at the end of 2010 with near-monthly sampling. Some measurements are also available for the 2006–2010 period from a previous stake farm. The French stake farm consists of 50 stakes; observations started in 2004 with yearly sampling during austral summer. Snow buildup measurements at individual stakes show a strong variability caused by the interaction of wind-driven snow with surface micro-relief. In the common observation period, the present Italian stake farm generally underestimates the SMB with respect to the French one, except for 3 years in which an overestimation is observed. Over the 2011–2023 period, the mean yearly accumulation recorded by the Italian and French stake farms is 7.3 ± 0.2 cm and 8.4 ± 0.1 cm, respectively. Bootstrap simulation has been performed to: (i) assess the significance of the differences between the two datasets; (ii) evaluate the effect on the measurements of the different size of the stake farms and their distance to the Station. The comparison of the observations with reanalysis datasets (ERA5 and MERRA2) and regional models (RACMO2.4p1, MAR3.12) indicates the former more in agreement with the observations. The potential interaction effect of the Station has also been investigated by analysing wind direction during snowfall events, suggesting that buildings may influence accumulation. In fact, in the hyper-arid environment of Dome C, snow accumulation is largely governed by post-depositional processes such as wind redistribution and clear-sky precipitation. Buildings alter the wind field, enhancing erosion beneath them and forming snowdrifts leeward and laterally, which may explain accumulation differences between the ITA and FRA stake fields. Additionally, two more stake farms, located 25 km North and South of Concordia Station, are also analysed to study the SMB gradient across Dome C, confirming previous results. On average, yearly SMB increases northward by 8 %–9 % over the 50 km span between the southern and northern stake farms. At Concordia, for the 2004–2023 period, a mean SMB of 27.21 ± 0.60 kg m−2 has been estimated, taking into account the uncertainty of the observations and of the snow compaction effect. Results are valuable for validating SMB estimated from reanalysis, regional climate models and remote-sensing data.
- Article
(8799 KB) - Full-text XML
-
Supplement
(779 KB) - BibTeX
- EndNote


The Surface Mass Balance (SMB) of the Antarctic ice sheet is a critical parameter for understanding its contributions to global sea-level rise and to the climate system, for ice sheet dynamics and ice-core dating. SMB is defined as the difference between mass gain, primarily through snowfall, and mass loss through sublimation, wind ablation, and surface melting. However, due to Antarctica's vast and remote territory, SMB measurements pose significant challenges, relying on various methods and models to ensure accurate estimates. The SMB of the Antarctic ice sheet is influenced by a complex interplay of climatology and topography. The average continental elevation of over 2200 m (Fretwell et al., 2013) results in reduced precipitation, with snow accumulation decreasing further away from coastal moisture sources (Thomas et al., 2017). The distribution of SMB, therefore, reflects the intricate balance between these climatic and topographic factors, including sublimation and wind redistribution. This is the case for the Dome C area on the East Antarctic Plateau, where the change in surface elevation across 50 km is less than 10 m (Genthon et al., 2015).
A large fraction (two thirds) of the annual accumulation at Dome C comes from clear-sky precipitation, such as diamond dust and vapor condensation, rather than conventional snowfall events (Stenni et al., 2016). While snowfall and diamond dust provide the baseline input, post-depositional processes exert the greatest influence on spatial and temporal variability. Inland accumulation is primarily driven by fluctuations in snowfall, which dominate interannual variability in SMB (Noël et al., 2023). However, the apparent uniformity of precipitation over tens to hundreds of kilometres is disrupted by wind and surface processes, which modulate local accumulation through redistribution across microtopographic features (Fujita et al., 2011). Wind is consistently identified as the dominant control across the East Antarctic Plateau. Processes such as drifting snow, erosion, and redistribution create highly variable features including sastrugi, dunes, and megadunes, which contribute to substantial local heterogeneity (Frezzotti et al., 2005; Eisen et al., 2008). Sublimation – both surface and wind-driven – further reduces accumulation, and in particularly dry areas like Dome C, Dome Fuji, and Vostok, it may cancel out a significant fraction of snowfall (Eisen et al., 2008). Over the central plateau, katabatic winds actively shape the surface, driving strong spatial variability even where precipitation is minimal (Lazzara et al., 2012). At the South Pole, for instance, annual accumulation decreased significantly from 1983 to 2010, largely attributed to changes in wind and sublimation patterns rather than reductions in snowfall (Lazzara et al., 2012). Topographic effects are also critical: dome sites generally exhibit lower spatial variability (3 %–9 %) compared to regions with complex surface morphology, where variability may exceed 40 % (Eisen et al., 2008). Small-scale features such as sastrugi, wind crusts, and megadunes introduce accumulation noise two to four times the mean, occasionally resulting in multi-year ablation (Frezzotti et al., 2005). On larger spatial scales, Dome Fuji records demonstrate how accumulation differences are strongly correlated with position relative to ice divides and prevailing wind directions, and are further modulated by elevation and distance from moisture sources (Oyabu et al., 2023). Overall, spatial variability at kilometre scales is an order of magnitude greater than temporal variability at decadal to secular scales (Frezzotti et al., 2005). This highlights why dome sites such as Dome C are often favoured for paleoclimate reconstructions: their relatively stable conditions reduce the noise introduced by local post-depositional processes, even though wind redistribution and sublimation remain significant factors (Frezzotti et al., 2005).
Climate change adds another element of complexity to SMB dynamics. Rising temperatures are expected to increase snowfall in Antarctica's interior, partially offsetting mass losses from ice melt and calving on the coasts (Ning et al., 2024). However, the extent of this compensatory effect is uncertain. Even small inaccuracies in measuring these fluxes can significantly affect mass balance estimates, highlighting the need for precise and comprehensive observations.
One of the most common methods for SMB measurement involves stake observations. This simple and reliable technique requires embedding stakes into the snowpack and periodically measuring the height of the snow relative to the stake. By combining these measurements with snow density data, the water-equivalent SMB can be calculated. Different approaches exist to establish the most appropriate snow density value to use. In East Dronning Maud Land, Takahashi et al. (1994) used the snow density through the upper 2 m, while Kameda et al. (1997) and Satow et al. (1999) used densities from the surface to the bottom of the annual snow layer. Takahashi and Kameda (2007) were the first to suggest that the appropriate snow density for deriving SMB from stake measurements is the average snow density at the base of the stake during the observation period, as this accounts for snow compaction. Following this approach, Kameda et al. (2008) applied this density in their SMB calculations at Dome Fuji. Ekaykin et al. (2020) measured the mean density in the upper 20 cm of snow thickness in a number of random points across the stake farm at Vostok, thus allowing to correct a SMB dataset of more than 50 years (Ekaykin et al., 2023). Stake farms and profiles remain the backbone of many SMB studies, offering invaluable insights into annual and even monthly variations in SMB. Despite advances in observational techniques and modelling, challenges persist. Deploying and maintaining automatic weather stations (AWS) and stake farms in Antarctica's extreme environment is resource-intensive, leading to sparse coverage (Eisen et al., 2008). Besides, stations are unevenly distributed: clustered near coastal regions, with only a few inland installed on the East Antarctic Plateau, including Dome C, Dome F, Vostok, and other interior sites (Wang et al., 2023). AWSs, by capturing long-term records of key drivers – such as wind, humidity, and temperature – enhance our understanding of how atmospheric processes impact SMB in remote high-plateau regions. Long-term SMB observations are rare but invaluable. Some AWSs are equipped with ultrasonic sensors to measure snow surface height changes by detecting the vertical distance to the surface, but the uncertainty of the measurements is not sufficient to properly examine the small snow accumulation events that usually occur in the interior of the East Antarctic Plateau (Wang et al., 2021). The AntSMB dataset comprises observations from 675 sites across Antarctica, including daily, annual, and multi-year records derived from ice cores, snow pits, stake farms, ultrasonic sounders, and ground-penetrating radar. The dataset reveals large spatial heterogeneity in accumulation driven by local processes like wind redistribution, slope effects, and surface roughness, which are pronounced across interior plateau sites. By integrating multiple measurement types (e.g. stakes, cores, radar), the dataset allows quantification of the relative impact of precipitation supply, erosion/deposition, and surface sublimation, clarifying which processes dominate at interior sites (Eisen et al., 2008; Wang et al., 2021). The combined analysis of Ground-Penetrating Radar (GPR) profiles, firn cores, and stake measurements indicates that Dome C exhibits remarkable spatial homogeneity at the regional scale, with only minor local variations in snow accumulation primarily driven by surface microtopography and prevailing wind patterns (Urbini et al., 2008). Temporal variability in accumulation rates appears limited over decadal to centennial scales, as confirmed by firn-core records, although interannual fluctuations linked to episodic wind-driven redistribution are evident. The consistency between point-scale observations and GPR-derived stratigraphy supports the reliability of radar methods for spatial interpolation in this area. Overall, the low flow velocity, minimal surface undulation, and stable accumulation regime reaffirm Dome C as an optimal site for deep ice core drilling and long-term paleoclimate reconstructions (Urbini et al., 2008). Since 1970 Vostok has maintained a stake array to monitor SMB, providing continuous data critical for assessing trends and validating models (Ekaykin et al., 2023). Similarly, studies at South Pole, Dome Fuji, the old Dome C site, Dome A, Talos Dome, and others, also from traverses and near the coasts, have enhanced our understanding of SMB variability across the East Antarctic Plateau (Frezzotti et al., 2007; Kameda et al., 2008; Agosta et al., 2012; Favier et al., 2013; Genthon et al., 2015; Ding et al., 2016; Ekaykin et al., 2023). These observations have revealed significant temporal and spatial heterogeneity in SMB, emphasising the importance of localised measurements in capturing the variability of snow accumulation and redistribution.
GPR (Eisen et al., 2008; Urbini et al., 2008; Cavitte et al., 2018) and ultrasonic sensors (Reijmer and van den Broeke, 2003) offer promising alternatives but require calibration against ground-based data to ensure accuracy. In fact, these more technologically advanced methods complement stake observations by capturing spatial patterns and providing data over long timescales or across challenging terrains. Furthermore, integrating SMB measurements with ice-core studies can provide historical context, linking modern observations to past climate variations and helping predict future changes (Kameda et al., 2008; Favier et al., 2013; Vandecrux et al., 2024; Ekaykin et al., 2024). GPR has shown its effectiveness in mapping spatial variations in SMB on Dome C, where small topographic changes correspond to significant SMB variations, revealing isochronous layers in the snowpack (Urbini et al., 2008; Cavitte et al., 2018). GPR data show that SMB increases by ∼10 % at Dome C from South to North over 50 km (but a spatially stable gradient is present at larger scale through the last ∼73 kyr, Cavitte et al., 2018), despite the gentle slope as it is related to continentality, confirmed by model estimates and observations at the stakes (Urbini et al., 2008; Genthon et al., 2015; Vittuari et al., 2025).
Regional Climate Models (RCMs), such as RACMO2.4p1 (van Wessem et al., 2018) and MAR3.12 (Agosta et al., 2019; Servettaz et al., 2023), have been instrumental in simulating SMB at high spatial resolutions. These models provide insights into the spatial and temporal variability of SMB across Antarctica, accounting for processes like snowfall, sublimation, and snow redistribution by the wind. However, biases remain a significant issue. For instance, Richter et al. (2021) found that while RACMO2.4p1's SMB estimates for Vostok Station aligned well with observations, MAR3.12's estimates exhibited a positive bias, particularly in SMB seasonal distribution. Observational data from stake farms are crucial for validating and improving these models (Favier et al., 2013). In general, Ning et al. (2024) highlighted that in the inner Plateau MAR has a positive bias, of the order of 25 %–50 % for the areas at an altitude of 3100–3300 m, i.e., where Dome C is located. On the other hand, the ERA5 and MERRA2 reanalysis offer some of the best model SMB estimates for those areas (Ning et al., 2024).
In conclusion, understanding the SMB of the Antarctic ice sheet is essential for assessing its role in global sea-level rise and climate dynamics. While field measurements like stake observations provide foundational data, their limitations necessitate the use of advanced methods such as GPR, reanalysis and RCMs. The interplay of topography, meteorology, and climate change complicates SMB estimation, underscoring the importance of continuous innovation in measurement techniques and model development. By addressing these challenges, researchers can improve predictions of the Antarctic ice sheet behaviour and its implications for the global climate system.
In this article, the accumulation measurements taken at Dome C by means of stake farms are studied. Two stake farms are located close to the Italian-French Concordia Station, at ∼800 and ∼500 m southwest, while two adjacent stake farms are located ∼2 km South. Four more stake farms are further away, two placed 25 km North and two placed 25 km South of the Station. The different distance of the stake farms from Concordia allows to evaluate the interaction with the Station structure. The length of the available time series, at most 20 years, is not sufficient to robustly investigate potential links with the periodicities associated for example with SAM and ENSO.
The paper is organized as follows: Section 2 describes the stake farms, the data used and introduces some statistical techniques; Sects. 3 and 4 present and discuss the results, respectively, showing the SMB estimates in the Dome C area, the interaction between buildings and wind, and its effect on snow accumulation; finally, conclusions are drawn in Sect. 5.
2.1 Stake farms
Concordia Station is an Italian-French research facility open all year round located at Dome C, at an elevation of 3233 m above sea level (75.10° S 123.33° E). The Reference Elevation Model of Antarctica (REMA, 2 m of maximum resolution, Howat et al., 2022) shows that the surface in this area has an extreme flatness (less than 0.1 m km−1); the buildings, the route of the logistic traverses and the airstrip emerge as features in the satellite images and REMA (Fig. 1). The facility consists of a winter station made up of two interconnected cylinders linked to the power plant, and a summer camp (which also serves as an emergency camp during winter). Each cylinder of the winter station has a diameter of 18.5 m and a height of 11 m (2955 m3), and is divided into three floors, providing a total of 250 m2 of usable surface. The total height above the ice exceeds 14 m, since each structure rests on six large adjustable iron supports designed to compensate for variations in ice thickness (https://www.pnra.aq/it/stazione-concordia, last access: 15 September 2025, an aerial view of the facility is shown in Fig. S1 in the Supplement). The main structures and facilities are shown in Fig. 1. Atmos and Physics are shelters located near the Italian stake farms composed of 8 and 4 coupled containers, respectively (https://www.pnra.aq/it/laboratori-e-facilities-concordia, last access: 15 September 2025). Besides, every year several tons of snow are cleared from the buildings and other structures, including the towers and the summer camp, and transported North using a Pisten Bully.
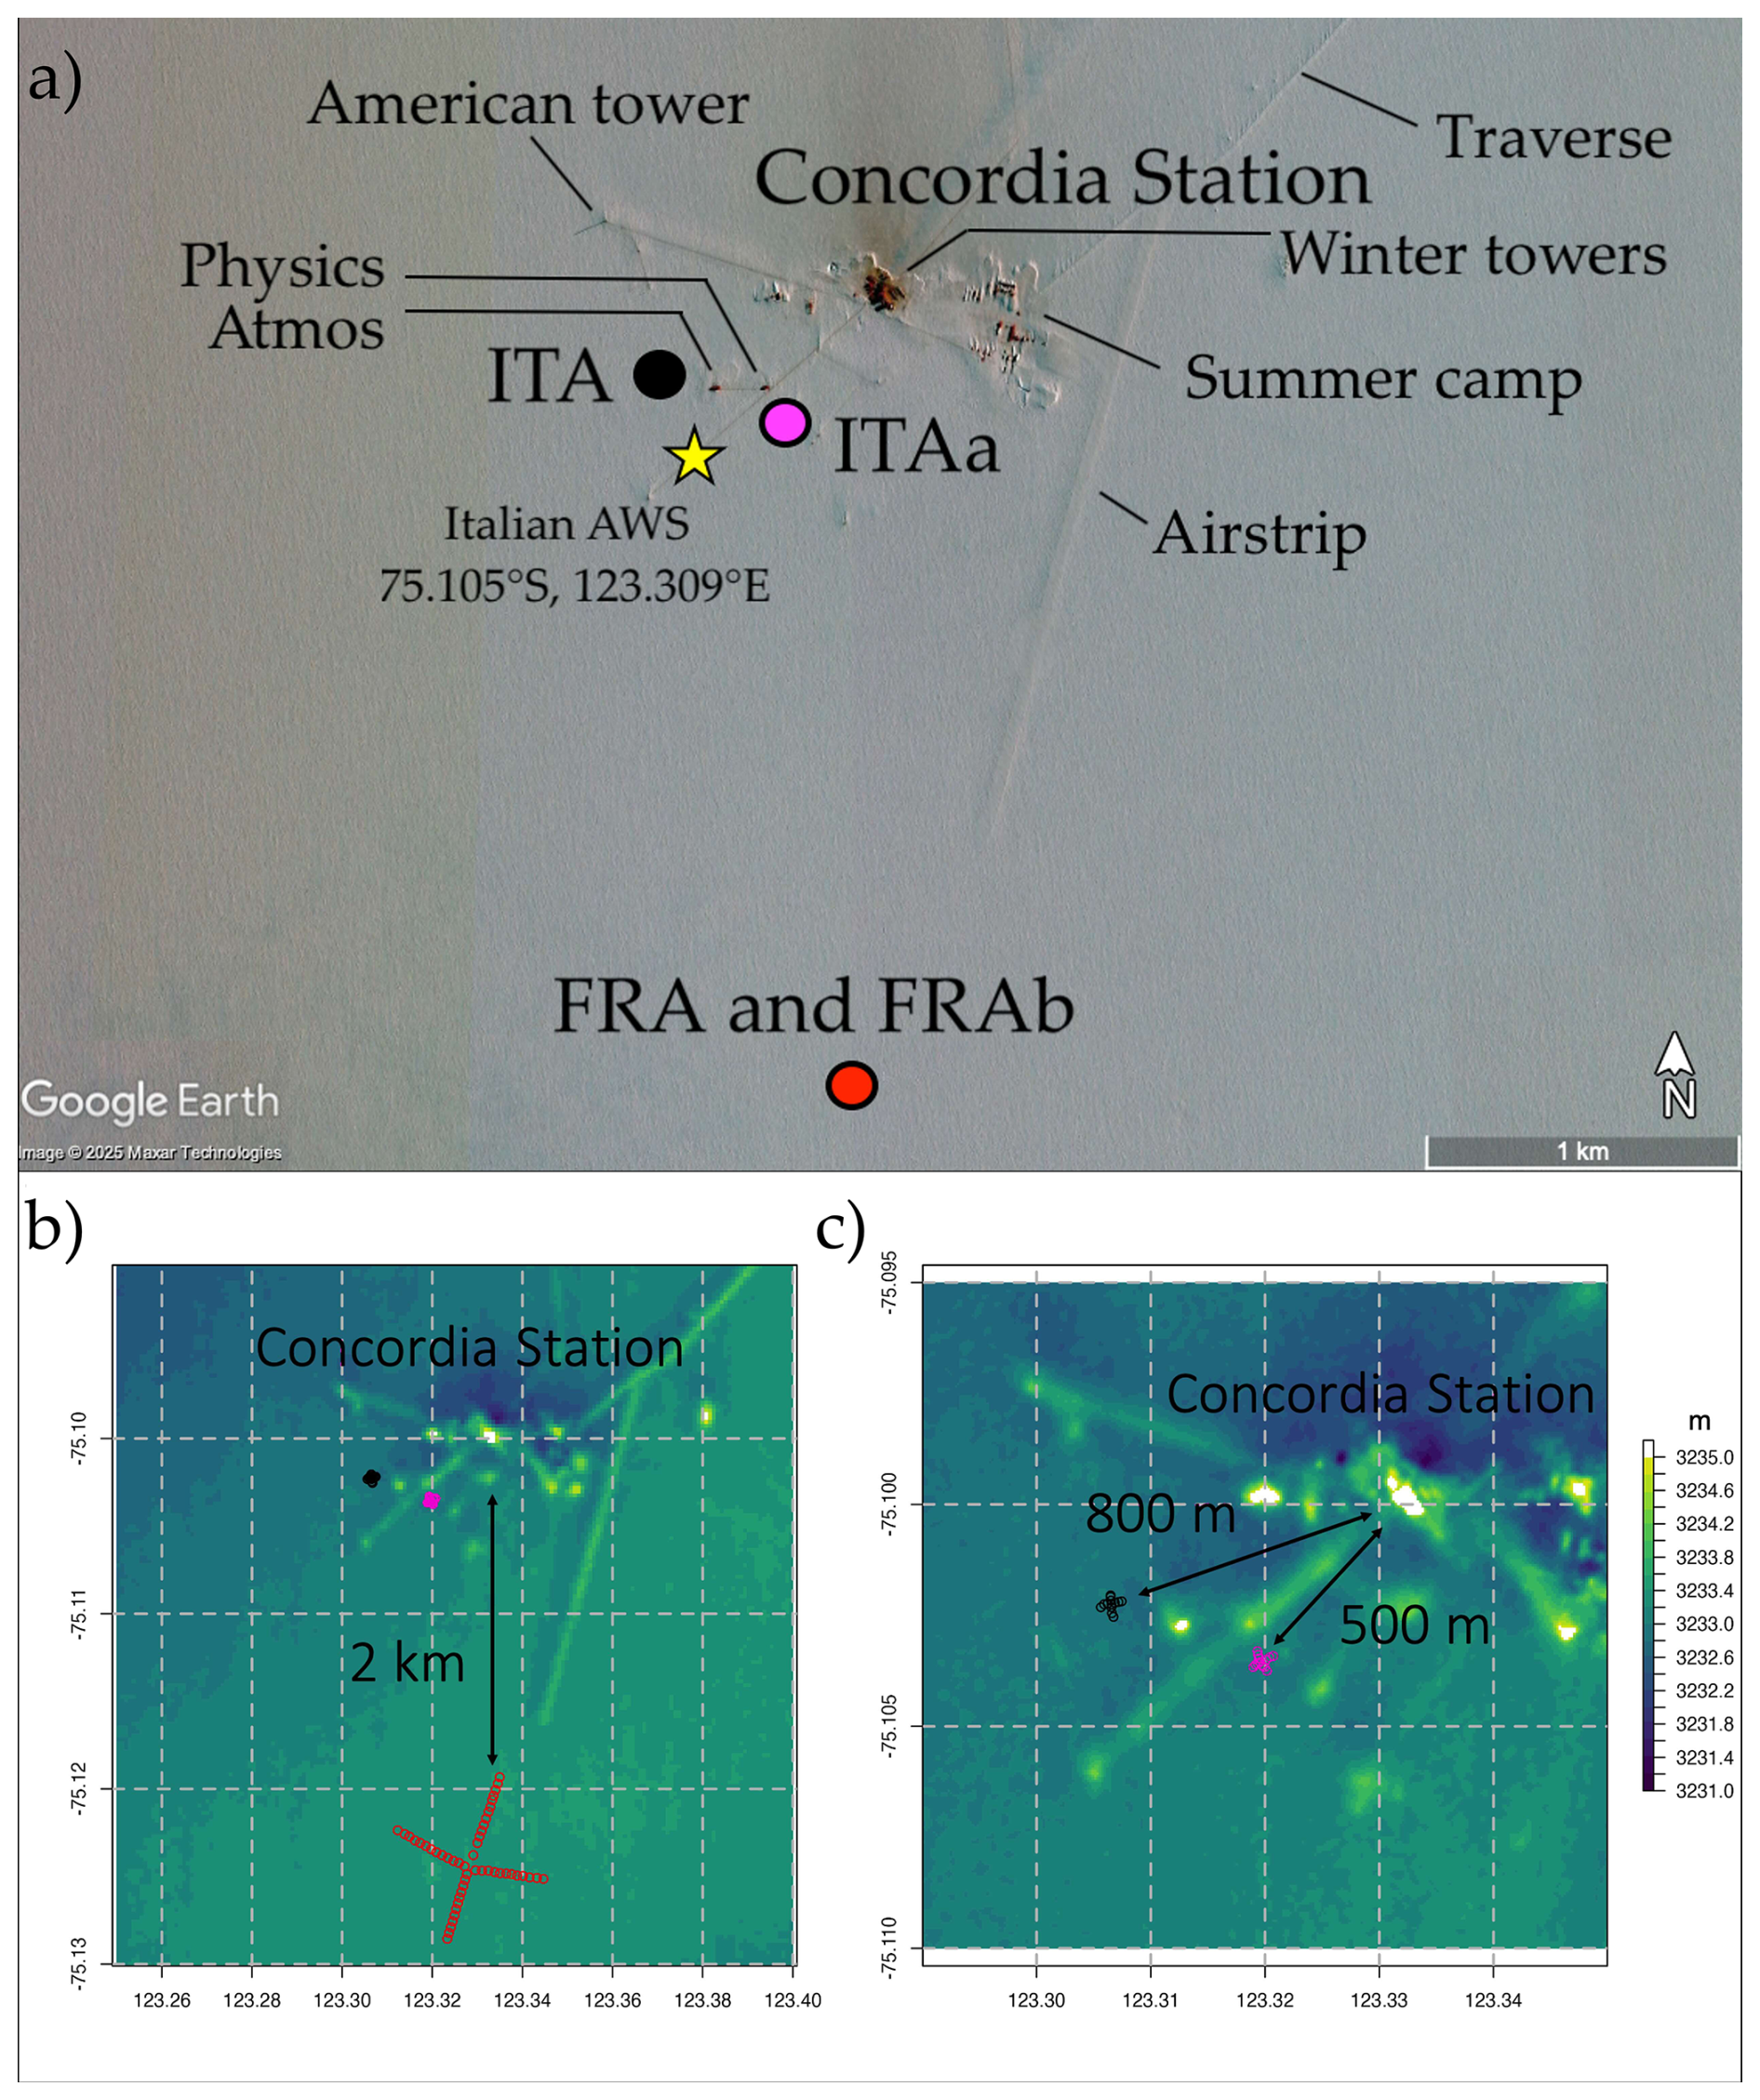
Figure 1(a) Satellite map (© Maxar Technologies, Google Earth) of the area around Concordia Station, with the locations of stake farms (circles) and of the Italian AWS (star); (b) elevation of the Concordia Station area (colours from REMA, Howat et al., 2022), and locations of the Italian stake farms (ITAa, in purple circles, operative in 2006–2010, and ITA, in black circles, operative since 2010) and the French stake farm (FRA and FRAb, red circles); (c) zoom of (b) showing the distance of ITA and ITAa from the Station. Longitude and latitude are shown in decimal degrees.
Regular observations of accumulation at the stakes began in January 2004 at a site managed by the GLACIOCLIM Project (https://glacioclim.osug.fr/-Antarctique-, last access: 15 September 2025), which is located ∼2 km South with respect to the Station (FRA: 75.12° S 123.33° E, red circles in Fig. 1). The stake farm consists of 50 stakes 2 m-long, separated by 40 m buried by ∼1.5 m when installed, arranged in a cross-shaped structure aligned to parallel and perpendicular to prevalent wind from South-southwest. The stake heights are recorded at least once a year during the austral summer season. In 2017, as the stakes began to be submerged by the snow, a new 50-stake farm (FRAb) was deployed with new 3 m-long stakes installed 2 m apart from the older ones. At the end of 2024, only 19 out of the 50 stakes installed in 2004 had been used for the height measurements, the others being completely submerged; therefore, being too sparse, the 2024 data have been excluded from the analysis.
Another stake farm was installed in January 2006 at a site managed by the Italian PNRA (“Programma nazionale di ricerche in Antartide”, i.e., National Antarctic Research Program), ∼500 m South-southwest of the Station (ITAa: 75.10° S 123.32° E, purple circles in Fig. 1). Here, measurements were conducted until the end of 2010, when a new stake farm was installed in its current location (ITA: 75.10° S 123.31° E, black circles in Fig. 1), ∼800 m away from the Station. Both stake farms consist of 13 2.2 m-long stakes, separated by 10 m, buried by ∼0.25 m when installed. The height measurements have been taken approximately monthly.
Finally, in 2006 the northern (74.88° S 123.39° E, 3228 m, blue circles in Fig. 2) and southern (75.32° S 123.39° E, 3226 m, green circles in Fig. 2) French stake farms were also installed (FRA-N and FRA-S, respectively, with 2 m-long stakes) in the framework of GLACIOCLIM observatory. They are located 25 km away from Concordia Station and consist of 50 stakes each. The northern stake farm was almost completely submerged in 2024, as only 9 stakes remained operational. In 2018 and 2019, respectively, two more 50-stake farms were added 2 m apart from the previous ones (FRAb-N and FRAb-S, respectively, with 3 m-long stakes).
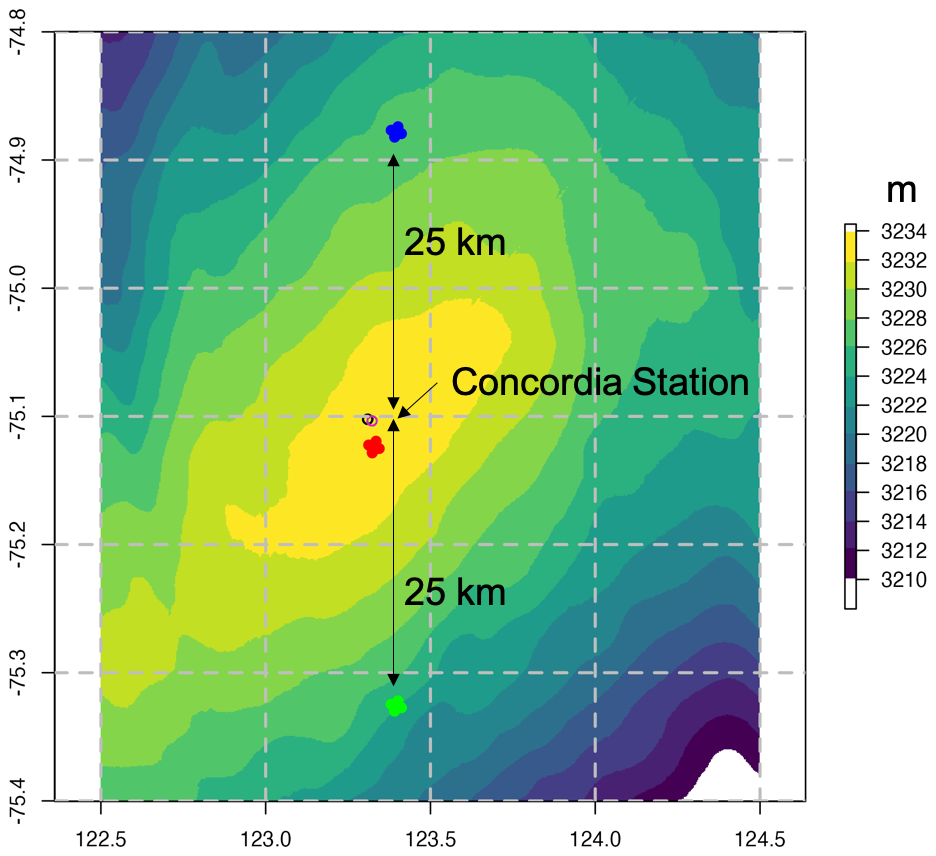
Figure 2Elevation of the Dome C area (colours from REMA, Howat et al., 2022) and locations of the northern (FRA-N, blue circles) and southern (FRA-S, green circles) French stake farms. The purple, black (very close to each other), and red circles are the stake farms near Concordia Station shown in Fig. 1. Longitude and latitude are shown in decimal degrees.
2.2 Reanalysis and regional climate models datasets
For this study, hourly snowfall, snow sublimation and deposition were extracted for the pixel nearest to Concordia Station over the 2004–2023 period from the ERA5 reanalysis produced by the European Centre for Medium-Range Weather Forecasts (ECMWF, horizontal resolution 0.25°×0.25°, which corresponds to ∼28 km North-South and ∼7 km East-West for the area of Dome C, Hersbach et al., 2023) and from the Modern-Era Retrospective analysis for Research and Applications, Version 2 (MERRA-2, horizontal resolution 0.5°×0.625°, which corresponds to ∼55 km North-South and ∼18 km East-West for the area of Dome C, Gelaro et al., 2017). Over the same period but with monthly resolution, snowfall, snow sublimation and deposition were also extracted from regional climate models MAR (Modèle Atmosphérique Régional) and RACMO (Regional Atmospheric Climate Model). Both models are specifically developed to study the polar regions and forced at their lateral boundaries and over the ocean by the ERA5 reanalysis. RACMO has a horizontal resolution of ∼27 km and MAR of ∼35 km. The version 2.4p1 of RACMO (van Dalum et al., 2024) and the version 3.12 of MAR were used (Agosta et al., 2019; Servettaz et al., 2023). SMB has been calculated as the sum of the snowfall and snow deposition minus snow sublimation.
2.3 Snow density
At the Concordia Station, in the nearby area of the current Italian stake farm, snow density has been measured since December 2014 monthly in snow trenches dug from the surface to 1 m deep at 10 cm intervals. To drill the snowpack, a core barrel 4.5 cm in diameter of 25 cm long was used: it was inserted horizontally in the snow and the snow density was calculated from its weight. The standard errors of the mean, for the various depths, are in the range from ±3.5 to ±5.5 kg m−3 while the 95 % confidence intervals are between ±7 and ±10 kg m−3 (Fig. 3). Each month a single measurement was performed for each layer. From these long and continuous time series, a constant mean density profile can be obtained. For the first layer near the surface, the mean value for the 2014–2023 period was 321 kg m−3, very close to the value used by Genthon et al. (2015) (320 kg m−3) and it increased, not monotonically, up to 353 kg m−3 at 1 m depth. Snow density at the stake base is a crucial parameter to evaluate the SMB, i.e., to convert the snow accumulation in centimeters to millimeters of water equivalent (mm w.e.) (Takahashi and Kameda, 2007). However, over time some stakes may be buried more than 1 m from the surface due to snow accumulation; therefore, it is necessary to know the snow density beyond 1 m depth. One possibility is to consider the model by Leduc-Leballeur et al. (2015):
where is the mean snow density, in kg m−3, at a depth h, in meters, which provides a continuous estimate of the firn/ice density down to hundreds of meters.
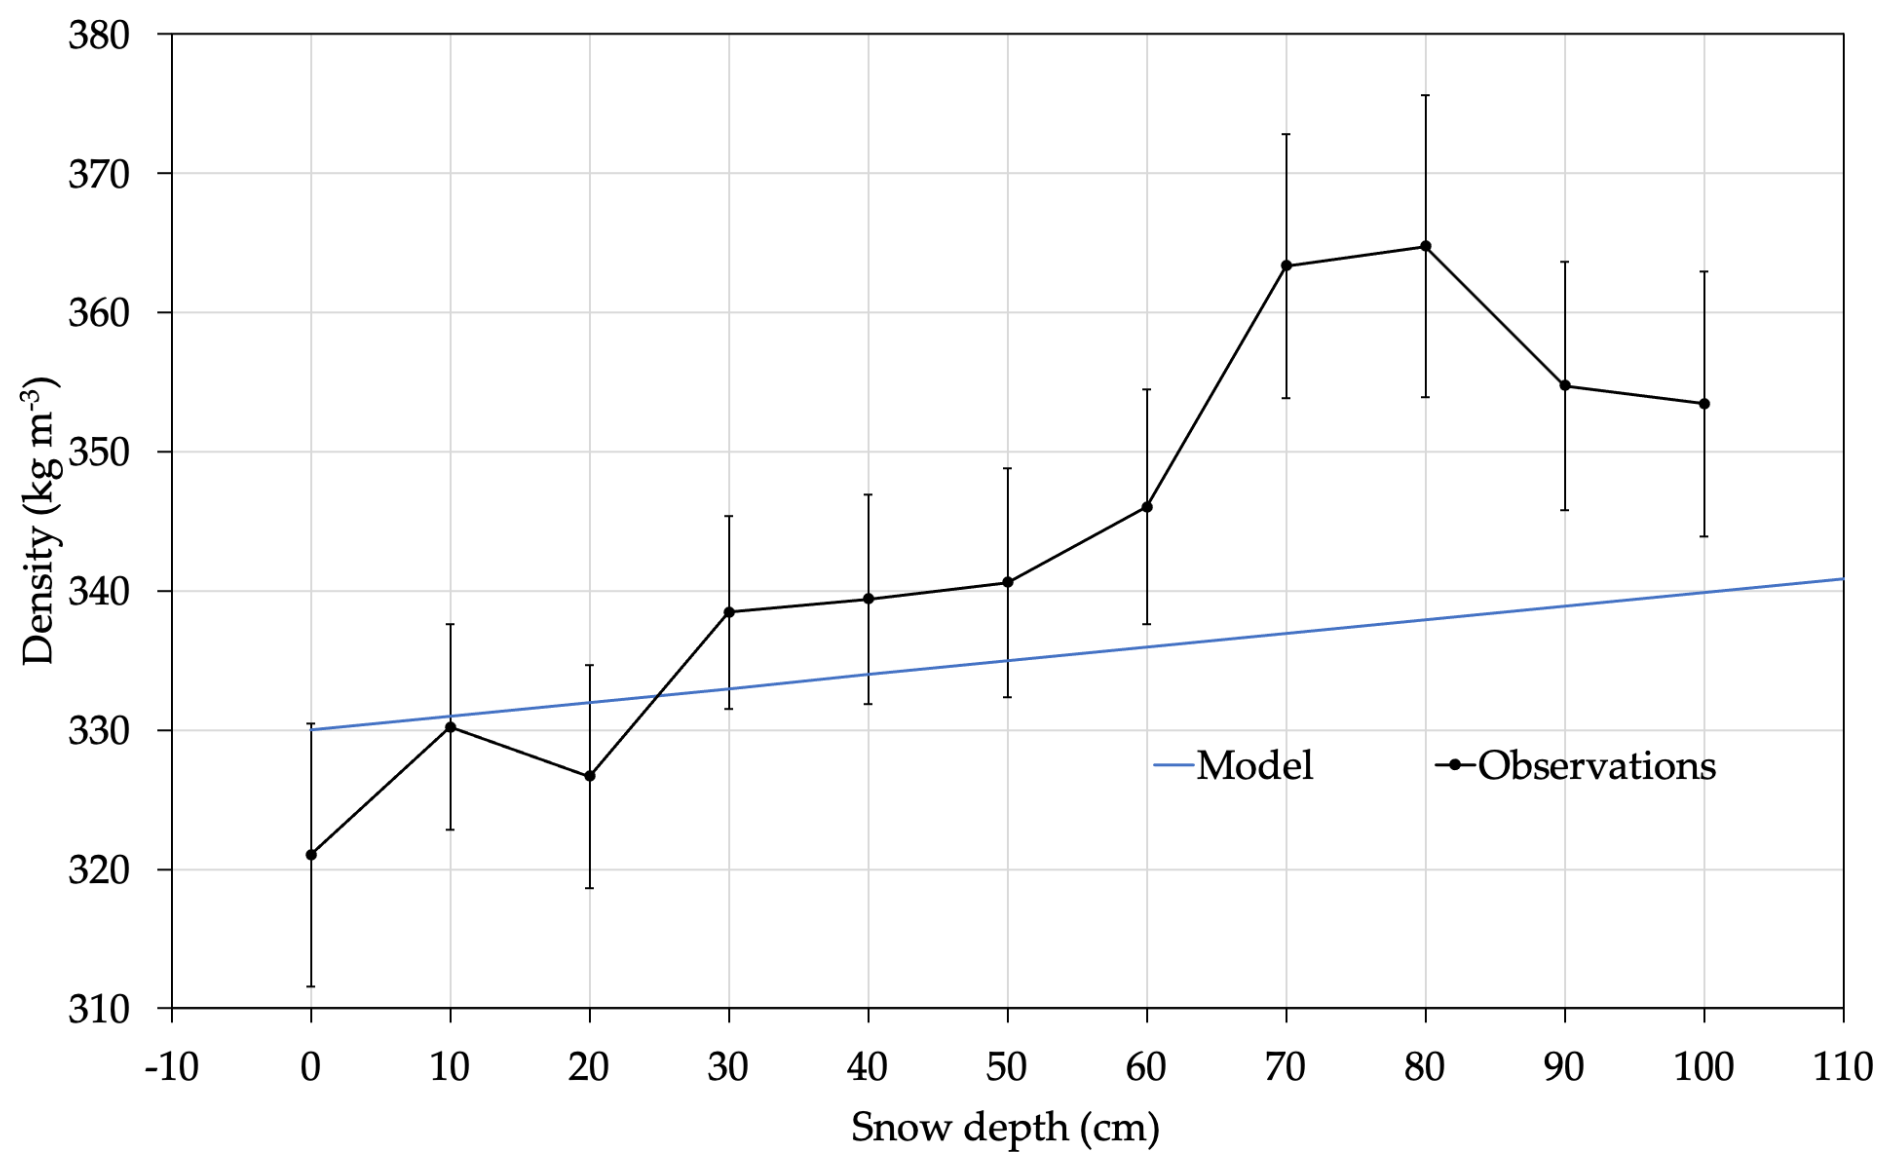
Figure 3Observed snow density from 0 to 1 m depth at 10 cm intervals (black line) near Concordia Station for the 2014–2023 period, and 95 % confidence intervals (bars); the model (blue line) is the Eq. (1).
The snow water equivalent provided by the models in millimetres w.e. have been converted in centimetres of snow by using 320 kg m−3 as surface snow density ρ0, as in Genthon et al. (2015).
2.4 Automatic weather stations (AWSs)
Hourly wind speed and direction are derived from the observations of the Italian AWS Concordia (75.105° S 123.309° E, 3230 m, approximately 800 m far from the Station), managed by the Italian Antarctic Meteo-Climatological Observatory of the PNRA, which are available for the 2005–2023 period; a Vaisala Milos 520 model station is installed 3 m above the ground and equipped with both heated and unheated aerovane, and an ultrasonic wind sensor WS425 (https://www.climantartide.it/strumenti/aws/Concordia/index.php?lang=en, last access: 15 September 2025). Details on sensors and technical data are reported in Table 1. Wind speed and direction are provided hourly, with a resolution of 1 kn and 10° respectively. Wind speed is then reported in m s−1. Other AWSs are present in the Dome C area, but this is the only one with heated sensors, not affected by frost.
Table 1Description of the wind sensors of the Concordia AWS used in this study.
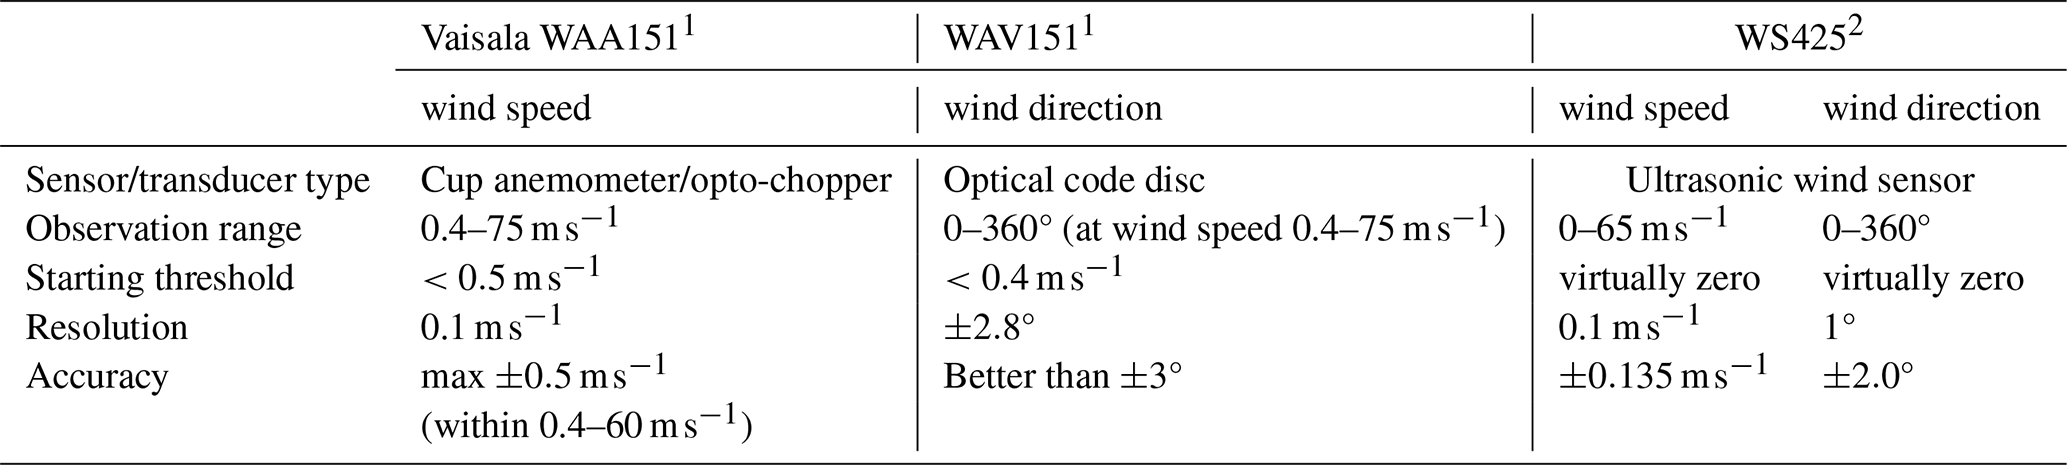
1 https://docs.vaisala.com/v/u/B210382EN-J/en-US (last access: 15 September 2025)
2 WS425 Users Guide M210361EN-E.
2.5 Snow compaction
Generally, the snow compaction effect cannot be ignored. Each snow layer between the surface and the base of the stake is compressed under the weight of the overlying snow; therefore, the height measured at the stakes actually underestimates the real increase in snow depth (Ekaykin et al., 2020). Considering this process, the annual SMB estimate was increased by 8 % at Vostok (Ekaykin et al., 2020, 2023) and by 27 % at Dome Fuji (Takahashi and Kameda, 2007; Kameda et al., 2008). At these locations, direct estimates of the snow compaction were possible as the snow density at the base of the stakes was measured jointly to the stake height or by comparison of two stakes of different length very close to each other. The yearly compaction δb of a snow layer between the surface (with snow density ρ0) and the stake base (with snow density ρh) can be evaluated as (Ekaykin et al., 2020):
2.6 Bootstrapping
The Italian and French stake farms near Concordia Station consist of 13 and 50 stakes, respectively, with 50 more considering also the recently installed FRAb stakes. To evaluate the possibility that differences between the two sets of observations, i.e., the Italian and French stake farms, could arise from their different size or proximity to the buildings, a bootstrapping was implemented. In this procedure, once the normality distribution of the data has been verified by means of the Anderson-Darling test (Anderson and Darling, 1952), a random sampling of 13 values out of the 50 observations (or less in the recent years) from the French stake farm is repeated 10 000 times. Thus, for each year over the 2004–2023 period, the mean accumulations for these 13 samples are evaluated jointly with their 95 % confidence intervals. Then, these intervals are compared to the observations coming from the Italian 13-stake farms by means of the Student's t-test and F-test (Snedecor and Cochrane, 1989).
3.1 Snow buildup near Concordia Station
The cumulative snow buildup (SB, expressed in cm, whereas SMB is in kg m−2) recorded by the stake farms near Concordia Station is shown in Fig. 4. The zero has been set at the beginning of 2011, the first year with complete data at the ITA stake farm. The ITA observations are generally below the FRA and FRAb data, indicating SB underestimation by the former with respect to the latter. On the other hand, the previous Italian stake farm, ITAa, had similar or larger accumulation with respect to FRA, but the scarcity of the common period (5 years) makes it difficult to draw conclusions. The FRA and FRAb observations are comparable. Note the different temporal resolution of the datasets, with the ITA observations capable of detecting intra-annual events, e.g., the relatively large accumulations recorded in September 2021 and March 2022, which cannot be appreciated by FRA and FRAb observations.
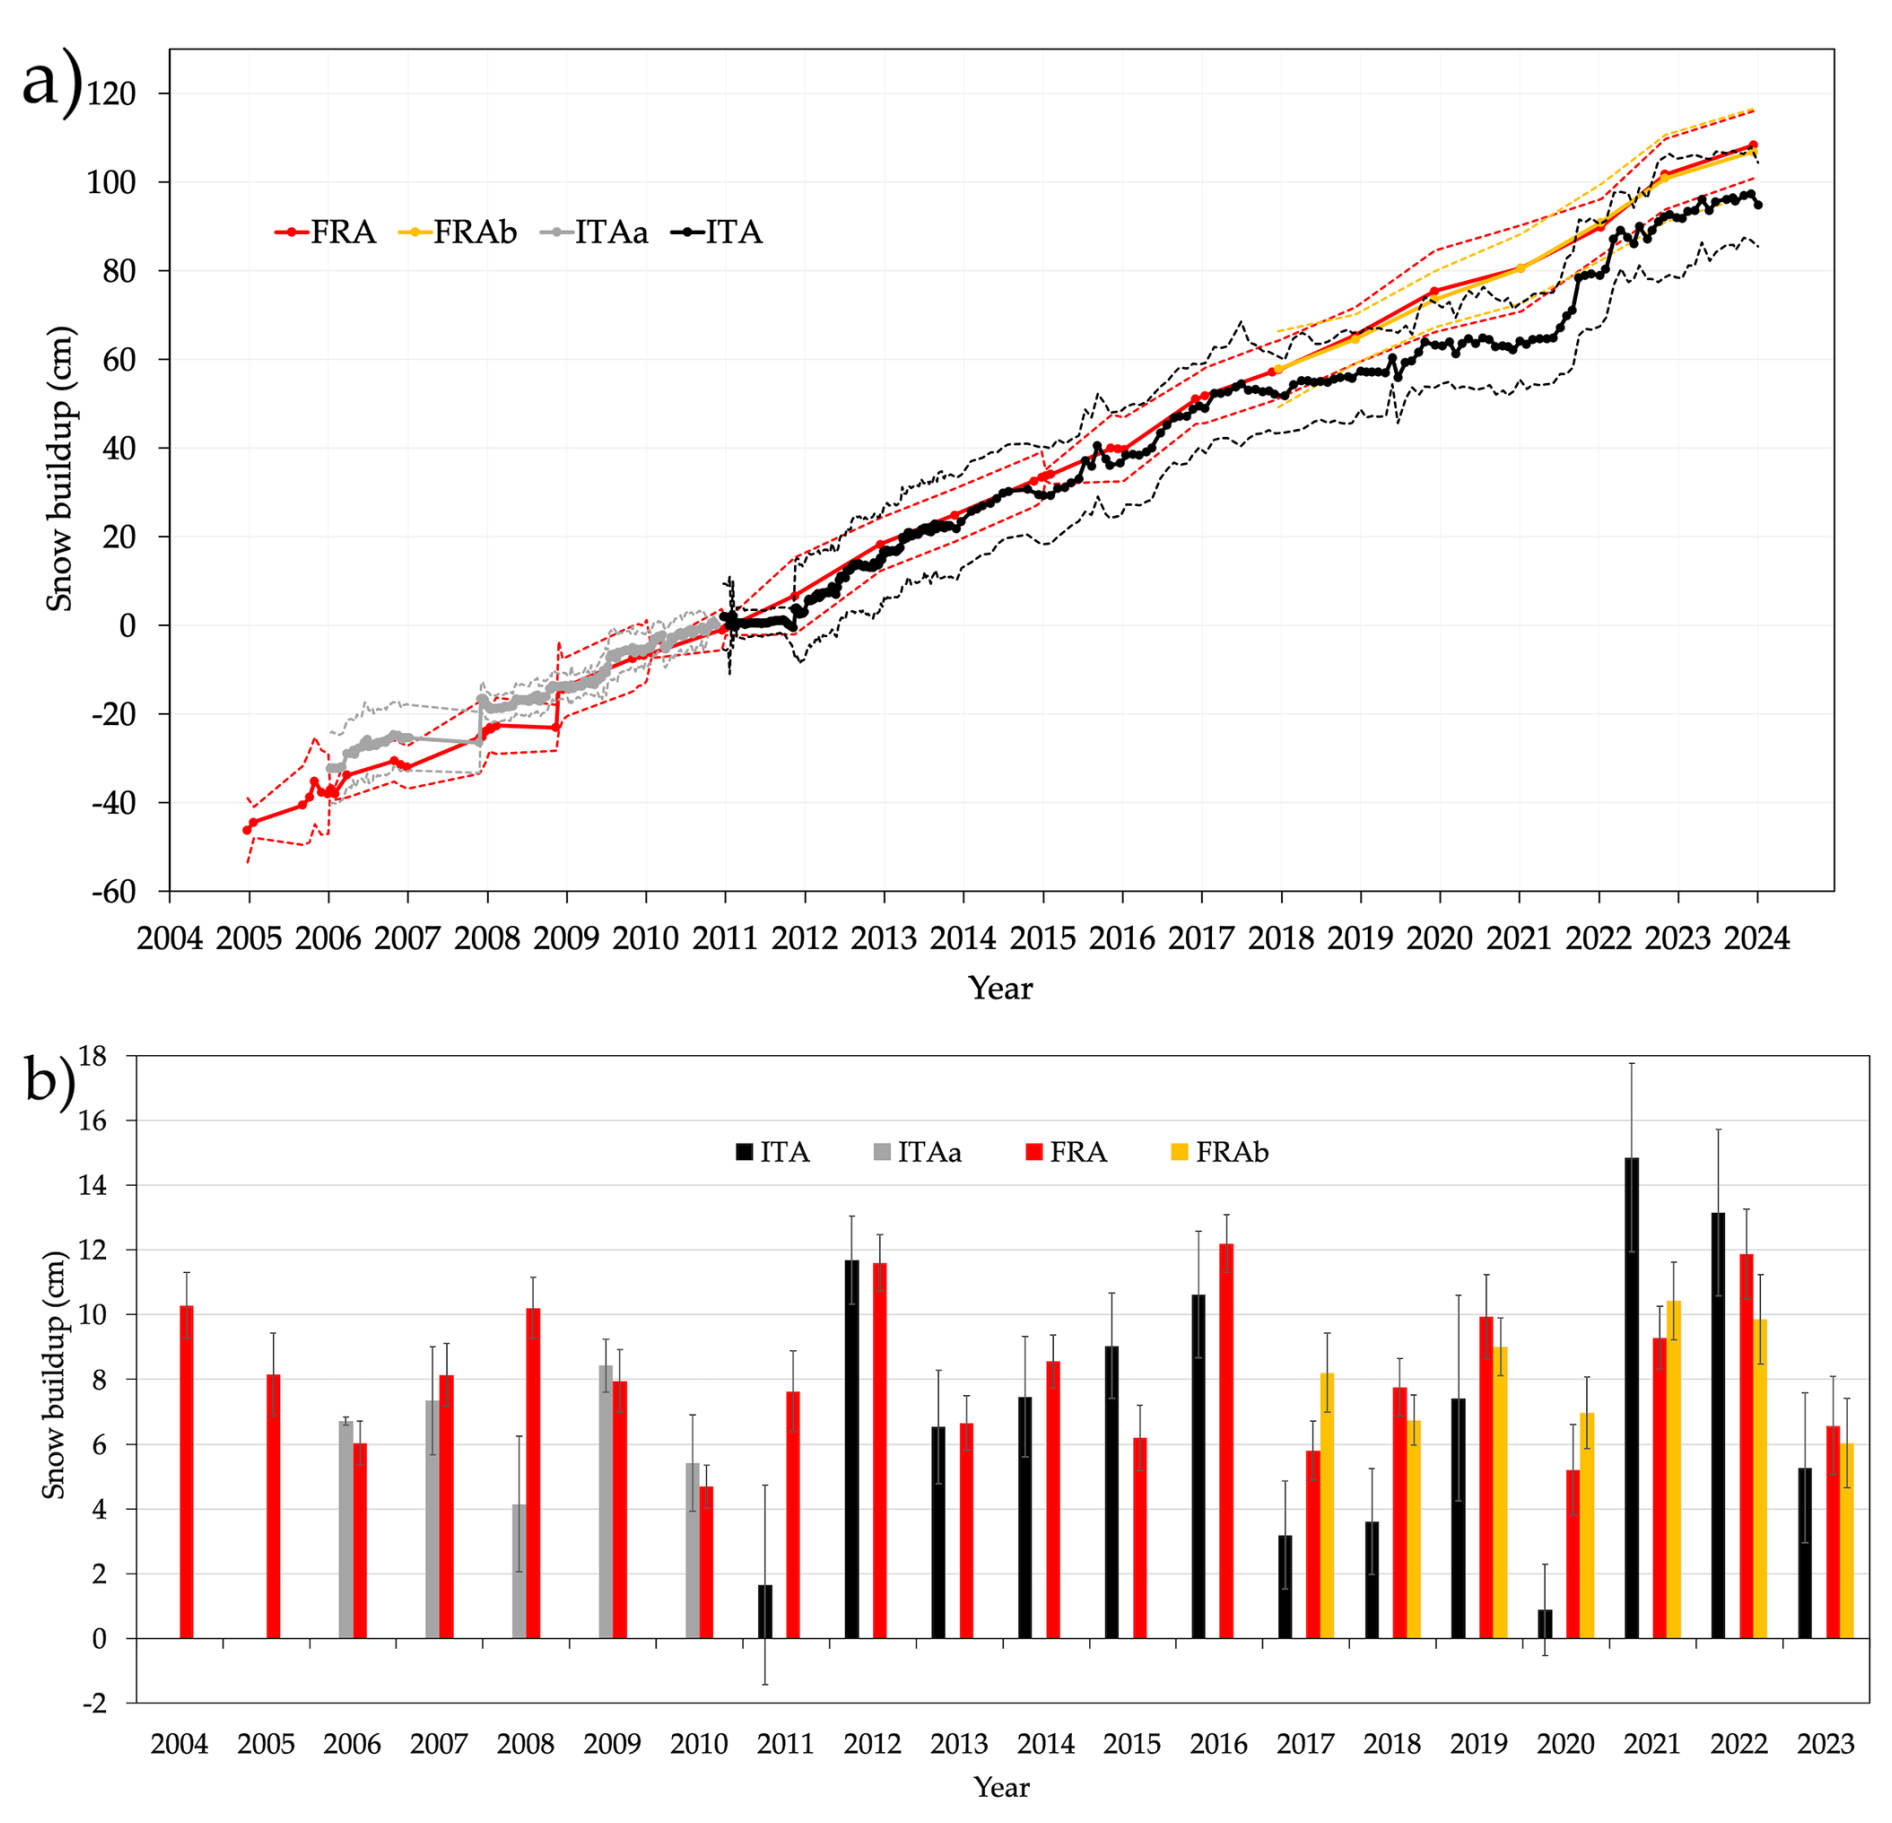
Figure 4(a) Cumulative snow buildup from the Italian and French stake farms near Concordia Station with respect to the beginning of 2011. Continuous coloured lines connect the mean values while the dashed lines indicate ±1 standard deviation of each dataset; (b) yearly mean snow buildup from the Italian and French stake farms near Concordia Station. The uncertainty bars indicate the standard errors of the mean values.
From these data, it is possible to extract yearly SB, which is reported in Fig. 4b. However, the stakes observations do not always cover exactly 365 d, nor they generally refer precisely to the calendar year (1 January–31 December) because of the different schedules of the Italian and French observers, and due to the meteorological conditions, which constrain the possibility to get outside of the Station to take the measurements. Since the French observations are less frequent than the Italian ones, the date of the French measurement closest to the beginning of each year has been considered as reference to compute the yearly accumulation, and the date in the ITA dataset closest to this reference date has been selected. As an example, if in a certain year the date of FRA closest to New Year's Day is 10 January, and the ITA's closest available dates are 29 December (of the previous year) and 15 January, 15 January is chosen for ITA as the starting date to evaluate the SB of that year. In fact, 15 January is closer to 10 January than 29 December, despite 29 December being closer to New Year's Day than 15 January. The number of days used for each year to calculate the yearly SB is shown in Fig. S2 in the Supplement. The measurements of FRA and FRAb are collected on the same day.
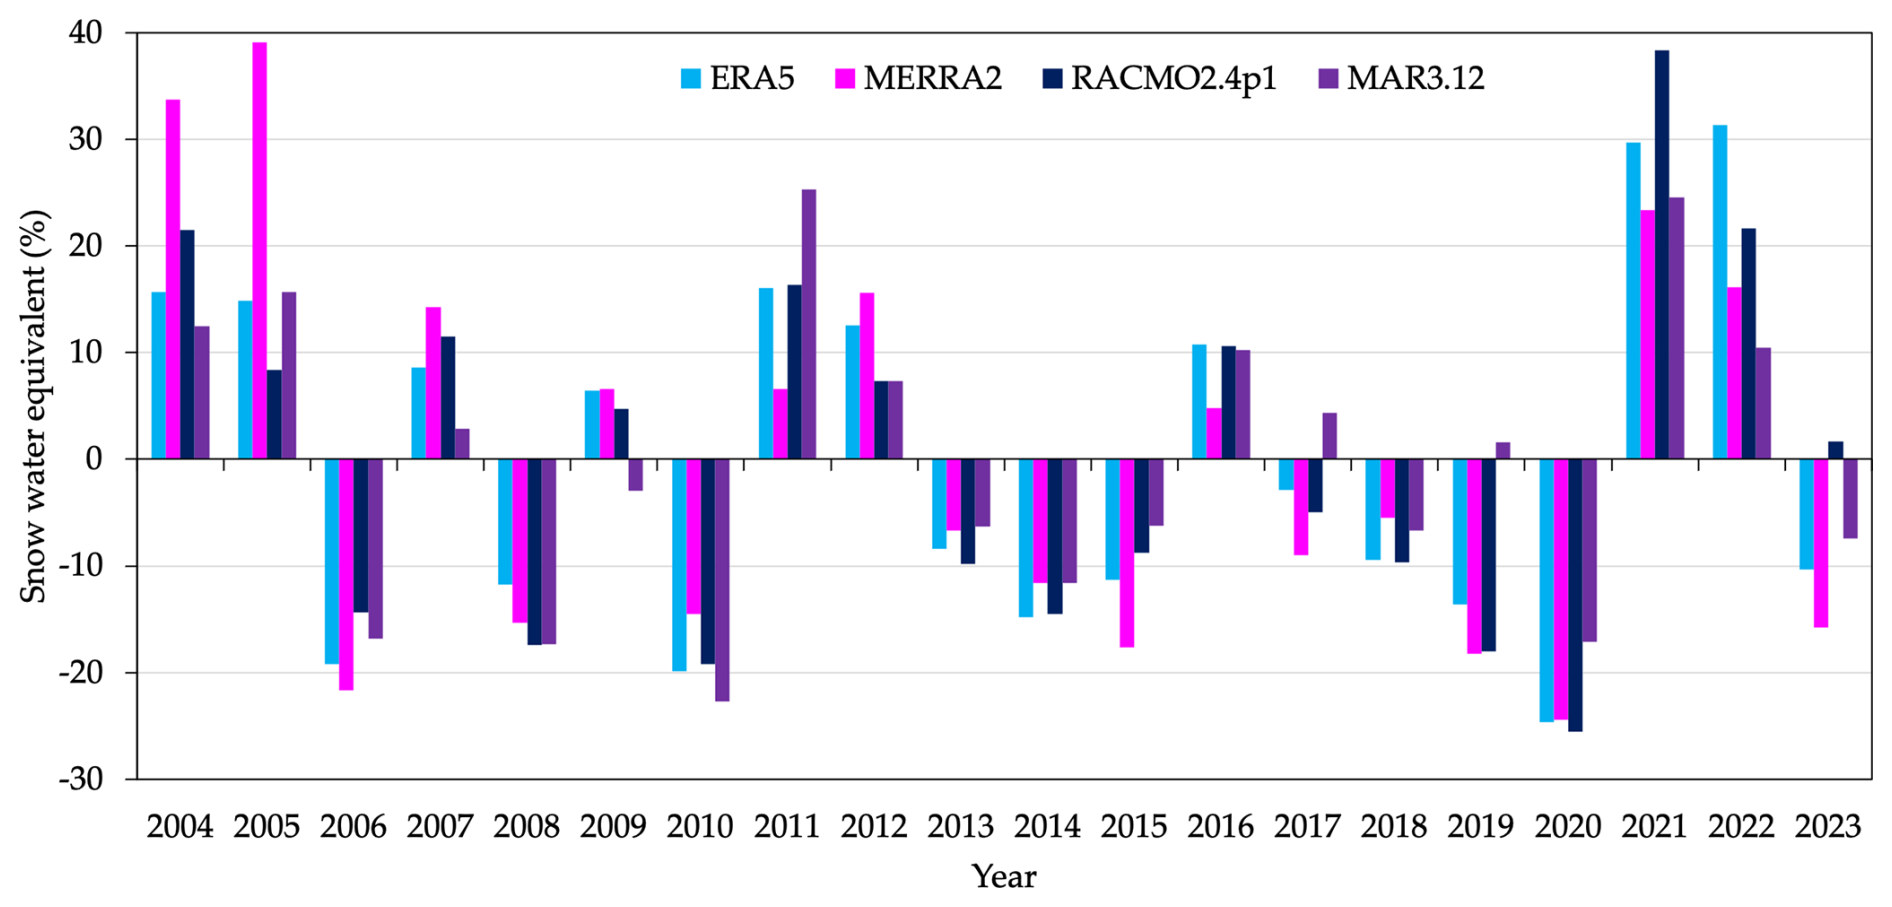
The SB values estimated by the reanalysis and regional climate models have been compared to the measurements taken at the stakes. Figure S3a in the Supplement reports the yearly SB for the 2004–2023 period, i.e., the sum of the snowfall and snow deposition minus snow sublimation, according to ERA5, MERRA2, RACMO2.4p1 and MAR3.12, for the pixel nearest to Concordia Station. Results are also summarized in Table S1 in the Supplement. In this case, the values refer to the correct calendar years, as not all the datasets are available with daily resolution. Figure 5 shows the anomaly of the SB (with respect to the 2004–2023 climatology, expressed as percentage, whereas the absolute anomaly values, in mm, are shown in Fig. S3b). While Fig. S3a highlights that MAR3.12 provides larger values with respect to the other datasets, the anomalies of Fig. 5 indicate that the temporal evolution is nearly the same across all the reconstructions, as it was expected because the regional models are initialized on ERA5. This confirms the findings of Ning et al. (2024), according to which ERA5 and MERRA2 datasets provide some of the best model representation of the snow variability in the inner Plateau of Antarctica since 1979. In Table S1 the difference of the estimates of ERA5 and MERRA2 between the calculation of the yearly total using the calendar year and the dates of the observations of the FRA stakes, are reported. Yearly differences are less than 5 % most of the time, with maxima in 2022 (+19.0 % and +26.6 %, respectively) as only 295 d are available for the yearly sum using the dates from the stakes observations, and minima in 2023 (−16.2 % and −16.9 %, respectively), with 406 d.
The SB observations and reconstructions are summarized in Table 2. During the longest period of continuous analysis, from 2004 to 2023, only FRA observations are available, providing a mean annual value of 8.2 cm, with a 95 % confidence interval of 8.1–8.4 cm. The maximum possible underestimate for this value due to snow compaction (whose estimation is explained below) is 0.7 cm but it is 0.3 cm on average (Table 3), giving a sum of 8.5 cm. ERA5 and MERRA2 provide the closest reconstructions to this value, 8.5 and 9.1 cm, respectively. During the 2006–2010 period, when both FRA and ITAa observations are available, the mean values they provide are not compatible according to a Student's t-test (p value=0.02). In the 2011–2023 period, mean values of FRA and ITA are not compatible either (p value<0.01). Finally, in the 2017–2023 period, when also FRAb is available, the SBs observed by FRA and FRAb are compatible (p value=0.40), while the value of ITA is not compatible with the one of FRA (p value=0.04), nor with the one of FRAb (p value=0.01). The F-tests performed on the same pairs of datasets indicate that there is no statistical difference (p value>0.05) for the standard deviations.
Table 2Mean snow buildup and, in parenthesis, the 95 % confidence intervals CI, from the stake farms and the models near Concordia Station for different periods. The estimate from the models have been converted from snow water equivalent to snow accumulation using ρ0=320 kg m−3. All values are in cm.
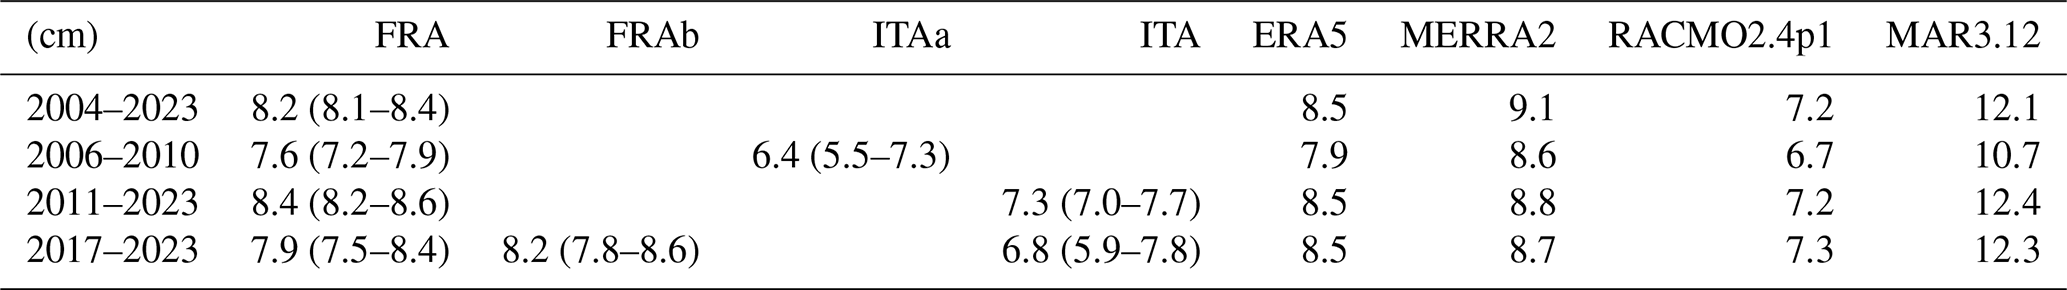
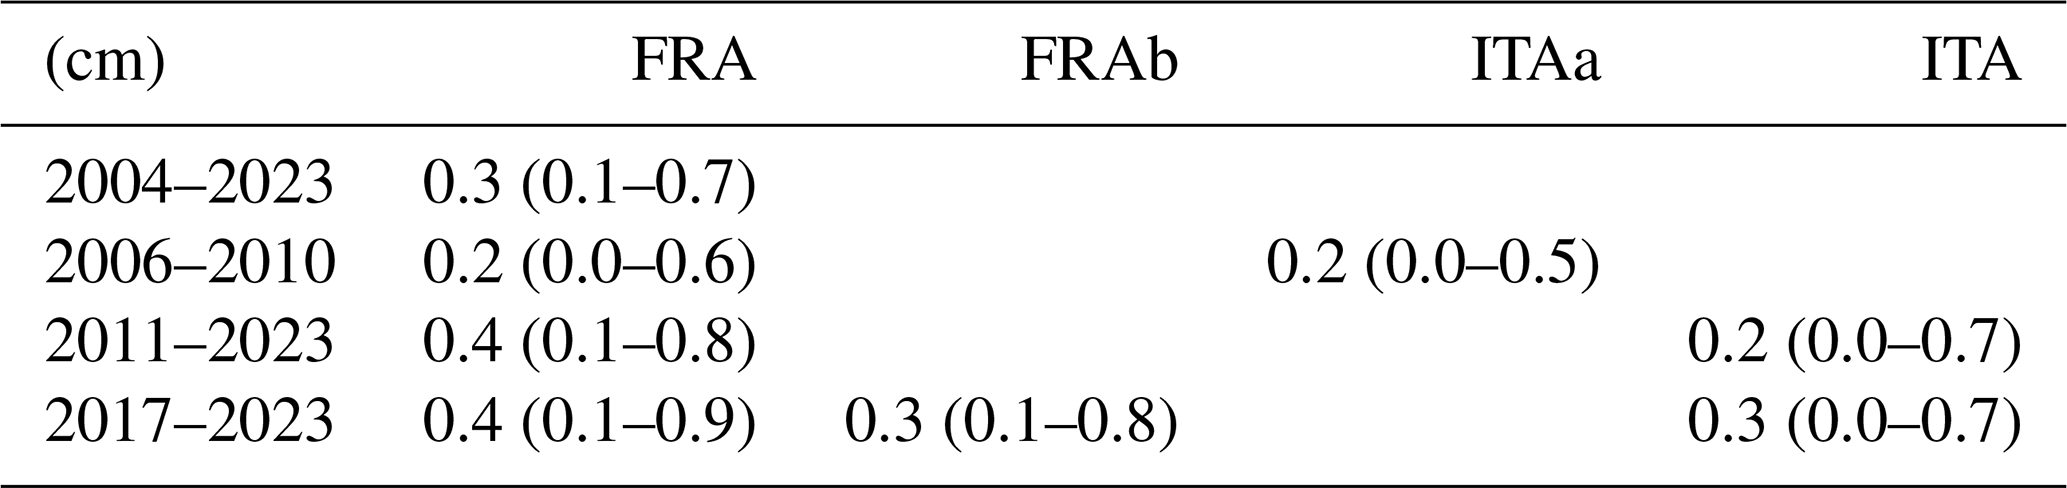
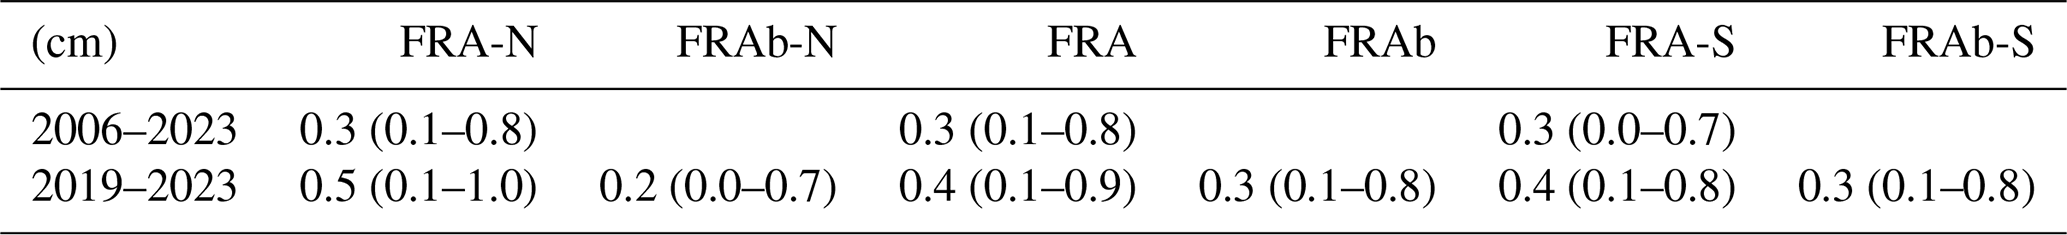
Table 3Mean snow compaction δb and, in parenthesis, the 95 % confidence intervals CI, at the stake farms near Concordia Station for different intervals of years. All values are in cm.
Considering the 2004–2023 period, to have for the models the same SB estimate as FRA and taking into account the range of the possible compaction, the surface densities ρ0 should be 307–328, 330–352, 261–279 and 438–468 kg m−3, for ERA5, MERRA2, RACMO2.4p1 and MAR3.12, respectively. Only the ERA5 range of density is compatible with the measured data shown in Fig. 3.
The effect of snow compaction δb cannot be estimated directly, as no observation of the snow density at the base of the stakes is taken jointly to the measurements of the stake height. The old and new French stake farms are not close enough (2 m) to directly evaluate the snow compaction observing the shift in the accumulations, as the variability in the small-scale topography (i.e., micro-reliefs and sastrugi) and in the snow density lowers the spatial correlation between the measurements at the stakes (Frezzotti et al., 2007; Ekaykin et al., 2023). In fact, the correlation coefficients between the pairs of adjacent stakes are statistically significant only for 13 stakes out of 50. The yearly estimate of δb is possible considering both Eqs. (1) and (2). First, ρh is estimated from Eq. (1), as the depth of each stake whose base h is known. Then, to take into account the variability of the snow density, N=1000 samples are taken from a Gaussian distribution having ρh as mean value and kg m−3 as standard deviation, which is the average of the standard errors found at the different depths shown in Sect. 2.3. Besides, ρ0 and SMB are estimates too; therefore, the procedure explained for ρh is also applied to ρ0 and SMB, with the Gaussian distribution of SMB having the mean value and standard deviation of the SMB estimations provided by the models. Thus, a mean value of δb is obtained for each year applying Eq. (2) and by applying a Gamma distribution to the above zero simulated data only (as δb is positive) also the 95 % confidence intervals are evaluated, for all the stake farms. Results are shown in Table 3.
Considering the longest available time series, FRA, over the 2004–2023 period a mean annual SMB in water equivalent can be calculated by multiplying the value of Table 2 by ρ0=320 kg m−3 obtaining 26.29 kg m−2 with a standard error of 0.23 kg m−2, and finally 27.21 ± 0.60 kg m−2 if the compaction effect (Table 3), with an error of 0.56 kg m−2, is also taken into account. This value confirms the SMB of the last 60 years derived from ice cores and GPR with respect to the β-tritium marker, and the increase with respect to the Tambora-marker of 1816; the lowest SMB belongs to the 1602–1739 period with ∼26 kg m−2 (Urbini et al., 2008). The analysis of GNSS poles revealed that over the 1996–2014 period the SMB was 31.1 ± 1.8 kg m−2 (estimated using ρ0=340 kg m−3, it is 29.3 kg m−2 using ρ0=320 kg m−3), a slightly higher value when compared to the other data probably because of the influence of the larger pole diameter (10 cm, while the diameter of the stakes is 2 cm) on snow-drift driven accumulation (Vittuari et al., 2025).
3.2 Snow buildup across Dome C
The French stake farms located 25 km North and South of Concordia Station allow to study in more detail the SB variability around Dome C. Previous studies (Urbini et al., 2008; Genthon et al., 2015; Cavitte et al., 2018; Vittuari et al., 2025) have already provided the evidence of the presence of a gradient in the accumulation, i.e., the southern area, being further away from the precipitation source with respect to the northern area, observes on average less accumulation (Genthon et al., 2015). The cumulative SB over the 2006–2023 period shown in Fig. 6a confirms these findings, as accumulations decrease going from North to South. However, the difference between the accumulations near the Station (i.e., FRA and FRAb) and the southern site (i.e., FRA-S and FRAb-S) is lower than the difference between the former and the northern site (i.e., FRA-N and FRAb-N). However, the yearly SB (Fig. 6b) indicates that in some years the hierarchy of the accumulation is not respected, as for example in 2013 the largest SB was observed in the southern site and the lowest in the northern site. In Sect. 3.4 the representativeness of the single and multi-year averages is discussed.
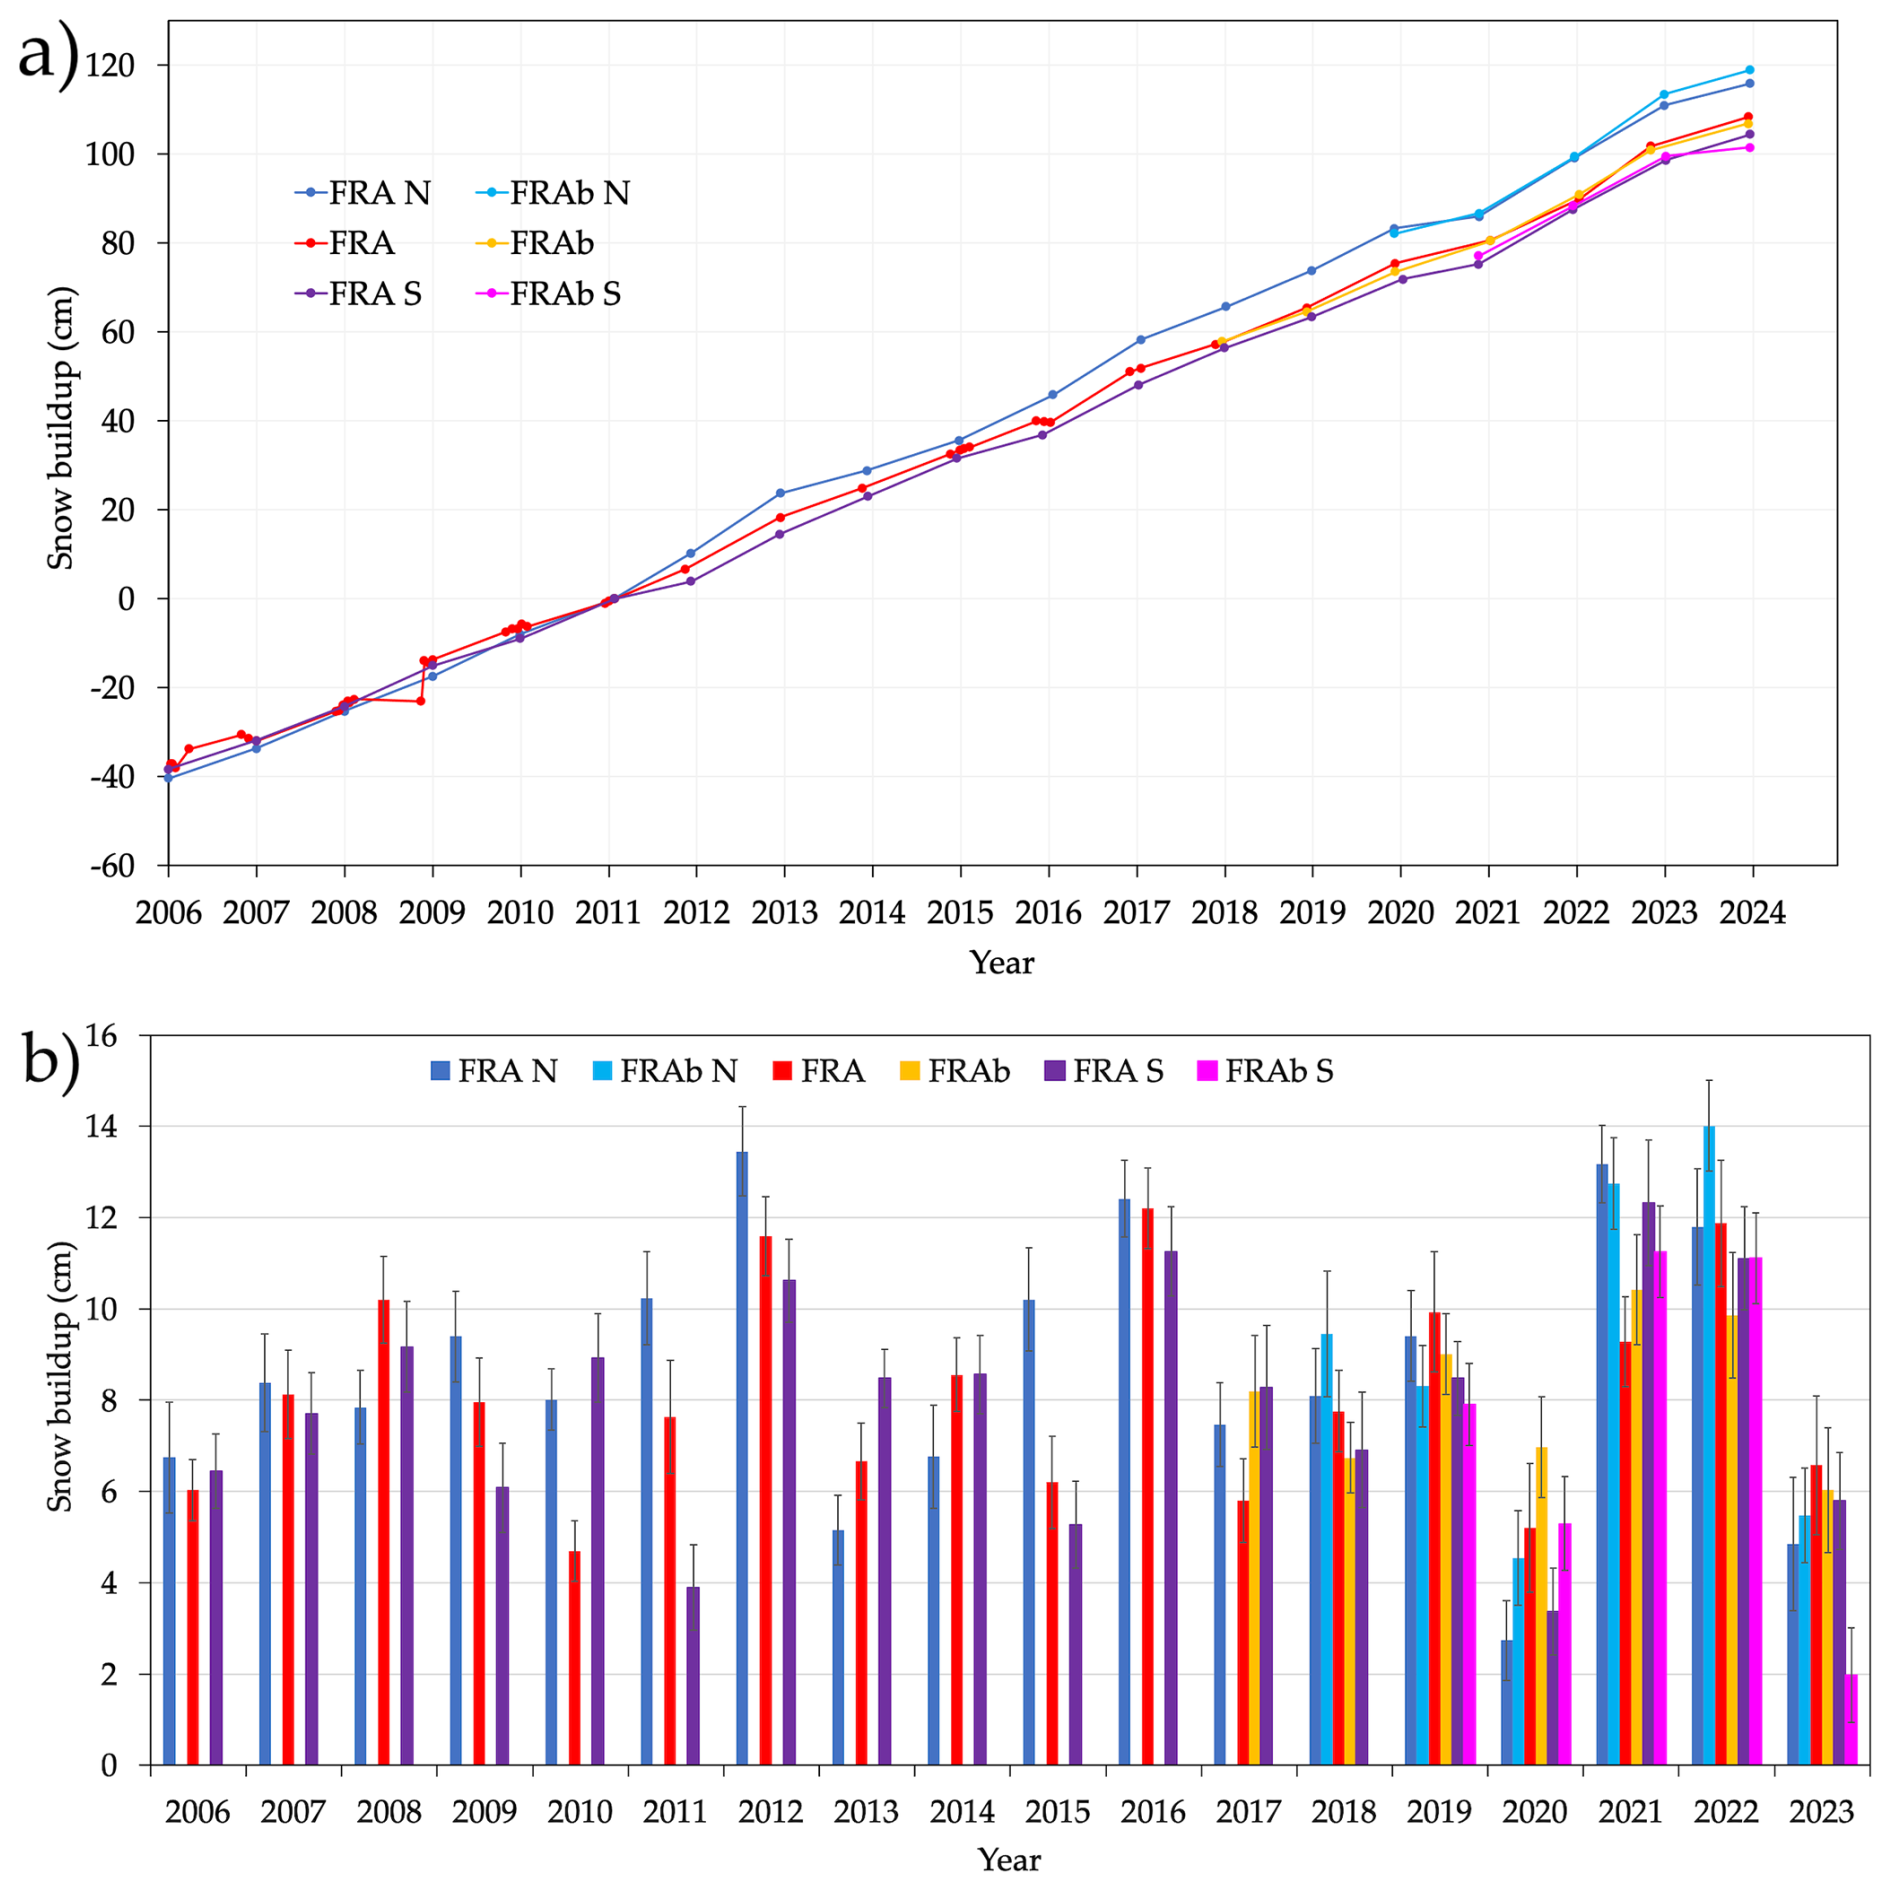
Figure 6(a) Cumulative snow buildup from the French stake farms near Concordia Station, and in the southern and northern sites for the 2006–2023 period, with respect to 2011; (b) yearly snow buildup derived from (a), the uncertainty bars indicate the standard errors of the mean values.
The mean SB and snow compaction δb have also been evaluated for the northern and southern stake farms; results are shown in Tables 4 and 5, respectively, jointly with the FRA and FRAb values evaluated over the same intervals. Note that only from 2019 the new stake farms FRAb, FRAb-N, FRAb-S, are all available.
Table 4Mean snow buildup and, in parenthesis, the 95 % confidence intervals CI, from the French sites near Concordia Station and the southern and northern stake farms for different intervals of years. All values are in cm.
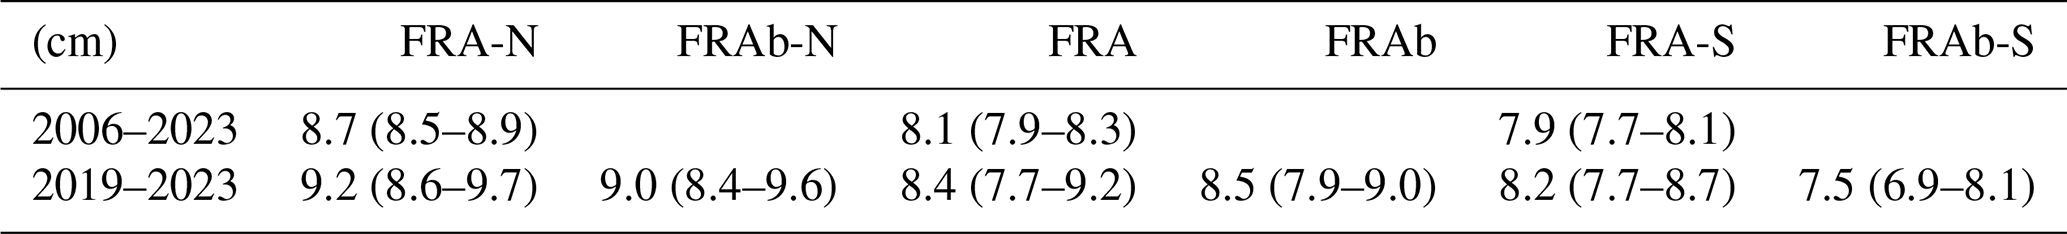
Table 5Mean snow compaction δb and, in parenthesis, the 95 % confidence intervals CI, at the French sites near Concordia Station and at the southern and northern stake farms for different intervals of years. All values are in cm.
The difference between the mean value of FRA-S and FRAb-S in 2019–2023 is larger than the corresponding differences between the new and old stake farms in the northern site and near Concordia Station. A Student's t-test reveals that the two datasets are leaning to compatibility (p value=0.08). This difference is mainly due to the 2023 observations: as clear from Fig. 6b, there is a difference of nearly 4 cm between FRA-S and FRAb-S in that year, which is unusual considering that the two stake farms are only 2 m apart. In 2024 the difference between FRA-S and FRAb-S had an opposite behaviour (not shown) and both the significance of these differences in 2023 and 2024 have been tested by means of a bootstrap sampling, providing p values<0.01. The SB gradient in the 50 km separating the southern and the northern sites has also been explored. Figure 7 compares the SB mean total variation from South to North derived from the observations and the models. The regression line of the SBs at the three points of the southern site, Concordia Station, and the northern site, has been multiplied by the total distance (50 km), for the 2006–2023 period (red bar in Fig. 7). The reconstructions of the models exhibit larger variations than the observations. The increase in 50 km from South to North evaluated from the stake farms is 0.7 ± 0.2 cm, i.e. 8 %–9 %, confirming the spatial variability of SB within three centuries of Urbini et al. (2008) using GPR internal layering (∼0.5 cm).
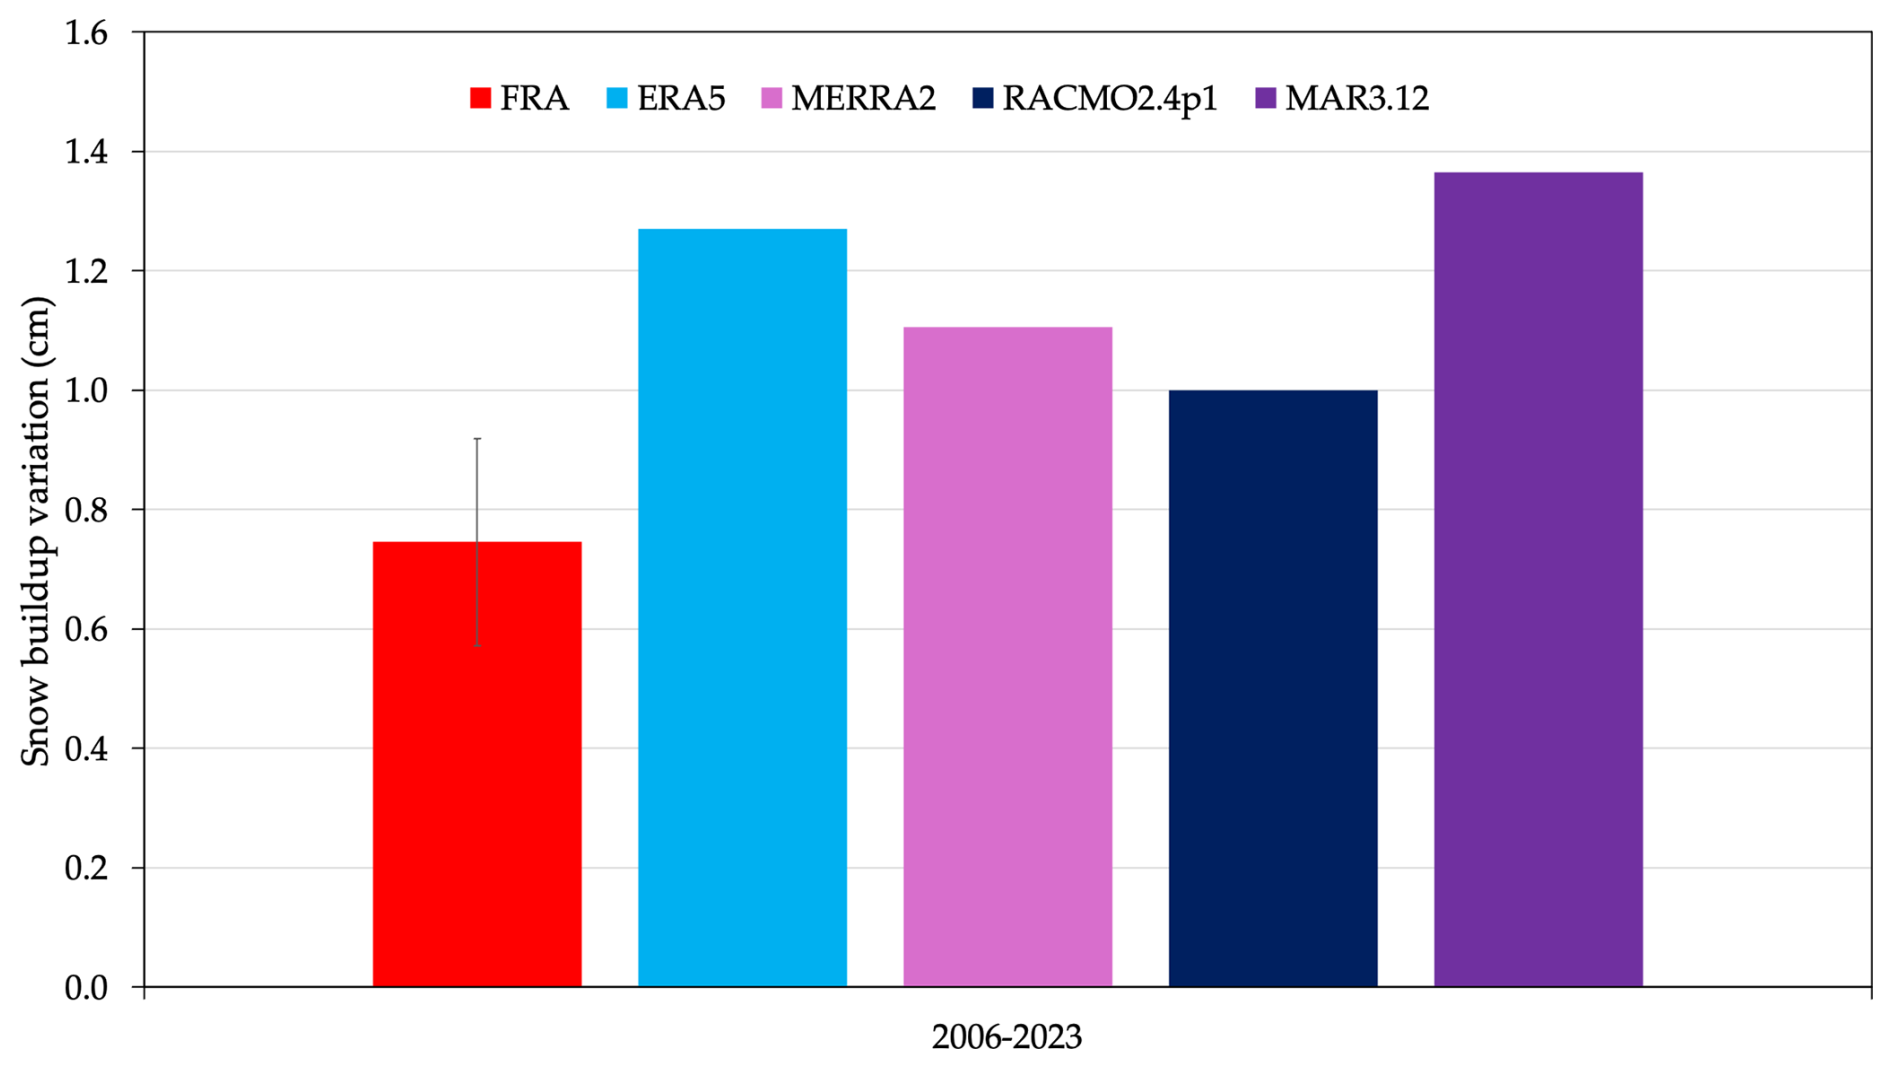
Figure 7Mean yearly snow buildup total variation across Dome C obtained from the observations in the French stake farms and from the models. The uncertainty bar indicates the standard error.
3.3 Bootstrap
The difference between the SB observed by the Italian and French stake farms near Concordia Station could be due to the difference in the number of stakes, the different extent of the area covered by the stakes (approx. 0.01 and 1.72 km2 for the Italian and French stake farms, respectively), and/or the influence of the buildings which alter the blowing/drifting snow near the surface or to other geographical/meteorological characteristics of the study area that might affect the SB locally. A bootstrap has been applied to assess the significance of the yearly differences. Results are reported in Fig. 8a. ITA, 2011, 2020, and 2021 are outside or in the lower limit of the 95 % intervals of FRA or FRAb, with p values of the t-tests being ≤0.01 for the first 2 years and <0.10 for the third one, suggesting the possibility that some other effects than the different size could play a role in determining these discrepancies.
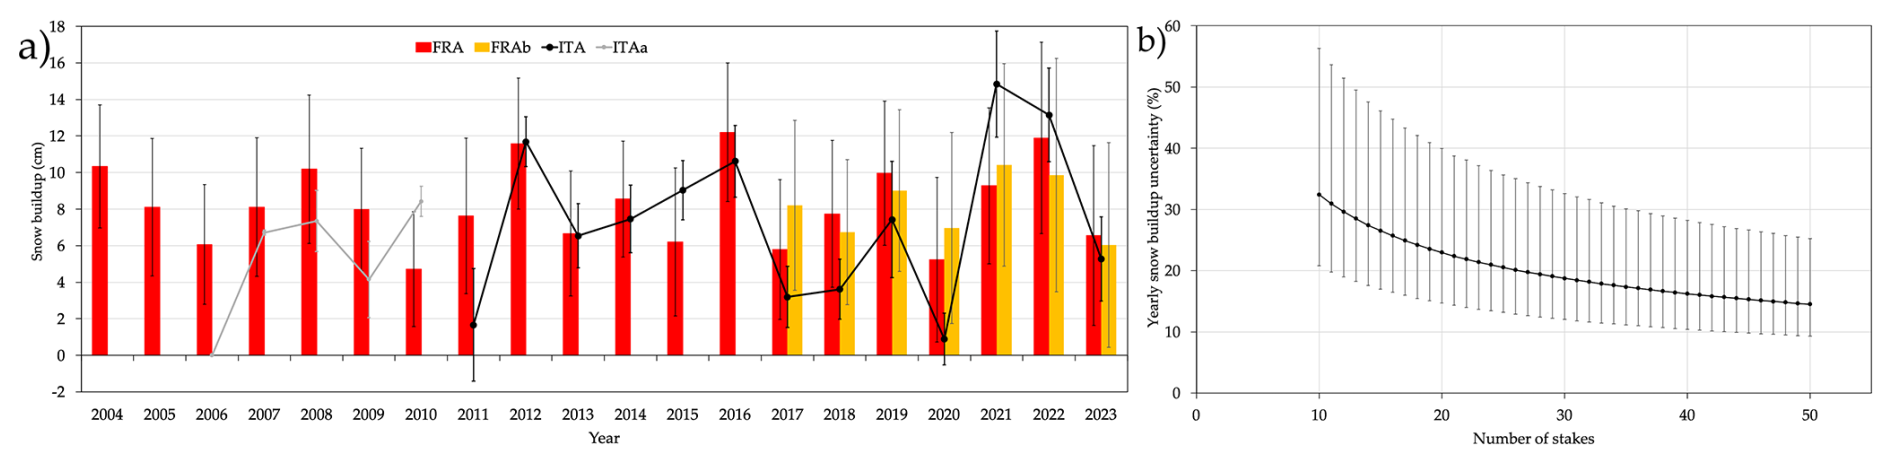
Figure 8(a) Bootstrap simulation: yearly mean snow buildup and 95 % confidence intervals (light grey bars) of FRA and FRAb. The red and yellow bars are the FRA and FRAb observations, and the grey and black lines are the ITAa and ITA observations. (b) Mean uncertainty (black line) in the yearly snow buildup associated with the bootstraps as the sample size increases from 10 to 50 stakes. Error bars range from the minimum to the maximum difference between the observed FRA and the sampled values, for the 2004–2023 period.
It is possible to evaluate the mean, minimum and maximum yearly difference between the SB observed by FRA and the value obtained by the bootstrap, varying the sample size, i.e., the number of stakes. Figure 8b shows the relative difference (in %) between the mean yearly SB associated with the bootstraps and the observations, as the sample size increases from 10 to 50 stakes. The error bars cover the whole range from the minimum yearly difference (for the 2004–2023 period) to the maximum. Therefore, while for a 13-stake farm the uncertainty associated to the yearly SB is almost 30 %, (ranging from nearly 20 % to 50 %) for a 50-stake farm the uncertainty is halved, nearly 15 %, on average (ranging from 10 % to 25 %).
3.4 Multi-year averages
Representativeness of the stake farms over time has also been evaluated. Following Frezzotti et al. (2007), for each stake farm the percentage of stakes with an accumulation difference with respect to the average less than ±10 % is shown in Fig. 9, for different number of years. Thus, for 1 year only ∼10 %–15 % of the stakes have measurements which differ less than 10 % from the average of the belonging stake farm, for a running mean of 5 years this percentage increases to ∼20 %–40 %, at 10 years it is ∼60 %–70 % and afterwards the increase is less steep. Note that the ITA stake farm takes more time (a couple of years on average for intervals >5 years) to reach the representativeness of the French stake farms. The causes of the different behaviour of the ITA and FRA stake farms are explored in the next Section (4.3). Thus, excluding the peculiar case of ITA, the time required for the SB measured at a stake farm in the Dome C area to overcome the noise induced by the local micro-relief, i.e., reaching the 70 % threshold of the number of stakes with difference less than 10 % compared to the average, is 10–12 years.
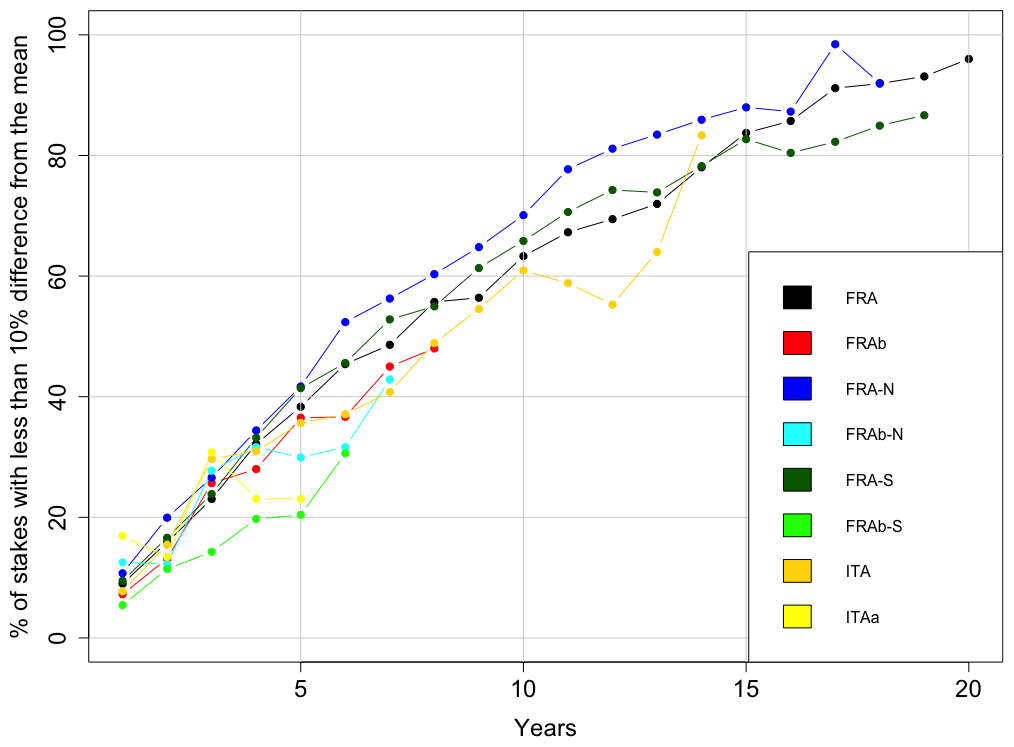
Figure 9Number of stakes (in %) with less than 10 % difference in accumulation from the mean of the stake farm for different year intervals.
4.1 Interaction of snow buildup with wind
The distribution of the yearly fraction of the number of stakes with negative and zero SB, i.e., with wind erosion, is shown in Fig. 10a. The ITA stake farm has more variability with respect to the FRA and FRAb ones, because of their different sizes but also as a probable effect of the enhanced turbulent mixing induced by the presence of the buildings which enhances sublimation of snow during drifting/blowing with export in the atmosphere. Besides, black carbon (BC) produced by the Station can also affect the albedo causing differences in surface temperature, sublimation, and surface hoar frost formation, impacting the final SB (France et al., 2011). In fact, snowpack's energy budget and photochemistry are strongly influenced by how solar radiation penetrates the snow. Light decreases exponentially with depth, governed by the asymptotic flux extinction coefficient, which – like albedo – depends on snow grain shape and size (Bohren and Barkstrom, 1974). However, no clear evidence exists that BC from Concordia Station measurably affects snow albedo, grain size, or surface temperature. Although Warren et al. (2006) reported elevated BC levels near the Station, subsequent work focused mainly on photochemical tracers, showing strong NOx spikes from exhaust plumes (Helmig et al., 2020) rather than radiative effects. Evidence from coastal Antarctic sites indicates that BC can reduce albedo and enhance melting (Cordero et al., 2022); although these effects have not been measured on the high Antarctic plateau, they are expected to be present.
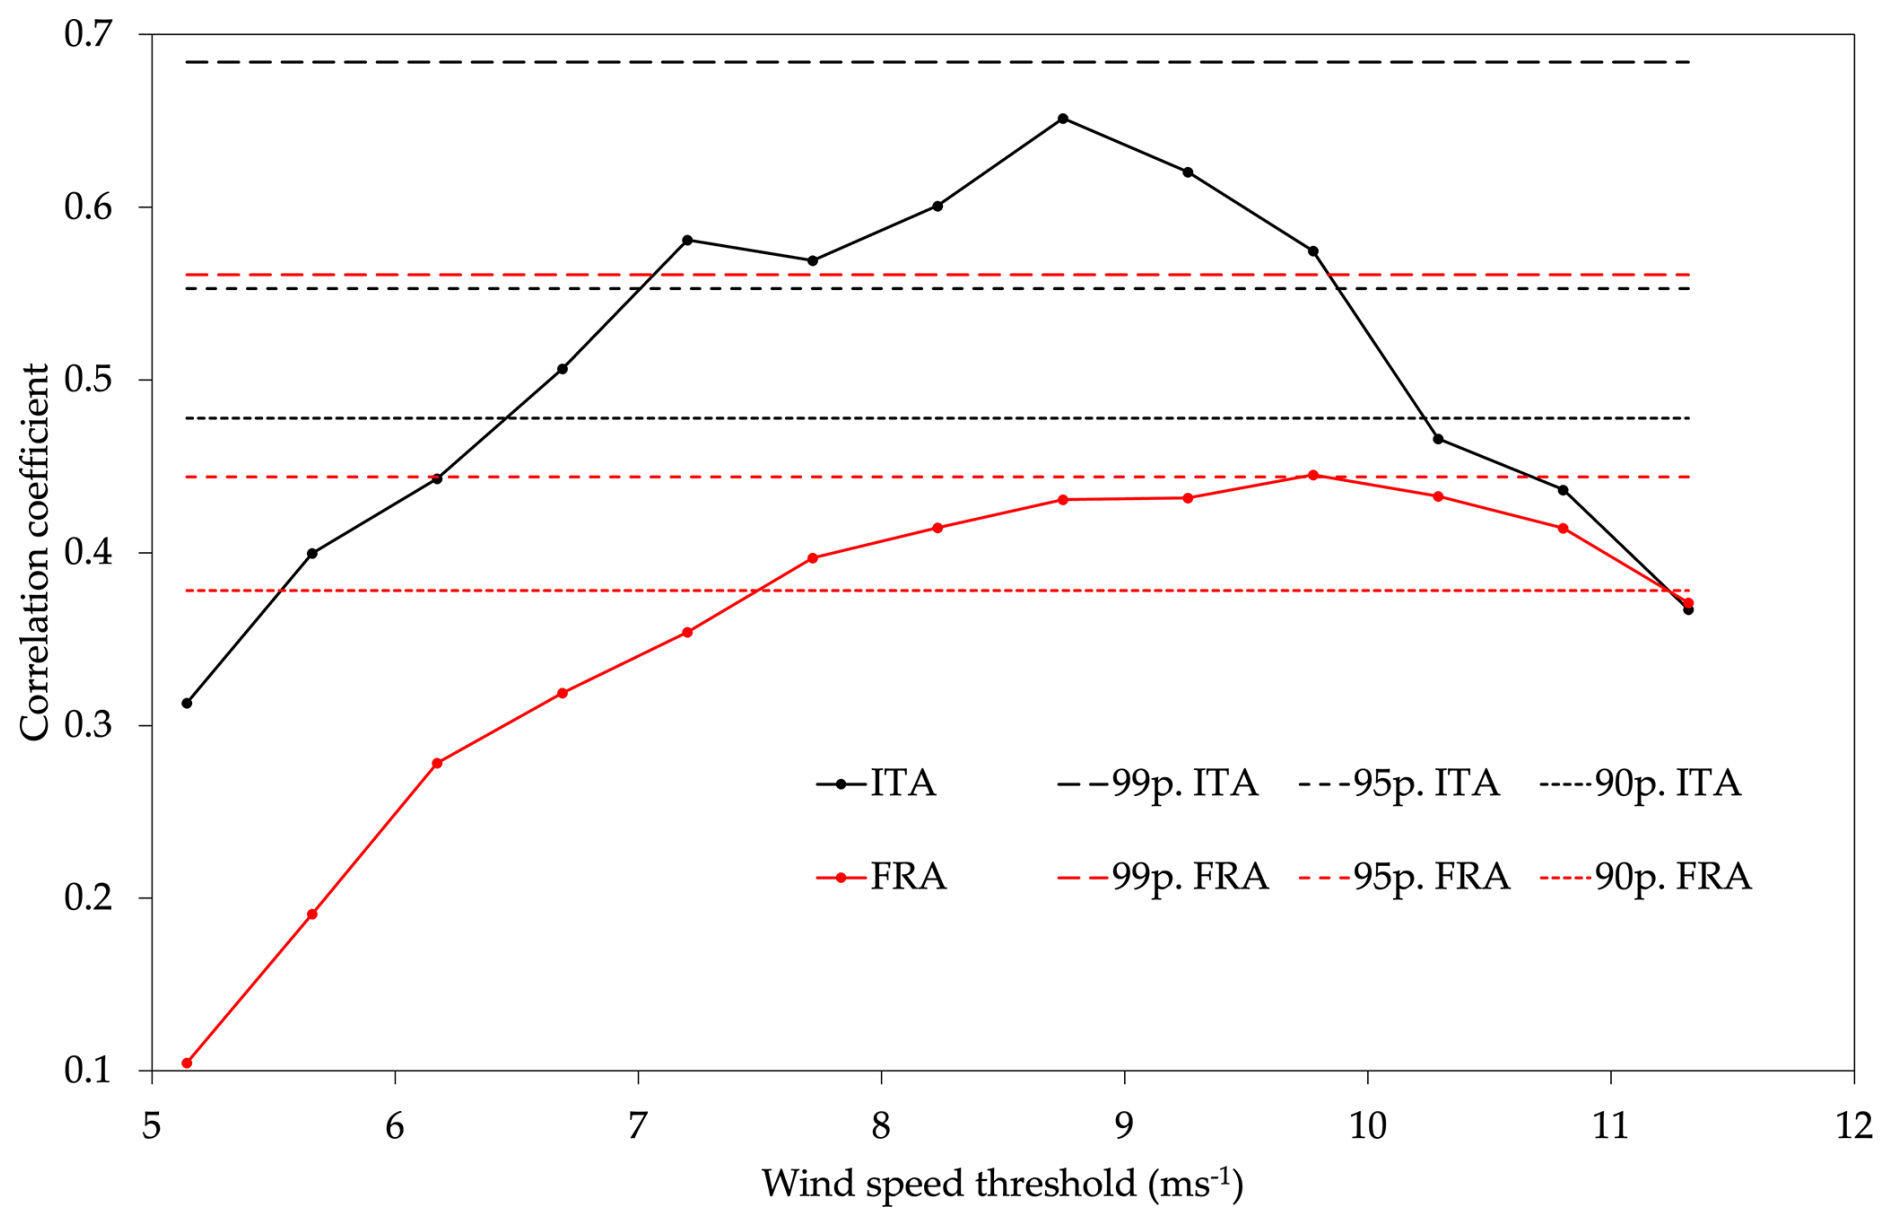
Figure 10Linear correlation coefficients between the yearly fraction of stakes with negative and zero SB and the frequency of wind speed values at the AWS above certain thresholds. 99 %, 95 %, and 90 % confidence levels for each stake farm are shown.
The ITAa series has values similar to the FRA one but it is short, and these effects are not appreciated. The effect of the turbulence has been investigated comparing the annual percentage of stakes observing erosion with the frequency of wind speed values at the AWS above certain thresholds. The maximum linear correlation occurs when a threshold of 8.7 m s−1 is considered for the ITA series (r=0.65, p value=0.02), while for FRA the threshold is 9.8 m s−1 (r=0.45, p value=0.05), as shown in Fig. 10.
The analysis of the stake measurements highlights a significant number of stakes with SB value ≤0, which reaches up to 30 % of the stakes at the annual level (FRA, Fig. 11c) and reaches 70 % for the ITA stakes during the autumn season (Fig. 11a). The absence of SB erosion (value ≤0) and the absence of corresponding deposition at the site mainly reflect the erosion caused by wind-induced sublimation during transport/blowing, as well highlighted by the correlation between SB value ≤0 and wind speed.
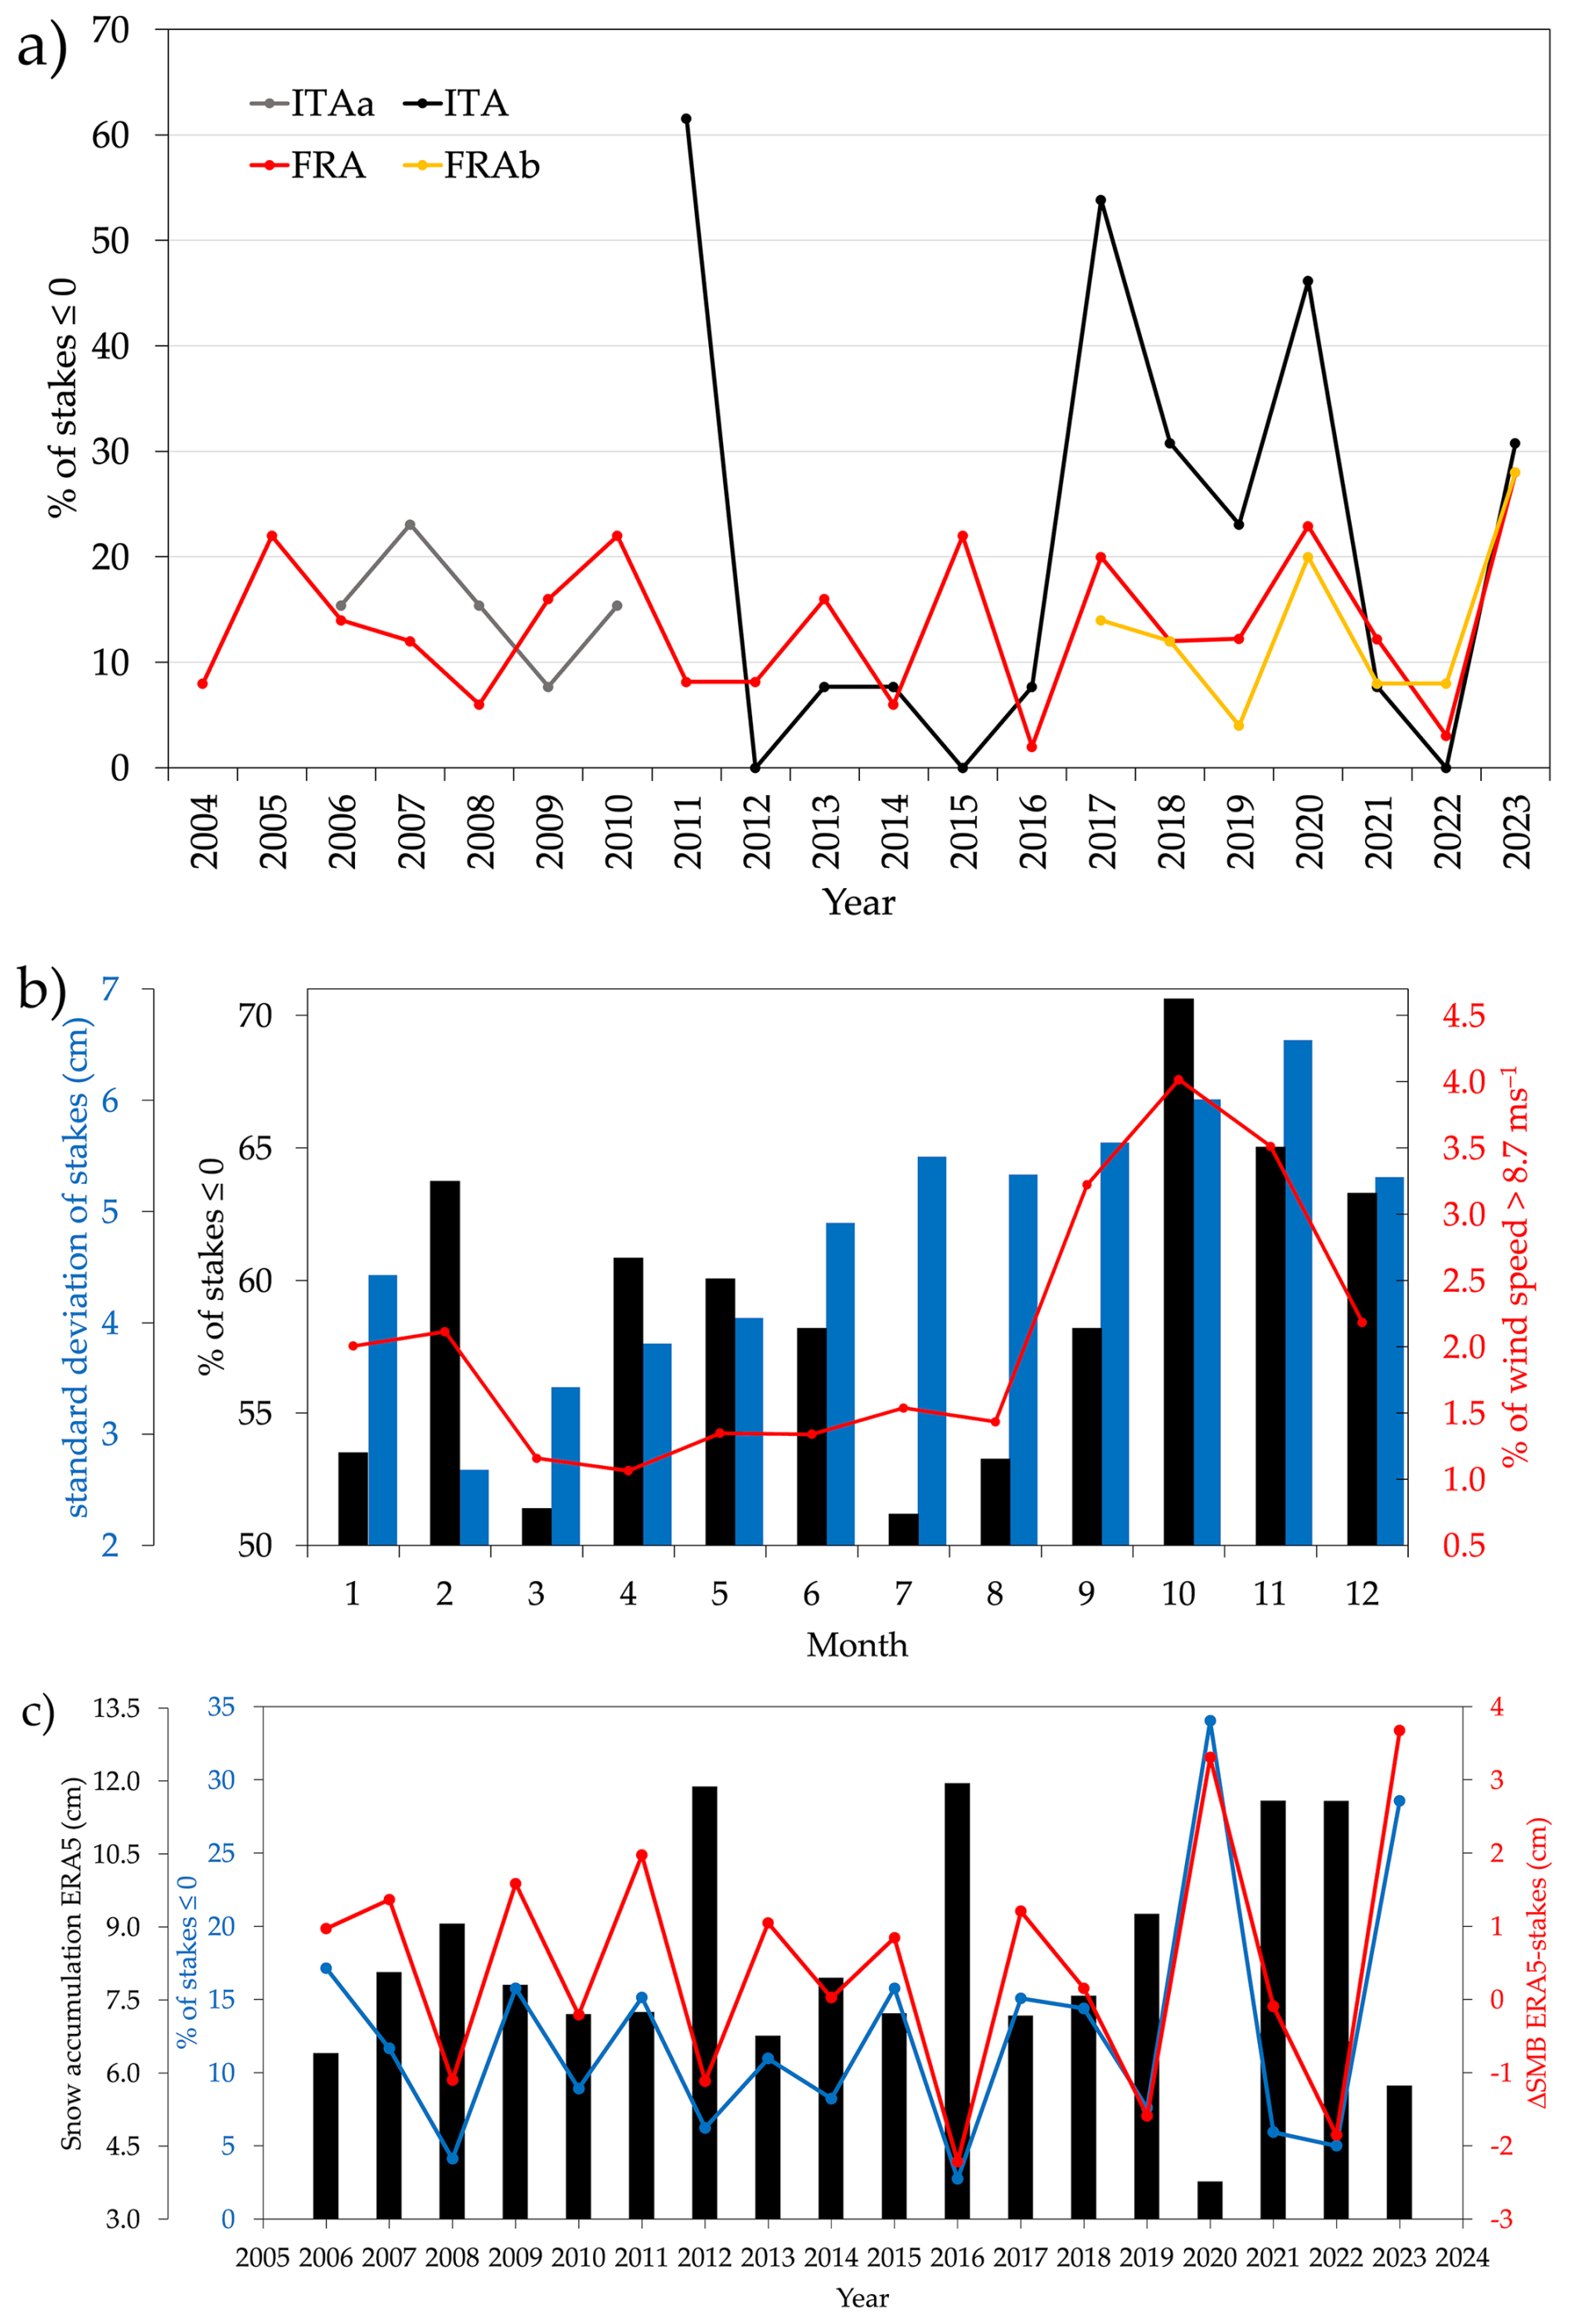
Figure 11(a) Yearly percentage of the number of stakes with negative snow buildup (erosion) near Concordia Station; (b) mean monthly percentage of the number of ITA stakes with negative snow buildup (black bars), mean monthly standard deviation of the accumulation of ITA stakes (blue bars) and fraction of time with wind speed above the 8.7 m s−1 threshold (red line), for which the linear correlation between the annual percentage of stakes observing erosion and the frequency of wind speed values at the AWS above a certain level is maximized (see Fig. 10); (c) yearly percentage of the number of stakes (FRA, FRA-N and FRA-S) with negative SMB (blue line), difference of the yearly snow accumulation as seen by ERA5 and the average of the FRA, FRA-N and FRA-S stake farms (red line), and yearly snow accumulation reconstructed by ERA5 (black bars).
The sublimation caused by solar radiation is present only during the summer season, roughly between mid-November and mid-January; the significance of these correlation coefficients shows that large wind speed values enhance snow erosion/sublimation with export in the atmosphere. In particular, observing Fig. 11b, erosion is mainly present between September and November (70 % SB≤0), when the wind speed is higher and the standard deviations do not reflect the equivalent amount of snow deposition, as the snow is transported across the surface causing more variability in the accumulation. In December and January surface sublimation induced by solar radiation and snow export in the atmosphere also contribute to the negative values at the stakes (Fujii and Kusunoki, 1982; Takahashi et al., 1992).
Finally, the snow density observed between 0 and 10 cm below the surface has seasonal oscillations (Fig. S4 in the Supplement), with nearly 10 % increase from winter to summer. This happens because the compaction near the surface mainly depends on the temperature and it occurs mostly in summer and slows down significantly in the cold part of the year (Stevens et al., 2023; Ekaykin et al., 2023). However, at interannual level if we consider the stakes heights taken in the same season (and if the seasonal perturbations are the same from year to year) the density profile near the surface will be similar and thus this effect is negligible, while the compaction due to the difference in density between the surface and the stake base is important at interannual scale.
Broadening the perspective and considering the whole Dome C (Fig. 11c), the yearly percentage of stakes with negative values (considering the FRA, FRA-N and FRA-S together) is closely related to the difference between the SMB reconstructed by ERA5 and the SB at stakes themselves, as the correlation between these two time series reaches 0.90 (p value<0.01). While ERA5 only considers the snowfall, snow deposition from air humidity and sublimation caused by radiation, this high correlation confirms the importance of the erosion/sublimation and snow export in atmosphere caused by wind also at dome sites.
4.2 Effect of buildings on SMB
In this Section, the possibility that the Station building and the other man-made structures alter the blowing/drifting snow and thus the SMB at the stakes near Concordia is explored. Both the Italian and the French stake farms are located upwind with respect to the main wind direction near the surface, which is South (30 % of the time, then 14 % from SSW and 11 % from SSE). However, the prevailing winds during snowfall events generally blow from the sectors between NNW and ESE, with a peak from NE. At 3000 m above the surface, back trajectories analysis revealed that the air masses which cause the 80 % of snowfall originate from the Southern Ocean in front of the Wilkes Land coasts and then arrive from NW at Dome C (Scarchilli et al., 2011; Genthon et al., 2015). Nonetheless, differences exist when considering the cases in which the SB observed at the Italian and French sites are different from each other. In this analysis, the hourly snowfall data are either from ERA5 (Fig. 12a) or MERRA2 (Fig. 12b) reconstructions, while the wind data are obtained from the Italian AWS of Concordia. Two cases are considered: when the differences between the yearly SB of ITA and FRA are below the 30th or above the 70th percentile thresholds, respectively. The cases in which the differences between ITA and FRA are above the 70th-ile are 2011, 2017, 2018, 2020, while the cases in which the differences are below the 30th-ile are 2012, 2015, 2021, 2022 (indicated as “ITA<FRA” and “ITA>FRA”, respectively, in Fig. 12). Note that some of these years have already emerged from the bootstrap analysis of Sect. 4.1.
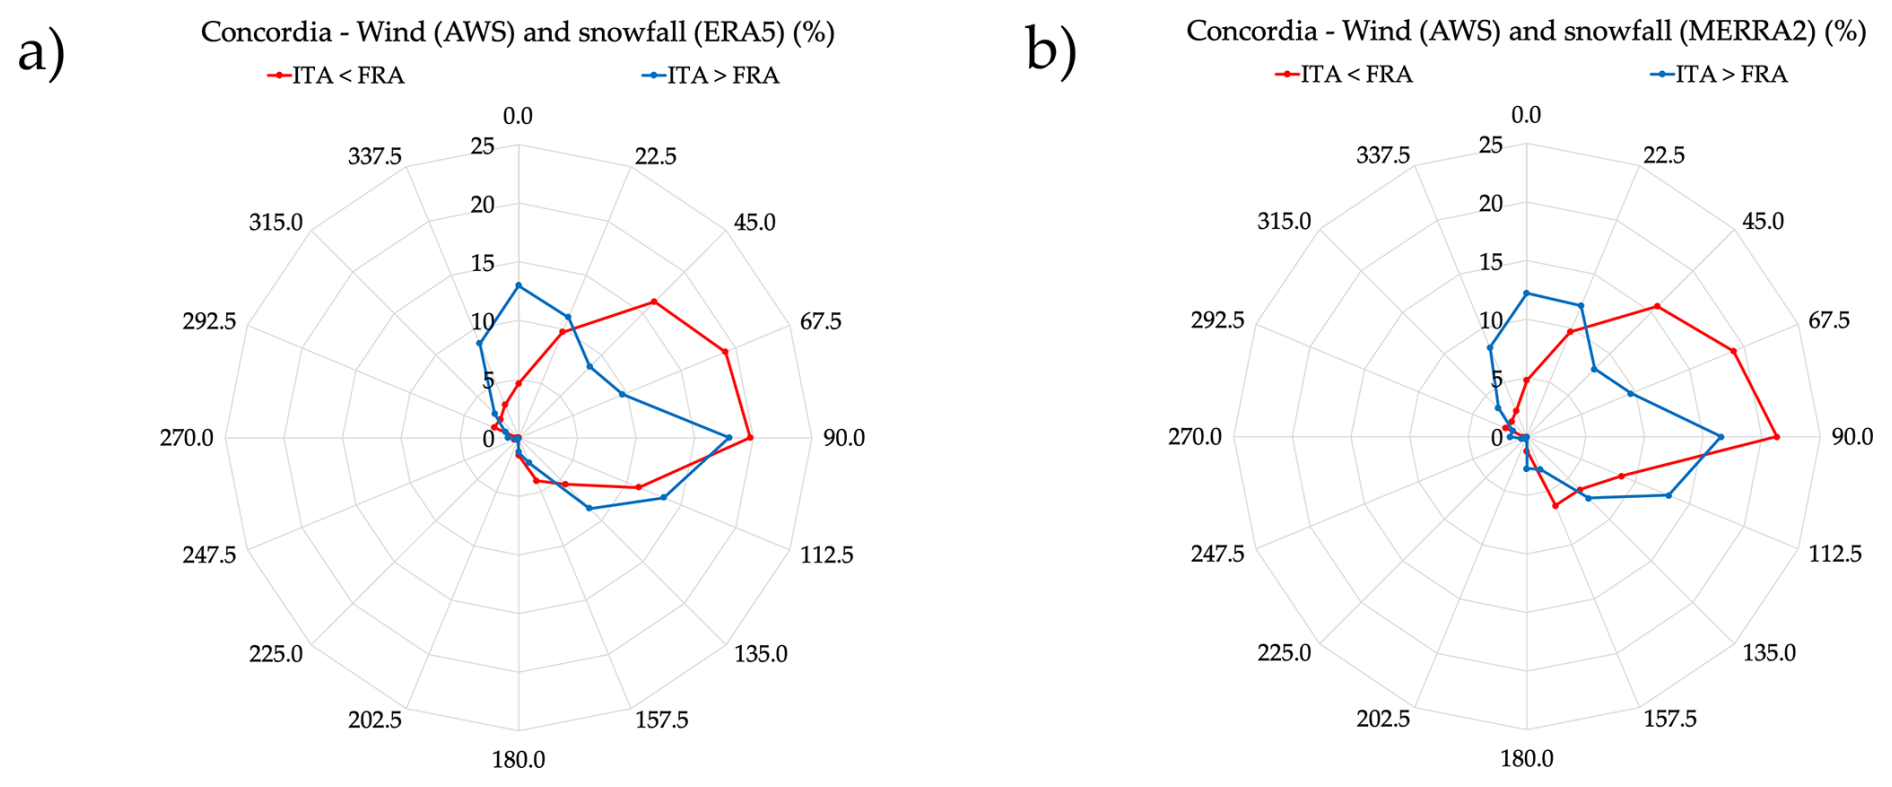
Figure 12Direction of the wind near Concordia Station during snowfall events; the “ITA<FRA” and “ITA>FRA” cases are considered (see the text for the details). Wind data taken from the Italian AWS of Concordia and snowfall from (a) ERA5 and (b) MERRA2.
Table 6P values of the Mann-Whitney-Wilcoxon tests performed to assess the differences between the frequency of wind direction (from AWS Concordia) of the “ITA<FRA” and “ITA>FRA” cases for North, NE, and ENE, when considering the snowfall data of ERA5 or MERRA2. and ∗ denote the cases significant at the 95 % and 90 % thresholds, respectively.
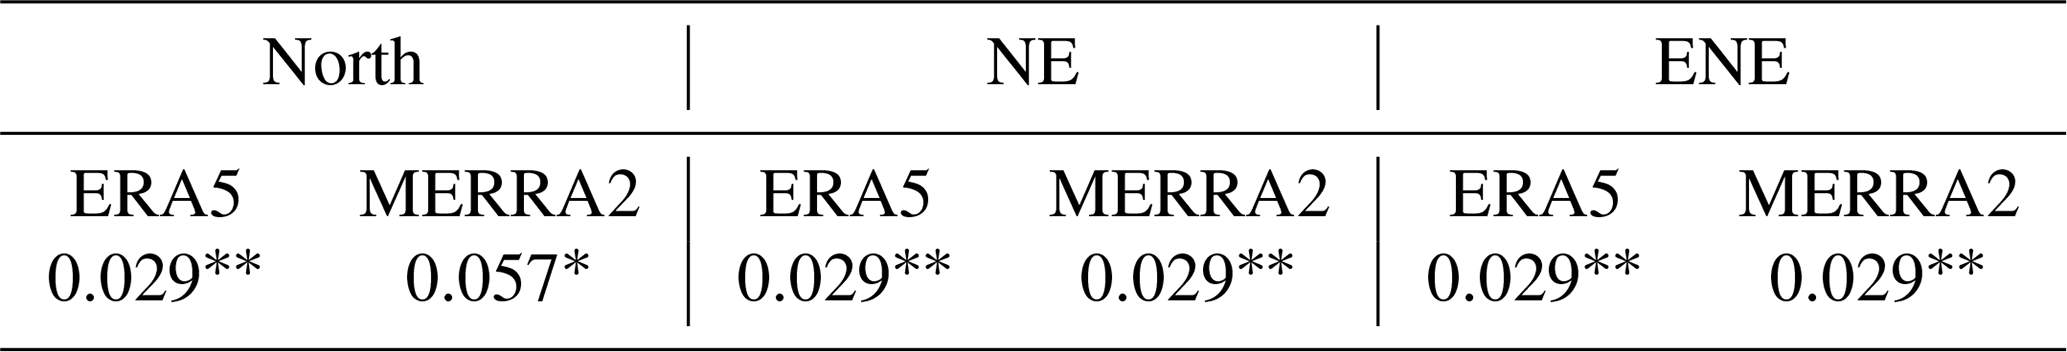
Disregarding the presence of snowfall, the dominant wind direction evaluated from the AWS has a peak from South, as said before. Conversely, when the hourly snowfall is above the 95th-ile and the wind speed is above the 70th-ile (4.1 m s−1), the wind direction is generally from the first quadrant, and differences exist between the cases “ITA<FRA” and “ITA>FRA”. The main dissimilarities concern the North, NE and ENE sector. Mann-Whitney-Wilcoxon tests have been performed to quantitatively assess the differences between the frequency of the wind arriving from those directions in the “ITA<FRA” and “ITA>FRA” cases. Results are reported in Table 6.
These results suggest that the SB recorded by the Italian and French stake farms differs very likely when the wind near Concordia Station blows from certain directions, in particular NE, ENE and possibly North. In particular, when the wind is from North the SB at the French site is lower than usual with respect to the Italian site (average difference of 2.4 cm in the annual SB), suggesting that the Station located 2 km upwind interferes on the wind field. Contrariwise, when the wind is from NE or ENE, the Italian stake farm records lower snow accumulation values average (difference of 4.3 cm in the annual SB), being the Station in this case 800 m upwind with respect to it.
Model tests using real snow particles in cold-climate wind tunnels demonstrate that airflow accelerates beneath buildings elevated above the snow surface, which causes increased surface stress and erosion directly beneath the structure. Snow eroded upwind is deposited downwind of the building, forming concentrated drifts in the wake region. This redistribution results in reduced accumulation immediately near the building and increased snow loads farther leeward (Mitsuhashi et al., 1983; Kwok et al., 1992; Delpech et al., 1998; Yamagishi et al., 2012), with the building elevation, shape, and roof inclination also playing a role (Yamagishi et al., 2012). However, further leeward, a slight scouring zone emerges with less accumulation with respect to the adjacent zones (Moore et al., 1994, Thiis, 2003; Nara et al., 2025), where the ITA stake farm is located. Beyond the turbulent wake, wind resumes its ambient plateau flow regime. Besides, under this hyper-arid conditions, post-depositional processes like wind drift, sublimation, and hoar frost formation often dominate over the initial snowfall in determining the final surface accumulation (Frezzotti et al., 2005). Additionally, a large fraction of the annual accumulation (two thirds) comes from clear-sky precipitation, such as diamond dust and vapor condensation, rather than conventional snowfall events (Stenni et al., 2016).
Furthermore, enhanced snow accumulation zones develop on both side of the buildings, extending also leeward at a great distance from them, more than 10 times the height of the structures, forming a horseshoe shape (Thiis, 2003; Nara et al., 2025). This effect could explain the higher accumulation in the ITA field with respect to the FRA one when snowfall and wind from the North occur: FRA is probably well beyond the turbulent wake leeward the buildings, but ITA is likely affected by increased accumulation due to lateral snowdrifts.
The snow buildup (SB) at the French and Italian stake farms near Concordia Station has been analysed. The observations at the present Italian stake farm are generally lower than the French ones, with some exceptions. A bootstrap analysis revealed that the different size of the stake farms (13 stakes for the Italian and 50 for the French) only partly explain the difference between the measurements. The same bootstrap analysis revealed that the uncertainty on the annual SB of the 13 stake farms is ∼30 %, but it can be lowered to ∼20 % using 30 stakes or ∼15 % with 50 stakes (as the French stake farm).
Combining the snowfall reconstructions from ERA5 and MERRA2, and the wind observations from the Italian AWS Concordia, a possible interaction of man-made structures on blowing/drifting snow during snow precipitation have been found. In fact, when the SB at the Italian stake farm is lower than the French one, the wind, when snowfall occurs, blows mainly from NE or ENE. The opposite when the wind blows mainly from North. Therefore, when snowfall occurs and a stake farm is downwind with respect to the Station, a difference in the SB can be observed.
Considering the French stake farm near Concordia, whose observations are available for the longest period, 2004–2023, a SMB of 27.21 ± 0.60 kg m−2 was estimated. No significant trend was found in this series, whereas a decrease has been found from 2005 to 2020 in the inland area of the Southern Indian Ocean sector of East Antarctica, between Dome A and the coast (Wang et al., 2025). However, compared with accumulation records obtained from firn cores, the accumulation appears to have increased over centennial timescales (Frezzotti et al., 2005; Urbini et al., 2008; Vittuari et al., 2025). Direct observations of the snow density at the base of the stakes are not available to study the snow compaction effect. However, an estimate has been performed by means of simulations, using many realistic profiles of the snow density based on nearby observations collected over the last 10 years. The French stake farms located 25 km North and South of Concordia have also been considered. The South-North SMB gradient across Dome C observed in previous studies is confirmed and estimated to be 8 %–9 %, even though there is interannual variability, and compared to recent model reconstructions. Further studies can be done to assess the SB seasonal distribution by means of the Italian stake farm, which provide observations with monthly resolution and allows the analysis of extreme accumulations events, such as the March 2022 heatwave (Wille et al., 2024; Dreossi et al., 2025). As the Italian stake farm will be submerged over the next couple of years, the recommendation (valid in general, not only for this specific case) is to install new stakes in the same location, to preserve the homogeneity of the time series and being able to collect data monthly even during the polar night. At the same time, it is recommended to increase the number of stakes to at least 30, to increase the representativeness of the stake farm and reduce the noise. Instead, when considering the location for installing a new stake farm, it should be considered not only the dominant wind direction but also the prevailing directions when snowfall occurs. The significant number of stakes with SB value ≤0 is highly correlated to wind speed, confirming the importance of the erosion/sublimation and snow export in atmosphere caused by wind also at dome sites.
French stake farms observations are available at https://glacioclim.osug.fr/Donnees-d-Antarctique-en-cours-de-construction (last access: 15 September 2025); Italian stake farm observations are available at https://doi.org/10.71761/3c796dbd-da9c-4f9f-b699-4af9453b5dfb (DAIS, 2025a; from 2023, older data will be added soon); snow density data are available at https://doi.org/10.71761/5fdbb2ae-6c40-4bd0-a502-7fb9844bd227 (DAIS, 2025b); ERA5 reanalysis data are available at https://doi.org/10.24381/cds.adbb2d47 (Hersbach et al., 2023); MERRA-2 reanalysis data are available at https://doi.org/10.5067/RKPHT8KC1Y1T (Global Modeling and Assimilation Office, 2015), RACMO2.4p1 data are available at https://doi.org/10.5281/zenodo.14217232 (van Dalum et al., 2024); MAR3.12 data are available at ftp://ftp.climato.be//fettweis/MARv3.12 (last access: 15 September 2025); meteorological data from the Italian AWS are available at https://doi.org/10.12910/DATASET2022-002 (Grigioni et al., 2022).
The supplement related to this article is available online at https://doi.org/10.5194/tc-19-5781-2025-supplement.
Conceptualization, CSt, BS, MF; methodology, CSt; validation, CSt, FB, MF; formal analysis, CSt; investigation, CSt; data curation, VF, CSc, VC, GC; writing – original draft preparation, CSt; writing – review and editing, CSt, BS, MM, GD, MF, VF, FB, CSc, VC, GC; supervision, BS. All authors have read and agreed to the published version of the manuscript.
The contact author has declared that none of the authors has any competing interests.
Publisher's note: Copernicus Publications remains neutral with regard to jurisdictional claims made in the text, published maps, institutional affiliations, or any other geographical representation in this paper. While Copernicus Publications makes every effort to include appropriate place names, the final responsibility lies with the authors. Views expressed in the text are those of the authors and do not necessarily reflect the views of the publisher.
Geospatial support for this work provided by the Polar Geospatial Center under NSF-OPP awards 1043681, 1559691, and 2129685. DEMs provided by the Byrd Polar and Climate Research Center and the Polar Geospatial Center under NSF-OPP awards 1043681, 1542736, 1543501, 1559691, 1810976, and 2129685. Meteorological data are achieved by the Italian Antarctic Meteo-Climatological Observatory (IAMCO, https://www.climantartide.it, last access: 15 September 2025) in the framework of the PNRA/IPEV “Routine Meteorological Observation at Station Concordia” project. The French stakes network are part of the GLACIOCLIM-SAMBA observatory, supported by IPEV (Institut Polaire Paul-Emile Victor) and INSU (Institut National des Sciences de l'Univers).
This research has been supported by the Italian National Antarctic Research Program (PNRA) funded by Italian MUR (grant no. PNRA18_00031 “WHETSTONE” and PNRA0000072 – “AIR-FLOC”).
This paper was edited by Lei Geng and reviewed by T. Kameda and two anonymous referees.
Agosta, C., Favier, V., Genthon C., Gallée, H., Krinner, G., Lenaerts, J., and Van den Broeke, M. R.: A 40-year accumulation dataset for Adelie Land, Antarctica and its application for model validation, Clim. Dynam., 38, 75–86, https://doi.org/10.1007/s00382-011-1103-4, 2012.
Agosta, C., Amory, C., Kittel, C., Orsi, A., Favier, V., Gallée, H., van den Broeke, M. R., Lenaerts, J. T. M., van Wessem, J. M., van de Berg, W. J., and Fettweis, X.: Estimation of the Antarctic surface mass balance using the regional climate model MAR (1979–2015) and identification of dominant processes, The Cryosphere, 13, 281–296, https://doi.org/10.5194/tc-13-281-2019, 2019.
Anderson, T. W. and Darling, D. A.: Asymptotic theory of certain “goodness-of-fit” criteria based on stochastic processes, Ann. of Math. Stat., 23, 193–212, https://doi.org/10.1214/aoms/1177729437, 1952.
Bohren, C. F. and Barkstrom, B. R.: Theory of the optical properties of snow, J. Geophys. Res., 79, 4527–4535, https://doi.org/10.1029/JC079i030p04527, 1974.
Ca' Foscari University of Venice (DAIS): Stakes height at Concordia Station (Antarctica), CNR Antarctic Data Center [data set], https://doi.org/10.71761/3c796dbd-da9c-4f9f-b699-4af9453b5dfb, 2025a.
Ca' Foscari University of Venice (DAIS), Snow density, temperature, and hardness at Concordia Station, Antarctica, CNR Antarctic Data Center [data set], https://doi.org/10.71761/5fdbb2ae-6c40-4bd0-a502-7fb9844bd227 2025b.
Cavitte, M. G. P., Parrenin, F., Ritz, C., Young, D. A., Van Liefferinge, B., Blankenship, D. D., Frezzotti, M., and Roberts, J. L.: Accumulation patterns around Dome C, East Antarctica, in the last 73 kyr, The Cryosphere, 12, 1401–1414, https://doi.org/10.5194/tc-12-1401-2018, 2018.
Cordero, R. R., Sepúlveda, E., Feron, S., Damiani, A., Fernandoy, F., Neshyba, S., Rowe, P. M., Asencio, V., Carrasco, J., Alfonso J. A., Llanillo, P., Wachter, P., Seckmeyer, G., Stepanova, M., Carrera, J. M., Jorquera, J., Wang, C., Malhotra, A., Dana, J., Khan, A. L., and Casassa, G.: Black carbon footprint of human presence in Antarctica, Nature Communications, 13, 984, https://doi.org/10.1038/s41467-022-28560-w, 2022.
Delpech, P., Palier, P., and Gandemer, J.: Snowdrifting simulation around Antarctic buildings, Journal of Wind Engineering and Industrial Aerodynamics, 74–76, 567–576, https://doi.org/10.1016/S0167-6105(98)00051-8, 1998.
Ding, M., Xiao, C., Yang, Y., Wang, Y., Li, C., Yuan, N., Shi, G., Sun, W., and Ming, J.: Re-assessment of recent (2008–2013) surface mass balance over Dome Argus, Antarctica, Polar Research, 35, 26133, https://doi.org/10.3402/polar.v35.26133, 2016.
Dreossi, G., Masiol, M., Zannoni, D., Stefanini, C., Scarchilli, C., Ciardini, V., Grigioni, P., Del Guasta, M., Landais, A., Casado, M., Ollivier, I., Terzer-Wassmuth, S., Copia, L., and Stenni, B.: March 2022 warm event detected in precipitation and surface snow at Concordia Station in East Antarctica, EGU General Assembly 2025, Vienna, Austria, 27 Apr–2 May 2025, EGU25-19112, https://doi.org/10.5194/egusphere-egu25-19112, 2025.
Eisen, O., Frezzotti, M., Genthon, C., Isaksson, E., Magand, O., van den Broeke, M. R., Dixon, D. A., Ekaykin, A., Holmlund, P., Kameda, T., Karlöf, L., Kaspari, S., Lipenkov, V. Y., Oerter, H., Takahashi, S., and Vaughan, D. G.: Ground-based measurements of spatial and temporal variability of snow accumulation in East Antarctica, Reviews of Geophysics, 46, https://doi.org/10.1029/2006RG000218, 2008.
Ekaykin, A. A., Teben'kova, N. A., Lipenkov, V. Y., Tchikhatchev, K. B., Veres, A. N., and Richter, A.: Underestimation of Snow Accumulation Rate in Central Antarctica (Vostok Station) Derived from Stake Measurements, Russian Meteorology and Hydrology, 45, 132–140, https://doi.org/10.3103/S1068373920020090, 2020.
Ekaykin, A. A., Lipenkov, V. Y., and Tebenkova, N. A.: Fifty years of instrumental surface mass balance observations at Vostok Station, central Antarctica, Journal of Glaciology, 1–13, https://doi.org/10.1017/jog.2023.53, 2023.
Ekaykin, A. A., Veres, A. N., and Wang, Y.: Recent increase in the surface mass balance in central East Antarctica is unprecedented for the last 2000 years, Communications Earth and Environment, 5, https://doi.org/10.1038/s43247-024-01355-1, 2024.
Favier, V., Agosta, C., Parouty, S., Durand, G., Delaygue, G., Gallée, H., Drouet, A.-S., Trouvilliez, A., and Krinner, G.: An updated and quality controlled surface mass balance dataset for Antarctica, The Cryosphere, 7, 583–597, https://doi.org/10.5194/tc-7-583-2013, 2013.
France, J. L., King, M. D., Frey, M. M., Erbland, J., Picard, G., Preunkert, S., MacArthur, A., and Savarino, J.: Snow optical properties at Dome C (Concordia), Antarctica; implications for snow emissions and snow chemistry of reactive nitrogen, Atmos. Chem. Phys., 11, 9787–9801, https://doi.org/10.5194/acp-11-9787-2011, 2011.
Fretwell, P., Pritchard, H. D., Vaughan, D. G., Bamber, J. L., Barrand, N. E., Bell, R., Bianchi, C., Bingham, R. G., Blankenship, D. D., Casassa, G., Catania, G., Callens, D., Conway, H., Cook, A. J., Corr, H. F. J., Damaske, D., Damm, V., Ferraccioli, F., Forsberg, R., Fujita, S., Gim, Y., Gogineni, P., Griggs, J. A., Hindmarsh, R. C. A., Holmlund, P., Holt, J. W., Jacobel, R. W., Jenkins, A., Jokat, W., Jordan, T., King, E. C., Kohler, J., Krabill, W., Riger-Kusk, M., Langley, K. A., Leitchenkov, G., Leuschen, C., Luyendyk, B. P., Matsuoka, K., Mouginot, J., Nitsche, F. O., Nogi, Y., Nost, O. A., Popov, S. V., Rignot, E., Rippin, D. M., Rivera, A., Roberts, J., Ross, N., Siegert, M. J., Smith, A. M., Steinhage, D., Studinger, M., Sun, B., Tinto, B. K., Welch, B. C., Wilson, D., Young, D. A., Xiangbin, C., and Zirizzotti, A.: Bedmap2: improved ice bed, surface and thickness datasets for Antarctica, The Cryosphere, 7, 375–393, https://doi.org/10.5194/tc-7-375-2013, 2013.
Frezzotti, M., Pourchet, M., Flora, O., Gandolfi, S., Gay, M., Urbini, S., Vincent, C., Becagli, S., Gragnani, R., Proposito, M., Severi, M., Traversi, R., Udisti, R., and Fily, M.: Spatial and temporal variability of snow accumulation in East Antarctica from traverse data, Journal of Glaciology, 51, 113–124, https://doi.org/10.3189/172756505781829502, 2005.
Frezzotti, M., Urbini, S., Proposito, M., Scarchilli, C., and Gandolfi, S.: Spatial and temporal variability of surface mass balance near Talos Dome, East Antarctica, Journal of Geophysical Research: Earth Surface, 112, https://doi.org/10.1029/2006JF000638, 2007.
Fujii, Y. and Kusunoki, K.: The role of sublimation and condensation in the formation of ice sheet surface at Mizuho Station, Antarctica, J. Geophys. Res., 87, 4293–4300, https://doi.org/10.1029/JC087iC06p04293, 1982.
Fujita, S., Holmlund, P., Andersson, I., Brown, I., Enomoto, H., Fujii, Y., Fujita, K., Fukui, K., Furukawa, T., Hansson, M., Hara, K., Hoshina, Y., Igarashi, M., Iizuka, Y., Imura, S., Ingvander, S., Karlin, T., Motoyama, H., Nakazawa, F., Oerter, H., Sjöberg, L. E., Sugiyama, S., Surdyk, S., Ström, J., Uemura, R., and Wilhelms, F.: Spatial and temporal variability of snow accumulation rate on the East Antarctic ice divide between Dome Fuji and EPICA DML, The Cryosphere, 5, 1057–1081, https://doi.org/10.5194/tc-5-1057-2011, 2011.
Gelaro, R., McCarty, W., Suárez, M. J., Todling, R., Molod, A., Takacs, L., Randles, C. A., Darmenov, A., Bosilovich, M. G., Reichle, R., Wargan, K., Coy, L., Cullather, R., Draper, C., Akella, S., Buchard, V., Conaty, A., da Silva, A. M., Gu, W., Kim, G.-K., Koster, R., Lucchesi, R., Merkova, D., Nielsen, J. E., Partyka, G., Pawson, S., Putman, W., Rienecker, M., Schubert, S. D., Sienkiewicz, M., and Zhao, B.: The Modern-Era Retrospective Analysis for Research and Applications, Version 2 (MERRA-2), Journal of Climate, 30, 5419–5454, https://doi.org/10.1175/JCLI-D-16-0758.1, 2017.
Genthon, C., Six, D., Scarchilli, C., Ciardini, V., and Frezzotti, M.: Meteorological and snow accumulation gradients across Dome C, East Antarctic plateau: meteorological and snow accumulation gradients at Dome C, International Journal of Climatology, 36, 455–466, https://doi.org/10.1002/joc.4362, 2015.
Global Modeling and Assimilation Office (GMAO): MERRA-2 tavg1_2d_lnd_Nx: 2d,1-Hourly,Time-Averaged,Single-Level,Assimilation,Land Surface Diagnostics V5.12.4, Greenbelt, MD, USA, Goddard Earth Sciences Data and Information Services Center (GES DISC) [data set], https://doi.org/10.5067/RKPHT8KC1Y1T, 2015.
Grigioni, P., Camporeale, G., Ciardini, V., De Silvestri, L., Iaccarino, A., Proposito, M., and Scarchilli, C.: Dati meteorologici della Stazione meteorologica CONCORDIA presso la Base CONCORDIA STATION (DomeC), ENEA [data set], https://doi.org/10.12910/DATASET2022-002, 2022.
Helmig, D., Liptzin, D., Hueber, J., and Savarino, J.: Impact of exhaust emissions on chemical snowpack composition at Concordia Station, Antarctica, The Cryosphere, 14, 199–209, https://doi.org/10.5194/tc-14-199-2020, 2020.
Hersbach, H., Bell, B., Berrisford, P., Biavati, G., Horányi, A., Muñoz Sabater, J., Nicolas, J., Peubey, C., Radu, R., Rozum, I., Schepers, D., Simmons, A., Soci, C., Dee, D., and Thépaut, J.-N.: ERA5 hourly data on single levels from 1940 to present, Copernicus Climate Change Service (C3S) Climate Data Store (CDS) [data set], https://doi.org/10.24381/cds.adbb2d47, 2023.
Howat, I., Porter, C., Noh, M.-J., Husby, E., Khuvis, S., Danish, E., Tomko, K., Gardiner, J., Negrete, A., Yadav, B., Klassen, J., Kelleher, C., Cloutier, M., Bakker, J., Enos, J., Arnold, G., Bauer, G., and Morin, P.: The Reference Elevation Model of Antarctica – Mosaics, Version 2, The Reference Elevation Model of Antarctica, https://doi.org/10.7910/DVN/EBW8UC, 2022.
Kameda, T., Azuma, N., Furukawa, T., Ageta, Y., and Takahashi, S.: Surface mass balance, sublimation and snow temperatures at Dome Fuji Station, Antarctica, in 1995, Proc. NIPR Symp. Polar Meteorol. Glaciol., 11, https://doi.org/10.15094/00003967, 1997.
Kameda, T., Motoyama, H., Fujita, S., and Takahashi, S.: Temporal and spatial variability of surface mass balance at Dome Fuji, East Antarctica, by the stake method from 1995 to 2006, Journal of Glaciology, 54, 107–116, https://doi.org/10.3189/002214308784409062, 2008.
Kwok, K. C. S., Kim, D. H., Smedley, D. J., and Rohde, H. F.: Snowdrift around buildings for antarctic environment, Journal of Wind Engineering and Industrial Aerodynamics, 44, 2797–2808, https://doi.org/10.1016/0167-6105(92)90073-J, 1992.
Lazzara, M. A., Keller, L. M., Markle, T., and Gallagher, J.: Fifty-year Amundsen–Scott South Pole station surface climatology, Atmospheric Research, 118, 240–259, https://doi.org/10.1016/j.atmosres.2012.06.027, 2012.
Leduc-Leballeur, M., Picard, G., Mialon, A., Arnaud, L., Lefebvre, E., Possenti, P., and Kerr, Y.: Modeling L-Band Brightness Temperature at Dome C in Antarctica and Comparison With SMOS Observations, IEEE Transactions on Geoscience and Remote Sensing, 53, 4022–4032, https://doi.org/10.1109/tgrs.2015.2388790, 2015.
Mitsuhashi, H., Hannuki, T., Sato, T., and Kusunoki, K.: Snow Control Studies of Elevated Buildings in the Antarctic, Ann. of Glac., 4, 188–191, https://doi.org/10.3189/S0260305500005450, 1983.
Moore, I., Mobbs, S. D., Ingham, D. B., and King, J. C.: A numerical model of blowing snow around an Antarctic building, Annals of Glaciology, 20, 341–346, https://doi.org/10.3189/1994AoG20-1-341-346, 1994.
Nara, R., Groth, C., and Biancolini, M. E.: Numerical Simulation of Snowdrift Development in Non-Equilibrium Flow Fields Around Buildings, Fluids, 10, 75, https://doi.org/10.3390/fluids10040075, 2025.
Ning, W., Wang, Y., Zhang, W., and Zhou, M.: What recent global atmospheric reanalyses and regional climate models can represent observed snow accumulation on Antarctica?, Atmospheric Research, 300, 107260, https://doi.org/10.1016/j.atmosres.2024.107260, 2024.
Noël, B., van Wessem, J. M., Wouters, B., Trusel, L., Lhermitte, S., and van den Broeke, M. R.: Higher Antarctic ice sheet accumulation and surface melt rates revealed at 2 km resolution, Nature Communications, 14, 7949, https://doi.org/10.1038/s41467-023-43584-6, 2023.
Oyabu, I., Kawamura, K., Fujita, S., Inoue, R., Motoyama, H., Fukui, K., Hirabayashi, M., Hoshina, Y., Kurita, N., Nakazawa, F., Ohno, H., Sugiura, K., Suzuki, T., Tsutaki, S., Abe-Ouchi, A., Niwano, M., Parrenin, F., Saito, F., and Yoshimori, M.: Temporal variations of surface mass balance over the last 5000 years around Dome Fuji, Dronning Maud Land, East Antarctica, Clim. Past, 19, 293–321, https://doi.org/10.5194/cp-19-293-2023, 2023.
Reijmer, C. H. and van den Broeke, M. R.: Temporal and spatial variability of the surface mass balance in Dronning Maud Land, Antarctica, as derived from automatic weather stations, Journal of Glaciology, 49, 512–520, https://doi.org/10.3189/172756503781830494, 2003.
Richter, A., Ekaykin, A. A., Willen, M. O., Lipenkov, V. Y., Groh, A., Popov, S. V., Scheinert, M., Horwath, M., and Dietrich, R.: Surface Mass Balance Models Vs. Stake Observations: A Comparison in the Lake Vostok Region, Central East Antarctica, Frontiers in Earth Science, 9, https://doi.org/10.3389/feart.2021.669977, 2021.
Satow, K., Watanabe, O., Shoji, H., and Motoyama, H.: The relationship among accumulation rate, stable isotope ratio and surface temperature on the Plateau of East Dronning Maud Land, Antarctica, Polar meteorology and glaciology, 13, 43–52, https://doi.org/10.15094/00002888, 1999.
Scarchilli, C., Frezzotti, M., and Ruti, P. M.: Snow precipitation at four ice core sites in East Antarctica: provenance, seasonality and blocking factors, Climate Dynamics, 37, 2107–2125, https://doi.org/10.1007/s00382-010-0946-4, 2011.
Servettaz, A. P. M., Agosta, C., Kittel, C., and Orsi, A. J.: Control of the temperature signal in Antarctic proxies by snowfall dynamics, The Cryosphere, 17, 5373–5389, https://doi.org/10.5194/tc-17-5373-2023, 2023.
Snedecor, G. W. and Cochran, W. G.: Statistical Methods, 8th ed., Iowa State University Press, Ames, IA, 237–253, ISBN 978-0-8138-1561-9, 1989.
Stenni, B., Scarchilli, C., Masson-Delmotte, V., Schlosser, E., Ciardini, V., Dreossi, G., Grigioni, P., Bonazza, M., Cagnati, A., Karlicek, D., Risi, C., Udisti, R., and Valt, M.: Three-year monitoring of stable isotopes of precipitation at Concordia Station, East Antarctica, The Cryosphere, 10, 2415–2428, https://doi.org/10.5194/tc-10-2415-2016, 2016.
Stevens, C. M., Lilien, D. A., Conway, H., Fudge, T. J., Koutnik, M. R., and Waddington, E. D.: A new model of dry firn-densification constrained by continuous strain measurements near South Pole, Journal of Glaciology, 69, 2099–2113, https://doi.org/10.1017/jog.2023.87, 2023.
Takahashi, S. and Kameda, T.: Snow density for measuring surface mass balance using the stake method, Journal of Glaciology, 53, 677–680, https://doi.org/10.3189/002214307784409360, 2007.
Takahashi, S., Endoh, T., Azuma, N., and Meshida, S.: Bare ice fields developed in the inland part of the Antarctica, Proc. NIPR Symp. Polar Meteorology and Glaciology, 5, 128–139, https://doi.org/10.15094/00003706, 1992.
Takahashi, S., Ageta, Y., Fujii, Y., and Watanabe, O.: Surface mass balance in east Dronning Maud Land, Antarctica, observed by Japanese Antarctic Research Expeditions, Annals of Glaciology, 20, 242–248, https://doi.org/10.3189/1994AoG20-1-242-248, 1994.
Thiis, T. K.: Large scale studies of development of snowdrifts around buildings, Journal of Wind Engineering and Industrial Aerodynamics, 91, 829–839, https://doi.org/10.1016/S0167-6105(02)00474-9, 2003.
Thomas, E. R., van Wessem, J. M., Roberts, J., Isaksson, E., Schlosser, E., Fudge, T. J., Vallelonga, P., Medley, B., Lenaerts, J., Bertler, N., van den Broeke, M. R., Dixon, D. A., Frezzotti, M., Stenni, B., Curran, M., and Ekaykin, A. A.: Regional Antarctic snow accumulation over the past 1000 years, Clim. Past, 13, 1491–1513, https://doi.org/10.5194/cp-13-1491-2017, 2017.
Urbini, S., Frezzotti, M., Gandolfi, S., Vincent, C., Scarchilli, C., Vittuari, L., and Fily, M.: Historical behaviour of Dome C and Talos Dome (East Antarctica) as investigated by snow accumulation and ice velocity measurements, Global and Planetary Change, 60, 576–588, https://doi.org/10.1016/j.gloplacha.2007.08.002, 2008.
van Dalum, C., van de Berg, W. J., and van den Broeke, M.: Monthly RACMO2.4p1 data for Antarctica (11 km) for SMB, SEB and near-surface variables (1979–2023), Zenodo [data set], https://doi.org/10.5281/zenodo.14217232, 2024.
Vandecrux, B., Amory, C., Ahlstrøm, A. P., Akers, P. D., Albert, M., Alley, R. B., Alves de Castro, M., Arnaud, L., Baker, I., Bales, R., Benson, C., Box, J. E., Brucker, L., Buizert, C., Chandler, D., Charalampidis, C., Cherblanc, C., Clerx, N., Colgan, W., Covi, F., Dattler, M., Denis, G., Derksen, C., Dibb, J. E., Ding, M., Dixon, D., Eisen, O., Fahrner, D., Fausto, R., Favier, V., Fernandoy, F., Freitag, J., Gerland, S., Harper, J., Hawley, R. L., Heuer, J., Hock, R., Hou, S., How, P., Humphrey, N., Hubbard, B., Iizuka, Y., Isaksson, E., Kameda, T., Karlsson, N. B., Kawakami, K., Kjær, H. A., Kreutz, K., Kuipers Munneke, P., Lazzara, M., Lemeur, E., Lenaerts, J. T. M., Lewis, G., Lindau, F. G. L., Lindsey-Clark, J., MacFerrin, M., Machguth, H., Magand, O., Mankoff, K. D., Marquetto, L., Martinerie, P., McConnell, J. R., Medley, B., Miège, C., Miles, K. E., Miller, O., Miller, H., Montgomery, L., Morris, E., Mosley-Thompson, E., Mulvaney, R., Niwano, M., Oerter, H., Osterberg, E., Otosaka, I., Picard, G., Polashenski, C., Reijmer, C., Rennermalm, Å., Rutishauser, A., Scanlan, K., Simoes, J. C., Simonsen, S. B., Smeets, P. C. J. P., Smith, A., Solgaard, A., Spencer, M., Steen-Larsen, H. C., Stevens, C. M., Sugiyama, S., Svensson, J., Tedesco, M., Thomas, E., Thompson-Munson, M., Tsutaki, S., van As, D., Van den Broeke, M. R., van Tiggelen, M., Wang, Y., Wilhelms, F., Winstrup, M., Xiao, J., and Xiao, C.: The SUMup collaborative database: Surface mass balance, subsurface temperature and density measurements from the Greenland and Antarctic ice sheets (2024 release), Arctic Data Center [data set], https://doi.org/10.18739/A2M61BR5M, 2024.
van Wessem, J. M., van de Berg, W. J., Noël, B. P. Y., van Meijgaard, E., Amory, C., Birnbaum, G., Jakobs, C. L., Krüger, K., Lenaerts, J. T. M., Lhermitte, S., Ligtenberg, S. R. M., Medley, B., Reijmer, C. H., van Tricht, K., Trusel, L. D., van Ulft, L. H., Wouters, B., Wuite, J., and van den Broeke, M. R.: Modelling the climate and surface mass balance of polar ice sheets using RACMO2 – Part 2: Antarctica (1979–2016), The Cryosphere, 12, 1479–1498, https://doi.org/10.5194/tc-12-1479-2018, 2018.
Vittuari L., Zanutta A., Gandolfi S., Martelli, L., Ritz, C., Urbini, S., and Frezzotti, M.: Decadal migration of Dome C inferred by global navigation satellite system measurements, Journal of Glaciology, 71, e117, https://doi.org/10.1017/jog.2025.28, 2025.
Wang, D., Ma, H., Li, X., Hu, Y., Hu, Z., An, C., Ding, M., Li, C., Jiang, S., Li, Y., Lu, S., Sun, B., Zeng, G., van den Broeke, M., and Shi, G.: Sustained decrease in inland East Antarctic surface mass balance between 2005 and 2020, Nature Geoscience, 18, 462–470, https://doi.org/10.1038/s41561-025-01699-z, 2025.
Wang, Y., Ding, M., Reijmer, C. H., Smeets, P. C. J. P., Hou, S., and Xiao, C.: The AntSMB dataset: a comprehensive compilation of surface mass balance field observations over the Antarctic Ice Sheet, Earth Syst. Sci. Data, 13, 3057–3074, https://doi.org/10.5194/essd-13-3057-2021, 2021.
Wang, Y., Zhang, X., Ning, W., Lazzara, M. A., Ding, M., Reijmer, C. H., Smeets, P. C. J. P., Grigioni, P., Heil, P., Thomas, E. R., Mikolajczyk, D., Welhouse, L. J., Keller, L. M., Zhai, Z., Sun, Y., and Hou, S.: The AntAWS dataset: a compilation of Antarctic automatic weather station observations, Earth Syst. Sci. Data, 15, 411–429, https://doi.org/10.5194/essd-15-411-2023, 2023.
Warren, S. G., Brandt, R. E., and Grenfell, T. C.: Visible and near-ultraviolet absorption spectrum of ice from transmission of solar radiation into snow, Appl. Optics, 45, 5320–5334, https://doi.org/10.1364/ao.45.005320, 2006.
Wille, J. D., Alexander, S. P., Amory, C., Baiman, R., Barthélemy, L., Bergstrom, D. M., Berne, A., Binder, H., Blanchet, J., Bozkurt, D., Bracegirdle, T. J., Casado, M., Choi, T., Clem, K. R., Codron, F., Datta, R., Battista, S. D., Favier, V., Francis, D., Fraser, A. D., Fourré, E., Garreaud, R. D., Genthon, C., Gorodetskaya, I. V., González-Herrero, S., Heinrich, V. J., Hubert, G., Joos, H., Kim, S. J., King, J. C., Kittel, C., Landais, A., Lazzara, M., Leonard, G. H., Lieser, J. L., Maclennan, M., Mikolajczyk, D., Neff, P., Ollivier, I., Picard, G., Pohl, B., Ralph, F. M., Rowe, P., Schlosser, E., Shields, C. A., Smith, I. J., Sprenger, M., Trusel, L., Udy, D., Vance, T., Vignon, E., Walker, C., Wever, N., and Zou, X.: The extraordinary march 2022 east antarctica “heat” wave. part ii: Impacts on the antarctic ice sheet, Journal of Climate, 37, 779–799, https://doi.org/10.1175/JCLI-D-23-0176.1, 2024.
Yamagishi, Y., Kimura, S., Ishizawa, K., Kikuchi, M., Morikawa, H., and Kojima, T.: Visualization of snowdrift around buildings of an Antarctic base through numerical simulation, J. Vis., 15, 77–84, https://doi.org/10.1007/s12650-011-0105-y, 2012.