the Creative Commons Attribution 4.0 License.
the Creative Commons Attribution 4.0 License.
 | 14 Oct 2025
Brief communication: Reanalyses underperform in cold regions, raising concerns for climate services and research
Stephan Gruber
Many changes in cold regions are amplified by nonlinear processes involving ice and have important consequences locally and globally. We show that the average ensemble spread of the mean annual air temperature (1.5 °C) in the reanalyses is 90 % greater in cold regions compared to the other regions and shows pronounced disagreement in the trend. The ensemble spread in the mean annual maximum snow water equivalent is found to be greater than the ensemble mean. The reduced quality of reanalyses in cold regions, coinciding with sparse in situ observations and low population, points to challenges in how we represent cold-region phenomena in simulation systems and limits our ability to support climate research and services.
- Article
(1791 KB) - Full-text XML
-
Supplement
(2136 KB) - BibTeX
- EndNote


Cold regions are experiencing the planet's strongest warming (IPCC, 2023). This has local consequences for ecosystems and people, as well as global consequences by affecting weather patterns elsewhere through teleconnections (Overland et al., 2016; Cohen et al., 2021) and through feedbacks and potential tipping elements (Richardson et al., 2023) affecting climate. Despite their sparse population and remoteness, cold regions disproportionately affect climate change and its consequences everywhere (Abram et al., 2019).
Understanding cold regions is important for informing local climate change adaptation and climate action globally. However, the climate conditions and dynamics can be subject to disagreement. For example, previous studies have suggested that the climate signal in cold regions could be different depending on the datasets used (Huang et al., 2017; Wang et al., 2017) and concluded that the “warming hiatus” in the Arctic may be an artifact. This is because many cold-region processes react nonlinearly to changes near 0 °C due to the ice–water phase transition. Their analysis and simulation are extra sensitive to errors. In addition to these challenges, sparse in situ observations increase the need for and importance of atmospheric reanalyses as a tool for supporting climate research and services. While a few studies report the performance of reanalyses for specific variables and places (e.g., Graham et al., 2019; Cao et al., 2020; Fang et al., 2023; Lan et al., 2025), their quality in cold regions is also less well known than elsewhere.
This study uses a simple and intuitive analysis to illustrate and contextualize a critical gap in knowledge and capabilities for representing and analyzing the Earth system. We quantify the relative quality of five state-of-the-art reanalyses in cold regions to inform the application of reanalysis products and to motivate further improvements specific to cold environments. We use the average ensemble spread (e.g., Fortin et al., 2014) as an observation-independent measure of relative quality. We focus on the mean annual air temperature (MAAT) and maximum snow water equivalent (maxSWE) because of their dominant control over cold environments and their intuitive interpretation.
2.1 Reanalyses
Five state-of-the-art reanalyses – JRA-3Q, ERA5, MERRA-2, JRA-55, and NCEP2 – are investigated (Table S1 in the Supplement). The 10-member ensemble of ERA5, which quantifies uncertainties in the ERA5 assimilation and modeling system, was also included here for comparison. The ERA5 ensemble provides an opportunity to show how parameter uncertainty in one reanalysis system compares with the spread between structurally different reanalyses. While JRA-3Q, ERA5, and JRA-55 are produced using the most advanced four-dimensional variational (4DVar) assimilation, NCEP2 and MERRA-2 use the three-dimensional variational method (3DVar). As better performance is expected from the newer 4DVar reanalyses, we also analyzed them separately. The three most recent decades, 1991–2020, which had improved satellite observation and data assimilation (Hersbach et al., 2019), were used.
The in situ observations and population information are from Copernicus Climate Change Service (C3S) Climate Data Store (CDS) (2021) and Center for International Earth Science Information Network-CIESIN-Columbia University (2018), respectively, representing conditions in 2020. Population information is not available for Antarctica, and no population is assumed for these regions.
2.2 Near-surface air temperature downscaling
The ERA5 grid has the highest spatial resolution (0.25°) and was used as the common grid for this analysis. We conducted a 3D downscaling on the other reanalyses to produce the surface air temperature at ground elevation with a consistent spatial resolution by adopting the algorithms presented by Cao et al. (2017, 2019). Surface and upper-air (pressure level) temperatures are first regridded to the ERA5 grid with 2D linear interpolation. Then, the 2D interpolated surface air temperature was refined by adding the lapse rate derived from a linear extrapolation of the lowest two pressure levels above the ground. If an inversion was present, a zero lapse rate was used. The downscaling algorithm significantly removes the influences of inconsistent resolution and improves the data comparability (Fig. S1 in the Supplement).
2.3 Snow water equivalent
The snow water equivalent (SWE) is derived by multiplying snow density and snow depth where it is not available as a variable directly. Only areas with a mean maximum snow depth during 1991–2020 greater than 0.05 m (assuming that the snow density is 250 kg m−3) are shown. In contrast to the other reanalyses, MERRA-2 contains a precipitation correction based on observations (Reichle et al., 2017). The corrections were implemented in the coupled model but did not extend to latitudes north of 62.5° N.
2.4 Reanalyses ensemble
Most available high-quality observations are assimilated by reanalyses; therefore, stand-alone assessment is challenging. Indeed, reanalyses are produced via complex systems, and they generally differ between observation systems, assimilation systems, processing algorithms, and employed physical laws; identifying one or more reliable datasets is a difficult matter (Xu and Powell, 2010). For these reasons, the average ensemble spread is widely used in Earth system research to infer the reliability of an ensemble prediction system (Fortin et al., 2014). We used the average ensemble spread (enss) as an intuitive measure of how different the target variable could turn out based on an arbitrary choice of one of multiple well-regarded reanalyses. The metric enss, therefore, indicates where reanalyses, taken together as representing our ability to quantify atmospheric state, are more and where they are less accurate. With Vm = being a set of target variables from different reanalyses (m), the average ensemble spread of a variable V is given as
where n is the ensemble size, and s2 is the unbiased estimator for the variance of the ensemble members, given as
where is the ensemble mean of the target variable. The variable ranges Vs used here are the mean annual air temperature (MAATs) and the maximum snow water equivalent (maxSWEs). The relative average ensemble spread, the ensemble spread divided by the ensemble mean, was used for the maxSWE because of its strong variability.
2.5 Cryosphere occurrence
The fractional occurrence of glaciers, ice sheets, snow cover, permafrost, and seasonally frozen ground is used to illustrate the cryosphere context of our findings. Glaciers are from the Randolph Glacier Inventory (Randolph Glacier Consortium, 2023), snow cover extent is from Estilow et al. (2015), and seasonally frozen ground is from Kim et al. (2017). Since snow and seasonal frozen ground have a spatial and a temporal extent, their occurrence is derived as the presence probability for the analysis period of 1991–2020.
The permafrost zonation index (PZI) is used to derive permafrost extent (Gruber, 2012) and is scaled to 0 %–100 %. The heuristic–empirical model links the extent of permafrost to the long-term MAAT.
where μ=4.8 and σ=2.54 are model parameters from Gruber (2012). The MAAT is derived from the ensemble mean of all five reanalyses from 1991 to 2020. Even though the parameters have been calibrated for the period 1961–1990, we use them unchanged in a warmer period (i.e., 1991–2020), where slightly more permafrost than indicated may therefore persist in the subsurface.
For MAAT bins of 0.1 °C, the mean covered area is derived as the covered area by specific cryosphere element divided by the total terrestrial area including the ice sheets. Note that grid cells are weighted by area before further analyses.
To distinguish the variability between cryospheric regimes, the spread was individually analyzed for each cryosphere element. Ice-sheet-dominated areas include the Greenland and Antarctic ice sheets, areas with more than 30 snow-covered days were considered snow-dominated, areas with PZI ≥ 0.1 were considered permafrost-dominated, and areas with frozen soil ≥ 30 d (excluding permafrost-dominated areas) were considered seasonally frozen-ground-dominated.
3.1 Lower agreement among reanalyses in cold regions
We consider cold regions to be terrestrial areas, including the Greenland and Antarctic ice sheets, with a MAAT below 0 °C. The average ensemble spread of MAAT (MAATs) is higher in cold regions (Fig. 1). Using all five reanalyses (), it is about 1.5 °C (0.5–3.0 °C; hereafter, values are reported as the mean and 10th to 90th percentiles) in cold regions, or about 90 % higher than in other regions (0.8, 0.3–1.5 °C; Table 1). The MAAT trend shows a similar pattern; the spread of the mean warming trend in cold regions is about 60 % higher than that in other terrestrial areas, i.e., 0.24 °C per decade (0.10–0.42) vs. 0.15 °C per decade (0.06–0.25), and is about 56 % of the ensemble mean.
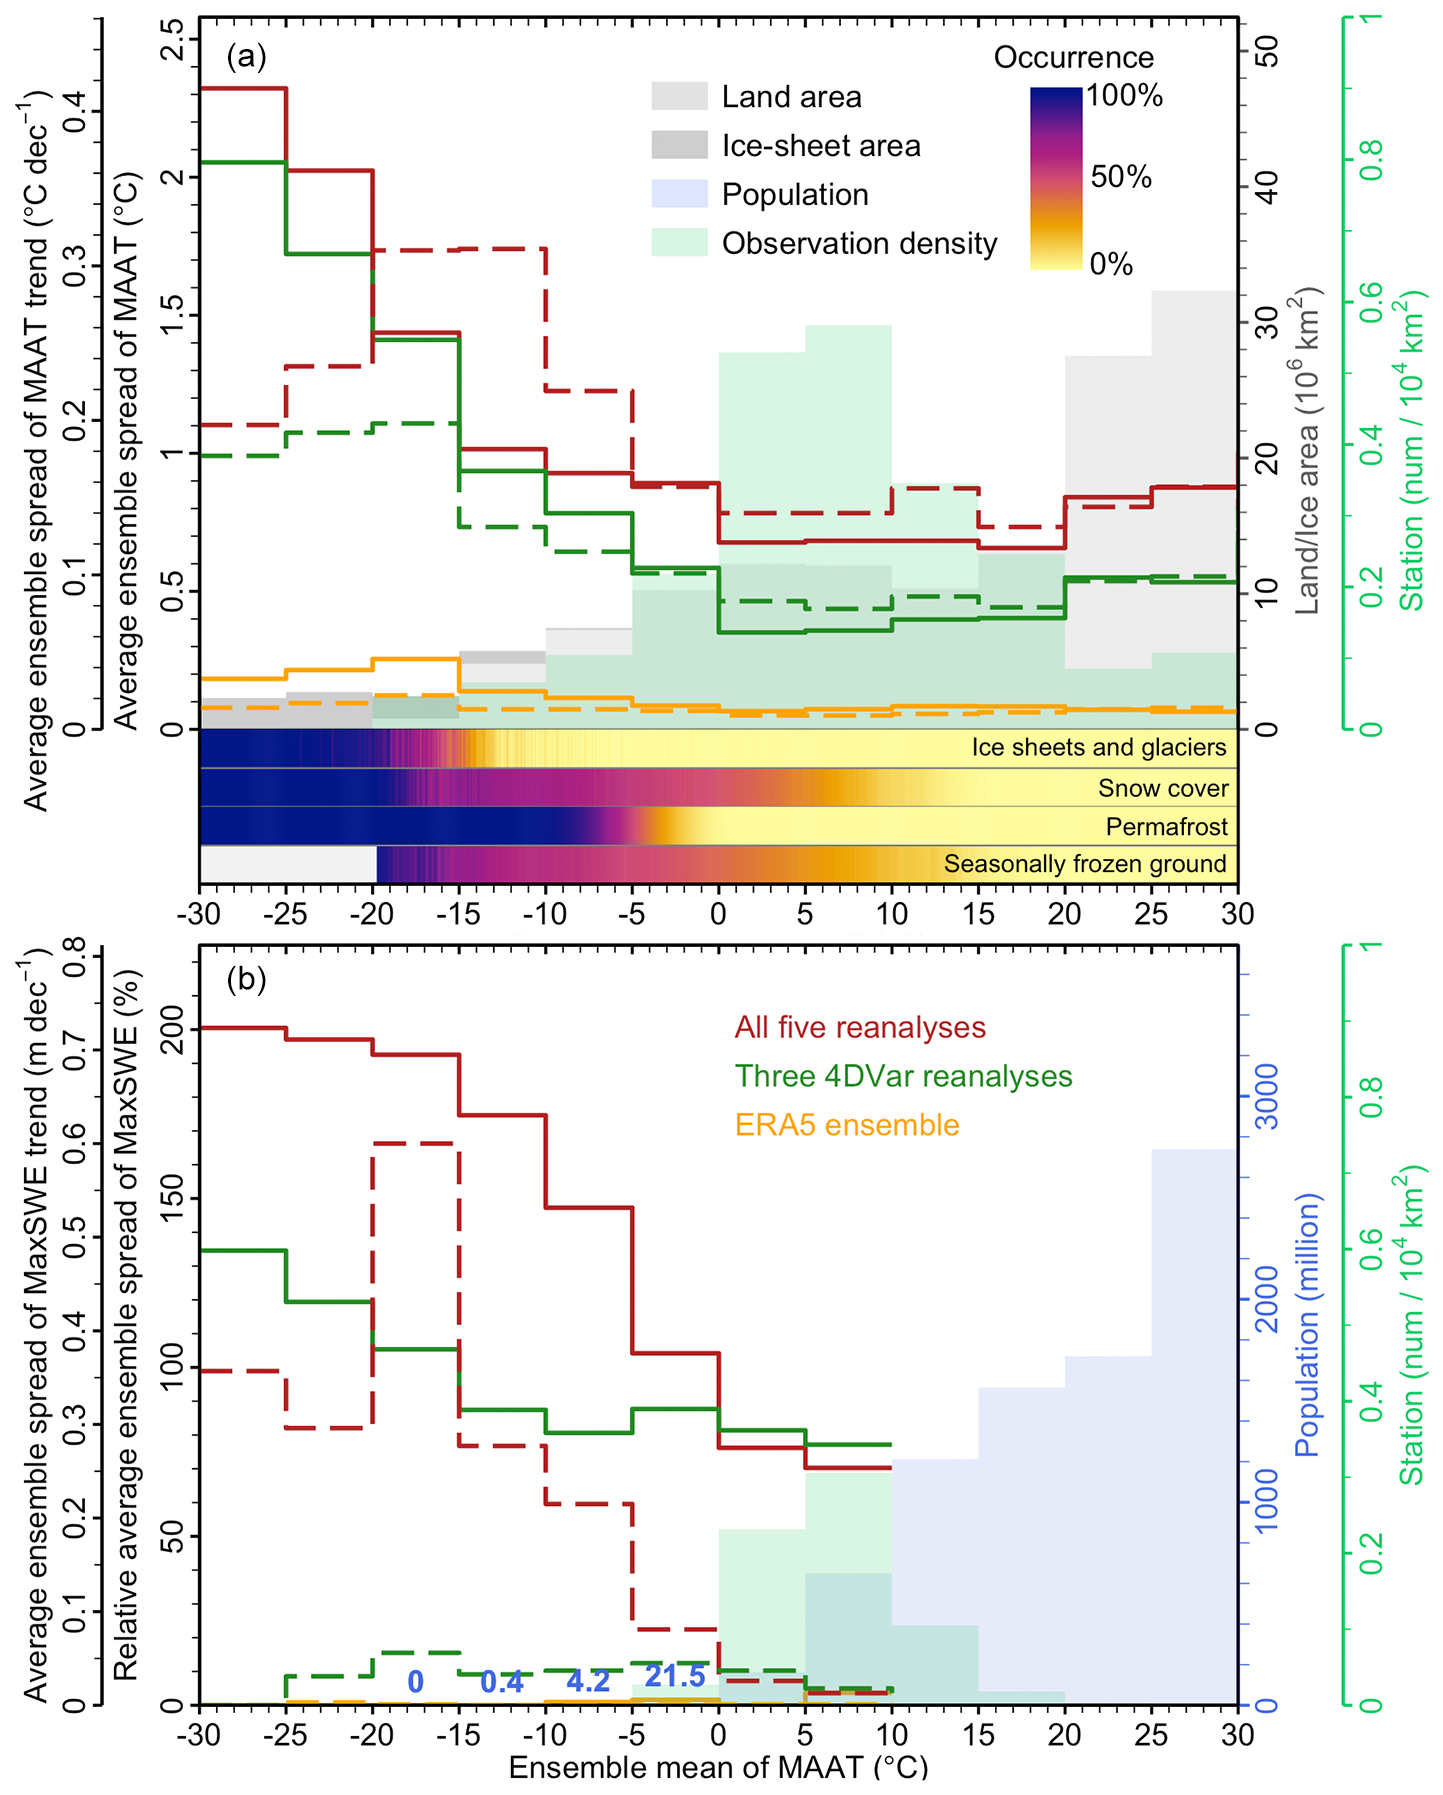
Figure 1The 1991–2020 average ensemble spread of (a) mean annual air temperature (MAAT) and (b) relative maximum snow water equivalent (maxSWE) among different reanalyses. The red (3DVar and 4DVar) and green (4DVar only) lines represent ensembles of differing numerical weather prediction models and assimilation systems, whereas the yellow line (ERA5) represents uncertainty in observations and physical parameterizations in a single modeling and assimilation system. The solid lines represent the mean state, and dashed lines indicate the trend (left vertical axis). Land area and population are shown for context (right vertical axis). Values are summarized in intervals of 5 °C for the ensemble mean of MAAT. The occurrence of cryosphere elements, estimated as the probability of occurrence during the analysis period, is scaled per MAAT bin of 0.1 °C (see Methods). Only reanalysis cells with a significant (P < 0.05) trend are used for the analysis of change. Blue numbers express low population counts in millions. The peak in the trend of maxSWE observed for MAAT classes from −15 to −20 °C is caused by increased uncertainty in ice-free areas of Greenland and Antarctica.
Table 1The spread of mean annual air temperature (MAATs; ∘C) and relative maximum snow water equivalent (maxSWEs; %) for the areas occupied by specific cryosphere elements.
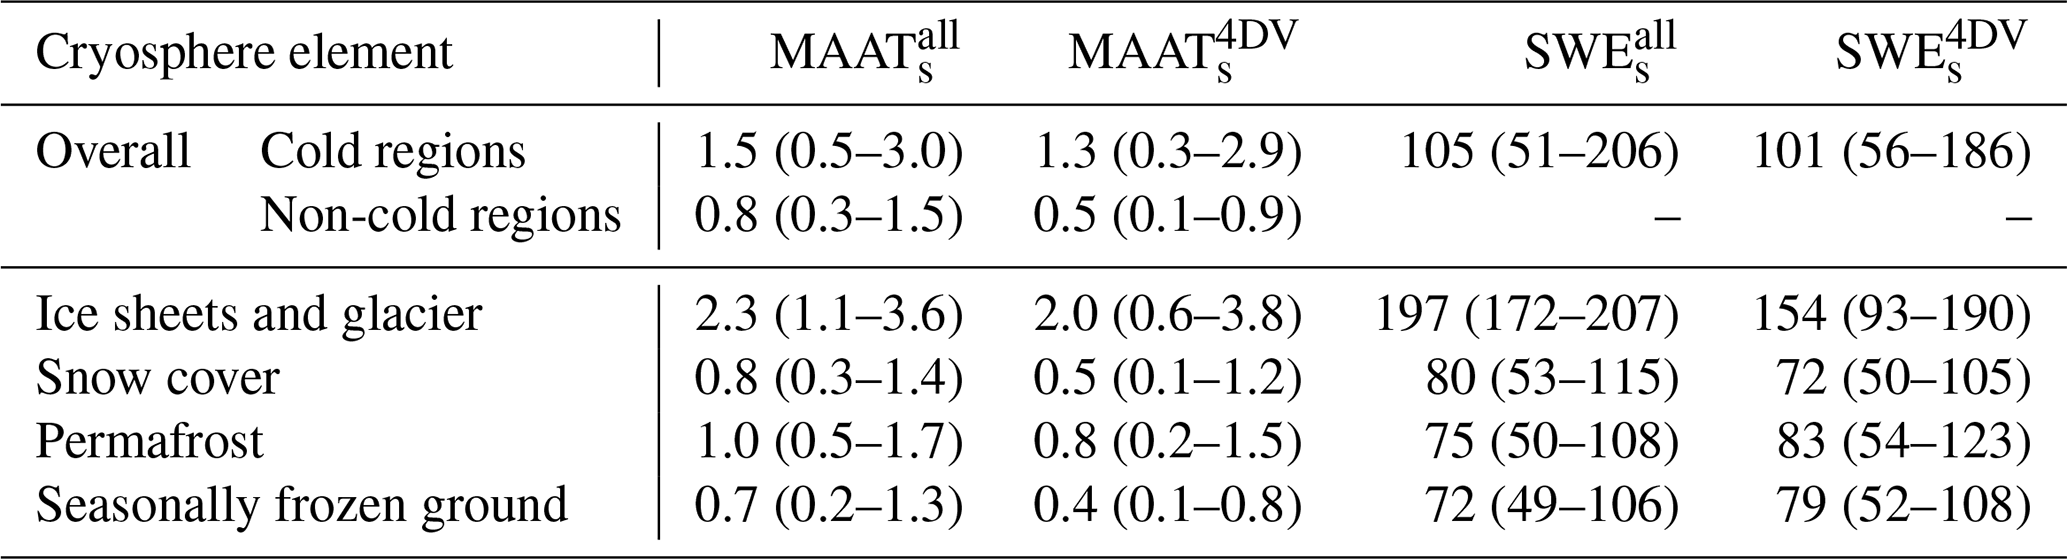
Values are reported as means (10th to 90th percentiles). Superscripts distinguish all five (all) reanalyses and the three 4DVar modern reanalyses (4DV) only.
Because maxSWE has strong spatial variability, we report its relative spread (Fig. 2c and d). Its high average (105, 51 %–206 %) shows that, on average, the variation in maxSWE between reanalyses is greater than their ensemble mean. This suggests that reanalyses face challenges in supporting services and research related to snow. We found that the greatest maxSWEs values occur in high-altitude regions, for example high-mountain Asia (Fig. 2c and d), where snowmelt water is an essential supply to millions of people downstream for irrigation, hydroelectric power, and consumption (Qin et al., 2020; Kraaijenbrink et al., 2021). Figure S3 in the Supplement (and Sect. S1 in the Supplement) shows how ensemble spread increases with terrain ruggedness. On the other hand, the spread on the two continental ice sheets is also high even though the terrain is flat. This is likely because of inadequate representation of processes involving ice, snow, and firn. Previous studies reported that the snow uncertainties in mountains are related to the performance of numerical weather prediction models in representing precipitation and snow processes (Domine et al., 2019; Cao et al., 2020; Zhou et al., 2024), especially the well-known bias in MERRA-2 precipitation (Reichle et al., 2017). The coarse spatial resolution of reanalysis leads to inadequate representation of elevation-specific processes like precipitation, katabatic winds, or radiation in the numerical weather prediction models used.
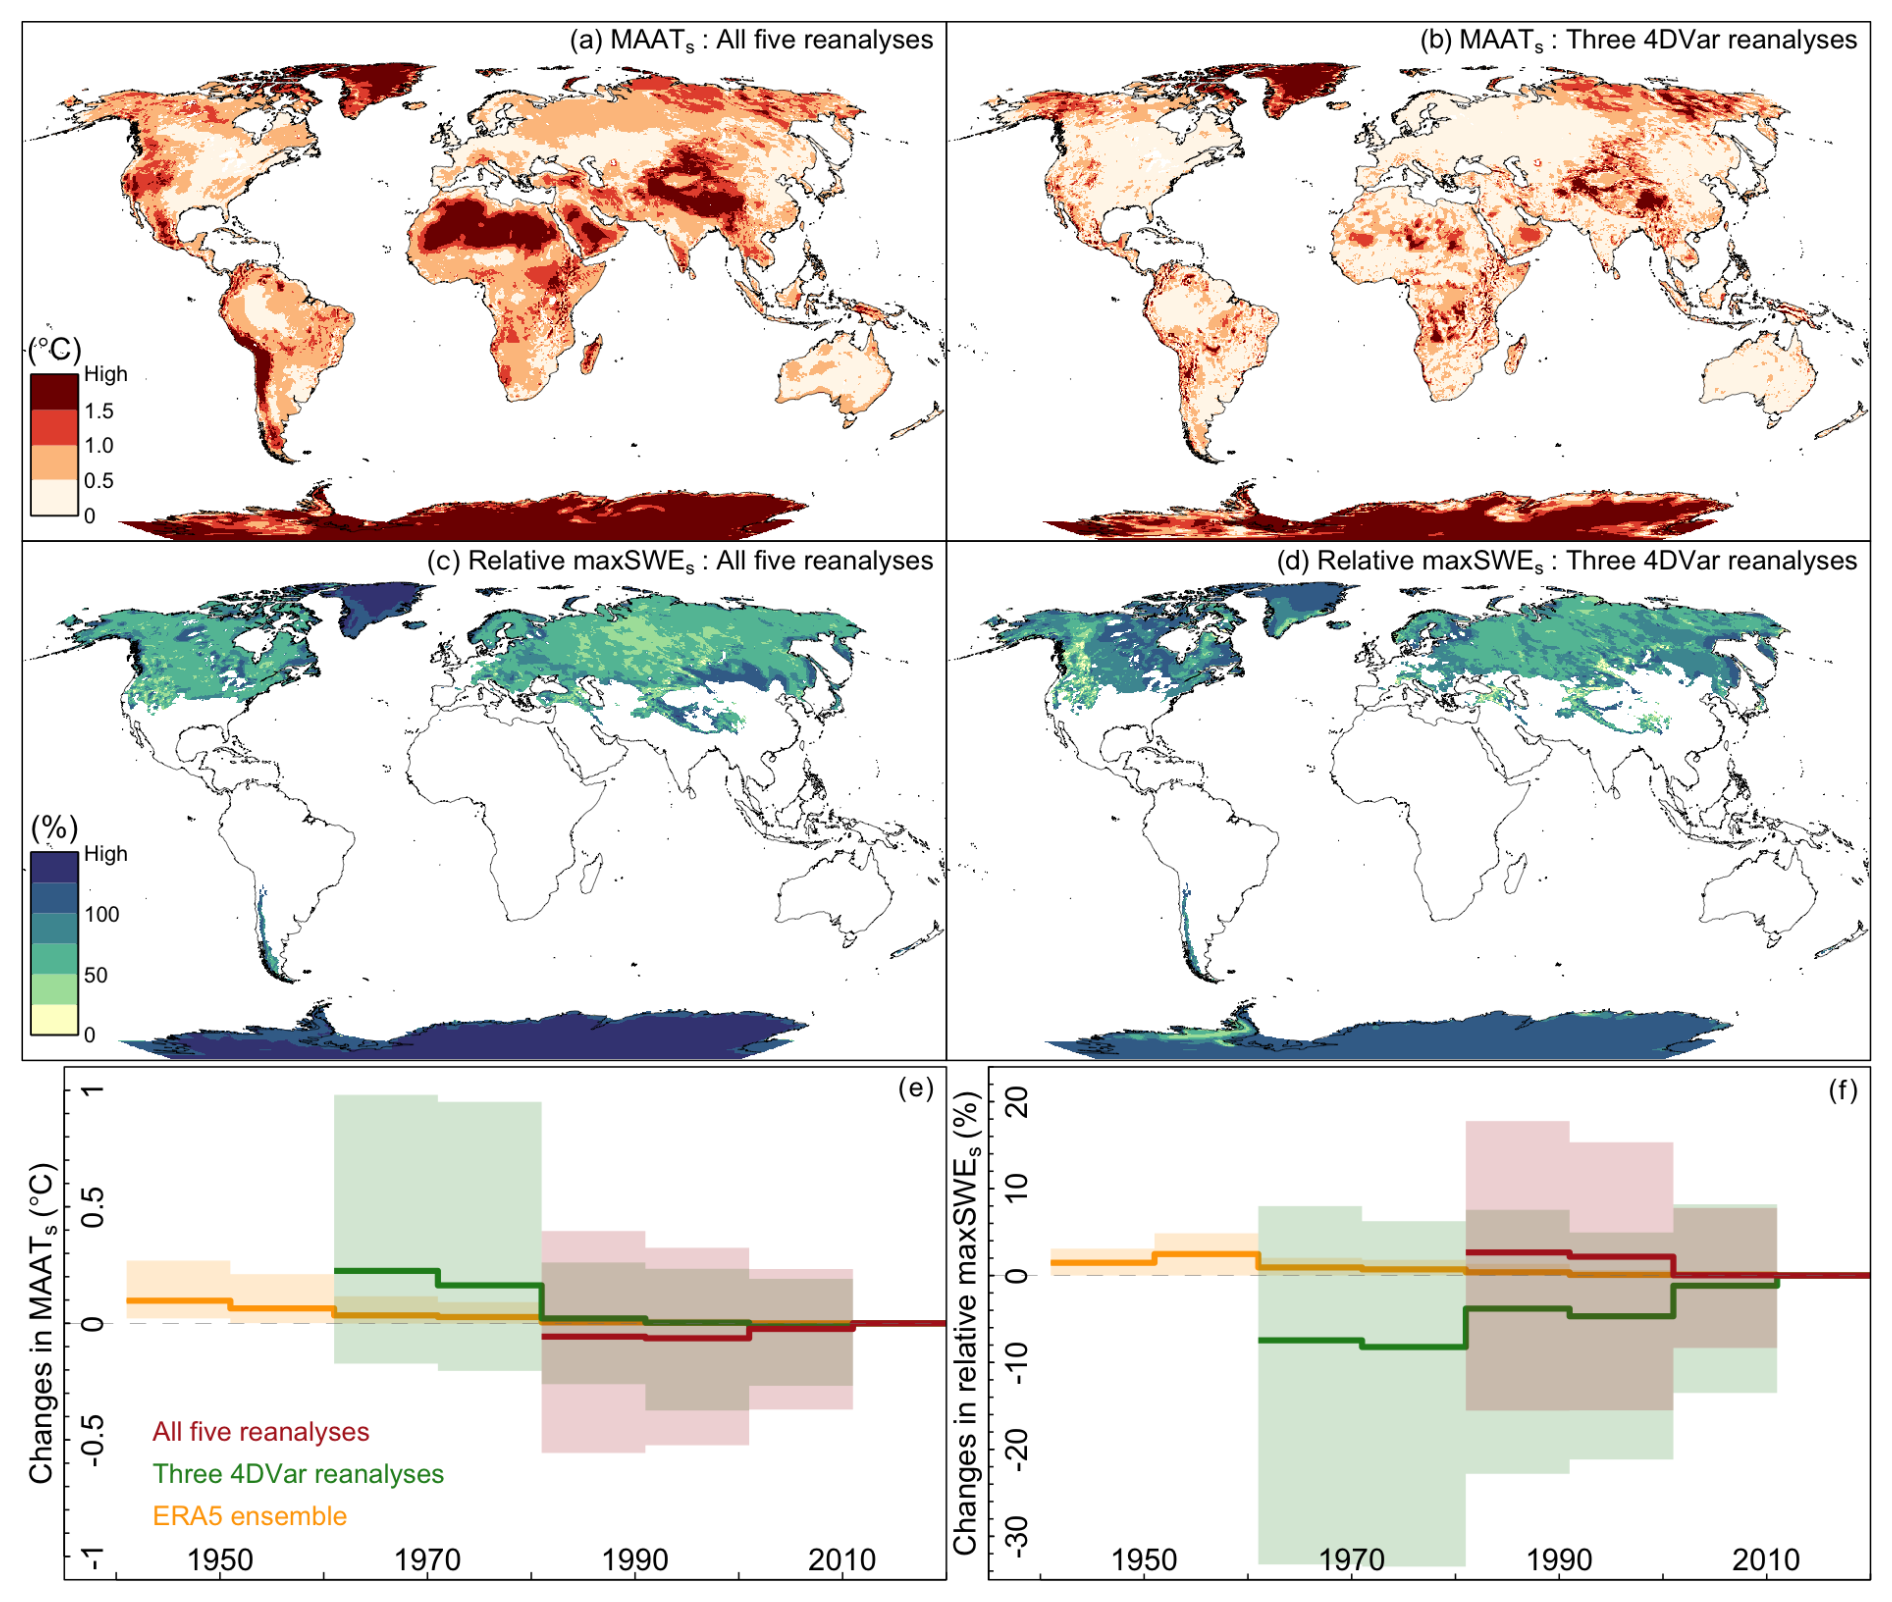
Figure 2The 1991–2020 average ensemble spread of mean annual air temperature (MAATs) and relative spread of maximum snow water equivalent (maxSWEs). Only areas with a mean maxSWEs greater than 0.0125 m (0.05 m snow height at a snow density of 250 kg m−3) are shown. Snow water equivalent is not available for the two continental ice sheets in MERRA-2 and is therefore not included in these regions. The overall temporal changes for (e) MAATs and (f) relative maxSWEs were derived with the reference period of 2011–2020 using all five reanalyses, and a positive value means the spread is reduced relative to the referenced period. In (e) and (f), the solid lines represent the mean state, and shaded areas indicate the 10th to 90th percentiles. The difference between all five reanalyses and three 4DVar reanalyses is given in Fig. S2 in the Supplement.
Compared to all five reanalyses, the MAATs spread (1.3, 0.3–2.9 °C) and its trend (0.13, 0.04–0.24 °C per decade) for the 4DVar reanalyses are still significant in cold regions, and the average ensemble spread is up to 45 % greater than that of other regions (Table 1, Figs. 1 and 2), indicating the inherent issues regarding the complex ice-related processes. The relative maxSWEs among 4DVar reanalyses is about 101 % (56 %–186 %) and is comparable to that derived from all five reanalyses. Compared to the spread of multiple reanalyses that also differ in structure, the spread of the ERA5 ensemble, within a consistent assimilation system and representing mostly parametric uncertainty, is notably smaller, as expected, i.e., 0.1 °C (0.0–0.3) for MAATs and 1.0 % (0–2.6) for relative maxSWEs.
The temporal analyses revealed that the spread in MAAT and maxSWE was generally reduced after 1980, with the increased assimilation of satellite datasets (Fig. 2e and f; Hersbach et al., 2019). For example, the MAATs in the 2010s was reduced by 0.23 °C compared to that in the 1960s for the 4DVar reanalyses. But a persistent spread found since 1980 despite improved observations may indicate process representation issues in the numerical weather prediction models.
While the overall spread is remarkable in cold regions, the ice sheet areas show the most significant spread, which is about 2.3 times greater for MAAT and 1.7 times greater for maxSWE compared to that in seasonally frozen-ground-dominated areas based on all five reanalyses (Table 1, Fig. 1).
3.2 Coincident low density of observations
We explored the density of in situ observations to contextualize variation in reanalysis performance. Reanalyses have the best agreement, or lowest MAATs, in regions with rich observations, corresponding to the MAAT band from 0 to 10 °C, where 848 million people (or about 10 % of the global population) live (Fig. 1). In cold regions, the population is about 26 million (or 0.3 %), with 80 % in its warmest MAAT band of −5 to 0 °C. The density of in situ observations (0.08 stations per 104 km2) is low compared to other regions, limiting the ability to constrain the reanalyses.
Interestingly, the MAATs in hot regions (MAAT ≥ 20 °C) is about 0.4 °C (or 46 %) lower compared to the extremely cold regions (−20 ≤ MAAT ≤ −10 °C), although the density of in situ observations is comparably low (0.05 stations per 104 km2). This indicates the prevalence of cryospheric phenomena such as glaciers, ice sheets, snow, and frozen soil (Fig. 1), and related physical processes pose important additional difficulties for the numerical weather prediction models (e.g., Cao et al., 2020; Domine et al., 2019). This is also visible in the 10-member ensemble of ERA5, taking into account random uncertainty in observations and parameterizations but having only a single prediction model and assimilation system (Fig. 1).
Reanalyses are produced by assimilating a broad range of historical observations into numerical weather prediction models. As such, they manifest how well we can estimate the state of the atmosphere and land surface globally, based on process knowledge and observations. They are widely considered a key data source for climate studies (Baatz et al., 2021) and the delivery of services (e.g., Dee et al., 2014; Gruber et al., 2023). This is especially true in cold regions, where we show that the quality of reanalyses in key variables is much lower than elsewhere.
While cold regions are remote and sparsely populated overall, this reduced quality of reanalyses matters. Environmental changes in cold regions involve feedbacks and tipping elements that affect Earth in its entirety. Obstacles in resolving the underlying processes likely point to similar gaps in knowledge and capabilities in the context of numerical weather prediction models. Furthermore, climate-driven changes in cold regions will be more profound than in many other terrestrial areas globally. As such, the ability to provide services and support climate research has an outsized importance for enabling resilient communities and resource extraction, as well as for national security and disaster preparedness. We hope our analysis will help raise the awareness of how important cold-region processes may be for numerical weather prediction models and reanalyses and thus encourage greater focus on studies of individual cryosphere elements (e.g., Cao et al., 2022; Meloche et al., 2022) to inform research leading to future improvements in numerical weather prediction models.
The mean annual air temperature and snow water equivalent datasets used here are publicly available on Zenodo (https://doi.org/10.5281/zenodo.14216654, Cao and Gruber, 2024). The JRA-3Q (https://search.diasjp.net/en/dataset/JRA3Q, last access: 26 September 2025) and JRA-55 (https://search.diasjp.net/en/dataset/JRA55, last access: 26 September 2025) are from the Japan Meteorological Agency. ERA5 is from the Climate Data Store (https://doi.org/10.24381/cds.f17050d7, Hersbach et al., 2023). MERRA-2 is from Goddard Earth Sciences Data and Information Services Center (https://doi.org/10.5067/0JRLVL8YV2Y4, GMAO, 2015). NCEP2 is from the NOAA Physical Sciences Laboratory (https://psl.noaa.gov/data/gridded/data.ncep.reanalysis2.html, last access: 26 September 2025).
The supplement related to this article is available online at https://doi.org/10.5194/tc-19-4525-2025-supplement.
BC carried out this study by conducting simulations and analyses. SG proposed the initial idea and guided the study. Both authors wrote the text.
The contact author has declared that none of the authors has any competing interests.
Publisher's note: Copernicus Publications remains neutral with regard to jurisdictional claims made in the text, published maps, institutional affiliations, or any other geographical representation in this paper. While Copernicus Publications makes every effort to include appropriate place names, the final responsibility lies with the authors.
We would thank the two anonymous reviewers and the subject editor for their constructive comments, which have substantially improved the quality of the manuscript.
This research has been supported by the National Natural Science Foundation of China (grant no. 42422608), the Youth Innovation Promotion Association of the Chinese Academy of Sciences (grant no. 2023075), and the Natural Sciences and Engineering Research Council of Canada (grant nos. NETGP 523228-18 and RGPIN-2020-04783).
This paper was edited by Cécile Ménard and reviewed by two anonymous referees.
Abram, N., Adler, C., Bindoff, N. L., Cheng, L., Cheong, S.-M., Cheung, W. W. L., Collins, M., Derksen, C., Ekaykin, A., Frölicher, T., Garschagen, M., Gattuso, J.-P., Glavovic, B., Gruber, S., Guinder, V., Hallberg, R., Harper, S., Hilmi, N., Hinkel, J., Hirabayashi, Y., Hock, R., Hollowed, A., Combes, H. J. D., Kairo, J., Magnan, A. K., Masson-Delmotte, V., Matthews, J. R., McInnes, K., Meredith, M., Mintenbeck, K., Morin, S., Okem, A., Oppenheimer, M., Orlove, B., Petzold, J., Pirani, A., Poloczanska, E., Pörtner, H.-O., Prakash, A., Rasul, G., Rivera-Arriaga, E., Roberts, D. C., Schuur, E. A., Sebesvari, Z., Sommerkorn, M., Sutherland, M., Tagliabue, A., Wal, R. V. D., Williamson, P., Yu, R., and Zhai, P.: Summary for Policymakers, in: IPCC Special Report on the Ocean and Cryosphere in a Changing Climate, Intergovernmental Panel on Climate Change, pp. 3–35, 2019. a
Baatz, R., Hendricks Franssen, H. J., Euskirchen, E., Sihi, D., Dietze, M., Ciavatta, S., Fennel, K., Beck, H., De Lannoy, G., Pauwels, V. R. N., Raiho, A., Montzka, C., Williams, M., Mishra, U., Poppe, C., Zacharias, S., Lausch, A., Samaniego, L., Van Looy, K., Bogena, H., Adamescu, M., Mirtl, M., Fox, A., Goergen, K., Naz, B. S., Zeng, Y., and Vereecken, H.: Reanalysis in Earth System Science: Toward Terrestrial Ecosystem Reanalysis, Reviews of Geophysics, 59, 1–39, https://doi.org/10.1029/2020RG000715, 2021. a
Cao, B. and Gruber, S.: Reduced performance of reanalyses in cold regions, Zenodo [data set], https://doi.org/10.5281/zenodo.14216654, 2024. a
Cao, B., Gruber, S., and Zhang, T.: REDCAPP (v1.0): parameterizing valley inversions in air temperature data downscaled from reanalyses, Geosci. Model Dev., 10, 2905–2923, https://doi.org/10.5194/gmd-10-2905-2017, 2017. a
Cao, B., Zhang, T., Wu, Q., Sheng, Y., Zhao, L., and Zou, D.: Permafrost zonation index map and statistics over the Qinghai-Tibet Plateau based on field evidence, Permafrost and Periglacial Processes, 30, 178–194, https://doi.org/10.1002/ppp.2006, 2019. a
Cao, B., Gruber, S., Zheng, D., and Li, X.: The ERA5-Land soil temperature bias in permafrost regions, The Cryosphere, 14, 2581–2595, https://doi.org/10.5194/tc-14-2581-2020, 2020. a, b, c
Cao, B., Arduini, G., and Zsoter, E.: Brief communication: Improving ERA5-Land soil temperature in permafrost regions using an optimized multi-layer snow scheme, The Cryosphere, 16, 2701–2708, https://doi.org/10.5194/tc-16-2701-2022, 2022. a
Center for International Earth Science Information Network-CIESIN-Columbia University: Gridded Population of the World (GPW), Version 4 (GPWv4): Population Density, Revision 11 [data set], https://doi.org/10.7927/H49C6VHW, 2018. a
Cohen, J., Agel, L., Barlow, M., Garfinkel, C. I., and White, I.: Linking Arctic variability and change with extreme winter weather in the United States, Science, 373, 1116–1121, https://doi.org/10.1126/science.abi9167, 2021. a
Copernicus Climate Change Service (C3S) Climate Data Store (CDS): Global land surface atmospheric variables from 1755 to 2020 from comprehensive in-situ observations, https://doi.org/10.24381/cds.cf5f3bac (last access: 21 April 2025), 2021. a
Dee, D., Balmaseda, M., Balsamo, G., Engelen, R., Simmons, A., and Thépaut, J.-N.: Toward a consistent reanalysis of the climate system, Bulletin of the American Meteorological Society, 95, 1235–1248, 2014. a
Domine, F., Picard, G., Morin, S., Barrere, M., Madore, J.-B., and Langlois, A.: Major Issues in Simulating Some Arctic Snowpack Properties Using Current Detailed Snow Physics Models: Consequences for the Thermal Regime and Water Budget of Permafrost, Journal of Advances in Modeling Earth Systems, 11, 34–44, https://doi.org/10.1029/2018MS001445, 2019. a, b
Estilow, T. W., Young, A. H., and Robinson, D. A.: A long-term Northern Hemisphere snow cover extent data record for climate studies and monitoring, Earth Syst. Sci. Data, 7, 137–142, https://doi.org/10.5194/essd-7-137-2015, 2015. a
Fang, Y., Liu, Y., Li, D., Sun, H., and Margulis, S. A.: Spatiotemporal snow water storage uncertainty in the midlatitude American Cordillera, The Cryosphere, 17, 5175–5195, https://doi.org/10.5194/tc-17-5175-2023, 2023. a
Fortin, V., Abaza, M., Anctil, F., and Turcotte, R.: Why Should Ensemble Spread Match the RMSE of the Ensemble Mean?, Journal of Hydrometeorology, 15, 1708–1713, https://doi.org/10.1175/JHM-D-14-0008.1, 2014. a, b
Global Modeling and Assimilation Office (GMAO): MERRA-2 tavgM_2d_flx_Nx: 2d,Monthly mean,Time-Averaged,Single-Level,Assimilation,Surface Flux Diagnostics V5.12.4, Goddard Earth Sciences Data and Information Services Center (GES DISC), Greenbelt, MD, USA [data set], https://doi.org/10.5067/0JRLVL8YV2Y4, 2015. a
Graham, R. M., Hudson, S. R., and Maturilli, M.: Improved performance of ERA5 in Arctic gateway relative to four global atmospheric reanalyses, Geophysical Research Letters, 46, 6138–6147, 2019. a
Gruber, S.: Derivation and analysis of a high-resolution estimate of global permafrost zonation, The Cryosphere, 6, 221–233, https://doi.org/10.5194/tc-6-221-2012, 2012. a, b
Gruber, S., Hayley, J., Karunaratne, K., King, J., MacLean, T., Marshall, S., and Moore, D.: Considerations toward a vision and strategy for permafrost knowledge in Canada, Arctic Science, 9, iv–viii, https://doi.org/10.1139/as-2023-0016, 2023. a
Hersbach, H., Bell, W., Berrisford, P., Horányi, A., J, M.-S., Nicolas, J., Radu, R., Schepers, D., Simmons, A., Soci, C., and Dee, D.: Global reanalysis: goodbye ERA-Interim, hello ERA5, https://doi.org/10.21957/vf291hehd7, 2019. a, b
Hersbach, H., Bell, B., Berrisford, P., Biavati, G., Horányi, A., Muñoz Sabater, J., Nicolas, J., Peubey, C., Radu, R., Rozum, I., Schepers, D., Simmons, A., Soci, C., Dee, D., and Thépaut, J,-N.: ERA5 monthly averaged data on single levels from 1940 to present, Copernicus Climate Change Service (C3S) Climate Data Store (CDS) [data set], https://doi.org/10.24381/cds.f17050d7, 2023. a
Huang, J., Zhang, X., Zhang, Q., Lin, Y., Hao, M., Luo, Y., Zhao, Z., Yao, Y., Chen, X., Wang, L., Nie, S., Yin, Y., Xu, Y., and Zhang, J.: Recently amplified arctic warming has contributed to a continual global warming trend, Nature Climate Change, 7, 875–879, https://doi.org/10.1038/s41558-017-0009-5, 2017. a
Intergovernmental Panel On Climate Change (IPCC): Climate Change 2021 – The Physical Science Basis: Working Group: I Contribution to the Sixth Assessment Report of the Intergovernmental Panel on Climate Change, 1st edn., Cambridge University Press, https://doi.org/10.1017/9781009157896, 2023. a
Kim, Y., Kimball, J. S., Glassy, J., and Du, J.: An extended global Earth system data record on daily landscape freeze–thaw status determined from satellite passive microwave remote sensing, Earth Syst. Sci. Data, 9, 133–147, https://doi.org/10.5194/essd-9-133-2017, 2017. a
Kraaijenbrink, P. D. A., Stigter, E. E., Yao, T., and Immerzeel, W. W.: Climate change decisive for Asia's snow meltwater supply, Nature Climate Change, 11, 591–597, https://doi.org/10.1038/s41558-021-01074-x, 2021. a
Lan, S., Cao, B., Li, X., Sun, W., Wang, S., Ma, R., Sun, Z., and Guo, X.: Improved JRA-3Q Soil Temperature in Permafrost Regions, Journal of Climate, 38, 1611–1625, https://doi.org/10.1175/JCLI-D-24-0267.1, 2025. a
Meloche, J., Langlois, A., Rutter, N., Royer, A., King, J., Walker, B., Marsh, P., and Wilcox, E. J.: Characterizing tundra snow sub-pixel variability to improve brightness temperature estimation in satellite SWE retrievals, The Cryosphere, 16, 87–101, https://doi.org/10.5194/tc-16-87-2022, 2022. a
Overland, J. E., Dethloff, K., Francis, J. A., Hall, R. J., Hanna, E., Kim, S.-J., Screen, J. A., Shepherd, T. G., and Vihma, T.: Nonlinear response of mid-latitude weather to the changing Arctic, Nature Climate Change, 6, 992–999, https://doi.org/10.1038/nclimate3121, 2016. a
Qin, Y., Abatzoglou, J. T., Siebert, S., Huning, L. S., AghaKouchak, A., Mankin, J. S., Hong, C., Tong, D., Davis, S. J., and Mueller, N. D.: Agricultural risks from changing snowmelt, Nature Climate Change, 10, 459–465, https://doi.org/10.1038/s41558-020-0746-8, 2020. a
Randolph Glacier Consortium: Randolph Glacier Inventory – A Dataset of Global Glacier Outlines, Version 7.0., NSIDC: National Snow and Ice Data Center, https://doi.org/10.5067/f6jmovy5navz, 2023. a
Reichle, R. H., Liu, Q., Koster, R. D., Draper, C. S., Mahanama, S. P. P., and Partyka, G. S.: Land Surface Precipitation in MERRA-2, Journal of Climate, 30, 1643–1664, https://doi.org/10.1175/JCLI-D-16-0570.1, 2017. a, b
Richardson, K., Steffen, W., Lucht, W., Bendtsen, J., Cornell, S. E., Donges, J. F., Drüke, M., Fetzer, I., Bala, G., von Bloh, W., Feulner, G., Fiedler, S., Gerten, D., Gleeson, T., Hofmann, M., Huiskamp, W., Kummu, M., Mohan, C., Nogués-Bravo, D., Petri, S., Porkka, M., Rahmstorf, S., Schaphoff, S., Thonicke, K., Tobian, A., Virkki, V., Wang-Erlandsson, L., Weber, L., and Rockström, J.: Earth beyond six of nine planetary boundaries, Science Advances, 9, 1–17, https://doi.org/10.1126/sciadv.adh2458, 2023. a
Wang, K., Zhang, T., Zhang, X., Clow, G. D., Jafarov, E. E., Overeem, I., Romanovsky, V., Peng, X., and Cao, B.: Continuously amplified warming in the Alaskan Arctic: Implications for estimating global warming hiatus, Geophysical Research Letters, 44, 9029–9038, https://doi.org/10.1002/2017GL074232, 2017. a
Xu, J. and Powell, A. M.: Ensemble spread and its implication for the evaluation of temperature trends from multiple radiosondes and reanalyses products, Geophysical Research Letters, 37, https://doi.org/10.1029/2010GL044300, 2010. a
Zhou, P., Tang, J., Ma, M., Ji, D., and Shi, J.: High resolution Tibetan Plateau regional reanalysis 1961-present, Scientific Data, 11, 444, https://doi.org/10.1038/s41597-024-03282-4, 2024. a