the Creative Commons Attribution 4.0 License.
the Creative Commons Attribution 4.0 License.
 | 15 Sep 2025
Linking crystallographic orientation and ice stream dynamics: evidence from the EastGRIP ice core
Nicolas Stoll
Daniela Jansen
Paul Bons
Kyra Darányi
Julien Westhoff
María-Gema Llorens
David Wallis
Jan Eichler
Tomotaka Saruya
Tomoyuki Homma
Sune Olander Rasmussen
Giulia Sinnl
Anders Svensson
Martyn Drury
Frank Wilhelms
Sepp Kipfstuhl
Dorthe Dahl-Jensen
Johanna Kerch
A better understanding of glacial ice flow and how it is influenced by internal deformation is required to improve the projections of future sea level rise under a warming climate. Large ice streams, the main contributors to solid-ice discharge to the ocean, still require more observational data to be represented sufficiently in numerical ice sheet models. The East Greenland Ice-core Project (EastGRIP) successfully drilled the first continuous deep-ice core through an active ice stream, the Northeast Greenland Ice Stream (NEGIS), focusing on investigating the dynamical processes that lead to its exceptionally high velocity. Here, we show crystallographic preferred orientation (CPO) data at a 5–15 m depth resolution throughout the 2663 m core, down to bedrock, to determine the deformation regimes in this ice stream, complemented by grain size and borehole temperature profiles for context. A broad single-maximum CPO pattern is present in the upper 200 m caused by overlying snow and ice layers. Below, a crossed-girdle CPO is observed for the first time in a deep-ice core and we discuss possible formation mechanisms. Between 500 and 1230 m in depth, we observe a vertical-girdle CPO indicative of along-flow extensional deformation. A complementary simple-shear component could explain the CPO between 1230 and 2500 m, a vertical girdle with horizontal maxima of varying strength. Close to bedrock, large amoeboid-shaped grains and a multi-maxima CPO indicate migration recrystallisation due to high temperatures close to the pressure melting point. Complementary conductivity data further suggest an undisturbed stratigraphy until at least 104 ka b2k (thousands of years before 2000 CE), and microstructural data suggest even older ice from the Eemian. A comparison with other deep-ice cores from Greenland and Antarctica shows the uniquely fast development of CPOs at shallow depths in the EastGRIP ice core due to its location in an area of high strain rates, while the grain size profile with depth remains similar to less dynamic sites, confirming that it is mainly governed by the varying purity of ice deposited under varying climatic conditions. We further show that the overall plug flow of NEGIS is characterised by many small-scale variations, which remain to be considered in ice flow models.
- Article
(16429 KB) - Full-text XML
-
Supplement
(49429 KB) - BibTeX
- EndNote


Melting and solid-ice discharge are the two main processes that cause mass loss from Greenland and Antarctica. Ice streams, which are characterised by a river-like structure of localised high flow velocities, contribute most to solid-ice discharge and thus play a crucial role in future sea level rise (e.g. Bamber et al., 2000; van den Broeke et al., 2009; Margold et al., 2015; IPCC, 2022). However, ice stream dynamics, including internal deformation, are insufficiently understood (IPCC, 2013; Nick et al., 2013; Stokes et al., 2016). Therefore, the physics of ice streams must be investigated further to enable better projections of global sea level rise. Large-scale ice flow models usually ignore the mechanical anisotropy of ice (Winkelmann et al., 2011) or assume (scalar) enhancement factors to approximate the effects of anisotropy in the bulk behaviour (e.g. Russell-Head and Budd, 1979; Rathmann et al., 2022). As it is only possible to measure ice flow velocity on the surface, except for very few locations with long-term accessible boreholes, there are no direct observations to constrain ice behaviour deeper in the ice column in an ice stream. Thus, the relative contributions to fast ice flow from internal deformation and basal sliding can only be estimated by inverse modelling, relying on standard descriptions of the rheological behaviour of ice. It is further unclear how and where the horizontal movement over the bed translates into shearing over the bed.
Internal deformation is a significant component of ice flow, and its relative importance depends on the basal conditions. However, direct observational data from within the ice volume, i.e. from a deep-ice core, are scarce due to the high costs and effort involved. To study the internal deformation in an ice stream, physical properties, such as the microstructure and crystallographic preferred orientations (CPOs) of ice crystals (also called crystal-orientation fabric or, in short, fabric), are examined and improve our understanding of the rheological behaviour of ice. A better description of ice rheological behaviour can then be implemented in large-scale flow models to advance our understanding of ice dynamics. Modelling ice CPOs and their respective deformation regimes has advanced over the recent decades, becoming a powerful tool for investigating the dynamic behaviour of ice at different scales (e.g. Montagnat et al., 2014b; Richards et al., 2023). However, the objectives and processes implemented usually differ from small-scale to large-scale flow models (e.g. Azuma and Higashi, 1985; Alley, 1992; Piazolo et al., 2019; Lilien et al., 2021; Llorens et al., 2022; Rathmann and Lilien, 2022; Richards et al., 2023; Ranganathan and Minchew, 2024). Information on anisotropy in ice streams can be deduced to a certain extent by geophysical remote sensing methods, such as seismic (e.g. Smith et al., 2017; Pearce et al., 2024) and radar (Jordan et al., 2022; Zeising et al., 2023; Gerber et al., 2023; Nymand et al., 2024) measurements. The most detailed ground-truth data are required from ice cores to verify the results of these remote sensing data in addition to improving modelling approaches.
Accurate information on the ice anisotropy and microstructural properties, such as grain size, can be derived via polarised-light microscopy measurements of the c-axis orientations on consecutive thin-section samples from deep-ice-core drillings. Measurements have been established utilising automated fabric analysers, typically at depth intervals of 10 to 150 m (e.g. Wang et al., 2003; Montagnat et al., 2014a; Fitzpatrick et al., 2014; Weikusat et al., 2017; Voigt, 2017). So far, most deep-ice cores have been drilled at locations with low ice flow velocities, such as ice domes or divides, to guarantee an undisturbed record of climate signals (e.g. Petit et al., 1999; Watanabe et al., 2003; EPICA Community Members, 2004). Thus, direct observations of ice sheet CPOs and microstructure have been focused on these regions. However, the need for data from more dynamic regions is evident. The investigation of microstructural processes influenced by crystallographic preferred orientation, such as strain localisation and shear layers (e.g. Bons and Jessell, 1999; Carreras, 2001; Adam et al., 2005; Llorens et al., 2016a; de Riese et al., 2019), largely unexplored in ice, would further benefit from data at a high spatial resolution on anisotropy and deformation in an ice stream.
To investigate ice stream dynamics by direct observation from within the ice, the East Greenland Ice-core Project (EastGRIP; main drilling between 2016 and 2023) retrieved the first continuous deep-ice core through the central part of an active ice stream, the Northeast Greenland Ice Stream (NEGIS) (Fig. 1). NEGIS is Greenland's most significant ice stream, draining 12 % of the ice sheet (Rignot and Mouginot, 2012). Jansen et al. (2024) showed that NEGIS was dynamic in the Holocene and was only established in its current form 2000 years ago. Further, along-flow extension and compression is more difficult in the ice stream centre than at the shear margins (Gerber et al., 2023).
Initial microstructural data from EastGRIP have assisted in investigating the localisation of impurities in the ice microstructure (Stoll et al., 2021a, 2022; Bohleber et al., 2023; Stoll et al., 2023), further showing the complicated interplay between impurities and the ice microstructure with regard to deformation and ice viscosity (e.g. Jones and Glen, 1969; Paterson, 1991; Eichler et al., 2017; Stoll et al., 2021b), in reconstructing the original orientation of the drilled core (Westhoff et al., 2021), and in understanding the birefringent radar echo patterns caused by CPOs (Gerber et al., 2023).
We present the first-ever study of CPO patterns with depth throughout a site in the central part of a several-kilometre-wide ice stream derived via thin-section measurements from a deep-ice core supplemented by grain size and electrical conductivity data. Complete measurements of 0.55 m pieces, i.e. entire “bags”, of the ice core every 5–15 m exceed the semi-continuous sampling established in prior deep-ice-core studies. The closely spaced samples enable us to quantify gradual changes in CPO with depth, providing a solid observational platform on which to build robust deformation models showing the changes in dominant deformation kinematics, conditions, and mechanisms as a function of depth inside NEGIS.
Here, we focus on the investigation of the large-scale (hundreds of metres) and mesoscale (m) changes in CPO with depth and derive the second-order orientation tensor's eigenvalues to explore the CPO and ice anisotropy with depth. We further compare the CPO development to other ice cores from Greenland and Antarctica, aiming to highlight the unique characteristics of ice streams by considering different dynamical settings.
2.1 The EastGRIP ice core
The EastGRIP deep drilling succeeded in retrieving the first continuous ice core through an active ice stream. The drilling site is located at 75°38.16′ N, 35°59.35′ W (Fig. 1a), 2708 m a.s.l. (metres above sea level) (May 2024), roughly 10 km away from the shear margins of NEGIS (Fig. 1b and c), the most significant ice stream in Greenland in terms of ice transport towards the margin (Fahnestock et al., 1993). The surface ice flow velocity at EastGRIP is ∼ 55 m yr−1 (Hvidberg et al., 2020), but the velocity, location, and flow dynamics of NEGIS probably changed throughout the Holocene (Franke et al., 2022; Jansen et al., 2024). Upstream of EastGRIP, the surface velocity and width of NEGIS are smaller, while it widens into faster flow downstream of the drill site (Fig. 1a) (Hvidberg et al., 2020). The site is characterised by an ice thickness of approximately 2667 m and an annual mean surface temperature of −28.7 °C (Vandecrux et al., 2023).
Electromechanical drilling with the established Danish Hans-Tausen-style drill retrieving 98 mm diameter cores started in 2016. Drilling had to be stopped in 2020 and 2021 due to the COVID-19 pandemic. Drilling resumed in 2022, and bedrock, consisting of water-saturated fine-grained sediment, was reached in August 2023 at a depth of 2667.7 m. The bubble lock-in depth at EastGRIP is between 58 and 61 m in depth (Westhoff et al., 2024). Ice temperature (Fig. 1d) is approximately −32 °C to a depth of 1200 m. Temperature increases below this, with gradually increasing thermal gradients to 2000 m, where the temperature is −25 °C. There is a constant thermal gradient to the final measurement at 2665 m, just above the base of the ice, where the temperature is −2.47 °C, which is slightly below the pressure melting point.
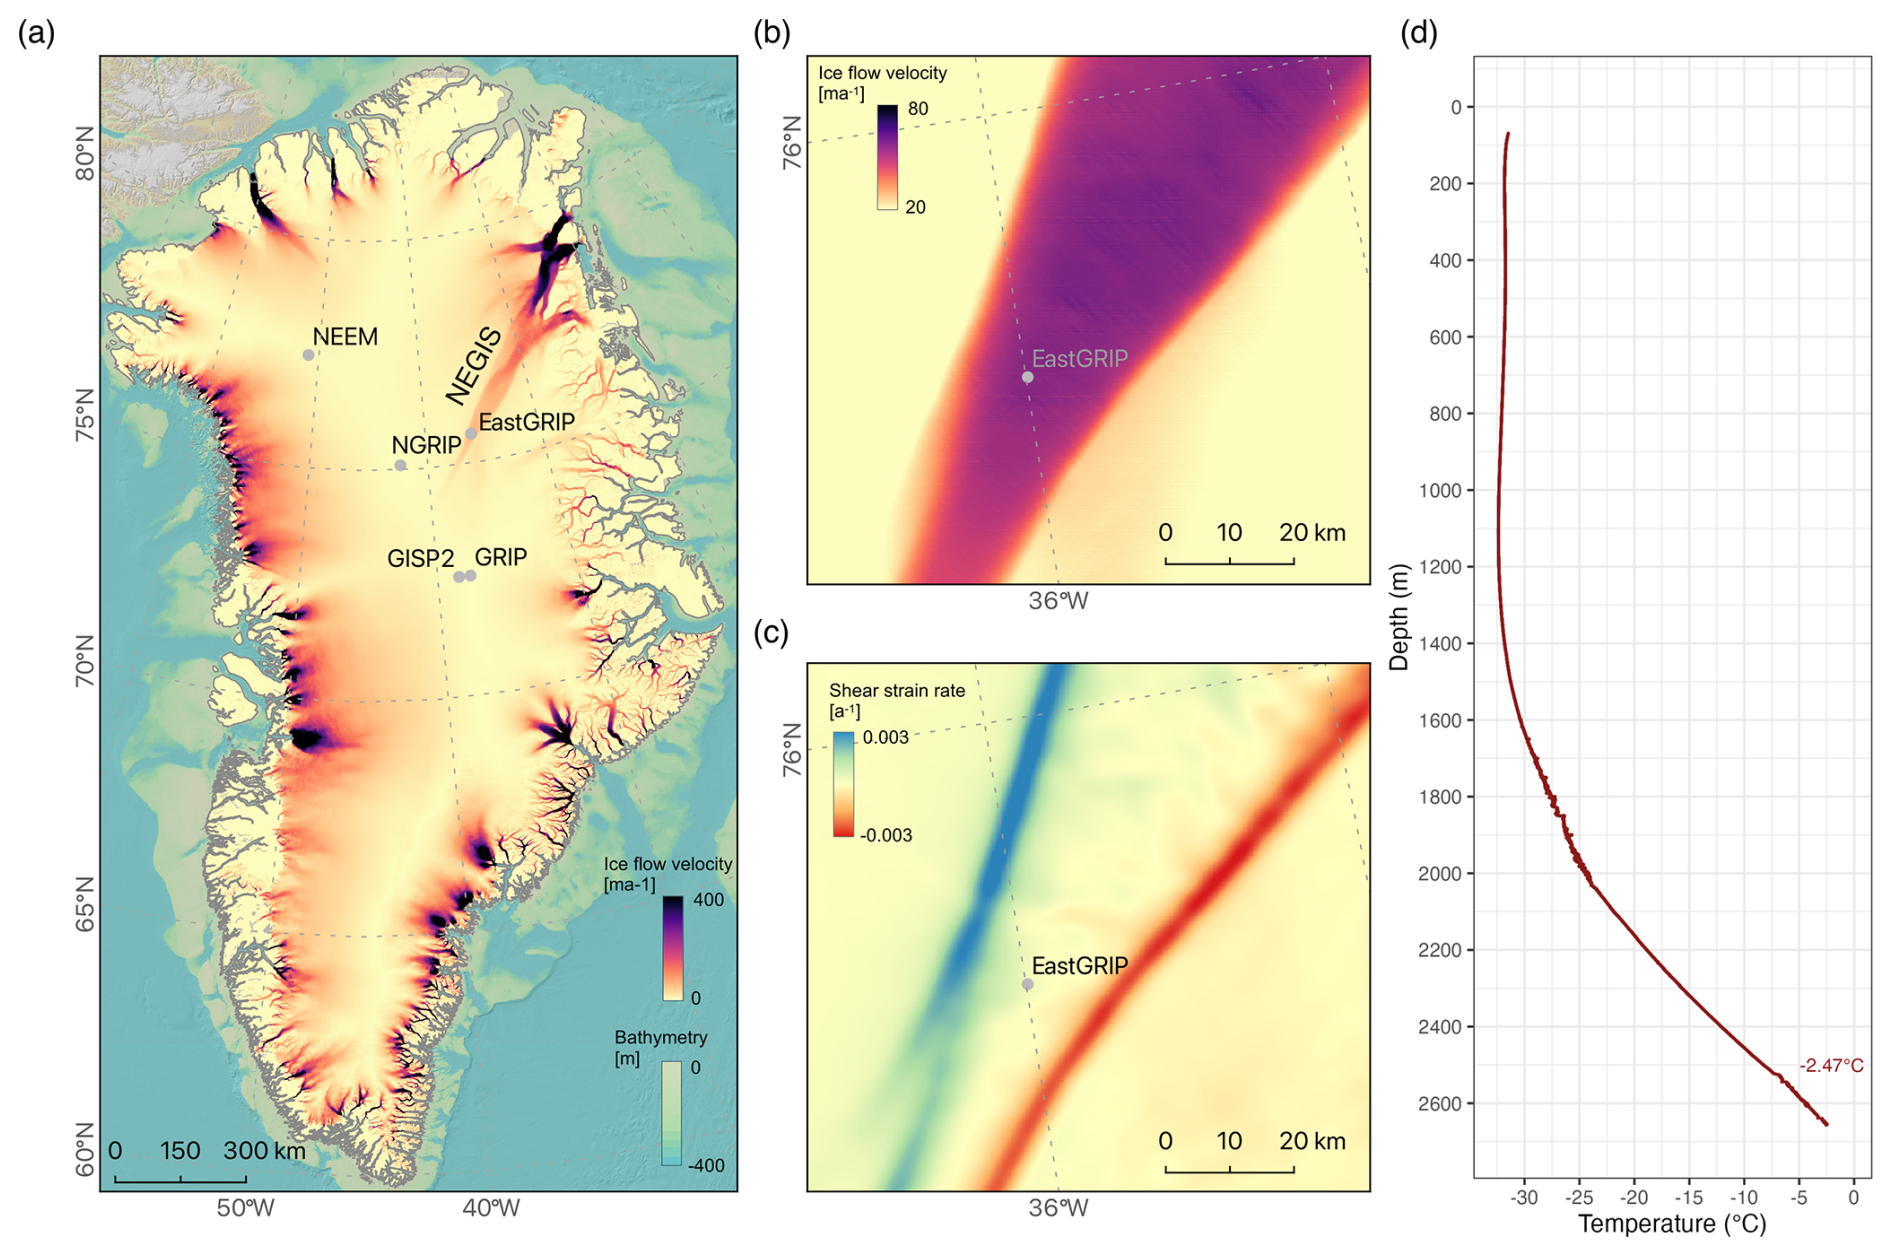
Figure 1(a) Overview of the surface ice flow velocity of Greenland (MEaSUREs ice velocity dataset (Joughin et al., 2010a, b)). NEGIS and some deep-ice coring sites are indicated. (b) Detailed view of the NEGIS surface-ice flow velocity close to EastGRIP and the (c) derived shear strain rates in the horizontal plane. (d) Temperature profile of the borehole derived from borehole logging on 17 May 2024. Data from 9 July 2023 are shown below 2610 m because the logger could not go deeper in 2024 due to a glycol cavity at this depth. The deepest measurement is −2.47 °C, slightly below the pressure melting point.
2.2 Sample preparation
At the EastGRIP drill site, roughly every 5–15 m in depth, we cut 0.55 m long ice core pieces parallel to the core axis into six sections of 92 × 70 mm (“vertical sections”). In situ core orientation, i.e. the azimuth angle, is not recorded directly during drilling, as oriented drilling is still challenging. While this lack of orientation is not a constraint on obtaining results from the data analysis, it may limit the interpretation. The core azimuth with reference to geographic coordinates could only be reconstructed at specific depths using visual stratigraphy (Westhoff et al., 2021).
Unless indicated otherwise, the results presented were carried out on vertical sections. This enables the continuous analysis of the variations in CPO with depth within consecutive 55 cm sections. Roughly every 100 m, “horizontal sections” of 100 mm in length were taken from core volume samples, providing snapshots of the microstructure orthogonal to the core axis and thus enhancing the representation of the three-dimensional shape of crystals with two-dimensional measurements.
For a combined analysis of microstructure and CPO, samples were cut into thick and thin sections with thicknesses of 130–160 mm and 0.3 mm, respectively. The remaining pieces were used for measurements of impurity distribution in the microstructure (e.g. Stoll et al., 2021a, 2022, 2023; Bohleber et al., 2023). The samples were glued onto clean glass plates with water droplets and microtomed with a Leica microtome sledge. A sharp blade enables micrometre-precise polishing via a micrometre screw, adjusting the distance between the blade and the stage. Each sample was left to sublimate under controlled conditions at the ambient temperature in the trench (−28 to −18 °C) for the required time, usually ca. 1 h, to increase the visibility of grain boundaries as they develop into sublimation grooves (e.g. Weikusat et al., 2009) and to smooth the surface roughness affected by the polishing.
2.3 CPO and grain size measurements with the fabric analyser
We used the automatic fabric analyser G50 manufactured by Russel-Head Instruments in the field shortly after drilling. The instrument automatically measures the CPO (Wilson et al., 2003) inside each thin section. We analysed 1152 vertical and 66 horizontal sections over five field seasons (2017–2019, 2022–2023) from 165 continuous 55 cm ice core sections. Due to varying ice core quality, volume samples, and time constraints, the remaining measurements come from less continuous sections. The measurements cover an ice depth range within the ice stream from 111 to 2663 m, which is almost the depth of the bedrock. Ice from the brittle zone (approximately 650–950 m (Westhoff et al., 2022)) was measured a year later to avoid samples breaking easily before relaxation. Between 2120 and 2417 m, no CPO data were measured due to the time delay caused by the COVID-19 pandemic.
The fabric analyser uses polarised-light microscopy to derive the orientation of the c axis using the birefringence of polarised light in optically anisotropic media. Thus, it is possible to measure one part of the full-crystal orientation, i.e. the orientation of the main crystallographic axis, the c axis. One standard measurement with a 20 µm spot size takes roughly 45 min for a sample with dimensions of 92 × 70 mm.
2.4 Fabric analyser data processing
Raw image data were manually corrected to exclude artificial ice crystals that originate from the preparation process of the thin sections (Fig. A1). The corrected data are analysed with the software cAxes (Eichler, 2013). Threshold criteria regarding, for example, minimum crystal sizes (500 px equaling 0.2 mm2), misorientation (1°), and sample quality, were applied. The data derived contain information about physical properties, such as the c-axis distribution and grain size. Grain area is calculated by transforming the pixels of single grains from the previously derived grain boundary network into mm2, yielding more exact results than older techniques, such as measuring the longest grain diameter or only measuring a certain percentage of the largest grains. We here display the most common parameters to enable an overview of the core regarding deformation regimes.
2.5 Eigenvalues and fabric patterns
To analyse the shape and strength of the fabric data measured, the eigenvalues of the second-order orientation tensor for each sample are calculated. The measured c-axis orientations in polar coordinates are converted into Cartesian coordinates, followed by the determination of the orientation tensor via standard structural geology methods (Wallbrecher, 1986). The c-axis distribution can be displayed as an ellipsoid, with the eigenvectors representing the three orthogonal unit vectors along its axes that originate from the centre of the ellipsoid (Woodcock, 1977). The lengths of the axes are represented by the invariant eigenvalues (e1, e2, e3), which are usually normalised (λ1, λ2, and λ3). They obey the conditions and λ1≤λ2≤λ3. The dominant fabric type can be determined using the eigenvalues according to the following rules:
-
random fabric – λ1≈λ2≈λ3 (spherical shape)
-
single maximum – and (prolate-ellipsoid shape)
-
girdle fabric – λ1<λ2≈λ3 (oblate-ellipsoid shape).
However, the meaningfulness of second-order orientation tensor eigenvalues is limited due to their inability to differentiate between certain fabric types. For example, discriminating between multi-maxima and isotropic distributions is not possible. Thus, utilising additional data representations, such as (contoured) stereographic projections (provided in the Supplement), are required to fully evaluate CPO patterns.
2.6 Dielectric profiling
Dielectric profiling (DEP) enables, before cutting and processing the core, the fast and non-destructive scanning of both the electric conductivity and the permittivity. At EastGRIP, DEP was performed on site with the device introduced by Wilhelms et al. (1998) shortly after drilling to quickly locate the positions of volcanic events and changes in chemical constituents. Conductivity in ice is mainly impacted by the acidity and the salt and ammonia concentrations (Moore et al., 1992). A detailed description of the instrument, the established procedure at EastGRIP, and DEP data can be found in Mojtabavi et al. (2020). We here extend the DEP record to the deepest 260 m.
2.7 Electrical conductivity measurements
We made electrical conductivity measurements (ECMs) with the technique originally described by Hammer (1980), with details given for the current setup by Mojtabavi et al. (2020). The ECM signal is related to the acidity of the core, and the high-resolution signal is beneficial for identifying volcanic signals (peaks in ECM) and layers with high NH4 concentration (troughs in ECM). The records are used for peak and pattern matching, where sequences of peaks are assumed to represent the same sequence of events in the matched cores. The signal's relation to the absolute acidity is largely uncalibrated. Still, as the same method and setup have been used for NorthGRIP, NEEM, and EastGRIP, the records are comparable in this regard. Data processing was carried out as described in Mojtabavi et al. (2020).
2.8 Chronology
Annual-layer identification is possible in at least the upper parts of the EastGRIP ice core but has so far only been completed for the most recent 3.8 ka b2k (b2k: thousands of years before 2000 CE) (Sinnl et al., 2022). For most of the core, the Greenland Ice Core Chronology 2005 (GICC05; Vinther et al., 2006; Rasmussen et al., 2006; Andersen et al., 2006; Svensson et al., 2006), which is based on annual-layer identification in the DYE-3, GRIP, and NorthGRIP ice cores, has instead been applied to the EastGRIP ice core based on the assumption that peaks and common patterns in the ECM and DEP data represent isochrones. The tools and methodology are described in Seierstad et al. (2014), and here, we extend the work of Mojtabavi et al. (2020) and Gerber et al. (2021), which provided similar transferred timescales for EastGRIP reaching back to 15 ka and 49.9 ka b2k, respectively. Here, we only describe where our procedure or results differ from what has been described in these papers.
Two observers independently aligned the ECM and DEP records of EastGRIP and NorthGRIP. Only minor differences related to things such as ambiguous peak shapes were found between the two sets of match points, which were then combined into one set of match points. The result is 108 tie points between EastGRIP and NorthGRIP for the period older than 49.9 ka b2k (corresponding to EastGRIP depths of 2117 m and below). More details can be found in the Appendix A2.
The ECM and DEP records can be matched with high confidence to the Greenland interstadial (GI) 23.1 at about 104 ka b2k (Fig. 2). The short-lived GI-23.2 is well-resolved in the NorthGRIP ice core but is missing in both NEEM and EastGRIP. A less certain but still credible match of GI-24 allows us to extend the timescale to about 108 ka b2k, but below this, the resemblance of the signals between cores drops, and several possible alignments of the records are possible. We thus refrain from assigning ages to the part of the record below GI-24.
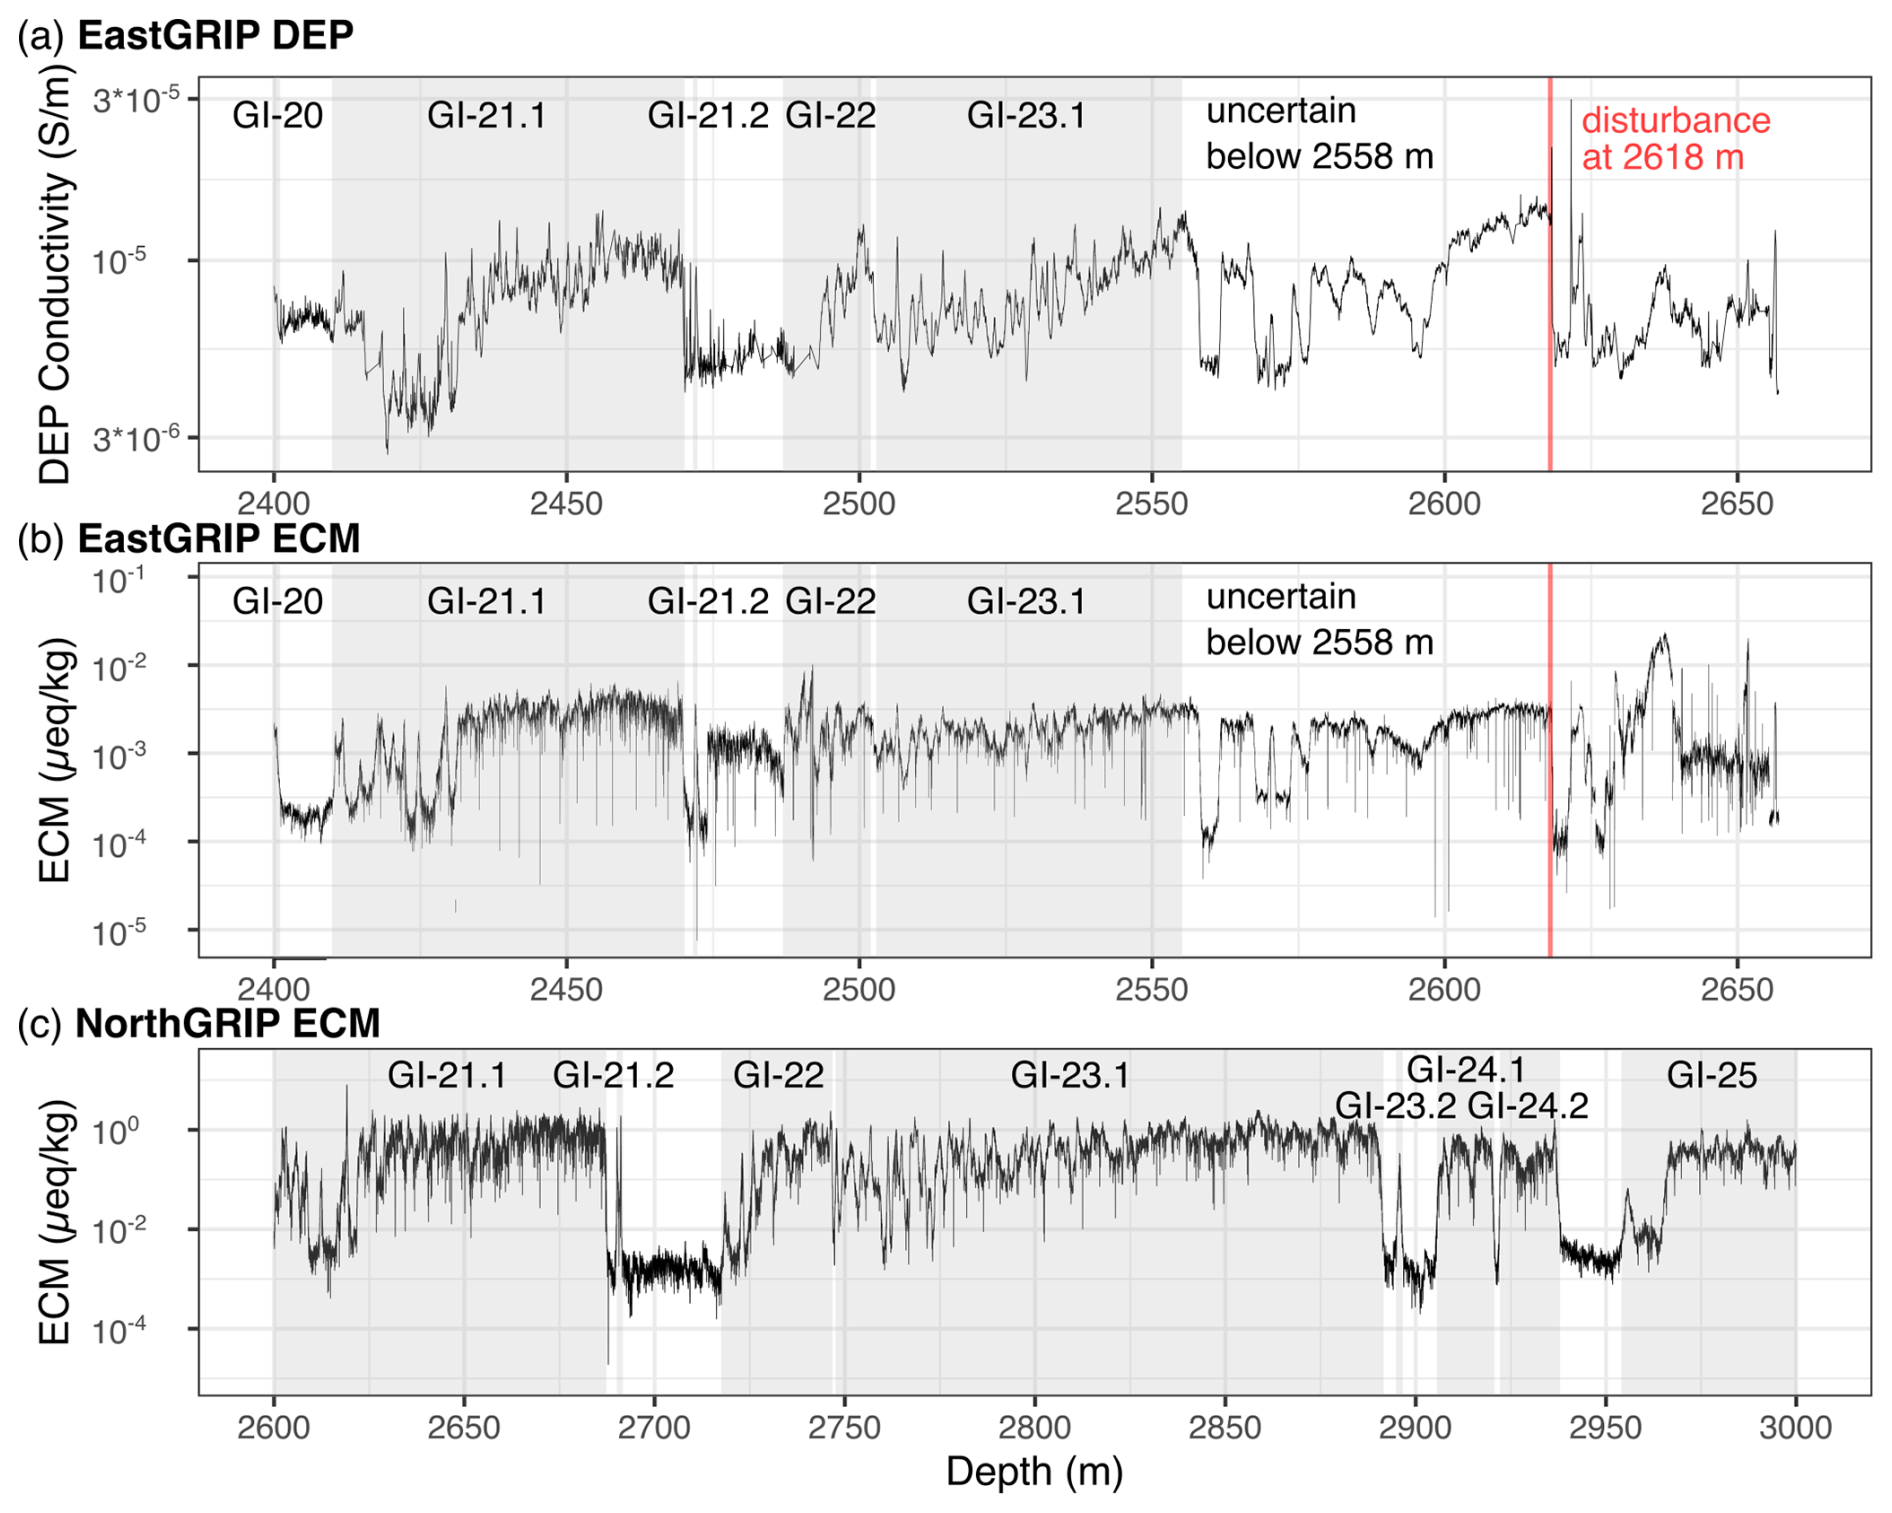
Figure 2(a) DEP and (b) ECM data from the deepest 260 m compared to (c) NorthGRIP ECM (Rasmussen et al., 2013) data. Greenland interstadials (GIs) are shown following Rasmussen et al. (2014). The EastGRIP timescale is uncertain below 2558 m. s/m is siemens per metre.
In the deepest section (below 2550 m), we observe a lack of sharp features and note that the transitions into and out of interstadials become more gradual, often spanning 0.5–1 m, adding to the alignment uncertainty in the oldest sections. The annual-layer thickness is about 11 cm just below the firn, 2 cm at 50 ka b2k, and just a few millimetres at 100 ka b2k, leading to a correspondingly large variation in timescale transfer uncertainty when measured in years. The interpolation uncertainty is mainly controlled by the distance to the nearest match point, and the largest uncertainty is therefore expected in the middle of the longest stadials (e.g. GS-18 and GS-19.1) and within the middle of GI-23.1, where we did not identify any match points. It is thus not possible to derive a simple estimate of the timescale transfer uncertainty, and we urge users to be cautious when interpreting offsets between features found in the NorthGRIP, NEEM, and EastGRIP records.
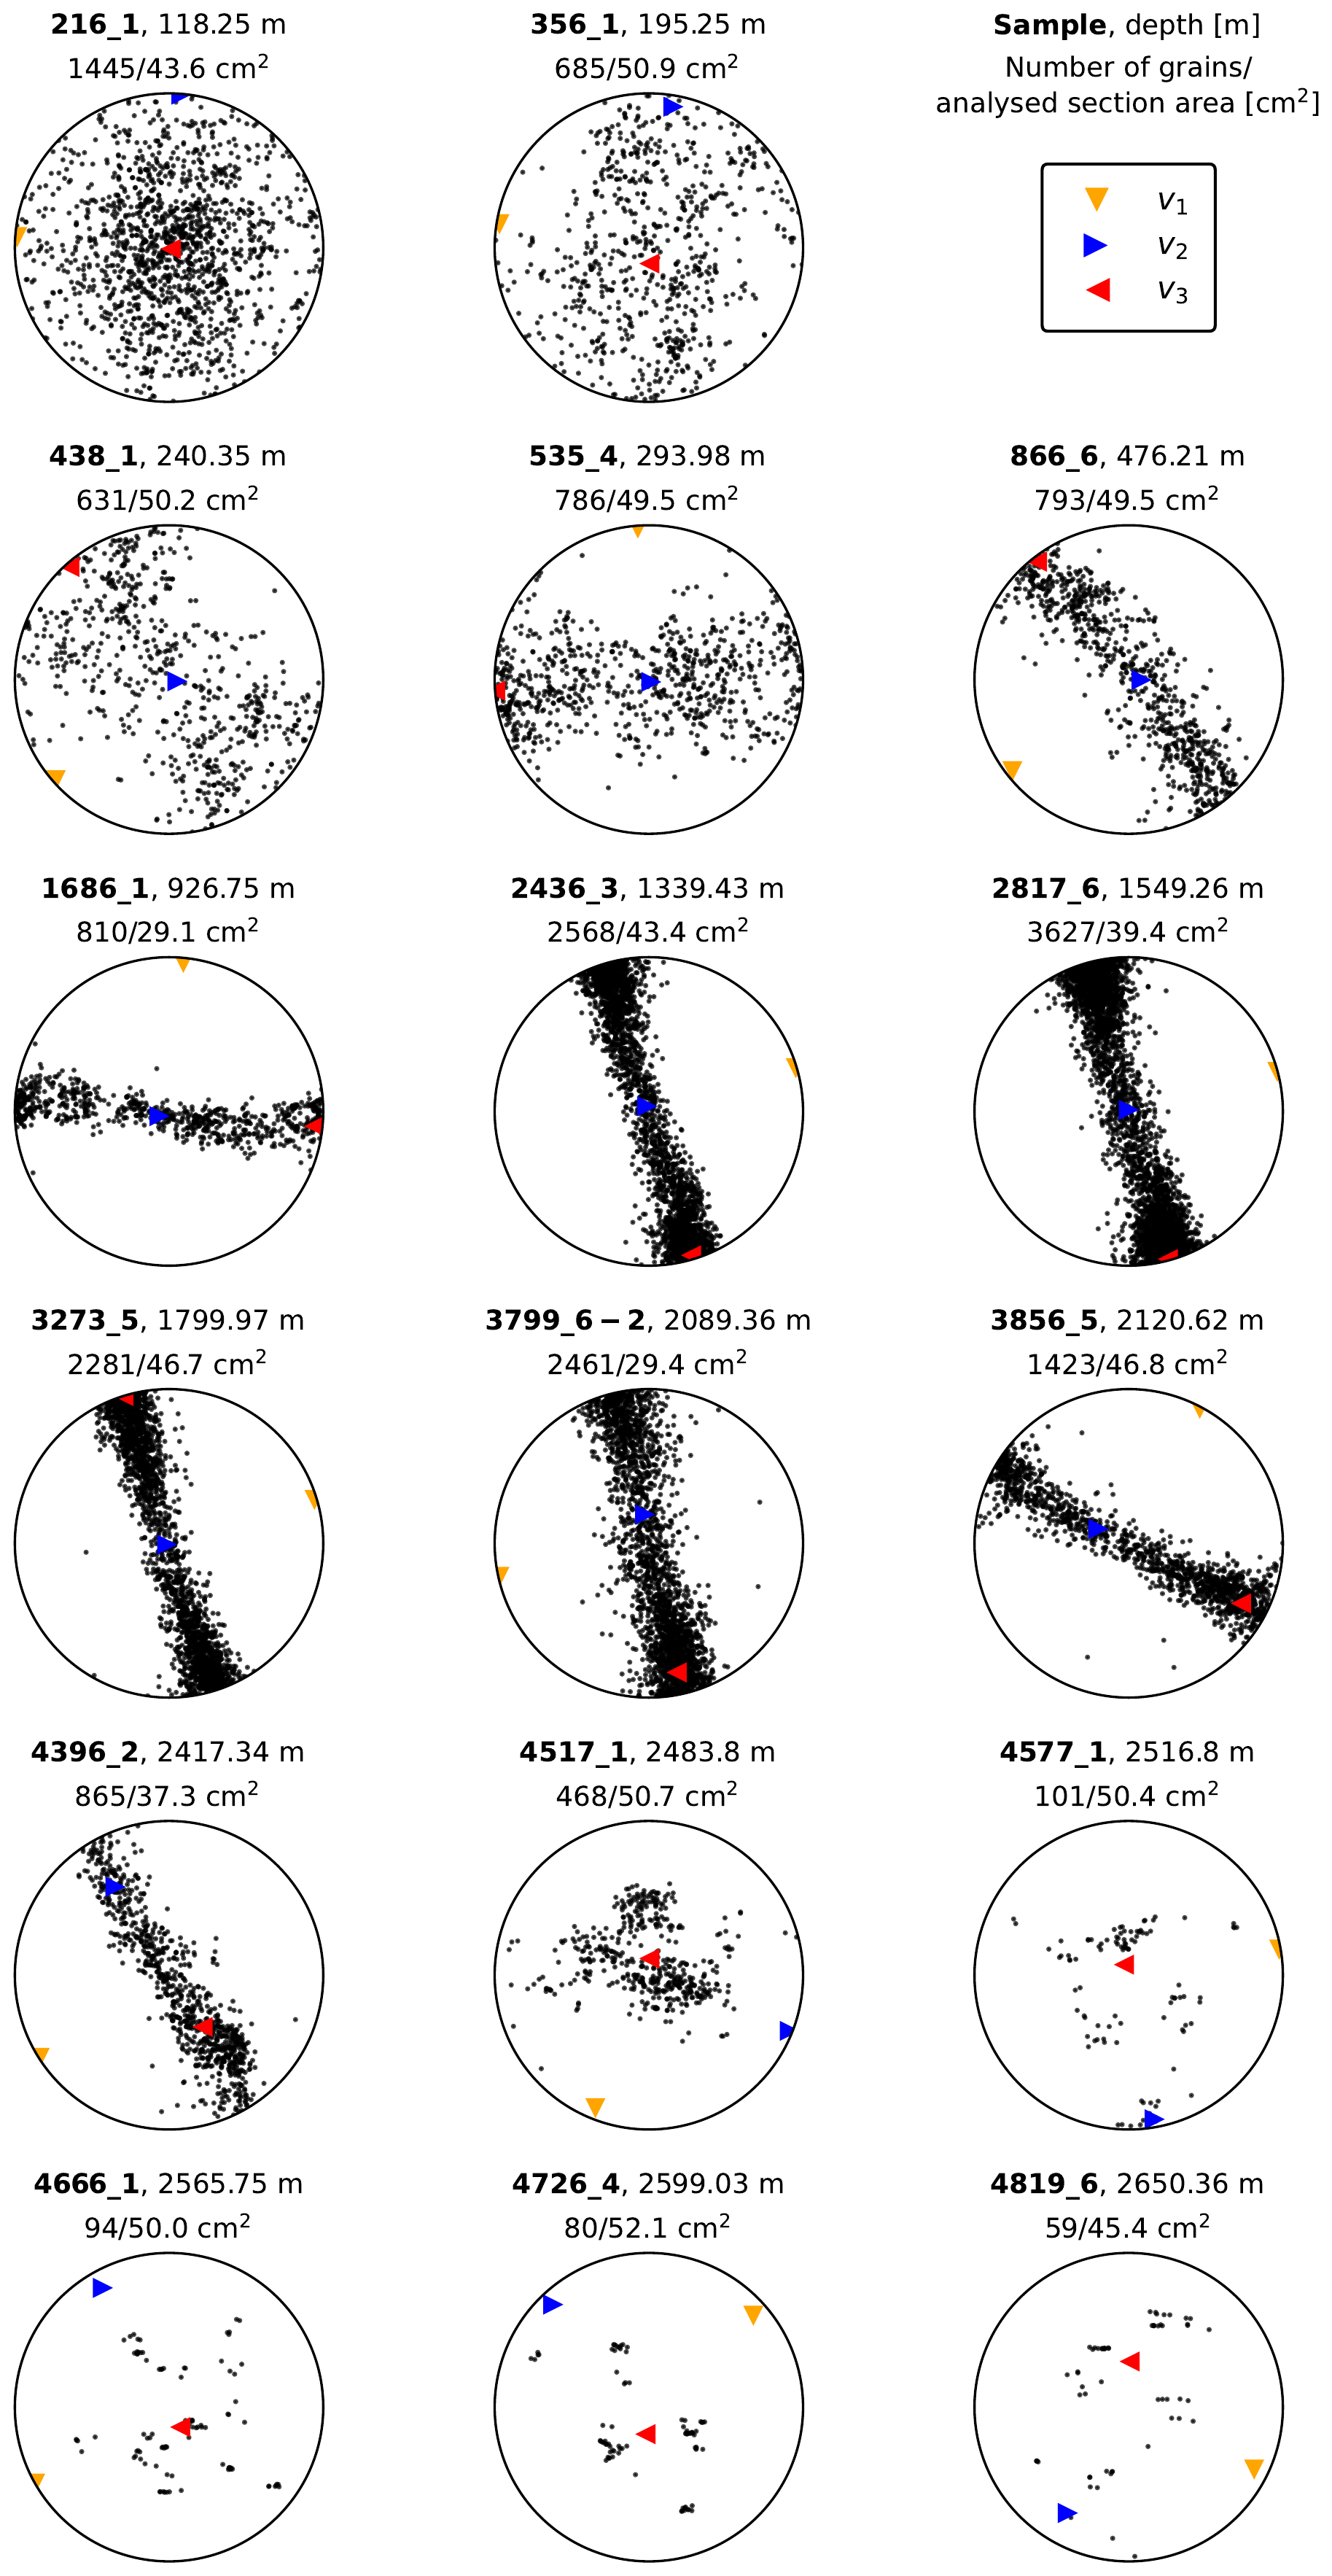
Figure 3Representative selection of CPO patterns at EastGRIP displayed as equal-area lower-hemisphere projections. Depth, bag number and section, eigenvectors, the number of crystals analysed, and the sum of the crystal area analysed (cm2) are indicated. The original azimuthal orientation is not preserved. All pole figures are provided in the Supplement.
3.1 CPO patterns in the EastGRIP ice core
The c-axis distributions, displayed as a selection of representative pole figures in Fig. 3 (all pole figures are provided in the Supplement), reveal a pattern that has not been observed so far in a deep-ice core. To enable the interpretation of the present CPO patterns, we must classify them and their respective depth regimes (Table 1). Most patterns are subject to gradual transitions, and the chosen depth regimes are inevitably subjective approximations biased by the available data and can not be regarded as clearly defined.
The first 85 m, starting at an absolute depth of 111 m, shows a weak, broad, single-maximum CPO. With depth, this CPO pattern strengthens, and the c axes are oriented more towards the vertical, which could be interpreted as weak girdles.
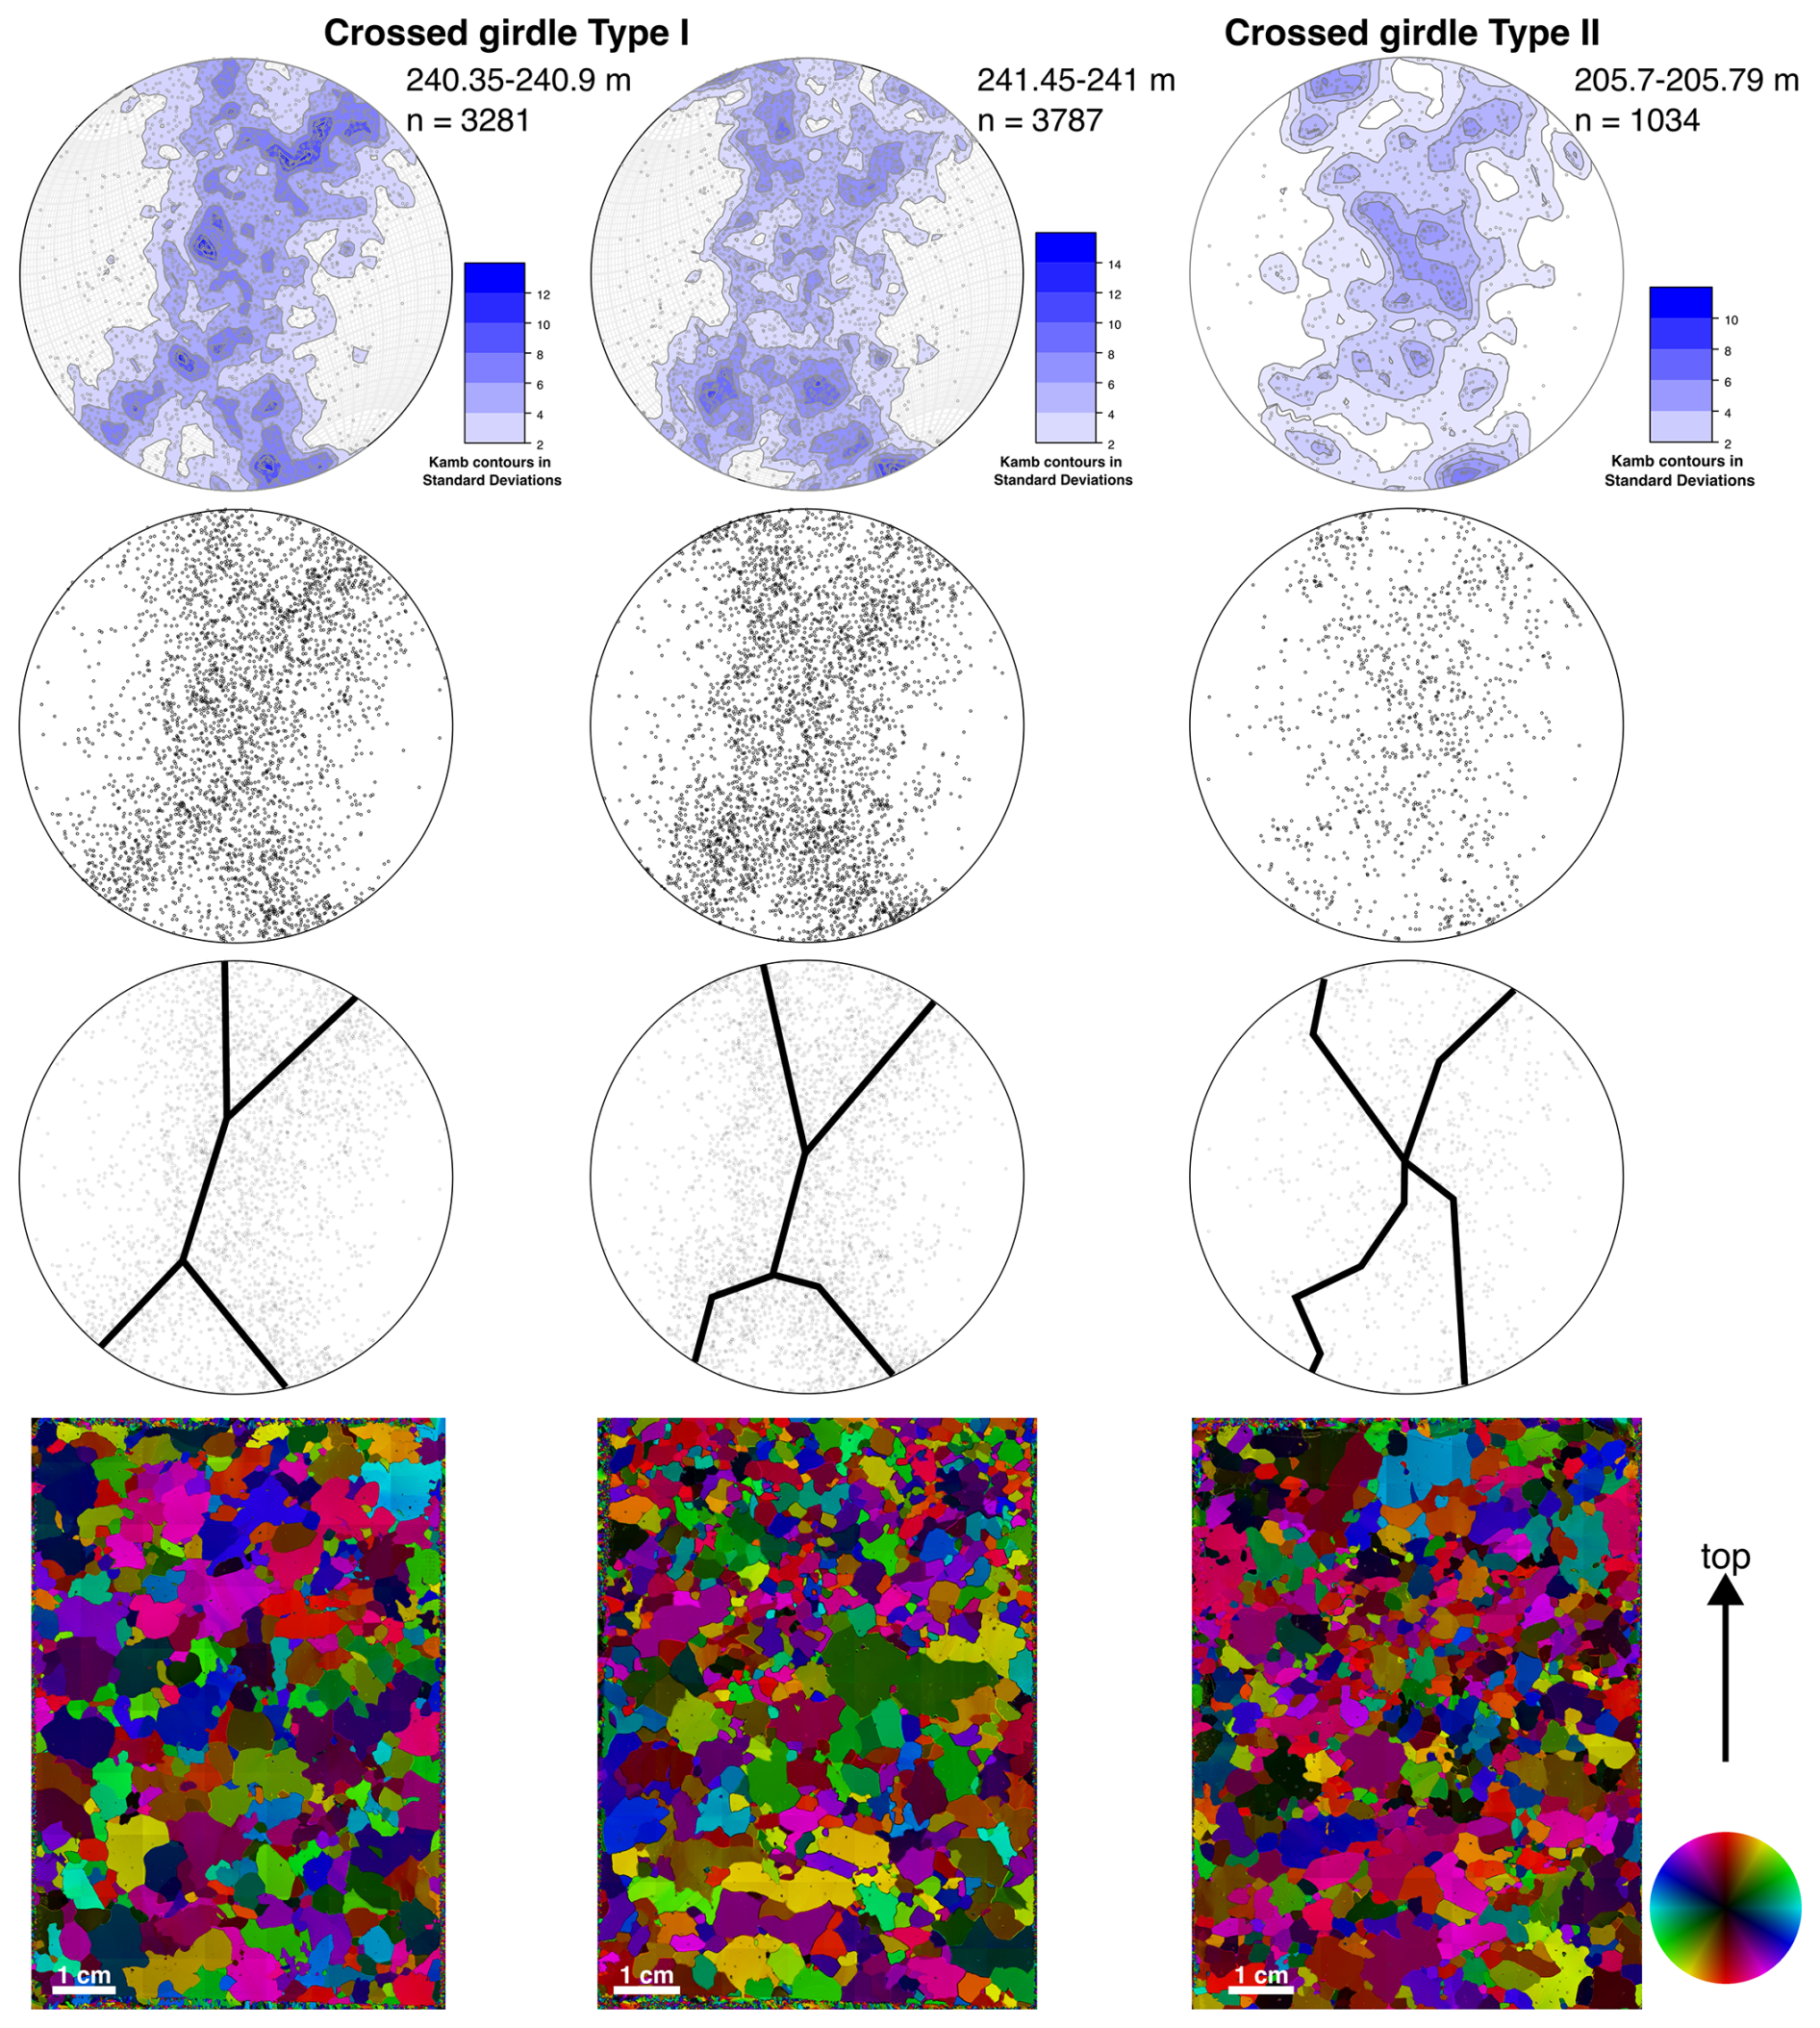
Figure 4Representative examples of crossed-girdle CPOs in the EastGRIP ice core and the respective microstructures (c-axis orientations are indicated by the colour wheel; “top” points towards the surface of the ice sheet). Displayed are downwards direction equal-area lower-hemisphere Kamb contour plots (Kamb, 1959), point plots, and fabric skeletons constructed from contoured c-axis plots. The sample from 205.7 m depth represents a type-II crossed girdle. The two examples of type-I crossed girdles are compiled from six consecutive thin sections over 55 cm to increase visibility. Note the differences in the legends.
Between 196 and 294 m, we describe, for the first time in natural or experimentally deformed ice, crossed-girdle CPOs (Fig. 4). Crossed-girdle CPOs are defined by a meeting of the “limbs” of circle girdles forming type I (Christie, 1963; Hara et al., 1973), type II (Sylvester and Christie, 1968; Lister, 1977), and transitional stage CPOs. Type I is characterised by two girdles meeting at some distance from each other while being connected by a single girdle. Type II is characterised by the direct meeting of the two girdles “crossing” at one point (Schmid and Casey, 1986). We observe both types as well as transitional stages (Fig. 4 and the Supplement) and indicate them with skeletal outlines in Fig. 4. Crossed-girdles are strongest between 205 and 242 m. They vary in type and strength from sample to sample. The observed limbs are differently distinct and, for type II, vary in their meeting point with regard to the vertical axis. Despite a high sampling resolution of measurements up to every metre in this depth regime, no continuous CPO development trend is visible. Between 294 and 500 m, the crossed-girdle CPO (pronounced at e.g. 366 and 398 m; see Supplement) transitions into a broad vertical-girdle CPO.
The vertical-girdle CPO is fully formed from roughly 500 m in depth. It increases in strength down to 1230 m; i.e. the girdle gets narrower. The vertical girdle often shows horizontal maxima of varying strength, which are fully established below 1394 m and occur down to 2418 m. Around 2418 m, grain sizes are large, and the number of measured c axes thus decreases, resulting in less pronounced CPOs.
Between 2500 and 2663 m, the c axes exhibit a multi-maxima CPO (Figs. 3 and 5). Most samples exhibit four to five maxima, which are centred around the vertical axis. Centimetre-sized crystals with amoeboid shapes and curved grain boundaries are abundant at this depth. However, the number of measured crystals (21–168) is usually still sufficient to identify CPO patterns.
At the depth interval of 2608–2618 m, crystals are several centimetres in length (see Sect. 3.4) and therefore are not sufficient in number to measure in the samples. We combined data from six adjacent samples to yield suitable statistics with several hundreds of data points.
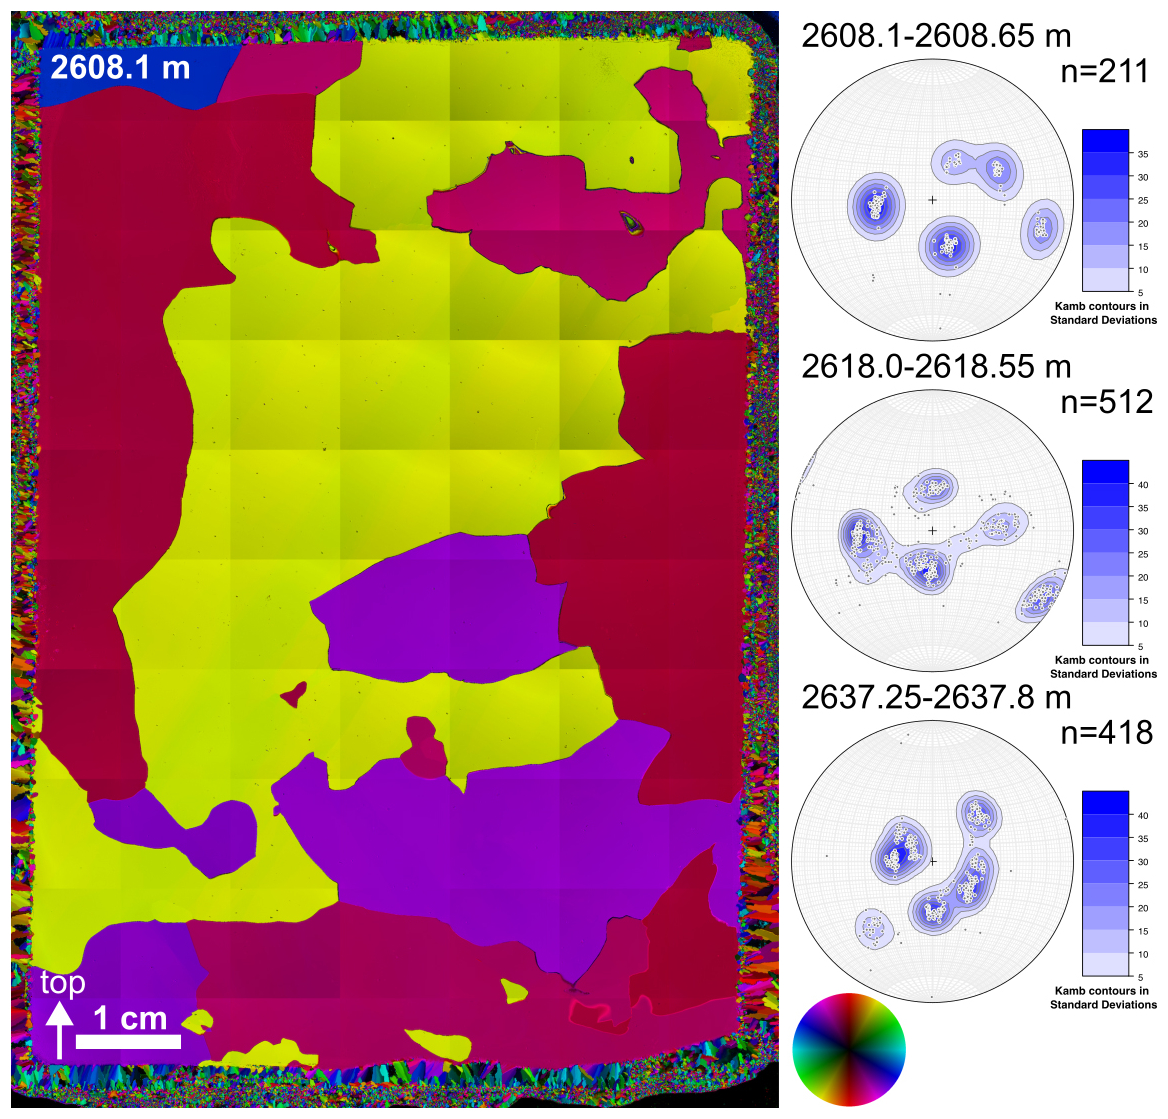
Figure 5Example of the microstructure at 2608.1 m in the c-axis-orientation colour scale (see colour wheel on the bottom right). Adjacent are three representative multi-maxima CPOs with Kamb contours (Kamb, 1959) compiled from six consecutive thin sections over 55 cm. The middle plot displays the interface between Eemian and glacial ice, probably due to a stratigraphic disturbance. Projections and annotation are as in Fig. 3 note the slight differences in the legends.
Table 1Approximate depth regimes of the present CPO patterns at EastGRIP. In reality, CPO patterns are subject to gradual transitions, and the specified depths are chosen for simplicity. The transition zones mentioned in the table are not displayed separately but are visible in the Supplement.
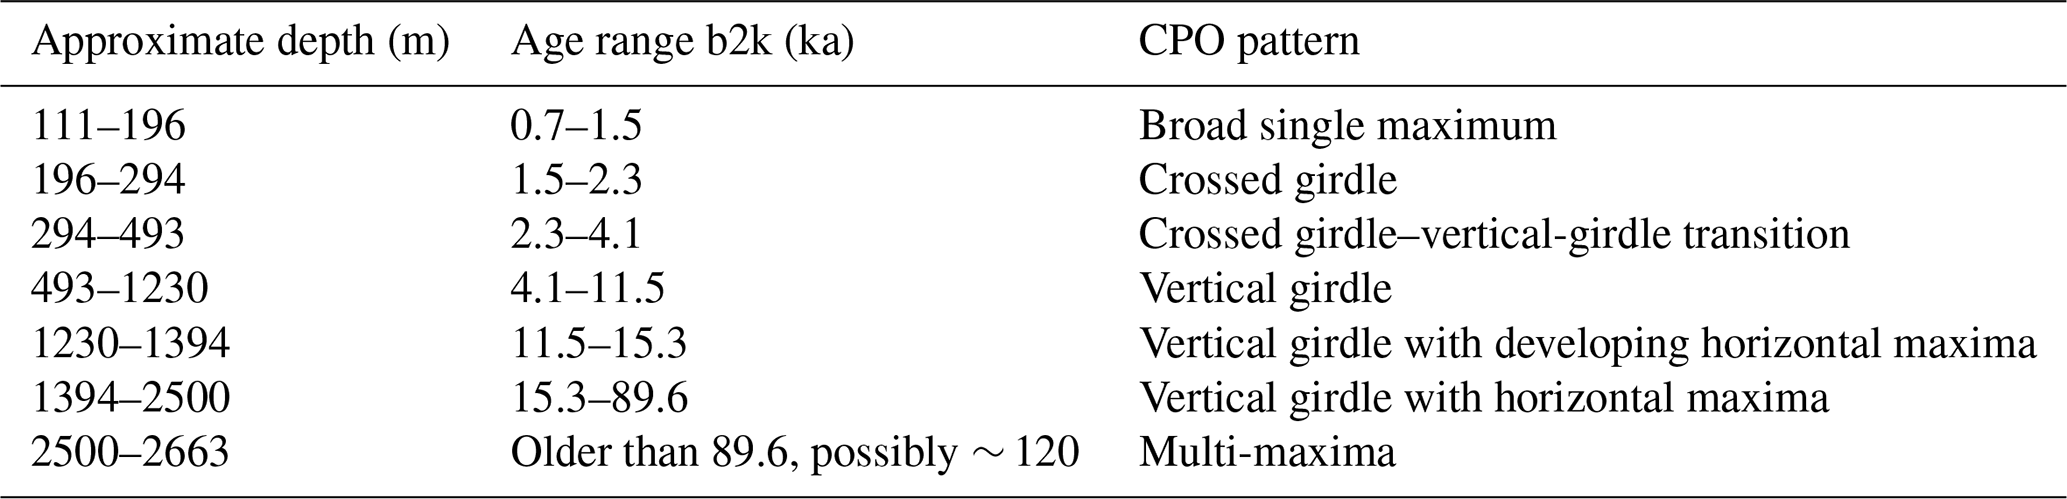
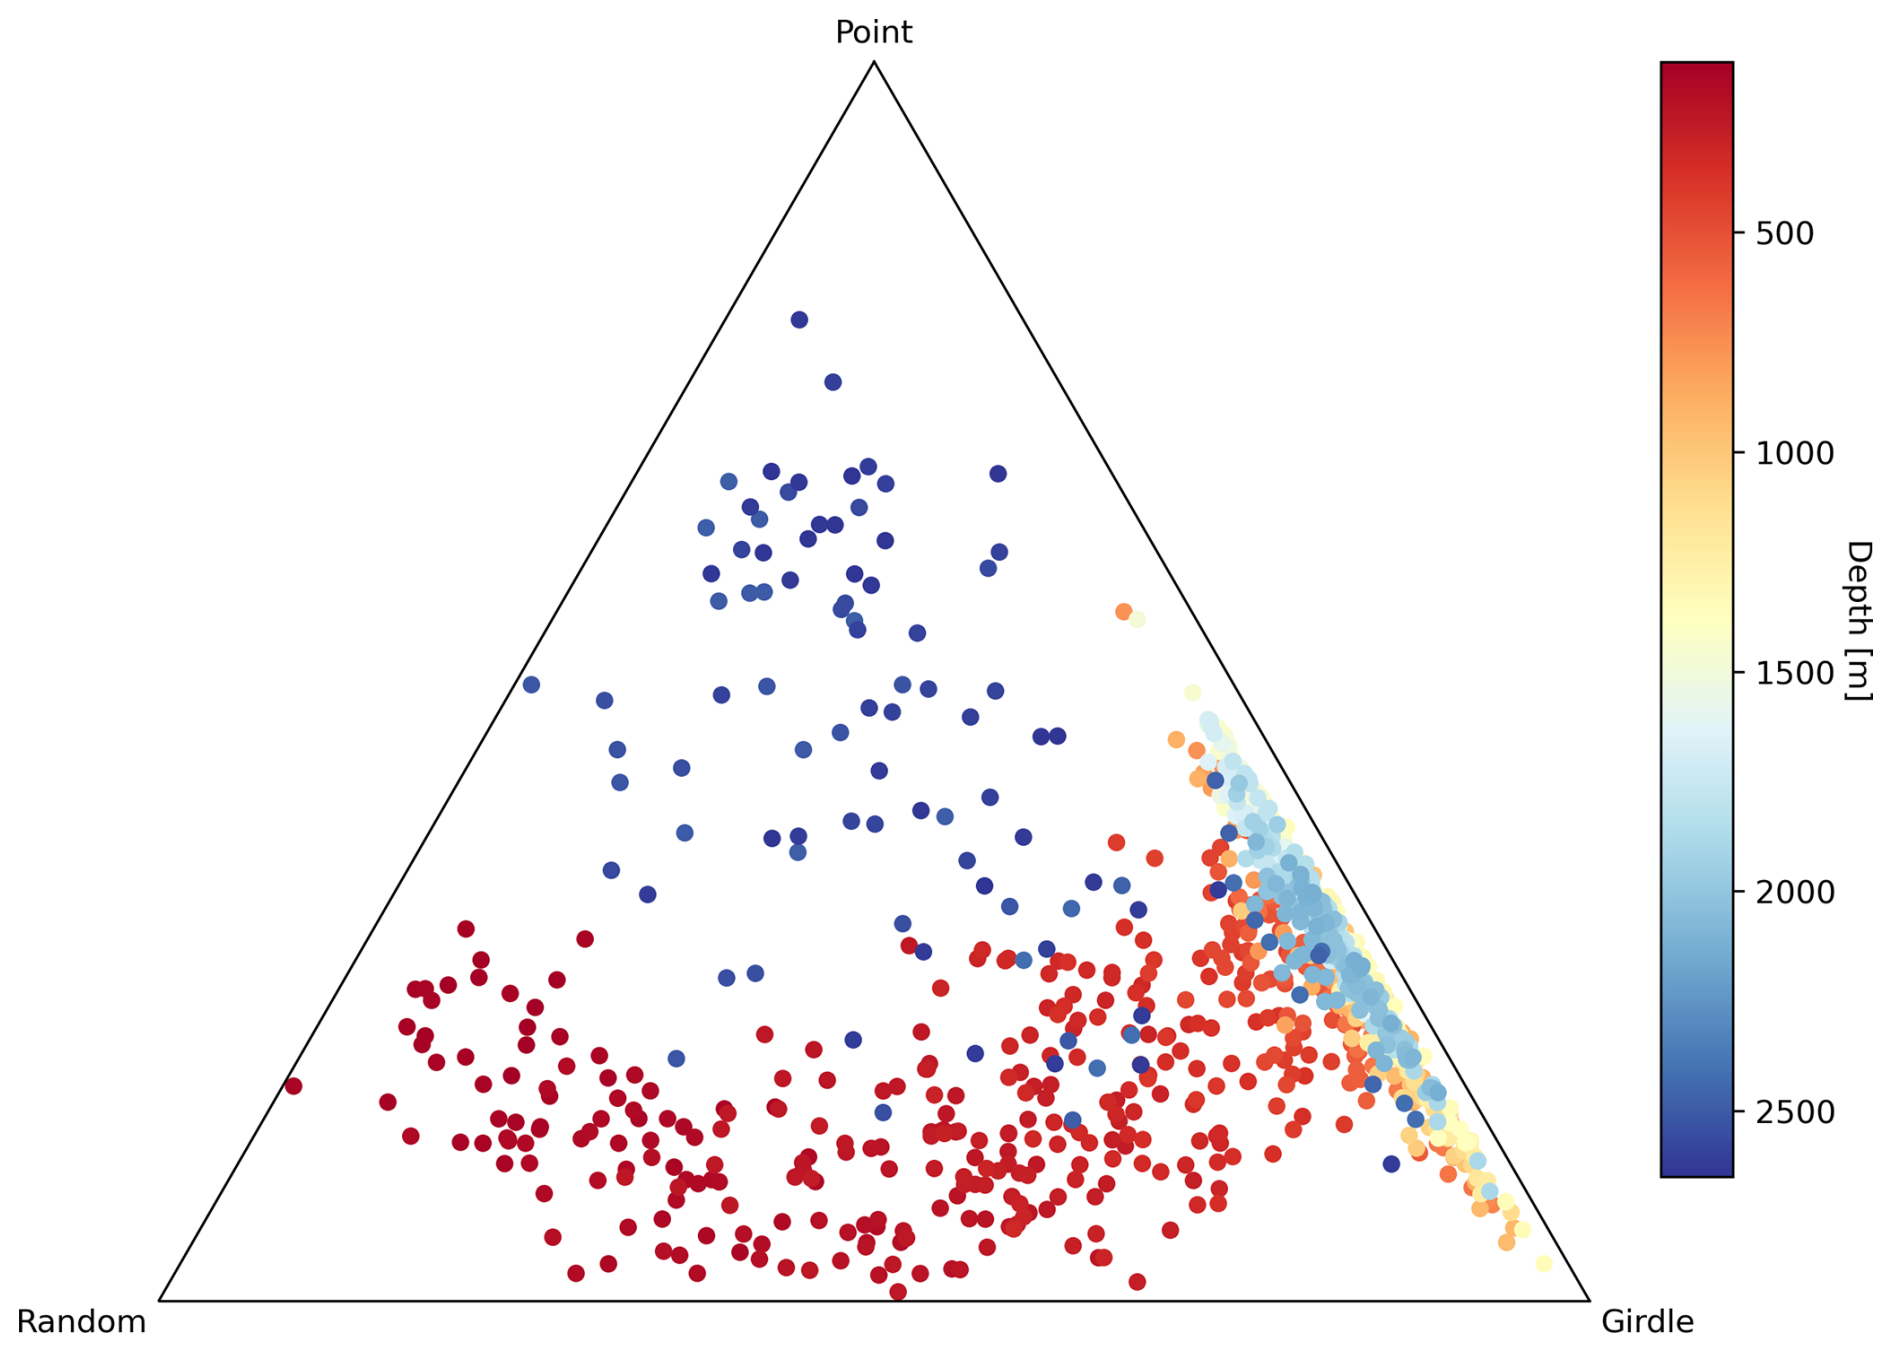
Figure 6Triangular (ternary) diagram displaying the CPO data classified between random (R), point (P), and girdle (G) CPOs following Vollmer (1989, 1990). The indices P, G, and R are calculated from the grain-area-weighted eigenvalues (P = λ3−λ2, G = , R = ). Every marker represents one thin vertical section; depth is indicated by colour.
3.2 Patterns of eigenvalues with depth
We show eigenvalues as mean values per 92 × 70 mm thin section between 111 and 2663 m in depth. Figure 6 is a ternary diagram displaying the ratios of the endmembers of random, point, and girdle CPOs, summing to a constant (Vollmer, 1989, 1990). These indexes are analogous to calculations following Woodcock (1977) and display the differences between eigenvalues and not their ratios in a closed way with three, instead of two, endmembers. For EastGRIP, this shows the change in CPO with depth, transforming from random with a point component to a strong girdle. Close to bedrock, it develops into something between point and random, representing multi-maxima CPOs.
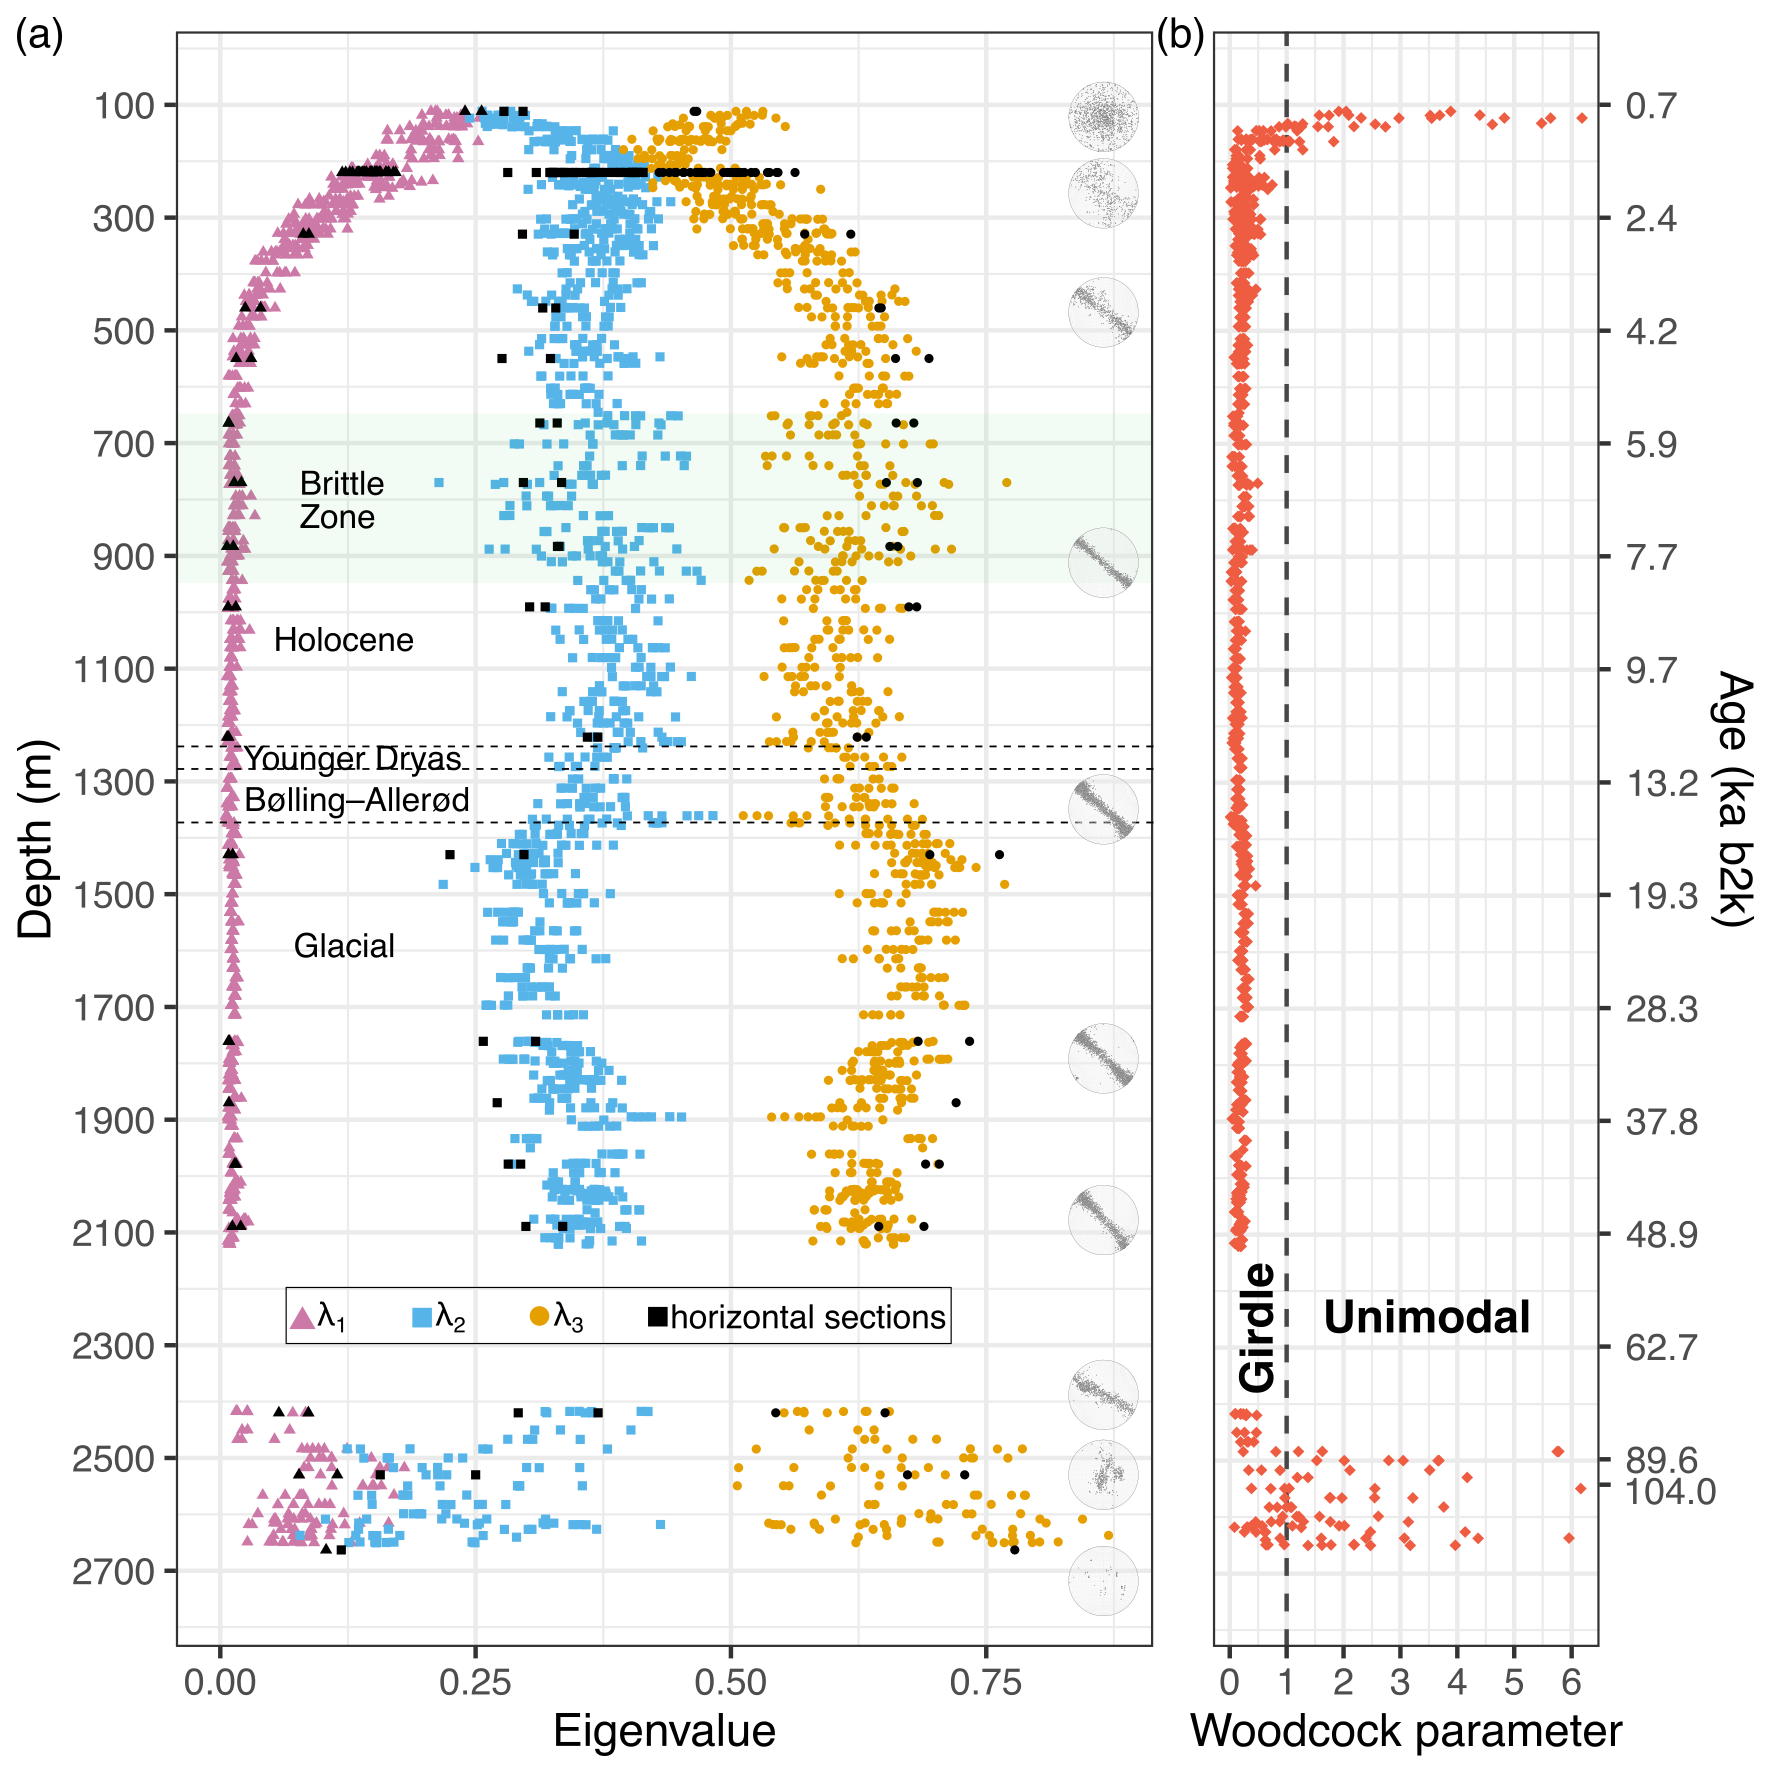
Figure 7(a) Orientation tensor eigenvalues of thin sections (9.2 × 7 cm) derived by the fabric analyser and representative CPOs. Coloured eigenvalues are from vertical sections oriented parallel to the core axis; black symbols represent horizontal sections perpendicular to the core axis. Brittle zone (Westhoff et al., 2022) and climatic periods are indicated. (b) Woodcock parameter, values above 1 represent unimodal CPOs; values below 1 indicate girdle CPOs. One outlier of 20.5 at 135.5 m in depth was excluded for better visibility. The values shown are weighted by grain area. Novel ECM and DEP data extend the timescale with certainty until 104 ka b2k.
The classic representation of the three eigenvalues with depth is shown in Fig. 7a. Between 111 and 500 m, λ1 decreases constantly and stays close to 0 until a depth of 2400 m. λ2 and λ3 start around 0.25 and 0.5, respectively, at 111 m (broad vertical-maximum CPO) and meet at 0.4 at 250 m, correlating with the fully formed crossed-girdle CPO. They separate until 550 m (vertical-girdle CPO) at which point a wavy eigenvalue pattern of λ2 and λ3 occurs (Fig. 7a). The amplitude of this wavy pattern is usually between 0.1 and 0.2, and the wavelengths range from dozens to hundreds of metres in depth. λ2 and λ3 are similar at 650, 720, 930, 1110, 1370, and 1895 m. At 2400 m, λ1 starts to increase up to 0.2, and λ2 decreases to minimum values of 0.15. Below 2550 m, λ1 and λ2 decrease and λ3 increases towards 0.8, correlating with the multi-maxima CPO. Eigenvalue variability is much greater at this depth than in shallower ice.
The Woodcock parameter (Fig. 7b) lies in the interval of 0–1 and 1–∞ for girdle and unimodal CPOs, respectively. In EastGRIP, the Woodcock parameter fluctuates between 1 and 6.2 in the shallowest 70 m analysed and decreases with depth. Between 180 and 2480 m, it is below 0.5. We detect slightly greater values between 228 and 250 m in depth. Below 2400 m, the Woodcock parameter increases and is often greater than 1. It sometimes exceeds 5 below 2483 m, correlating with the multi-maxima CPO. We excluded one outlier of 20.5 at 135.5 m in Fig. 7b, which is probably a measurement artefact.
3.3 Microstructure overview: grain size and shape
The mean grain area, from hereon referred to as grain size, is displayed in Fig. 8. Figures 5, 9, and 10 provide an overview of the grain shape and grain size distribution. A companion study will provide an in-depth quantitative analysis of high-resolution microstructure data utilising large-area scanning macroscope (LASM) data (Krischke et al., 2015).
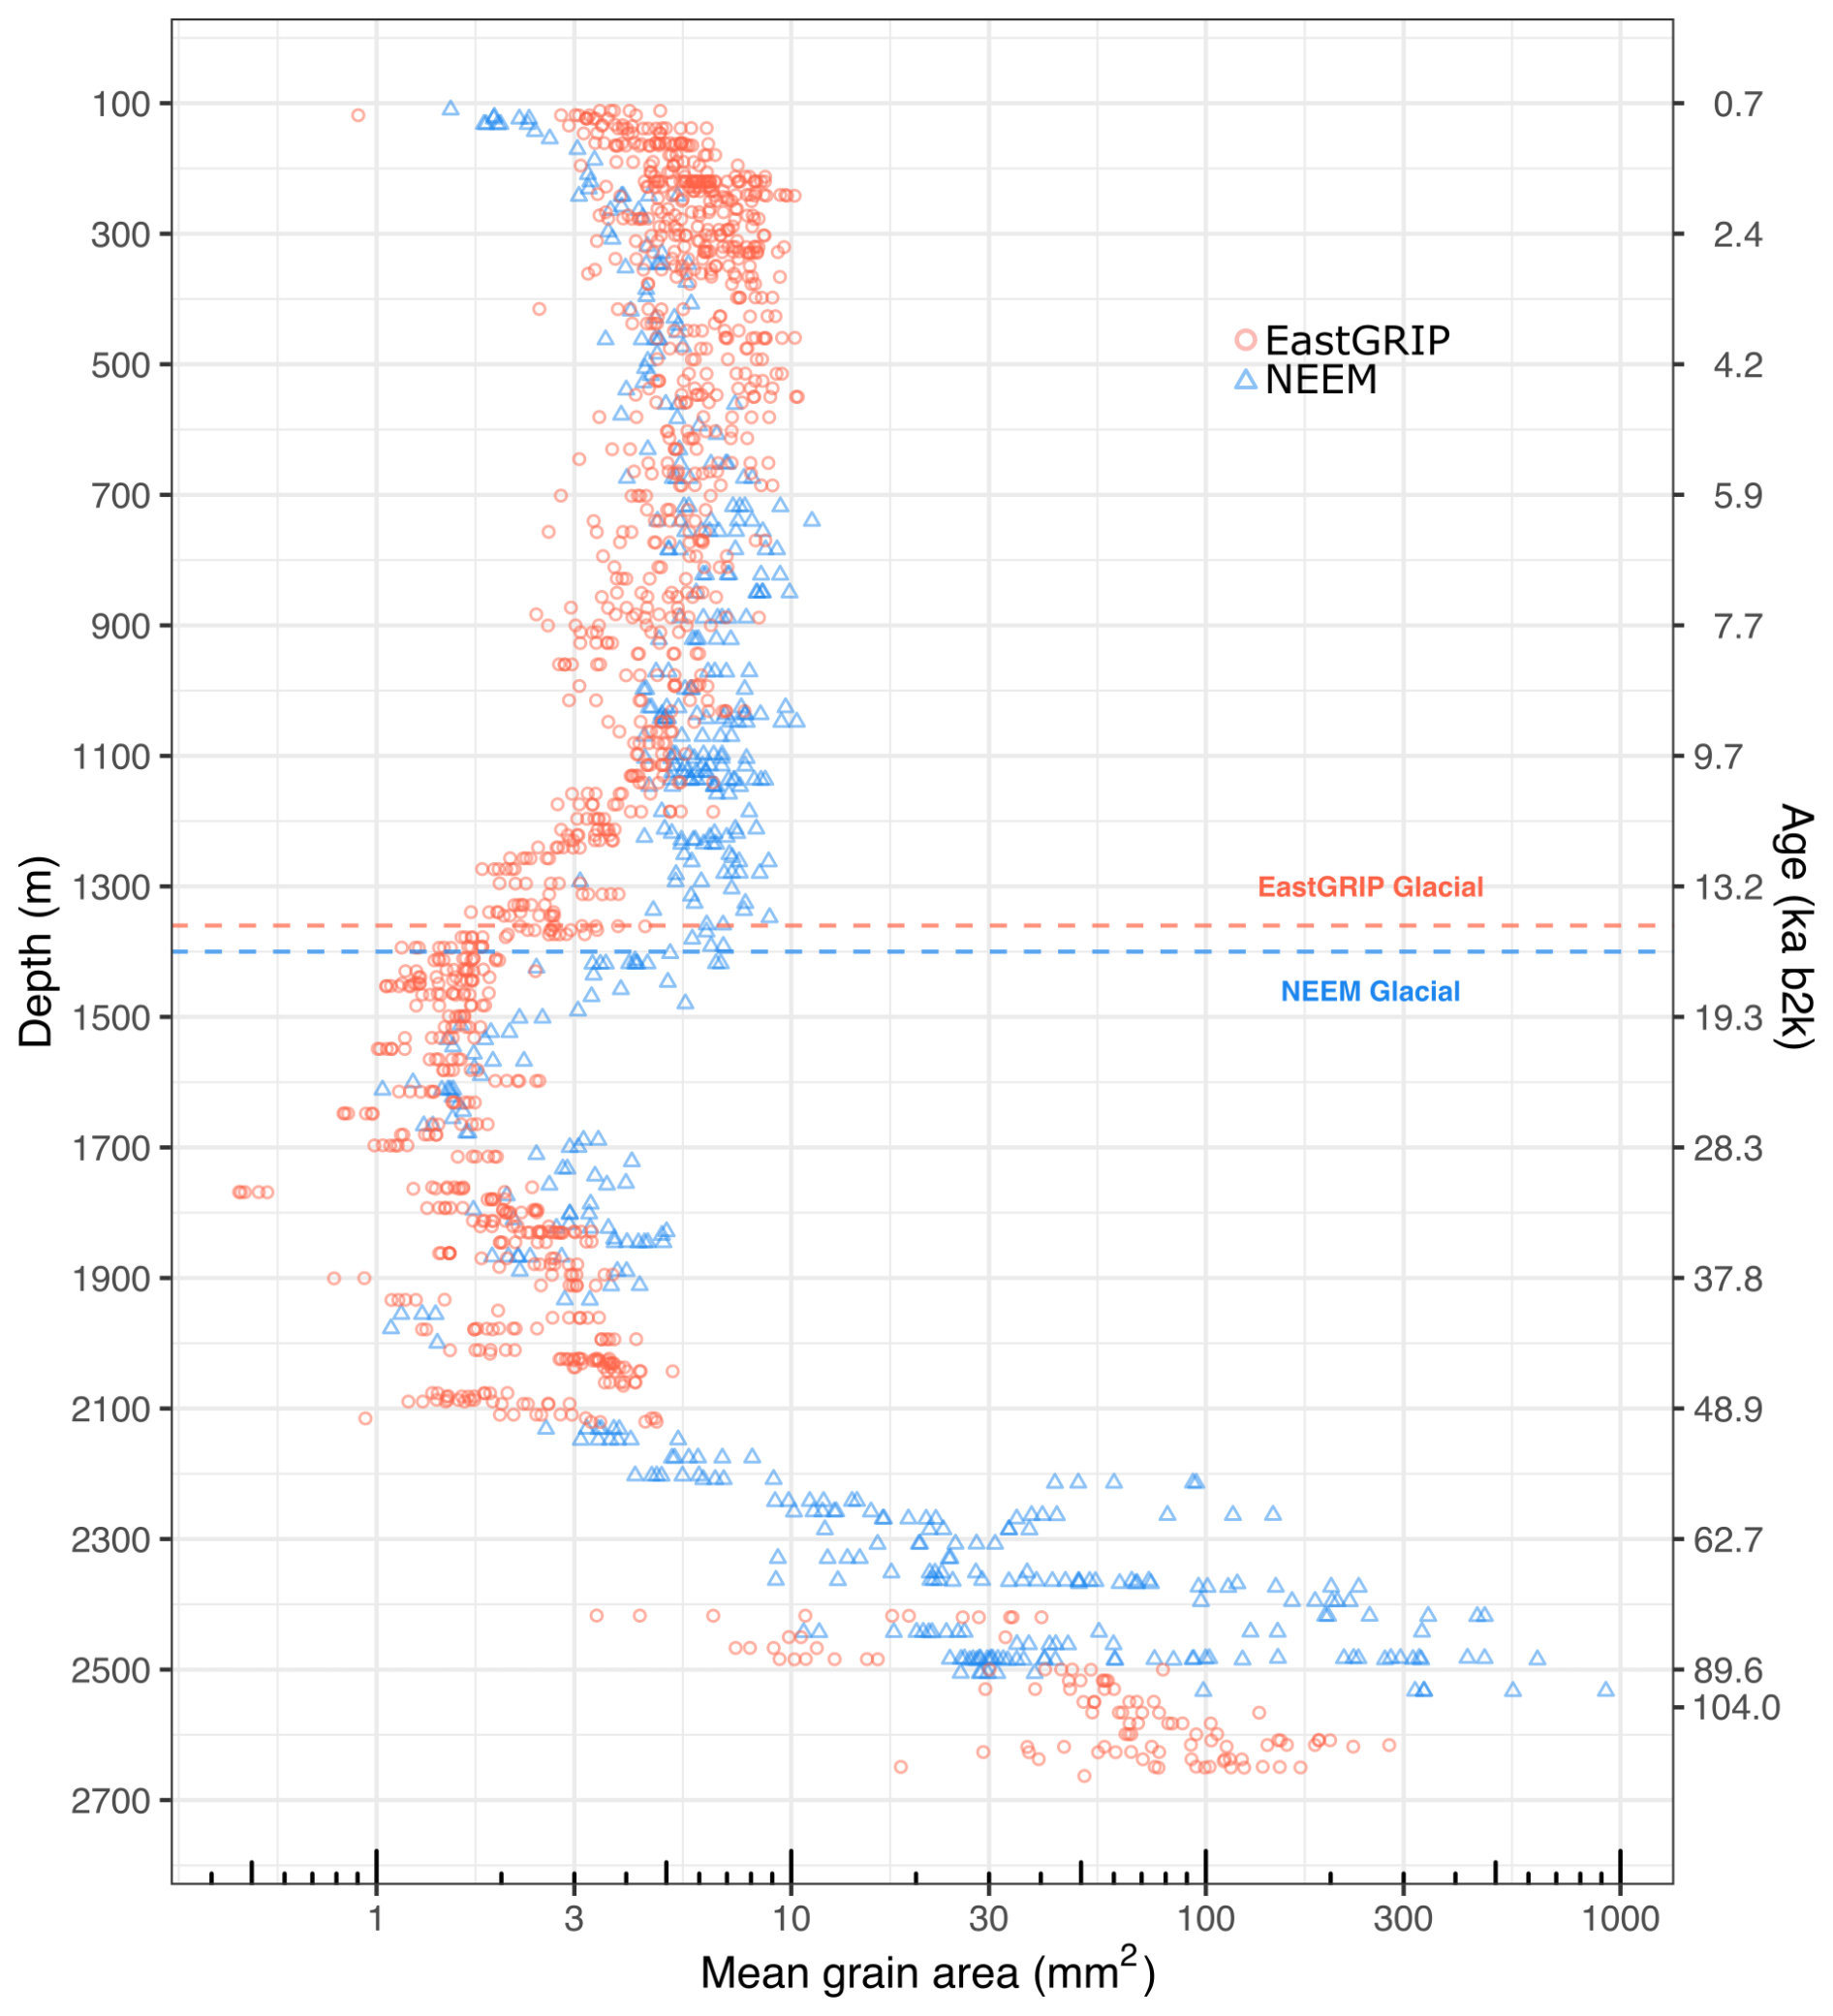
Figure 8Comparison of the mean grain size between EastGRIP and NEEM (Montagnat et al., 2014a) derived by automated fabric analysers. Ice below the dotted lines is from the Last Glacial, and the largest grains likely indicate Eemian ice.
In the upper 550 m, grain size reaches up to 10 mm2, and grains are usually characterised by lobate grain boundaries and equidimensional to oblate shapes (Fig. 9a). Grains tend to become more horizontally elongated with depth, and the grain size decreases to 3–6 mm2 at 1000 m, increases slightly until 1100 m, and decreases to about 2–3 mm2 at 1300 m. The grain size is between 0.5 and 5 mm2, mainly fluctuating around 1–2 mm2, with an increasing trend with depth throughout the glacial until 2500 m. Further, grain size layering is common, especially in fine-grained bands, and grain shapes are usually rectangular with straight grain boundaries. In the deepest ∼ 150 m, grain size strongly increases up to 280 mm2 (Fig. 8), and amoeboid grain shapes with bulging grain boundaries dominate (Figs. 5 and 9a). Different types of sub-grain boundaries were observed at all depths. Grain size distributions are skewed in all samples, with a peak at finer grain sizes and a long tail extending to coarser sizes (Fig. 9b). Mean values are greater than the medians. In the deepest samples, the distribution is strongly skewed, but the small number of large grains hampers statistical analyses.
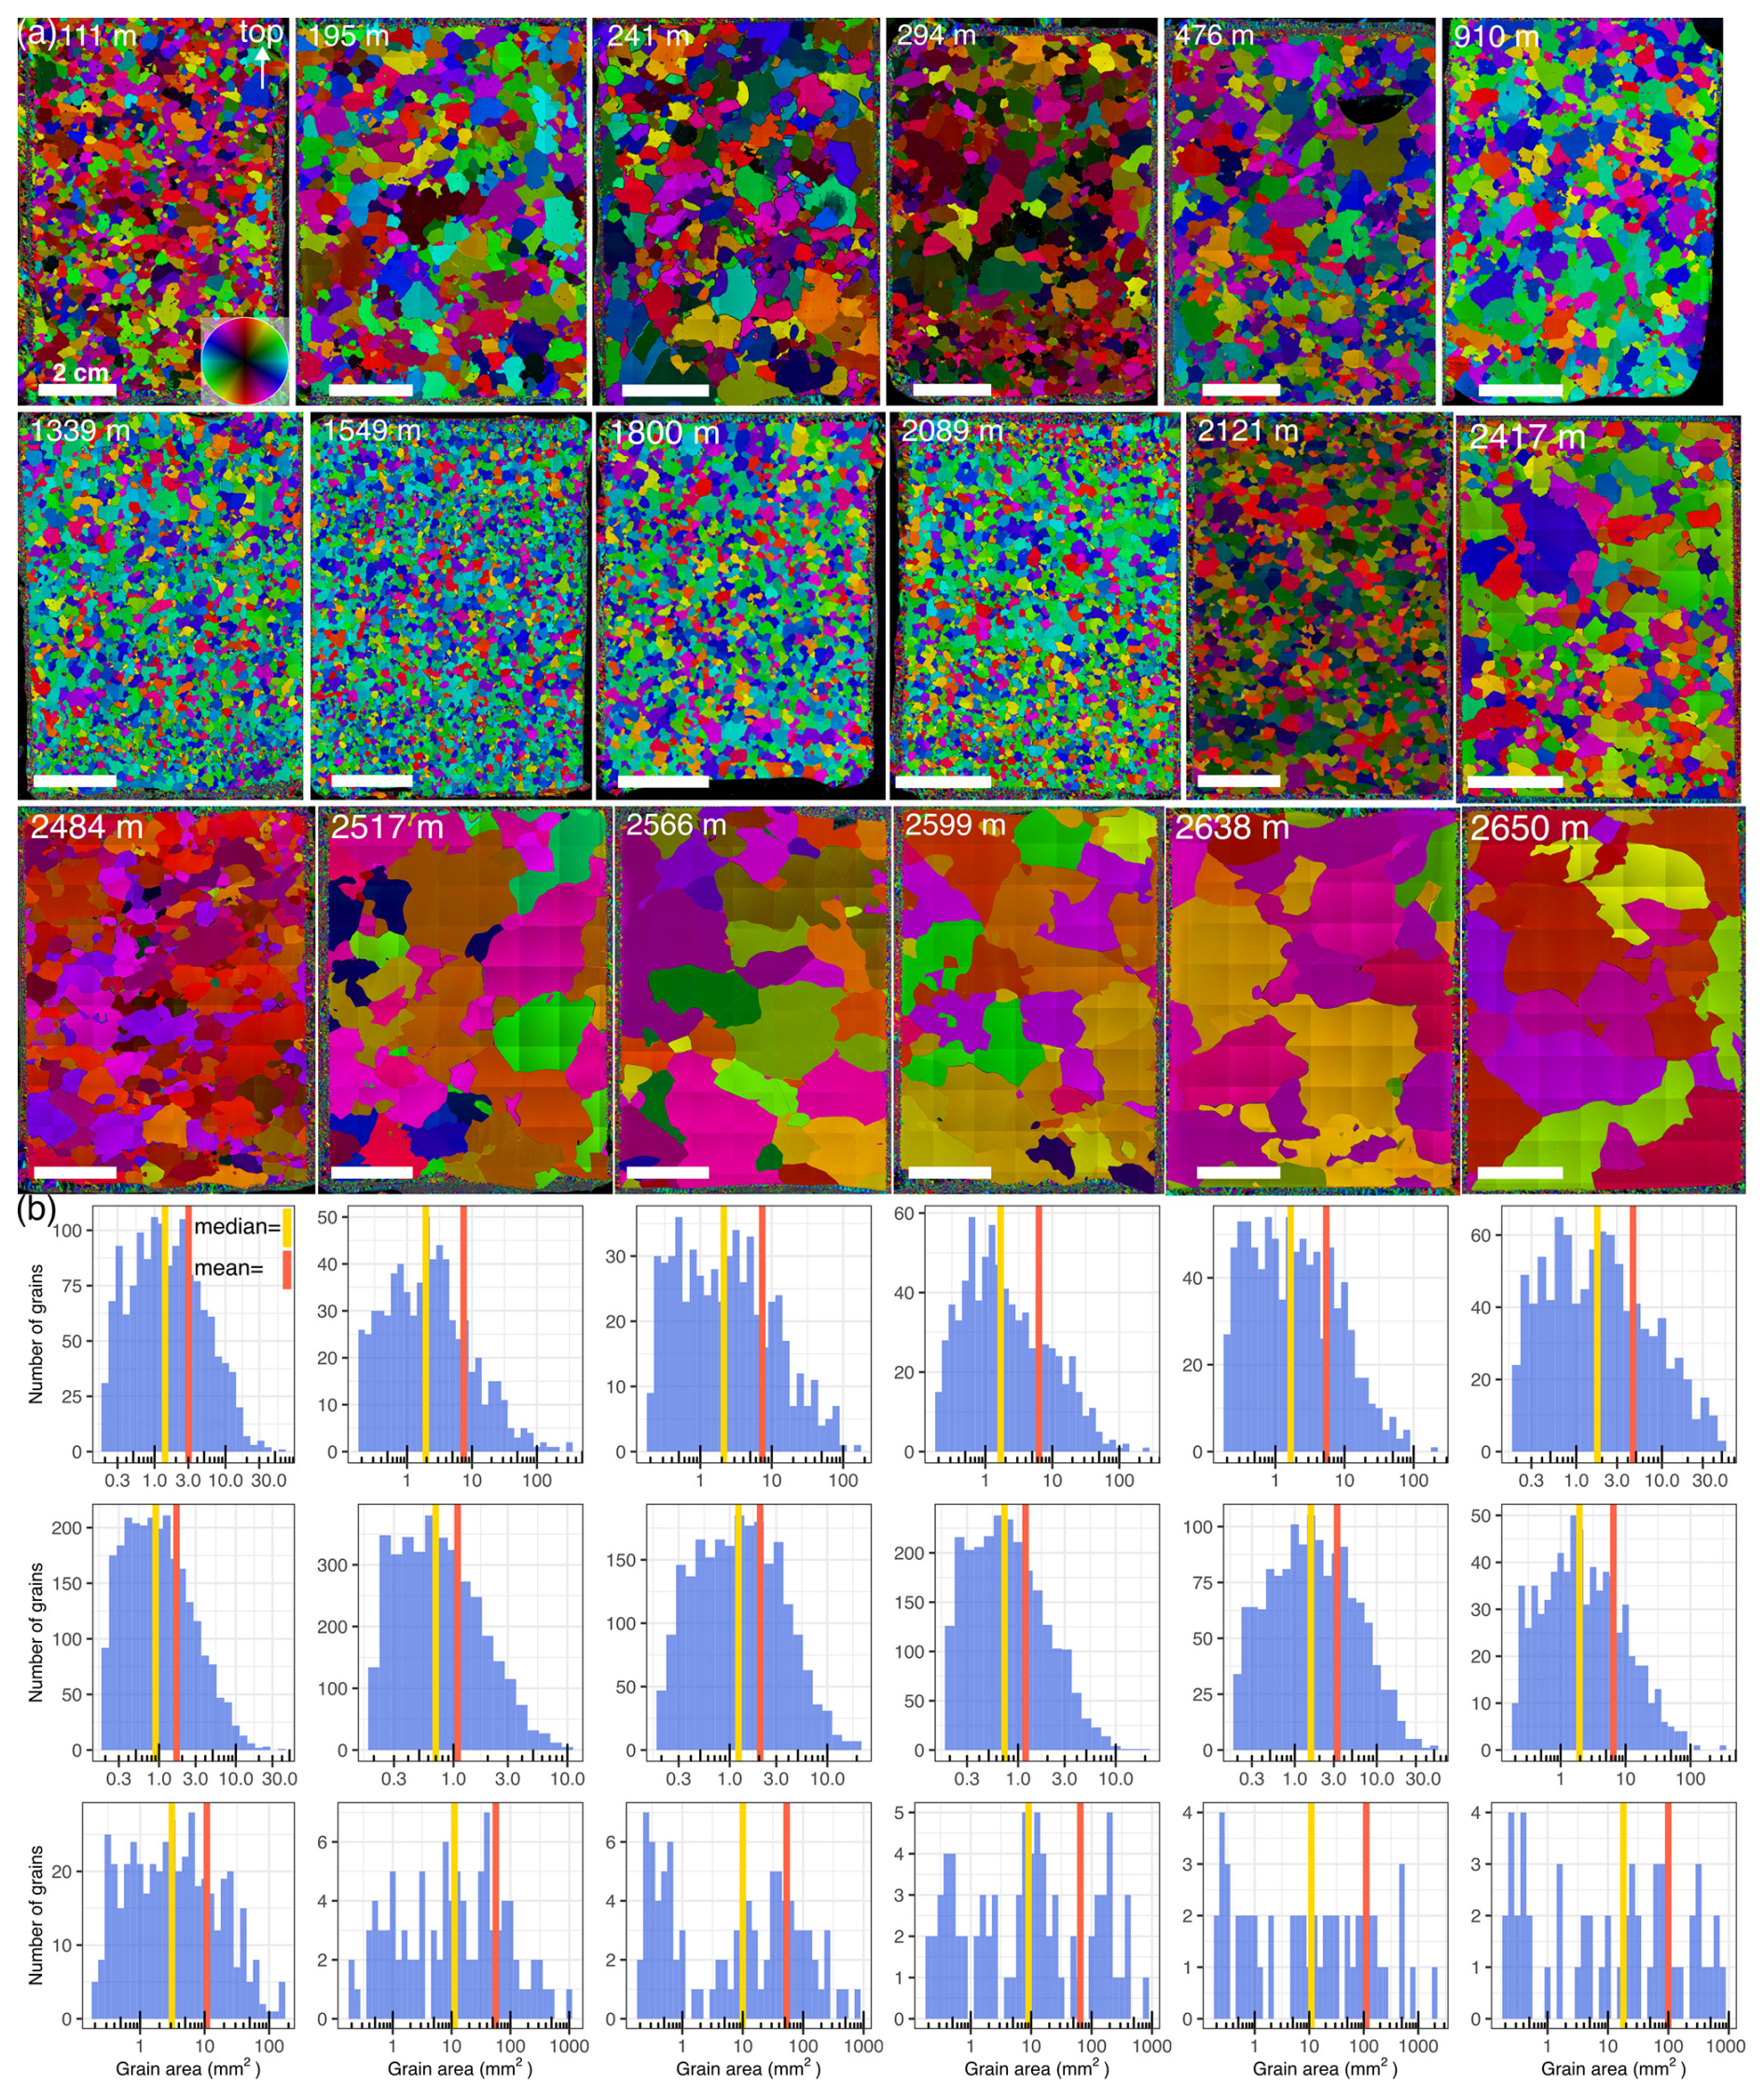
Figure 9Representative selection displaying the (a) microstructure and (b) respective grain size distributions (note the varying axes) at similar depths as the CPOs in Fig. 3. “Top” indicates the surface of the ice sheet. The c-axis orientation is indicated by the colour wheel.
The range of the mean grain size measured per thin section varies strongly throughout the core. The range is relatively large in the Holocene (Fig. 8), spanning up to 10 mm2 between the smallest and largest mean values at similar depths. In the glacial, the variability is smaller, i.e. between 0.5 and 5 mm2. At 2410 and 2618 m, there is a large variability between adjacent samples (Fig. 10).
3.4 Signs of disturbed stratigraphy
EastGRIP DEP, ECM, and microstructure data do not show correlating indications of abrupt disturbances until a depth of 2618 m. At 2618.3 m, a sudden change in conductivity coincides with a change in crystal size and CPO over a few centimetres (Fig. 10). Very large ice crystals (up to 7 cm in diameter) are followed by much smaller crystals and a more blurred multi-maxima CPO (Fig. 10).
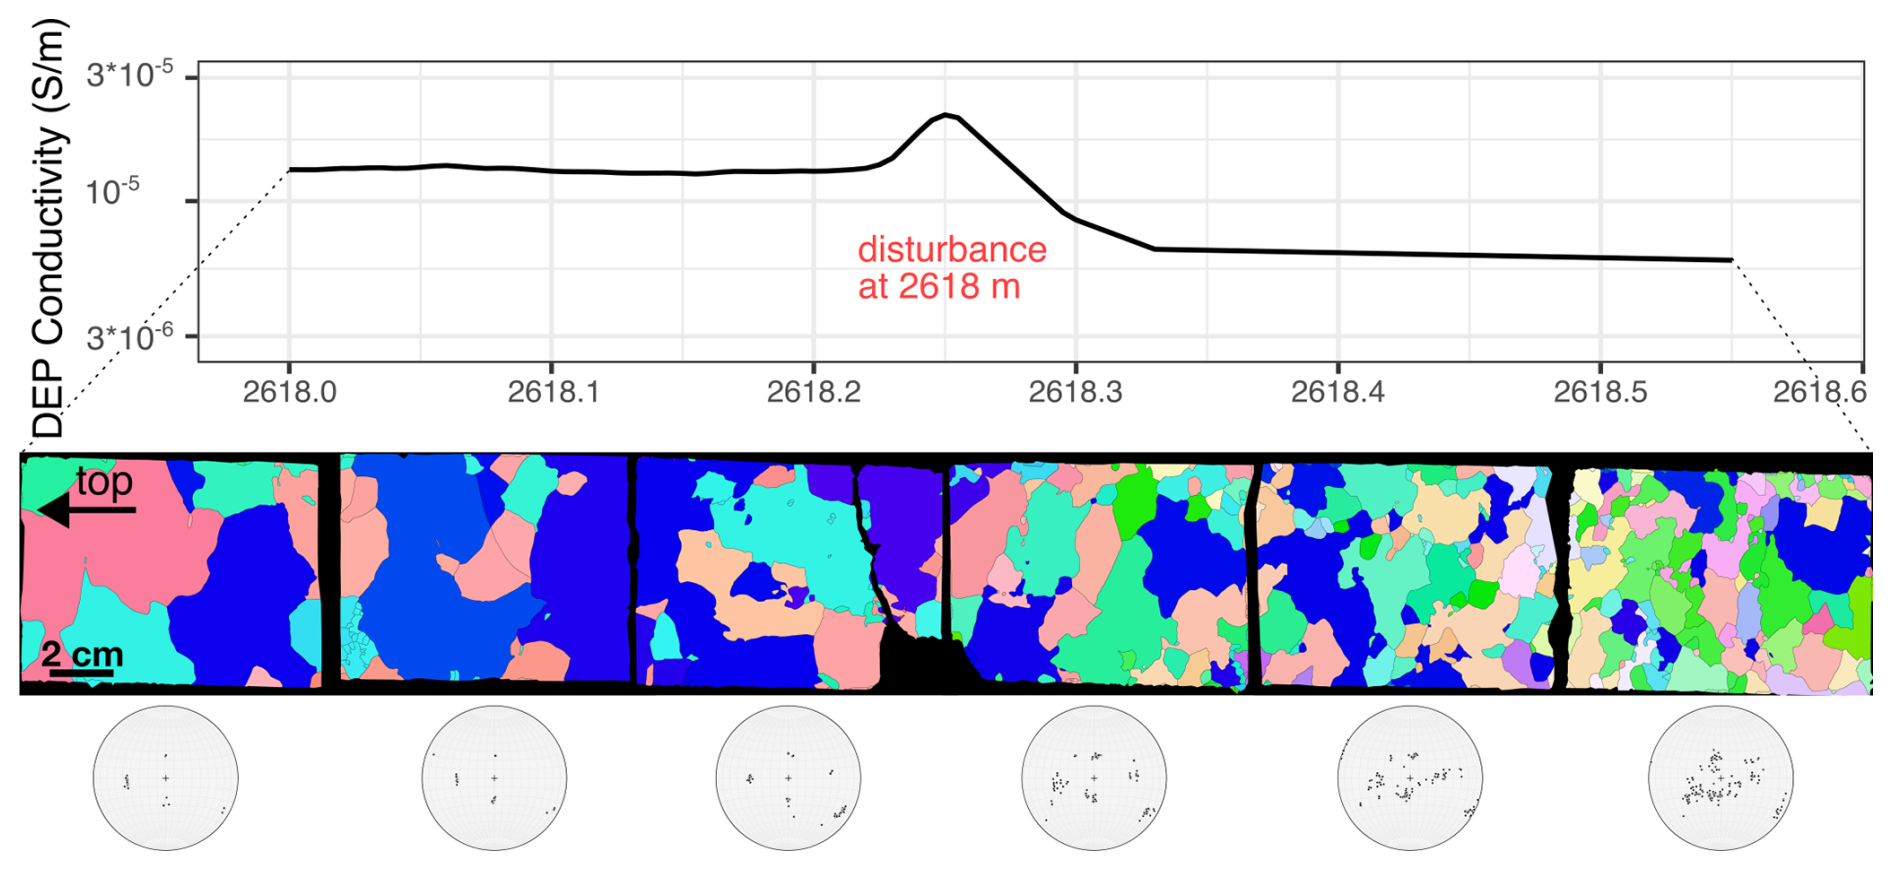
Figure 10At 2618.3 m, DEP conductivity drops, correlating with a strong decrease in grain size and a change in the CPO (equal-area lower-hemisphere projections), indicating a disturbance in the stratigraphy.
4.1 Deformation regimes in NEGIS derived from CPOs
In the EastGRIP ice core, five different CPO patterns are present (Table 1). The two main processes affecting the CPO are (1) the rotation of c axes due to deformation activated by the applied stresses (Alley, 1988; Castelnau and Duval, 1994) and (2) the growth (positive and negative) of old grains or formation of new ice crystals with different orientations due to grain boundary migration recrystallisation (e.g. De La Chapelle et al., 1998; Thorsteinsson et al., 1997). Figure 6 shows the complex CPOs with depth at EastGRIP indicated by the variety of different proportion symmetries throughout the ice sheet. To understand this profile, we derive information on the dominant deformation regimes from the present CPO patterns, as has been done for other deep-ice cores (e.g. Kamb, 1972; Alley, 1988; Thorsteinsson et al., 1997; Wang et al., 2002; Montagnat et al., 2014a; Weikusat et al., 2017).
4.1.1 Broad single-maximum CPO by uniaxial compression in shallow ice
Between 111 and 196 m, we observe weak, broad, single-maximum CPOs. Here, most c axes are loosely oriented towards the vertical axis. While a sequence of complex processes takes place in firn, including but not limited to densification, metamorphism, and density-crossover phenomena (e.g. Freitag et al., 2004; Hörhold et al., 2012; Fujita et al., 2014, 2016; Montagnat et al., 2020), the initial CPO at the bottom of the firn is governed by vertically orientated uniaxial compression (coaxial-dominated deformation) from overlying layers (e.g. Gow and Williamson, 1976; Thorsteinsson et al., 1997; Dahl-Jensen et al., 1997). Basal planes and their orthogonal c axes are forced to rotate towards the axis of compression, which correlates with the ice core axis, enabling the compression displayed in deformation experiments (e.g. Azuma and Higashi, 1985; Fan et al., 2021). However, comparing laboratory deformation experiments with observations from ice cores has to be treated with caution. An additional horizontal-extension component parallel to the ice stream direction is likely but cannot be determined at this depth.
4.1.2 Hypotheses for the origin of the crossed-girdle CPO
Crossed-girdle CPOs have not been described before in ice but have been described in quartz and rocks containing quartz, such as schists or quartzites (e.g. Lister, 1974; Gross et al., 1978; Carreras and Garcia Celma, 1982; Law et al., 1986). Our crossed girdles are less distinct than the examples described in the literature but differ from the broad single-maximum and vertical girdles above and below, respectively (Figs. 3 and 4). Crossed-girdle CPOs were first categorised by Sander (1970) and later renamed type I and II crossed girdles (Lister, 1977). Type I is characterised by two girdles meeting some distance from the intermediate-strain axis that are connected by a single girdle. In Type II, the two girdles meet at a point parallel to the intermediate-strain axis (Schmid and Casey, 1986). Our observed CPOs vary between (1) both types and (2) different symmetry shapes regarding the intensity distribution and skeletal outline.
For quartz, different explanations exist for the crossed-girdle CPO. As quartz is a well-known analogue for ice (e.g. Wilson, 1979, 1981) due to similar rheological (hexagonal crystal structure, formation of polycrystalline aggregates, deformation via basal slip) and optical properties (Wilson and Russell-Head, 1979), it is assumed that both materials behave roughly similarly during deformation, thus showing similar CPO patterns. However, limitations and differences exist; for example, non-basal plane deformation is well known for quartz (e.g. Baëta and Ashbee, 1969; Wang et al., 2024) but is rarely described in ice (e.g. Castelnau et al., 1996; Llorens et al., 2016b). Thus, the following possibilities for the crossed girdle should be considered with caution, as further research on this CPO pattern is needed but is beyond the scope of this study.
-
Deformation history – approximate plane strain under pure-shear (coaxial deformation) conditions (Lister and Hobbs, 1980; Lister and Dornsiepen, 1982). An intermediate deformation regime between plane strain and flattening would result in a transitional CPO between a small circle girdle and a type I crossed girdle (Law et al., 1986). The asymmetry of the crossed girdles could be related to different coaxial and non-coaxial strain paths (Lister and Hobbs, 1980) or increasing strain during simple-shear deformation (Garcia Celma, 1983; Bouchez and Duval, 1982; Law et al., 1986).
-
Activation of non-basal slip systems (Hirth and Lothe, 1982; Weertman and Weertman, 1992). As observed in quartz (e.g. Toy et al., 2008) and ice cores (e.g. Fukuda et al., 1987, Hondoh et al., 1990, Shearwood and Whitworth, 1991, Weikusat et al., 2011), this results in the fast movement of short-edge dislocation segments on non-basal planes (for details, see Fig. 7 in Toy et al., 2008, and e.g. Etchecopar, 1977; Schmid and Casey, 1986), providing mechanisms for accommodating heterogeneous strain and the multiplication of basal dislocations, such as Frank–Read sources (Frank and Read, 1950).
-
Overprinting of an older CPO during deformation (Christie, 1963; Llorens et al., 2022). This is caused by the establishment of NEGIS in its current form 2000 years ago (250 m) (Franke et al., 2022; Jansen et al., 2024).
-
Transition between broad single-maximum and vertical-girdle CPO. This results in an intermediate CPO resembling the crossed-girdle CPO. Samples measured between 1064 and 1264 m in depth (Fig. 19 in Fitzpatrick et al., 2014) from the West Antarctic Ice Sheet (WAIS) divide ice core display similar crossed-girdle CPOs despite having been retrieved from a less dynamic site.
An in-depth investigation of the a axes of EastGRIP samples between 200 and 250 m using electron backscatter diffraction (EBSD) is required to test the hypotheses above but is beyond the scope of this overview study.
4.1.3 Uniaxial horizontal extension
From 294 m downwards, the crossed girdle changes into a broad vertical-girdle CPO, which becomes more distinct with depth and is a fully established vertical girdle between 493 and 1230 m. The vertical girdle is explained by uniaxial extension further impacted by dynamic recrystallisation. During uniaxial longitudinal extension, as presumed for an ice stream, crystals rotate, and c axes rotate away from the extension direction and, thus, the basal plane rotates towards the extensional direction. The vertical-girdle plane in pole figures becomes oriented perpendicular to the axis of horizontal extension (Jacka and Maccagnan, 1984; Fujita et al., 1987; Alley, 1988; Lipenkov et al., 1989; Thorsteinsson et al., 1997; Wang et al., 2002; Llorens et al., 2022). By combining visual stratigraphy and fabric data, Westhoff et al. (2021) demonstrated that the c axes forming the girdle are oriented orthogonal to the ice flow present at the surface, proving that extension in the ice stream flow direction is the primary driver.
Vertical-girdle CPOs were observed in the Antarctic ice cores from Vostok, WAIS, EDML (European Project for Ice Coring in Antarctica (EPICA) in Dronning Maud Land), and Mizuho (Fujita et al., 1987; Lipenkov et al., 1989; Fitzpatrick et al., 2014; Weikusat et al., 2017) and in the NorthGRIP ice core from Greenland (Wang et al., 2002). However, the impact of this fabric pattern on internal ice deformation is difficult to assess (Wang et al., 2002; Craw et al., 2018). In a vertical girdle, some crystals will be in a soft position, i.e. with c axes 45° from the vertical compression axes. In contrast, other crystals are in a hard position relative to vertical compression.
4.1.4 Uniaxial horizontal extension complemented by a simple-shear component
The development from a vertical girdle to a vertical girdle with a defined horizontal-maxima CPO occurs between 1230 and 1394 m in depth, which is precisely the period of the transition from the Last Glacial to the Holocene (Mojtabavi et al., 2020) and is displayed in the broadening of the eigenvalue pattern (Fig. 7). At EastGRIP, the Holocene covers the upper 1240 m, followed by the Younger Dryas at 1240–1280 m and the Bølling Allerød at 1280–1375 m (Mojtabavi et al., 2020). In contrast to NorthGRIP, the vertical girdle does not develop a maximum in the vertical direction parallel to the core axis (Wang et al., 2002) but shows a maximum of varying strengths in the horizontal plane (Fig. 3). Only Glacial ice displays this CPO, which is thus likely related to the rheological differences between Holocene and Glacial ice. Glacial ice has a higher number of insoluble particles, such as dust (e.g. Paterson, 1991; Stoll et al., 2021a, 2023) deposited during periods of colder temperatures, and is characterised by smaller grains. Even though the detailed interplay between grain size and microstructure, impurities, and CPO remains ambiguous (Eichler et al., 2017, 2019; Stoll et al., 2021b), the differences between climate periods are unmistakable.
The horizontal maxima of the CPO could be strengthened by an additional simple-shear component with a vertical shear plane, as seen in a shear margin core from ice stream B, West Antarctica (Jackson and Kamb, 1997), or in the modelling work of Azuma (1994). Llorens et al. (2022) model the CPO development under ice stream flow conditions that first resulted in a vertical girdle due to uniaxial extension followed by horizontal-point maxima with a girdle component due to simple shear. Kamb (1972), Burg et al. (1986), and others showed the development of horizontal-maxima CPOs with varying strengths in simple-shear deformation experiments. Similar results were obtained with observed and modelled seismic data (Smith et al., 2017; Lutz et al., 2022). If simple shear occurs as a secondary-deformation regime, in addition to the longitudinal extension, a vertical-girdle CPO with a horizontal maxima would be the outcome. The comparably minor rheological differences within glacial ice, such as between stadials and interstadials or between cloudy bands and purer ice (Stoll et al., 2023), and different rates of dynamic recrystallisation due to various levels of impurity content could explain the wavy eigenvalue pattern (Fig. 7).
4.1.5 Dynamic recrystallisation close to bedrock
The deepest depth range (below 2500 m, temperature above −7.5 °C) is characterised by multi-maxima CPO patterns of coarse-grained ice with interpenetrating grains of amoeboid shapes and curved inter-lobate grain boundaries (Figs. 3, 10, 5). Multi-maxima CPOs were observed in a few polar ice cores, such as the North Greenland Eemian Ice Drilling (NEEM) (Montagnat et al., 2014a), Byrd (Gow and Williamson, 1976), Cape Folger (Thwaites et al., 1984), and Law Dome (Zichu, 1985), and in temperate glaciers and ice caps (e.g. Rigsby, 1951; Hooke and Hudleston, 1980; Tison and Hubbard, 2000; Hellmann et al., 2021; Monz et al., 2021; Disbrow-Monz et al., 2024). Like EastGRIP, the present transitions to the multi-maxima CPO are often abrupt, accompanied by a change towards larger grain sizes, and occur close to bedrock, where temperatures are typically high. Depending on the strain rate and temperature, different recrystallisation processes impact the microstructure (e.g. Alley, 1988; Castelnau and Duval, 1994; Faria et al., 2014). The distinct CPOs of clustered c axes are partly a function of the grain sampling. However, the multi-maxima CPOs, large interlocking grains, and inter-lobate grain boundaries are evidence of strong dynamic recrystallisation by grain boundary migration (Gow and Williamson, 1976; Alley, 1988). The intensification of dynamic recrystallisation is fostered by the high temperature close to bedrock (above −10 °C) (Fig. 1), high stresses, and large strains inflicted by potential basal shearing (Faria et al., 2014). Another possibility is a regime of stagnant ice close to bedrock, which would also result in large interlocked grains, as observed at the bottom of the Talos Dome ice core (Montagnat et al., 2012). Future borehole logging data will help to explore this possibility.
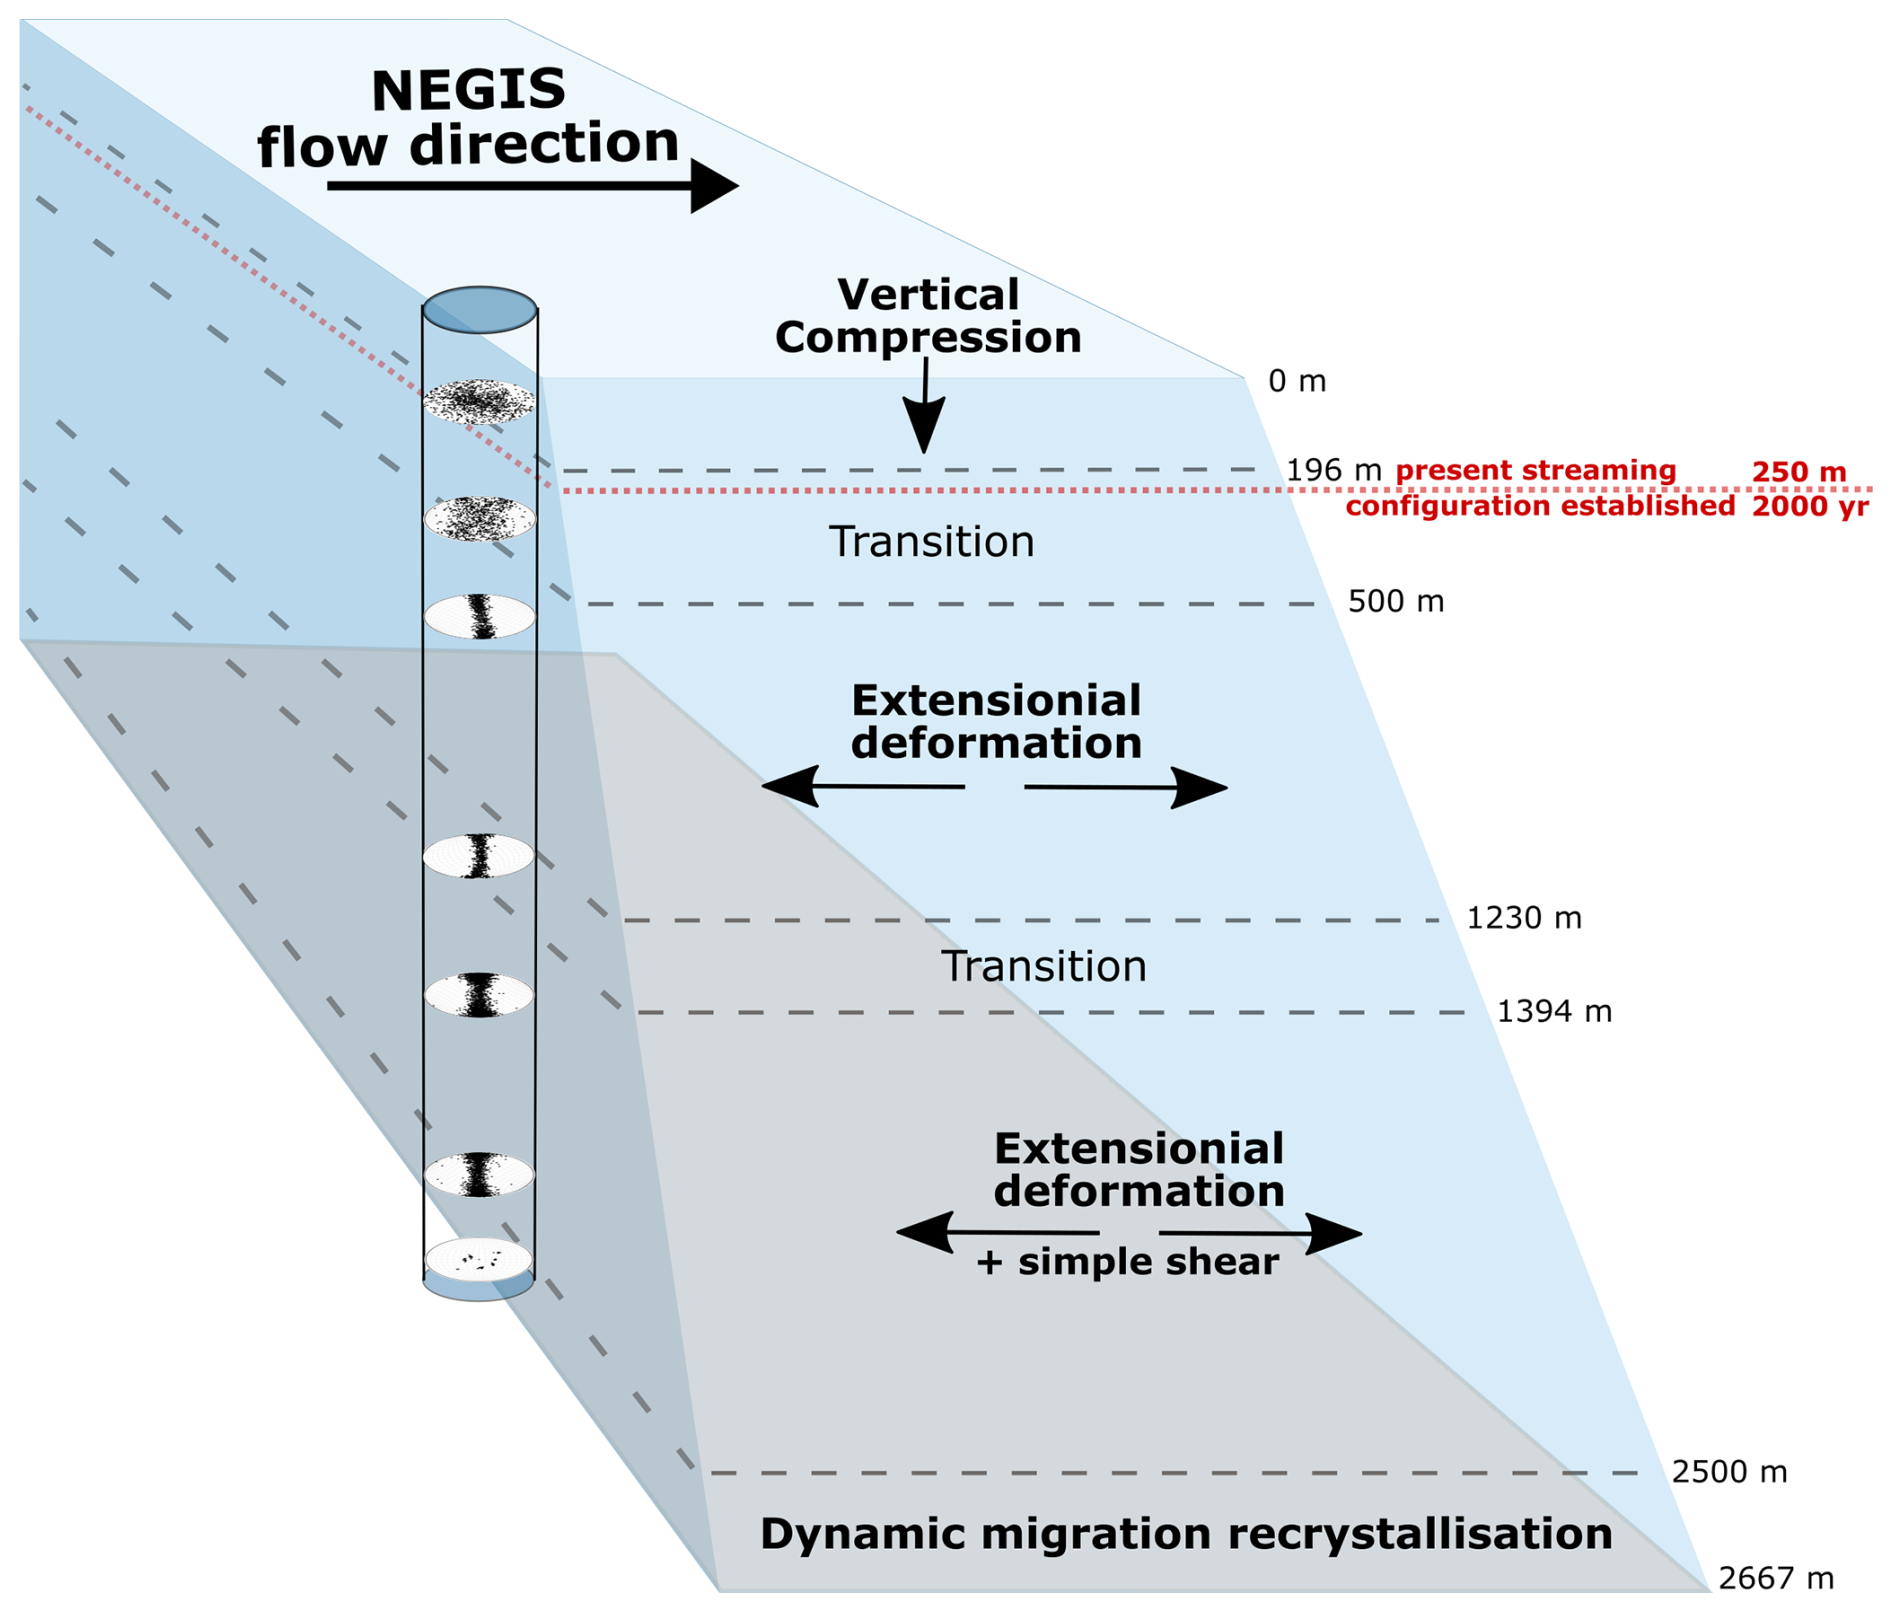
Figure 11Sketch of NEGIS displaying the CPO patterns and the deformation regimes and recrystallisation processes derived. The dotted red line displays the depth when NEGIS was established in its current form (Jansen et al., 2024); everything below accumulated before today's ice stream conditions.
The distinct microstructure in the form of large amoeboid grains (Fig. 10b), the multi-maxima CPO pattern (Fig. 5), and the high ice temperature in the deepest 163 m (Fig. 1d) significantly enhancing grain boundary mobility indicate that nucleated migration recrystallisation is the dominant process in this depth regime. Indications of dynamic recrystallisation have been observed in EastGRIP from shallow depths downwards (Stoll et al., 2021a), similar to other ice cores (e.g. Alley, 1988; Weikusat et al., 2009; Kipfstuhl et al., 2009; Faria et al., 2014).
The multi-maxima CPO is not primarily a sampling issue caused by measuring grains multiple times, as has recently been discussed (Monz et al., 2021; Disbrow-Monz et al., 2024). It persists when combining data from six vertically adjacent samples (Fig. 9), resulting in statistically relevant numbers of crystals analysed (≥211). A distinct study utilising high-resolution optical microstructure data will follow up on this.
4.2 Patterns of CPO with depth compared to other ice cores
EastGRIP is the first deep-ice core drilled through an ice stream, and we summarise the CPO patterns and derived deformation regimes in Fig. 11. To investigate differences compared to traditional (palaeo-climatologically motivated) less dynamic ice coring sites, such as ice domes and divides, we compare the EastGRIP CPOs with other ice cores that have comparably large CPO datasets (Fig. 12). The respective CPOs are displayed in the original publications, and we have only summarised them here. The NEEM ice core was drilled on the Greenland ice divide approximately 440 km northwest of EastGRIP and was included due to this proximity and its similar age and temperature profiles (Montagnat et al., 2014a). NEEM is characterised by a progressive c-axis orientation strengthening with depth, resulting in a single maximum. EDML, at Kohnen Station, Antarctica, represents an ice divide with an extensional deformation regime (Weikusat et al., 2017). A broad single maximum develops into a vertical girdle with depth followed by a single-maximum CPO close to bedrock. Lastly, the South Pole Ice Core (SPICE) at the South Pole, Antarctica, represents flank flow and a relatively fast surface flow velocity of 10 m yr−1 (Casey et al., 2014; Voigt, 2017). SPICE is characterised by a broad single-maximum CPO close to the surface and a vertical girdle strengthening with depth.
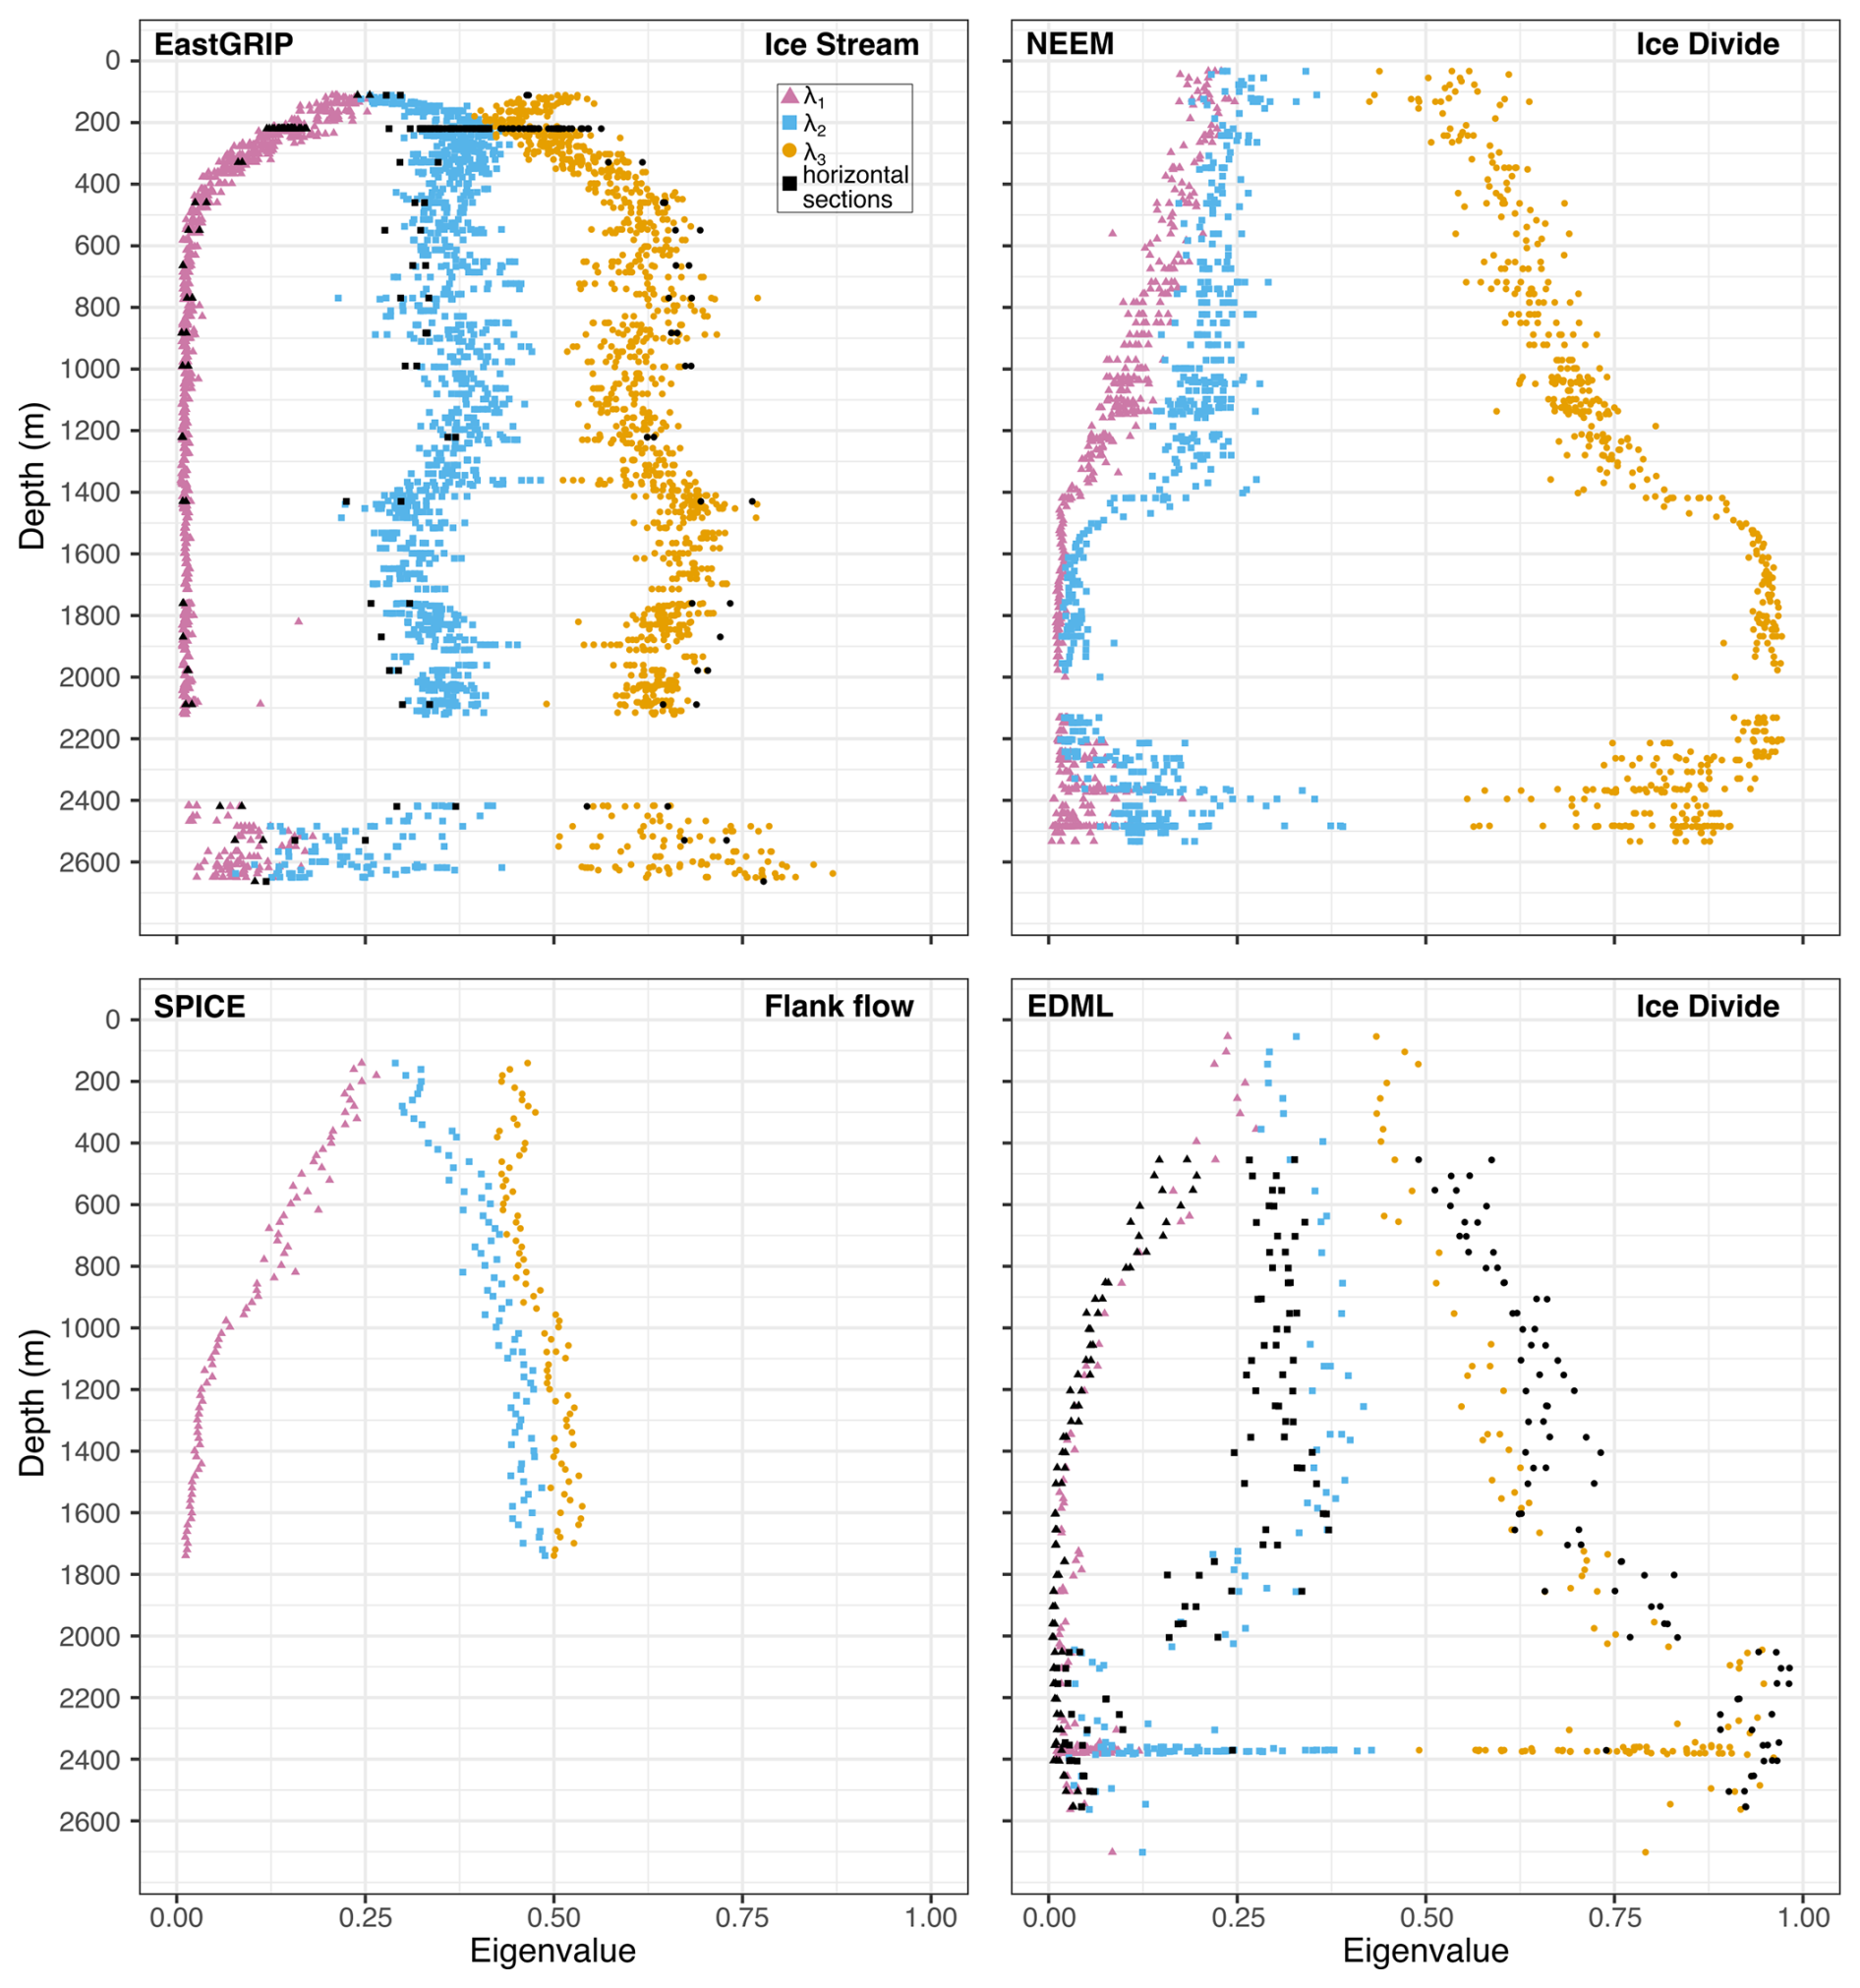
Figure 12Comparison of the anisotropy between EastGRIP, NEEM, EDML, and SPICE via their eigenvalue pattern with depth (Montagnat et al., 2014a; Weikusat et al., 2017; Voigt, 2017). Note the differences between the maximum values of λ3 of EastGRIP and SPICE compared to those of NEEM and EDML. Annotations as in Fig. 7; all axes are formatted in the same way for better comparison.
The distinct development of a strong anisotropy with depth is characterised by the rapid decrease in λ1 at EastGRIP compared to the other cores (Fig. 12). λ1 stabilises slightly above 0 at 500 m depth; similar values do not occur until depths greater than 1400, 1500, and 1700 m at NEEM, EDML, and SPICE, respectively. Consequently, λ3 at EastGRIP reaches higher values at shallower depths than in the other cores and remains between 0.5 and 0.8 until bedrock. In contrast, NEEM shows an abrupt increase in λ3 at 1419 m, the λ3 of EDML gradually increases between 1600 and 2000 m, and the λ3 of SPICE remains between 0.42 and 0.54. The CPOs with depth at EastGRIP further differ strongly from the other cores. In addition to the novel crossed girdle, the vertical-girdle CPO at EastGRIP occurs at a much shallower depth (∼ 300 m) than at EDML (∼ 950 m) or SPICE (∼ 1000 m).
This comparison shows that the anisotropy development at EastGRIP is uniquely rapid. Thus, ice anisotropy plays a crucial role in ice flow within NEGIS and likely in other ice streams. Even flank flow at SPICE differs strongly from the conditions at EastGRIP. The potential implications and consequences of this finding are discussed in Sect. 4.5.1.
No other core exhibits wavy fluctuations in eigenvalues with depth as pronounced as at EastGRIP (Fig. 12). The wavy pattern correlates with the depth regime characterised by the vertical-girdle CPO, but SPICE, containing a similar vertical girdle, displays no such eigenvalue pattern. Some of the EDML eigenvalues, roughly correlating with the vertical-girdle CPO, could be interpreted as a weak wavy pattern, but it is indistinct compared to that at EastGRIP. The broader spread between 650 and 950 m correlates with the brittle zone at EastGRIP (Westhoff et al., 2022) and could be explained by the formation of small grains close to bubbles transforming into clathrates and natural variability. This difference could also be an artefact of the much larger EastGRIP dataset displaying more variation. To explore this further, future studies on the single-crystal scale and along particular depth regimes are needed at specific depths, such as the brittle zone and, for example, the depths around 1370 and 1895 m (Fig. 7).
4.3 Confirming the hypothesised vertical-girdle CPO in ice streams
Our observational data enable us to confirm model assumptions about CPO patterns and deformation modes in active ice streams (e.g. Alley, 1988; Azuma, 1994; Llorens et al., 2022), enabling the transfer to other ice streams in Greenland and Antarctica. These studies assume that the c axes of ice crystals rotate away from the axis of extension and thus produce a vertical-girdle CPO with a potential horizontal-maxima pattern. However, so far, only observations of the ice flow velocity on the surface of NEGIS indicate extensional behaviour. We can now confirm that within NEGIS, the most abundant deformation regime is longitudinal extension, represented by a vertical-girdle CPO.
4.4 Grain size with depth in an ice stream
The examined grain size trends with depth in EastGRIP are comparable to those in other Greenland deep-ice cores (e.g. Thorsteinsson et al., 1997; Montagnat et al., 2014a). Figure 8 shows that grain size with depth is similar in EastGRIP and NEEM. A more specific interpretation of grain size data will be presented in follow-up publications, as fabric analyser grain sizes (transmitting-light microscopy) are less accurate and are generally coarser than reflected-light methods (Binder et al., 2013).
Both cores show medium grain sizes throughout the Holocene, driven mainly by normal grain growth. In both cores, grain size decreases over 150 m in depth at the Holocene–Last Glacial transition. However, this process starts at 1100 and 1350 m at EastGRIP and NEEM, respectively. The transition in NEEM is comparably consistent, while EastGRIP shows more fluctuation in mean grain size, which could be due to the higher number of samples. In the Glacial, grains remain small, as has been described for other deep-ice cores (e.g. Gow and Williamson, 1976; Lipenkov et al., 1989; Weikusat et al., 2017). Roughly 200 m above bedrock, grains are strongly curved, intersect each other, and get significantly bigger. We interpret these features as evidence for (1) chemically purer ice formed during the warmer conditions in the Eemian period (Thorsteinsson et al., 1997) and (2) very warm ice (Fig. 1d) caused by the proximity to bedrock and, thus, more geothermal heat. In the deepest part, the mean grain size at NEEM, which was also obtained with an automated fabric analyser and with partly larger samples, reaches up to 922 mm2, while crystals at EastGRIP only reach about 280 mm2.
Despite different CPOs and dynamic conditions (EastGRIP – ice stream; NEEM – ice divide), the similar grain size profiles between both cores suggest that grain size is not significantly impacted by fast-flowing ice stream ice. It further indicates that grain growth and grain size reduction are driven by similar processes. Most NEEM samples are in a similar size range as those from EastGRIP, even close to bedrock. On smaller scales, the interplay between grain size, impurities, and CPO is more complex and remains challenging to disentangle (e.g. Paterson, 1991; Eichler et al., 2019; Stoll et al., 2021b).
4.5 Implications
4.5.1 Relevance for ice sheets and ice flow modelling
The data presented indicate that NEGIS, at the location of EastGRIP, mainly experiences extensional deformation along flow, resulting in heterogeneous plug flow. Contrary to block flow, this includes additional internal deformation components and heterogeneous strain and stress phenomena on different spatial scales, which are indicated by the crossed-girdle and vertical-girdle-with-horizontal-maxima CPOs. Despite their importance for ice sheet and glacier mechanics, these microstructural features are usually overlooked in models (Faria et al., 2014). To estimate the overall impact further, analyses regarding the mechanic responses of a crossed-girdle CPO compared to the broad vertical CPO below or compared to isotropic ice are needed. We discuss the crossed-girdle CPO for the first time in natural ice, and, to our knowledge, most ice fabric modelling has yet to produce similar CPOs. Thus, enhancing the bridging of different scales and approaches, as has recently been done by Richards et al. (2023) and Ranganathan and Minchew (2024), is crucial.
A fundamental question arises regarding the upstream source and flow path of ice at various depths at EastGRIP, especially when considering the significance of the vertical fabric profile for ice sheet dynamics and the modelling of NEGIS. One key aspect is whether one assumes a constant velocity field in the past, where ice particles flow into NEGIS through the shear zone. This assumption is commonly used in modelling, mass flux, and firn compaction studies (e.g. Holschuh et al., 2019; Gerber et al., 2021; Franke et al., 2021; Oraschewski and Grinsted, 2022; Gerber et al., 2023). Contrary to this assumption is the idea that shear zones in the upstream sector of NEGIS move with the ice over time and can cause the ice stream to either widen or narrow, reflecting a highly dynamic component in the development of NEGIS (Grinsted et al., 2022; Franke et al., 2022; Jansen et al., 2024). The different consequences arising from these two perspectives are highlighted in Jansen et al. (2024), where the sheared cylindrical folds are used as passive markers for ice flow. The fold deformation patterns at the shear margins do not align with the flow lines derived from the current ice flow velocity vectors and instead indicate that ice remained inside the shear margins during the time of shearing.
Underlying this question is a long-standing fundamental debate on whether NEGIS, in its current form, represents a constant feature throughout the Holocene (Fahnestock et al., 2001) or whether NEGIS and similar ice streams are temporary phenomena that evolve with time and can switch on and off over a few thousand years (Franke et al., 2022; Jansen et al., 2024). While a detailed discussion of this topic is beyond the scope of this article, it is highly relevant for understanding the dynamic behaviour of the Greenland Ice Sheet. It is clear, however, that the two theories – one positing an unchanging velocity field with ice flow through the shear zone and the other proposing a changing velocity field with moving shear zones – are fundamentally incompatible.
So far, we have used the CPO data to establish the current deformation regimes at the EastGRIP site. However, there is a debate whether and under which conditions ice fabric can be used to reconstruct deformation and flow history (e.g. Lilien et al., 2021; Llorens et al., 2022). However, assuming that EastGRIP ice accumulated initially at the ice divide upstream of NEGIS before NEGIS was established, the respective changes in flow and deformation history, i.e. changes in stress and strain conditions, could completely change or partly imprint the fabric (e.g. Craw et al., 2018; Lilien et al., 2021; Llorens et al., 2022). Llorens et al. (2022) show that the fabric at the onset of NEGIS would be preserved for a maximum of ∼ 7 kyr. The strong dynamic recrystallisation at the bottom of the core would likely result in a much shorter duration of preservation. Similarly, in regions with higher strain, such as the shear margin, only ∼ 200 years of preservation duration are estimated (Llorens et al., 2022).
The crossed-girdle CPO around 250 m correlates with the timing of the establishment of NEGIS and its shear margins 2000 years ago (Fig. 11) (Jansen et al., 2024). The assumption that NEGIS in its current form is 2000 years old, as explained above, results in a unique change in deformation regimes inside the EastGRIP ice core over a short time around a depth of 250 m. Before either the establishment of NEGIS or the movement of EastGRIP ice into the ice stream, ice below 250 m in depth mainly experienced vertical compression and thus a different starting CPO than ice above 250 m, which mainly experienced a NEGIS-induced finite longitudinal strain or extension (Ramsay and Huber, 1983) of approximately +0.75 along flow and −0.33 (shortening) perpendicular to it during the last 2000 years (strain rates calculated with MEaSUREs ice velocity dataset (Joughin et al., 2010a, b)). NEEM provides an estimate of the CPO and anisotropy profile at EastGRIP before NEGIS became established, which is represented by a weak and strong vertical c-axis maximum in shallow and kilometre-deep ice, respectively (Fig. 12) (Montagnat et al., 2014a). The change in the dynamic situation at EastGRIP 2000 years ago could result in an overprinting of the initial CPO or the activation of different slip systems, as has been hypothesised for the crossed-girdle CPO (Sect. 4.1.2). However, deformation experiments have shown that strains of 0.2 can already completely change initial CPOs (e.g. Craw et al., 2018). Further, the basal slip system is dominant under axial compression and simple-shear-deformation experiments (e.g. Bouchez and Duval, 1982; Montagnat et al., 2015; Qi et al., 2019). We thus stress that further research is crucial, and, for now, the activation of different slip systems has to be treated with caution as an explanation for the crossed-girdle CPOs. Further clarification could be obtained by analysing the borehole deformation via repeated borehole logging runs. So far, the CPO patterns derived seem to be reliable indicators of the ongoing ice flow while displaying remnants of the recent changes in ice dynamics of NEGIS (Jansen et al., 2024).
Our results show that in ice streams such as NEGIS and likely others in Greenland and Antarctica, we cannot assume that the upper part of the ice column (the upper two-thirds assumed for ice divides (Dansgaard and Johnsen, 1969)) is dominated by vertical compression. Our observations reveal that specific stress and strain regimes occur and must thus be represented better in ice flow models. The novel insights from the EastGRIP ice core could help us to take the next step towards more comprehensive ice flow and fabric modelling. The strong recrystallisation close to bedrock makes the detection of potential shearing at the base very challenging. Unfortunately, ice does not contain strain markers in the same way as other rocks do, thus hampering the clear identification of changes in strain using microstructural methods. Repeated logging along the entire borehole is needed to detect and quantify these changes. However, long-enough periods (often up to 12 months) between measurements are required to detect changes in the borehole geometry and, thus, potential shearing with certainty.
Our data, together with recent studies on the history and stability of NEGIS (Franke et al., 2022; Jansen et al., 2024), clearly display the complicated flow behaviour of NEGIS. These new insights imply that any changes regarding the flow behaviour of NEGIS, such as the recently seen acceleration in several of its regions (Grinsted et al., 2022; Khan et al., 2022), could impact the entire thickness of the ice column, resulting in higher solid-ice discharge in the future if surface flow velocities keep increasing.
4.5.2 Potential for a record reaching back to the Eemian
Comparing EastGRIP DEP and ECM data to ECM data from the NorthGRIP ice core from central Greenland shows a good correlation between both cores for their deepest parts (Fig. 2). We thus extend the EastGRIP age–depth relationship with certainty until 104 ka b2k (2558 m). In deeper ice, the large grain sizes (Figs. 8 and 5) and high ECM values suggest that the EastGRIP ice core contains Eemian ice similar to, e.g. NEEM and NorthGRIP (NEEM community members, 2013; Rasmussen et al., 2014). However, this remains speculative until further dating, including stable-water isotope and gas records, becomes available.
The distinct change from large to small grain sizes at 2618.3 m, correlating with a drop in electric conductivity (Fig. 10), indicates a disturbance, potentially by shearing, of the stratigraphy at this depth, which remains to be further characterised. However, EastGRIP has the potential to enable further investigation of the climate and the conditions of the Greenlandic Ice Sheet during the last interglacial.
The EastGRIP ice core enables the first overview of deformation regimes and CPO development throughout an ice stream. EastGRIP is characterised by five major deformation regimes accompanied by transition zones. The shallowest regime has undergone vertical compression from overlying layers, yielding a broad single-maximum CPO. Below, we describe a crossed-girdle CPO for the first time in ice and provide hypotheses for its origin, which remain to be tested in future studies. The major regime is extensional deformation, which is indicated by a vertical-girdle CPO. With depth, extensional deformation remains dominant, but the vertical girdle is extended by horizontal maxima. Close to bedrock, high temperatures prevail, resulting in dynamic migration recrystallisation visible in a multi-maximum CPO and large grains and, thus, few data points hindering the detection of the dominating deformation regime and the detection of potential basal shearing. We show that anisotropy develops at considerably shallower depths than at less dynamic sites, such as ice divides and even at ice flanks. The overall plug flow shows various small-scale variations, which require further research. Additional borehole logging is needed to decipher potential shearing above bedrock. We provide a chronology for the EastGRIP ice core to 108 ka b2k, below which the records of NorthGRIP, NEEM, and EastGRIP become significantly different. There are indications that the EastGRIP ice core contains ice from the Eemian interglacial period, but we find it likely that the ice core record is stratigraphically disturbed in the deepest section. Additional grain size and ice temperature profiles with depth contribute to a better understanding of the rheological behaviour and flow behaviour of ice streams, while providing crucial data for improving future ice flow models.
A1 Fabric analyser data correction
A2 Chronology
The last two tie points of Gerber et al. (2021) have been omitted, as they were not in line with the match at larger depths. As observed in earlier work, most match points are located within interstadials, as the higher concentrations of alkaline dust in stadial ice neutralise any acid and mute the ECM and DEP signals. In most interstadials, the ECM records are very similar between EastGRIP and NorthGRIP (Fig. 2), but in the long GI-23.1, only the large-scale variations between the stadial and interstadial signal levels are similar, and we thus have a long interstadial section without any match points. In addition, we have no clear match points within the short GI-18. In order to avoid having to interpolate over the combined GS-18, GI-18, and GS-19.1 period, we have assigned a match point within GI-18 based on broad-scale patterns in ECM and DEP. The uncertainty in this match point is larger than the normal maximum uncertainty but still improves the overall accuracy of the interpolation.
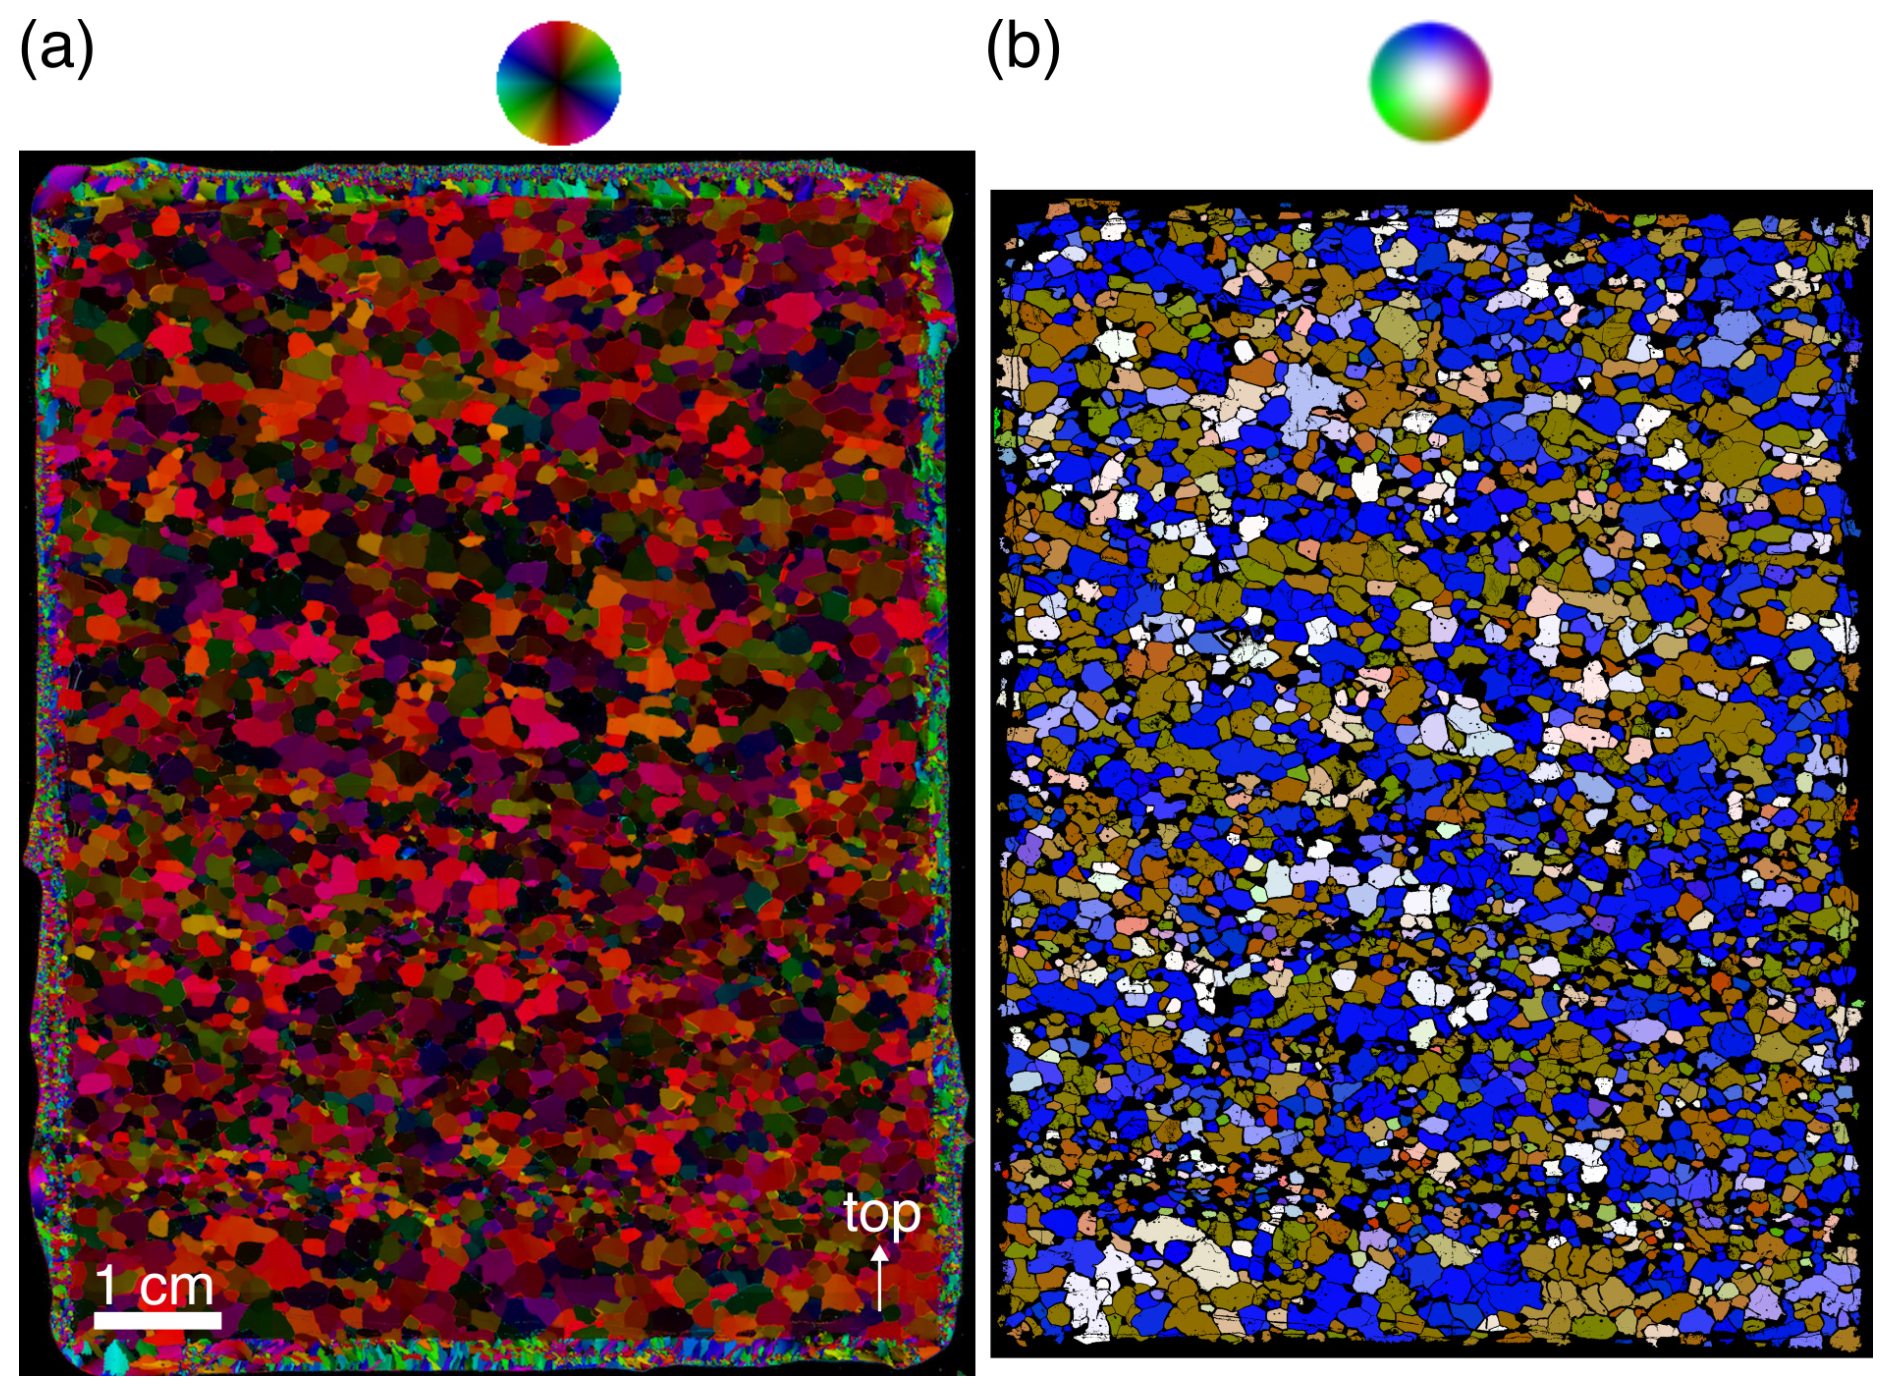
Figure A1Measured fabric image and processed cAxes image from a depth of 1565.3 m. (a) Original fabric image derived by the G50 fabric analyser. (b) Image after processing with cAxes. The surrounding artificial ice from gluing the sample to the plate was digitally removed. The colours represent the orientation of the c axis according to their respective colour wheels.
The GICC05 chronology was transferred to EastGRIP by linear interpolation of depths between the match points (Mojtabavi et al., 2020). The timescale uncertainty itself is comprised of the GICC05 maximum counting error, which applies to all cores synchronised to GICC05, and the timescale transfer uncertainty. The timescale transfer uncertainty comes from the uncertainty in the individual match points and the interpolation approach. Most match points have low uncertainty (on the order of a few centimetres), but occasionally, wide peaks or ambiguous alignment mean that the uncertainty in rare cases can be a few tens of centimetres (discussed by Mojtabavi et al., 2020).
Data are available via PANGAEA.
-
Chronology: https://doi.org/10.1594/PANGAEA.984827 (Rasmussen and Sinnl, 2025a)
-
ECM: https://doi.org/10.1594/PANGAEA.984831 (Rasmussen and Sinnl, 2025b)
-
DEP: https://doi.org/10.1594/PANGAEA.971616 (Wilhelms et al., 2025).
-
Crystal-preferred orientation data: https://doi.org/10.1594/PANGAEA.983953 (Weikusat et al., 2025).
The supplement related to this article is available online at https://doi.org/10.5194/tc-19-3805-2025-supplement.
The study was conceptualised by IW, DDJ, SK, JK, and NiS. The paper was written by NiS, IW, JK, KD, DJ, and SR, with contributions from all authors. Fabric data were collected by NiS, IW, JK, JE, DJ, JW, DW, TS, and TH and were processed and analysed by NiS, JK, KD, IW, and DJ, with contributions from all authors. DEP data were collected by NiS, DJ, JW, SK, AS, and IW and were processed by FW. GS processed the ECM data, which were matched by GS and SR. SR calculated the timescale. Funding was acquired by IW, PB, FW, MD, and DDJ.
The contact author has declared that none of the authors has any competing interests.
Publisher's note: Copernicus Publications remains neutral with regard to jurisdictional claims made in the text, published maps, institutional affiliations, or any other geographical representation in this paper. While Copernicus Publications makes every effort to include appropriate place names, the final responsibility lies with the authors.
We gratefully thank Steven Franke, Sebastian Hellmann, Pia Götz, Ina Kleitz, Wataru Shigeyama, Ernst-Jan Kuiper, Maddalena Bayer, Nicholas Rathmann, and Eliza Cook for their assistance in the sample preparation and measurement at EastGRIP. We thank Sonja Wahl, Florian Painer, Nils Hvidberg, Yannick Heiser, Nils F. Nymand, and Mikkel Lauritzen for contributing to DEP data. We further thank everybody involved in gathering ECM data. We acknowledge Alexander Schlemmer for his technical support in setting up the environment for remote data processing. We further thank Steven Franke and Shuji Fujita for valuable input that improved the quality of the paper. We thank the entire EastGRIP community for logistical assistance, ice core processing, and fruitful discussions. This work was carried out as part of the Helmholtz Junior Research group “The effect of deformation mechanisms for ice sheet dynamics” (VH-NG-802). Nicolas Stoll acknowledges additional funding from the Programma di Ricerche in Artico (PRA) and the German Academic Exchange Service (DAAD, Postdoc Fellowship RESTORATION). EastGRIP is directed and organised by the Centre for Ice and Climate at the Niels Bohr Institute, University of Copenhagen. It is supported by funding agencies and institutions in Denmark (A. P. Møller Foundation, University of Copenhagen), the USA (US National Science Foundation, Office of Polar Programs), Germany (Alfred Wegener Institute, Helmholtz Centre for Polar and Marine Research), Japan (National Institute of Polar Research and Arctic Challenge for Sustainability), Norway (University of Bergen and Trond Mohn Foundation), Switzerland (Swiss National Science Foundation), France (French Polar Institute Paul-Emile Victor, Institute for Geosciences and Environmental research), Canada (University of Manitoba) and China (Chinese Academy of Sciences and Beijing Normal University).
This research has been supported by the Helmholtz Association (grant no. VH-NG-802).
The article processing charges for this open-access publication were covered by the Alfred-Wegener-Institut Helmholtz-Zentrum für Polar- und Meeresforschung.
This paper was edited by Kaitlin Keegan and reviewed by Maurine Montagnat and David Prior.
Adam, J., Urai, J. L., Wieneke, B., Oncken, O., Pfeiffer, K., Kukowski, N., Lohrmann, J., Hoth, S., van der Zee, W., and Schmatz, J.: Shear localisation and strain distribution during tectonic faulting – new insights from granular-flow experiments and high-resolution optical image correlation techniques, J. Struct. Geol., 27, 283–301, https://doi.org/10.1016/j.jsg.2004.08.008, 2005. a
Alley, R. B.: Fabrics in polar ice sheets: Development and prediction, Science, 240, 493–495, https://doi.org/10.1126/science.240.4851.493, 1988. a, b, c, d, e, f, g
Alley, R. B.: Flow-law hypotheses for ice-sheet modeling, J. Glaciol., 38, 245–256, https://doi.org/10.3189/S0022143000003658, 1992. a
Andersen, K. K., Svensson, A., Johnsen, S. J., Rasmussen, S. O., Bigler, M., Röthlisberger, R., Ruth, U., Siggaard-Andersen, M.-L., Peder Steffensen, J., and Dahl-Jensen, D.: The Greenland Ice Core Chronology 2005, 15–42 ka. Part 1: constructing the time scale, Quaternary Sci. Rev., 25, 3246–3257, https://doi.org/10.1016/j.quascirev.2006.08.002, 2006. a
Azuma, N.: A flow law for anisotropic ice and its application to ice sheets, Earth Planet. Sc. Lett., 128, 601–614, 1994. a, b
Azuma, N. and Higashi, A.: Formation processes of ice fabric pattern in ice sheets, Ann. Glaciol., 6, 130–134, https://doi.org/10.1145/3209219.3209221, 1985. a, b
Bamber, J. L., Vaughan, D. G., and Joughin, I.: Widespread complex flow in the interior of the antarctic ice sheet, Science, 287, 1248–1250, https://doi.org/10.1126/science.287.5456.1248, 2000. a
Baëta, R. D. and Ashbee, K. H. G.: Slip systems in quartz: I. Experiments, Am. Mineral., 54, 1551–1573, 1969. a
Binder, T., Garbe, C., Wagenbach, D., Freitag, J., and Kipfstuhl, S.: Extraction and parametrization of grain boundary networks in glacier ice, using a dedicated method of automatic image analysis, Journal of Microscopy, 250, 130–141, https://doi.org/10.1111/jmi.12029, 2013. a
Bohleber, P., Stoll, N., Rittner, M., Roman, M., Weikusat, I., and Barbante, C.: Geochemical Characterization of Insoluble Particle Clusters in Ice Cores Using Two-Dimensional Impurity Imaging, Geochem. Geophy. Geosy., 24, e2022GC010595, https://doi.org/10.1029/2022GC010595, 2023. a, b
Bons, P. D. and Jessell, M. W.: Micro-shear zones in experimentally deformed octachloropropane, J. Struct. Geol., 21, 323–334, https://doi.org/10.1016/S0191-8141(98)90116-X, 1999. a
Bouchez, J. L. and Duval, P.: The Fabric of Polycrystalline Ice Deformed in Simple Shear: Experiments in Torsion, Natural Deformation and Geometrical Interpretation, Texture. Microstruct., 5, 171–190, 1982. a, b
Burg, J. P., Wilson, C. J. L., and Mitchell, J. C.: Dynamic recrystallization and fabric development during the simple shear deformation of ice, J. Struct. Geol., 8, 857–870, https://doi.org/10.1016/0191-8141(86)90031-3, 1986. a
Carreras, J.: Zooming on Northern Cap de Creus shear zones, J. Struct. Geol., 23, 1457–1486, https://doi.org/10.1016/S0191-8141(01)00011-6, 2001. a
Carreras, J. and Garcia Celma, A.: Quartz of C-Axis fabric variation at the margins of a shear zone developed in schists from Cap de Creus (Spain), Acta Geologica Hispanica, 17, 137–149, 1982. a
Casey, K., Fudge, T., Neumann, T., Steig, E., Cavitte, M., and Blankenship, D.: The 1500 m South Pole ice core: recovering a 40 ka environmental record, Ann. Glaciol., 55, 137–146, https://doi.org/10.3189/2014AoG68A016, 2014. a
Castelnau, O. and Duval, P.: Simulations of anisotropy and fabric development in polar ices, Ann. Glaciol., 20, 277–282, https://doi.org/10.3189/1994AoG20-1-277-282, 1994. a, b
Castelnau, O., Duval, P., Lebensohn, R. A., and Canova, G. R.: Viscoplastic modeling of texture development in polycrystalline ice with a self-consistent approach: Comparison with bound estimates, J. Geophys. Res.-Sol. Ea., 101, 13851–13868, https://doi.org/10.1029/96JB00412, 1996. a
Christie, J. M.: The Moine thrust zone in the Assynt region, northwest Scotland, University of California Press, https://cir.nii.ac.jp/crid/1130282270950398080, 1963. a, b
Craw, L., Qi, C., Prior, D. J., Goldsby, D. L., and Kim, D.: Mechanics and microstructure of deformed natural anisotropic ice, J. Struct. Geol., 115, 152–166, https://doi.org/10.1016/j.jsg.2018.07.014, 2018. a, b, c
Dahl-Jensen, D., Thorsteinsson, T., Alley, R., and Shoji, H.: Flow properties of the ice from the Greenland Ice Core Project ice core: The reason for folds?, J. Geophys. Res.-Oceans, 102, 26831–26840, https://doi.org/10.1029/97JC01266, 1997. a
Dansgaard, W. and Johnsen, S. J.: A Flow Model and a Time Scale for the Ice Core from Camp Century, Greenland, J. Glaciol., 8, 215–223, https://doi.org/10.3189/S0022143000031208, 1969. a
De La Chapelle, S., Castelnau, O., Lipenkov, V., and Duval, P.: Dynamic recrystallization and texture development in ice as revealed by the study of deep ice cores in Antarctica and Greenland, J. Geophys. Res.-Sol. Ea., 103, 5091–5105, https://doi.org/10.1029/97JB02621, 1998. a
de Riese, T., Evans, L., Gomez-Rivas, E., Griera, A., Lebensohn, R. A., Llorens, M.-G., Ran, H., Sachau, T., Weikusat, I., and Bons, P. D.: Shear localisation in anisotropic, non-linear viscous materials that develop a CPO: A numerical study, J. Struct. Geol., 124, 81–90, https://doi.org/10.1016/j.jsg.2019.03.006, 2019. a
Disbrow-Monz, M. E., Hudleston, P. J., and Prior, D. J.: Multimaxima crystallographic fabrics (CPO) in warm, coarse-grained ice: New insights, J. Struct. Geol., 182, 105107, https://doi.org/10.1016/j.jsg.2024.105107, 2024. a
Eichler, J.: C-axis analysis of the NEEM ice core: an approach based on digital image processing, PhD thesis, Freie Universität Berlin, Berlin, https://doi.org/10013/epic.41621.d001, 2013. a
Eichler, J., Kleitz, I., Bayer-Giraldi, M., Jansen, D., Kipfstuhl, S., Shigeyama, W., Weikusat, C., and Weikusat, I.: Location and distribution of micro-inclusions in the EDML and NEEM ice cores using optical microscopy and in situ Raman spectroscopy, The Cryosphere, 11, 1075–1090, https://doi.org/10.5194/tc-11-1075-2017, 2017. a, b
Eichler, J., Weikusat, C., Wegner, A., Twarloh, B., Behrens, M., Fischer, H., Hörhold, M., Jansen, D., Kipfstuhl, S., Ruth, U., Wilhelms, F., and Weikusat, I.: Impurity Analysis and Microstructure Along the Climatic Transition From MIS 6 Into 5e in the EDML Ice Core Using Cryo-Raman Microscopy, Frontiers in Earth Science, 7, 1–16, https://doi.org/10.3389/feart.2019.00020, 2019. a, b
EPICA Community Members: Eight glacial cycles from an Antarctic ice core EPICA community members, Nature, 429, 623–628, 2004. a
Etchecopar, A.: A plane kinematic model of progressive deformation in a polycrystalline aggregate, Tectonophysics, 39, 121–139, https://doi.org/10.1016/0040-1951(77)90092-0, 1977. a
Fahnestock, M., Bindschadler, R., Kwok, R., and Jezek, K.: Greenland Ice Sheet Surface Properties and Ice Dynamics from ERS-1 SAR Imagery, Science, 262, 1530–1534, https://doi.org/10.1126/science.262.5139.1530, 1993. a
Fahnestock, M., Abdalati, W., Joughin, I., Brozena, J., and Gogineni, P.: High Geothermal Heat Flow, Basal Melt, and the Origin of Rapid Ice Flow in Central Greenland, Science, 294, 2338–2342, https://doi.org/10.1126/science.1065370, 2001. a
Fan, S., Cross, A. J., Prior, D. J., Goldsby, D. L., Hager, T. F., Negrini, M., and Qi, C.: Crystallographic Preferred Orientation (CPO) Development Governs Strain Weakening in Ice: Insights From High-Temperature Deformation Experiments, J. Geophys. Res.-Sol. Ea., 126, e2021JB023173, https://doi.org/10.1029/2021JB023173, 2021. a
Faria, S. H., Weikusat, I., and Azuma, N.: The microstructure of polar ice. Part II: State of the art, J. Struct. Geol., 61, 21–49, https://doi.org/10.1016/j.jsg.2013.11.003, 2014. a, b, c, d
Fitzpatrick, J. J., Voigt, D. E., Fegyveresi, J. M., Stevens, N. T., Spencer, M. K., Cole-Dai, J., Alley, R. B., Jardine, G. E., Cravens, E. D., Wilen, L. A., Fudge, T., and Mcconnell, J. R.: Physical properties of the WAIS Divide ice core, J. Glaciol., 60, 1181–1198, https://doi.org/10.3189/2014JoG14J100, 2014. a, b, c
Frank, F. C. and Read, W. T.: Multiplication Processes for Slow Moving Dislocations, Physical Review, 79, 722–723, https://doi.org/10.1103/PhysRev.79.722, 1950. a
Franke, S., Jansen, D., Beyer, S., Neckel, N., Binder, T., Paden, J., and Eisen, O.: Complex Basal Conditions and Their Influence on Ice Flow at the Onset of the Northeast Greenland Ice Stream, J. Geophys. Res.-Earth, 126, e2020JF005689, https://doi.org/10.1029/2020JF005689, 2021. a
Franke, S., Bons, P. D., Westhoff, J., Weikusat, I., Binder, T., Streng, K., Steinhage, D., Helm, V., Eisen, O., Paden, J. D., Eagles, G., and Jansen, D.: Holocene ice-stream shutdown and drainage basin reconfiguration in northeast Greenland, Nat. Geosci., 15, 995–1001, https://doi.org/10.1038/s41561-022-01082-2, 2022. a, b, c, d, e
Freitag, J., Wilhelms, F., and Kipfstuhl, S.: Microstructure-dependent densification of polar firn derived from X-ray microtomography, J. Glaciol., 50, 243–250, https://doi.org/10.3189/172756504781830123, 2004. a
Fujita, S., Nakawo, M., and Shinji, M.: Orientation of the 700-m Mizuho core and its strain history, in: Proceedings of the NIPR Symposium on Polar Meteorology and Glaciology, Tachikawa, Tokyo, Japan, September 1987, 1, 122–131, https://cir.nii.ac.jp/crid/1571135651852389632, 1987. a, b
Fujita, S., Hirabayashi, M., Goto-Azuma, K., Dallmayr, R., Satow, K., Zheng, J., and Dahl-Jensen, D.: Densification of layered firn of the ice sheet at NEEM, Greenland, J. Glaciol., 60, 905–921, https://doi.org/10.3189/2014JoG14J006, 2014. a
Fujita, S., Goto-Azuma, K., Hirabayashi, M., Hori, A., Iizuka, Y., Motizuki, Y., Motoyama, H., and Takahashi, K.: Densification of layered firn in the ice sheet at Dome Fuji, Antarctica, J. Glaciol., 62, 103–123, https://doi.org/10.1017/jog.2016.16, 2016. a
Fukuda, A., Hondoh, T., and Higashi, A.: Dislocation Mechanisms of Plastic Deformation of Ice, Le Journal de Physique Colloques, 48, C1-163–C1-173, https://doi.org/10.1051/jphyscol:1987124, 1987. a
Garcia Celma, A.: C-axis-and shape-fabrics in quartz-mylonites of Cap de Creus (Spain): their properties and development., PhD thesis, Utrecht University, 1983. a
Gerber, T. A., Hvidberg, C. S., Rasmussen, S. O., Franke, S., Sinnl, G., Grinsted, A., Jansen, D., and Dahl-Jensen, D.: Upstream flow effects revealed in the EastGRIP ice core using Monte Carlo inversion of a two-dimensional ice-flow model, The Cryosphere, 15, 3655–3679, https://doi.org/10.5194/tc-15-3655-2021, 2021. a, b, c
Gerber, T. A., Lilien, D. A., Rathmann, N. M., Franke, S., Young, T. J., Valero-Delgado, F., Ershadi, M. R., Drews, R., Zeising, O., Humbert, A., Stoll, N., Weikusat, I., Grinsted, A., Hvidberg, C. S., Jansen, D., Miller, H., Helm, V., Steinhage, D., O’Neill, C., Paden, J., Gogineni, S. P., Dahl-Jensen, D., and Eisen, O.: Crystal orientation fabric anisotropy causes directional hardening of the Northeast Greenland Ice Stream, Nat. Commun., 14, 2653, https://doi.org/10.1038/s41467-023-38139-8, 2023. a, b, c, d
Gow, A. J. and Williamson, T.: Rheological implications of the internal structure and crystal fabrics of the West Antarctic ice sheet as revealed by deep core drilling at Byrd Station, GSA Bulletin, 87, 1665–1677, https://doi.org/10.1130/0016-7606(1976)87<1665:RIOTIS>2.0.CO;2, 1976. a, b, c, d
Grinsted, A., Hvidberg, C. S., Lilien, D. A., Rathmann, N. M., Karlsson, N. B., Gerber, T., Kjær, H. A., Vallelonga, P., and Dahl-Jensen, D.: Accelerating ice flow at the onset of the Northeast Greenland Ice Stream, Nat. Commun., 13, 5589, https://doi.org/10.1038/s41467-022-32999-2, 2022. a, b
Gross, G. W., Hayslip, I. C., and Hoy, R. N.: Electrical conductivity and relaxation in ice crystals with known Impurity content, J. Glaciol., 21, 143–160, https://doi.org/10.3189/S0022143000033372, 1978. a
Hammer, C. U.: Acidity of Polar Ice Cores in Relation to Absolute Dating, Past Volcanism, and Radio–Echoes, J. Glaciol., 25, 359–372, https://doi.org/10.3189/S0022143000015227, 1980. a
Hara, I., Takeda, K., and Kimura, T.: Preferred Lattice Orientation of Quartz in Shear Deformation, Journal of science of the Hiroshima University. Series C, Geology and Mineralogy, 7, 1–10, https://doi.org/10.15027/53047, 1973. a
Hellmann, S., Kerch, J., Weikusat, I., Bauder, A., Grab, M., Jouvet, G., Schwikowski, M., and Maurer, H.: Crystallographic analysis of temperate ice on Rhonegletscher, Swiss Alps, The Cryosphere, 15, 677–694, https://doi.org/10.5194/tc-15-677-2021, 2021. a
Hirth, J. P. and Lothe, J.: Theory of Dislocations, Krieger Publishing Company, Malabar, Florida, ISBN 9780521864367, 1982. a
Holschuh, N., Lilien, D. A., and Christianson, K.: Thermal Weakening, Convergent Flow, and Vertical Heat Transport in the Northeast Greenland Ice Stream Shear Margins, Geophys. Res. Lett., 46, 8184–8193, https://doi.org/10.1029/2019GL083436, 2019. a
Hondoh, T., Iwamatsu, H., and Mae, S.: Dislocation mobility for non-basal glide in ice measured by in situ X-ray topography, Philos. Mag. A, 62, 89–102, https://doi.org/10.1080/01418619008244337, 1990. a
Hooke, R. L. and Hudleston, P. J.: Ice Fabrics in a Vertical Flow Plane, Barnes Ice Cap, Canada, J. Glaciol., 25, 195–214, https://doi.org/10.3189/S0022143000010443, 1980. a
Hörhold, M. W., Laepple, T., Freitag, J., Bigler, M., Fischer, H., and Kipfstuhl, S.: On the impact of impurities on the densification of polar firn, Earth Planet. Sc. Lett., 325-326, 93–99, https://doi.org/10.1016/j.epsl.2011.12.022, 2012. a
Hvidberg, C. S., Grinsted, A., Dahl-Jensen, D., Khan, S. A., Kusk, A., Andersen, J. K., Neckel, N., Solgaard, A., Karlsson, N. B., Kjær, H. A., and Vallelonga, P.: Surface velocity of the Northeast Greenland Ice Stream (NEGIS): assessment of interior velocities derived from satellite data by GPS, The Cryosphere, 14, 3487–3502, https://doi.org/10.5194/tc-14-3487-2020, 2020. a, b
IPCC: IPCC 13 Observations: Cryosphere, Climate Change 2013: The Physical Science Basis. Contribution of Working Group I to the Fifth Assessment Report of the Intergovernmental Panel on Climate Change, 317–382, https://doi.org/10.1017/CBO9781107415324.012, 2013. a
IPCC: The Ocean and Cryosphere in a Changing Climate Special Report of the Intergovernmental Panel on Climate Change, Cambridge University Press, Cambridge, ISBN 978-1-00-915796-4, https://doi.org/10.1017/9781009157964.005, 2022. a
Jacka, T. and Maccagnan, M.: Ice crystallographic and strain rate changes with strain in compression and extension, Cold Reg. Sci. Technol., 8, 269–286, https://doi.org/10.1016/0165-232X(84)90058-2, 1984. a
Jackson, M. and Kamb, B.: The marginal shear stress of Ice Stream B, West Antarctica, J. Glaciol., 43, 415–426, https://doi.org/10.3189/S0022143000035000, 1997. a
Jansen, D., Franke, S., Bauer, C. C., Binder, T., Dahl-Jensen, D., Eichler, J., Eisen, O., Hu, Y., Kerch, J., Llorens, M.-G., Miller, H., Neckel, N., Paden, J., de Riese, T., Sachau, T., Stoll, N., Weikusat, I., Wilhelms, F., Zhang, Y., and Bons, P. D.: Shear margins in upper half of Northeast Greenland Ice Stream were established two millennia ago, Nat. Commun., 15, 1193, https://doi.org/10.1038/s41467-024-45021-8, 2024. a, b, c, d, e, f, g, h, i, j
Jones, S. J. and Glen, J. W.: The effect of dissolved impurities on the mechanical properties of ice crystals, Philos. Mag., 19, 13–24, https://doi.org/10.1080/14786436908217758, 1969. a
Jordan, T. M., Martín, C., Brisbourne, A. M., Schroeder, D. M., and Smith, A. M.: Radar Characterization of Ice Crystal Orientation Fabric and Anisotropic Viscosity Within an Antarctic Ice Stream, J. Geophys. Res.-Earth, 127, e2022JF006673, https://doi.org/10.1029/2022JF006673, 2022. a
Joughin, I., Smith, B., Howat, I., and Scambos, T.: MEaSUREs Greenland Ice Sheet Velocity Map from InSAR Data, Version 1, National Snow and Ice Data Center [data set], https://doi.org/10.5067/MEASURES/CRYOSPHERE/NSIDC-0478.001, 2010a. a, b
Joughin, I., Smith, B. E., Howat, I. M., Scambos, T., and Moon, T.: Greenland flow variability from ice-sheet-wide velocity mapping, J. Glaciol., 56, 415–430, https://doi.org/10.3189/002214310792447734, 2010b. a, b
Kamb, B.: Experimental Recrystallization of Ice Under Stress, Flow and Fracture of Rocks, American Geophysical Union Geophysical Monograph, 16, 211–241, https://doi.org/10.1029/GM016p0211, 1972. a, b
Kamb, W. B.: Ice petrofabric observations from Blue Glacier, Washington, in relation to theory and experiment, J. Geophys. Res., 64, 1891–1909, https://doi.org/10.1029/JZ064i011p01891, 1959. a, b
Khan, S. A., Choi, Y., Morlighem, M., Rignot, E., Helm, V., Humbert, A., Mouginot, J., Millan, R., Kjær, K. H., and Bjørk, A. A.: Extensive inland thinning and speed-up of Northeast Greenland Ice Stream, Nature, 611, 727–732, https://doi.org/10.1038/s41586-022-05301-z, 2022. a
Kipfstuhl, S., Faria, S. H., Azuma, N., Freitag, J., Hamann, I., Kaufmann, P., Miller, H., Weiler, K., and Wilhelms, F.: Evidence of dynamic recrystallization in polar firn, J. Geophys. Res.-Sol. Ea., 114, B05204, https://doi.org/10.1029/2008JB005583, 2009. a
Krischke, A., Oechsner, U., and Kipfstuhl, S.: Rapid Microstructure Analysis of Polar Ice Cores, Optik & Photonik, 10, 32–35, https://doi.org/10.1002/opph.201500016, 2015. a
Law, R. D., Casey, M., and Knipe, R. J.: Kinematic and tectonic significance of microstructures and crystallographic fabrics within quartz mylonites from the Assynt and Eriboll regions of the Moine thrust zone, NW Scotland, T. RSE Earth, 77, 99–125, https://doi.org/10.1017/S0263593300010774, 1986. a, b, c
Lilien, D. A., Rathmann, N. M., Hvidberg, C. S., and Dahl-Jensen, D.: Modeling Ice-Crystal Fabric as a Proxy for Ice-Stream Stability, Journal of Geophys. Res.-Earth, 126, e2021JF006306, https://doi.org/10.1029/2021JF006306, 2021. a, b, c
Lipenkov, V. Y., Barkov, N. I., Duval, P., and Pimienta, P.: Crystalline Texture of the 2083 m Ice Core at Vostok Station, Antarctica, J. Glaciol., 35, 392–398, https://doi.org/10.3189/S0022143000009321, 1989. a, b, c
Lister, G. S.: The theory of deformation fabrics, PhD thesis, Australian National University, 1974. a
Lister, G. S.: Discussion: Crossed-girdle c-axis fabrics in quartzites plastically deformed by plane strain and progressive simple shear, Tectonophysics, 39, 51–54, https://doi.org/10.1016/0040-1951(77)90087-7, 1977. a, b
Lister, G. S. and Dornsiepen, U. F.: Fabric transitions in the Saxony granulite terrain, J. Struct. Geol., 4, 81–92, https://doi.org/10.1016/0191-8141(82)90009-8, 1982. a
Lister, G. S. and Hobbs, B. E.: The simulation of fabric development during plastic deformation and its application to quartzite : the influence of detormation history, J. Struct. Geol., 2, 355–370, 1980. a, b
Llorens, M.-G., Griera, A., Bons, P. D., Lebensohn, R. A., Evans, L. A., Jansen, D., and Weikusat, I.: Full-field predictions of ice dynamic recrystallisation under simple shear conditions, Earth Planet. Sc. Lett., 450, 233–242, https://doi.org/10.1016/j.epsl.2016.06.045, 2016a. a
Llorens, M. G., Griera, A., Bons, P. D., Roessiger, J., Lebensohn, R., Evans, L., and Weikusat, I.: Dynamic recrystallisation of ice aggregates during co-axial viscoplastic deformation: A numerical approach, J. Glaciol., 62, 359–377, https://doi.org/10.1017/jog.2016.28, 2016b. a
Llorens, M.-G., Griera, A., Bons, P. D., Weikusat, I., Prior, D. J., Gomez-Rivas, E., de Riese, T., Jimenez-Munt, I., García-Castellanos, D., and Lebensohn, R. A.: Can changes in deformation regimes be inferred from crystallographic preferred orientations in polar ice?, The Cryosphere, 16, 2009–2024, https://doi.org/10.5194/tc-16-2009-2022, 2022. a, b, c, d, e, f, g, h, i
Lutz, F., Prior, D. J., Still, H., Bowman, M. H., Boucinhas, B., Craw, L., Fan, S., Kim, D., Mulvaney, R., Thomas, R. E., and Hulbe, C. L.: Ultrasonic and seismic constraints on crystallographic preferred orientations of the Priestley Glacier shear margin, Antarctica, The Cryosphere, 16, 3313–3329, https://doi.org/10.5194/tc-16-3313-2022, 2022. a
Margold, M., Stokes, C. R., and Clark, C. D.: Ice streams in the Laurentide Ice Sheet: Identification, characteristics and comparison to modern ice sheets, Earth-Sci. Rev., 143, 117–146, https://doi.org/10.1016/j.earscirev.2015.01.011, 2015. a
Mojtabavi, S., Wilhelms, F., Cook, E., Davies, S. M., Sinnl, G., Skov Jensen, M., Dahl-Jensen, D., Svensson, A., Vinther, B. M., Kipfstuhl, S., Jones, G., Karlsson, N. B., Faria, S. H., Gkinis, V., Kjær, H. A., Erhardt, T., Berben, S. M. P., Nisancioglu, K. H., Koldtoft, I., and Rasmussen, S. O.: A first chronology for the East Greenland Ice-core Project (EGRIP) over the Holocene and last glacial termination, Clim. Past, 16, 2359–2380, https://doi.org/10.5194/cp-16-2359-2020, 2020. a, b, c, d, e, f, g, h
Montagnat, M., Buiron, D., Arnaud, L., Broquet, A., Schlitz, P., Jacob, R., and Kipfstuhl, S.: Measurements and numerical simulation of fabric evolution along the Talos Dome ice core, Antarctica, Earth Planet. Sc. Lett., 357-358, 168–178, https://doi.org/10.1016/j.epsl.2012.09.025, 2012. a
Montagnat, M., Azuma, N., Dahl-Jensen, D., Eichler, J., Fujita, S., Gillet-Chaulet, F., Kipfstuhl, S., Samyn, D., Svensson, A., and Weikusat, I.: Fabric along the NEEM ice core, Greenland, and its comparison with GRIP and NGRIP ice cores, The Cryosphere, 8, 1129–1138, https://doi.org/10.5194/tc-8-1129-2014, 2014a. a, b, c, d, e, f, g, h
Montagnat, M., Castelnau, O., Bons, P. D., Faria, S. H., Gagliardini, O., Gillet-Chaulet, F., Grennerat, F., Griera, A., Lebensohn, R. A., Moulinec, H., Roessiger, J., and Suquet, P.: Multiscale modeling of ice deformation behavior, J. Struct. Geol., 61, 78–108, https://doi.org/10.1016/j.jsg.2013.05.002, 2014b. a
Montagnat, M., Chauve, T., Barou, F., Tommasi, A., Beausir, B., and Fressengeas, C.: Analysis of dynamic recrystallization of ice from EBSD orientation mapping, Frontiers in Earth Sciences, 3, 1–13, https://doi.org/10.3389/feart.2015.00081, 2015. a
Montagnat, M., Löwe, H., Calonne, N., Schneebeli, M., Matzl, M., and Jaggi, M.: On the Birth of Structural and Crystallographic Fabric Signals in Polar Snow: A Case Study From the EastGRIP Snowpack, Frontiers in Earth Science, 8, 1–23, https://doi.org/10.3389/feart.2020.00365, 2020. a
Monz, M. E., Hudleston, P. J., Prior, D. J., Michels, Z., Fan, S., Negrini, M., Langhorne, P. J., and Qi, C.: Full crystallographic orientation (c and a axes) of warm, coarse-grained ice in a shear-dominated setting: a case study, Storglaciären, Sweden, The Cryosphere, 15, 303–324, https://doi.org/10.5194/tc-15-303-2021, 2021. a
Moore, J. C., Wolff, E. W., Clausen, H. B., and Hammer, C. U.: The chemical basis for the electrical stratigraphy of ice, J. Geophys. Res., 97, 1887–1896, https://doi.org/10.1029/91JB02750, 1992. a
NEEM community members: Eemian interglacial reconstructed from a Greenland folded ice core, Nature, 493, 489–494, https://doi.org/10.1038/nature11789, 2013. a
Nick, F. M., Vieli, A., Andersen, M. L., Joughin, I., Payne, A., Edwards, T. L., Pattyn, F., and Van De Wal, R. S.: Future sea-level rise from Greenland's main outlet glaciers in a warming climate, Nature, 497, 235–238, https://doi.org/10.1038/nature12068, 2013. a
Nymand, N. F., Lilien, D. A., Gerber, T. A., Hvidberg, C. S., Steinhage, D., Gogineni, S. P., Taylor, D., and Dahl-Jensen, D.: Double reflections in novel polarized radar data reveal ice fabric in the North East Greenland Ice Stream, Geophysical Research Letters, 52, e2024GL110453, https://doi.org/10.1029/2024GL110453, 2024. a
Oraschewski, F. M. and Grinsted, A.: Modeling enhanced firn densification due to strain softening, The Cryosphere, 16, 2683–2700, https://doi.org/10.5194/tc-16-2683-2022, 2022. a
Paterson, W. S. B.: Why ice-age ice is sometimes “soft”, Cold Reg. Sci. Technol., 20, 75–98, 1991. a, b, c
Pearce, E., Zigone, D., Hofstede, C., Fichtner, A., Rimpot, J., Rasmussen, S. O., Freitag, J., and Eisen, O.: Firn seismic anisotropy in the Northeast Greenland Ice Stream from ambient-noise surface waves, The Cryosphere, 18, 4917–4932, https://doi.org/10.5194/tc-18-4917-2024, 2024. a
Petit, J. R., Jouzel, J., Raynaud, D., Barkov, N. I., Barnola, J.-M., Basile, I., Bender, M., Chappellaz, J., Davisk, M., Delaygue, G., Delmotte, M., Kotlyakov, V. M., Legrand, M., Lipenkov, V. Y., Lorius, C., Pépin, L., Ritz, C., Saltzmank, E., and Stievenard, M.: Climate and atmospheric history of the past 420,000 years from the Vostok ice core, Antarctica The recent completion of drilling at Vostok station in East, Nature, 399, 429–436, 1999. a
Piazolo, S., Bons, P. D., Griera, A., Llorens, M.-G., Gomez-Rivas, E., Koehn, D., Wheeler, J., Gardner, R., Godinho, J. R. A., Evans, L., Lebensohn, R. A., and Jessell, M. W.: A review of numerical modelling of the dynamics of microstructural development in rocks and ice: past, present and future, J. Struct. Geol., 125, 111–123, https://doi.org/10.1016/j.jsg.2018.05.025, 2019. a
Qi, C., Prior, D. J., Craw, L., Fan, S., Llorens, M.-G., Griera, A., Negrini, M., Bons, P. D., and Goldsby, D. L.: Crystallographic preferred orientations of ice deformed in direct-shear experiments at low temperatures, The Cryosphere, 13, 351–371, https://doi.org/10.5194/tc-13-351-2019, 2019. a
Ramsay, J. G. and Huber, M. I.: The techniques of modern structural geology. Volume 1, Strain analysis, Academic Press, London, ISBN 0-12-576901-6, 1983. a
Ranganathan, M. and Minchew, B.: A modified viscous flow law for natural glacier ice: Scaling from laboratories to ice sheets, P. Natl. Acad. Sci. USA, 121, e2309788121, https://doi.org/10.1073/pnas.2309788121, 2024. a, b
Rasmussen, S. O. and Sinnl, G.: Chronology for the East GReenland Ice-core Project (EGRIP), extended to 108,305 years before 2000 CE, PANGAEA [data set publication series], https://doi.org/10.1594/PANGAEA.984827, 2025a. a
Rasmussen, S. O. and Sinnl, G.: Acidity measured with the Electrical Conductivity Method (ECM) on the full EGRIP ice core, converted to hydrogen ion concentration, PANGAEA [data set], https://doi.org/10.1594/PANGAEA.984831, 2025b. a
Rasmussen, S. O., Andersen, K. K., Svensson, A. M., Steffensen, J. P., Vinther, B. M., Clausen, H. B., Siggaard-Andersen, M.-L., Johnsen, S. J., Larsen, L. B., Dahl-Jensen, D., Bigler, M., Röthlisberger, R., Fischer, H., Goto-Azuma, K., Hansson, M. E., and Ruth, U.: A new Greenland ice core chronology for the last glacial termination, J. Geophys. Research, 111, D06102, https://doi.org/10.1029/2005JD006079, 2006. a
Rasmussen, S. O., Abbott, P. M., Blunier, T., Bourne, A. J., Brook, E., Buchardt, S. L., Buizert, C., Chappellaz, J., Clausen, H. B., Cook, E., Dahl-Jensen, D., Davies, S. M., Guillevic, M., Kipfstuhl, S., Laepple, T., Seierstad, I. K., Severinghaus, J. P., Steffensen, J. P., Stowasser, C., Svensson, A., Vallelonga, P., Vinther, B. M., Wilhelms, F., and Winstrup, M.: A first chronology for the North Greenland Eemian Ice Drilling (NEEM) ice core, Clim. Past, 9, 2713–2730, https://doi.org/10.5194/cp-9-2713-2013, 2013. a
Rasmussen, S. O., Bigler, M., Blockley, S. P., Blunier, T., Buchardt, S. L., Clausen, H. B., Cvijanovic, I., Dahl-Jensen, D., Johnsen, S. J., Fischer, H., Gkinis, V., Guillevic, M., Hoek, W. Z., Lowe, J. J., Pedro, J. B., Popp, T., Seierstad, I. K., Steffensen, J. P., Svensson, A. M., Vallelonga, P., Vinther, B. M., Walker, M. J. C., Wheatley, J. J., and Winstrup, M.: A stratigraphic framework for abrupt climatic changes during the Last Glacial period based on three synchronized Greenland ice-core records: refining and extending the INTIMATE event stratigraphy, Quaternary Sci. Rev., 106, 14–28, https://doi.org/10.1016/j.quascirev.2014.09.007, 2014. a, b
Rathmann, N. M. and Lilien, D. A.: Inferred basal friction and mass flux affected by crystal-orientation fabrics, J. Glaciol., 68, 236–252, https://doi.org/10.1017/jog.2021.88, 2022. a
Rathmann, N. M., Lilien, D. A., Grinsted, A., Gerber, T. A., Young, T. J., and Dahl-Jensen, D.: On the Limitations of Using Polarimetric Radar Sounding to Infer the Crystal Orientation Fabric of Ice Masses, Geophys. Res. Lett., 49, e2021GL096244, https://doi.org/10.1029/2021GL096244, 2022. a
Richards, D. H., Pegler, S. S., Piazolo, S., Stoll, N., and Weikusat, I.: Bridging the Gap Between Experimental and Natural Fabrics: Modeling Ice Stream Fabric Evolution and its Comparison With Ice-Core Data, J. Geophys. Res.-Sol. Ea., 128, e2023JB027245, https://doi.org/10.1029/2023JB027245, 2023. a, b, c
Rignot, E. and Mouginot, J.: Ice flow in Greenland for the International Polar Year 2008–2009, Geophys. Res. Lett., 39, L11501, https://doi.org/10.1029/2012GL051634, 2012. a
Rigsby, G. P.: Crystal Fabric Studies on Emmons Glacier Mount Rainier, Washington, J. Geol., 59, 590–598, https://doi.org/10.1086/625914, 1951. a
Russell-Head, D. S. and Budd, W. F.: Ice-Sheet Flow Properties Derived from Bore-Hole Shear Measurements Combined With Ice-Core Studies, J. Glaciol., 24, 117–130, https://doi.org/10.3189/S0022143000014684, 1979. a
Sander, N. R. B.: An Introduction to the Study of Geological Bodies, Geol. Mag., 107, 483–484, https://doi.org/10.1017/S001675680005768X, 1970. a
Schmid, S. and Casey, M.: Complete fabric analysis of some commonly observed quartz C-axis patterns, Mineral and Rock Deformation, American Geophysical Union (AGU), ISBN 0-87590-062-3, 1986. a, b, c
Seierstad, I. K., Abbott, P. M., Bigler, M., Blunier, T., Bourne, A. J., Brook, E., Buchardt, S. L., Buizert, C., Clausen, H. B., Cook, E., Dahl-Jensen, D., Davies, S. M., Guillevic, M., Johnsen, S. J., Pedersen, D. S., Popp, T. J., Rasmussen, S. O., Severinghaus, J. P., Svensson, A., and Vinther, B. M.: Consistently dated records from the Greenland GRIP, GISP2 and NGRIP ice cores for the past 104 ka reveal regional millennial-scale δ18O gradients with possible Heinrich event imprint, Quaternary Sci. Rev., 106, 29–46, https://doi.org/10.1016/j.quascirev.2014.10.032, 2014. a
Shearwood, C. and Whitworth, R. W.: The velocity of dislocations in ice, Philos. Mag. A, 64, 289–302, https://doi.org/10.1080/01418619108221186, 1991. a
Sinnl, G., Winstrup, M., Erhardt, T., Cook, E., Jensen, C. M., Svensson, A., Vinther, B. M., Muscheler, R., and Rasmussen, S. O.: A multi-ice-core, annual-layer-counted Greenland ice-core chronology for the last 3800 years: GICC21, Clim. Past, 18, 1125–1150, https://doi.org/10.5194/cp-18-1125-2022, 2022. a
Smith, E. C., Baird, A. F., Kendall, J. M., Martín, C., White, R. S., Brisbourne, A. M., and Smith, A. M.: Ice fabric in an Antarctic ice stream interpreted from seismic anisotropy, Geophys. Res. Lett., 44, 3710–3718, https://doi.org/10.1002/2016GL072093, 2017. a, b
Stokes, C. R., Margold, M., Clark, C. D., and Tarasov, L.: Ice stream activity scaled to ice sheet volume during Laurentide Ice Sheet deglaciation, Nature, 530, 322–326, https://doi.org/10.1038/nature16947, 2016. a
Stoll, N., Eichler, J., Hörhold, M., Erhardt, T., Jensen, C., and Weikusat, I.: Microstructure, micro-inclusions, and mineralogy along the EGRIP ice core – Part 1: Localisation of inclusions and deformation patterns, The Cryosphere, 15, 5717–5737, https://doi.org/10.5194/tc-15-5717-2021, 2021a. a, b, c, d
Stoll, N., Eichler, J., Hörhold, M., Shigeyama, W., and Weikusat, I.: A Review of the Microstructural Location of Impurities and Their Impacts on Deformation, Frontiers in Earth Science, 8, https://doi.org/10.3389/feart.2020.615613, 2021b. a, b, c
Stoll, N., Hörhold, M., Erhardt, T., Eichler, J., Jensen, C., and Weikusat, I.: Microstructure, micro-inclusions, and mineralogy along the EGRIP (East Greenland Ice Core Project) ice core – Part 2: Implications for palaeo-mineralogy, The Cryosphere, 16, 667–688, https://doi.org/10.5194/tc-16-667-2022, 2022. a, b
Stoll, N., Westhoff, J., Bohleber, P., Svensson, A., Dahl-Jensen, D., Barbante, C., and Weikusat, I.: Chemical and visual characterisation of EGRIP glacial ice and cloudy bands within, The Cryosphere, 17, 2021–2043, https://doi.org/10.5194/tc-17-2021-2023, 2023. a, b, c, d
Svensson, A., Andersen, K. K., Bigler, M., Clausen, H. B., Dahl-Jensen, D., Davies, S. M., Johnsen, S. J., Muscheler, R., Rasmussen, S. O., and Röthlisberger, R.: The Greenland Ice Core Chronology 2005, 15–42 ka. Part 2: comparison to other records, Quaternary Sci. Rev., 25, 3258–3267, https://doi.org/10.1016/j.quascirev.2006.08.003, 2006. a
Sylvester, A. G. and Christie, J. M.: The Origin of Crossed-Girdle Orientations of Optic Axes in Deformed Quartzites, J. Geol., 76, 571–580, https://doi.org/10.1086/627360, 1968. a
Thorsteinsson, T., Kipfstuhl, J., and Miller, H.: Textures and fabrics in the GRIP ice core, J. Geophys. Res.-Oceans, 102, 26583–26599, https://doi.org/10.1029/97JC00161, 1997. a, b, c, d, e, f
Thwaites, R. J., Wilson, C. J. L., and McCray, A. P.: Relationship Between Bore-Hole Closure and Crystal Fabrics in Antarctic Ice Core from Cape Folger, J. Glaciol., 30, 171–179, https://doi.org/10.3189/S0022143000005906, 1984. a
Tison, J.-L. and Hubbard, B.: Ice crystallographic evolution at a temperate glacier: Glacier de Tsanfleuron, Switzerland, Geological Society, London, Special Publications, 176, 23–38, https://doi.org/10.1144/GSL.SP.2000.176.01.03, 2000. a
Toy, V. G., Prior, D. J., and Norris, R. J.: Quartz fabrics in the Alpine Fault mylonites: Influence of pre-existing preferred orientations on fabric development during progressive uplift, J. Struct. Geol., 30, 602–621, https://doi.org/10.1016/j.jsg.2008.01.001, 2008. a, b
van den Broeke, M., Bamber, J., Ettema, J., Rignot, E., Schrama, E., van de Berg, W. J., van Meijgaard, E., Velicogna, I., and Wouters, B.: Partitioning Recent Greenland Mass Loss, Science, 326, 984–986, https://doi.org/10.1126/science.1178176, 2009. a
Vandecrux, B., Box, J. E., Ahlstrøm, A. P., Andersen, S. B., Bayou, N., Colgan, W. T., Cullen, N. J., Fausto, R. S., Haas-Artho, D., Heilig, A., Houtz, D. A., How, P., Iosifescu Enescu, I., Karlsson, N. B., Kurup Buchholz, R., Mankoff, K. D., McGrath, D., Molotch, N. P., Perren, B., Revheim, M. K., Rutishauser, A., Sampson, K., Schneebeli, M., Starkweather, S., Steffen, S., Weber, J., Wright, P. J., Zwally, H. J., and Steffen, K.: The historical Greenland Climate Network (GC-Net) curated and augmented level-1 dataset, Earth Syst. Sci. Data, 15, 5467–5489, https://doi.org/10.5194/essd-15-5467-2023, 2023. a
Vinther, B. M., Clausen, H. B., Johnsen, S. J., Rasmussen, S. O., Andersen, K. K., Buchardt, S. L., Dahl-Jensen, D., Seierstad, I. K., Siggaard-Andersen, M.-L., Steffensen, J. P., Svensson, A., Olsen, J., and Heinemeier, J.: A synchronized dating of three Greenland ice cores throughout the Holocene, J. Geophys. Res.-Atmos., 111, D13102, https://doi.org/10.1029/2005JD006921, 2006. a
Voigt, D. E.: c-Axis Fabric of the South Pole Ice Core, SPC14, USAP-DC [data set], https://doi.org/10.15784/601057, 2017. a, b, c
Vollmer, F. W.: A triangular fabric plot with applications for structural analysis, American Geophysical Union Transactions, 70, 463, https://www2.newpaltz.edu/~vollmerf/papers/Vollmer_1989_AGU.pdf, 1989. a, b
Vollmer, F. W.: An application of eigenvalue methods to structural domain analysis, GSA Bulletin, 102, 786–791, https://doi.org/10.1130/0016-7606(1990)102<0786:AAOEMT>2.3.CO;2, 1990. a, b
Wallbrecher, E.: Tektonische und gefügeanalytische Arbeitsweisen: graphische, rechnerische und statistische Verfahren, Enke, Stuttgart, ISBN 3432956711, 1986. a
Wang, Q., Okudaira, T., and Shigematsu, N.: Dominant slip systems of quartz under lower amphibolite-facies conditions identified from microstructures and CPOs in quartz phenocrysts, J. Struct. Geol., 182, 105106, https://doi.org/10.1016/j.jsg.2024.105106, 2024. a
Wang, Y., Thorsteinsson, T., Kipfstuhl, J., Miller, H., Dahl-Jensen, D., and Shoji, H.: A vertical girdle fabric in the NorthGRIP deep ice core, North Greenland, Ann. Glaciol., 35, 515–520, https://doi.org/10.3189/172756402781817301, 2002. a, b, c, d, e
Wang, Y., Kipfstuhl, S., Azuma, N., Thorsteinsson, T., and Miller, H.: Ice-fabrics study in the upper 1500 m of the Dome C (East Antarctica) deep ice core, Ann. Glaciol., 37, 97–104, https://doi.org/10.3189/172756403781816031, 2003. a
Watanabe, O., Jouzel, J., Johnsen, S., Parrenin, F., Shoji, H., and Yoshida, N.: Homogeneous climate variability across East Antarctica over the past three glacial cycles, Nature, 422, 509–512, https://doi.org/10.1038/nature01525, 2003. a
Weertman, J. and Weertman, J. R.: Elementary Dislocation Theory, Oxford University Press, Oxford, ISBN 978-0-19-506900-6, 1992. a
Weikusat, I., Kipfstuhl, S., Faria, S. H., Azuma, N., and Miyamoto, A.: Subgrain boundaries and related microstructural features in EDML (Antarctica) deep ice core, J. Glaciol., 55, 461–472, https://doi.org/10.3189/002214309788816614, 2009. a, b
Weikusat, I., Miyamoto, A., Faria, S. H., Kipfstuhl, S., Azuma, N., and Hondoh, T.: Subgrain boundaries in Antarctic ice quantified by X-ray Laue diffraction, J. Glaciol., 57, 111–120, https://doi.org/10.3189/002214311795306628, 2011. a
Weikusat, I., Jansen, D., Binder, T., Eichler, J., Faria, S. H., Wilhelms, F., Kipfstuhl, S., Sheldon, S., Miller, H., Dahl-Jensen, D., and Kleiner, T.: Physical analysis of an Antarctic ice core–towards an integration of micro- and macrodynamics of polar ice, Philos. T. R. Soc. A, 375, 20150347, https://doi.org/10.1098/rsta.2015.0347, 2017. a, b, c, d, e, f
Weikusat, I., Stoll, N., Kerch, J., Eichler, J., Jansen, D., Darányi, K., Kleitz, I., Shigeyama, W., Homma, T., Bayer, M., Götz, P., Kuiper, E.-J. N., Saruya, T., Franke, S., Hellmann, S., Rathmann, N. M., Wallis, D., Cook, E., and Kipfstuhl, S.: Crystal-preferred orientation data from the polar ice core EGRIP (vertical and horizontal thin section data, raw and processed), 111–2664 m depth, 2017–2023, PANGAEA [data set], https://doi.org/10.1594/PANGAEA.983953, 2025. a
Westhoff, J., Stoll, N., Franke, S., Weikusat, I., Bons, P., Kerch, J., Jansen, D., Kipfstuhl, S., and Dahl-Jensen, D.: A stratigraphy-based method for reconstructing ice core orientation, Ann. Glaciol., 62, 191–202, https://doi.org/10.1017/aog.2020.76, 2021. a, b, c
Westhoff, J., Sinnl, G., Svensson, A., Freitag, J., Kjær, H. A., Vallelonga, P., Vinther, B., Kipfstuhl, S., Dahl-Jensen, D., and Weikusat, I.: Melt in the Greenland EastGRIP ice core reveals Holocene warm events, Clim. Past, 18, 1011–1034, https://doi.org/10.5194/cp-18-1011-2022, 2022. a, b, c
Westhoff, J., Freitag, J., Orsi, A., Martinerie, P., Weikusat, I., Dyonisius, M., Faïn, X., Fourteau, K., and Blunier, T.: Combining traditional and novel techniques to increase our understanding of the lock-in depth of atmospheric gases in polar ice cores – results from the EastGRIP region, The Cryosphere, 18, 4379–4397, https://doi.org/10.5194/tc-18-4379-2024, 2024. a
Wilhelms, F., Kipfstuhl, J., Miller, H., Heinloth, K., and Firestone, J.: Precise dielectric profiling of ice cores: a new device with improved guarding and its theory, J. Glaciol., 44, 171–174, https://doi.org/10.3189/S002214300000246X, 1998. a
Wilhelms, F., Stoll, N., Jansen, D., Freitag, J., Heiser, Y., Wahl, S., Painer, F., Hvidberg, N., Lauritzen, M., Nymand, N., Westhoff, J., Svensson, A. M., Vinther, B. M., Kipfstuhl, S., Dahl-Jensen, D., and Weikusat, I.: Conductivity and permittivity measured with the dielectric profiling (DEP) technique on the EGRIP ice core, 2120.850–2656.995 m depth, PANGAEA [data set], https://doi.org/10.1594/PANGAEA.971616, 2025. a
Wilson, C. J., Russell-Head, D. S., and Sim, H. M.: The application of an automated fabric analyzer system to the textural evolution of folded ice layers in shear zones, Ann. Glaciol., 37, 7–17, https://doi.org/10.3189/172756403781815401, 2003. a
Wilson, C. J. L.: Boundary structures and grain shape in deformed multilayered polycrystalline ice, Tectonophysics, 57, T19–T25, https://doi.org/10.1016/0040-1951(79)90139-2, 1979. a
Wilson, C. J. L.: Experimental folding and fabric development in multilayered ice, Tectonophysics, 78, 139–159, https://doi.org/10.1016/0040-1951(81)90011-1, 1981. a
Wilson, C. J. L. and Russell-Head, D. S.: Experimental folding in ice and the resultant c-axis fabrics, Nature, 279, 49–51, https://doi.org/10.1038/279049a0, 1979. a
Winkelmann, R., Martin, M. A., Haseloff, M., Albrecht, T., Bueler, E., Khroulev, C., and Levermann, A.: The Potsdam Parallel Ice Sheet Model (PISM-PIK) – Part 1: Model description, The Cryosphere, 5, 715–726, https://doi.org/10.5194/tc-5-715-2011, 2011. a
Woodcock, N. H.: Specification of fabric shapes using an eigenvalue method, Geol. Soc. Am. Bull., 88, 1231–1236, 1977. a, b
Zeising, O., Gerber, T. A., Eisen, O., Ershadi, M. R., Stoll, N., Weikusat, I., and Humbert, A.: Improved estimation of the bulk ice crystal fabric asymmetry from polarimetric phase co-registration, The Cryosphere, 17, 1097–1105, https://doi.org/10.5194/tc-17-1097-2023, 2023. a
Zichu, X.: Ice Formation and Ice Structure on Law Dome, Antarctica, Ann. Glaciol., 6, 150–153, https://doi.org/10.3189/1985AoG6-1-150-153, 1985. a