the Creative Commons Attribution 4.0 License.
the Creative Commons Attribution 4.0 License.
 | 10 Sep 2025
A thicker-than-present East Antarctic Ice Sheet plateau during the Last Glacial Maximum
Cari Rand
Richard S. Jones
Andrew N. Mackintosh
Brent Goehring
Kat Lilly
In this study, we present a surface exposure chronology of past ice thickness change derived from in situ cosmogenic-14C dating at a site in the Grove Mountains, located on the edge of the East Antarctic plateau, 380 km inland from the coastline in the Lambert Glacier–Amery Ice Shelf sector. At the Last Glacial Maximum (LGM), observations and models suggest that increased ice sheet volume was accommodated by thicker ice near the coast and grounding line advance towards the continental-shelf edge. In contrast, the ice sheet interior maintained a relatively stable thickness until present, with ice core evidence even suggesting thinner ice relative to today. However, the magnitude of these thickness changes and the transition point from thicker-than-present to thinner-than-present LGM ice are poorly constrained. Here, we reconstruct changes in the thickness of the East Antarctic Ice Sheet since the LGM at a nunatak in the Grove Mountains using in situ 14C, which circumvents the common issue of long-lived nuclide inheritance that leads to inaccurate records of LGM ice thickness. Samples between 1912 m above sea level (a.s.l.) and the modern ice margin (∼1825 m a.s.l.) yield 14C ages of 0.18-5.26 ka. Samples at and above 1912 m a.s.l. have saturated 14C concentrations, implying exposure of the nunatak summit through the LGM. We therefore place the LGM ice surface in the Grove Mountains ∼70 m higher than at present. The unsaturated samples below 1912 m a.s.l. indicate that gradual thinning began ∼16 ka, with some (25 %–45 %) post-LGM thinning recorded ∼16–11 ka and most (55 %–75 %) recorded during the Holocene. Ice sheet models that do not account for this thickness change would inaccurately characterize the LGM geometry of the EAIS and underestimate its contributions to deglacial sea level rise.
- Article
(2094 KB) - Full-text XML
-
Supplement
(479 KB) - BibTeX
- EndNote


The East Antarctic Ice Sheet (EAIS) is the largest contiguous mass of ice on Earth (Rignot et al., 2019). Loss of ice to melting and calving is predicted to be offset by increases in snow accumulation over the coming century, but beyond 2100 CE, the ice sheet is expected to lose mass and contribute to sea level rise (Stokes et al., 2022). Characterizing past changes in the EAIS is necessary for several reasons:
-
Satellite observations of Antarctic glaciers extend back only to the 1960s, so other records of past ice sheet states are needed in order to reliably distinguish long-term trends from natural variability (Hanna et al., 2020; Jones et al., 2022).
-
Geodetic data used to estimate modern ice mass changes must be corrected for glacial isostatic adjustment (e.g., Coulon et al., 2021), the magnitude of which is dependent on the past configuration of the ice sheet.
-
Determining the magnitude and timing of ice loss can identify or exclude potential sources of meltwater input to oceans during past periods of rapid sea level rise (e.g., Lin et al., 2021).
-
Numerical models informed by records of past ice sheet change can be used to estimate the future contributions to sea level rise (e.g., DeConto et al., 2021).
However, reconstructing the geometry of the EAIS is challenging. Evidence of past ice thickness comes from radar, ice core, and geological data, which are sparse owing to the remoteness of East Antarctica, the large area of the ice sheet, and the sparsity of ice-free areas. Furthermore, different records of Last Glacial Maximum (LGM) ice thickness are often in disagreement with one another.
During the LGM, at approximately 20 ka, available evidence points towards a more extensive but shallower-gradient ice sheet (Mackintosh et al., 2014). Dated acid-insoluble organic matter in sediments from the East Antarctic coast indicate that the EAIS advanced to the edge of the continental shelf in most locations during the LGM (Bentley et al., 2014), with constraints from cosmogenic 10Be and 26Al indicating the presence of ice near the coast that was thicker than it is now (e.g., Mackintosh et al., 2007; White et al., 2011a; Yamane et al., 2011). Meanwhile, snow accumulation rates interpolated between ice domes suggest a thinner ice sheet across the East Antarctic plateau (Buizert et al., 2021) at the LGM. A “hinge zone” thus likely existed between thicker ice at the coast and thinner ice in the interior during the LGM relative to today (Bockheim et al., 1989; Andersen et al., 2023), but the location of this transition point across East Antarctica is unclear. Cosmogenic-10Be and cosmogenic-26Al ages from ice-free areas on the edge of the East Antarctic plateau such as the Grove Mountains or southern Prince Charles Mountains (PCMs) are older than the LGM (e.g., Lilly et al., 2010; White et al., 2011a), implying no change since or slightly thinner ice in these locations at the LGM (Fig. 1).
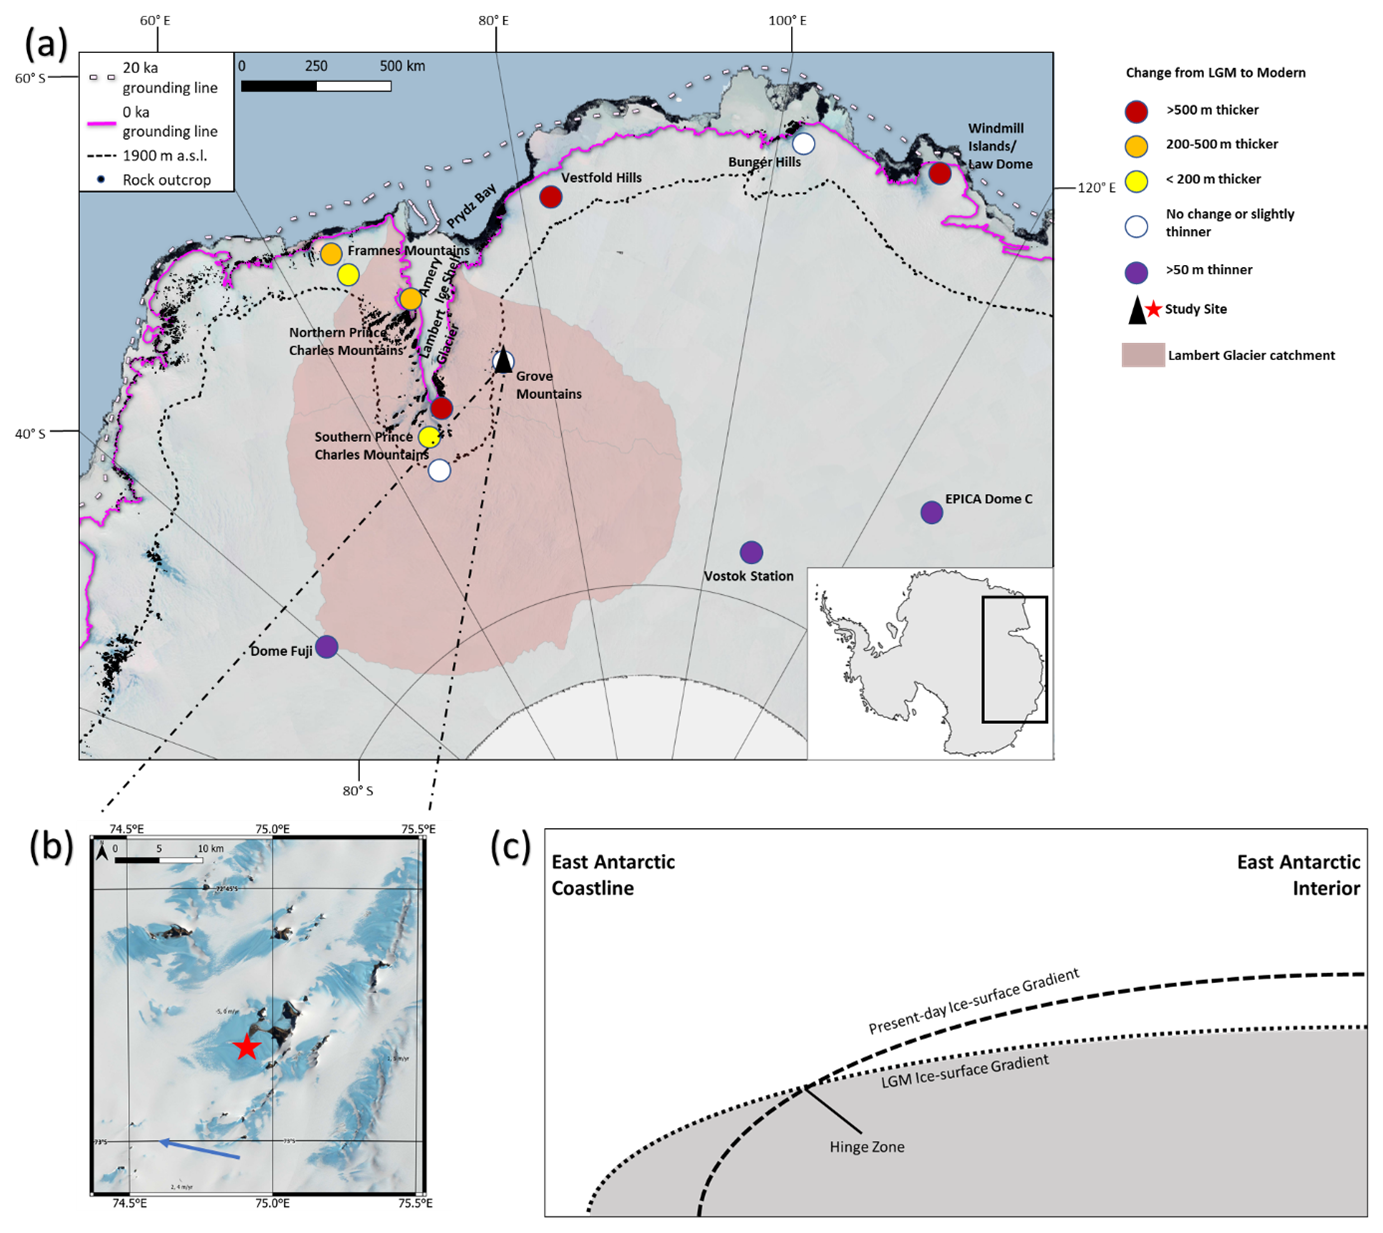
Figure 1Constraints on central East Antarctic ice thickness at the Last Glacial Maximum (LGM). (a) Inferred LGM-to-present ice thickness differences near Lambert Glacier. The dashed black line shows the 1900 m a.s.l. contour (Liu et al., 2015), the elevation of our sampled nunatak. This line represents the most interior geological evidence and reflects a potential hinge zone between coastal and interior LGM ice thickness change. If coastal ice thins and interior ice thickens after the LGM, the modern ice surface profile would intersect the LGM surface profile somewhere in the middle; this intersection is the hinge zone, at which ice there has undergone no net change in thickness since the LGM. LGM thickness reconstructions in White et al. (2011a) and Lilly et al. (2010) placed the hinge zone in areas equivalent to a present-day ice surface elevation of ∼1900 m a.s.l. Elements of this map were provided by the Quantarctica 3 GIS package provided by the Norwegian Polar Institute (Matsuoka et al., 2018), including ice-free areas (Burton-Johnson et al., 2016), the current Antarctic ice sheet grounding line (Bindschadler et al., 2011), and the inferred East Antarctic grounding line at 20 ka (Bentley et al., 2014). Pink-shaded ice indicates the extent of the catchment of Lambert Glacier (Zwally et al., 2012). LGM thickness data for this figure come from Buizert et al. (2021; Dome Fuji and EPICA Dome C), Lilly et al. (2010; Grove Mountains), Mackintosh et al. (2007; Framnes Mountains), Mackintosh et al. (2014) and references therein (Bunger Hills, Law Dome, Vestfold Hills, Vostok Station, and Windmill Islands), and White et al. (2011a; Prince Charles Mountains). (b) Satellite view of the study area with the sampled nunatak (Nunatak 1921). Bedrock and erratic samples were collected in a transect extending from the modern ice surface to nunatak summit. Ice at this site flows slowly (blue arrow; Rignot et al., 2011) northwest, towards the Amery Ice Shelf, though flow speeds are low, and directions are strongly influenced by topography in the vicinity of nunataks. (c) Diagram illustrating the concept of a hinge zone in ice thickness change. The image shows hypothetical vertically exaggerated cross-sections of the East Antarctic Ice Sheet at the LGM (dotted line) and present day (dashed line). The Grove Mountains are a key site for testing the location of this hinge zone as they lie close to the elevation of the hinge zone identified in previous studies of the region (e.g., White et al., 2011a).
Existing cosmogenic-nuclide data from regions of cold-based non-erosive ice, however, may not provide reliable constraints on LGM ice thickness. Many samples have apparently pre-LGM and inconsistent 10Be (t0.5) and 26Al (t0.5) exposure ages, indicating nuclide inventories inherited from previous periods of exposure (Balco et al., 2014). Due to the short half-life of in situ 14C (5.7 kyr; Nichols, 2022), its concentration decays quickly when shielded (e.g., when covered by ice; Goehring et al., 2019a); this makes in situ 14C a useful tool for investigating post-LGM glacial history (Nichols, 2022).
In this study, we aim to constrain the position of the hinge zone in this region by measuring in situ 14C in bedrock and erratic samples previously measured for 10Be and 26Al from the Grove Mountains, a key site in the ice sheet interior. Rocks exposed since before the LGM should have concentrations of 14C at secular equilibrium between production and decay (saturation), a state that requires ca. five half-lives of continuous exposure (Dunai, 2010). Conversely, rocks with less-than-saturated concentrations of 14C from a site in East Antarctica imply that those samples were likely covered for some duration post-LGM by a thicker-than-present EAIS that subsequently thinned. The concentration of a cosmogenic nuclide in a sample will remain at secular equilibrium indefinitely unless disturbed by cover, erosion, or transport; thus, only a minimum age can be assigned to saturated samples. Measuring samples from an elevation transect with in situ 14C thus allows us to reevaluate the ice thickness history at the site: the ice must have been thick enough to cover at least the highest-elevation unsaturated sample and had to have been that thick within the time it would have taken for the 14C concentration of that sample to reach saturation again.
Study area
The Grove Mountains are well located to assess how far inland the EAIS was thicker at the LGM than it is at present and whether previously measured concentrations of 10Be and 26Al from this site likely reflect a component of nuclides inherited from a previous period of exposure. These isolated nunataks are located ∼200 km upstream of the main trunk of Lambert Glacier and ∼400 km inland/south of the Antarctic coast (Fig. 1) and are the most interior ice-free area in this region. The summits of the nunataks rise 100–200 m above the modern ice surface (∼1800 m a.s.l.), providing the potential to record past EAIS thickness changes. Ice flows slowly (<5 m yr−1) to the west-northwest between these nunataks (Rignot et al., 2011).
At Nunatak 1921 (named for its summit elevation; local ice surface elevation ≈ 1825 m a.s.l.), evidence of past ice cover is apparent from the occurrence of felsic cobbles atop very weathered orthogneiss bedrock (Lilly, 2008). Given the sparsity of outcrops and non-channelized nature of ice flow in the interior EAIS, we are not able to identify the provenance of these cobbles beyond stating that they are not derived from Nunatak 1921 (i.e., they are erratics).
Here we reanalyze samples first presented in Lilly et al. (2010), which were collected from the Grove Mountains for 10Be and 26Al analysis as part of a study of the long-term glacial history of the region. Measurements of 10Be and 26Al were carried out in 2004 at the ANTARES accelerator mass spectrometry facility. Nuclide concentrations below saturation were recorded for all samples, indicating 40–700 kyr of exposure since the bedrock was last reset. For full details, see Lilly (2008) and Lilly et al. (2010).
The samples were collected in an elevation transect from the present-day ice surface on the upstream face of Nunatak 1921 in April 2003 and May 2004 (Lilly et al., 2010; Table 1). Pairs of bedrock and erratic samples showed no evidence of post-depositional movement, cover by sediments, or subaerial erosion. Samples were preferentially collected from ridgetops to minimize the chances of shielding by snow. As neither plucking scars nor glacial striae were observed at the site (Lilly et al., 2010), indicating low or negligible rates of subglacial erosion, and because of the scatter observed in the 10Be and 26Al data from this site, we anticipate that the existing nuclide concentrations do not accurately record LGM ice thickness.
Table 1Sample locations. Seven samples were erratic cobbles. Three samples were bedrock (BR). A density of 2.7 g cm−3 is assumed for all samples.
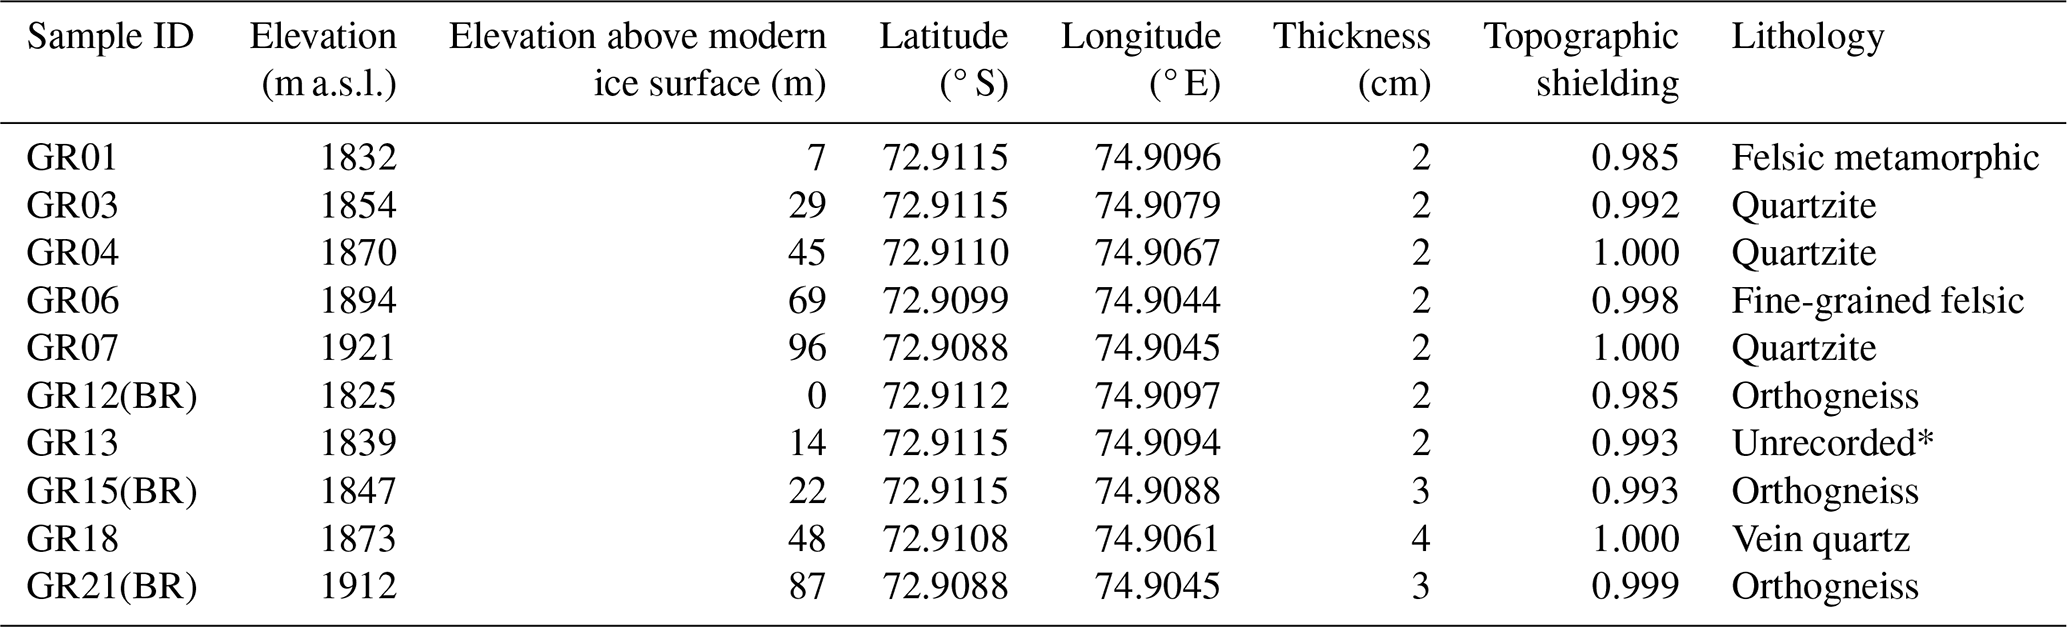
∗ Sample GR13 was crushed prior to the beginning of this study, and its lithology was not recorded prior to crushing.
To provide a test of LGM ice thickness, we carried out in situ 14C analysis on the 10 of these samples from which available material remained. These samples form a transect covering 96 m of elevation (1825–1921 m a.s.l.). Seven of the samples were erratic cobbles. The remaining three (marked in Table 1 with “(BR)” appended to the sample ID) were bedrock samples.
Quartz was isolated through physical and chemical processing at the Tulane University Cosmogenic Nuclides Laboratory (TUCNL; Goehring et al., 2019b). Whole samples were crushed and milled; then all samples were sieved to select their 125–500 µm fractions. Sieved samples were then rinsed with tap water to remove clay-sized grains. A roller-type magnetic separator was then used to remove magnetic minerals. Froth flotation was used to separate quartz and feldspar grains, followed by etching for at least 2 d in 5 % on a shaker table and at least 2 d in a sonicator in 1 % in order to remove adsorbed carbon species (Nichols and Goehring, 2019).
Following the isolation and purification, 0.6–5 g aliquots were separated from the cleaned quartz for 14C extraction. Before extraction, each aliquot was sonicated in 50 % HNO3 for 0.5 h, then rinsed with Type I water and dried overnight in a vacuum oven. The dried quartz was then loaded into a Pt combustion boat containing LiBO2 flux which had been degassed, fused, and cooled. This boat containing flux and sample was then step-heated in O2 for 0.5 h at 500 °C for cleaning. The quartz was then heated for a further 3 h at 1100 °C in the Tulane University Carbon Extraction and Graphitization System to extract gases for measurement. Carbon species released were oxidized to CO2 over 0.64–0.86 mm graded, crushed quartz chips at 850 °C, then cryogenically purified, collected, and diluted to ∼110 µg with 14C-free CO2 (Goehring et al., 2019b). An aliquot of this gas was separated for δ13C analysis and the remainder graphitized via Fe-catalyzed H2 reduction. For further details, see Goehring et al. (2019b) and Nichols and Goehring (2019). Carbon isotope ratios were then measured at the National Ocean Sciences accelerator mass spectrometry facility at the Woods Hole Oceanographic Institution (see Table S2 in the Supplement), and data reduction followed Hippe and Lifton (2014).
A blank value of 43 661±11 279 atoms was subtracted from the total measured atoms from each sample; this value represents the mean and standard deviation of process blanks run at the TUCNL (Goehring et al., 2019b) through the time span within which samples for this study were measured (10 July–27 August 2021). This blank-corrected measurement was divided by the sample mass to determine the 14C concentration of each sample. Exposure ages were calculated using the “LSDn” nuclide-specific production rate scaling scheme of Lifton et al. (2014). The production rate of in situ 14C was calibrated using the CRONUS-A interlaboratory comparison material (Goehring et al., 2019b). The CRONUS-A material is assumed to be saturated, with in situ 14C based on geological observations indicating that its collection site has not been covered in the last 11.3 Myr (Goehring et al., 2019b; Nichols et al., 2019). Repeated measurements of CRONUS-A material at the TUCNL show ∼6 % variation in 14C concentrations (Goehring et al., 2019b); thus, we use a minimum uncertainty equal to 6 % of the calculated 14C concentration of our samples for exposure age calculation (Table 2).
Table 2Sample 14C concentrations and exposure ages. All measurements of 14C atoms per sample corrected by subtracting a atom blank prior to concentration calculation. Where the 1σ [14C] uncertainty and 6 % [14C] differ, the larger uncertainty value is reported. “Internal” 14C-age uncertainties include only instrumental uncertainty. “External” 14C-age uncertainties include both instrumental and production rate uncertainties. “NA” indicates that a sample is saturated, and no uncertainty may be calculated. All 14C-age uncertainties are here presented at 1σ. For further sample details, see Table S1. For details of the dataset used to calibrate production rates at our site, see Table S3.
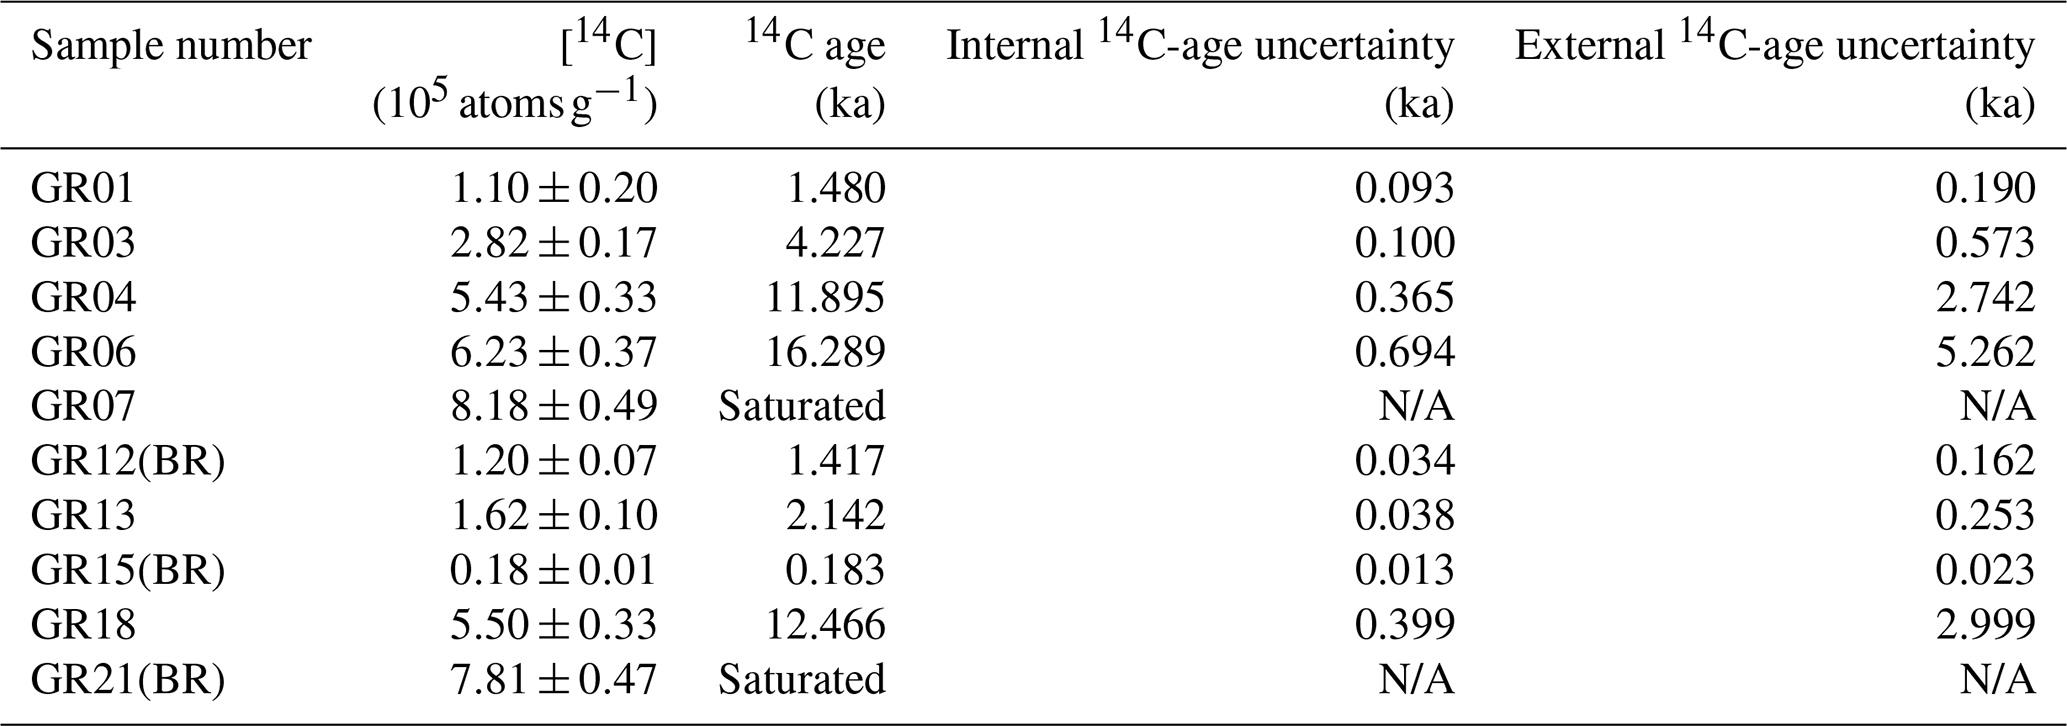
Our samples have 14C concentrations between atoms g−1 (GR15) and atoms g−1 (GR07; Table 2). The sample with the lowest concentration has an exposure age of 0.18±0.02 ka, and the samples with the highest concentrations are saturated (Table 2). These exposure ages are 38±9.6 (GR01) to 295±27.1 kyr (GR03) less than 10Be and 26Al exposure ages from each sample (for full sample measurement details, see Tables S1–S6 in the Supplement). Samples form a thinning transect with concentrations and ages mostly increasing monotonically with elevation (Fig. 2). There are however two exceptions, both low-elevation bedrock samples (GR15 and GR12). We suspect that the site of GR15 may have been covered by snow or other sediment, though we have not acquired any field evidence to this effect. GR12 may instead not be an outlier, as its concentration lies within the uncertainty window of that of GR01.
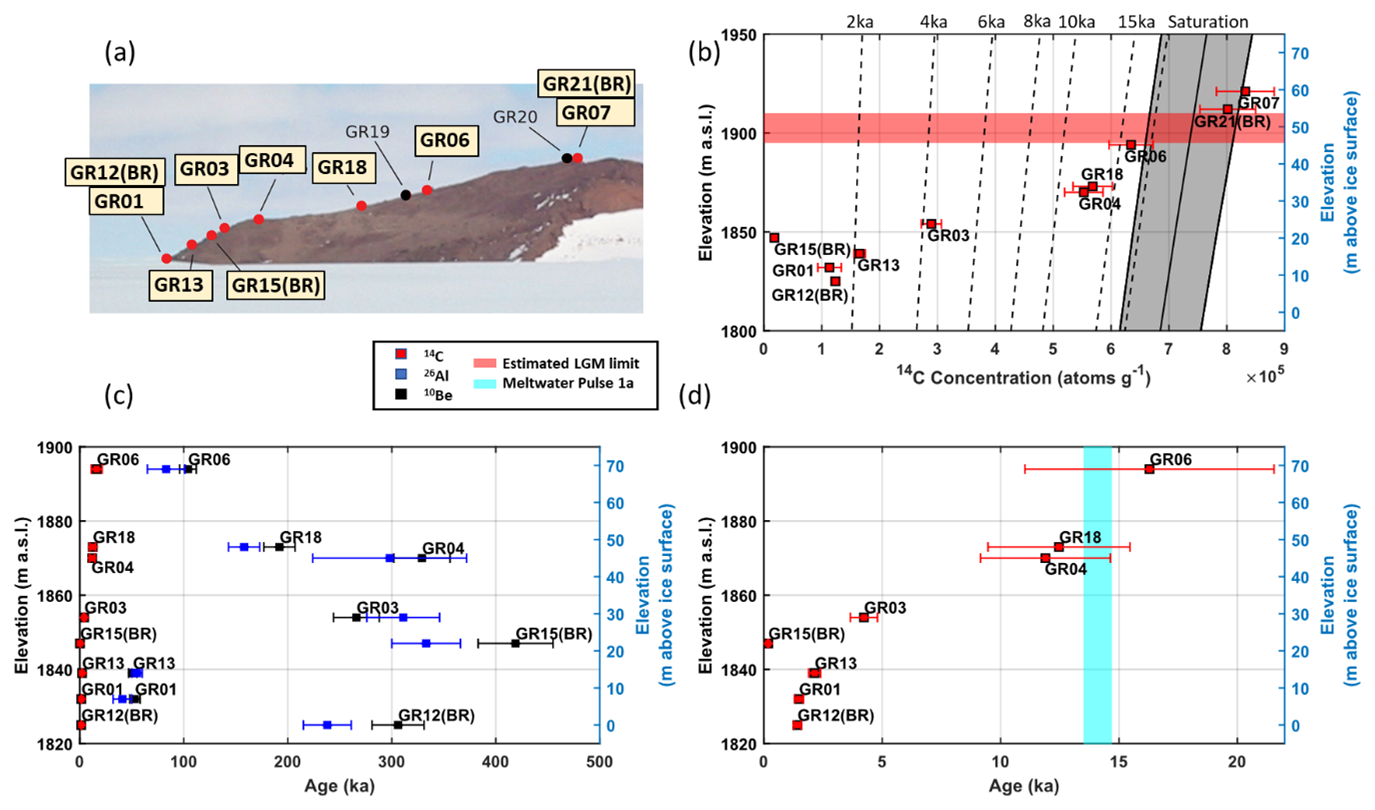
Figure 2Sample nuclide concentrations and exposure ages. The current ice surface at this site is approximately coincident with the elevation of sample GR12. (a) Locations of samples noted on a photograph of the south face of Nunatak 1921. IDs of samples from which 14C was measured in this study are highlighted, and sample locations are marked with red circles. Black circles represent the locations of samples from which 14C was not measured, as no sample material was available. This image is modified from Lilly et al. (2010). (b) 14C concentrations plotted against elevation. Isochrones (dotted lines) show corresponding exposure ages at each elevation. The tilted vertical gray band to the right represents the saturation error envelope as calculated using the online exposure age calculator formerly known as the CRONUS-Earth online exposure age calculator using the CRONUS-A measurements listed in Table S3. Samples GR07 and GR21 are saturated, indicating >25 kyr of exposure and implying the summit of the nunatak was exposed during the LGM. The horizontal red band indicates the range of possible LGM ice surface elevations limited by the elevations of GR06, the highest-elevation unsaturated sample, and GR21, the lowest-elevation saturated sample. We consider samples GR12 and GR15 to be outliers, as the trend of decreasing elevation with decreasing age recorded by all of the erratic samples places these two samples out of order. (c) Sample exposure ages plotted against elevation, calculated from concentrations of 14C (this work) and 26Al and 10Be (Lilly et al., 2010). Note the younger exposure ages calculated from 14C. (d) As plot (c), but only showing 14C exposure ages for the last 22 kyr. The light-blue bar indicates the timing of meltwater pulse 1a (Deschamps et al., 2012). Samples GR07 and GR21 are saturated with 14C and thus omitted from this plot. See the tables in the Supplement for all sample information, nuclide concentrations, and calculated exposure ages.
If the ice sheet thickness was similar to or thinner than at present in the vicinity of the Grove Mountains at the LGM, all of our samples would be saturated with 14C. However, our samples show a clear trend of increasing 14C concentrations with elevation (Fig. 2). Only two samples (GR07 and GR21; Table 2) show clear evidence of saturation, both near the summit of the nunatak. These results thus show that ice was thicker at the LGM than at present in the Grove Mountains but not sufficiently thick as to override the summit for a significant duration, though saturation precludes neither a short period (<3 kyr) of cover nor cover by thin (<10 m) ice (Fig. 3).
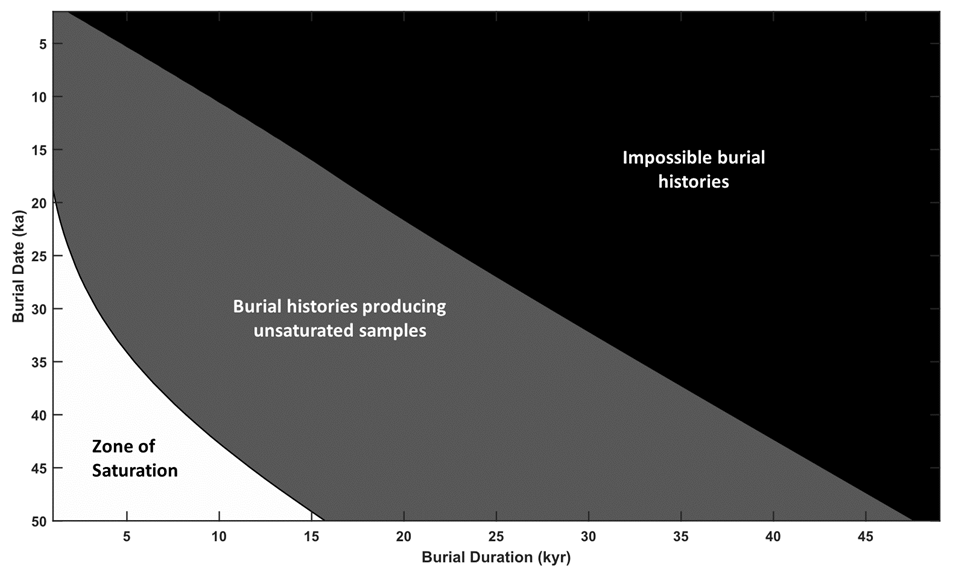
Figure 3Burial history contour plot for a sample at 1912 m above sea level (a.s.l.) in the Grove Mountains. Modeled glacial histories start at 50 ka with one episode of burial under >10 m of ice. No 14C is produced while buried. 14C concentrations in the sample are saturated at the model start. The black-shaded part of the graph shows impossible histories (i.e., histories that require future burial). The gray-shaded part of the graph shows histories that would result in sample GR21 having a concentration below saturation for 14C. The unshaded portion of the graph shows the uncertainty window of a saturated sample at this latitude and elevation (, 72.9088° S, 1912 m a.s.l.). Only the lower-concentration end of the saturation window is consistent with any significant degree of burial under enough ice to effectively stop production (∼10 m); thus, only samples that were buried a long time ago or for a very short duration could show concentrations approaching saturation. Sample GR21 plots off the bottom-left corner of this figure; its mean 14C concentration (; see Table 1) is thus inconsistent with any episode of burial longer than 3 kyr in the last 30 kyr, indicating that if there was any significant duration of cover experienced by these samples, it occurred predominantly prior to the LGM. Permissible episodes of cover become shorter and occur earlier if samples are not assumed to be saturated at 50 ka.
The LGM ice surface must have been between the lowest of our saturated and highest of our unsaturated samples, corresponding to an elevation between 1894 and 1912 m a.s.l. This equates to ice 63–87 m thicker at the LGM than at present, with subsequent thinning.
Additionally, exposure ages calculated from 14C concentrations allow us to infer a simple thinning history at Nunatak 1921. The highest-elevation unsaturated sample (GR06) provides a minimum post-LGM age for the onset of thinning at the site of 16.3±5.3 ka (Fig. 2, Table 2). Up to 18 m (21 %–29 %) of thinning could have occurred before and up to 21 m (24 %–33 %) during meltwater pulse 1a (MWP-1a; Fig. 2d), ∼13.5–14.7 ka, assuming the mean exposure ages of GR04 and GR18 and a linear thinning history. The potential for glacial overshoot, whereby the glacier thins beyond its new equilibrium thickness and subsequently rethickens, however, makes these minimum estimates. Note, too, the large uncertainties in the pre-Holocene ages presented here relative to the duration of MWP-1a; more stringent age control is necessary to state confidently the relative timing of ice loss here. Most post-LGM thinning (55 %–70 %) is recorded during the Holocene (the last 11.7 kyr; Walker et al., 2009), as opposed to the earlier stage of deglaciation, when most Antarctic ice loss is modeled (Pittard et al., 2022). Based on our lowest-elevation sample (GR12), which was collected less than 1 m above the current ice surface (∼1825 m a.s.l.), the present-day ice thickness was reached at 1.4±0.2 ka (Tables 1 and 2).
New exposure ages calculated from in situ 14C concentrations allow us to revise the history of the EAIS at this site. The combination of saturated and unsaturated samples on Nunatak 1921 shows that its summit was exposed during the LGM, yet the ice sheet was modestly thicker (up to 87 m) here at the LGM than at present, contrary to interpretations of previous 10Be and 26Al data at this site and reconstructions of the interior EAIS at the LGM (e.g., Lilly et al., 2010; Buizert et al., 2021).
Our samples were saturated with neither 10Be nor 26Al but show evidence of long, complex exposure histories (Lilly et al., 2010; Table S5). The high contribution of inherited nuclides from pre-LGM exposure prevents an accurate test of the LGM ice thickness and reconstruction of the post-LGM thinning history. Exposure long enough to build these 10Be and 26Al concentrations up would also have left these samples saturated with 14C. Our 14C data indicate that ice cover > ca. 10 m thick occurred at this site up to at least 70 m above the present ice surface, and the period of cover was long enough to allow 14C concentrations in our samples to decay to near-background levels, given the low concentrations of the lowest-elevation samples (Table 2). The summit of the nunatak was either not covered or only covered briefly (≲1 kyr) or by thin enough ice (≲10 m) for the two summit samples to become re-saturated with 14C following re-exposure (Fig. 3). Following the LGM, the nunataks were progressively re-exposed through the Late Holocene.
Direct constraints from cosmogenic 10Be and 26Al show evidence of the ice being thicker near the Antarctic coast at the LGM than at present (e.g., Mackintosh et al., 2007; White et al., 2011a), but exposure ages derived from the same nuclides from interior sites such as the Grove Mountains pre-date the LGM (Lilly et al., 2010). While we cannot rule out the thicker-than-present ice at the Grove Mountains being an entirely localized phenomenon, we suggest based on the application of 14C in this study and other Antarctic studies (e.g., White et al., 2011b; Fogwill et al., 2014; Nichols et al., 2019; Hillebrand et al., 2021) that at least some previous reconstructions of LGM ice thickness based on longer-lived nuclides (e.g., 10Be and 26Al) which show either thickening or no thinning since the LGM away from the coast and fastest-flowing parts of East Antarctica may be inaccurate. The potential for low levels of Al and Be inheritance in cold, arid regions – such as on the edge of the ice sheet plateau but possibly also in coastal areas of Antarctica – highlights the usefulness of 14C as a tool for improving ice histories derived from long-lived nuclides.
Our new chronology indicates that the zone of thicker-than-present LGM ice extended further inland than was previously thought (Mackintosh et al., 2014). Cosmogenic dating and geomorphic evidence from elsewhere in the Lambert Glacier catchment support a low-angle ice stream surface at the LGM, with ice 160 m thicker at the most upstream site in the PCMs (Mt. Ruker) and at least 250 m and up to 800 m thicker at sites closer to the coast (White et al., 2011a; Fig. 1). The hinge zone between interior and coastal change, where the LGM ice thickness was the same as today, was proposed to be at ∼1900–2000 m a.s.l. based on the available evidence at the PCMs and Grove Mountains (Mackintosh et al., 2014). A thicker-than-present EAIS at the Grove Mountains during the LGM therefore indicates that this hinge zone lies further inland, increasing the amount of LGM ice by volume across much of the ice sheet (Fig. 4).
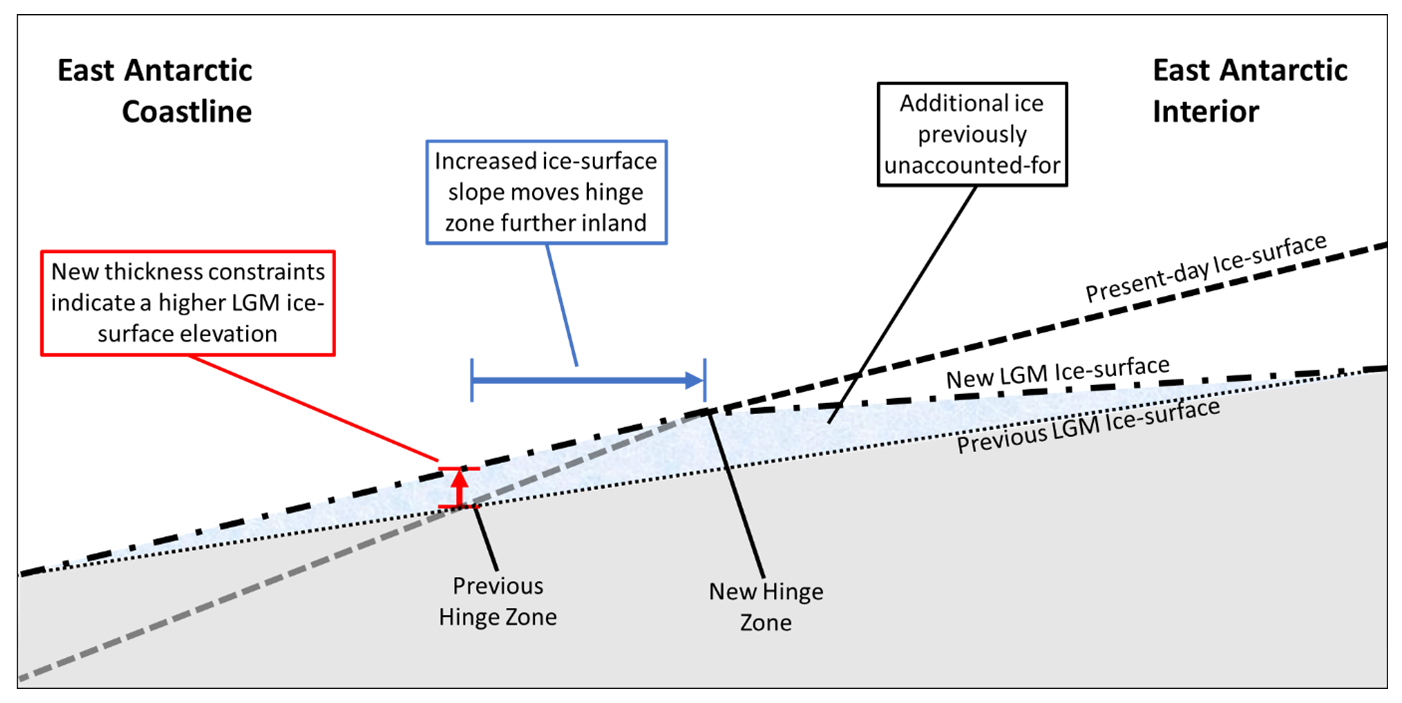
Figure 4Implications of new LGM ice thickness constraints on the East Antarctic hinge zone. Modified from Fig. 1c, the diagram shows hypothetical vertically exaggerated cross-sections of the East Antarctic Ice Sheet at the present day (dashed line) and at the LGM based on previous evidence (dotted line) and accounting for our data (dot-dashed line). Our results indicate that ice at the Grove Mountains (near the approximate elevation previously considered the hinge zone) was ∼70 m thicker than it is today. Assuming that LGM ice thickness estimates near the coast are accurate, this necessitates a steeper coastal ice surface slope to accommodate the increased thickness at the Grove Mountains (and a shallower East Antarctic plateau ice surface slope if the LGM ice thickness estimates in the interior are accurate), moving the hinge zone further into the interior. The exact gradients of these slopes and the location of the hinge zone control the volume of ice lost from the East Antarctic Ice Sheet since the LGM. Note that the distances and slopes displayed in this figure are not to scale and only schematically illustrate the relative elevations and changes in slope. Ice surface profiles are depicted here as straight lines to aid visibility. The true profiles would curve, as in Fig. 1c.
Ice in East Antarctica being thicker at the LGM than at present only within a few hundred kilometers of the coastline would be consistent with reconstructions of MWP-1a that call for only a limited input of meltwater from Antarctica (e.g., Yeung et al., 2019). Our work shows that EAIS thickening extended further inland than indicated by 10Be and 26Al ages (e.g., Lilly et al., 2010), providing modest additional ice volume for MWP-1a, and that thinning started before and possibly occurred during the period of MWP-1a. We cannot accurately quantify how much EAIS volume was lost during this period, due to the uncertainties in our calculated exposure ages. Our data indicate that likely less than half of the post-LGM ice loss occurred before or during MWP-1a in this region, consistent with studies identifying Antarctica as likely being a minor contributor and the majority of the Antarctic contribution to have been sourced from West Antarctica (e.g., Lin et al., 2021).
An implication of this interior portion of the EAIS being thicker than previously suggested at the LGM is that the ice subsequently thinned, allowing us to evaluate deglacial leads and lags between the coast and interior. The earliest deglaciation constraints in this region come from ice sheet thinning in the PCMs at 18 ka (White et al., 2011a; Bentley et al., 2014), which was possibly coincident with grounding line retreat on the continental shelf in Prydz Bay (Mackintosh et al., 2014). Ice shelf retreat began by ∼16 ka and ∼14 ka in west–central and eastern Prydz Bay, respectively, with the Rauer Group and Vestfold Hills ice-free by ∼11 ka (White et al., 2022). Our record suggests that ice in the Grove Mountains began thinning ∼16 ka, ∼2 kyr earlier than in the PCMs, though the timing at the Grove Mountains is broadly consistent with available evidence of deglaciation at the coast. The modern ice surface elevation was reached by 9–12 ka at the PCMs (White et al., 2011a) but 1.4 ka in the Grove Mountains, ∼8–11 kyr later. Cosmogenic-exposure ages reported here from other studies were recalculated using the online exposure age calculator formerly known as the CRONUS-Earth online exposure age calculator (https://hess.ess.washington.edu, last access: 27 August 2024), as with our 14C ages, using the primary 10Be calibration dataset of Borchers et al. (2016). Part of this discrepancy could be due to inheritance in the samples from the PCMs. Further work to measure in situ 14C in samples from the PCMs would enable an evaluation of the degree of lead and lag between sites.
Deglaciation thus possibly started and likely finished earlier downstream, and the magnitude of thinning was greater at the Antarctic coastline than in its interior. Ice sheet modeling indicates that responses to sea level rise, decreased accumulation, and changes in temperature should manifest first at the margins of the ice sheet, causing thinning to propagate into the interior of the ice sheet (Alley and Whillans, 1984; Spector et al., 2019). Such propagation is likely slowed and attenuated by distance and travel over bedrock highs (Johnson et al., 2021), such as the Grove Mountains. Modern observations confirm that such dynamic thinning occurs over decadal timescales (e.g., Felikson et al., 2017), but our data indicate that such processes may continue over centuries to millennia.
If the Grove Mountains are representative of the behavior of similar locations in interior East Antarctica, more of the EAIS may have been thicker-than-present at the LGM and subsequently thinned more than was previously thought. Ice sheet models may thus currently underestimate LGM ice volume and rates and magnitudes of deglacial ice loss.
Our new in situ 14C results provide improved constraints on past East Antarctic Ice Sheet thickness at a site ∼400 km inland from the present-day coast. These data show that the ice sheet at the Grove Mountains was thicker than at present at the LGM, but the summits of these nunataks were exposed. Ice sheet thinning began here ∼15 ka and continued through the Holocene, likely in response to changes near the grounding line that propagated upstream. This work demonstrates that the hinge zone separating the interior ice (which was thinner at the LGM than it is today) from the ice nearer the coast (which was thicker at the LGM than it is today) was further inland than was previously thought. The additional ice volume implied by these findings therefore needs to be accounted for in numerical ice sheet and glacial isostatic adjustment reconstructions of the last deglaciation.
All data described in the paper are included in Tables S1–S6.
The supplement related to this article is available online at https://doi.org/10.5194/tc-19-3681-2025-supplement.
CR processed samples for 14C analysis, wrote the paper, and prepared all figures. CR, RSJ, and ANM conceived the project. All authors read and commented on the manuscript. BG provided code for exposure age calculation and plotting. KL undertook fieldwork in the Grove Mountains and collected all the field observations and samples presented here.
The contact author has declared that none of the authors has any competing interests.
Publisher's note: Copernicus Publications remains neutral with regard to jurisdictional claims made in the text, published maps, institutional affiliations, or any other geographical representation in this paper. While Copernicus Publications makes every effort to include appropriate place names, the final responsibility lies with the authors.
This work was supported by Australian Research Council grant DE210101923, awarded to Richard S. Jones, and the ARC Special Research Initiative “Securing Antarctica's Environmental Future” (SR200100005). Cari Rand would also like to acknowledge support from the Monash Graduate and International Tuition Scholarships.
This research has been supported by the Australian Research Council (grant no. DE210101923) and the ARC Special Research Initiative “Securing Antarctica’s Environmental Future” (grant no. SR200100005).
This paper was edited by Lei Geng and reviewed by Greg Balco, Allie Balter-Kennedy, and one anonymous referee.
Alley, R. B. and Whillans, I. M.: Response of the East Antarctica ice sheet to sea-level rise, J. Geophys. Res.-Oceans, 89, 6487–6493, 1984.
Andersen, J. L., Newall, J. C., Fredin, O., Glasser, N. F., Lifton, N. A., Stuart, F. M., Fabel, D., Caffee, M., Pedersen, V. K., and Koester, A. J.: A topographic hinge-zone divides coastal and inland ice dynamic regimes in East Antarctica, Communications Earth & Environment, 4, 9, 2023.
Balco, G., Stone, J. O., Sliwinski, M. G., and Todd, C.: Features of the glacial history of the Transantarctic Mountains inferred from cosmogenic 26Al, 10Be and 21Ne concentrations in bedrock surfaces, Antarct. Sci., 26, 708–723, 2014.
Bentley, M. J., Cofaigh, C. O., Anderson, J. B., Conway, H., Davies, B., Graham, A. G., Hillenbrand, C.-D., Hodgson, D. A., Jamieson, S. S., and Larter, R. D.: A community-based geological reconstruction of Antarctic Ice Sheet deglaciation since the Last Glacial Maximum, Quaternary Sci. Rev., 100, 1–9, 2014.
Bindschadler, R., Choi, H., and ASAID Collaborators: High-resolution Image-derived Grounding and Hydrostatic Lines for the Antarctic Ice Sheet, National Snow and Ice Data Center, Boulder, Colorado, USA, https://doi.org/10.7265/N56T0JK2, 2011.
Bockheim, J. G., Wilson, S. C., Denton, G. H., Andersen, B. G., and Stuiver, M.: Late quaternary ice-surface fluctuations of Hatherton Glacier, Transantarctic Mountains, Quaternary Res., 31, 229–254, 1989.
Borchers, B., Marrero, S., Balco, G., Caffee, M., Goehring, B., Lifton, N., Nishiizumi, K., Phillips, F., Schaefer, J., and Stone, J.: Geological calibration of spallation production rates in the CRONUS-Earth project, Quat. Geochronol., 31, 188–198, 2016.
Buizert, C., Fudge, T., Roberts, W. H., Steig, E. J., Sherriff-Tadano, S., Ritz, C., Lefebvre, E., Edwards, J., Kawamura, K., and Oyabu, I.: Antarctic surface temperature and elevation during the Last Glacial Maximum, Science, 372, 1097–1101, 2021.
Burton-Johnson, A., Black, M., Fretwell, P. T., and Kaluza-Gilbert, J.: An automated methodology for differentiating rock from snow, clouds and sea in Antarctica from Landsat 8 imagery: a new rock outcrop map and area estimation for the entire Antarctic continent, The Cryosphere, 10, 1665–1677, https://doi.org/10.5194/tc-10-1665-2016, 2016.
Coulon, V., Bulthuis, K., Whitehouse, P. L., Sun, S., Haubner, K., Zipf, L., and Pattyn, F.: Contrasting response of West and East Antarctic ice sheets to glacial isostatic adjustment, J. Geophys. Res.-Earth, 126, e2020JF006003, 2021.
DeConto, R. M., Pollard, D., Alley, R. B., Velicogna, I., Gasson, E., Gomez, N., Sadai, S., Condron, A., Gilford, D. M., and Ashe, E. L.: The Paris Climate Agreement and future sea-level rise from Antarctica, Nature, 593, 83–89, 2021.
Deschamps, P., Durand, N., Bard, E., Hamelin, B., Camoin, G., Thomas, A. L., Henderson, G. M., Okuno, J. I., and Yokoyama, Y.: Ice-sheet collapse and sea-level rise at the Bølling warming 14 600 years ago, Nature, 483, 559–564, 2012.
Dunai, T. J.: Cosmogenic nuclides: principles, concepts and applications in the earth surface sciences, Cambridge University Press, https://doi.org/10.1017/CBO9780511804519, 2010.
Felikson, D., Bartholomaus, T. C., Catania, G. A., Korsgaard, N. J., Kjær, K. H., Morlighem, M., Noël, B., Van Den Broeke, M., Stearns, L. A., and Shroyer, E. L.: Inland thinning on the Greenland ice sheet controlled by outlet glacier geometry, Nat. Geosci., 10, 366–369, 2017.
Fogwill, C., Turney, C., Golledge, N., Rood, D., Hippe, K., Wacker, L., Wieler, R., Rainsley, E., and Jones, R.: Drivers of abrupt Holocene shifts in West Antarctic ice stream direction determined from combined ice sheet modelling and geologic signatures, Antarct. Sci., 26, 674–686, 2014.
Goehring, B. M., Balco, G., Todd, C., Moening-Swanson, I., and Nichols, K.: Late-glacial grounding line retreat in the northern Ross Sea, Antarctica, Geology, 47, 291–294, 2019a.
Goehring, B. M., Wilson, J., and Nichols, K.: A fully automated system for the extraction of in situ cosmogenic carbon-14 in the Tulane University cosmogenic nuclide laboratory, Nucl. Instrum. Meth. B, 455, 284–292, 2019b.
Hanna, E., Pattyn, F., Navarro, F., Favier, V., Goelzer, H., van den Broeke, M. R., Vizcaino, M., Whitehouse, P. L., Ritz, C., and Bulthuis, K.: Mass balance of the ice sheets and glaciers–Progress since AR5 and challenges, Earth-Sci. Rev., 201, 102976, 2020.
Hillebrand, T. R., Stone, J. O., Koutnik, M., King, C., Conway, H., Hall, B., Nichols, K., Goehring, B., and Gillespie, M. K.: Holocene thinning of Darwin and Hatherton glaciers, Antarctica, and implications for grounding-line retreat in the Ross Sea, The Cryosphere, 15, 3329–3354, https://doi.org/10.5194/tc-15-3329-2021, 2021.
Hippe, K. and Lifton, N. A.: Calculating isotope ratios and nuclide concentrations for in situ cosmogenic 14C analyses, Radiocarbon, 56, 1167–1174, 2014.
Johnson, J. S., Pollard, D., Whitehouse, P. L., Roberts, S. J., Rood, D. H., and Schaefer, J. M.: Comparing glacial-geological evidence and model simulations of ice sheet change since the last glacial period in the Amundsen Sea sector of Antarctica, J. Geophys. Res.-Earth, 126, e2020JF005827, 2021.
Jones, R. S., Johnson, J. S., Lin, Y., Mackintosh, A. N., Sefton, J. P., Smith, J. A., Thomas, E. R., and Whitehouse, P. L.: Stability of the Antarctic Ice Sheet during the pre-industrial Holocene, Nature Reviews Earth & Environment, 3, 500–515, 2022.
Korschinek, G., Bergmaier, A., Faestermann, T., Gerstmann, U., Knie, K., Rugel, G., Wallner, A., Dillmann, I., Dollinger, G., and Von Gostomski, C. L.: A new value for the half-life of 10Be by heavy-ion elastic recoil detection and liquid scintillation counting, Nucl. Instrum. Meth. B, 268, 187–191, 2010.
Lifton, N., Sato, T., and Dunai, T. J.: Scaling in situ cosmogenic nuclide production rates using analytical approximations to atmospheric cosmic-ray fluxes, Earth Planet. Sc. Lett., 386, 149–160, 2014.
Lilly, K.: Three million years of East Antarctic ice sheet history from in situ cosmogenic nuclides in the Lambert-Amery Basin, Doctoral dissertation, The Australian National University, Canberra, ACT, 2008.
Lilly, K., Fink, D., Fabel, D., and Lambeck, K.: Pleistocene dynamics of the interior East Antarctic ice sheet, Geology, 38, 703–706, 2010.
Lin, Y., Hibbert, F. D., Whitehouse, P. L., Woodroffe, S. A., Purcell, A., Shennan, I., and Bradley, S. L.: A reconciled solution of Meltwater Pulse 1A sources using sea-level fingerprinting, Nat. Commun., 12, 2015, 2021.
Liu, H., Jezek, K. C., Li, B., and Zhao, Z.: Radarsat Antarctic Mapping Project Digital Elevation Model, Version 2, NASA National Snow and Ice Data Center Distributed Active Archive Center, Boulder, Colorado USA, https://doi.org/10.5067/8JKNEW6BFRVD, 2015.
Mackintosh, A., White, D., Fink, D., Gore, D. B., Pickard, J., and Fanning, P. C.: Exposure ages from mountain dipsticks in Mac. Robertson Land, East Antarctica, indicate little change in ice-sheet thickness since the Last Glacial Maximum, Geology, 35, 551–554, 2007.
Mackintosh, A. N., Verleyen, E., O'Brien, P. E., White, D. A., Jones, R. S., McKay, R., Dunbar, R., Gore, D. B., Fink, D., and Post, A. L.: Retreat history of the East Antarctic Ice Sheet since the last glacial maximum, Quaternary Sci. Rev., 100, 10–30, 2014.
Matsuoka, K., Skoglund, A., Roth, G., de Pomereu, J., Griffiths, H., Headland, R., Herried, B., Katsumata, K., Le Brocq, A., Licht, K., Morgan, F., Neff, P., Ritz, C., Scheinert, M., Tamura, T., Van de Putte, A., van den Broeke, M., von Deschwanden, A., Deschamps-Berger, C., Van Liefferinge, B., Tronstad, S., and Melvær, Y.: Norwegian Polar Institute, Quantarctica [data set], https://doi.org/10.21334/npolar.2018.8516e961, 2018.
Nichols, K. A.: A decade of in situ cosmogenic 14C in Antarctica, Ann. Glaciol., 2022, 1–6, 2022.
Nichols, K. A. and Goehring, B. M.: Isolation of quartz for cosmogenic in situ 14C analysis, Geochronology, 1, 43–52, 2019.
Nichols, K. A., Goehring, B. M., Balco, G., Johnson, J. S., Hein, A. S., and Todd, C.: New Last Glacial Maximum ice thickness constraints for the Weddell Sea Embayment, Antarctica, The Cryosphere, 13, 2935–2951, https://doi.org/10.5194/tc-13-2935-2019, 2019.
Pittard, M. L., Whitehouse, P. L., Bentley, M. J., and Small, D.: An ensemble of Antarctic deglacial simulations constrained by geological observations, Quaternary Sci. Rev., 298, 107800, 2022.
Rignot, E., Mouginot, J., and Scheuchl, B.: Ice flow of the Antarctic ice sheet, Science, 333, 1427–1430, 2011.
Rignot, E., Mouginot, J., Scheuchl, B., Van Den Broeke, M., Van Wessem, M. J., and Morlighem, M.: Four decades of Antarctic Ice Sheet mass balance from 1979–2017, P. Natl. Acad. Sci. USA, 116, 1095–1103, 2019.
Spector, P., Stone, J., and Goehring, B.: Thickness of the divide and flank of the West Antarctic Ice Sheet through the last deglaciation, The Cryosphere, 13, 3061–3075, https://doi.org/10.5194/tc-13-3061-2019, 2019.
Stokes, C. R., Abram, N. J., Bentley, M. J., Edwards, T. L., England, M. H., Foppert, A., Jamieson, S. S., Jones, R. S., King, M. A., and Lenaerts, J.: Response of the East Antarctic Ice Sheet to past and future climate change, Nature, 608, 275–286, 2022.
Walker, M., Johnsen, S., Rasmussen, S. O., Popp, T., Steffensen, J. P., Gibbard, P., Hoek, W., Lowe, J., Andrews, J., and Björck, S.: Formal definition and dating of the GSSP (Global Stratotype Section and Point) for the base of the Holocene using the Greenland NGRIP ice core, and selected auxiliary records, J. Quaternary Sci., 24, 3–17, 2009.
White, D. A., Fink, D., and Gore, D. B.: Cosmogenic nuclide evidence for enhanced sensitivity of an East Antarctic ice stream to change during the last deglaciation, Geology, 39, 23–26, 2011a.
White, D., Fülöp, R.-H., Bishop, P., Mackintosh, A., and Cook, G.: Can in-situ cosmogenic 14C be used to assess the influence of clast recycling on exposure dating of ice retreat in Antarctica?, Quat. Geochronol., 6, 289–294, 2011b.
White, D. A., Fink, D., Lilly, K., O'Brien, P., Dorschel, B., Berg, S., Bennike, O., Gore, D. B., Fabel, D., and Blaxell, M.: Rapid ice sheet response to deglacial and Holocene paleoenvironmental changes in eastern Prydz Bay, East Antarctica, Quaternary Sci. Rev., 280, 107401, 2022.
Yamane, M., Yokoyama, Y., Miura, H., Maemoku, H., Iwasaki, S., and Matsuzaki, H.: The last deglacial history of Lützow-Holm Bay, East Antarctica, J. Quaternary Sci., 26, 3–6, 2011.
Yeung, N., Menviel, L., Meissner, K., and Sikes, E.: Assessing the Spatial Origin of Meltwater Pulse 1A Using Oxygen-Isotope Fingerprinting, Paleoceanography and Paleoclimatology, 34, 2031–2046, 2019.
Zwally, H. J., Giovinetto, M. B., Beckley, M. A., and Saba, J. L.: Antarctic and Greenland Drainage Systems, GSFC Cryospheric Sciences Laboratory, http://icesat4.gsfc.nasa.gov/cryo_data/ant_grn_drainage_systems.php, (last access: 27 August 2024), 2012.