the Creative Commons Attribution 4.0 License.
the Creative Commons Attribution 4.0 License.
 | 10 Sep 2025
Ongoing firn warming at Eclipse Icefield, Yukon, indicates potential widespread meltwater percolation and retention in firn pack across the St. Elias Range
Ingalise Kindstedt
Dominic Winski
C. Max Stevens
Emma Skelton
Luke Copland
Karl Kreutz
Mikaila Mannello
Renée Clavette
Jacob Holmes
Mary Albert
Scott N. Williamson
Warming in high alpine regions is leading to an increase in glacier surface melt production, firn temperature, and firn liquid water content, altering regional hydrology and climate records contained in the ice. Here we use field observations and firn modeling to show that although the snowpack at Eclipse Icefield at 3000 m in the St. Elias Range, Yukon, Canada, remains largely dry, meltwater percolation is likely to increase with an increase in intense melt events associated with continued atmospheric warming. In particular, the development of year-round deep temperate firn at Eclipse Icefield is promoted by an increase in the number of individual melt events and in average melt event magnitude combined with warmer wintertime temperatures, rather than an earlier or prolonged melt season. Borehole temperatures indicate that from 2016 to 2023 there was a 1.67 °C warming of the firn at 14 m depth (to °C in 2023). Results from the Community Firn Model show that warming of the firn below 10 m depth may continue over the next decade, with a 2 % chance of becoming temperate year-round at 15 m depth by 2033, even without continued atmospheric warming. Model results also show that the chance of Eclipse Icefield developing year-round temperate firn at 15 m depth by 2033 increases from 2 % with 0.1 °C atmospheric warming over the period 2023–2033 to 12 % with 0.2 °C warming, 51 % with 0.5 °C warming, and 98 % with 1 °C warming. As the majority of the St. Elias Range's glacierized terrain lies below Eclipse Icefield, the development of temperate firn at this elevation would likely indicate widespread meltwater percolation in this region and a wholesale change in its hydrological system, reducing its capacity to buffer runoff and severely limiting potential ice core sites. It is therefore urgent that a deep ice core be retrieved while the record is still intact.
- Article
(18412 KB) - Full-text XML
- BibTeX
- EndNote


Firn is defined as snow that has survived one melt season and is found in the accumulation region of glaciers, ice caps, and ice sheets around the world (Miller, 1952). There is increasing evidence that firn columns are warming and melting (Vandecrux et al., 2024; Horlings et al., 2022; Ochwat et al., 2021; Polashenski et al., 2014; Bezeau et al., 2013), which can alter the snow and firn structure, temperature, and chemistry, compromising the climate record in the developing ice column (Samimi and Marshall, 2017). Liquid water in the snow and firn can also preclude ice core drilling efforts. In addition, firn water retention can dramatically delay the release of glacier melt to downstream hydrological systems and act as a buffer to glacier runoff (Culberg et al., 2021; MacFerrin et al., 2019; Koenig et al., 2014; Harper et al., 2012). When deep percolation and localized freezing occur, firn storage of surface melt can cause a lag in runoff of years to decades (Harper et al., 2012). Alternatively, the development of near-surface low-permeability ice layers can lead to increased runoff in the longer term (MacFerrin et al., 2019; Machguth et al., 2016). Surface melt can be retained in the firn pack, either refrozen in ice layers or in liquid form as irreducible water, slush fields, or a firn aquifer (Clerx et al., 2022). Firn aquifers can store large amounts of liquid water and can retain water for several years, both delaying runoff and warming the firn (Ochwat et al., 2021; Miège et al., 2016; Jansson et al., 2003; Schneider, 1999; Fountain, 1989). For example, firn aquifers across Greenland have been estimated to store 140±20 Gt of liquid water, buffering ∼ 0.4 mm of sea level rise (Koenig et al., 2014).
Glacierized high alpine regions contain unique regional climate records and act as water towers for downstream human and ecological communities (Miller et al., 2021; Immerzeel et al., 2019; Winski et al., 2018; Fisher et al., 2004). Despite the importance of warming high alpine firn columns, comparatively little work has been done on the thermal evolution and meltwater retention of firn in these regions (e.g., Ochwat et al., 2021; Schneider, 1999; Fountain, 1989) compared to Greenland (e.g., Amory et al., 2024; Horlings et al., 2022; Culberg et al., 2021; MacFerrin et al., 2019; Machguth et al., 2016; Miège et al., 2016; Harper et al., 2012). Amplified warming at high elevations (Williamson et al., 2020), combined with high annual snow accumulation (Marcus and Ragle, 1970) that can insulate underlying firn, makes the heavily glacierized St. Elias Range a region of potentially widespread meltwater retention and active firn aquifer development.
The St. Elias Range (henceforth referred to as “St. Elias”) is a mountain range located in the southwest Yukon, Canada, on the border between the Yukon and Alaska (Fig. 1). Prior work on the upper Kaskawulsh Glacier, a prominent glacier on the east side of the range, revealed a firn aquifer that may have developed within the last decade, though its age cannot be well constrained (Ochwat et al., 2021). In contrast, observations from 2002 and 2016 at Eclipse Icefield (“Eclipse”), ∼ 350 m higher in elevation than the Kaskawulsh aquifer, have shown a relatively dry snow and firn pack (Kochtitzky et al., 2020; McConnell, 2019; Yalcin et al., 2006). Firn observations that span 20 years, nearby weather station data, and observed firn aquifer development at lower-elevation sites in the region make Eclipse a compelling case study for firn evolution and aquifer development in St. Elias and in glacierized alpine areas more generally. Here we combine field observations and firn modeling at Eclipse to determine the conditions required to develop a temperate firn column in a formerly polythermal high alpine regime. Specifically, we address the following questions: (1) is there evidence for current and increasing melt production and percolation at Eclipse? (2) How much warming is required to develop year-round temperate firn at Eclipse? (3) Does the distribution of warming throughout the year and/or among intense heat events matter?
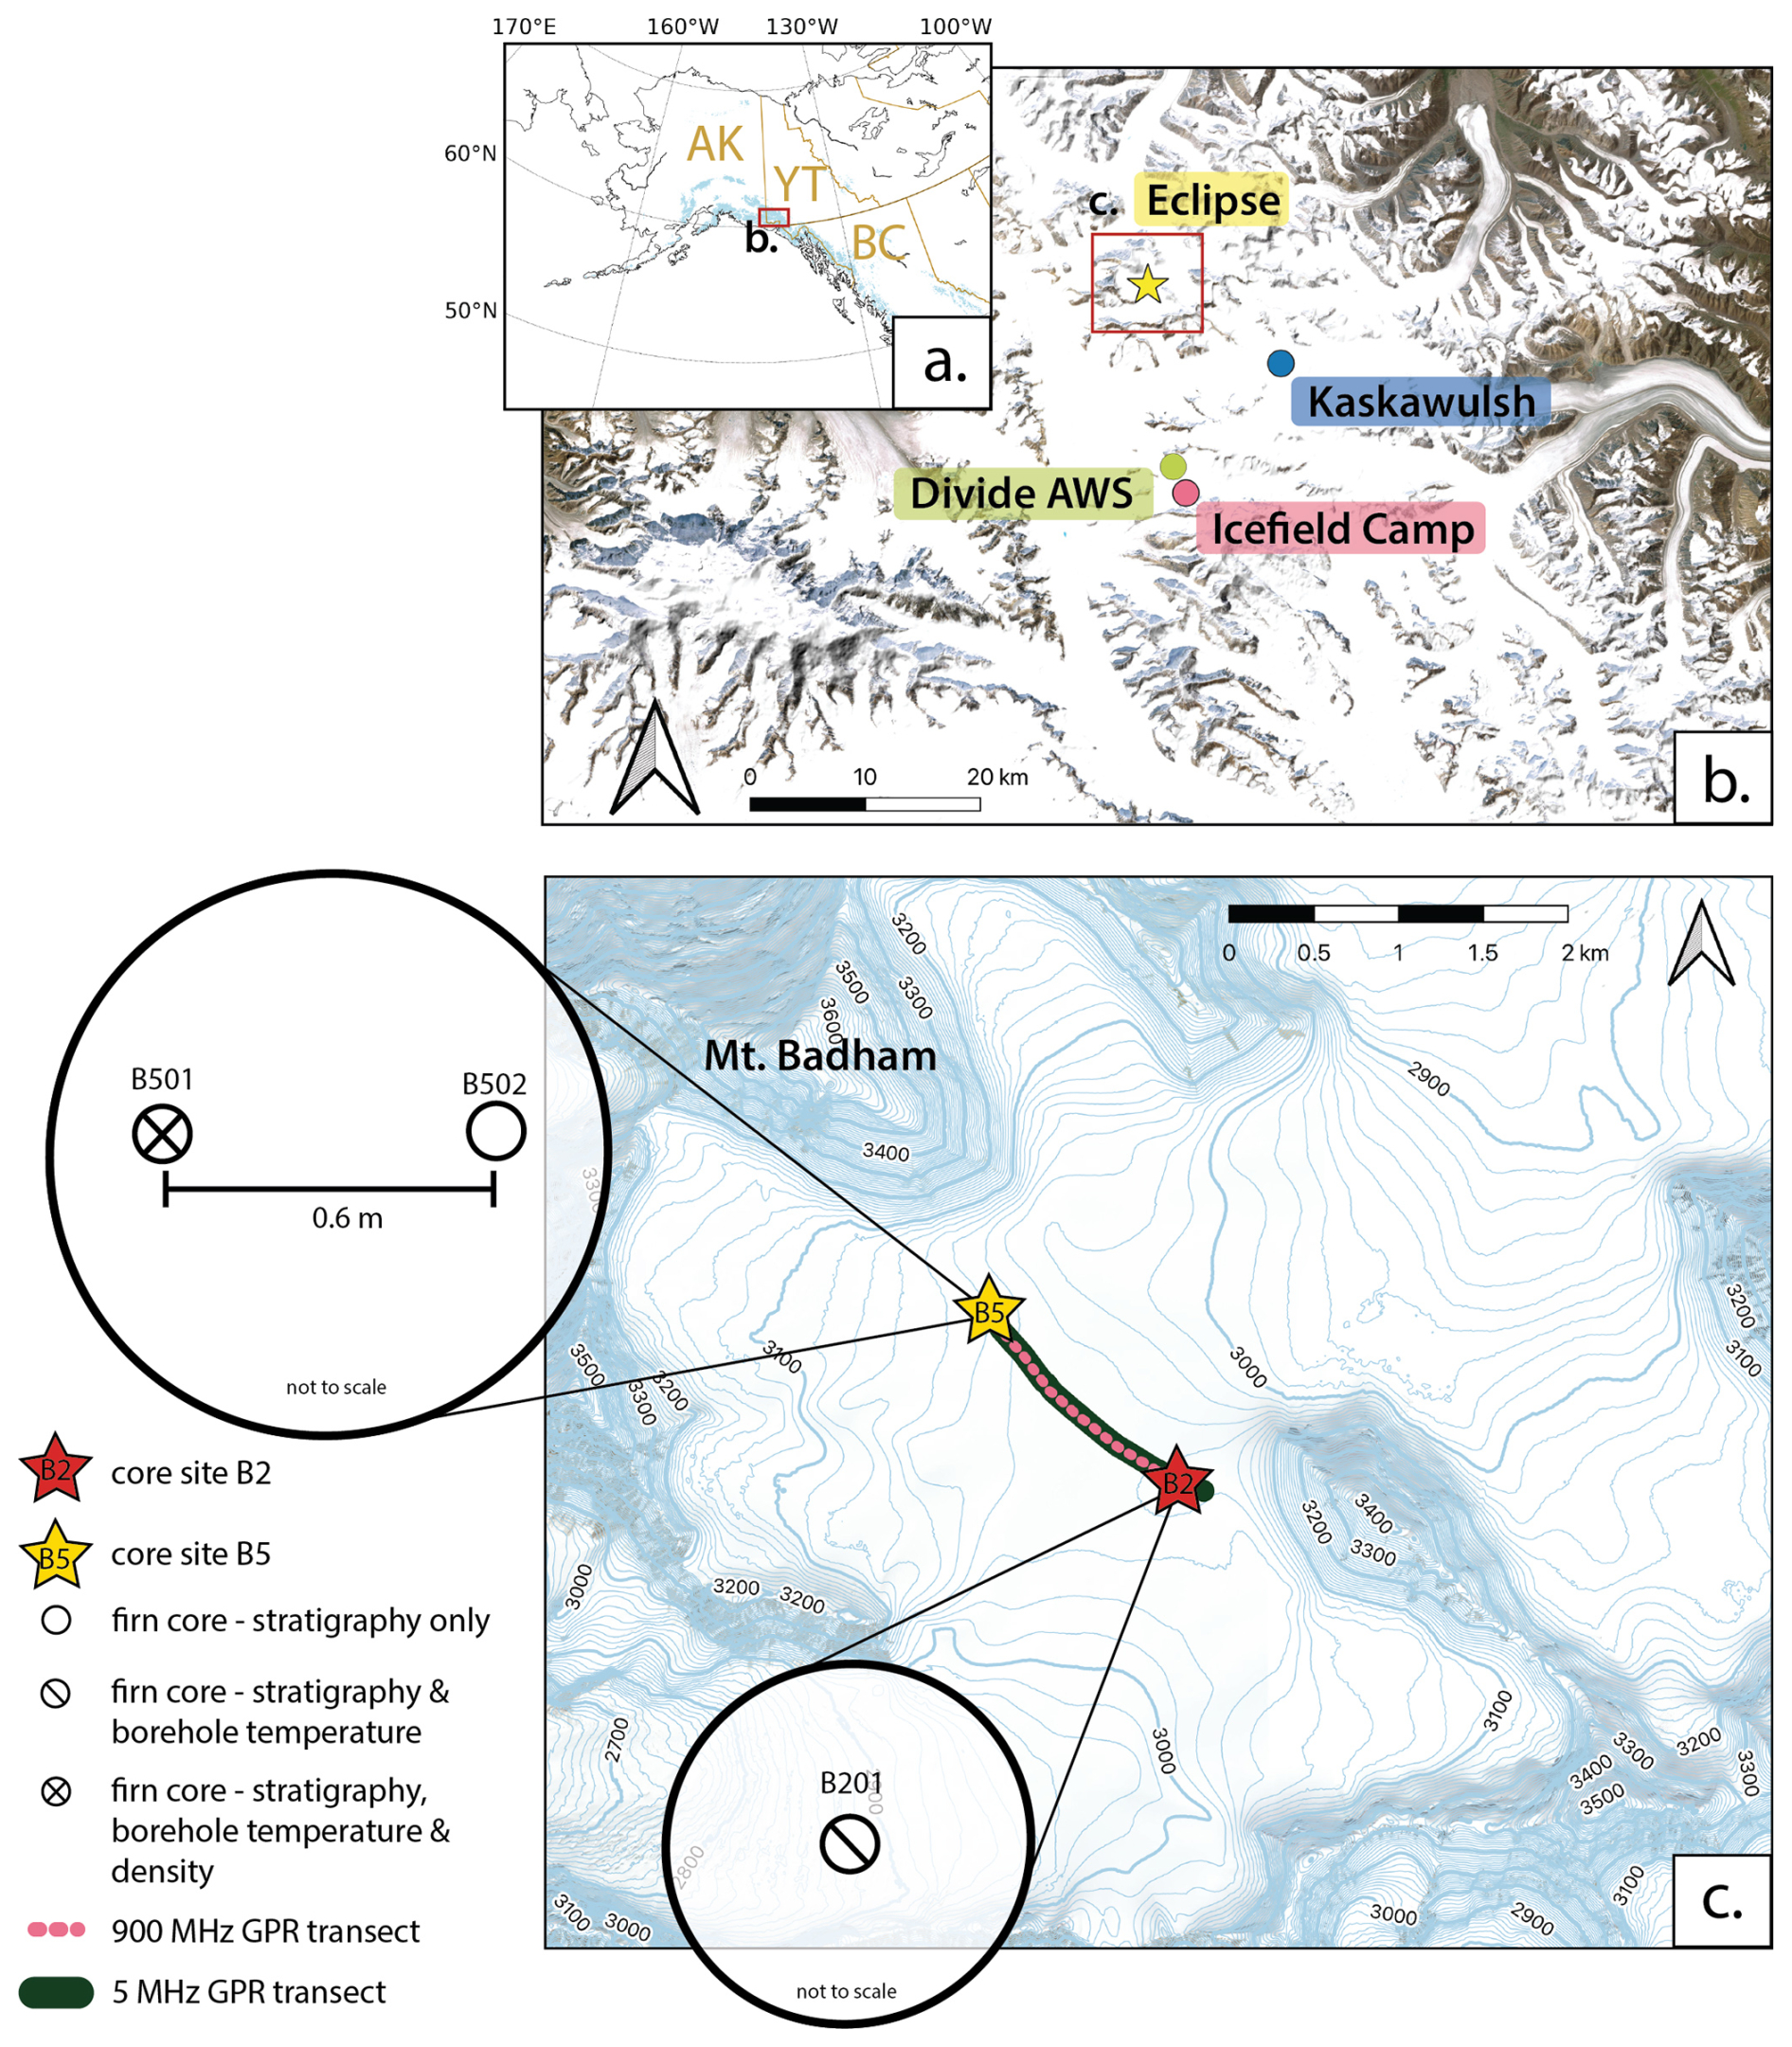
Figure 1Study area in the St. Elias Range with firn cores and ground-penetrating radar collected in the 2023 field campaign. The Gulf of Alaska region is shown in panel (a) with Alaska (AK), Yukon Territory (YT), and British Columbia (BC) labeled in gold. Relevant sites in the St. Elias Range are shown in panel (b), the extent of which is indicated by the red box in panel (a). Panel (c) shows a close-up view of Eclipse Icefield, bounded by the red box marked “Eclipse” in panel (b). Elevation contours in panel (c) are given in meters. Base imagery in panels (b) and (c) is from ESRI.
2.1 Firn core recovery
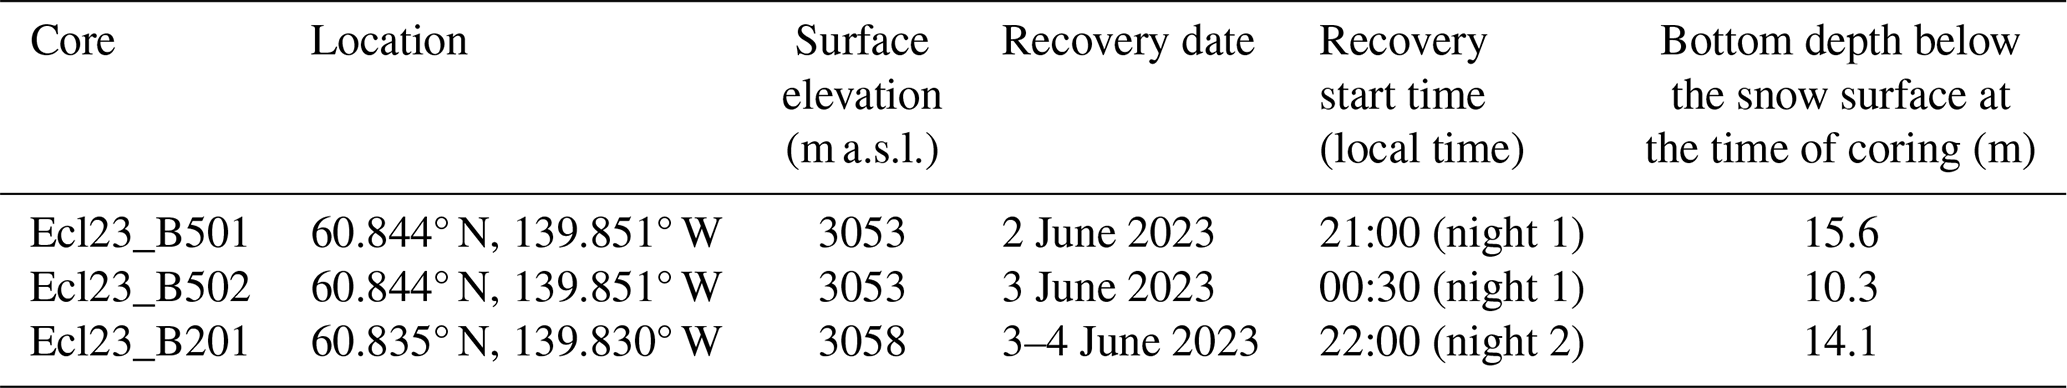
We recovered three firn cores from Eclipse Icefield between 2 and 4 June 2023 (Fig. 1c). Cores B501 and B502 were drilled from the surface to depths of 16.2 and 10.9 m, respectively, at 60.844° N, 139.851° W, 0.6 m apart from each other, to assess the small-scale spatial variability of near-surface melt features. Core B201 was drilled from the surface to 14.7 m depth at 60.835° N, 139.830° W (at a similar elevation ∼ 1.5 km to the southeast). Cores B501 and B502 were drilled in one night over the course of 5 h; core B201 was drilled the following night. A summary of core recovery information is given in Table 1.
2.1.1 Stratigraphy
We recorded the stratigraphic character of each layer within each core (e.g., opacity, texture, ice layers) in the field and logged accompanying back-lit photos. We describe layers as either “fine-grained” or “coarse-grained”. We use the term “fine-grained” to refer to sections of firn composed of <1 mm grains that separate readily when force is applied to the core. In this context, fine-grained firn is firn that shows no visible evidence of melt alteration. We use the term “coarse-grained” to refer to sections of firn composed of 1–2 mm well-sintered ice grains (Fig. A1b). Unlike the large, faceted grains in surface and depth hoar, which reduce layer strength, the rounded, well-sintered grains in our coarse-grained firn result in a strong icy layer requiring a saw to cut through. Despite their sintering, the grains remain readily distinguishable from one another, differentiating these layers from glacier ice. We use the terms “ice lens” and “ice layer” to refer to regions of solid ice that extend partially and fully across our core diameter, respectively. Uncertainty in our stratigraphy comes from the accuracy of the ruler used to measure core depths, as well as the subjective delineation of stratigraphic boundaries within the core. The ruler used was marked to the millimeter, so we report individual layer thicknesses to 0.001 m. However, we report layer depths and thicknesses of stratigraphic sections spanning more than one core segment to 0.01 m to account for the compounded uncertainty over accumulating core segments. We report all layer depths relative to the last summer surface (LSS) because of high uncertainty in our measurements of seasonal snow depth resulting from the visual similarity of seasonal snow and core chips (a drilling artifact) pulled out of the drill barrel. For visual representation purposes, we show the LSS in all three cores to be located at ∼ 4.25 m depth despite differences in measured depth. Because we are focusing on the firn below the LSS, standardizing the core depths to the LSS provides a more useful visual than standardizing them to the snow surface.
2.1.2 Density
We recorded density in the field for core B501 starting at 1.92 m depth. We did not record density for the unconsolidated snow above this because the volume uncertainty of core segments was too high. Core sections were sawed into roughly 10 cm segments or delineated at existing breaks. We then measured each segment’s length, diameter, and mass and assessed its cylindrical completeness. Following the methods of Ochwat et al. (2021), we assigned each core segment a cylindrical completeness value (f) of 0–1, with 1 denoting an intact core and fractional values denoting the portion of core segment present. For example, a core segment determined via visual inspection to have 5 % of its volume missing due to chipping or crumbling would be assigned an f value of 0.95. Density (ρ) was calculated for each core segment using
where m is mass, V is volume, L is core segment length, and D is the average diameter. We removed outliers for all depths below the last summer surface if their density was >917 or <300 kg m−3 within uncertainty. We report density for the top depth of each segment. For example, the density value reported for a depth of 3.40 m would be measured over the segment from 3.40 to 3.50 m depth below the snow surface at the time of coring.
Uncertainty in our density measurements comes from a variety of sources and can be calculated based on the uncertainties in mass and volume with the following.
Mass uncertainty arises from the accuracy of the scale. The scale used has a nominal accuracy of ±0.1 g, but we assign a mass uncertainty of 0.3 g to account for residual snow or water on its surface. Volume uncertainty comprises uncertainty in the measured segment length and radius (used to calculate cross-sectional area A) and in the subjective assignment of cylindrical completeness (f).
Our ruler was marked every millimeter, but following Ochwat et al. (2021), we assign to account for rough-cut core segments with crumbly edges. We then calculate the uncertainty in area using
We also follow Ochwat et al. (2021) in assigning an uncertainty of df=0.1 for f≥0.8 and df=0.2 for f<0.8 because a less complete core is more difficult to visually assess. We calculate the uncertainty for mean density values from the root mean square of all point values being averaged.
We report the top depth of all density measurements relative to the snow surface assuming an LSS depth of 4.24 m below the surface. Consequently, absolute depths reported have an uncertainty of ±0.2 m; however, density calculations depend on segment thickness rather than absolute depth and therefore use the assigned measurement uncertainty of 0.25 cm. Although densities can be reported to the top or middle depth of core segments, we report them here to the top of segments for consistency with our stratigraphy, which we report to segment tops to focus on the transition between melt-altered and unaltered sections of firn; this is more physically interesting than the midpoint depths of sections.
2.1.3 Borehole temperatures
We obtained temperature measurements from the boreholes of cores B501 and B201 using an RBRsolo3 T compact single-channel temperature logger. We allowed the borehole to equilibrate for approximately 12 h after drilling before installing or metering any temperature sensors. We obtained one temperature measurement near the bottom of B201 (14.1 m below the snow surface) after the sensor was allowed to equilibrate in the borehole for 1.5 h and one temperature measurement near the bottom of B501 (15.5 m below the snow surface) after the sensor was allowed to equilibrate in the borehole for 1.5 h. In addition to these deep equilibrated measurements, we acquired a full-length temperature profile for each core. Due to time constraints in the field, this was based on 30 s of measurement time at each depth, after 30 s of equilibration time. After recording the surface air temperature, we lowered the logger into the borehole using a survey wheel while continuously sampling at a rate of 2 Hz. At 20 cm intervals, we paused lowering and recorded a timestamp to identify the temperature at that depth. RBRsolo3 T temperature measurements have an initial accuracy of ±0.002 °C, which we apply to our basal borehole temperatures when the sensor was allowed to equilibrate in the borehole for 1.5 h. We assign an uncertainty of 0.01 °C to our temperature profiles at 20 cm increments when a 30 s equilibrium time was used. We ignore the effects of advective heat transport for three reasons: we were most concerned with temperatures below 10 m depth, boreholes were only ∼ 5 cm across, and surface conditions were very similar on both days when temperature measurements were collected (sunny, light breeze).
2.2 Ground-penetrating radar
We collected ground-penetrating radar (GPR) data at frequencies of 900 and 5 MHz using two different systems to image the near subsurface (∼ 20 m depth) and full ice thickness (up to 700 m depth), respectively. We collected very high-frequency (VHF) data on 2 June 2023 with a GSSI system using a shielded 900 MHz center frequency antenna (model 3101) and an SIR4000 control unit paired with a Garmin GPSMap78 (horizontal and vertical accuracy of ±3 m). We collected data at 2048 samples per scan and 24 scans per second with a range of 240 ns. We collected high-frequency (HF) data on 4 June 2023 with a Blue Systems Integrated (BSI) 5 MHz antenna, with 30 m separation between the transmitter and receiver. We ski-towed both GPR systems at a rate of ∼ 1 m s−1 to obtain profiles of stratigraphy between core sites B2 and B5 (Fig. 1c). Radar data were processed in ImpDAR (Lilien et al., 2020) using standard processing techniques, including clipping stationary periods, constant trace spacing, bandpass filtering, and normal move-out analysis to correct for antenna separation. HF data were also migrated using the SeisUnix sumigtk routine to correct for hyperbolic reflections from basal topography. Depth-variable density profiles obtained from shallow (2023 B501) and deep (2002) cores were used to calculate variable, permittivity-dependent radar-wave velocities to determine the depth of reflected layers. The LSS was semiautomatically picked across the VHF profile; a full description of this picking can be found in Lilien et al. (2020).
2.3 Firn modeling
We model the firn pack evolution over a period of 20 years (2013–2033) at Eclipse using the Community Firn Model (CFM), an open-source, modular model framework coded in Python 3 and available for download on GitHub (Stevens et al., 2020). We used the CFM to simulate firn density and temperature evolution as well as meltwater retention and refreezing. We parameterize firn density evolution using the densification scheme from Kuipers Munneke et al. (2015) and a time-invariant surface density derived from sensitivity testing (Table B1). The densification equation from Kuipers Munneke et al. (2015) was calibrated for use in Greenland using firn data from sites spanning a range of climates, and it is reasonable to assume that the climate at Eclipse is similar to some locations in Greenland. Any firn densification model is possibly subject to tuning biases (e.g., Kuipers Munneke model was tuned using RACMO climate data, so biases in RACMO will affect the model tuning). We do not expect that using a different firn densification equation would change our results and conclusions. The CFM uses a bucket scheme to simulate meltwater percolation, and it uses an enthalpy-based heat transfer scheme to simulate heat diffusion in the presence of phase changes. We use a parameterization for thermal conductivity from Calonne et al. (2019) and a Neumann boundary condition for the heat equation at the bottom of the 50 m deep firn column. We force the model with air temperature data from a weather station near the ice divide between the Kaskawulsh and Hubbard glaciers (30 km away, “Divide AWS”; Fig. 1b), surface melt calculated from air temperatures using a simple degree day model, and a mean annual accumulation rate of 1.4 m a−1 (McConnell, 2019) with monthly scalars applied (Fig. B5). We calculate these scalars using an in situ snow accumulation record from Divide. We use 4 years of complete coverage (2004, 2005, 2006, 2008) to compute each month's mean fractional contribution to annual accumulation. When incorporated into the CFM, we distribute each month's portion of the annual 1.4 m w.e. evenly across the days of the month. We elevation-correct Divide AWS air temperatures to Eclipse (∼ 400 m higher) using a lapse rate of −3.98 °C km−1 following Hill et al. (2021).
We spin the model up from ∼ 1983–2013 (exact spin-up time varies slightly among model runs as it is the time required to refresh the entire firn column and therefore dependent on densification rate and surface melt) using monthly averaged downscaled North American Regional Reanalysis (NARR) air temperatures for Eclipse from 1983 to 2013 (Jarosch et al., 2012). We also test the model sensitivity to three other spin-up schemes using different air temperature datasets: (1) elevation-adjusted Divide AWS data from 2013 to 2024 repeated for the duration of the spin-up, (2) synthetic climate data selected from a Gaussian distribution of temperatures based on elevation-adjusted 2013–2024 Divide AWS data, and (3) like spin-up scheme (2) but with a historical 0.024 °C a−1 rate of temperature change (Williamson et al., 2020) applied for the duration of the spin-up such that the mean annual temperature at the start of the main model run is consistent with elevation-adjusted 2013 Divide AWS data. All model spin-ups are forced with a mean annual accumulation rate of 1.4 m a−1. For our spin-up sensitivity tests, we test each spin-up scheme with 15 different degree day factor (DDF) values used to estimate surface melt from air temperatures and 20 different surface density values (Table B1). We select a representative pairing (DDF =6.2, ρ=450 kg m−3) from all the combinations of DDF and surface density values that produce no liquid water down to 14 m depth in the firn in both spring 2016 and spring 2023 (consistent with firn cores and GPR showing no evidence of liquid water at those times) and a firn temperature between −2 and −4 °C at 14 m depth in spring 2023 (consistent with 2023 borehole temperature measurements). We refer to this selected model as our “reference model”. Our exploration of model sensitivity to spin-up scheme, DDF, and surface density values is detailed in Appendix B.
We run the model with approximately 1 d time steps. After spin-up (∼ 1983 to 2013), we apply the elevation-adjusted Divide AWS temperature data as forcing from 2013–2024 and then run the CFM under a suite of climate scenarios from 2024–2033, including (a) continuation of current climate, (b) 0.1 °C cooling, (c) 0.1 °C warming, (d) 0.2 °C warming, (e) 0.5 °C warming, and (f) 1 °C warming by 2033. We generate synthetic air temperatures for all 2024–2033 climate scenarios by computing the mean and standard deviation of the 2013–2024 Divide AWS daily mean temperature values (computed from hourly measurements) for each day of year. We then assign synthetic daily air temperatures randomly drawn from Gaussian distributions described by these means and standard deviations. Temperatures for scenario (a) are drawn from the distribution described by the mean and standard deviation of 2013–2024 data. Temperatures for scenarios (b–f) are drawn from distributions with a prescribed rate of change applied to the mean such that the specified degree of warming or cooling for each scenario is reached by 31 December 2033. For each climate scenario, we run the model 50 times and calculate the percentage of model runs that produce temperate firn at 15 m depth by 2033.
To examine the conditions associated with the production of year-round temperate firn at 15 m depth, we quantify the mean winter temperature, melt season start, melt season end, melt season length, and total PDDs each year. We also quantify the number of individual melt events and each one's magnitude. We define melt events as any period over which the snow surface is continuously melting without refreeze.
2.4 Comparison among St. Elias study sites
To contextualize the firn conditions at Eclipse, we compare our results with data from two neighboring sites near the ice divide between the Kaskawulsh and Hubbard glaciers: Icefield Divide Camp (60.68° N, 139.78° W; 2603 m ), which we refer to as “Icefield Camp” to avoid confusion with reference to the broader Kaskawulsh/Hubbard Divide area, and the upper Kaskawulsh Glacier (60.78° N, 139.63° W; 2,640 m ), which we refer to as “Kaskawulsh”(Fig. 1b). On 4 June 2018, VHF (400 MHz) and HF (5 MHz) ground-penetrating radar data were collected at Icefield Camp; for a full description of GPR deployment and processing, see McConnell (2019). In the same year, two firn cores were recovered from the upper northern arm of Kaskawulsh Glacier by Ochwat et al. (2021). The cores were each 8 cm in diameter and drilled 60 cm apart from each other to depths of 36 m (Core 1) and 21 m (Core 2); liquid water was encountered at 34.5 m below the surface in Core 1 (Ochwat et al., 2021). Stratigraphy of both cores and density of Core 1 were measured in the field; densities for a subset of samples from Core 2 were measured after transporting the core from the field to nearby Kluane Lake Research Station. For a complete description of Kaskawulsh core recovery and analysis, see Ochwat et al. (2021).
We also contextualize the Eclipse, Icefield Camp, and Kaskawulsh sites within the St. Elias Range by producing a regional hypsometric curve for the region's glacierized terrain. We derive this curve from the ArcticDEM digital elevation model at 10 m resolution and highlight areas ranging from 2600 to 3000 m , which cover the elevation band between our sites of interest.
2.5 Firn changes at Eclipse over time
The St. Elias Range has been an area of glaciological study for decades. To investigate how firn at Eclipse has changed over time, we compare our 2023 data to other measurements made at Eclipse since 2002.
- i.
We compare 2023 GPR data to both VHF (400 MHz) and HF (10 MHz) GPR data from 2016, described in McConnell (2019).
- ii.
We compare 2023 density measurements to values measured in firn cores drilled in 2016 (McConnell, 2019). Density in the 2016 Eclipse ice core was measured by weighing each core segment (to the nearest 10 g) and dividing by the volume computed from one length measurement using a ruler (±0.5 cm accuracy) and the average of three diameter measurements using calipers (±0.5 mm accuracy).
- iii.
We compare 2023 borehole temperatures to values measured in 2016 using a string of iButtons and Easylog USB temperature sensors lowered into a borehole and allowed to equilibrate for over 24 h before logging data. iButton and Easylog sensors were both deployed at a sample rate of one per 300 s, and both sensors have an instrumental accuracy of 0.5 °C. For depths with multiple sensors, the mean of the temperature readings was taken as the final value.
- iv.
We compare 2023 density measurements to values from a 130 m ice core recovered in 2002 (Kochtitzky et al., 2020; Yalcin et al., 2006). Density values for the 2002 core were calculated in the field using bulk mass and volume measurements at 1 m increments (Kochtitzky et al., 2020; Kelsey et al., 2012). Ice layers were assumed to have a density of 910 kg m−3 and accounted for in the bulk density calculations.
3.1 Stratigraphy
The stratigraphy of all three 2023 cores shows ice layers, ice lenses, and melt-affected firn throughout the core; however, variability among individual melt features is high among all three cores despite the proximity (<1 m) of cores B501 and B502 (Fig. 2). The first ∼ 4 m of all three cores comprises the seasonal snowpack, with the last summer surface (LSS) appearing as a crusty layer of melt-affected firn. Unless otherwise specified, all following stratigraphic depths are reported relative to the LSS, which we designate as below the LSS or “BLSS”.
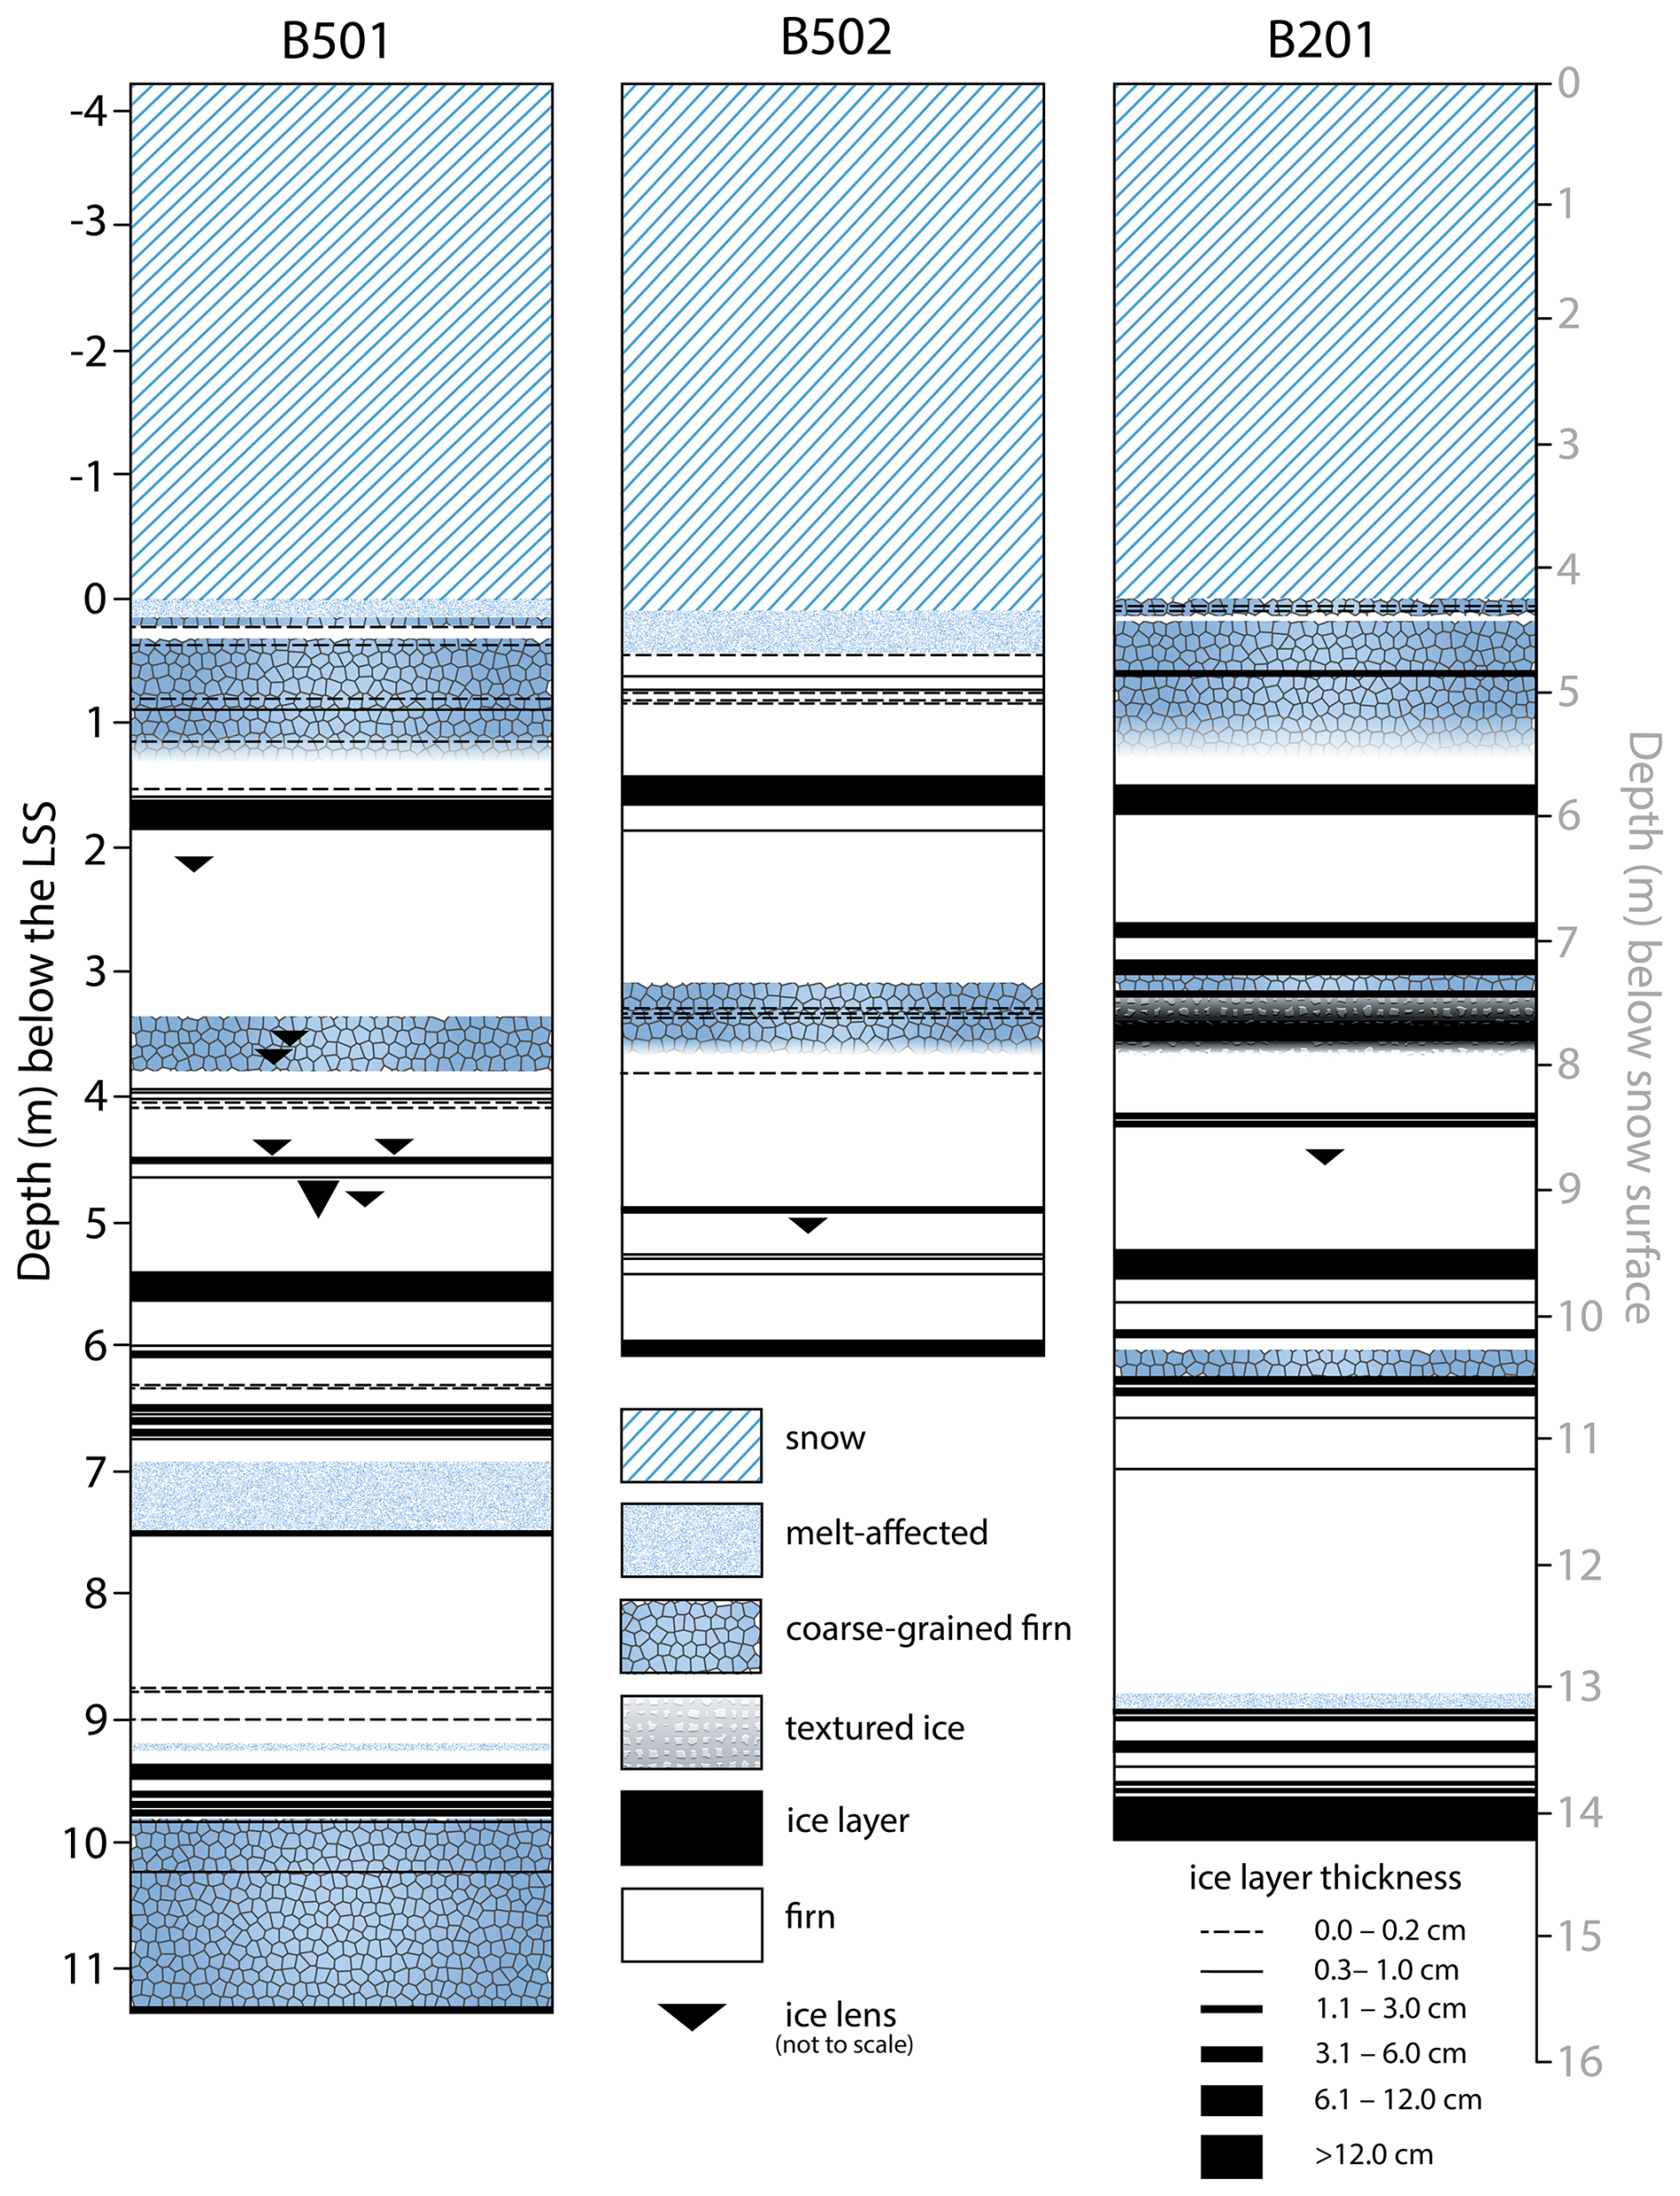
Figure 2Stratigraphy of the three firn cores drilled at Eclipse Icefield in 2023. The position of the LSS 0 m ark on the left-hand depth scale is the mean LSS depth (4.27 m).
In core B501, most of the top meter of firn below the LSS is coarse-grained and contains several hairline to 1.0 cm ice layers (Fig. 2). Approximately 1 m BLSS, the firn transitions from coarse-grained and very melt-affected to fine-grained with fewer melt features. It remains fine-grained until 3.40 m BLSS, where there is a sharp transition from fine- to coarse-grained firn. The largest sections of fine-grained firn occur from 2.15 to 3.40 m BLSS (1.25 m thick) and from 7.54 to 8.83 m BLSS (1.29 m thick). The rest of the core contains clusters of ice layers and lenses or is otherwise melt-affected based on texture and appearance. The thickest ice layer in the core begins at 5.46 m BLSS and is 12.0 cm thick. Core B501 has a total firn ice content of 5 % by volume and 40 % of its length below the LSS (11.34 m) is visibly metamorphized and/or melt-altered (ice layers, coarse-grained, and melt-affected sections as shown in Fig. 2).
In core B502, the first meter of firn below the LSS lacks the large crystals observed in core B501 but does contain numerous hairline to 1.0 cm thick ice layers (Fig. 2). The largest sections of fine-grained firn occur from 1.80 to 3.03 m BLSS (1.23 m thick) and from 3.72 to 4.82 m BLSS (1.10 m thick). The thickest ice layer in core B502 begins at 1.41 m BLSS and is 10.0 cm thick. Core B502 has a total ice content of 3 % by volume, and 19 % of its length below the LSS (5.96 m) is melt-altered.
In core B201, the LSS is defined based on the first appearance of coarse-grained firn rather than a crust as in B501 and B502 (Fig. 2). The top meter of firn below the LSS is coarse-grained and contains several ice lenses. At 1.18 m BLSS, the firn transitions from coarse- to fine-grained. The largest sections of fine-grained firn occur from 1.70 to 2.71 m BLSS (1.01 m thick) and from 7.10 to 8.90 m BLSS (1.80 m thick). Core B201 has three ice layers over 10 cm thick, the largest being at least 33 cm, where we stopped drilling because of mechanical difficulties. Core B201 has a total ice content of 10 % by volume, and 27 % of its length below the LSS (9.91 m) is melt-altered.
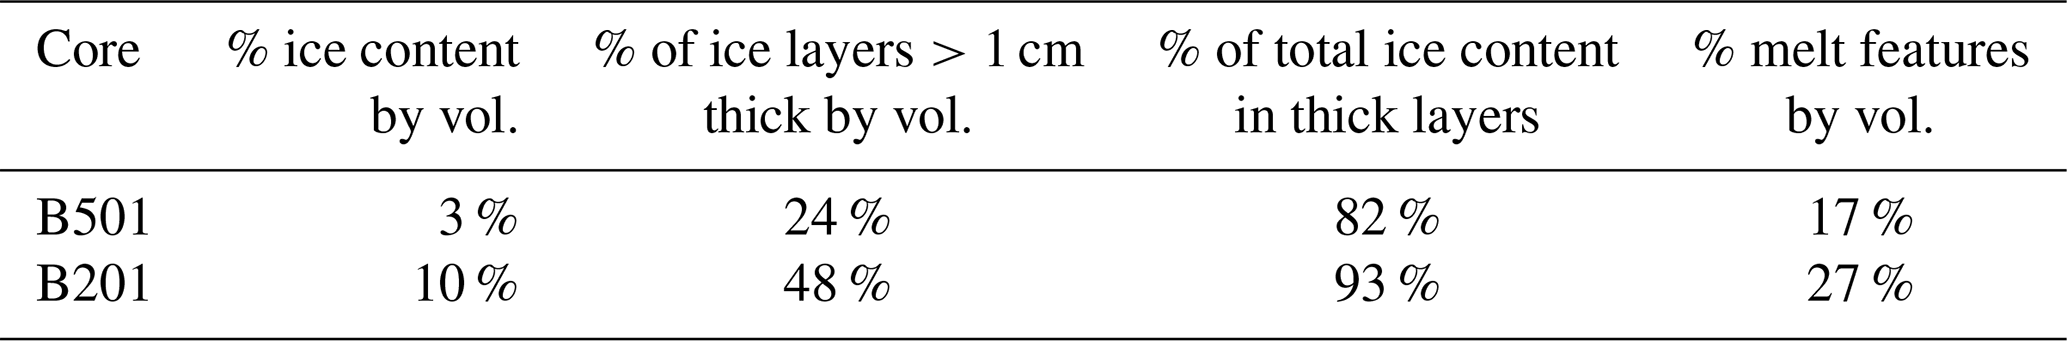
Ice content and melt alteration of cores B501 and B201 from the LSS down to 14.15 m depth (below snow surface) are summarized in Table 2. Although all three cores differ in their ice content and layer characteristics, we focus on the difference between cores B501 and B201 to maximize the depth of overlap for a greater sample domain.
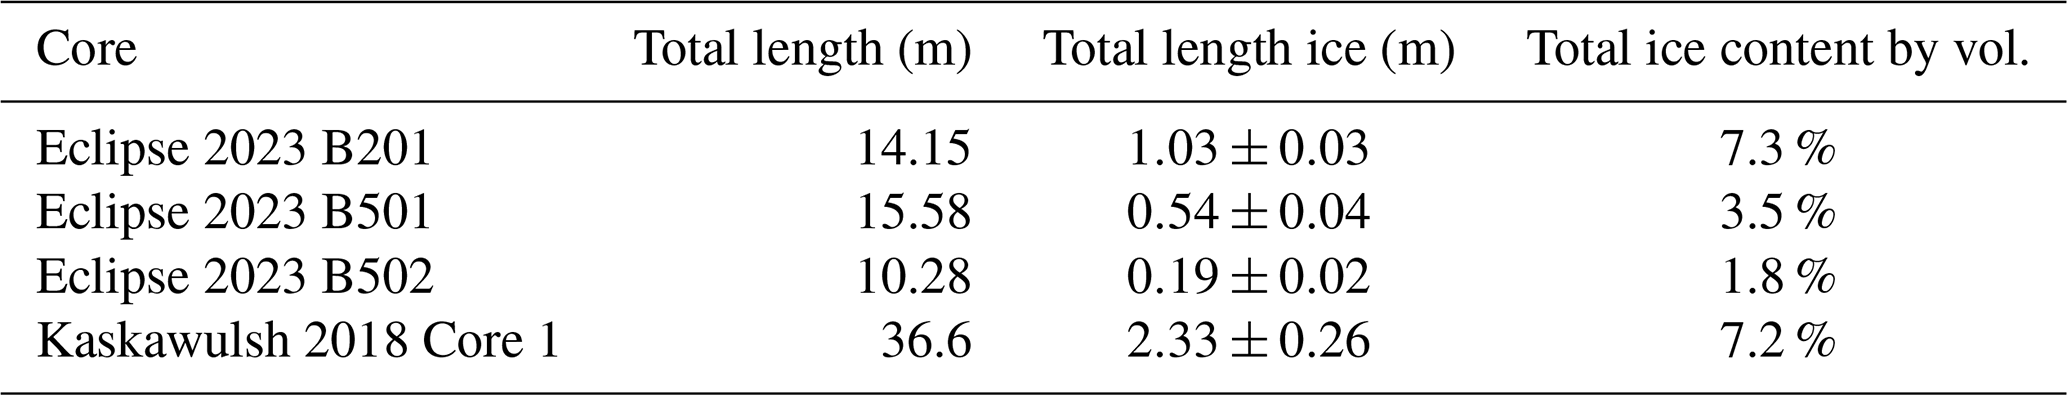
Table 2Ice content and melt alteration of cores B501 and B201 from the LSS to 14.15 m depth below the snow surface.
3.2 Density
In general, density increases with depth throughout the core. However, cyclic variations can be seen, which are likely seasonal, particularly in the top 10 m. Individual ice layers can also be identified by peaks in density (Fig. 3). We report density values beginning at 1.92 m depth (below the snow surface) because of high uncertainty in our volume measurements for the surface snow. The mean density from 1.92 m to the LSS at 4.24 m depth is 612±20 kg m−3. Seasonal snow above the LSS was dry with no ice content. We focus here on the firn below the LSS, much of which shows signs of melt alteration. The mean density of the top 2 m of firn below the LSS is 638±21 kg m−3. The mean density of the top 10 m of firn below the LSS is 689±10 kg m−3. The mean density of the bottom 2 m of the core is 722±23 kg m−3. The mean overall density of core B501 is 679±9 kg m−3. Note that although measured densities for some ice layers are implausibly high, their values are physically reasonable within uncertainty.
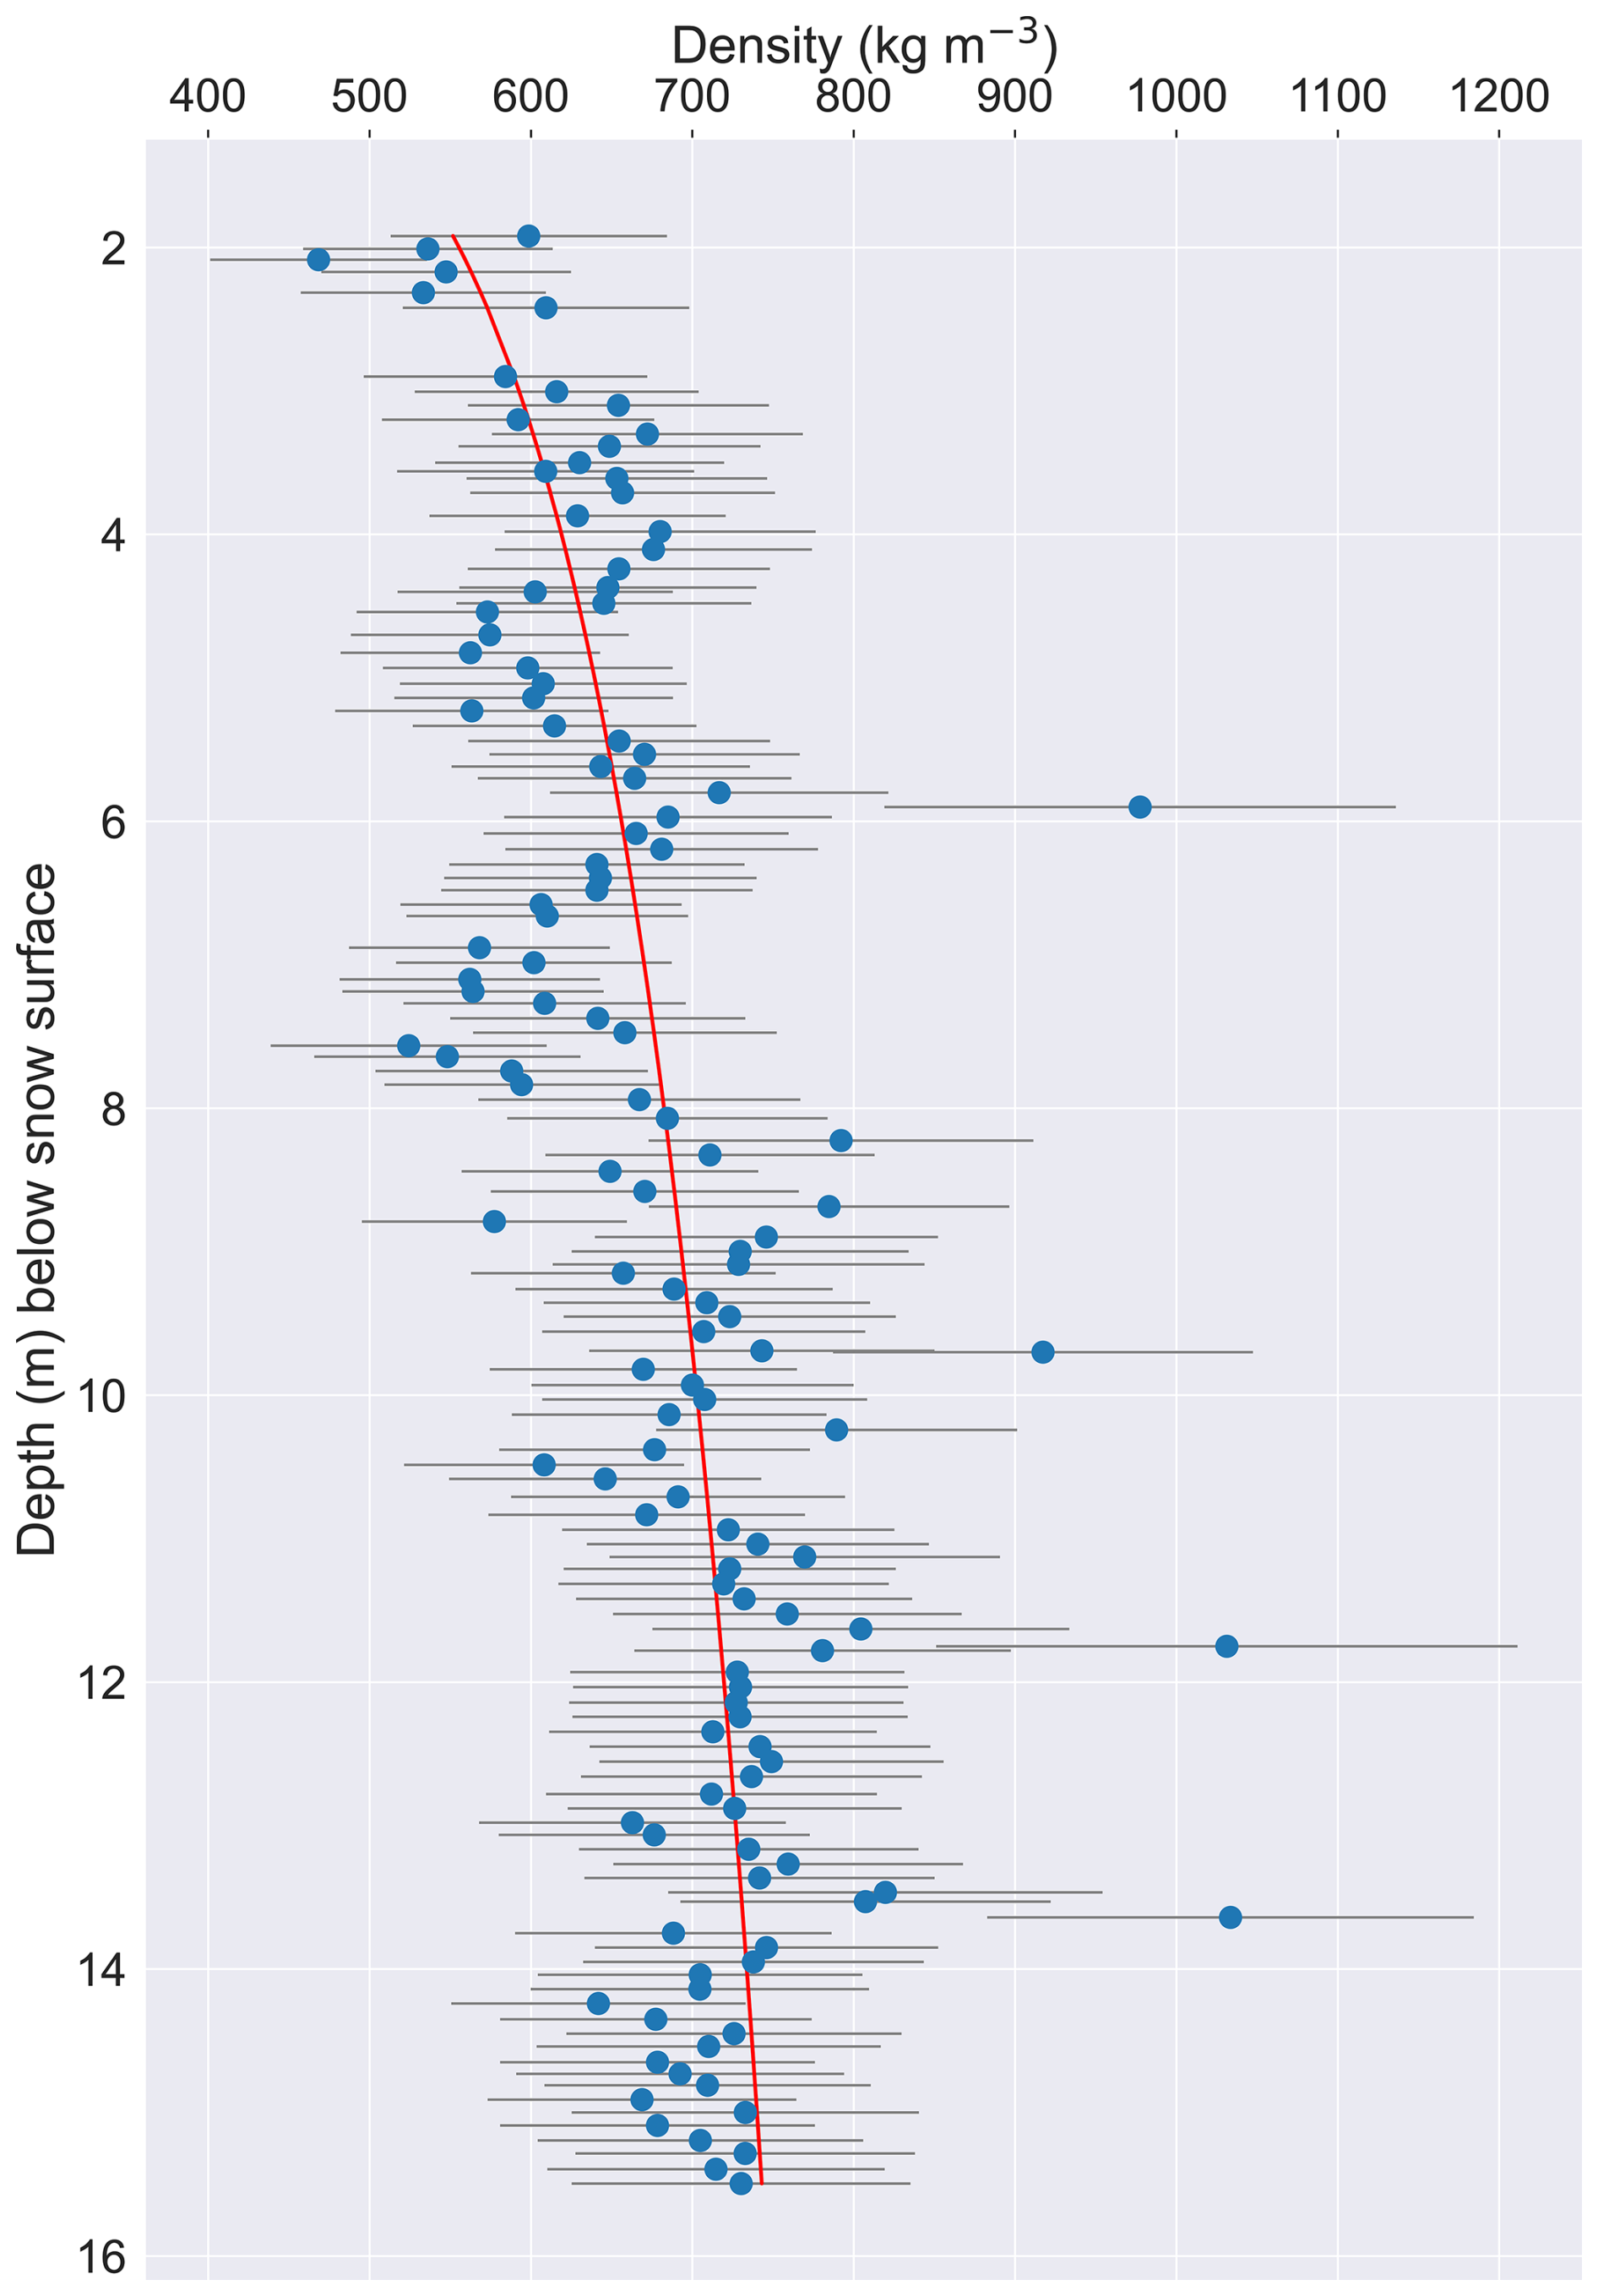
Figure 3Firn densities of 2023 core B501 with uncertainty values (gray) and a best-fit logarithmic curve (red). Measured densities begin at 1.92 m because the snow above that depth was too crumbly for accurate volume measurements.
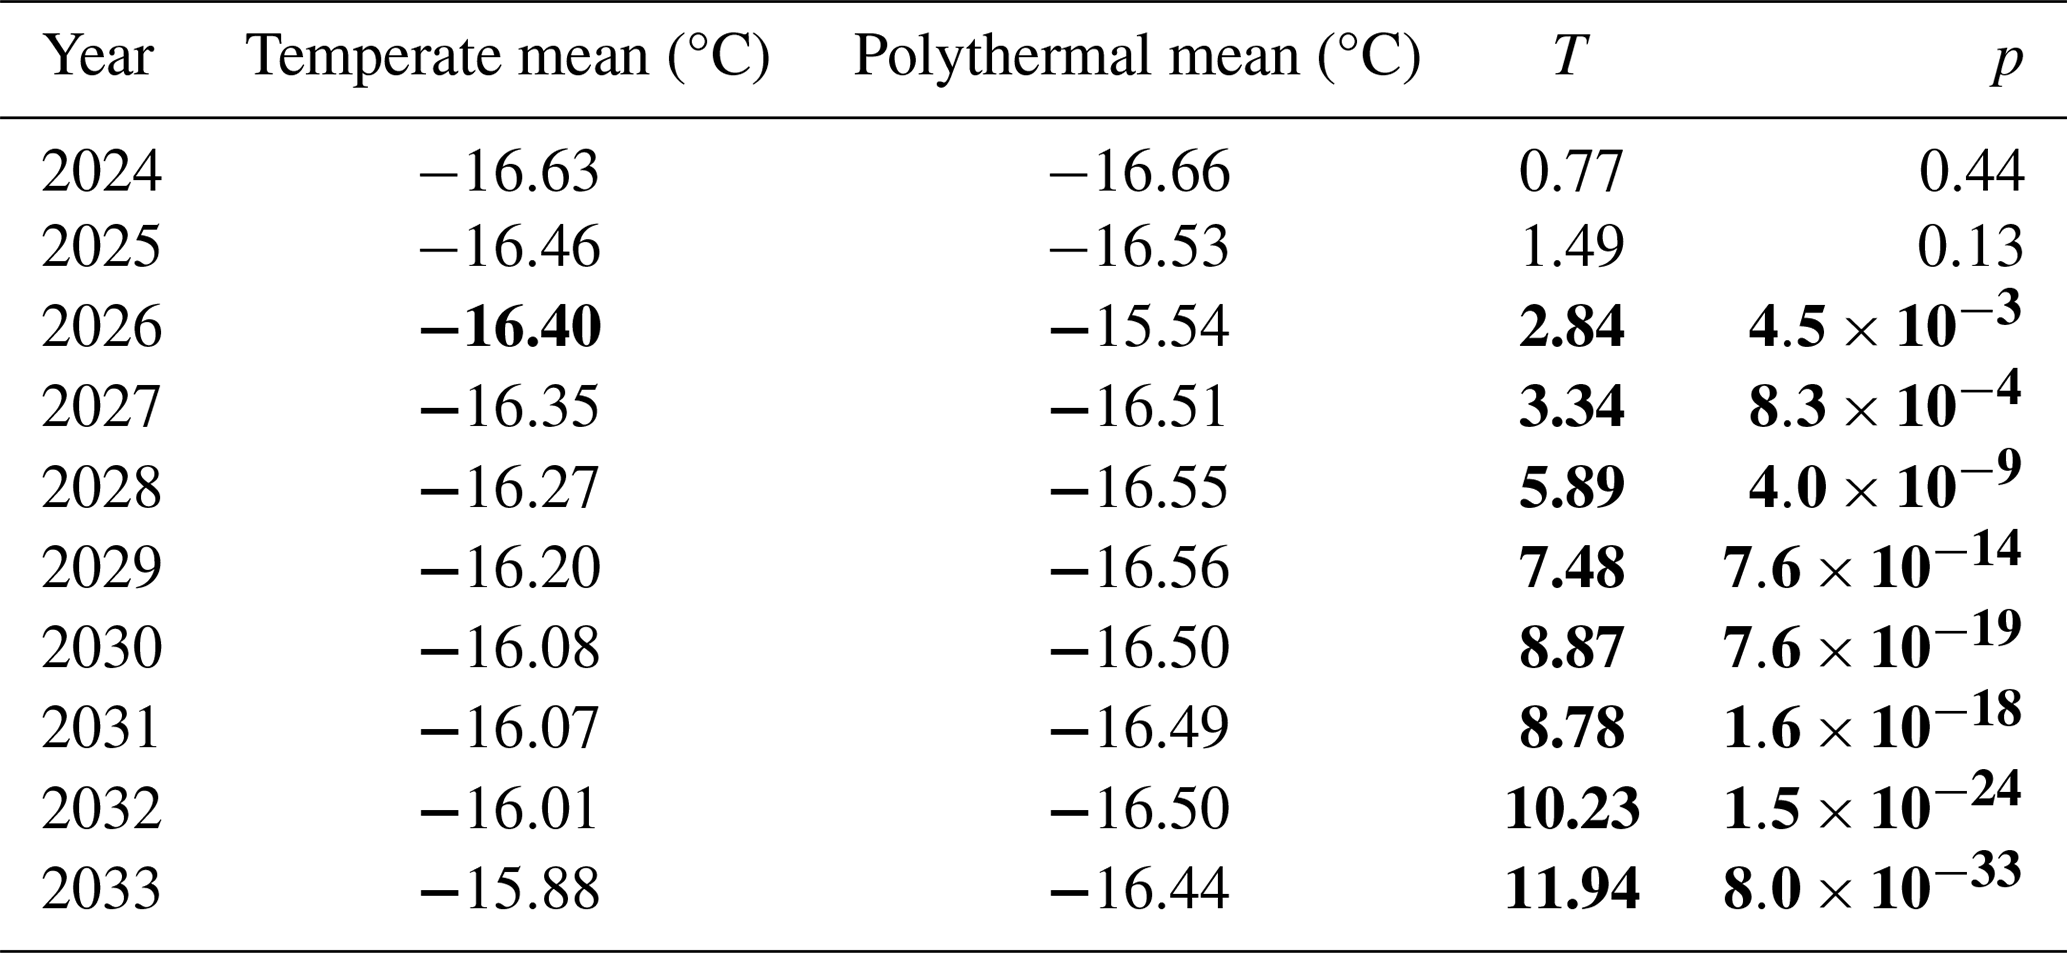
Table 3Difference in mean winter (October through March) temperatures (T, independent t test) between model runs that produce year-round temperate firn by 2033 and those that do not. Significant results (at the 95 % confidence level) are in bold.
3.3 Borehole temperatures
We obtained borehole temperatures down to 14.1 m depth (below the snow surface) for B201 and to 15.5 m depth (below the snow surface) for B501 (Fig. 4). Both profiles show an initial cooling for the top ∼ 3 m, which then transitions to a warming, with a temperature minimum just below −8 °C in the top 4 m of the profile. In B201, the warming continues until ∼ 12 m depth, below which the profile shows a temperature stabilization and slight cooling. In B501, the warming that begins around 3 m depth continues through the bottom of the profile domain (15.5 m). At 14 m depth, B2's temperature is °C and B5's temperature is °C. Although the temperature probe was continuing to equilibrate in the borehole at 1 min (30 s equilibration and 30 s measurement), our fully equilibrated spot measurements (indicated by stars in Fig. 4) are consistent with measurements acquired after only 30 s equilibration. We therefore consider our full temperature profiles to be adequately representative of borehole conditions.
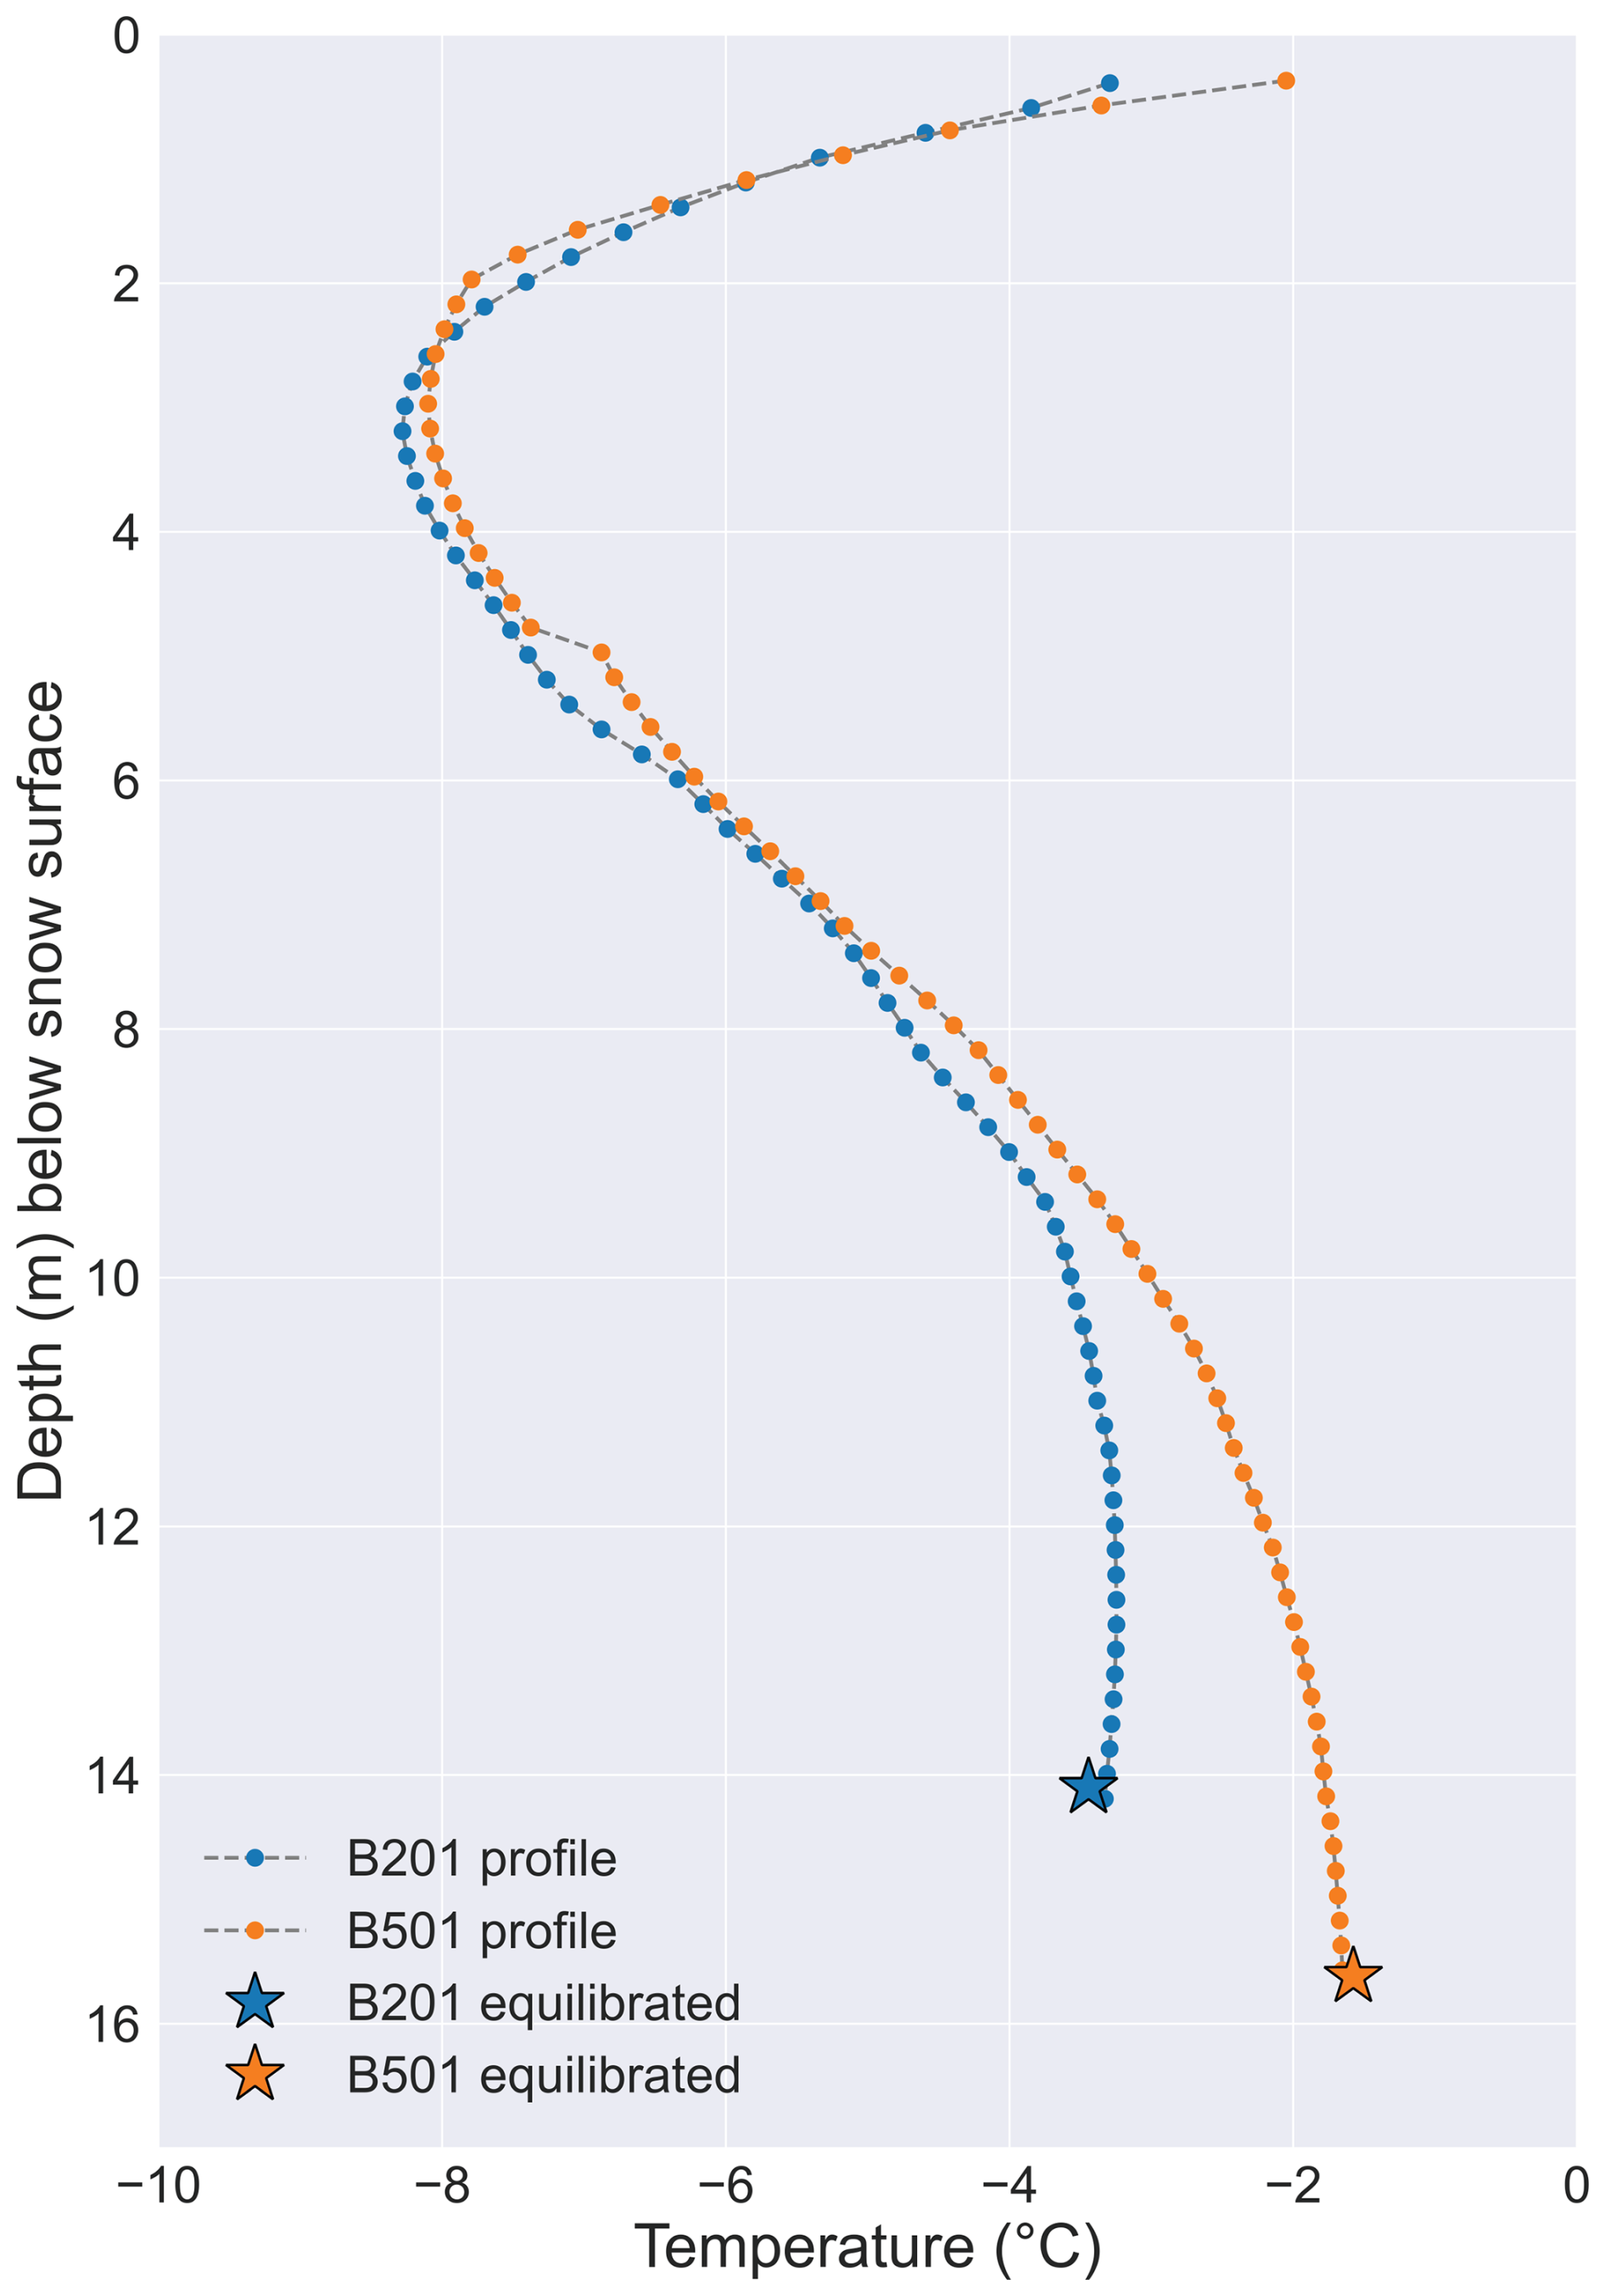
Figure 4Borehole temperatures measured at Eclipse in 2023. Full 2023 profiles (circles) were acquired with 30 s sensor equilibration at each depth. Near the bottom of each borehole, one measurement (star marker) was acquired after allowing the sensor to equilibrate for 1.5 h.
3.4 Ground-penetrating radar
Clear, continuous englacial horizons are observable throughout the radargrams, which is generally indicative of a non-temperate snowpack (Fig. 5). For example, our VHF (900 MHz) radargram shows a continuous reflector between 3 and 4 m depth (Fig. 5b), which we interpret to be the LSS. The LSS is determined to be at 3.66 m at site B2 and 3.60 m at site B5, differing from the average LSS depth observed in our firn cores because of assumptions about the radio-wave velocity used to interpret the GPR data. Similarly, our HF (5 MHz) radargram shows a continuous reflector at ∼ 150 m depth, which we interpret to be the ash layer associated with the Katmai eruption of 1912 (Yalcin et al., 2007; Fig. 5c). Our HF radargram also shows the total ice thickness, which ranges from ∼400 m to greater than 700 m (Fig. 5c). The deepest ice is found near the center of the profile, with the bedrock sloping up toward either end. Bedrock is located 484 m below the surface at site B2 and 566 m below the surface at site B5. There is no evidence for a firn aquifer in any of our GPR data.
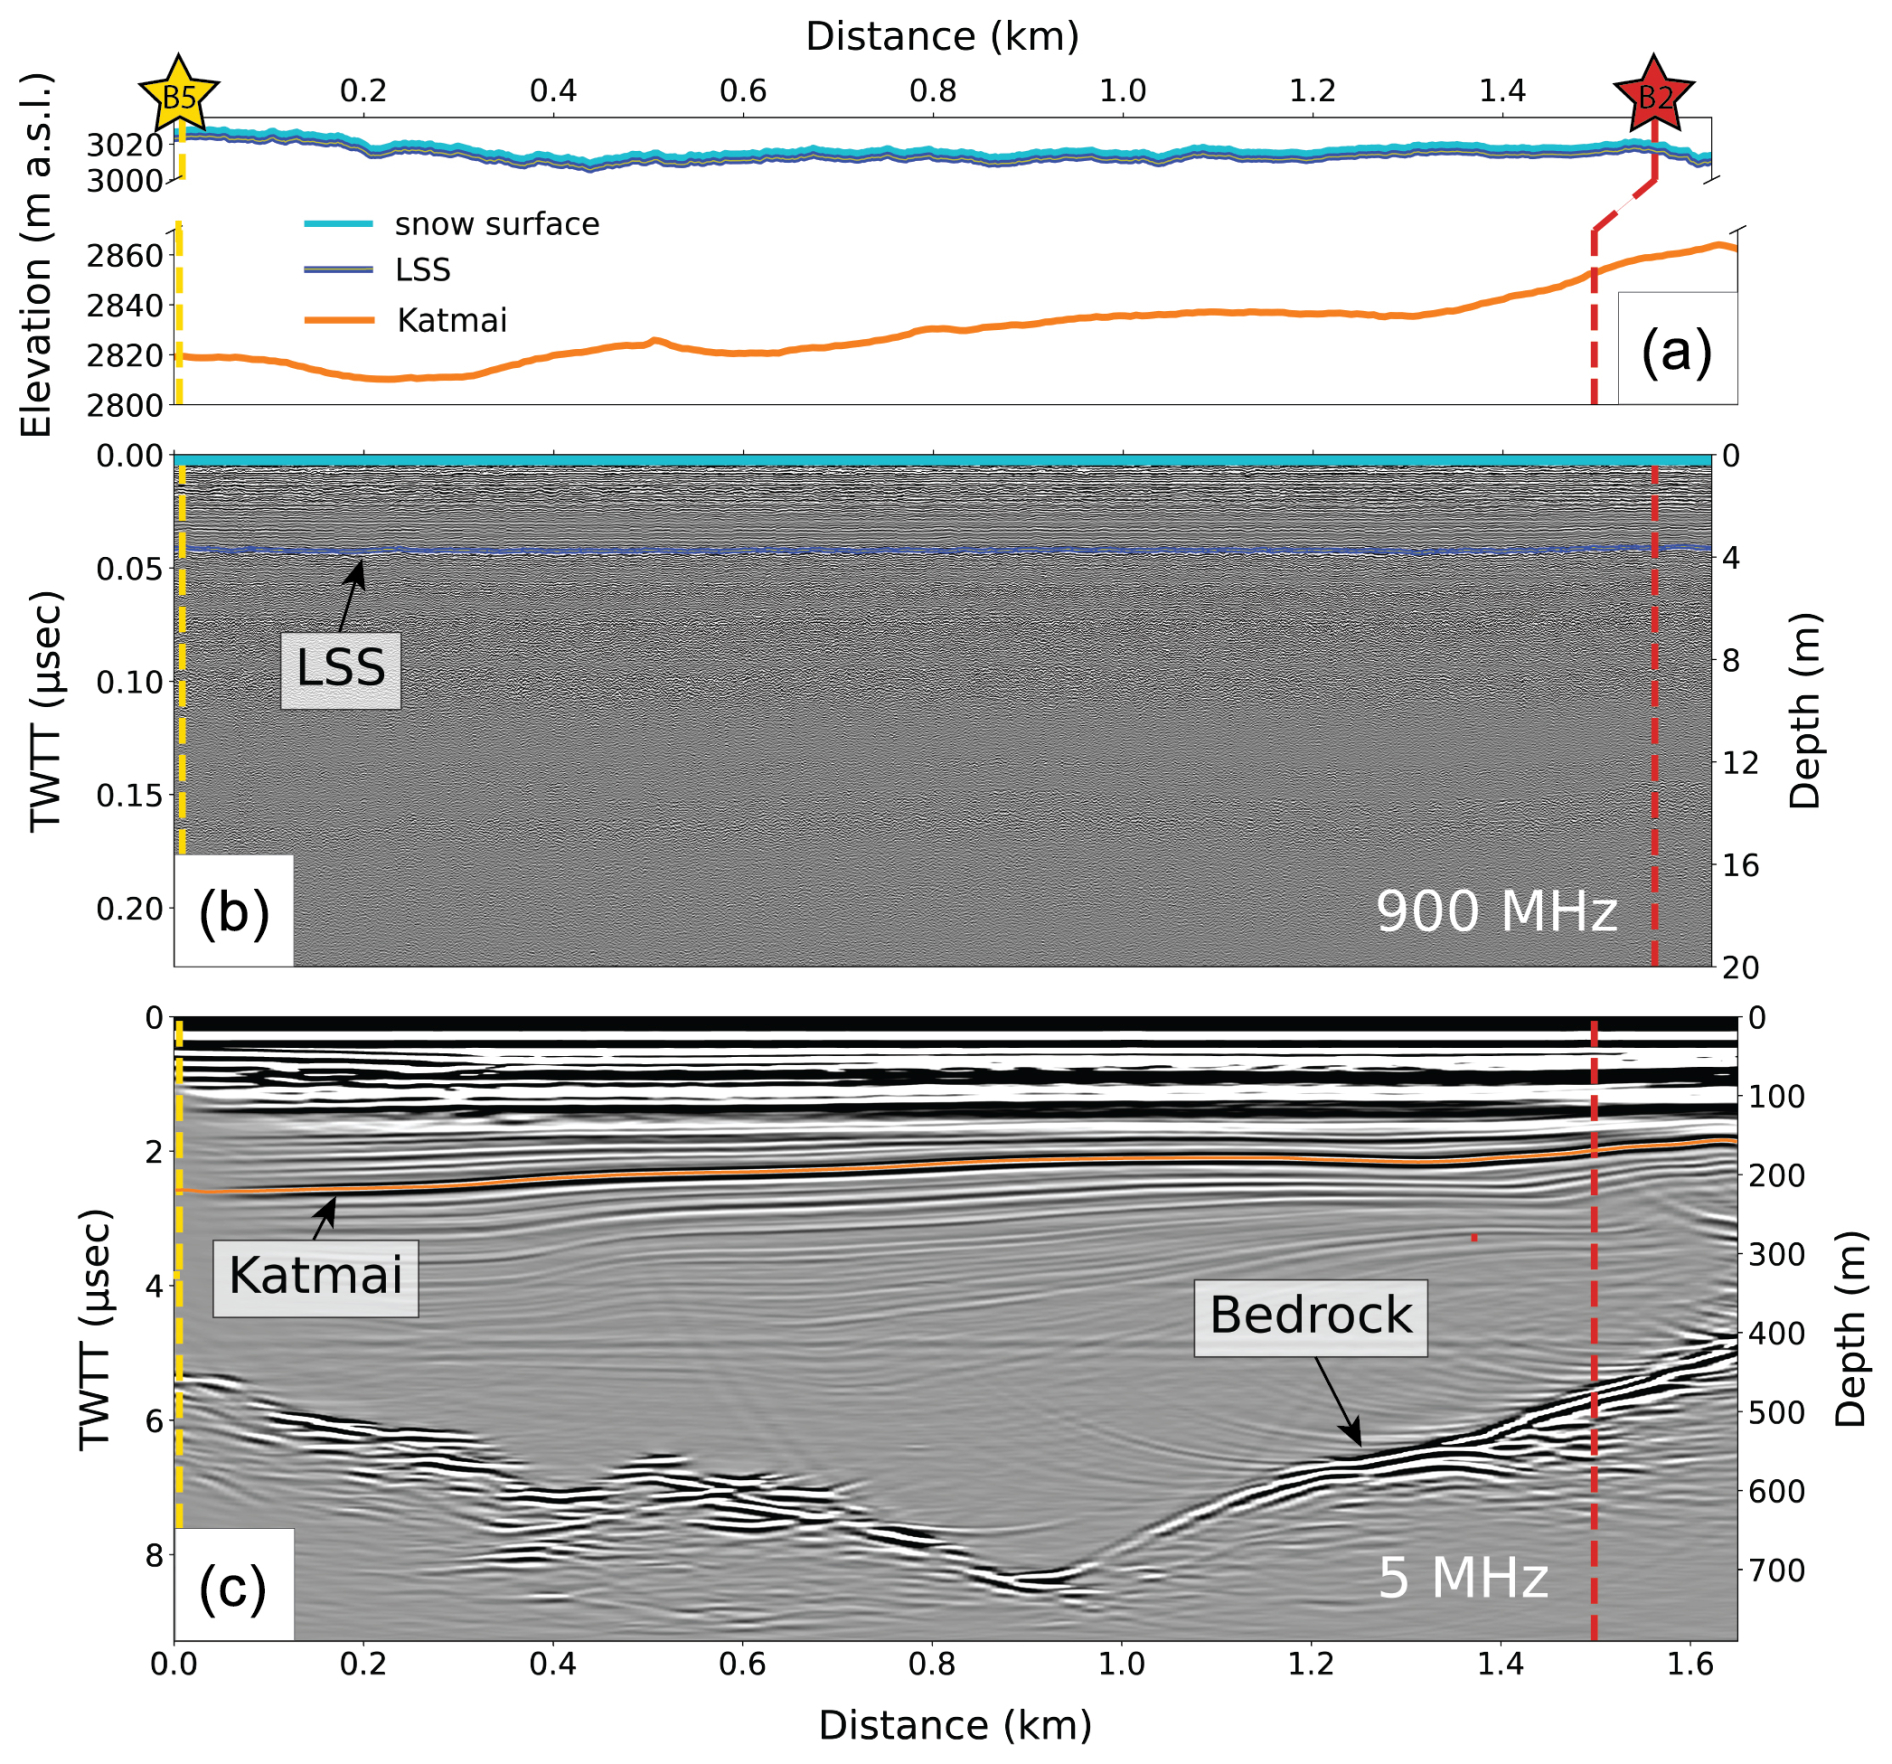
Figure 5Ground-penetrating radar data showing the last summer surface (LSS), Katmai volcanic ash layer, and bedrock across a transect between core sites B5 and B2. Panel (a) shows surface, LSS, and Katmai layer elevations; panels (b) and (c) are radargrams from the 900 MHz and 5 MHz systems, respectively. Yellow and red dashed lines indicate the surface location of core sites B5 and B2, respectively. The x axes of panels (a)–(c) are all on the same distance scale; however, the core site locations vary slightly between the shallow (900 MHz) and deep (5 MHz) profiles because the transects skied with the two systems were not exactly aligned. Two-way travel time (TWTT, left-hand axis) is used to calculate depth (right-hand axis).
3.5 Firn modeling
Assuming a continuation of current climate conditions through 2033, our reference model predicts little change in firn temperature below 10 m depth; over 50 replicate runs, our median predicted firn temperature is −1.75 °C at 10 m depth, −1.50 °C at 15 m depth, and −1.34 °C at 20 m depth in 2033. However, our range of predicted firn temperatures is 5.31 °C at 10 m depth, 4.06 °C at 15 m depth, and 3.53 °C at 20 m depth, with the reference model producing temperate firn for at least some of the 50 replicate runs at each depth (Fig. 6). Eclipse therefore appears to be near a threshold for supporting temperate firn below the penetration depth (∼ 10 m) of the annual temperature wave.
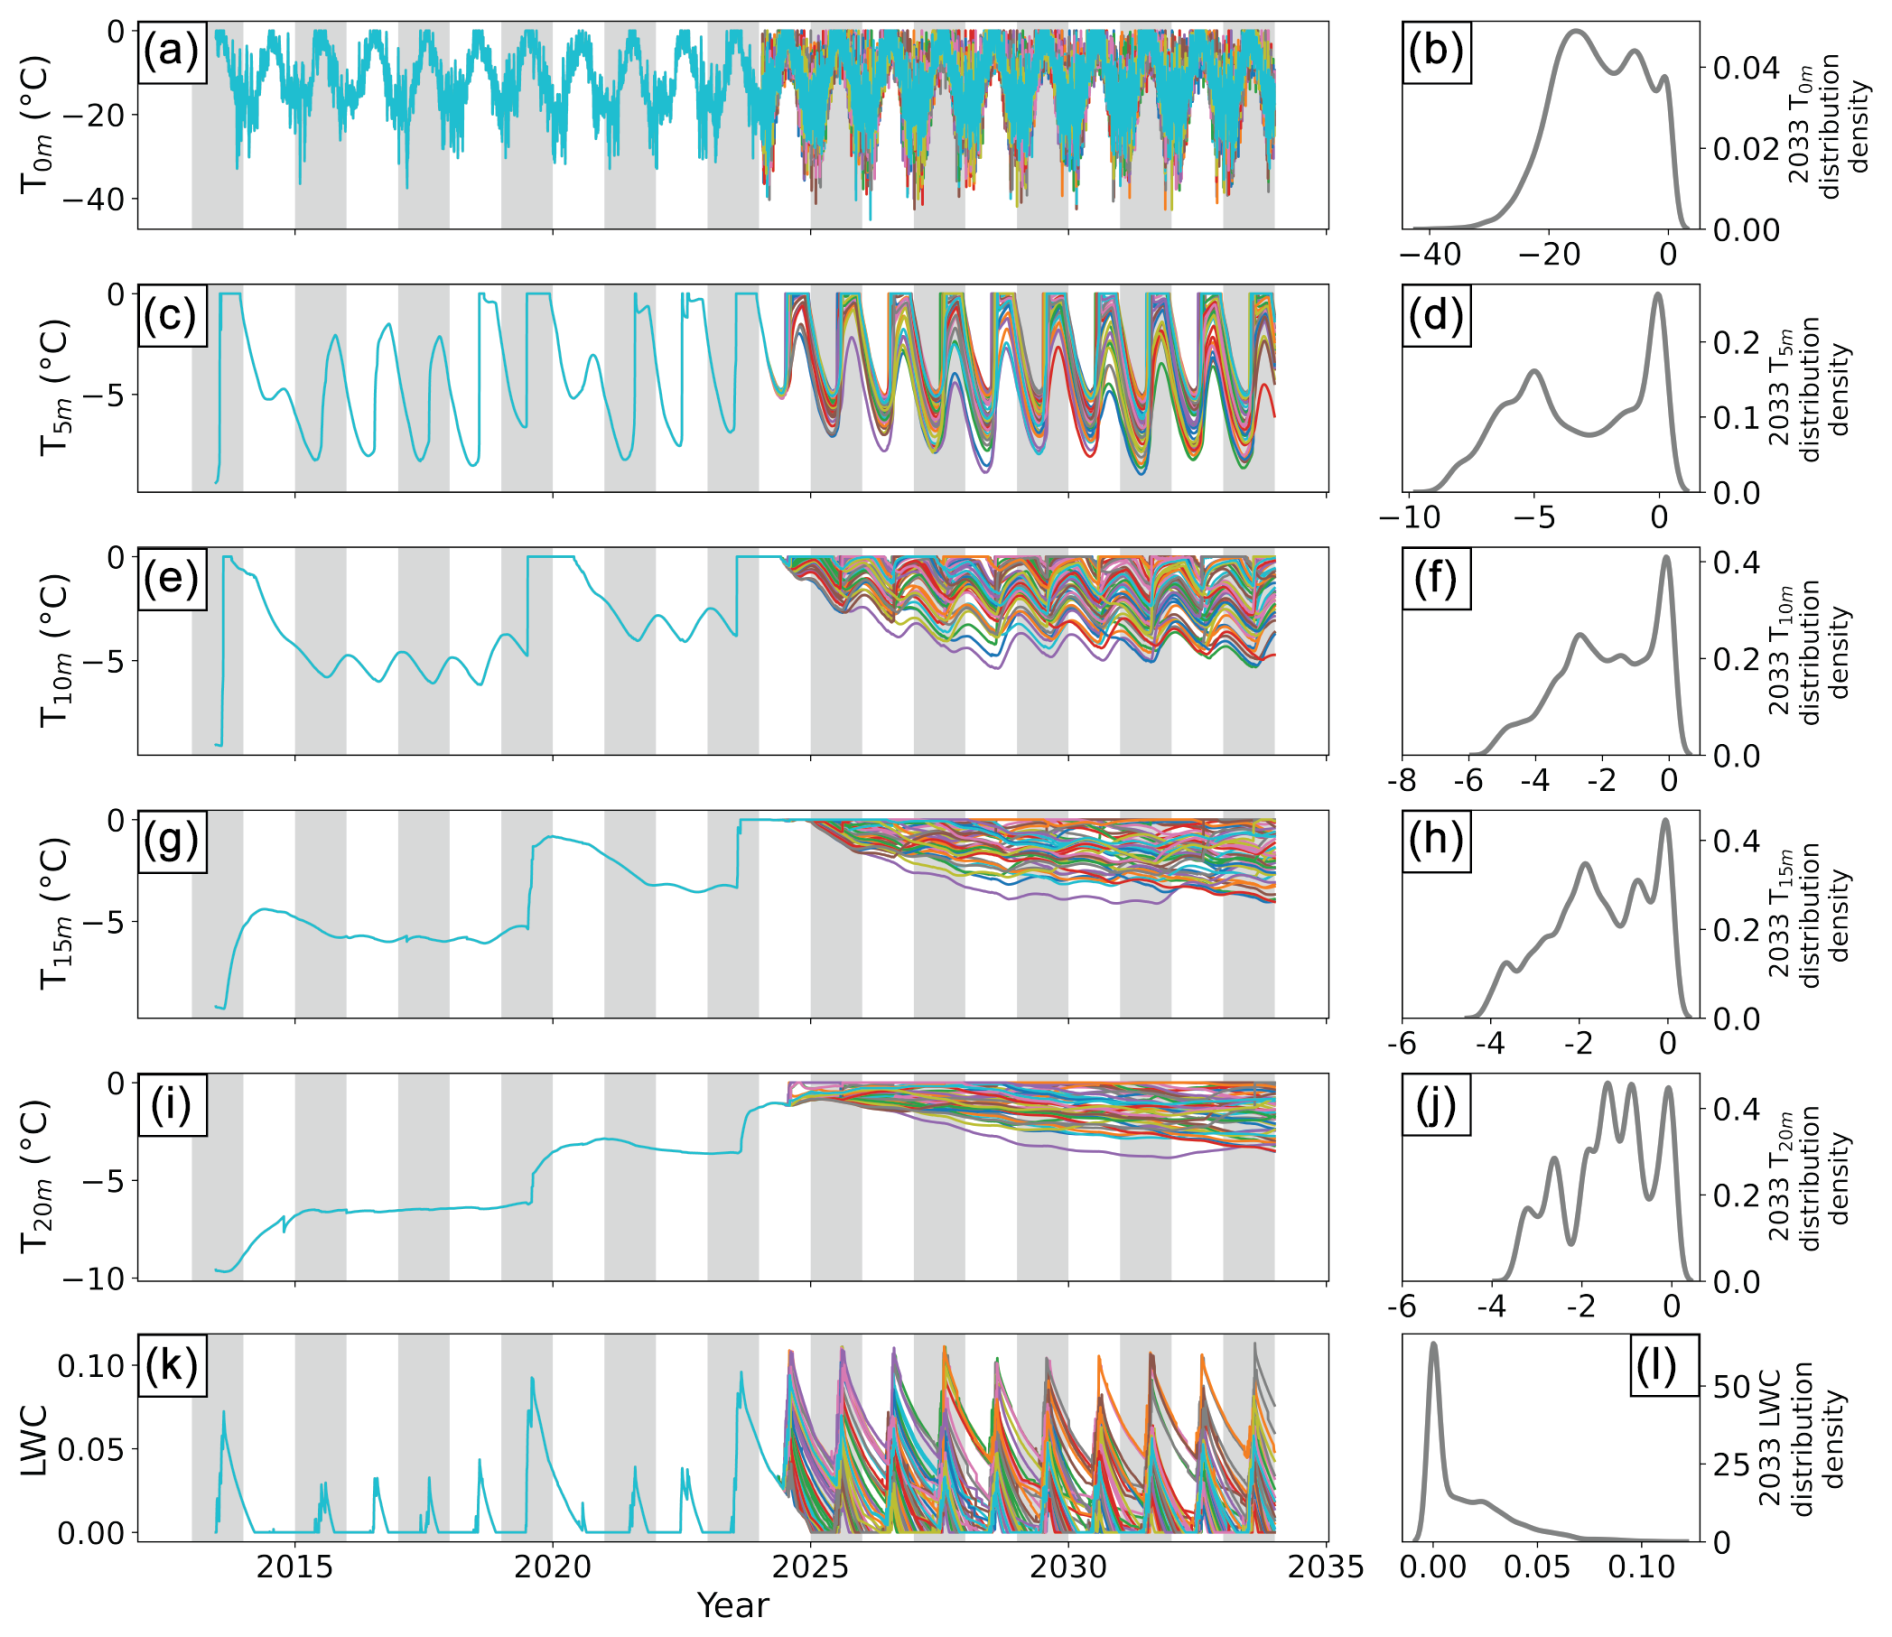
Figure 6Firn temperature (a–j) and liquid water content (LWC; k–l) time series and distribution plots for replicate runs of our reference model at Eclipse Icefield. Temperatures are shown at 0 m (a–b), 5 m (c–d), 10 m (e–f), 15 m (g–h), and 20 m (i–j) depth. LWC is calculated for the entire firn column. A degree day factor (DDF) of 6.2 and a surface density of 450 kg m−3 were used for all 50 model runs. All model runs were forced using downscaled NARR air temperatures during the spin-up period (pre-2013), elevation-corrected Divide AWS data from 2013–2024, and temperatures randomly drawn from a Gaussian distribution described by the mean and standard deviation of elevation-corrected 2013–2024 Divide AWS temperatures from 2024–2033. Forcing temperatures from 2024–2033 assume a continuation of current climate conditions. Gray bars show odd-numbered years (e.g., 2015, 2017). Values on the x axis of the right-hand panels (distributions) correspond to those on the y axis of the left-hand panels (time series). Distributions include all output values over the course of 2033 (1 January through 31 December).
Additionally, firn conditions (even below 10 m depth) at Eclipse are sensitive to changes in air temperature and exhibit threshold behavior with projected warming (Fig. 7). Over 50 replicate model runs with 0.1 °C cooling by 2033, firn at 15 m depth has a 4 % chance of being temperate year-round in 2033 compared to a 6 % chance over 50 replicate runs under a continuation of current climate or with 0.1 °C warming. The probability of firn at 15 m depth becoming temperate year-round increases to 26 % with 0.2 °C warming, 72 % with 0.5 °C warming, and 98 % with 1 °C warming by 2033. The evolution of density, liquid water content, and temperature over the full firn column is shown under each modeled climate scenario in Fig. B6 for a model run randomly selected from the 50 replicates.
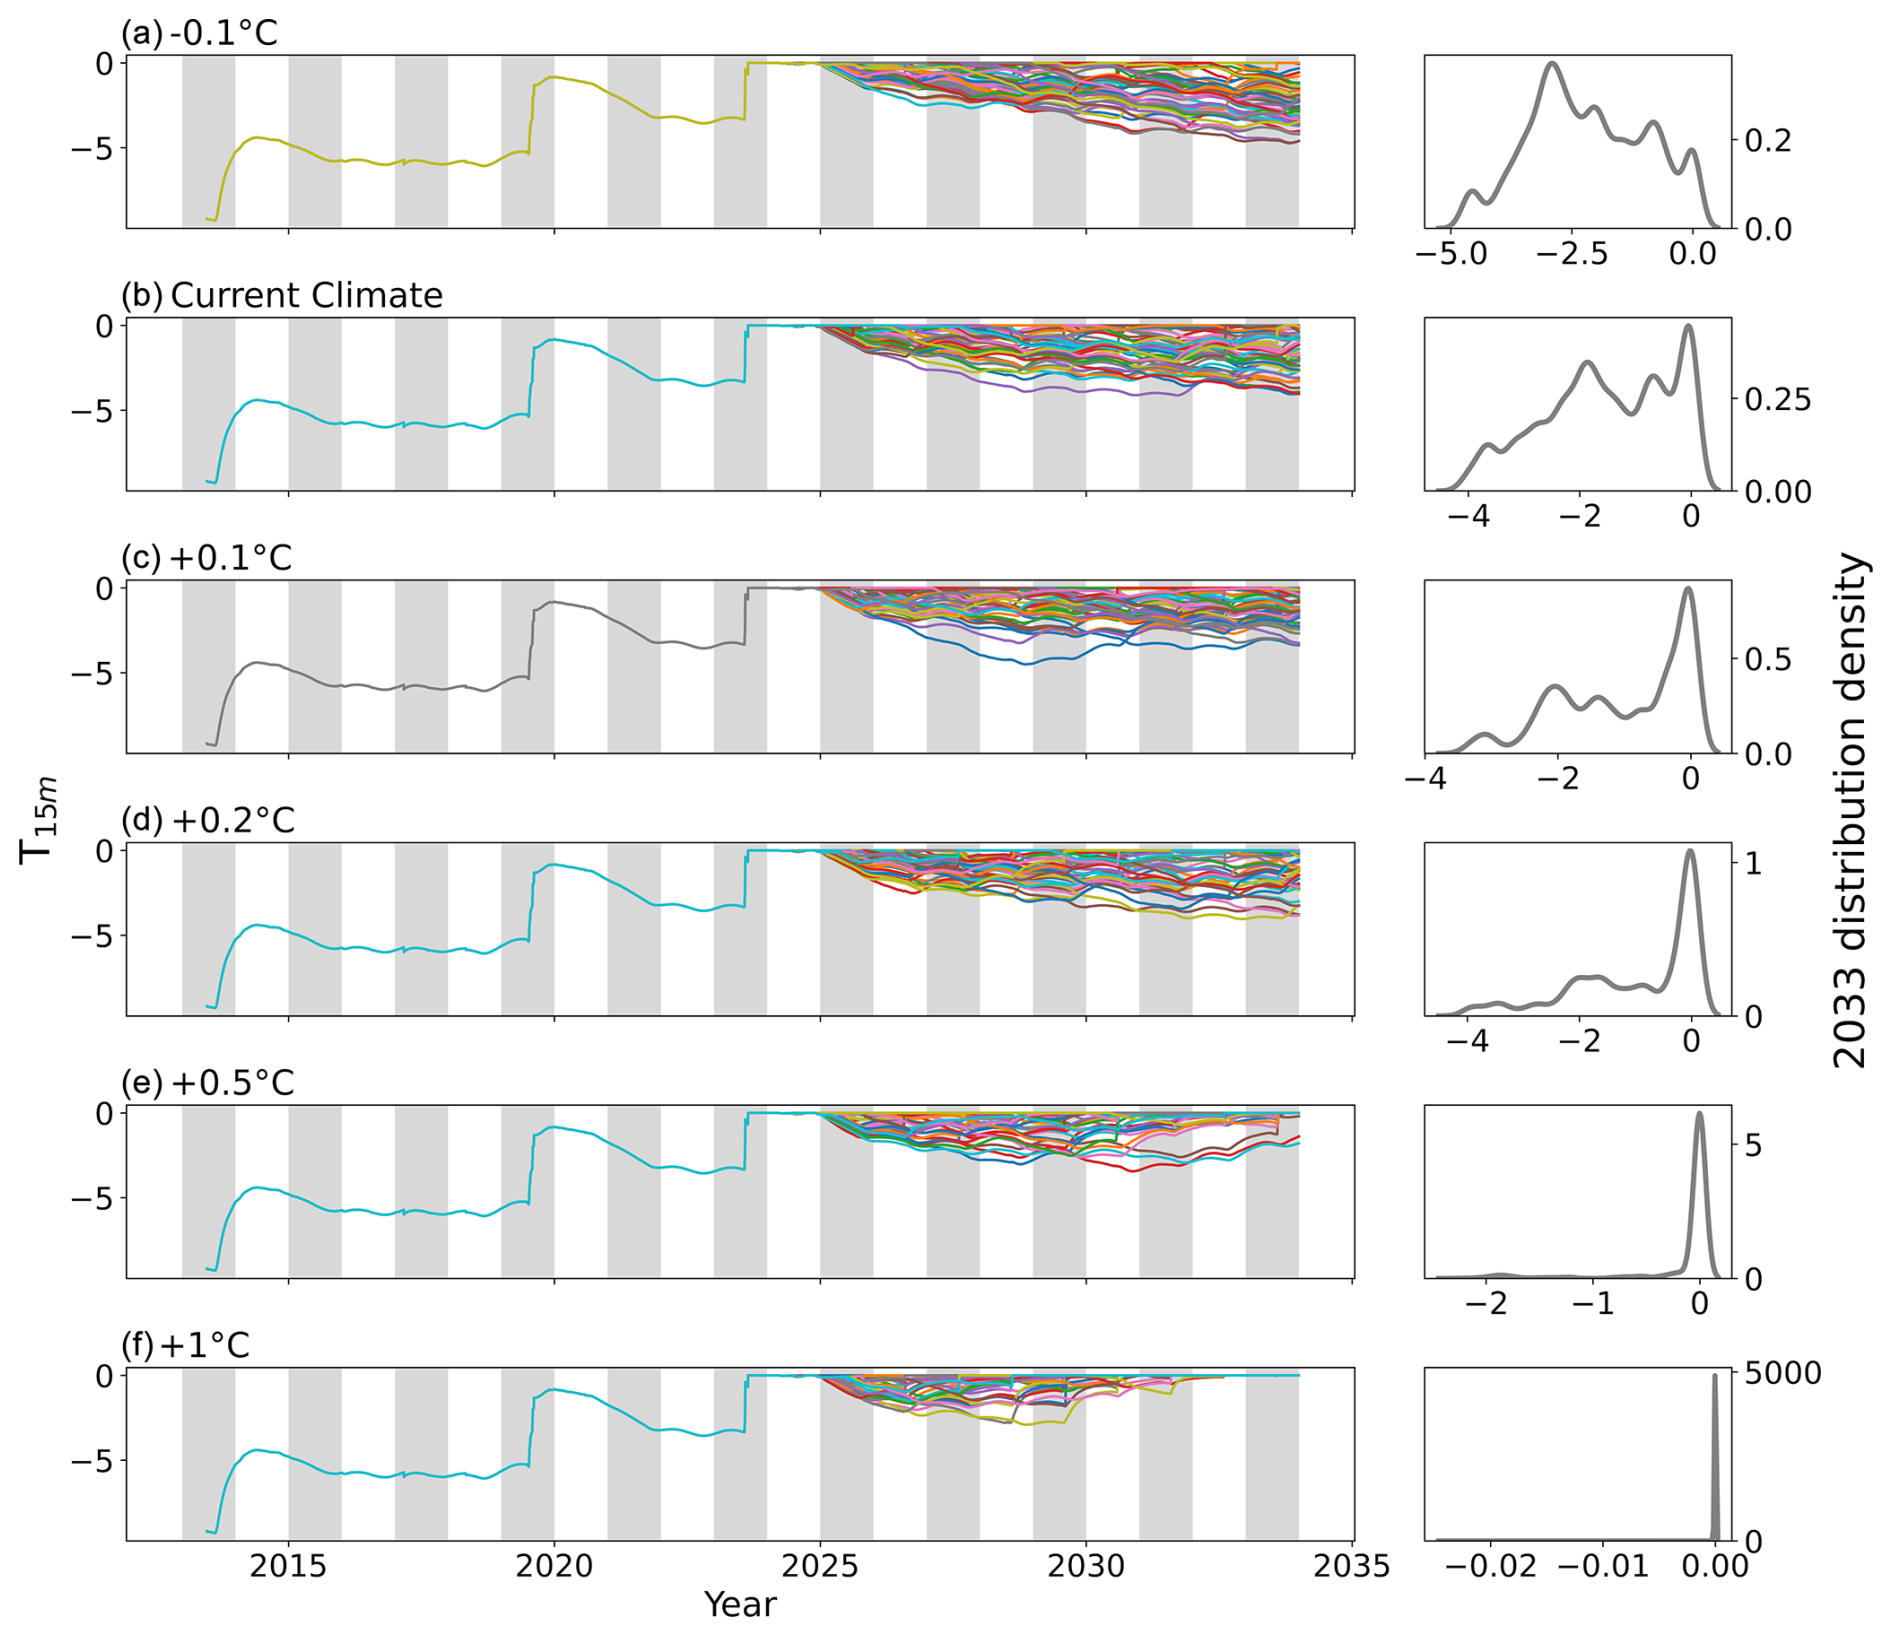
Figure 72013–2033 time series and 2033 distribution plots of firn temperature at 15 m depth. All model runs shown use a degree day factor of 6.2 and a surface density of 450 kg m−3. All model runs were forced using downscaled NARR air temperatures during the spin-up period (pre-2013), elevation-corrected Divide AWS data from 2013–2024, and temperatures randomly drawn from a Gaussian distribution described by the mean and standard deviation of elevation-corrected 2013–2024 Divide AWS temperatures from 2024–2033. Distributions include all output values over the course of 2033 (1 January through 31 December).
Conditions associated with the development of year-round temperate firn at 15 m depth include higher total melt season positive degree days (PDDs), more individual melt events, higher average melt event magnitude, and higher mean winter temperature (Fig. 8). We find a significant (p<0.05) difference (independent sample t test) for mean winter temperatures during all years after 2025 between model runs that do produce year-round temperate firn by 2033 and those that do not (Table 3).
Additionally, for model runs that do not produce temperate firn, the median of the total melt season PDDs (over all model runs for any given year) never exceeds 35 (Fig. 8). In contrast, the median total melt season PDDs over all model runs that do produce temperate firn by 2033 range from 31.58 in 2025 to 52.88 in 2033. Finally, we find a significant (p<0.05) difference (Wilcoxon rank sum test) for the total melt season PDDs, the number of individual melt events, and the median melt event magnitude (mm) between model runs that produce temperate firn at 15 m depth and those that do not during most years from 2024–2033 (Table 4). We do not find any significant (p≥0.05) difference in median melt season start, end, or length (Table 5).
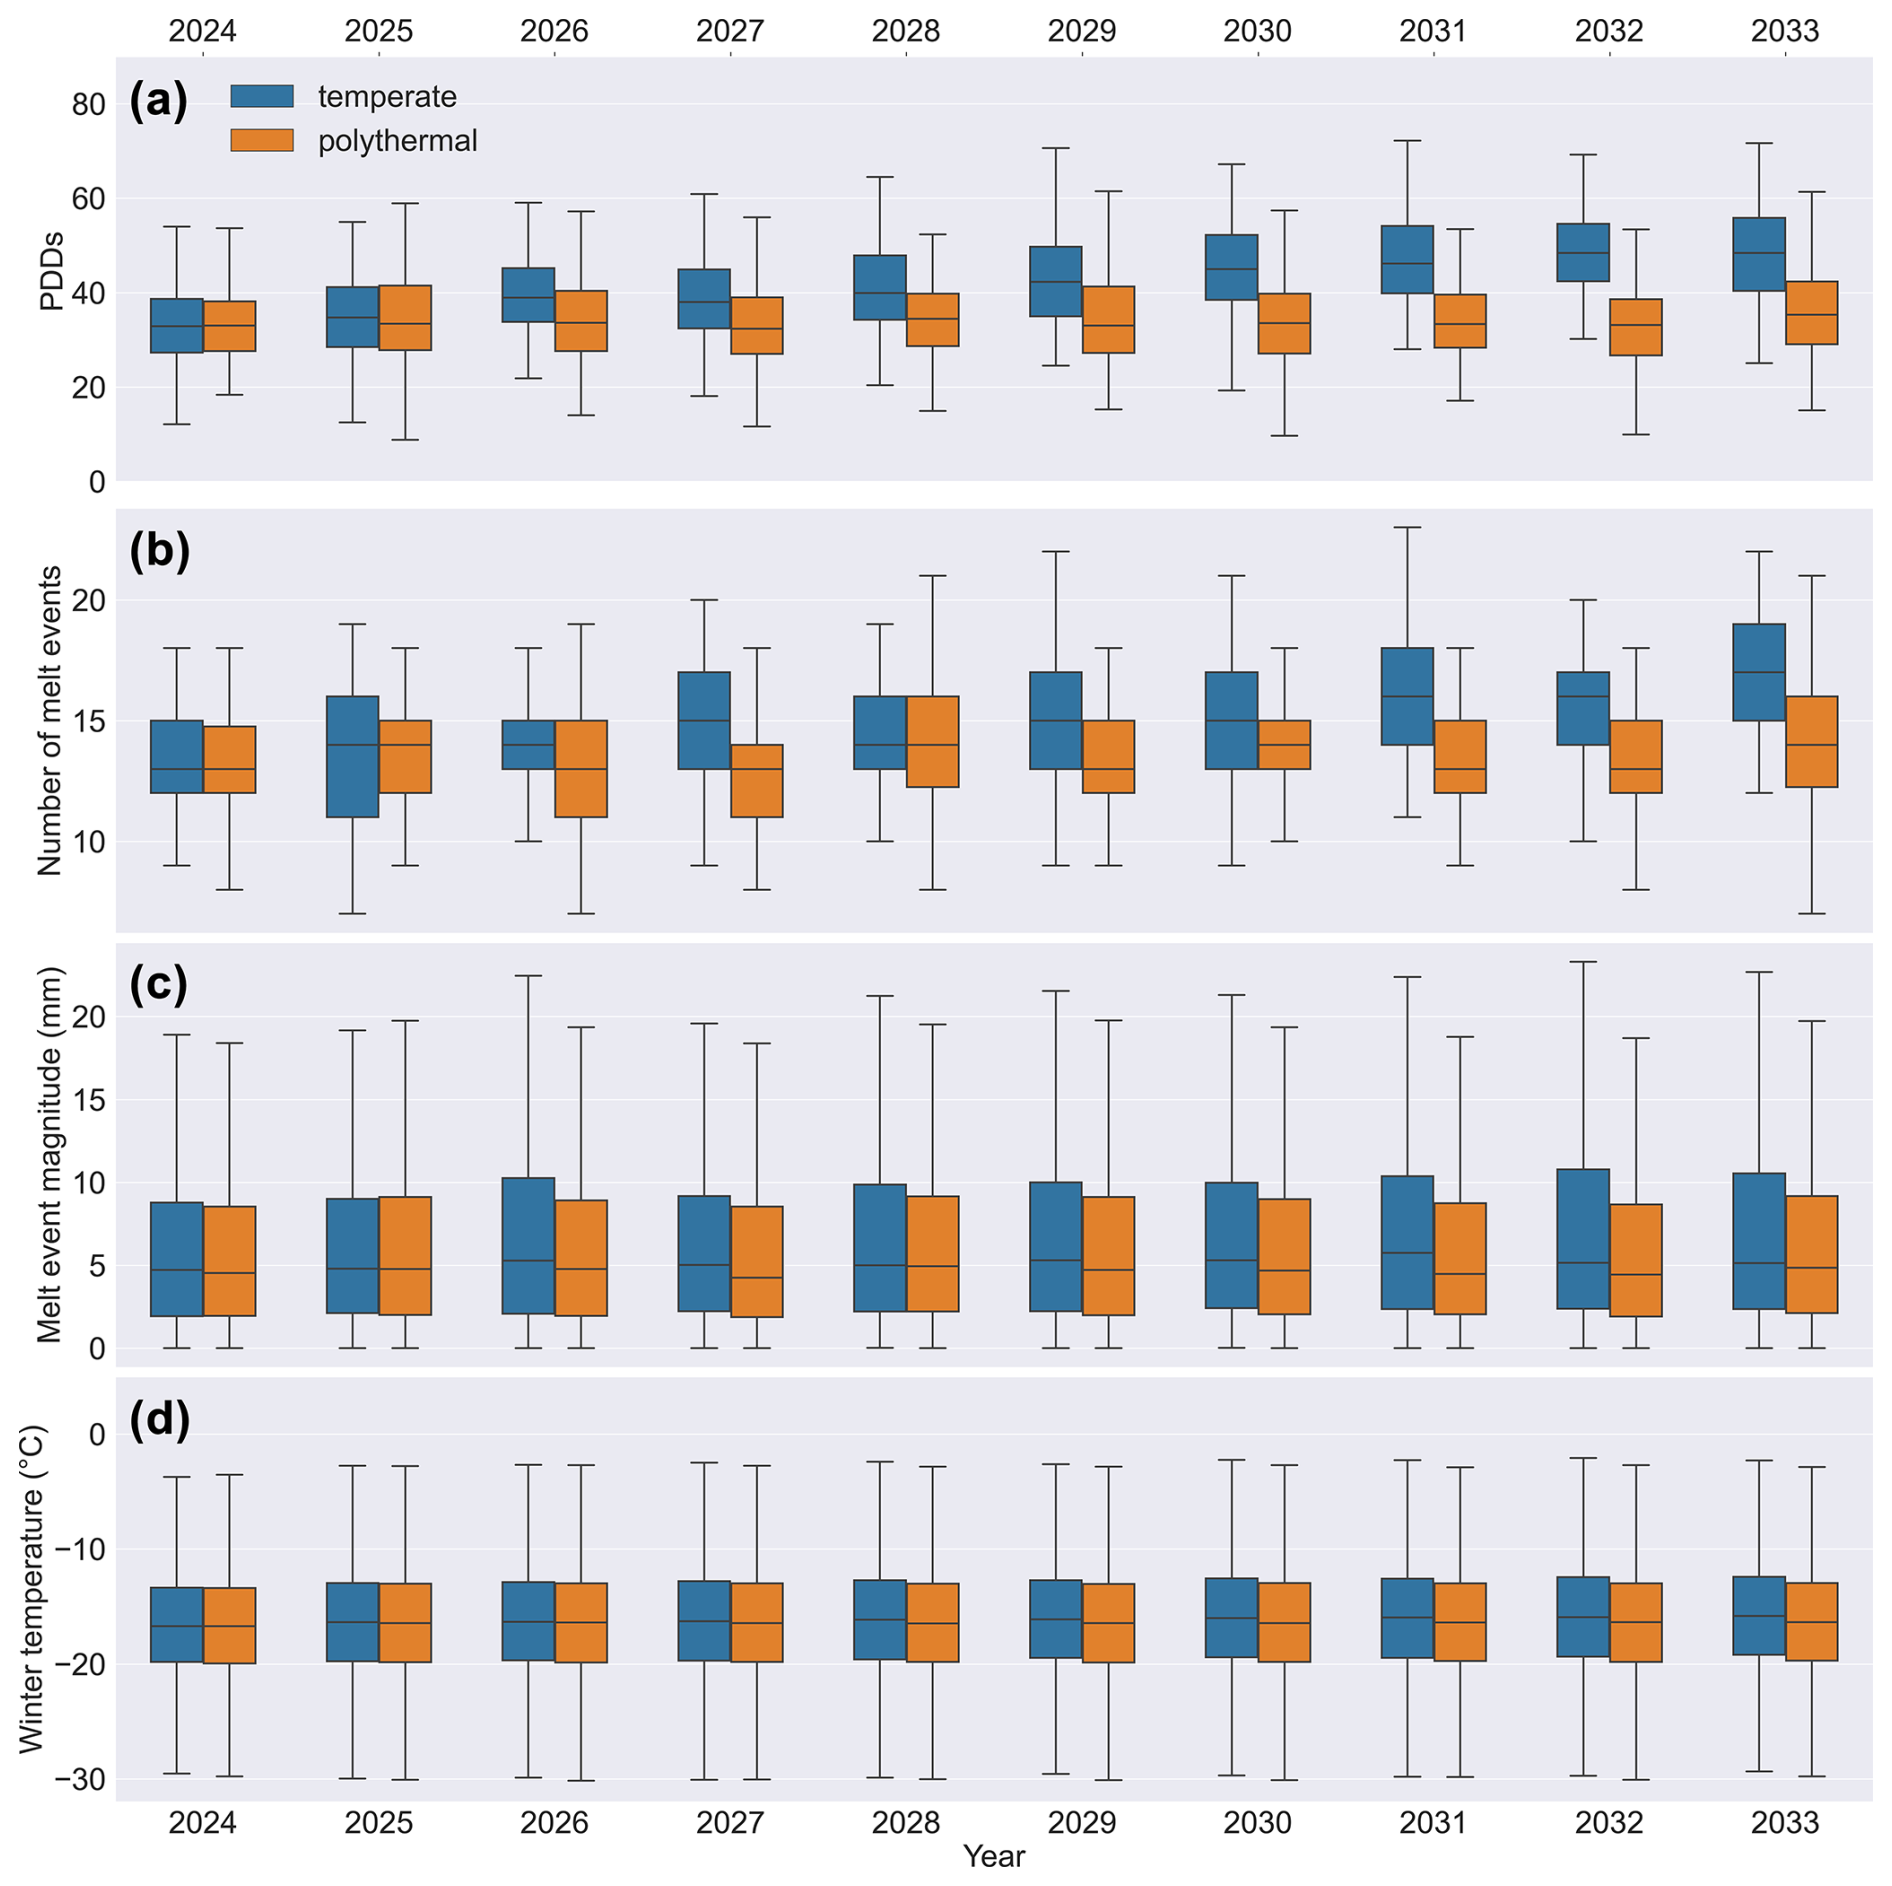
Figure 8Melt season positive degree days (PDDs, a), number of melt events (b), melt event magnitude (c), and wintertime temperatures (d) each year for model runs that produce year-round temperate firn at 15 m depth by 2033 (blue) and those that do not (orange). We define the melt season here as May–September and wintertime as October–March. Outliers are excluded for clarity.
Table 4Difference in median number and magnitude of melt events (W, Wilcoxon rank sum tests) between model runs that produce year-round temperate firn by 2033 and those that do not. Significant results (at the 95 % confidence level) are in bold.
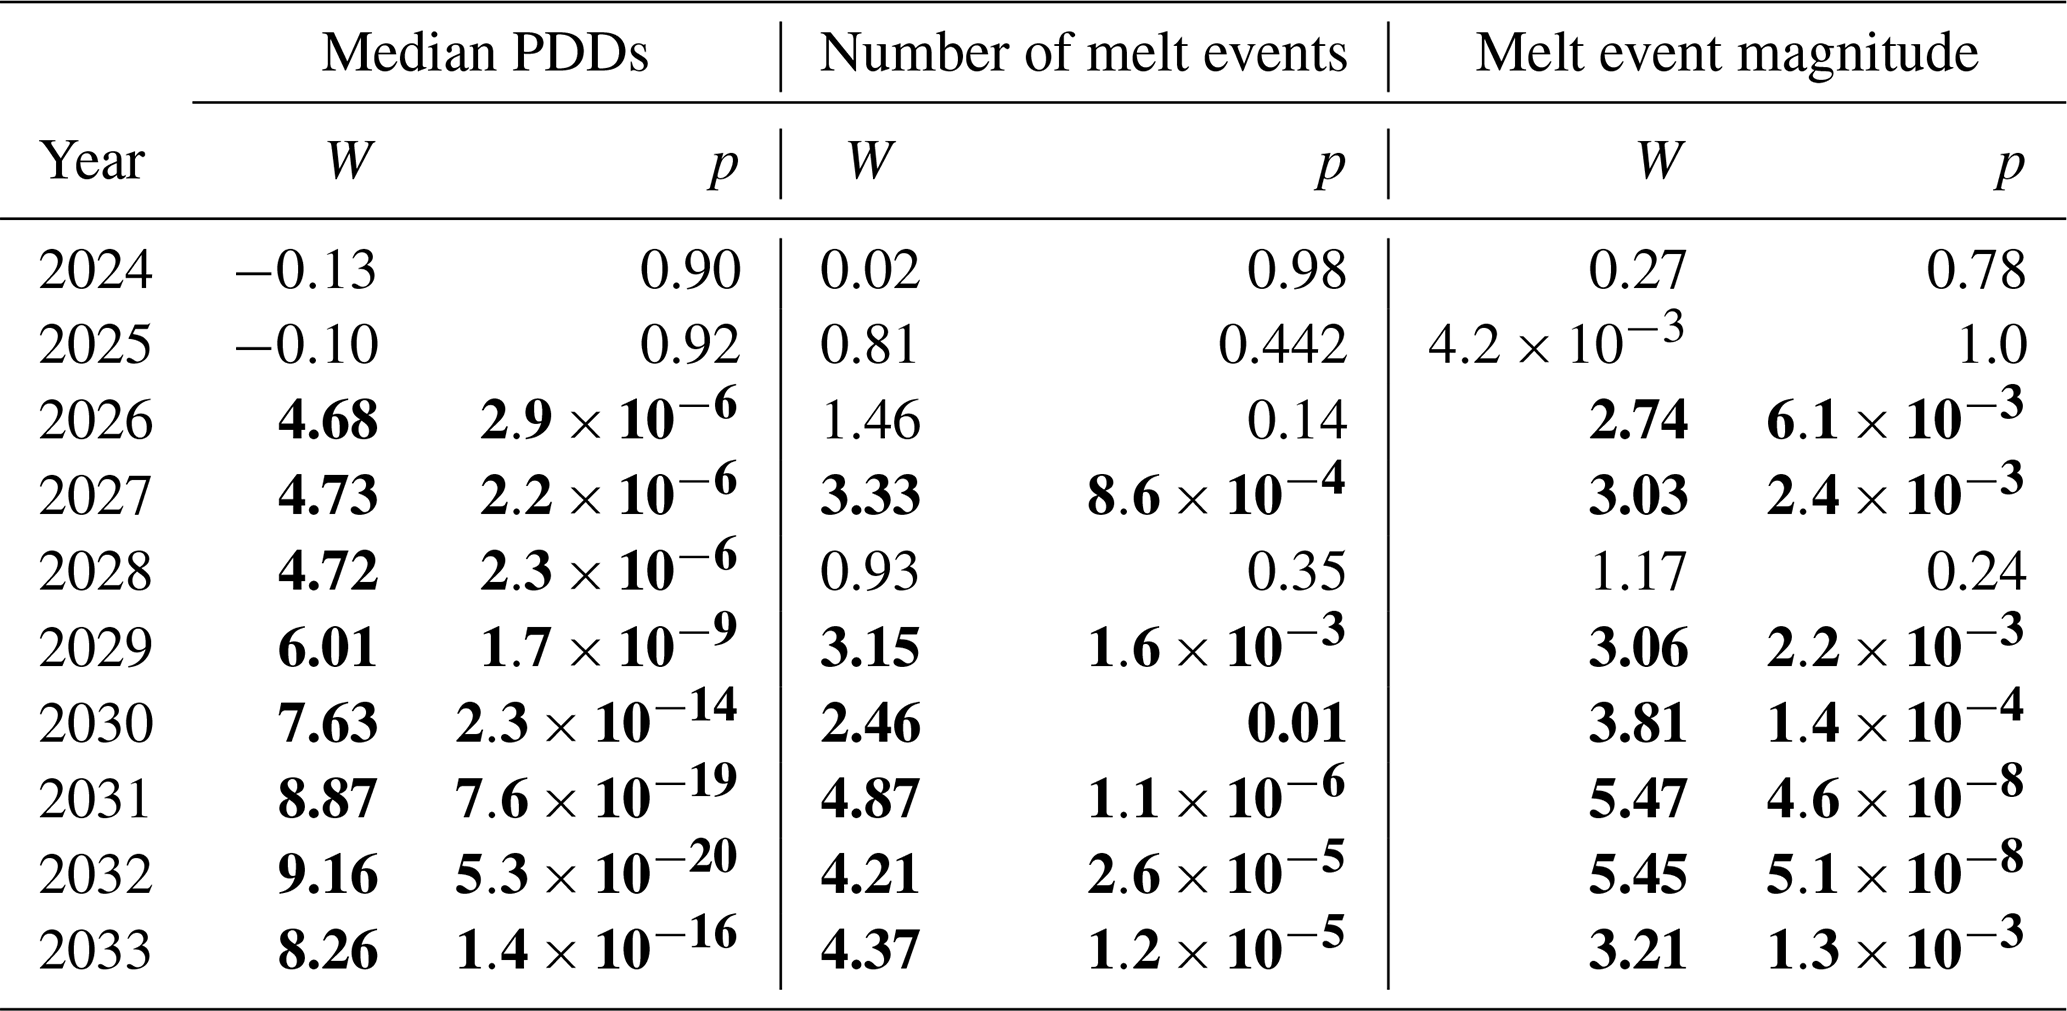
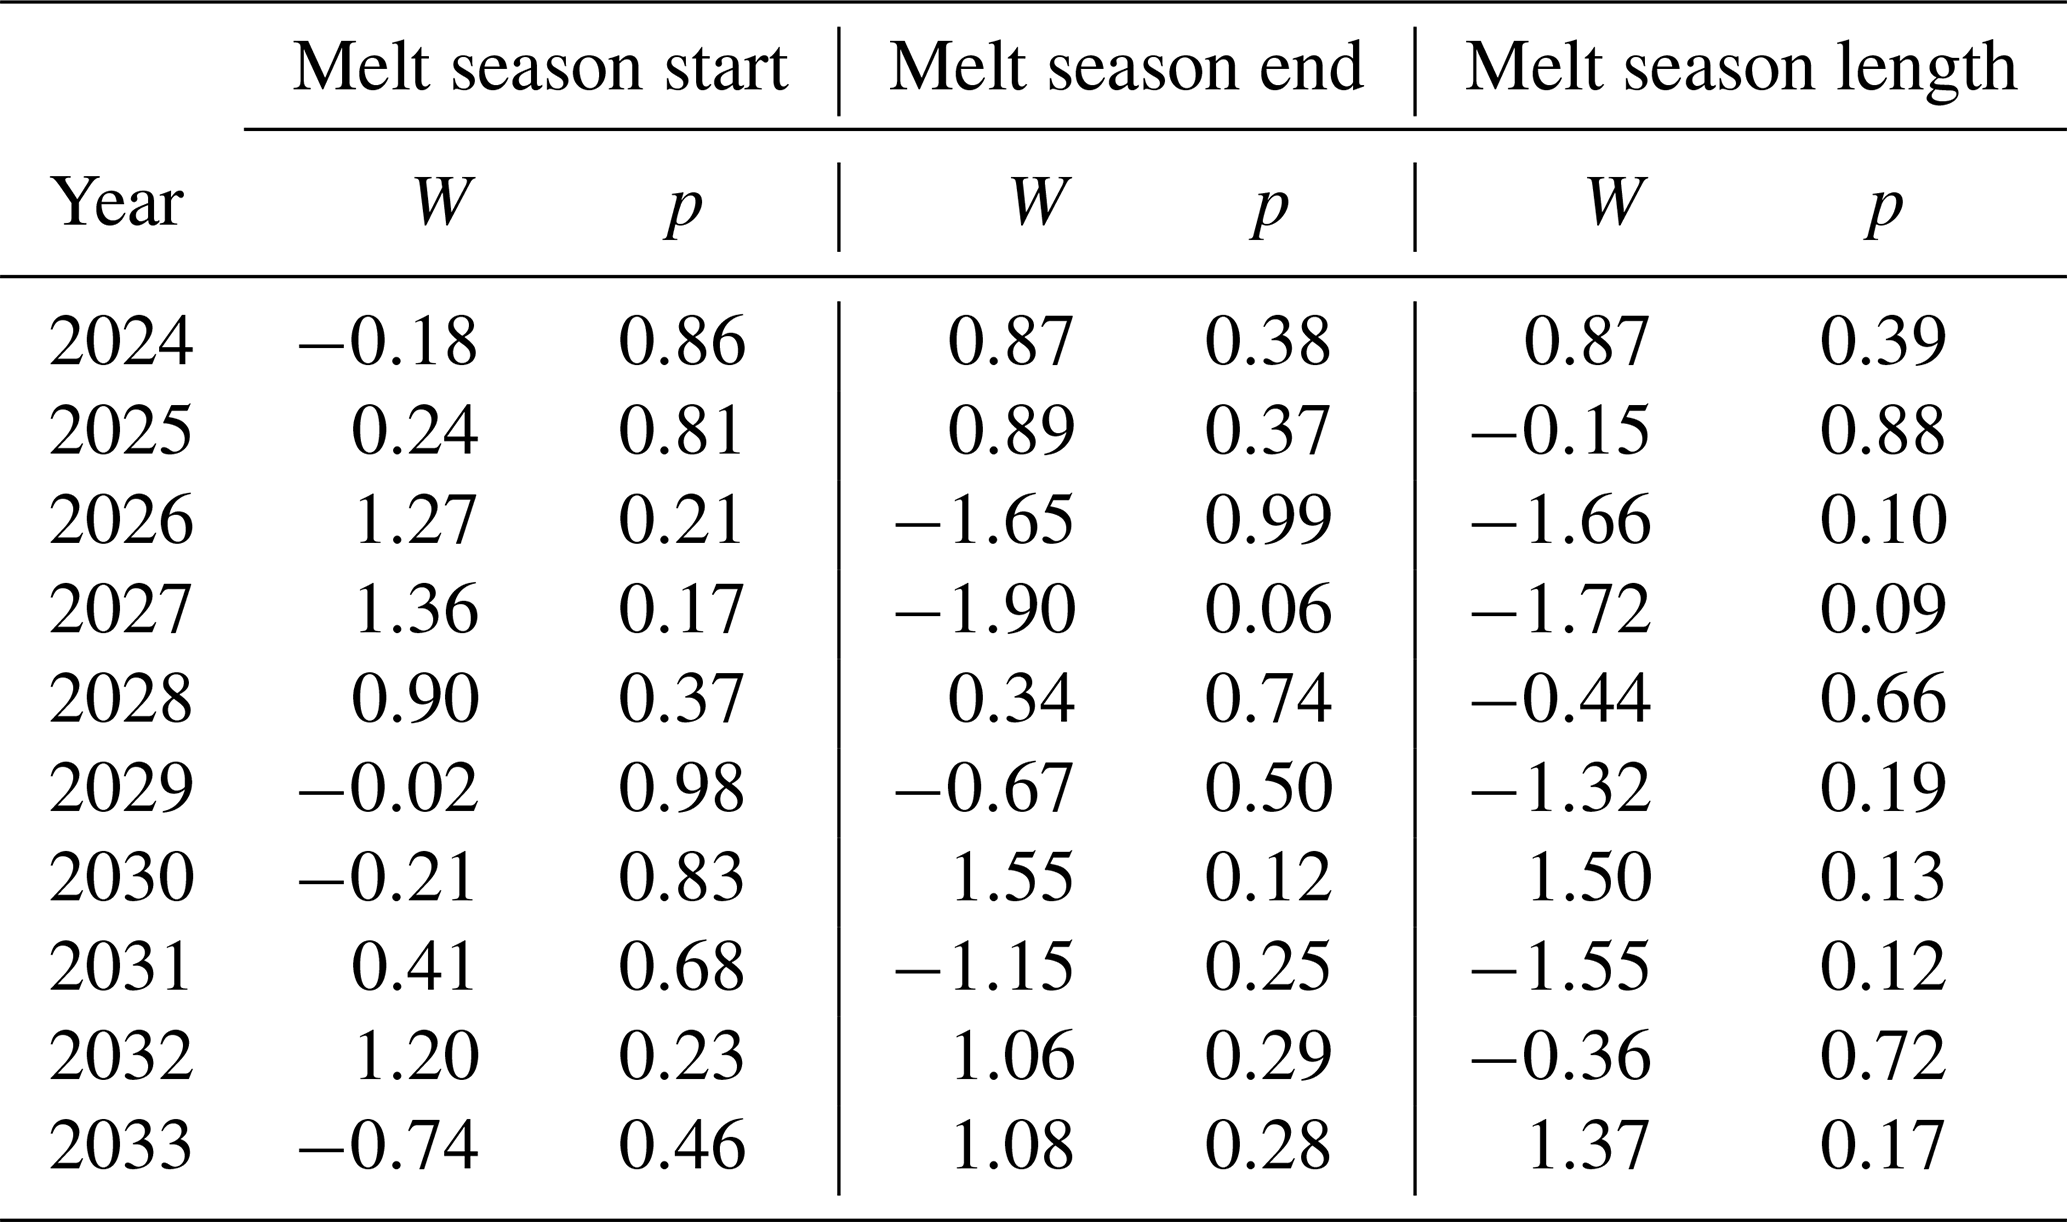
Table 5Difference in median melt season timing and duration (W, Wilcoxon rank sum tests) between model runs that produce year-round temperate firn by 2033 and those that do not. No years showed significant differences between the medians at the 95 % confidence level.
3.6 Comparison among St. Elias study sites
Over 80 % of the St. Elias Range's glacier cover lies below both Eclipse and the Kaskawulsh/Hubbard Divide in elevation (Fig. C1). Although it is only about 400 m higher in elevation than Divide, the firn pack at Eclipse to date remains drier than that at both the Icefield Camp and Kaskawulsh study sites. Comparisons between VHF (400 MHz) and HF (5–10 MHz) GPR data from Eclipse and Icefield Camp in 2016 and 2018, respectively, showed stratigraphic differences indicating a wetter firn pack at Icefield Camp relative to Eclipse, including a bright reflector in the HF data at ∼ 25 m depth suggesting the presence of a liquid water table in the firn at Icefield Camp but not at Eclipse (McConnell, 2019). VHF data from Icefield Camp show greater signal attenuation than those from Eclipse, consistent with a wetter firn pack at Icefield Camp (McConnell, 2019). GPR data from Eclipse in 2023 show the same results: clear stratigraphy with low signal attenuation and a lack of a bright reflector that would indicate a water table.
At the Kaskawulsh site, two firn cores were drilled in 2018 that allow comparison of firn properties between Kaskawulsh and Eclipse. The Kaskawulsh cores showed extensive evidence of meltwater percolation and freezing events, including the saturation of firn with liquid water below 34.5 m depth (Ochwat et al., 2021). The saturated firn, or firn aquifer, likely developed since 2013 based on model results, but its age cannot be confirmed (Ochwat et al., 2021). The seasonal snow layers at both Eclipse in 2023 and on Kaskawulsh in 2018 were dry since drilling at both sites occurred in the very early stages of the melt season. Ice content in Kaskawulsh 2018 Core 1 is similar to that in Eclipse 2023 core B201 and more than Eclipse 2023 cores B501 and B502 (Table 6). However, the density of the upper 10 m of firn (below the LSS) was higher in Eclipse core B501 (688±10 kg m−3) than in the Kaskawulsh 2018 cores (588±8 and 572±7 kg m−3; Ochwat et al., 2021). Much like cores B2 and B5 at Eclipse, Cores 1 and 2 on Kaskawulsh showed some similarities in general regions of melt alteration but distinct individual stratigraphic layers.
Table 6Ice content of Eclipse 2023 cores and Kaskawulsh Core 1. Kaskawulsh data are from Ochwat et al. (2021).
3.7 Firn changes at Eclipse over time
A borehole temperature of °C was recorded at 14 m depth in May 2023 at site B2, approximately the same location (within ∼ 50 m) where borehole temperatures of and °C were recorded at 14 and 20 m depth, respectively, in May 2016 (Fig. 9). The 1.67 °C increase in temperature at 14 m depth over those 7 years supports the notion of a warming regional firn pack suggested by changes in borehole temperatures and stratigraphy at the Kaskawulsh/Hubbard Divide between 1965 and 2018, where an increase in melt and refreeze was indicated by an increase in both the quantity and thickness of ice layers and lenses observed in the firn (Ochwat et al., 2021; Grew and Mellor, 1966). The warming firn pack and increased melt are likely due to atmospheric warming over that period, which has been shown to be amplified at high elevations; downscaled NARR gridded surface air temperatures in St. Elias show a 1979–2016 warming rate of 0.028 °C a−1 between 5500 and 6000 m , approximately 1.6 times larger than the global-average warming rate from 1979–2015 (Williamson et al., 2020).
Additionally, Eclipse density profiles from 2002, 2016, and 2023 show an apparent densification of the top 20 m of firn at Eclipse over the 21-year period (Fig. 9). We interpret this apparent densification with caution because of the unrealistically high measured densities of ice layers in the 2023 core (>917 kg m−3); however, both the location of peaks and transitions from periods of high to low measured density are consistent with our stratigraphic observations, coinciding with ice layers and seasonal changes in firn grain size. Results suggest an increase in melt within the snow and firn, which leads to densification first by rounding snow grains, allowing them to pack more closely, and eventually by filling in pore space and refreezing (Cuffey and Paterson, 2010; Sommerfeld et al., 1970).
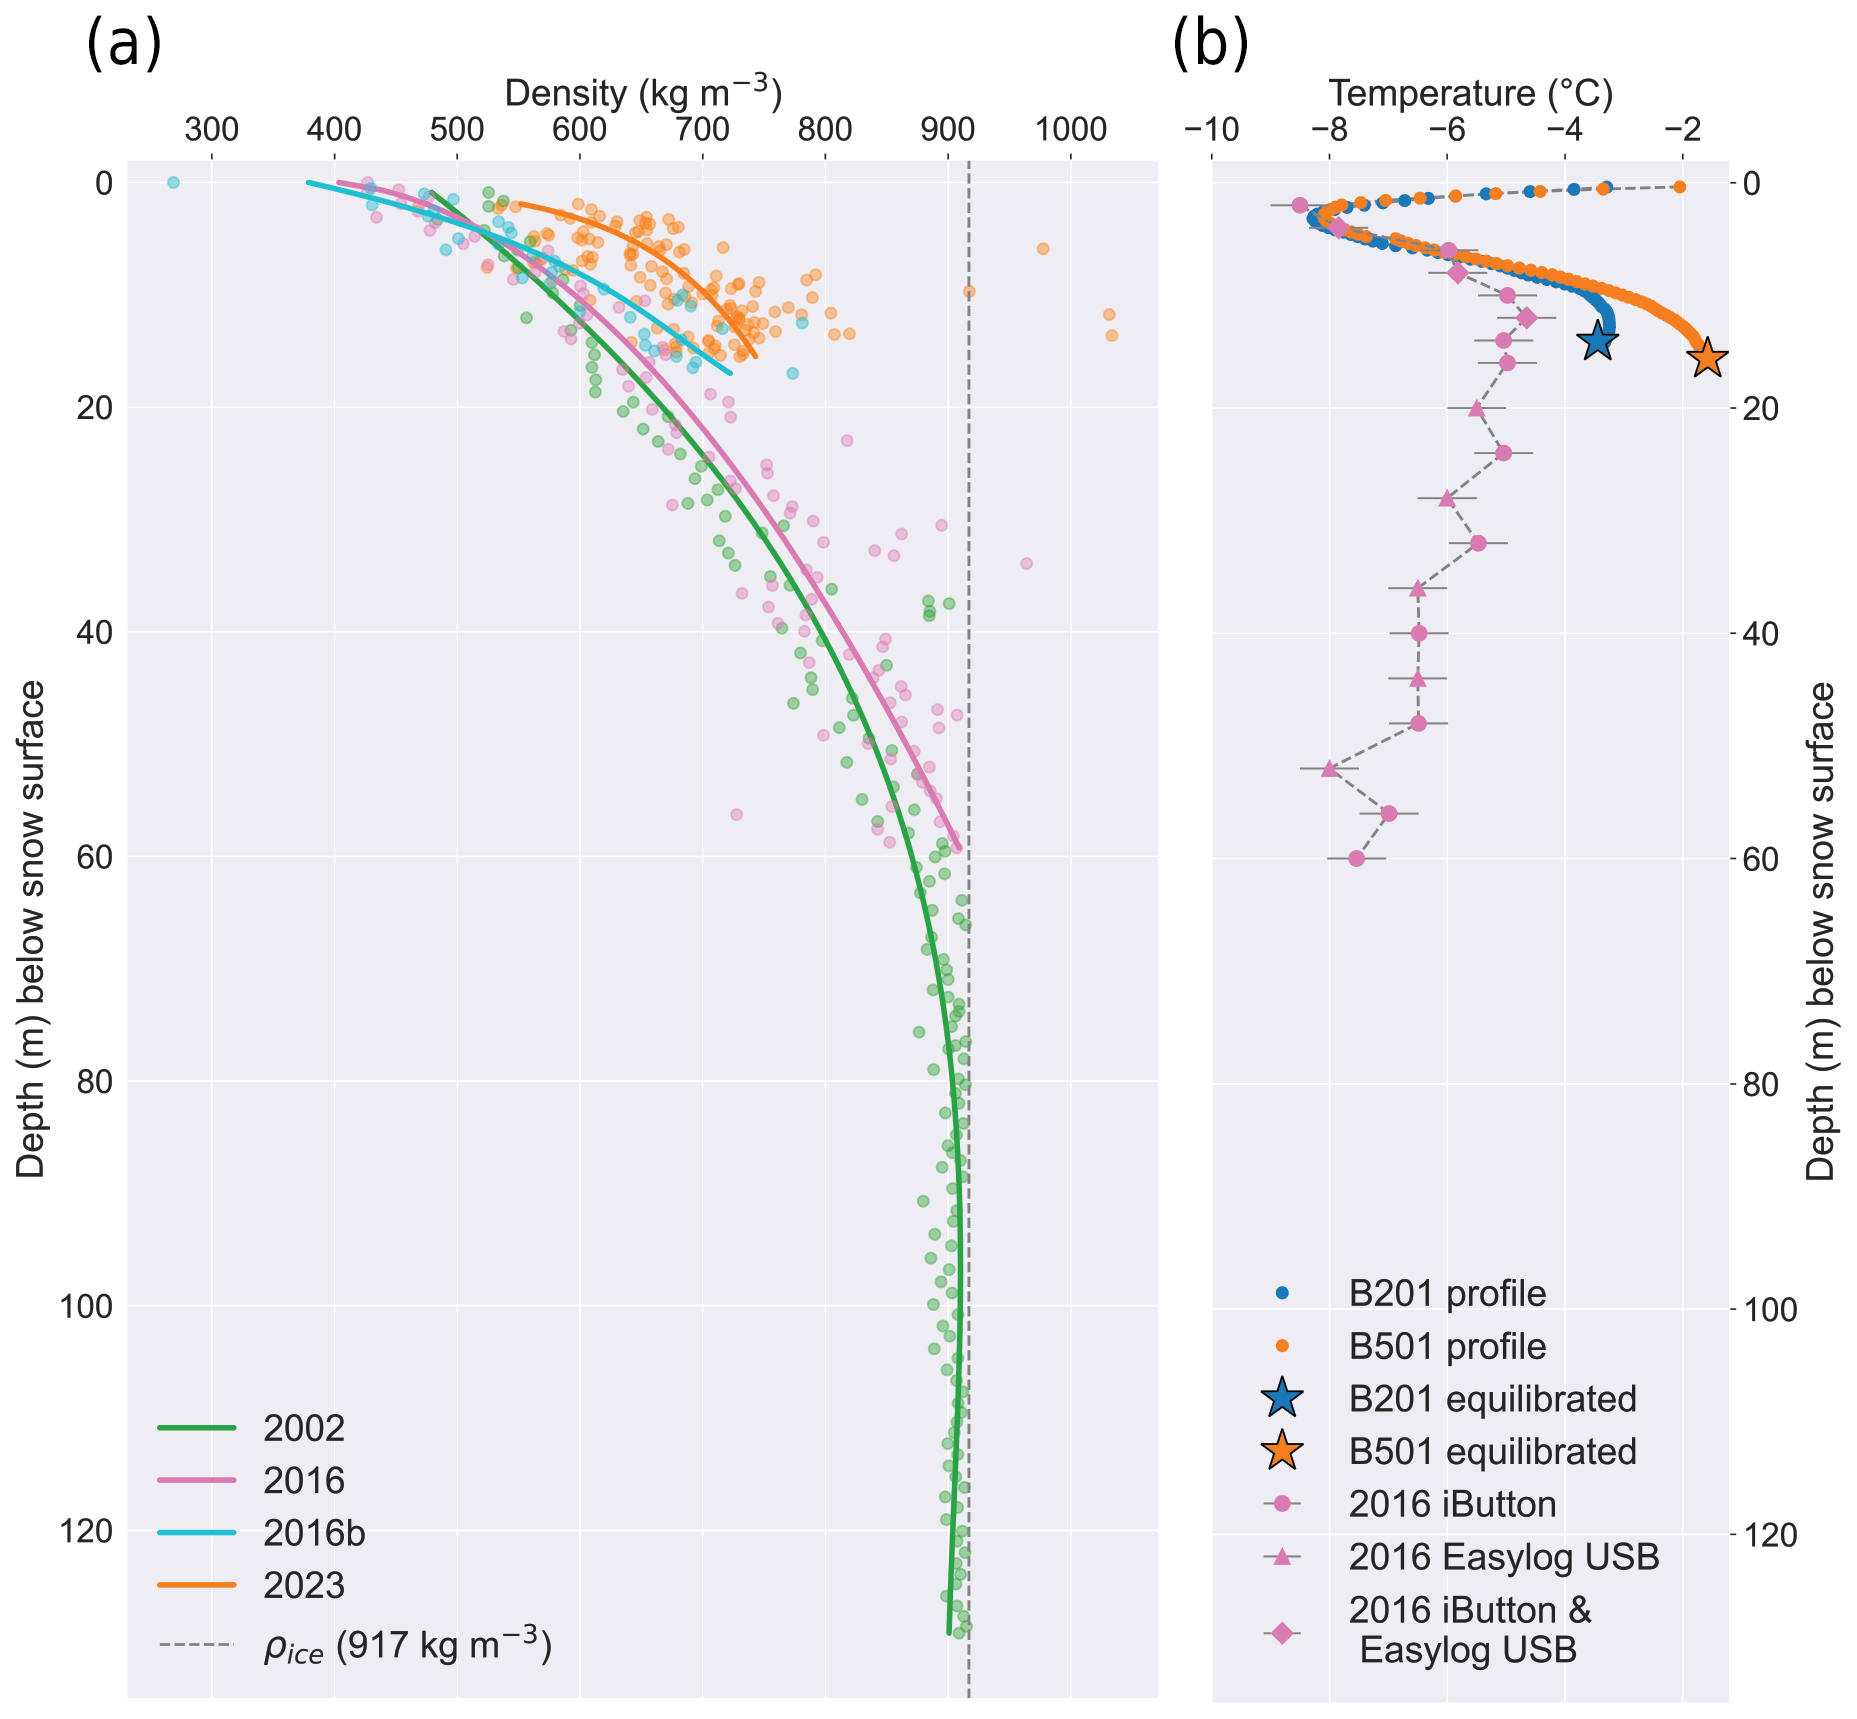
Figure 9Eclipse 2023 (a) firn densities and (b) borehole temperatures in comparison to measurements at Eclipse from 2002 and 2016. Measured density values are shown by circles in panel (a) with a curve fitted to each year's data. The density of solid ice is shown in panel (a) by the dotted gray line. Curves are not fitted to temperature data in panel (b). Uncertainty in 2016 temperature measurements is shown by the gray error bars. Error bars for 2023 measurements are too short to be visible behind the markers.
Results from our firn core stratigraphy, borehole temperatures, and GPR surveys (discussed in greater detail below) suggest that although there is some meltwater movement through the snow and firn at Eclipse, it is not enough to characterize the site as “wet”. Because of its high elevation (3017 m ), high accumulation rate (1.4 m a−1), and thick ice (>650 m), Eclipse has been the site of several past ice coring campaigns with additional core recovery planned for coming years (Yalcin et al., 2006; Wake et al., 2002; McConnell, 2019). However, recent and continued warming threatens the viability of coring efforts and the preservation of a climate record at Eclipse. Percolating melt can influence paleoproxy records by homogenizing isotope and chemical signals in the snow and firn through which it travels, as well as precluding core recovery with mechanical drills (Moran and Marshall, 2009). Although our results indicate that Eclipse to date remains relatively dry (and could therefore be a valuable ice core site), there is evidence of increasing meltwater inputs, and firn modeling shows that firn at the site could become temperate by 2033.
4.1 Meltwater movement and refreezing in snow
We see no evidence of seasonal melt onset in the top ∼ 4 m of snow. However, below this depth all three firn cores display a variety of features associated with snowmelt, including ice layers, ice lenses, and bubbly and coarse-grained firn (Fig. A1). The presence of such features indicates that snow at Eclipse experiences melt and percolation during the summer months, leading to the formation of ice lenses and layers that freeze either in subsurface firn below 0 °C or as ambient surface temperatures drop below freezing.
In the early stages of summer melt, capillary action causes the small amount of liquid water produced to stay in place between the crystals (Sommerfeld et al., 1970); if refreezing occurs at this stage, the refrozen melt only partially fills the boundaries between individual grains. It therefore does not produce a solid blue ice layer, instead appearing bubbly or composed of very coarse but well-sintered grains, which we note in our observations as “coarse-grained”. The strength of these layers differentiates them from depth hoar and is consistent with formation from meltwater, as repeated melt–freeze cycles increase both the size of snow crystals and the bond strength between them (Fierz et al., 2009; Sommerfeld et al., 1970). If the temperature remains above freezing for an extended period, ponding and wet grain growth can occur (Colbeck, 1972; Jordan, 1995; McDowell et al., 2023). Although not necessary for ponding or grain growth, blue ice layers, which we observe in all three firn cores, may form under these conditions (McDowell et al., 2023).
Ice lenses (ice layers that do not extend across the entire core diameter) are observed in all three firn cores, indicating the development of preferential pathways for meltwater movement. Percolation is a notoriously spatially variable phenomenon, often occurring via vertical pipes that develop as surface melt progresses and can leave surrounding firn unaltered (Bengtsson, 1982). Preferential flow through vertical pipes has been observed extensively in both seasonal snowpacks (Williamson et al., 2020; Evans et al., 2016; Albert et al., 1999; Marsh and Woo, 1984) and glacier and ice sheet snow cover (Winski et al., 2012; Humphrey et al., 2012; Mernild et al., 2006; Bøggild et al., 2005). We interpret the appearance of ice lenses as evidence of vertical piping in the snow and firn at Eclipse, although no pipes were sampled directly.
We interpret thin (≤2 mm) ice layers in all three cores as buried sun crusts. Sun crusts form when meltwater in the surface snow refreezes due to radiative cooling; the forming crust reduces shortwave absorption, allowing additional water vapor to condense below the initial glaze (Fierz et al., 2009). Buried sun crusts account for 31 % and 42 % of observed ice layers in cores B501 and B502, respectively, but only 16 % of observed ice layers in core B201. Sun crusts are surface formations that are later buried; they do not indicate movement of liquid melt through the snow and firn pack.
Thicker ice layers can form at the surface or deeper in the snow and firn, either through prolonged or intense individual melt events or through the cumulative effect of multiple melt events once an impermeable barrier to deeper percolation is established (Culberg et al., 2021). Multimeter-thick ice slabs, such as those observed in Greenland, can develop with multiyear meltwater production (Culberg et al., 2021). Alternatively, rapid freeze–thaw cycles can produce melt but inhibit its percolation, resulting in melt complexes that comprise many thin melt layers in close proximity, rather than thick consolidated slabs (MacFerrin et al., 2019). Our results are more consistent with the latter scenario, with the thickest ice layers observed in cores B501 and B502 being 12.0 and 10.0 cm, respectively. However, the possibility of an ice slab at the bottom of core B201 cannot be dismissed, as we drilled through 33.0 cm of ice before stopping due to mechanical issues; the total thickness of that layer therefore remains unknown.
Neither our VHF (900 MHz) nor HF (5 MHz) radar is high-frequency enough to identify thin and discontinuous ice layers in the near surface, which would indicate subsurface meltwater movement. However, both systems do provide a sense of the overall wetness of the firn pack. Liquid water is very effective at attenuating a radar signal, so the transition from a dry to wet firn pack can be inferred from the disappearance of stratigraphy in GPR data (e.g., Campbell et al., 2012). The presence of clear stratigraphy in both our VHF and HF radar profiles supports previous observations of an overall dry firn pack at Eclipse (McConnell, 2019). This is in contrast to a bright reflector atop washed-out deeper stratigraphy seen in a 2018 radar profile from nearby Icefield Camp (∼ 400 m lower than Eclipse), indicative of a liquid water table in the firn (McConnell, 2019).
4.2 Melt percolation and spatial variability in firn character
GPR results, core stratigraphy, and borehole temperatures together indicate that while spatially consistent annual melt–freeze cycles can be observed at Eclipse at the kilometer scale, the effects of meltwater production and percolation across this distance can vary substantially. For example, annual cycles as approximated by transitions between ice-rich and unaltered sections of firn are consistent between cores B501 and B501 and concur with those suggested by cyclic variations in B501 density. However, the location, thickness, and type (e.g., clustered ice layers vs. coarse-grained firn) of melt features differ between the cores due to small spatial variations in the amount of snow deposited at each site and to the irregular nature of ice lens, finger, and layer formation. Furthermore, core B201, drilled ∼ 1.5 km from the B5 cores and at a similar elevation, has a higher firn ice content (10 % by volume) than either B501 (5 % by volume) or B502 (3 % by volume), evidence of either greater surface melt production or greater retention of liquid water in the near surface. Additionally, B201's ice content tends to comprise thicker ice layers despite B201 having lower borehole temperatures than B501 below ∼10 m depth (Table 2).
This difference in borehole temperatures is likely due to a difference in the surface energy balance and/or meltwater input at the two sites; the relative magnitude of surface energy balance terms can vary substantially based on prevailing weather, topographic shading, and seasonal effects, even between closely located sites with similar mean annual temperatures (Hannah et al., 2000). One explanation for observed differences between sites B2 and B5 is that B5 on average receives slightly more solar radiation due to its southeast aspect, especially in the winter. Eclipse is high enough in latitude that the sun rises considerably further south in the winter than summer. This being a predominantly winter phenomenon could explain why B5 has fewer melt features despite being slightly warmer; however, we consider it unlikely that the wintertime southerly migration of sun position would outweigh the influence of summertime melt production at the two sites. Moreover, in areas with surface melt and percolation into the subsurface, the role of conduction in downward heat transport is comparatively minor relative to that of latent heat associated with the refreezing of meltwater (Cuffey and Paterson, 2010). Another explanation is that meltwater percolation is responsible for warming the firn at B5 but occurs adjacent to our core sites and is therefore not recorded in our core stratigraphy. For example, the lateral transport of liquid water along a subsurface layer boundary from the southeast-facing areas upslope of site B5 may account for the higher subsurface heat content of the site relative to B2. However, subsurface meltwater flow would be limited by the large cold content of below-freezing firn. Additionally, site B2 could also experience liquid water transport from upslope areas, predominantly with a western aspect; though based on surface debris, the areas upslope of B2 experience greater avalanche disruption than those upslope of B5, making meltwater transport along consistent subsurface pathways less likely.
4.3 Development of temperate firn
The present difference in firn water content between Eclipse, Icefield Camp, and Kaskawulsh is likely because Eclipse sits ∼ 400 m higher in elevation than the other sites. The lower elevation but generally similar environment of Icefield Camp and Kaskawulsh relative to Eclipse make them useful case studies for predicting the future firn evolution at Eclipse with continued warming in the St. Elias Range.
Unlike the Kaskawulsh/Hubbard Divide area, Eclipse has yet to develop a firn aquifer, as demonstrated by GPR data from both 2016 and 2023. HF (5–10 MHz) data from both years show bedrock that slopes to a trough in the middle of the ice field, a bright reflector at ∼ 150 m depth interpreted as the ash layer from the 1912 Katmai eruption, and continuous stratigraphy with the exception of surface zones of avalanche debris. Neither 2016 nor 2023 HF data show a bright reflector indicative of a liquid water table. VHF (400–900 MHz) data from both years also look similar, with clear and continuous stratigraphy down to 20 m depth indicative of a dry firn pack. Despite remaining dry to date, borehole temperatures indicate that at least part of Eclipse Icefield is <2 °C from the melting point at depth. Moreover, model results indicate that Eclipse is close to the threshold for developing temperate firn, with a 2 % chance of year-round temperate firn at 15 m depth by 2033 without continued atmospheric warming, a 51 % chance with 0.5 °C warming, and a 98 % chance with 1 °C warming. Model behavior also suggests an increase in liquid water content at depth, with the potential for firn aquifer development. During many of our model runs, the CFM failed to produce any outputs below ∼ 25 m depth starting in the late 2020s. Because the CFM is limited in its ability to handle large amounts of liquid water, we associate this pattern of model failure with high amounts of persistent liquid water, consistent with the possibility that Eclipse follows a similar trajectory to Kaskawulsh and Icefield Camp, developing a firn aquifer in the next 5–10 years.
We suggest that more and higher-magnitude melt events during the height of summer combined with warmer wintertime temperatures promote the development of year-round temperate firn in St. Elias. Model results for Eclipse show the development of year-round temperate firn at 15 m depth associated with an increase in total PDDs throughout the melt season, as well as with a greater number of individual melt events, higher average melt event magnitude (mm melt produced), and warmer winter temperatures, rather than an earlier or prolonged melt season (Fig. 8; Tables 4, 5). In Greenland, “extreme melt events” have been related to firn's multiyear response to surface melt via the formation of thick ice slabs and ice layer complexes, which cause a near-surface barrier to downward percolation (Culberg et al., 2021). In St. Elias, however, an increase in the number of melt events and an increase in average individual melt event magnitude are more likely to result in sustained heat transport to depth because of the insulating effect of the region's high annual accumulation (1.4 m a−1 at Eclipse) relative to accumulation rates in Greenland (0.3–1.2 m a−1; Hawley et al., 2020; Montgomery et al., 2020; Burgess et al., 2010). Also consistent with observations in Greenland (Horlings et al., 2022), our results show that the development of year-round temperate firn at Eclipse is associated with an increase in winter temperatures. Rather than directly relating to melt production, wintertime warming affects firn properties by reducing the regeneration of cold content that occurs between melt seasons, effectively enabling the warming effects of summertime melt to compound from one melt season to the next.
If Eclipse does indeed develop a firn aquifer in the next decade, over 90 % (>22 000 km2) of the region from 59.59 to 61.58° N and 138.02 to 142.23° W could support liquid water in the firn based on its elevation (Fig. C1). Moreover, areas above Eclipse in elevation are largely steep mountain peaks and represent a far smaller portion of the St. Elias hydrological reservoir than the broad ice fields below, which retain more snow and ice. Deep (>10 m depth) temperate firn up to 3000 m would therefore represent widespread meltwater percolation and constitute a wholesale change in the region's hydrological system. In particular, the capacity of the ice fields to buffer runoff would be reduced by meltwater's direct occupation of pore space and by intensified compaction associated with its rounding and lubrication of grains (Thompson-Munson et al., 2024; Amory et al., 2024; Colbeck, 1982; Colbeck and Parssinen, 1978). Such processes associated with warming have contributed to a 5 % reduction in firn pore space in Greenland since 1980 (Amory et al., 2024). Additionally, firn loses pore space in response to warming more readily than it gains pore space in response to cooling; observed densification of the firn to date therefore has long-term consequences for runoff buffering (Thompson-Munson et al., 2024).
Stratigraphy, density, and borehole temperature data from Eclipse Icefield indicate that although the site can still be characterized as largely “dry”, the production and percolation of meltwater are present and increasing. Numerous ice layers, lenses, and regions of melt-affected firn are seen in all three firn cores recovered in 2023, with stratigraphic observations in core B501 supported by density data. Borehole temperatures indicate that from 2016 to 2023 there was a 1.67 °C warming of the firn at 14 m depth, and model results indicate that warming of the firn below 10 m depth may continue over the next decade, with a 2 % chance of becoming temperate year-round at 15 m depth by 2033, even without continued atmospheric warming. The chance of developing year-round temperate firn at 15 m depth remains around 2 % with 0.1 °C atmospheric warming by 2033 but increases to 12 % with 0.2 °C warming, 51 % with 0.5 °C warming, and 98 % with 1 °C warming over the same period. Development of year-round temperate firn at Eclipse is associated with more total PDDs throughout the melt season, more individual melt events, and a higher average melt event magnitude combined with warmer wintertime temperatures, rather than with an earlier or prolonged melt season. Intense melt events combined with the site's high (1.4 m a−1) annual accumulation likely result in sustained heat transport to depth.
As >90 % of the region from 59.59 to 61.58° N and 138.02 to 142.23° W is below Eclipse in elevation, the development of temperate firn and/or a firn aquifer at Eclipse would represent the ability for widespread meltwater runoff across the St. Elias Range, indicating a wholesale change in the region’s hydrological system and a reduction in its ability to buffer runoff. Given its relatively dry conditions to date, Eclipse remains a site of interest for recovering an ice-core-based long-term regional climate record. However, because the firn at Eclipse is close to temperate in places, the heterogeneity of meltwater movement and its effects on the firn must be taken into account for the successful recovery of such a record. Moreover, opportunities for ice coring may be limited with continued atmospheric warming and the associated development of temperate firn and/or a firn aquifer. Such a change in firn character at Eclipse and across areas at or below similar elevations would severely limit potential ice core sites in St. Elias; it is urgent that a deep ice core be retrieved while the record is still intact.
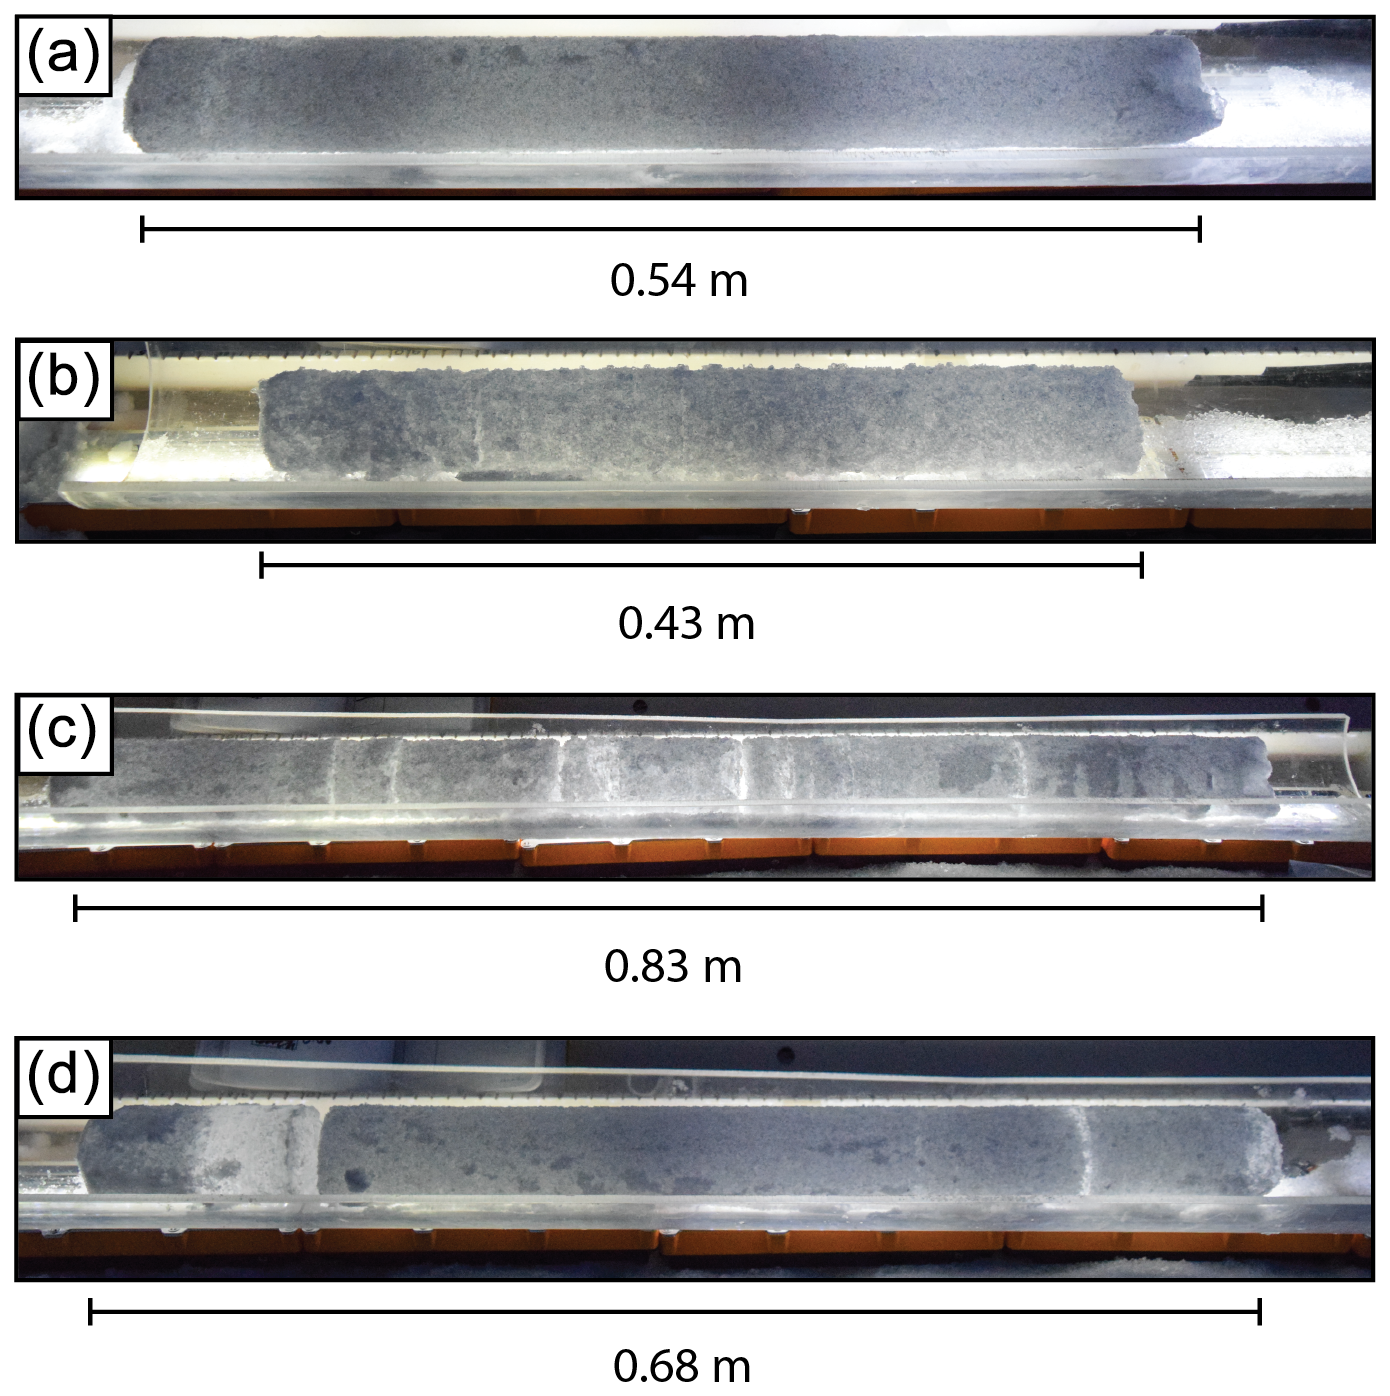
Figure A1Example back-lit photos from core B501 of (a) undisturbed firn (6.97 m BLSS), (b) coarse-grained firn (3.40 m BLSS), (c) clustered thin ice layers (6.36 m BLSS), and (d) a thick (>10 cm) ice layer (5.46 m BLSS). Depths refer to the top of the core segment below the last summer surface (BLSS).
We test the sensitivity of the Community Firn Model to the air temperatures used during the model spin-up by using four different spin-up schemes based on different air temperature data. First, we use 2013 to 2024 in situ data from an automatic weather station (AWS) near the Kaskawulsh/Hubbard ice divide (“Divide AWS”, Fig. 1), which we repeat for the duration of the spin-up. Second, we generate synthetic climate data by randomly selecting daily temperature values from a Gaussian distribution described by the mean and standard deviation of the Divide AWS data for each day of the year, which have been corrected for the difference in elevation between Divide and Eclipse using a lapse rate of −3.98 °C km−1 (Hill et al., 2021). Our third spin-up scheme uses the same Gaussian method, but we apply a temperature correction to account for a historical warming rate of 0.024 °C a−1 between 1979 and 2016 (Williamson et al., 2020). Finally, we use downscaled NARR temperature data from 1983 to 2013 (Jarosch et al., 2012). We use the same mean annual accumulation rate (1.4 m a−1) under all spin-up schemes.
The model is always forced with the same Divide AWS air temperatures from 2013–2024 regardless of spin-up regime, so surface temperatures (0 m depth) from 2013 to 2024 are consistent among all four spin-up schemes (Fig. B1) and there is no significant difference among the four spin-up schemes at 0 m depth (Kruskal–Wallis test; H=0.51, p≥0.05). There are, however, significant differences among the four schemes (Kruskal–Wallis test) at 5 m (H=65.81, p<0.05), 10 m (H=485.92, p<0.05), 15 m (H=1535.42, p<0.05), and 20 m (H=4008.88, p<0.05) depth. The Kruskal–Wallis test is the nonparametric equivalent of analysis of variance; it is used to test whether two or more samples originate from the same distribution. A higher H value reflects a larger difference between the medians of the samples in question, meaning it is more likely they are from different distributions. We select downscaled NARR air temperatures as the forcing data for our reference model spin-up because they provide the most conservative baseline firn temperatures below 10 m depth (Fig. B1). We therefore take all predictions of firn warming to be conservative estimates.
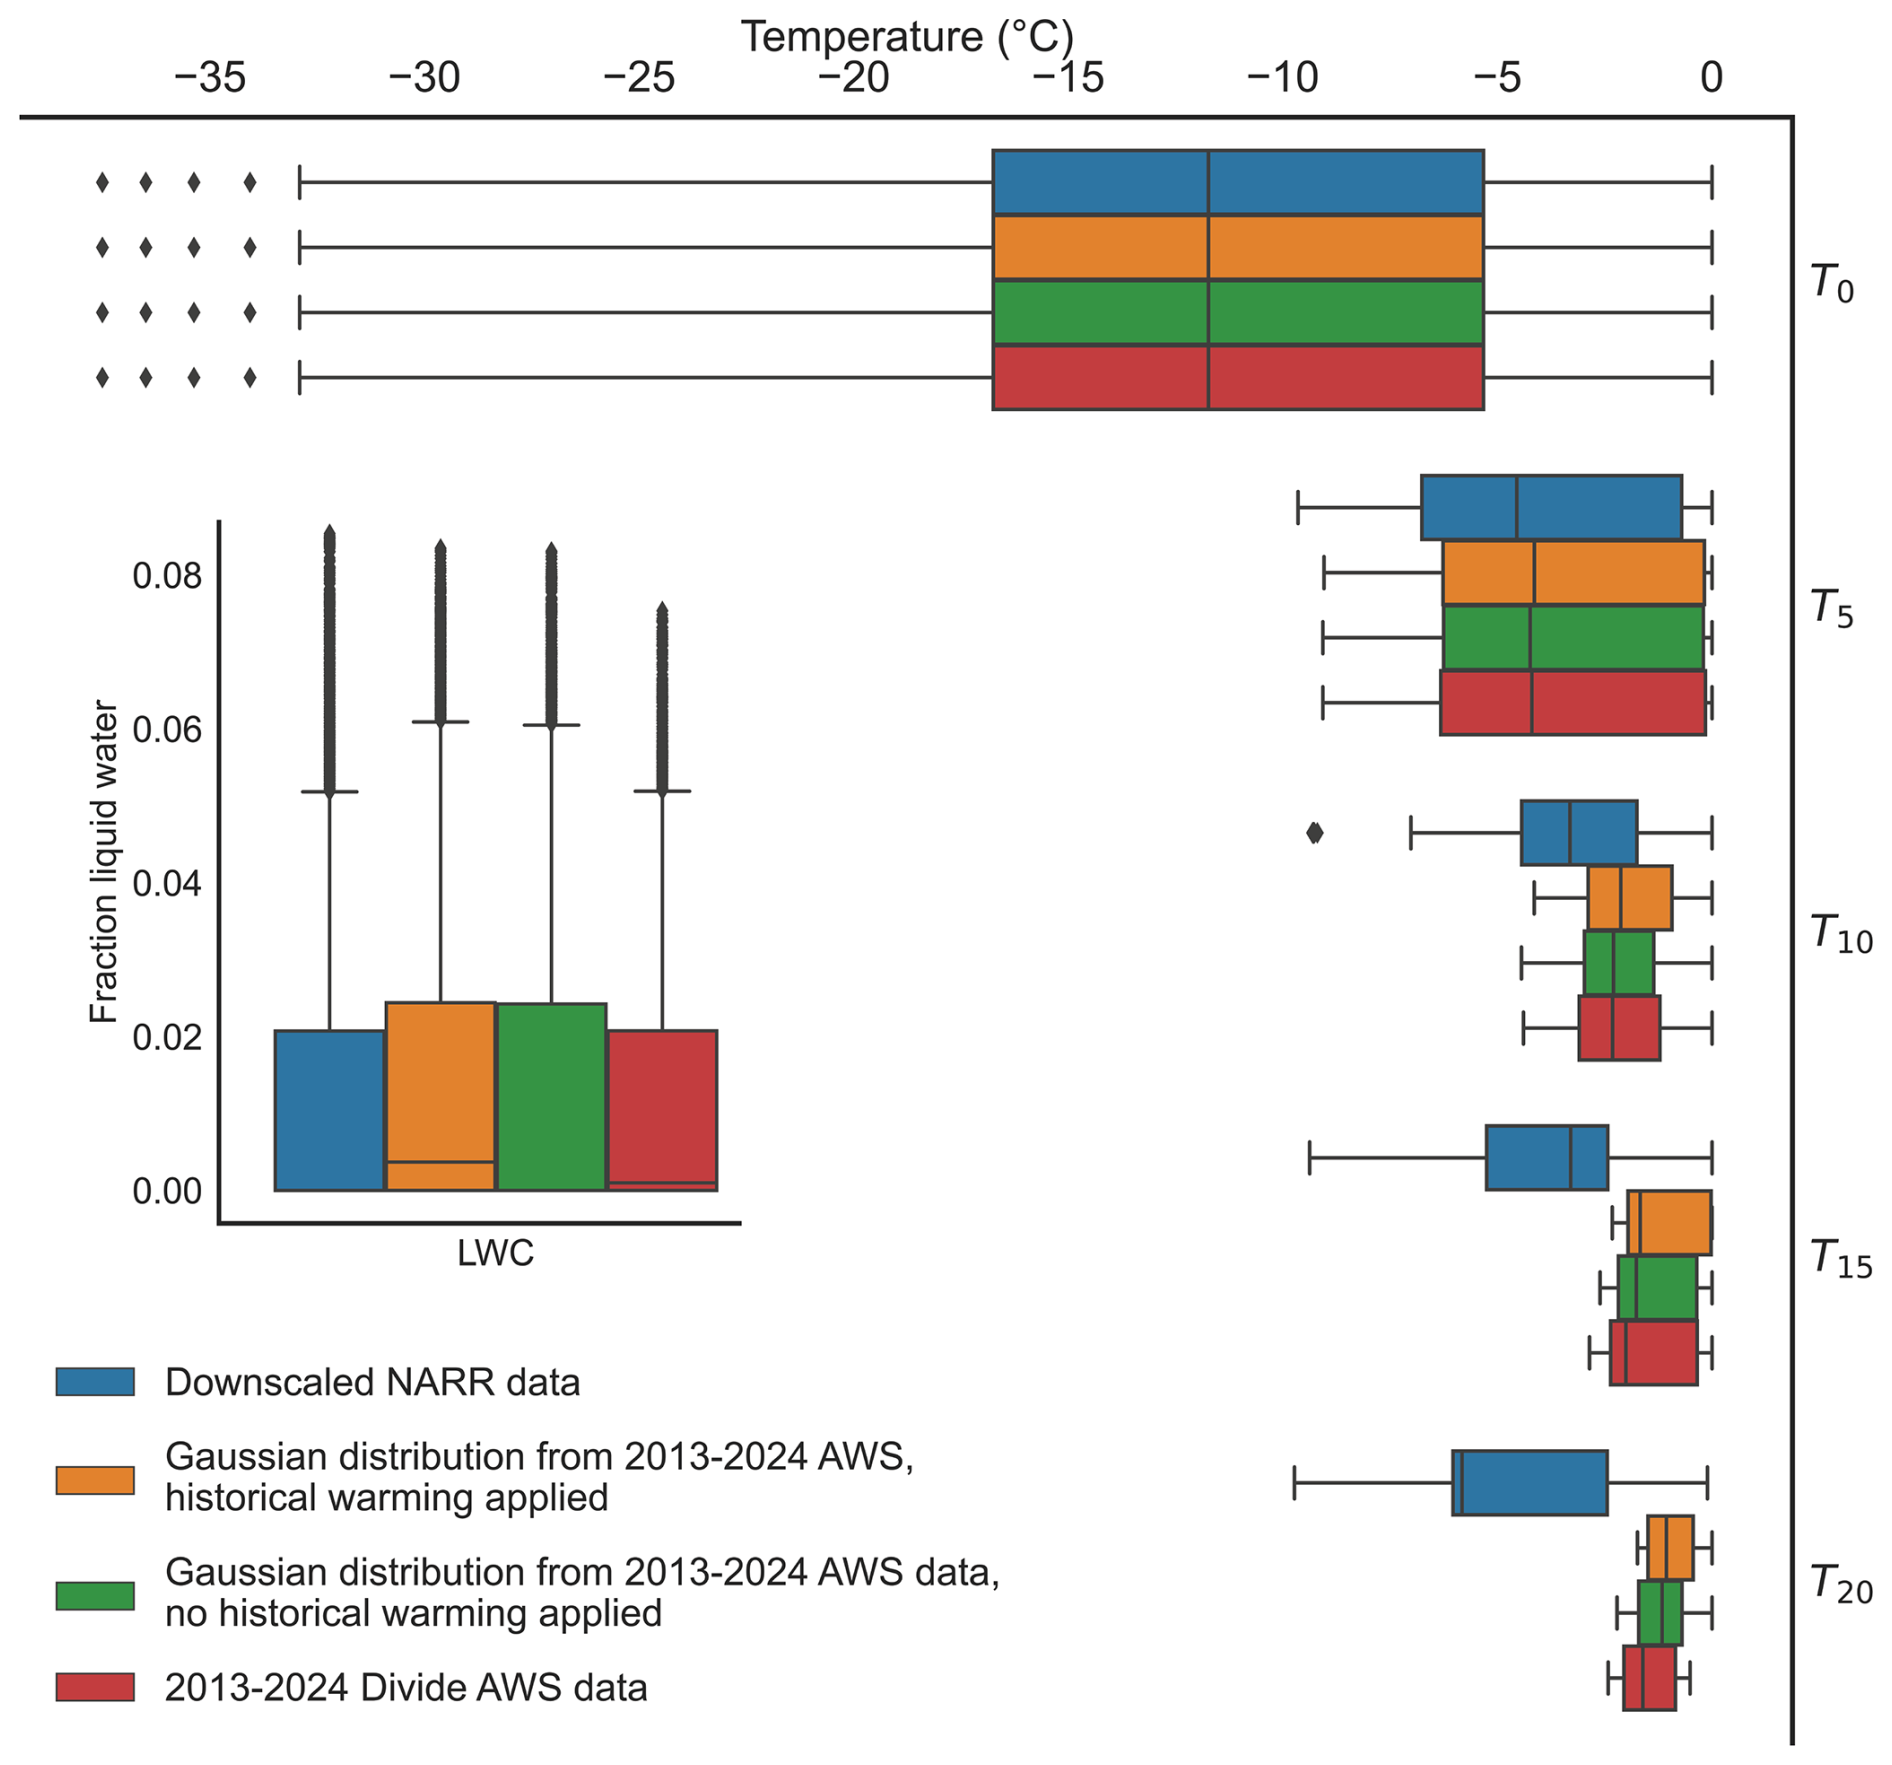
Figure B1Temperature and liquid water content (LWC) sensitivity to spin-up scheme. Distributions include temperature and LWC outputs from 2013–2024 under four different spin-up scenarios. Distributions are shown for temperature at 0, 5, 10, 15, and 20 m depth. LWC is calculated for the entire firn column.
We also test the model sensitivity to the degree day factor (DDF) and surface density values used in surface melt production and firn densification. Across the 300 combinations of DDF and surface density that we tested, the CFM produced firn temperatures ranging from 0 °C to nearly −10 °C in May/June 2023, when borehole temperatures indicated firn at ∼ 14 m depth at Eclipse to be between −2 and −4 °C (Fig. B2). Firn temperatures at 0, 5, 10, 15, and 20 m depth, as well as total firn column liquid water content, are shown for all sensitivity test runs that produced 2023 firn temperatures consistent with borehole measurements in Fig. B3. Results of our sensitivity tests for model runs spun up with downscaled NARR air temperatures are shown in Fig. B4 with our selected reference model (used for all reported results) indicated.
Monthly accumulation scalars used in our main CFM model runs are shown in Fig. B5. Examples of CFM density, liquid water content, and firn temperature outputs for the full firn column are shown in Fig. B6.
Table B1Suite of degree day factors (DDFs) and surface density values tested in model tuning. A total of 300 DDF and surface density combinations were tested.
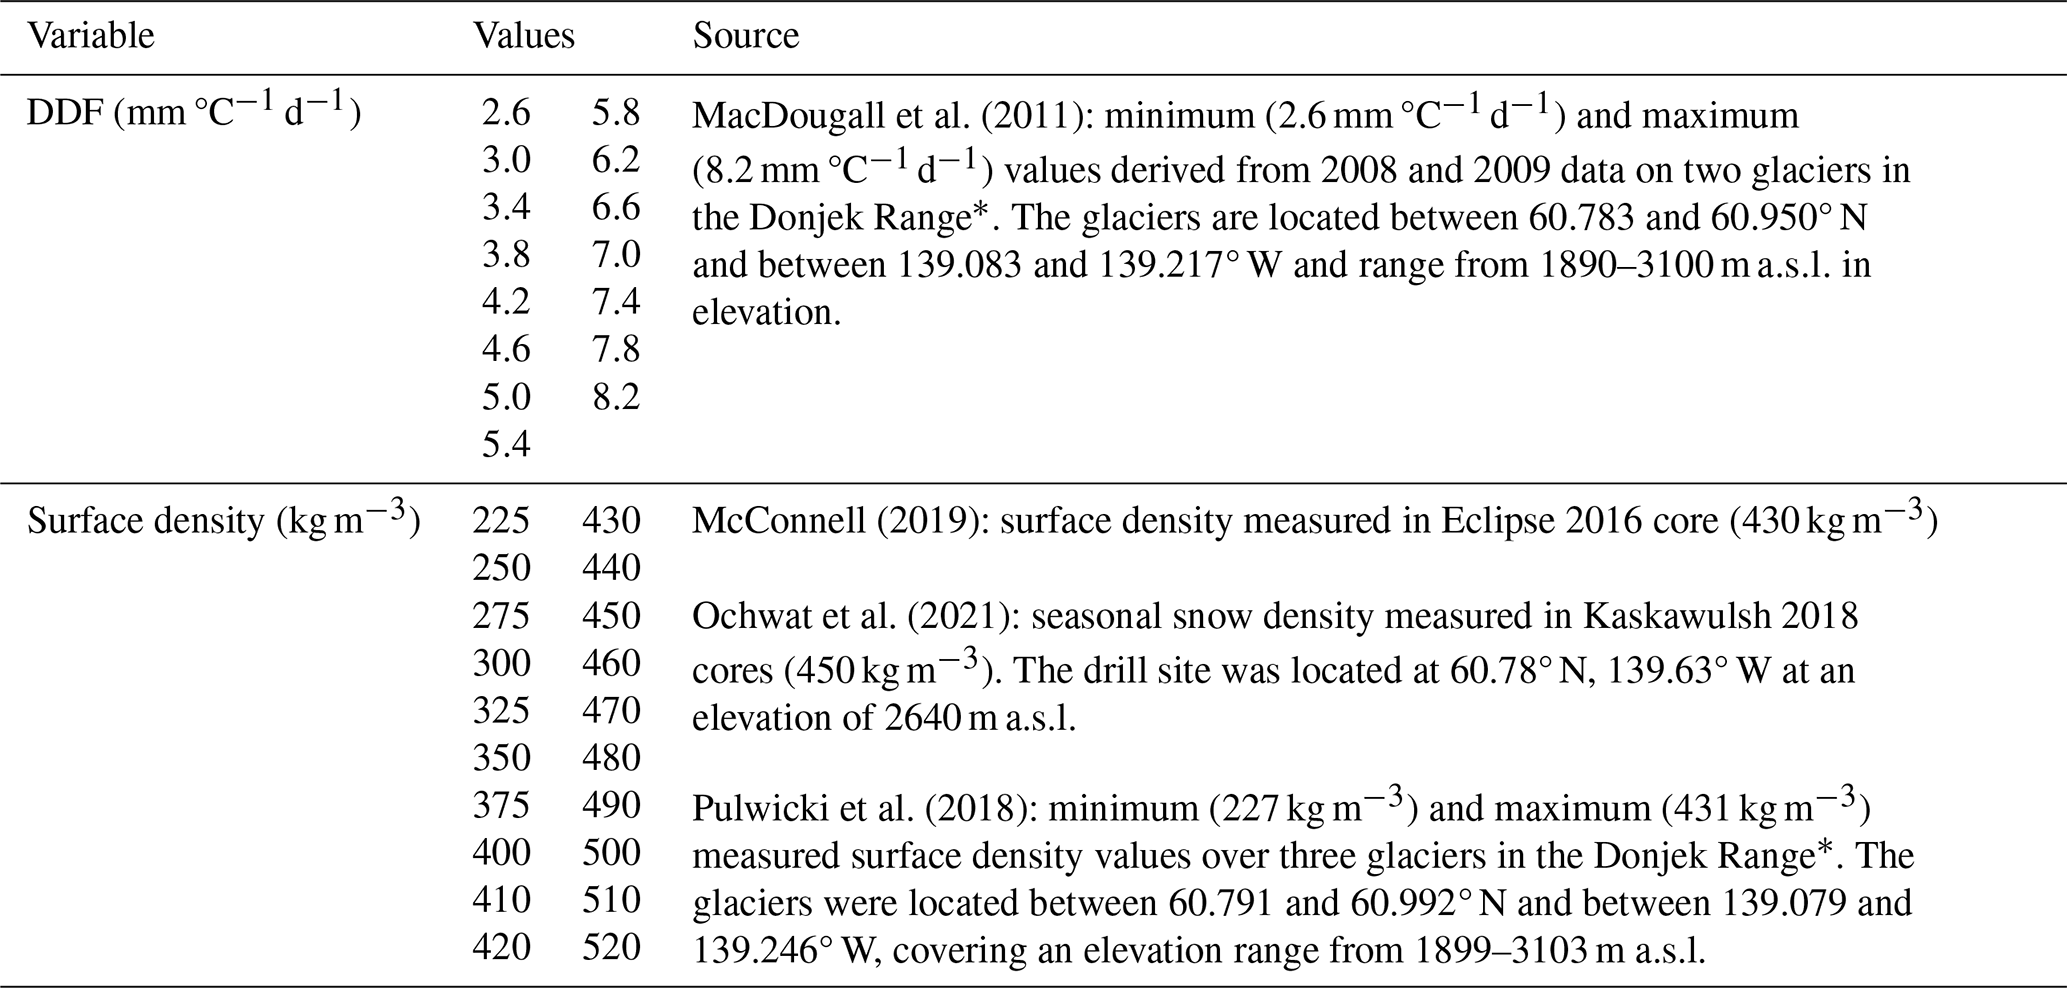
* A subrange in St. Elias.
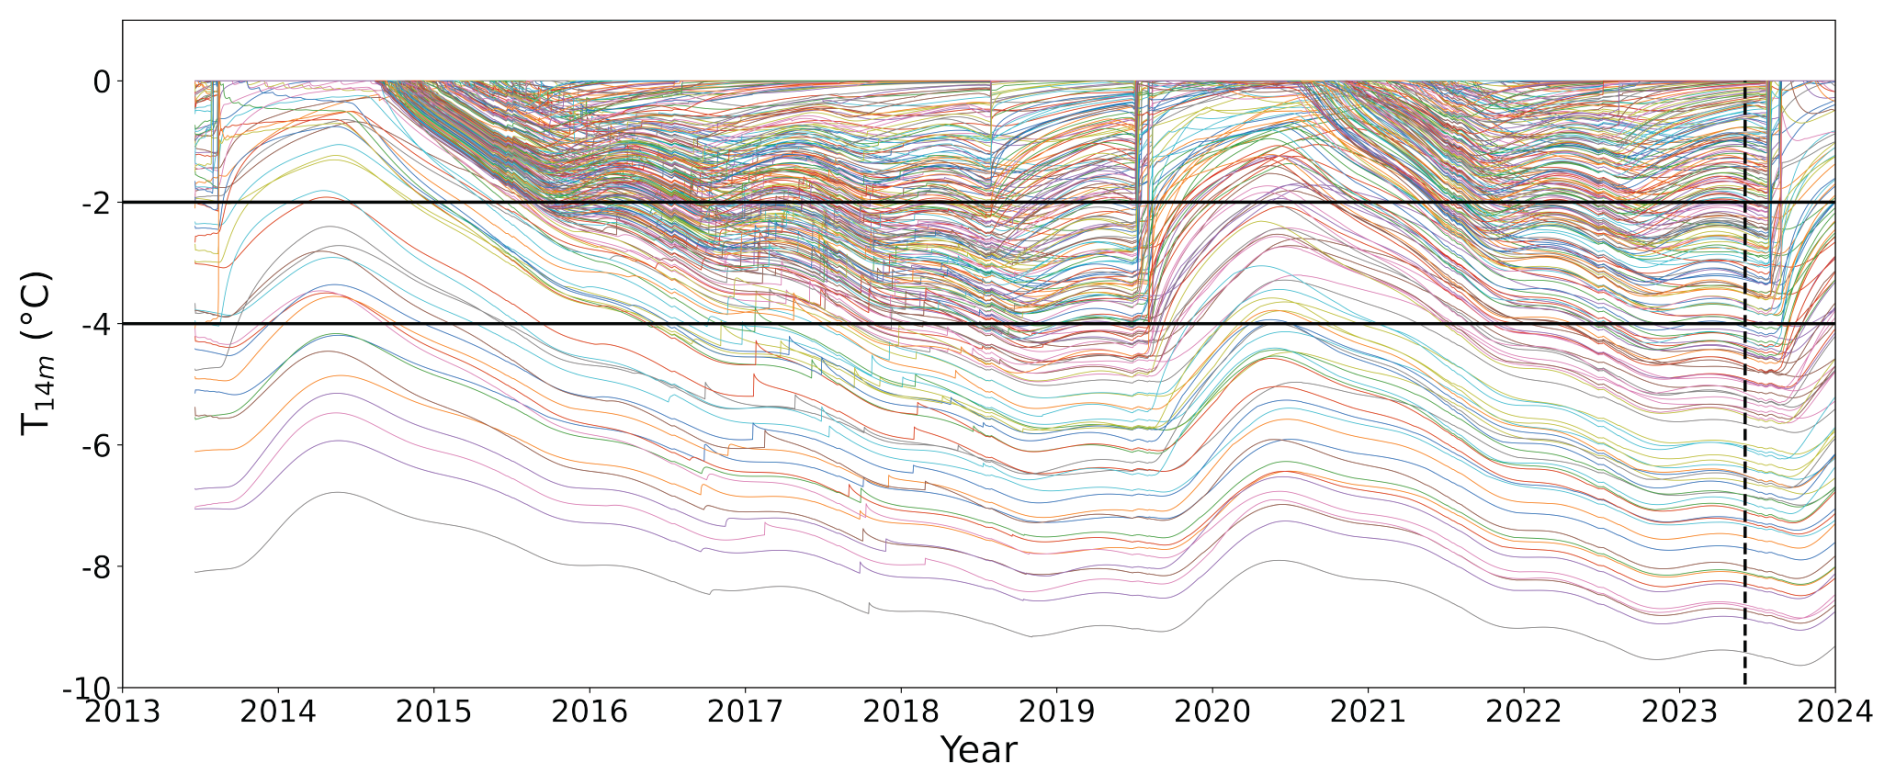
Figure B2Evolution of firn temperature at 14 m depth under 300 combinations of degree day factor (DDF) and surface density. Dotted vertical line marks the date of in situ borehole temperature measurements in May/June 2023. Solid horizontal lines at −2 and −4 °C show the bounds of realistic May/June 2023 firn temperatures at 14 m depth based on borehole measurements.
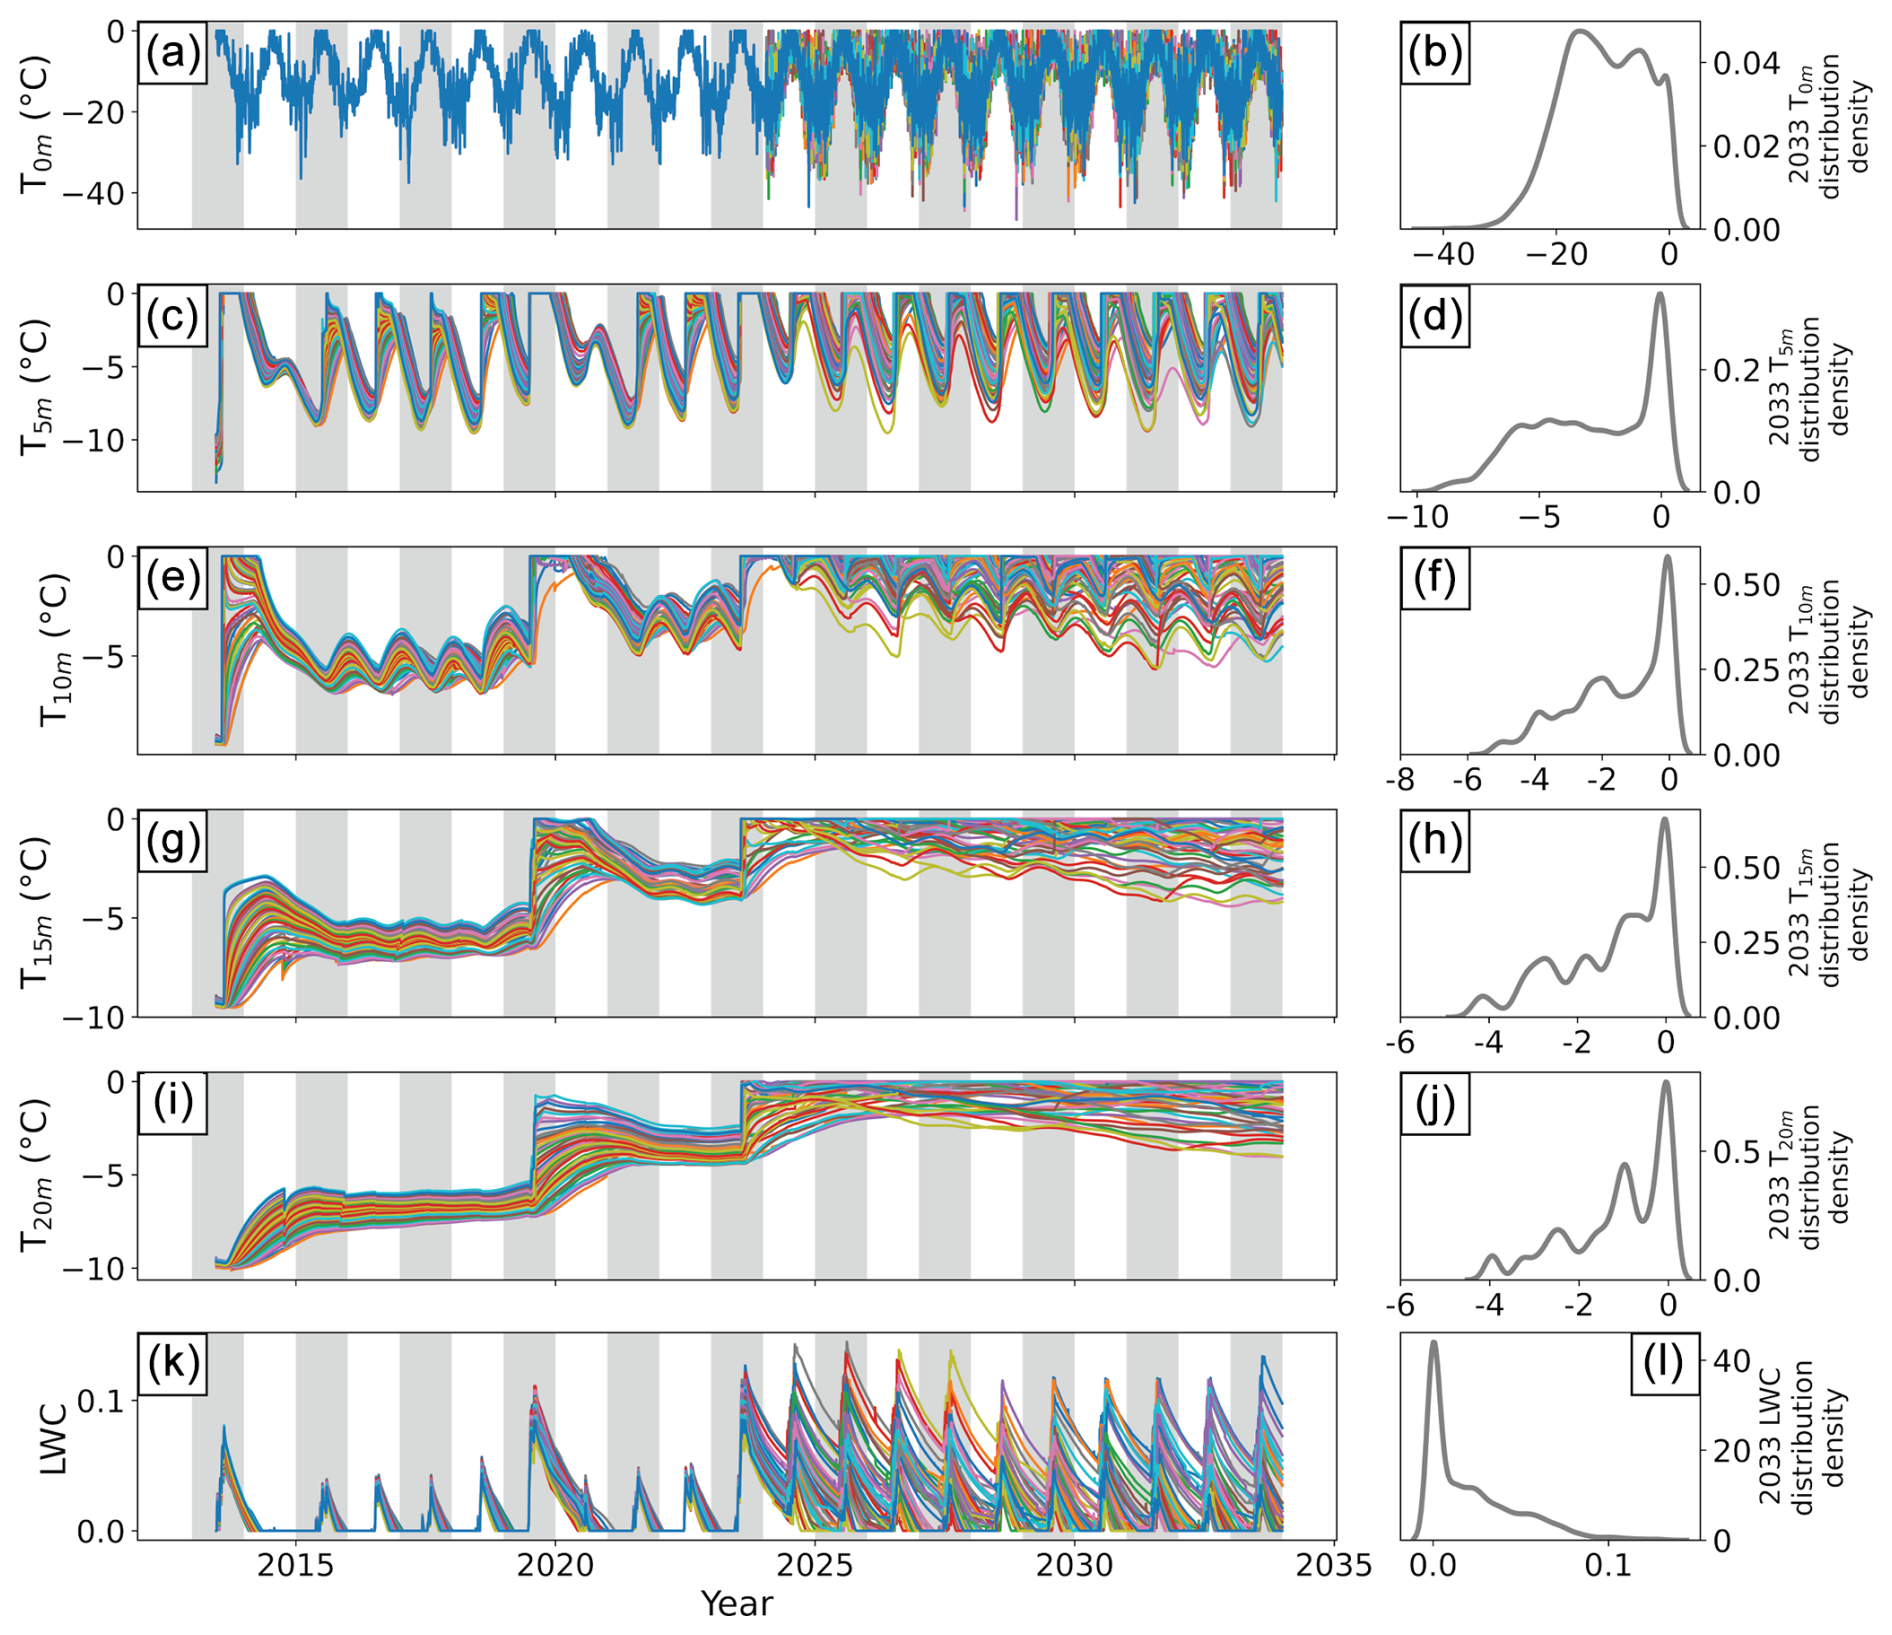
Figure B3Temperature (a–j) and liquid water content (LWC; k–l) time series and distribution plots for model runs that produce realistic results at Eclipse Icefield. Temperatures are shown at 0 m (a–b), 5 m (c–d), 10 m (e–f), 15 m (g–h), and 20 m (i–j) depth. LWC is calculated for the entire firn column. All model runs were forced using downscaled NARR air temperatures during the spin-up period (pre-2013), elevation-corrected Divide AWS data from 2013–2024, and temperatures randomly drawn from a Gaussian distribution described by the mean and standard deviation of elevation-corrected 2013–2024 Divide AWS temperatures from 2024–2033. Forcing temperatures from 2024–2033 assume a continuation of current climate conditions. Gray bars show odd-numbered years (e.g., 2015, 2017). Values on the x axis of the right-hand panels (distributions) correspond to those on the y axis of the left-hand panels (time series). Distributions are shown for 2033 outputs only.
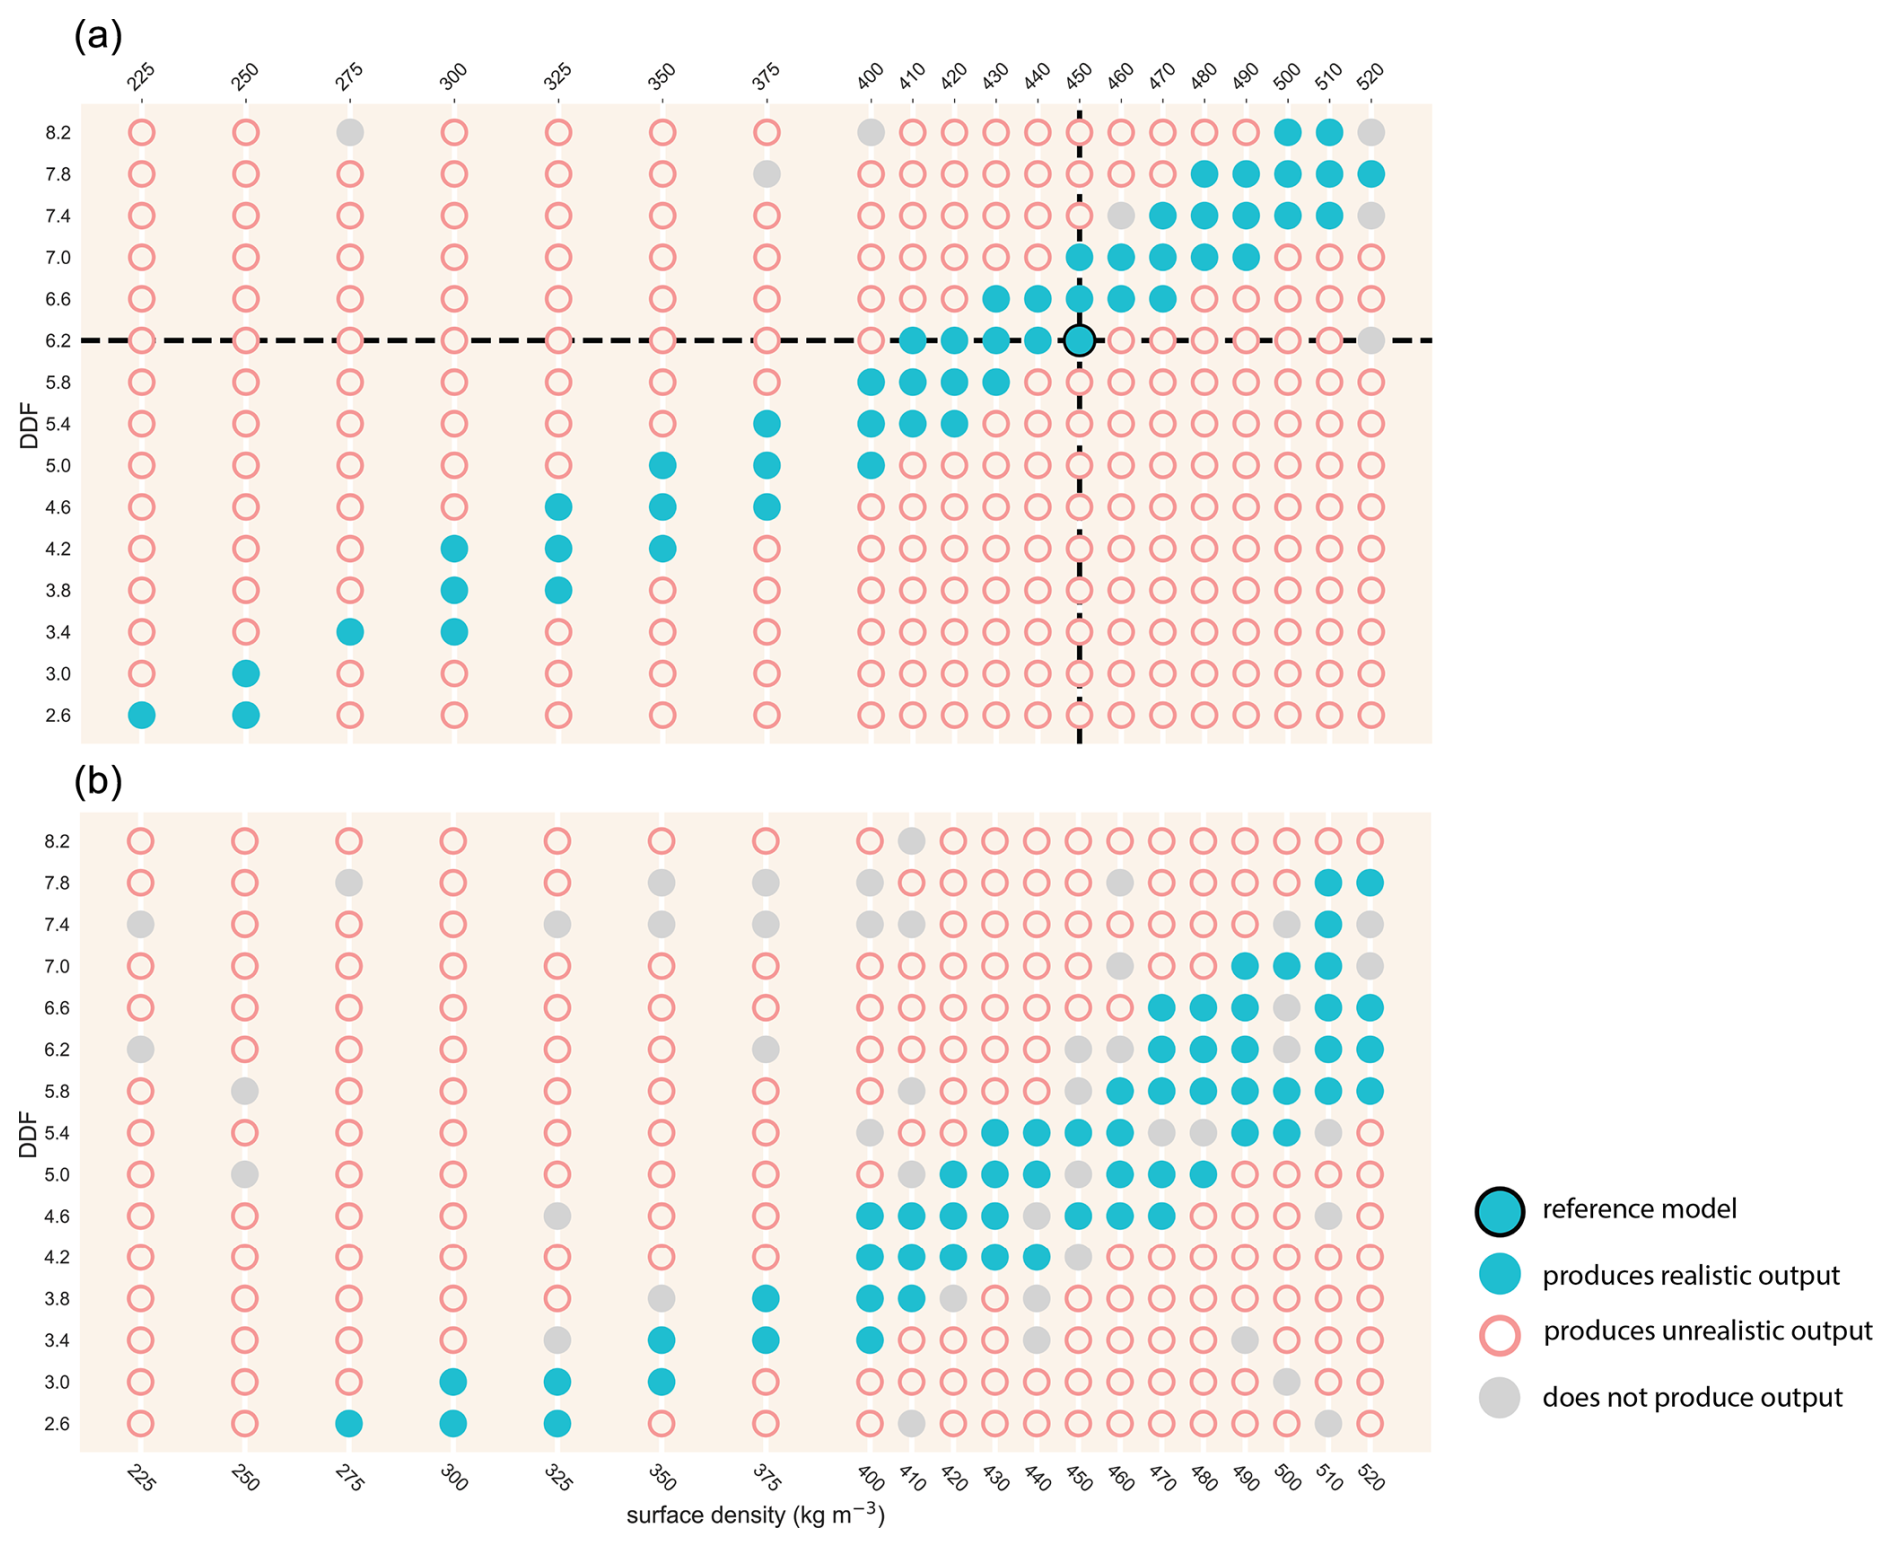
Figure B4Degree day factor (DDF) and surface density pairings that produce realistic (blue filled circles), unrealistic (pink open circles), and no (gray filled circles) outputs at Eclipse. Panel (a) shows model runs spun up with downscaled NARR temperatures. Panel (b) shows model runs spun up with temperature values randomly selected from a Gaussian distribution based on elevation-corrected Divide AWS data. A historical warming rate of 0.024 °C a−1 between 1979 and 2016 was applied to these data (Williamson et al., 2020). Our reference model is indicated by the black dashed lines and black-outlined circle.
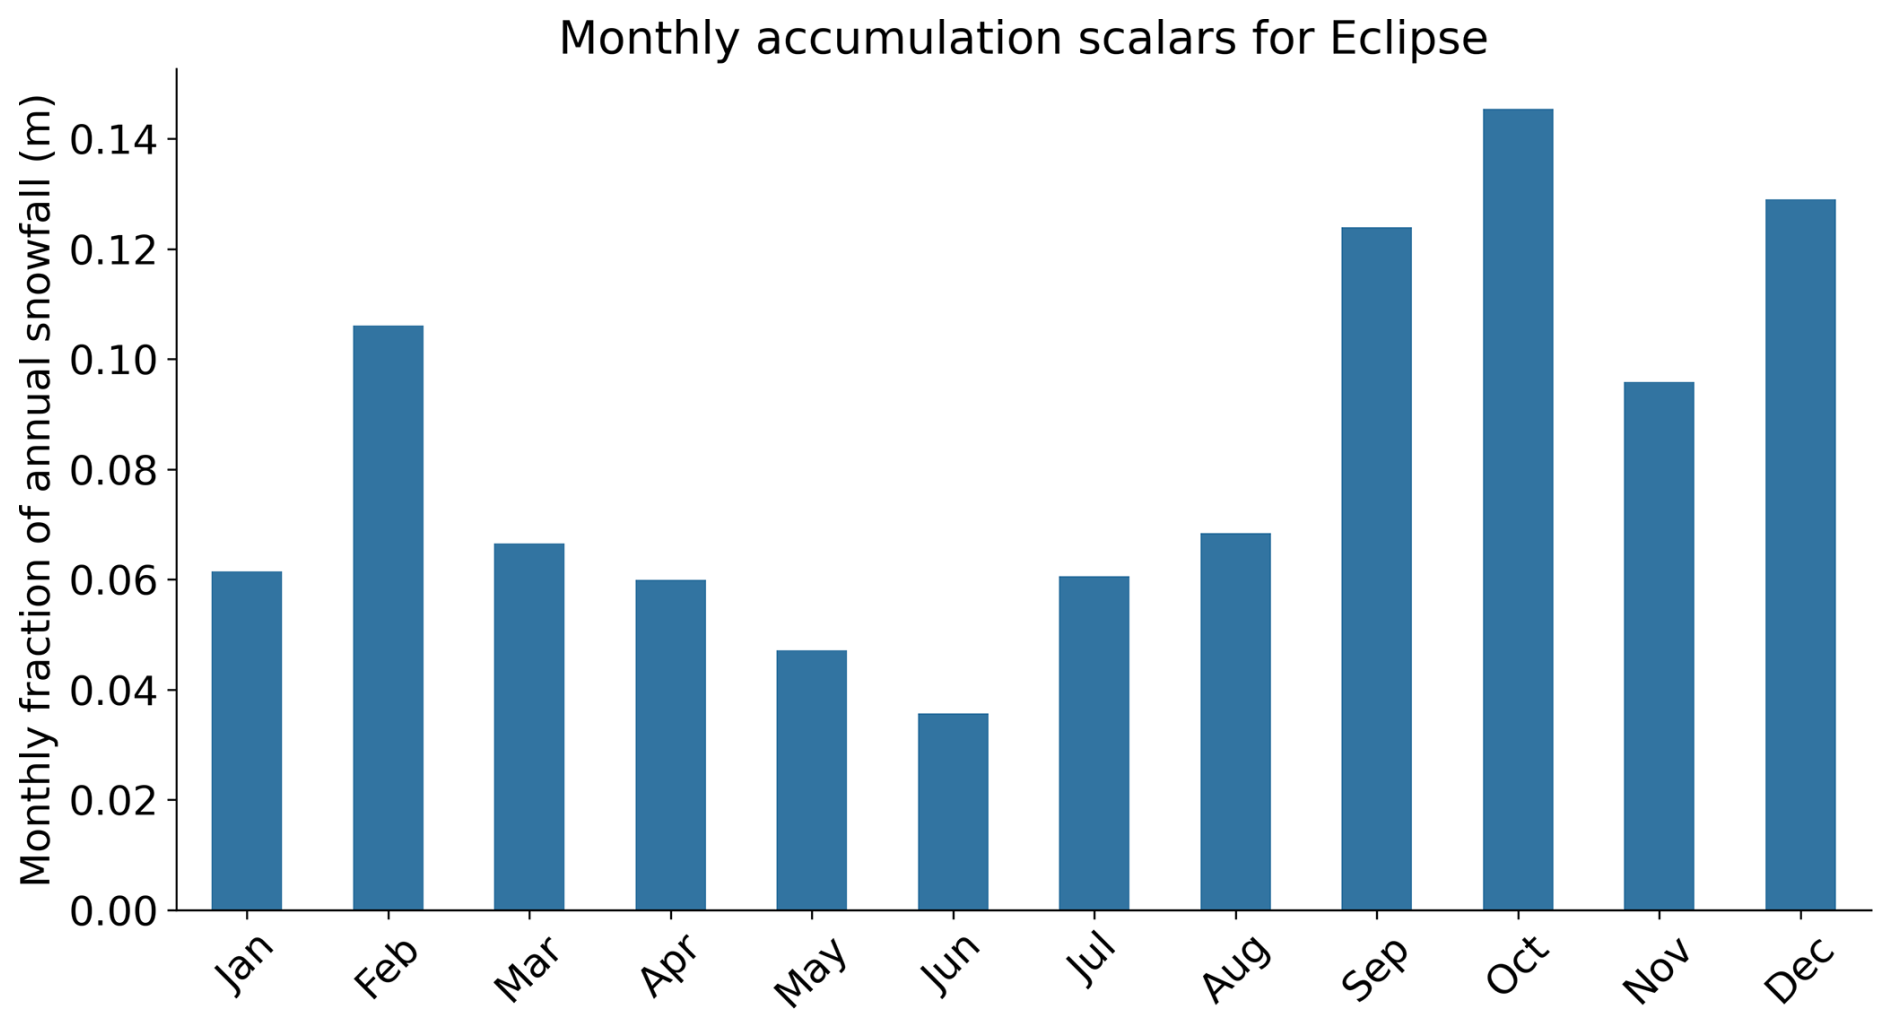
Figure B5Monthly accumulation scalars calculated using an in situ snow accumulation record from Divide. We use 4 years of complete coverage (2004, 2005, 2006, 2008) to compute each month's mean fractional contribution to annual accumulation. We compute the fractional contribution to total positive surface change (ignoring ablation) to represent snowfall rather than net accumulation.
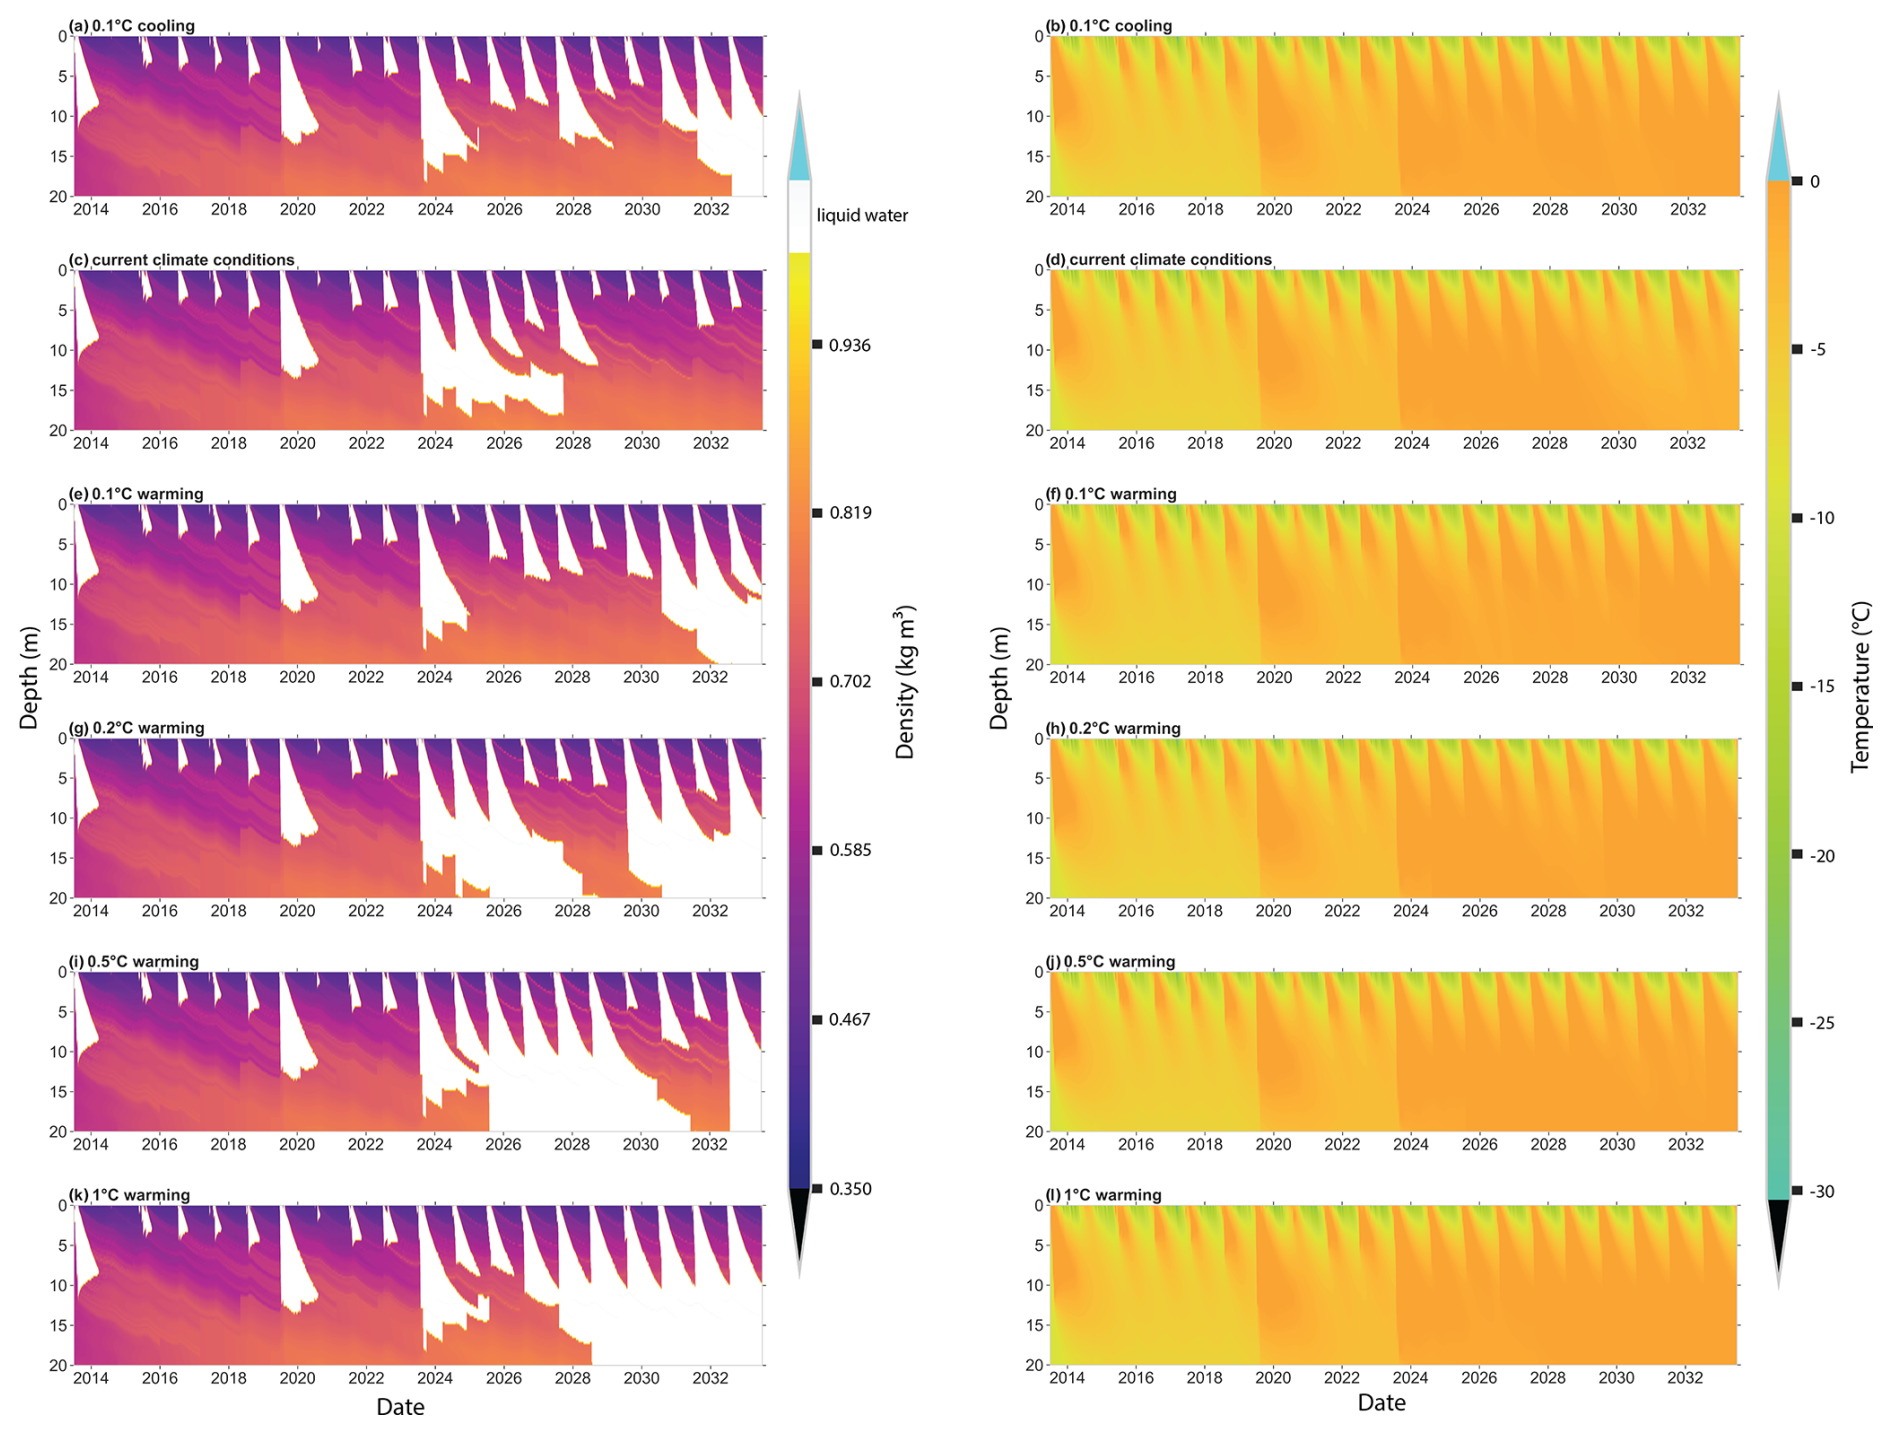
Figure B6Example time series of density, liquid water content, and firn temperature from 2013–2033 under six different climate scenarios: 0.1 °C cooling by 2033 (a–b), continuation of current climate through 2033 (c–d), 0.1 °C warming by 2033 (e–f), 0.2 °C warming by 2033 (g–h), 0.5 °C warming by 2033 (i–j), and 1 °C warming by 2033 (k–l). The right-hand panels show both density and LWC, with density shown by the color bar and white areas indicating the presence of liquid water. All climate scenarios are prescribed using surface temperature values drawn from a Gaussian distribution based on elevation-corrected 2013–2024 AWS data from Divide with the appropriate level of warming or cooling applied.
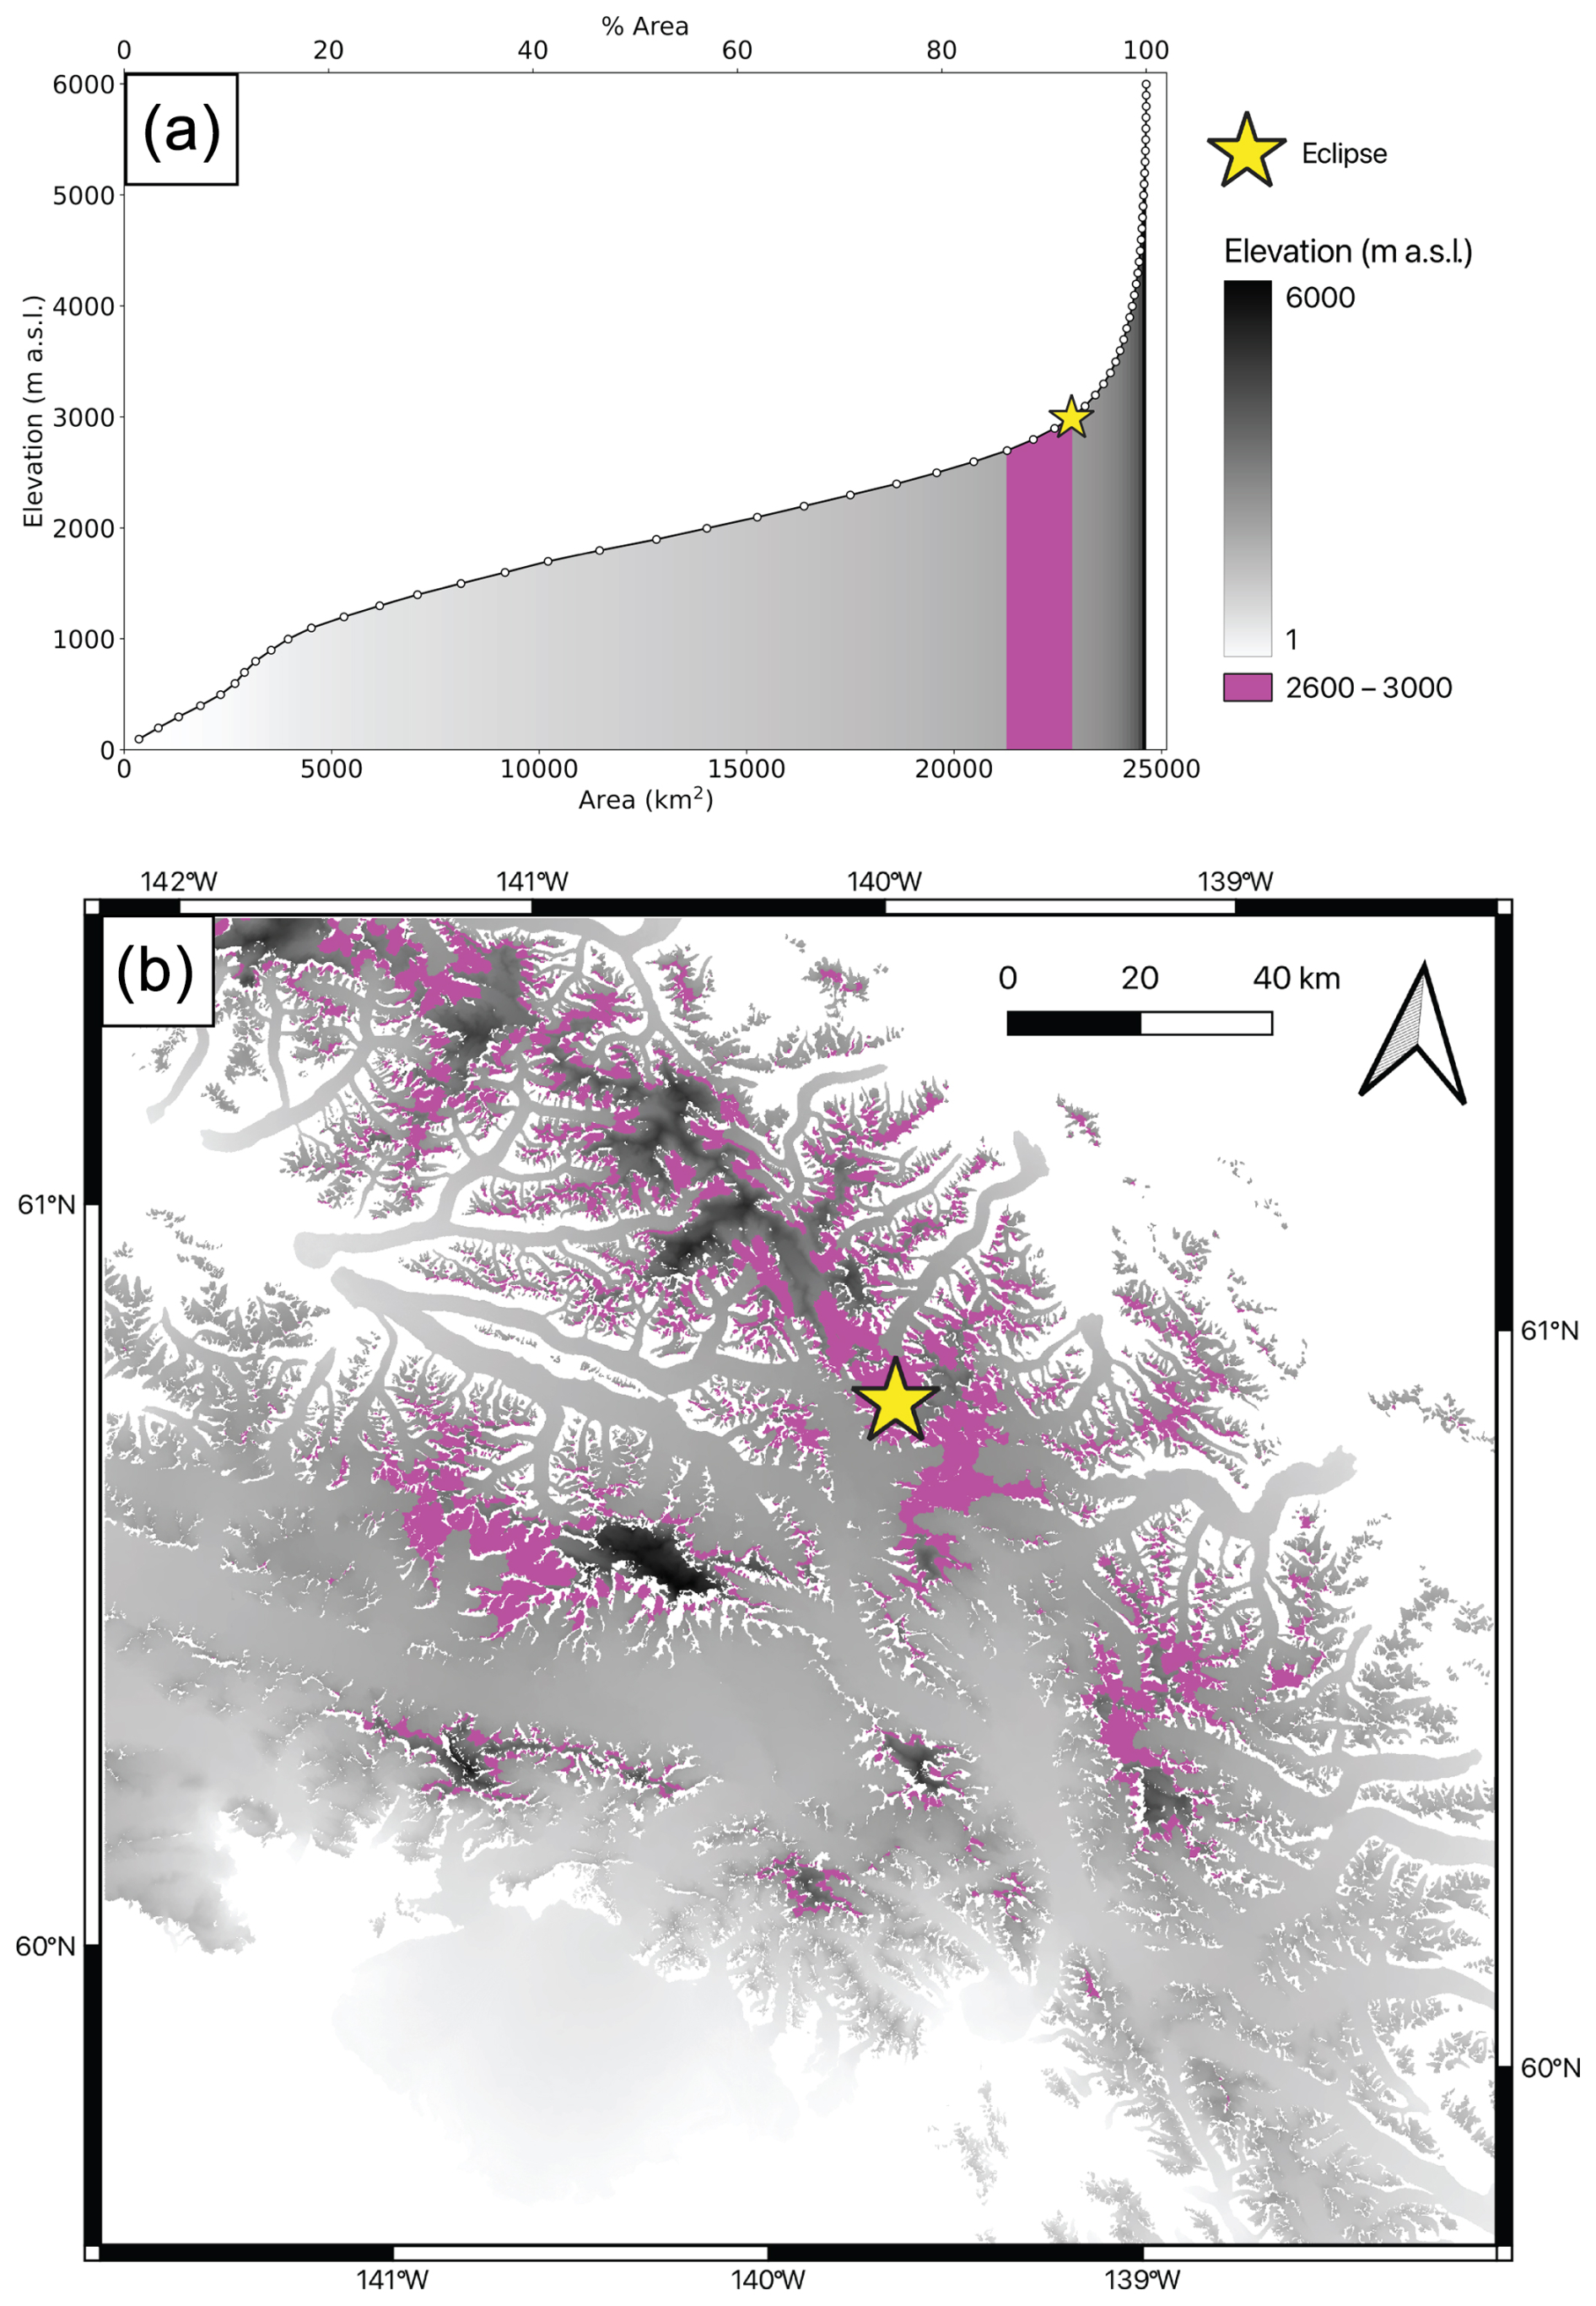
Figure C1Hypsometric curve (a) and elevation map (b) of Eclipse Icefield and the surrounding ice-covered area. Elevation is shown by the grayscale shading, with higher elevations indicated by darker gray. Non-glacierized regions are masked out; areas of pure white should be interpreted as outside our region of analysis. Elevations between 2600 and 3000 m (the approximate elevations of the Kaskawulsh/Hubbard Divide and Eclipse) are shown in magenta. The location of Eclipse is indicated with a yellow star.
Code for the Community Firn Model can be downloaded from GitHub at https://doi.org/10.5281/zenodo.8083362 (Stevens et al., 2023).
Eclipse Icefield 2023 firn core data (density, stratigraphy, borehole temperatures) can be accessed at https://doi.org/10.18739/A2000026Z (Kindstedt et al., 2025). Eclipse 2002 and 2016 borehole temperatures can also be accessed at https://doi.org/10.18739/A2MK65B0F (Kreutz et al., 2025). Ground-penetrating radar data used in this study are part of a more extensive radar dataset that will be published independently; we therefore cannot yet provide public access to these data.
IK, DW, and KK formulated the research goals, hypotheses, and testing methods. IK, ES, MM, RC, and JH participated in fieldwork and data collection. IK completed data analysis with contributions from ES, CMS, MA, and SW. IK prepared the paper with contributions from all co-authors.
The contact author has declared that none of the authors has any competing interests.
Publisher’s note: Copernicus Publications remains neutral with regard to jurisdictional claims made in the text, published maps, institutional affiliations, or any other geographical representation in this paper. While Copernicus Publications makes every effort to include appropriate place names, the final responsibility lies with the authors.
This article is part of the special issue “Northern hydrology in transition – impacts of a changing cryosphere on water resources, ecosystems, and humans (TC/HESS inter-journal SI)”. It is not associated with a conference.
We thank the Kluane, Champagne, and Aishihik, as well as White River First Nations, upon whose traditional territories fieldwork was conducted. We also thank Kluane Lake Research Station and Parks Canada for collaboration and support. Finally, we thank James Minifie, Stefan Bastien, Steven Bernsen, Erik Blake, Seth Campbell, Dan Dixon, William Kochtitzky, Justin Leavitt, Brittany Main, Dorota Medrzycka, Alex Mondrick, Patrick Saylor, and Cameron Wake for their efforts in obtaining field data and Naomi Ochwat for sharing insight from her own field experiences in the region.
This research has been supported by the US NSF award nos. 002470, OPP-0136005, 0240878, and 0713974, as well as AGS-1203838, 1502783, 1806422, and 2002483. The Golden Family Foundation, the Bob and Judy Sturgis Exploration Fund, the Natural Sciences and Engineering Research Council of Canada, the Polar Continental Shelf Program, the American Alpine Club Research Grant, Geophysical Survey Systems Inc., the American Geophysical Union Geophysics Grant, and the University of Maine Graduate Student Government have also supported this research.
This paper was edited by Florent Dominé and reviewed by two anonymous referees.
Albert, M., Koh, G., and Perron, F.: Radar investigations of melt pathways in a natural snowpack, Hydrol. Process., 13, 2991–3000, https://doi.org/10.1002/(SICI)1099-1085(19991230)13:18<2991::AID-HYP10>3.0.CO;2-5, 1999. a
Amory, C., Buizert, C., Buzzard, S., Case, E., Clerx, N., Culberg, R., Datta, R. T., Dey, R., Drews, R., Dunmire, D., Eayrs, C., Hansen, N., Humbert, A., Kaitheri, A., Keegan, K., Munneke, P. K., Lenaerts, J. T. M., Lhermitte, S., Mair, D., McDowell, I., Mejia, J., Meyer, C. R., Morris, E., Moser, D., Oraschewski, F. M., Pearce, E., Husman, S. d. R., Schlegel, N. J., Schultz, T., Simonsen, S. B., Stevens, C. M., Thomas, E. R., Thompson-Munson, M., Wever, N., and Wouters, B.: Firn on ice sheets, Nature Reviews Earth & Environment, 5, 79–99, https://doi.org/10.1038/S43017-023-00507-9, 2024. a, b, c
Bengtsson, L.: Percolation of meltwater through a snowpack, Cold Reg. Sci. Technol., 6, 73–81, https://doi.org/10.1016/0165-232X(82)90046-5, 1982. a
Bezeau, P., Sharp, M., Burgess, D., and Gascon, G.: Firn profile changes in response to extreme 21st-century melting at Devon Ice Cap, Nunavut, Canada, J. Glaciol., 59, 981–991, https://doi.org/10.3189/2013JOG12J208, 2013. a
Burgess, E. W., Forster, R. R., Box, J. E., Mosley-Thompson, E., Bromwich, D. H., Bales, R. C., and Smith, L. C.: A spatially calibrated model of annual accumulation rate on the Greenland Ice Sheet (1958–2007), J. Geophys. Res.-Earth, 115, F02004, https://doi.org/10.1029/2009JF001293, 2010. a
Bøggild, C. E., Forsberg, R., and Reeh, N.: Meltwater retention in a transect across the Greenland ice sheet, Ann. Glaciol., 40, 169–173, https://doi.org/10.3189/172756405781813546, 2005. a
Calonne, N., Milliancourt, L., Burr, A., Philip, A., Martin, C. L., Flin, F., and Geindreau, C.: Thermal Conductivity of Snow, Firn, and Porous Ice From 3-D Image-Based Computations, Geophys. Res. Lett., 46, 13079–13089, https://doi.org/10.1029/2019GL085228, 2019. a
Campbell, S., Kreutz, K., Osterberg, E., Arcone, S., Wake, C., Introne, D., Volkening, K., and Winski, D.: Melt regimes, stratigraphy, flow dynamics and glaciochemistry of three glaciers in the Alaska Range, J. Glaciol., 58, 99–109, https://doi.org/10.3189/2012JOG10J238, 2012. a
Clerx, N., Machguth, H., Tedstone, A., Jullien, N., Wever, N., Weingartner, R., and Roessler, O.: In situ measurements of meltwater flow through snow and firn in the accumulation zone of the SW Greenland Ice Sheet, The Cryosphere, 16, 4379–4401, https://doi.org/10.5194/tc-16-4379-2022, 2022. a
Colbeck, S. C.: A Theory of Water Percolation in Snow, J. Glaciol., 11, 369–385, https://doi.org/10.3189/S0022143000022346, 1972. a
Colbeck, S. C.: An overview of seasonal snow metamorphism, Rev. Geophys., 20, 45–61, https://doi.org/10.1029/RG020I001P00045, 1982. a
Colbeck, S. C. and Parssinen, N.: Regelation and the Deformation of Wet Snow, J. Glaciol., 21, 639–650, https://doi.org/10.3189/S002214300003375X, 1978. a
Cuffey, K. M. and Paterson, W. S. B.: The Physics of Glaciers, Elsevier, 4th edn., ISBN-10: 0-123694-61-2, ISBN-13: 978-0-123-69461-4, 2010. a, b
Culberg, R., Schroeder, D. M., and Chu, W.: Extreme melt season ice layers reduce firn permeability across Greenland, Nat. Commun., 12, 1–9, https://doi.org/10.1038/S41467-021-22656-5, 2021. a, b, c, d, e
Evans, S. L., Flores, A. N., Heilig, A., Kohn, M. J., Marshall, H. P., and McNamara, J. P.: Isotopic evidence for lateral flow and diffusive transport, but not sublimation, in a sloped seasonal snowpack, Idaho, USA, Geophys. Res. Lett., 43, 3298–3306, https://doi.org/10.1002/2015GL067605, 2016. a
Fierz, C., Armstrong, R. L., Durand, Y., Etchevers, P., Greene, E., McClung, D. M., Nishimura, K., Satyawali, P. K., and Sokratov, S. A.: The International classification for seasonal snow on the ground, https://unesdoc.unesco.org/ark:/48223/pf0000186462 (last access: 14 November 2024), 2009. a, b
Fisher, D. A., Wake, C., Kreutz, K., Yalcin, K., Steig, E., Mayewski, P., Anderson, L., Zheng, J., Rupper, S., Zdanowicz, C., Demuth, M., Waszkiewicz, M., Dahl-Jensen, D., Goto-Azuma, K., Bourgeois, J. B., Koerner, R. M., Sekerka, J., Osterberg, E., Abbott, M. B., Finney, B. P., and Burns, S. J.: Stable isotope records from Mount Logan, eclipse ice cores and nearby Jellybean Lake. Water cycle of the North Pacific over 2000 years and over five vertical kilometres: Sudden shifts and tropical connections, Geogr. Phys. Quatern., 58, 337–352, https://doi.org/10.7202/013147AR, 2004. a
Fountain, A. G.: The Storage of Water in, and Hydraulic Characteristics of, the Firn of South Cascade Glacier, Washington State, U.S.A., Ann. Glaciol., 13, 69–75, https://doi.org/10.3189/S0260305500007667, 1989. a, b
Grew, E. and Mellor, M.: High snowfields of the St. Elias Mountains, Yukon Territory, Canada, DA project no. ILO13001A91A, 1966. a
Hannah, D. M., Gurnell, A. M., and McGregor, G. R.: Spatio-temporal variation in microclimate, the surface energy balance and ablation over a cirque glacier, Int. J. Climatol., 20, 733–758, https://doi.org/10.1002/1097-0088(20000615)20:7<733::AID-JOC490>3.0.CO;2-F, 2000. a
Harper, J., Humphrey, N., Pfeffer, W. T., Brown, J., and Fettweis, X.: Greenland ice-sheet contribution to sea-level rise buffered by meltwater storage in firn, Nature, 491, 240–243, https://doi.org/10.1038/NATURE11566, 2012. a, b, c
Hawley, R. L., Neumann, T. A., Stevens, C. M., Brunt, K. M., and Sutterley, T. C.: Greenland Ice Sheet Elevation Change: Direct Observation of Process and Attribution at Summit, Geophys. Res. Lett., 47, e2020GL088864, https://doi.org/10.1029/2020GL088864, 2020. a
Hill, T., Dow, C. F., Bash, E. A., and Copland, L.: Application of an improved surface energy balance model to two large valley glaciers in the St. Elias Mountains, Yukon, J. Glaciol., 67, 297–312, https://doi.org/10.1017/JOG.2020.106, 2021. a, b
Horlings, A. N., Christianson, K., and Miège, C.: Expansion of Firn Aquifers in Southeast Greenland, J. Geophys. Res.-Earth, 127, e2022JF006753, https://doi.org/10.1029/2022JF006753, 2022. a, b, c
Humphrey, N. F., Harper, J. T., and Pfeffer, W. T.: Thermal tracking of meltwater retention in Greenland's accumulation area, J. Geophys. Rese.-Earth, 117, 1010, https://doi.org/10.1029/2011JF002083, 2012. a
Immerzeel, W. W., Lutz, A. F., Andrade, M., Bahl, A., Biemans, H., Bolch, T., Hyde, S., Brumby, S., Davies, B. J., Elmore, A. C., Emmer, A., Feng, M., Fernández, A., Haritashya, U., Kargel, J. S., Koppes, M., Kraaijenbrink, P. D. A., Kulkarni, A. V., Mayewski, P. A., Nepal, S., Pacheco, P., Painter, T. H., Pellicciotti, F., Rajaram, H., Rupper, S., Sinisalo, A., Shrestha, A. B., Viviroli, D., Wada, Y., Xiao, C., Yao, T., and Baillie, J. E. M.: Importance and vulnerability of the world’s water towers, Nature, 577, 364–369, https://doi.org/10.1038/S41586-019-1822-Y, 2019. a
Jansson, P., Hock, R., and Schneider, T.: The concept of glacier storage: a review, J. Hydrol., 282, 116–129, https://doi.org/10.1016/S0022-1694(03)00258-0, 2003. a
Jarosch, A. H., Anslow, F. S., and Clarke, G. K. C.: High-resolution precipitation and temperature downscaling for glacier models, Clim. Dynam., 38, 391–409, https://doi.org/10.1007/s00382-010-0949-1, 2012. a, b
Jordan, R.: Effects of Capillary Discontinuities on Water Flow and Water Retention in Layered Snowcovers, Defence Sci. J., 45, 79–91, 1995. a
Kelsey, E. P., Wake, C. P., Yalcin, K., and Kreutz, K.: Eclipse ice core accumulation and stable isotope variability as an indicator of North Pacific climate, J. Climate, 25, 6426–6440, https://doi.org/10.1175/JCLI-D-11-00389.1, 2012. a
Kindstedt, I., Skelton, E., Mannello, M., and Clavette, R.: Eclipse Icefield (Yukon, Canada) June 2023 firn core stratigraphy, density, and borehole temperatures, Arctic Data Center [data set], https://doi.org/10.18739/A2000026Z, 2025. a
Kochtitzky, W., Winski, D., McConnell, E., Kreutz, K., Campbell, S., Enderlin, E. M., Copland, L., Williamson, S., Main, B., and Jiskoot, H.: Climate and surging of Donjek Glacier, Yukon, Canada, Arct. Antarct. Alp. Res., 52, 264–280, https://doi.org/10.1080/15230430.2020.1744397, 2020. a, b, c
Koenig, L. S., Miège, C., Forster, R. R., and Brucker, L.: Initial in situ measurements of perennial meltwater storage in the Greenland firn aquifer, Geophys. Res. Lett., 41, 81–85, https://doi.org/10.1002/2013GL058083, 2014. a, b
Kreutz, K., Campbell, S., Winski, D., Dixon, D., and Wake, C.: Eclipse Icefield (Yukon, Canada) 2002 and 2016 borehole temperature data, Arctic Data Center [data set], https://doi.org/10.18739/A2MK65B0F, 2025. a
Kuipers Munneke, P., Ligtenberg, S. R. M., Noël, B. P. Y., Howat, I. M., Box, J. E., Mosley-Thompson, E., McConnell, J. R., Steffen, K., Harper, J. T., Das, S. B., and van den Broeke, M. R.: Elevation change of the Greenland Ice Sheet due to surface mass balance and firn processes, 1960–2014, The Cryosphere, 9, 2009–2025, https://doi.org/10.5194/tc-9-2009-2015, 2015. a, b
Lilien, D. A., Hills, B. H., Driscol, J., Jacobel, R., and Christianson, K.: ImpDAR: an open-source impulse radar processor, Ann. Glaciol., 61, 114–123, https://doi.org/10.1017/AOG.2020.44, 2020. a, b
MacFerrin, M., Machguth, H., As, D. v., Charalampidis, C., Stevens, C. M., Heilig, A., Vandecrux, B., Langen, P. L., Mottram, R., Fettweis, X., Broeke, M. R. v. d., Pfeffer, W. T., Moussavi, M. S., and Abdalati, W.: Rapid expansion of Greenland’s low-permeability ice slabs, Nature, 573, 403–407, https://doi.org/10.1038/S41586-019-1550-3, 2019. a, b, c, d
Machguth, H., Macferrin, M., As, D. V., Box, J. E., Charalampidis, C., Colgan, W., Fausto, R. S., Meijer, H. A. J., Mosley-Thompson, E., and van de Wal, R. S. W.: Greenland meltwater storage in firn limited by near-surface ice formation, Nat. Clim. Change, 6, 390–393, https://doi.org/10.1038/NCLIMATE2899, 2016. a, b
Marcus, M. G. and Ragle, R. H.: Snow Accumulation in the Icefield Ranges, St. Elias Mountains, Yukon, Arctic Alpine Res., 2, 277–292, https://doi.org/10.1080/00040851.1970.12003587, 1970. a
Marsh, P. and Woo, M.-K.: Wetting front advance and freezing of meltwater within a snow cover: 1. Observations in the Canadian Arctic, Water Resour. Res., 20, 1853–1864, https://doi.org/10.1029/WR020I012P01853, 1984. a
McConnell, E. A.: Mechanisms of Ice Core Stable Isotope Variability in the Upper Kaskawulsh-Donjek Region, St. Elias Mountains, Yukon, Canada, https://digitalcommons.library.umaine.edu/etd/3069 (last access: 14 November 2024), 2019. a, b, c, d, e, f, g, h
McDowell, I. E., Keegan, K. M., Wever, N., Osterberg, E. C., Hawley, R. L., and Marshall, H. P.: Firn Core Evidence of Two-Way Feedback Mechanisms Between Meltwater Infiltration and Firn Microstructure From the Western Percolation Zone of the Greenland Ice Sheet, J. Geophys. Res.-Earth, 128, e2022JF006752, https://doi.org/10.1029/2022JF006752, 2023. a, b
Mernild, S. H., Hasholt, B., and Liston, G. E.: Water flow through Mittivakkat Glacier, Ammassalik Island, SE Greenland, Geogr. Tidsskr., 106, 25–43, https://doi.org/10.1080/00167223.2006.10649543, 2006. a
Miller, J. B., Frisbee, M. D., Hamilton, T. L., and Murugapiran, S. K.: Recharge from glacial meltwater is critical for alpine springs and their microbiomes, Environ. Res. Lett., 16, 064012, https://doi.org/10.1088/1748-9326/ABF06B, 2021. a
Miller, M. M.: The terms ”Névé” and ”Firn”, J. Glaciol., 2, 150–151, https://doi.org/10.3189/S0022143000034195, 1952. a
Miège, C., Forster, R. R., Brucker, L., Koenig, L. S., Solomon, D. K., Paden, J. D., Box, J. E., Burgess, E. W., Miller, J. Z., McNerney, L., Brautigam, N., Fausto, R. S., and Gogineni, S.: Spatial extent and temporal variability of Greenland firn aquifers detected by ground and airborne radars, J. Geophys. Res.-Earth, 121, 2381–2398, https://doi.org/10.1002/2016JF003869, 2016. a, b
Montgomery, L., Koenig, L., Lenaerts, J. T. M., and Munneke, P. K.: Accumulation rates (2009–2017) in Southeast Greenland derived from airborne snow radar and comparison with regional climate models, Ann. Glaciol., 61, 225–233, https://doi.org/10.1017/AOG.2020.8, 2020. a
Moran, T. and Marshall, S.: The effects of meltwater percolation on the seasonal isotopic signals in an Arctic snowpack, J. Glaciol., 55, 1012–1024, https://doi.org/10.3189/002214309790794896, 2009. a
Ochwat, N. E., Marshall, S. J., Moorman, B. J., Criscitiello, A. S., and Copland, L.: Evolution of the firn pack of Kaskawulsh Glacier, Yukon: meltwater effects, densification, and the development of a perennial firn aquifer, The Cryosphere, 15, 2021–2040, https://doi.org/10.5194/tc-15-2021-2021, 2021. a, b, c, d, e, f, g, h, i, j, k, l
Polashenski, C., Courville, Z., Benson, C., Wagner, A., Chen, J., Wong, G., Hawley, R., and Hall, D.: Observations of pronounced Greenland ice sheet firn warming and implications for runoff production, Geophys. Res. Lett., 41, 4238–4246, https://doi.org/10.1002/2014GL059806, 2014. a
Samimi, S. and Marshall, S. J.: Diurnal cycles of meltwater percolation, refreezing, and drainage in the supraglacial snowpack of Haig Glacier, Canadian Rocky Mountains, Front. Earth Sci., 5, 6, https://doi.org/10.3389/FEART.2017.00006, 2017. a
Schneider, T.: Water movement in the firn of Storglaciären, Sweden, J. Glaciol., 45, 286–294, https://doi.org/10.3189/S0022143000001787, 1999. a, b
Sommerfeld, R. A., La, E., Hape, C., and Le, L.: The Classification of Snow Metamorphism, J. Glaciol., 9, 3–18, https://doi.org/10.3189/S0022143000026757, 1970. a, b, c
Stevens, C. M., Verjans, V., Lundin, J. M. D., Kahle, E. C., Horlings, A. N., Horlings, B. I., and Waddington, E. D.: The Community Firn Model (CFM) v1.0, Geosci. Model Dev., 13, 4355–4377, https://doi.org/10.5194/gmd-13-4355-2020, 2020. a
Stevens, M., Vo, H., emmakahle, Jboat, and oraschewski: UWGlaciology/CommunityFirnModel: Version 2.2.0, v2.2.0, Zenodo [code], https://doi.org/10.5281/zenodo.8083362, 2023. a
Thompson-Munson, M., Kay, J. E., and Markle, B. R.: Greenland's firn responds more to warming than to cooling, The Cryosphere, 18, 3333–3350, https://doi.org/10.5194/tc-18-3333-2024, 2024. a, b
Vandecrux, B., Fausto, R. S., Box, J. E., Covi, F., Hock, R., Rennermalm, Å. K., Heilig, A., Abermann, J., van As, D., Bjerre, E., Fettweis, X., Smeets, P. C. J. P., Kuipers Munneke, P., van den Broeke, M. R., Brils, M., Langen, P. L., Mottram, R., and Ahlstrøm, A. P.: Recent warming trends of the Greenland ice sheet documented by historical firn and ice temperature observations and machine learning, The Cryosphere, 18, 609–631, https://doi.org/10.5194/tc-18-609-2024, 2024. a
Wake, C. P., Yalcin, K., and Gundestrup, N. S.: The climate signal recorded in the oxygen-isotope, accumulation and major-ion time series from the Eclipse ice core, YukonTerritory, Canada, Ann. Glaciol., 35, 416–422, https://doi.org/10.3189/172756402781817266, 2002. a
Williamson, S. N., Zdanowicz, C., Anslow, F. S., Clarke, G. K. C., Copland, L., Danby, R. K., Flowers, G. E., Holdsworth, G., Jarosch, A. H., and Hik, D. S.: Evidence for elevation-dependent warming in the St. Elias Mountains, Yukon, Canada, J. Climate, 33, 3253–3269, https://doi.org/10.1175/JCLI-D-19-0405.1, 2020. a, b, c, d, e, f
Winski, D., Kreutz, K., Osterberg, E., Campbell, S., and Wake, C.: High-frequency observations of melt effects on snowpack stratigraphy, Kahiltna Glacier, Central Alaska Range, Hydrol. Process., 26, 2573–2582, https://doi.org/10.1002/HYP.9348, 2012. a
Winski, D., Osterberg, E., Kreutz, K., Wake, C., Ferris, D., Campbell, S., Baum, M., Bailey, A., Birkel, S., Introne, D., and Handley, M.: A 400-Year Ice Core Melt Layer Record of Summertime Warming in the Alaska Range, J. Geophys. Res.-Atmos., 123, 3594–3611, https://doi.org/10.1002/2017JD027539, 2018. a
Yalcin, K., Wake, C. P., Kreutz, K. J., Germani, M. S., and Whitlow, S. I.: Ice core evidence for a second volcanic eruption around 1809 in the Northern Hemisphere, Geophys. Res. Lett., 33, L14706, https://doi.org/10.1029/2006GL026013, 2006. a, b, c
Yalcin, K., Wake, C. P., Kreutz, K. J., Germani, M. S., and Whitlow, S. L.: Ice core paleovolcanic records from the St. Elias Mountains, Yukon, Canada, J. Geophys. Res.-Atmos., 112, D08102, https://doi.org/10.1029/2006JD007497, 2007. a
- Abstract
- Introduction
- Methods
- Results
- Discussion
- Conclusions
- Appendix A: Photos of representative firn core sections
- Appendix B: Community Firn Model setup, sensitivity tests, and example output
- Appendix C: Hypsometry of St. Elias
- Code availability
- Data availability
- Author contributions
- Competing interests
- Disclaimer
- Special issue statement
- Acknowledgements
- Financial support
- Review statement
- References