the Creative Commons Attribution 4.0 License.
the Creative Commons Attribution 4.0 License.
 | 08 Sep 2025
Enhanced MODIS-derived ice physical properties within the Common Land Model (CoLM) revealing bare-ice–snow albedo feedback over Greenland
Shuyang Guo
Yongjiu Dai
Hua Yuan
Hongbin Liang
Under global warming, the Greenland Ice Sheet (GrIS) is experiencing unprecedented mass loss. One key contributing factor is the change in snow and ice albedo, which is closely related to firn metamorphism. To investigate the impact of bare-ice microstructure changes on the regional warming of the GrIS ablation zone, SNICAR-ADv4 (Snow, Ice, and Aerosol Radiative Model Adding–Doubling version 4), a physically based radiative transfer model, is incorporated in the Common Land Model version 2024 (CoLM2024). It allows the land surface model to represent the ice albedo with changes in ice properties rather than using a constant ice albedo value. Quality control was conducted on the bare-ice physical property dataset input into CoLM, with multiple MODIS products combined to ensure accuracy. The application of SNICAR-ADv4 reduced the overestimation of shortwave broadband albedo by 38 %, with a bias of 0.053. Further sensitivity experiments indicate that the summer albedo in the bare-ice region is reduced by 0.032 due to the bare-ice metamorphism, producing a 2 m temperature forcing of 0.071 °C, a snow cover change of −0.011, and a snow water equivalent forcing of −1.345 mm. These changes lead to increased bare-ice exposure, further reducing albedo and enhancing solar radiation absorption by the surface, thereby reinforcing a positive feedback mechanism, which we term the bare-ice–snow albedo feedback. This highlights the critical role of bare-ice physical properties in amplifying melt through the bare-ice–snow albedo feedback, with stronger feedbacks expected in a fully coupled land–atmosphere model.
- Article
(9149 KB) - Full-text XML
-
Supplement
(4161 KB) - BibTeX
- EndNote


The Greenland Ice Sheet (GrIS) has been melting at a rapid pace since the 1990s, losing around 255 Gt of ice annually in 2003–2016 (Sasgen et al., 2020; Li et al., 2022; van den Broeke et al., 2017). The decreasing mass balance of the GrIS and peripheral glaciers is the most significant cryospheric factor driving sea level rise, contributing over 25 % of observed global sea level rise (Chen et al., 2017; Ryan et al., 2019). The total mass loss from GrIS consists of two components: surface runoff and frontal ablation occurring at the terminus of outlet glaciers (Cogley et al., 2011, Kochtitzky et al., 2023). Surface losses have exceeded dynamical losses in contributing to GrIS mass loss since 2000, with 55 % of Greenland's total mass loss attributed to surface mass balance (SMB) and 45 % to the discharge of outlet glaciers between 2000–2018 (Mouginot et al., 2019). These melting processes are driven by a combination of factors, including atmospheric warming, a reduced water retention capacity of firn due to densification, and a lower surface albedo (Hofer et al., 2017; King et al., 2020; Ryan, 2024).
Ice melt on the surface of the GrIS is partially regulated by the surface albedo. It serves as a fundamental parameter in controlling the absorption of insolation by the ice sheet (Box et al., 2012; Naegeli et al., 2017; Feng et al., 2024). A minor change in snow and ice surface albedo can exert a substantial effect on the energy budget of the regional surface air system, causing significant fluctuations in the energy flux on the surface of the GrIS (Nolin and Stroeve, 1997). Surfaces with high albedo, such as fresh snow, efficiently reflect solar radiation, whereas darker areas, such as glacier ice, absorb the majority of incoming shortwave energy (Whicker-Clarke et al., 2022). Snow albedo and ice albedo vary with the spatial distribution of snow, ice, and biotic and abiotic light-absorbing constituents (LACs) and further evolve with the melting of snowpack and glacier surfaces through the spring and summer. Fluctuations in the snowline dictate the relative extent of dark bare ice versus brighter snow (Ryan et al., 2019). These directly influence GrIS surface melt through the exposure of bare ice (Antwerpen et al., 2022) and the processes that darken bare ice itself (Chevrollier et al., 2023). Dark-bare-ice extent closely tracks interannual variations in snowline elevation and is exposed as the snowline retreats further inland during the melt season, leading to the reduction in ice sheet albedo and the intensified melt. This positive feedback has been referred to as the “melt-albedo feedback” (Ryan et al., 2019).
In the preceding decades, polar amplification has contributed to the progressive darkening of the GrIS and the prolongation of the melt season, both of which serve as positive feedback mechanisms that intensify surface melt (Tedesco et al., 2016). As the warming occurs over the ice surface, bare-ice albedo is reduced through melt processes that darken the ice surface. Notably, these processes include the exposure of dust layers, the pooling of surface meltwater, increased interstitial water content, and liquid-meltwater-induced growth of pigmented ice algal assemblages that inhabit the bare-ice surface (Cook et al., 2020; Stibal et al., 2017; Tedstone et al., 2020; Williamson et al., 2018; Whicker-Clarke et al., 2022). Despite operating over a relatively small area of the ice sheet, it is argued that these bare-ice processes have contributed substantially to an observed reduction in albedo and associated increase in melt across GrIS's ablation zone from 2000 to 2011 (Stibal et al., 2017; Tedstone et al., 2017). This category of physical and biological melt albedo processes that darken bare ice is referred as the “bare ice-albedo feedback” (Ryan et al., 2019). However, the complex and non-linear response of regional snow and ice, particularly in ablation zones, to changes in meteorology and climate highlights the growing necessity to model these surfaces using physical principles rather than relying solely on empirical methods (Box et al., 2012). Therefore, accurately modeling the influence of snow and ice on the albedo of the GrIS becomes increasingly important to capture these dynamics effectively.
The albedo of the cryosphere varies widely depending on the solar zenith angle (SZA), atmospheric conditions, the metamorphic state of the snow and ice, and impurities (He and Flanner, 2020). The Snow, Ice, and Aerosol Radiative Model (SNICAR) is one of the most widely used snowpack radiative transfer models (Flanner et al., 2021). Initially, it combined the theory from Wiscombe and Warren (1980) and Warren and Wiscombe (1980) with the multi-layer two-stream solution from Toon et al. (1989) to enhance the simulation of snow albedo (Flanner et al., 2007). Updates and new features have also been incorporated within SNICAR, including eight species of LACs (Flanner et al., 2007), four snow grain shapes (He et al., 2018), and the black carbon snow and dust snow internal mixing state (Flanner et al., 2012; He et al., 2017, 2019). Dang et al. (2019) developed SNICAR-AD by substituting the tri-diagonal matrix-solution-solving method (Toon et al., 1989) with the delta-Eddington adding–doubling radiative method, as a result of the latter's superior computational stability across varying solar zenith angles and higher computational efficiency (He et al., 2024). To represent ice albedo, Whicker-Clarke et al. (2022) further developed SNICAR-ADv4 by integrating and extending key features from earlier radiative transfer models to achieve more accurate simulations of a spectrally resolved cryospheric column of snow and ice with a refractive boundary while incorporating light-absorbing constituents (LACs), such as black carbon (BC) and algae, into this standalone radiative transfer model. It simulates bare ice using the physical microscopic structure of the ice, including the ice density, the scattering air bubbles within an absorbing ice medium, and a refractive boundary that depicts the refraction across snow–ice interfaces (Briegleb and Light, 2007; Gardner and Sharp, 2010; Mullen and Warren, 1988).
Nevertheless, the ice albedo is typically prescribed as constant values in the visible (VIS) and near-infrared (NIR) spectral regions in Earth system models. For instance, ice albedo is 0.6 in the visible and 0.4 in the NIR in the default version of the Energy Exascale Earth System Model (E3SM) and the Community Earth System Model (CESM) version 2 (Whicker-Clarke et al., 2024). Prescribing constant albedo values does not represent the physical variability in solid ice albedo or its spectral changes under varying conditions. To advance ice radiative transfer modeling in Earth system models, Whicker-Clarke et al. (2024) incorporated SNICAR-ADv4 into the E3SM (specifically its land component, ELM), in which the GrIS ice physical properties are retrieved from the satellite observation data. This enhancement enables more realistic simulations of the GrIS bare-ice albedo and concurrently reveals that the default ELM method overestimates bare-ice albedo by 4 % in the visible and 7 % in the NIR bands. However, the quality information of MODIS albedo products was not considered in the process of acquiring bare-ice properties in their study. Schaaf et al. (2011) noted that the MODIS poor-quality inversions beyond an SZA of 70° are characterized by high noise and often significantly lower than the more stable and consistent values observed at smaller SZAs. Omitting quality flags could, therefore, lead to an underestimation of Greenland's snow/ice albedo and introduce significant uncertainties in the retrieval of bare-ice physical properties. Despite the aforementioned modeling advances, the Common Land Model (CoLM) still uses fixed values to represent ice albedo (0.60 in the visible and 0.40 in the NIR). For the purpose of investigating the impacts of bare-ice metamorphism under polar warming, it is also imperative to incorporate ice radiative transfer techniques into CoLM to enhance albedo modeling with more realistic and physical representations of snow–ice–LAC–radiation interactions.
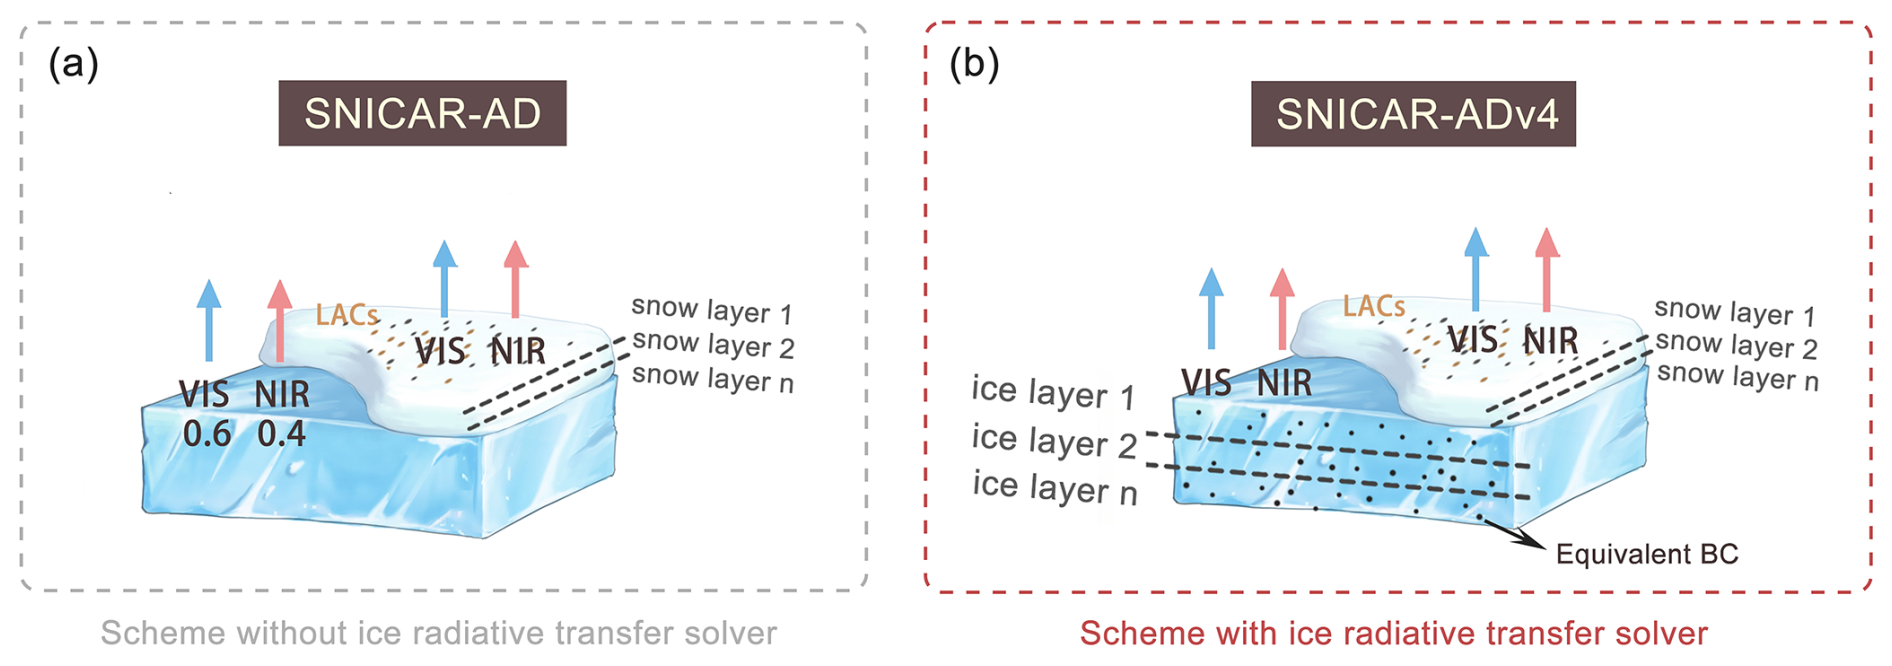
Figure 1Schematic representation of the snow and land ice column in CoLM–SNICAR-AD and CoLM–SNICAR-ADv4.
In this study, we focus on the bare-ice region of the GrIS, characterized by the presence of land ice, and bare ice is exposed by snow melting during the ablation season. The aim of this study is to develop a more reliable dataset of Greenland's bare-ice physical properties by incorporating the quality information of MODIS albedo products and explore the bare-ice albedo feedback associated with the metamorphism of bare ice after the implementation of SNICAR-ADv4 into CoLM. This paper is organized as follows. Section 2 provides descriptions of the CoLM snow and ice albedo schemes and details the model simulations, as well as an explanation of the use of various MODIS products to inform the ice albedo calculations in SNICAR-ADv4. Section 3 compares the differences in albedo simulations with and without an ice radiative transfer solver (SNICAR-AD and SNICAR-ADv4) and quantifies the impact of varying bare-ice properties on the near-surface air temperature and the snow cover. Section 4 is the conclusions and discussion.
2.1 Snow and ice albedo schemes
This study utilizes two distinct implementations of the SNICAR model within CoLM for snow and ice albedo simulations: (i) the baseline SNICAR-AD version (Dang et al., 2019) and (ii) the enhanced SNICAR-ADv4 version (Whicker-Clarke et al., 2024). Both versions adopt identical snow albedo algorithms but exhibit distinct ice albedo treatments. Specifically, as shown in Fig. 1a and b, SNICAR-ADv4 accounts for radiative transfer through the ice column, while SNICAR-AD prescribes ice albedo as constant values: 0.6 for visible (VIS; 0.3–0.7 µm) and 0.4 for near-infrared (NIR; 0.7–5.0 µm) bands. The snow albedo scheme of SNICAR-AD/SNICAR-ADv4 in CoLM computes snow albedo for the multi-layer (up to 5 layers) snowpack with the two stream radiative transfer scheme of the delta-Eddington approximation and adding–doubling technique accounting for the effects of snow properties (e.g., grain size and shape) and LAC contamination on snow albedo.
For snow albedo simulation, the SNICAR-AD/SNICAR-ADv4 model embedded in CoLM uses the physical properties of the snowpack and albedo of the top layer of the underlying ground to determine the column albedo (Flanner and Zender, 2006). The input variables consist of direct and diffuse radiation, the surface downward solar spectrum, the solar zenith angle (for direct radiation), the ground albedo beneath the snowpack, vertical profiles of snow grain size, snow layer thickness and density, aerosol concentrations of each snow layer, and the optical properties of both snow and aerosols. Meanwhile, parameterizations for snow grain shapes (sphere, spheroid, hexagonal plate, and Koch snowflake) and LAC–snow mixing states (BC/dust externally or internally mixed with snow grains) are included to improve the simulations of snow surface energy and water balances (Hao et al., 2023).
For ice albedo modeling, the advent of SNICAR-ADv4 enables us to explore the regional climatic response induced by changes in ice albedo using the ice microphysical properties derived from satellite products. As proposed by Whicker-Clarke et al. (2024), the radiation transfer process within the ice layer can be calculated in the land surface model, which requires input variables such as ice density, air bubble effective radii within the ice, equivalent BC concentrations, and downward solar spectra. The need for air bubble parameters arises from the representation of ice layers as collections of independently scattering air bubbles within a solid ice medium in SNICAR-ADv4, while snow layers are treated as independently scattering ice crystals in an air medium (Picard et al., 2016; Whicker-Clarke et al., 2022).
In addition to the albedo scheme, we briefly describe the physical processes represented by the glacier and snow modules in CoLM to clarify model capabilities. The glacier component is designed to capture essential surface thermodynamic processes, including full surface energy balance calculations and subsurface heat diffusion through a multi-layer ice column. However, it omits several key elements found in more advanced land ice schemes: (1) the model assumes fixed ice thickness and does not track accumulation or ablation, lacking mass-conserving SMB computation; (2) glacier geometry is static, with no coupling to an ice sheet model for dynamic evolution; and (3) meltwater generated from glacier ice is retained rather than routed to runoff, leading to unrealistic surface water storage. In contrast, the snow component in CoLM simulates several critical processes: (1) multi-layer snowpack energy and mass balance, including radiative, turbulent, and conductive heat fluxes; (2) vertical snow temperature evolution and phase changes; (3) melt, liquid water percolation, refreezing, sublimation and snowmelt runoff generation; and (4) snow aging and albedo evolution, with consideration of the impacts of LACs, as represented by SNICAR-AD/SNICAR-ADv4.
2.2 Data
MODIS MCD12C1, MOD09CMG, and MOD10C1 products with consistent 0.05° spatial resolution were utilized for GrIS bare-ice monitoring during the summer melt seasons of 2000–2020. MCD12C1 version 6.1 annual land cover type product (Friedl et al., 2010) provided initial cryospheric classification by excluding grids not categorized as snow or ice. MOD09CMG (Vermote, 2021) band 2 reflectance (0.841–0.876 µm) was employed for bare-ice–snow discrimination, where pixels with reflectance values below 0.6 were classified as bare ice. Comparative spectral analysis of MODIS imagery by Shimada et al. (2016) revealed markedly greater surface reflectance in snow-covered pixels relative to bare ice across all spectral bands, with maximal contrast observed at 0.86 µm. The robustness of this threshold was confirmed by Antwerpen et al. (2022) through comparison with the Landsat 8 Operational Land Imager (OLI), showing a relative error of only 0.16 % in bare-ice classification accuracy. The MOD10C1 product was further used to exclude pixels with a cloud obstruction percentage exceeding 90 % or snow cover fraction above 90 % (Antwerpen et al., 2022; Whicker-Clarke et al., 2024). The derived bare-ice extent was filtered by excluding pixels above the mean equilibrium line altitude of 1679 m a.s.l., defined as the 95th percentile of ablation zone elevations (Antwerpen et al., 2022). This conservative threshold minimizes sporadic high-elevation detections while maintaining a robust estimation of the mean equilibrium line altitude (Antwerpen et al., 2022).
The MODIS MCD43C3 product (Schaaf and Wang, 2021) is used to retrieve bare-ice physical properties using the standalone SNICAR-ADv4 model and to evaluate CoLM-simulated albedo over the GrIS bare-ice regions. This daily product provides spectral (MODIS bands 1 to 7) and broadband (VIS at 0.3–0.7 µm, NIR at 0.7–5.0 µm, and shortwave at 0.3–5.0 µm) black-sky albedo (BSA) and white-sky albedo (WSA) at local solar noon, derived from 16 d of the Aqua–Terra merged surface albedo dataset based on the bidirectional reflectance distribution function (BRDF) algorithm (Schaaf and Wang, 2021). Compared with the GLASS-AVHRR and C3S-v2 albedo products, MCD43C3 demonstrates superior performance for monitoring snow albedo, exhibiting the lowest bias and RMSE over snow and consistent performance across diverse snow cover conditions (Urraca et al., 2022). In the GrIS, MCD43A3 was found to outperform the GLASS albedo product and even the reconstructed albedo based on MOD10A1, for the sites located in the GrIS ablation zone (Ye et al., 2023). In this study, shortwave albedo under direct radiation is treated as equivalent to BSA, in accordance with the widely accepted terminology used in the MCD43C3 product.
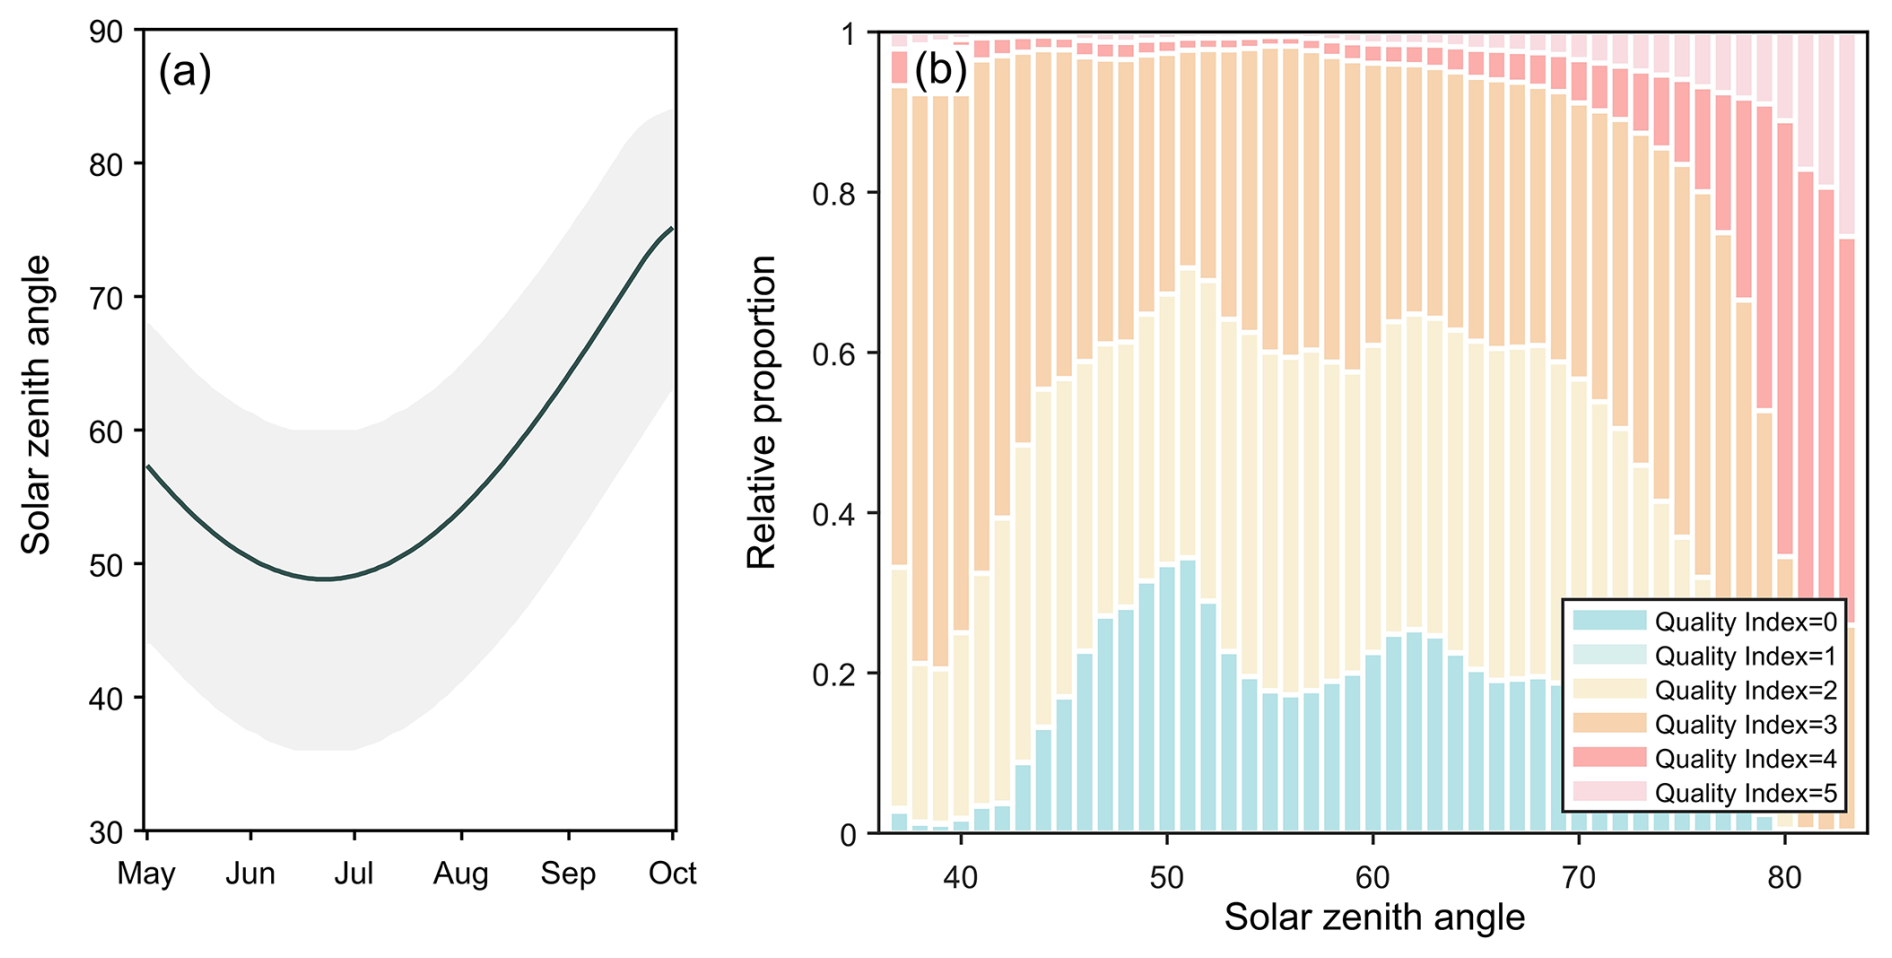
Figure 2(a) Regionally weighted mean SZAs over Greenland at local noon from May to September (solid line). Grey-shaded area represents the range of SZAs over Greenland. (b) Relative proportion of the quality index of the MCD43C3 albedo dataset under different SZAs over Greenland during May to September (0 for best quality and 5 for poorest quality).
Considering the little difference between BSA and WSA for a typical summer day, using BSA is considered acceptable for analyzing the GrIS during the summer (Alexander et al., 2014; Stroeve et al., 2005). The extracted variables in this study from MODIS MCD43C3 include band 2 BSA, broadband BSA (visible, near-infrared, and shortwave), and local noon solar zenith angles (SZAs) and the albedo quality index. The MCD43C3 albedo quality index helps identify regions with cloud cover contamination, detrimental atmospheric conditions, or insufficient observational data. Figure 2a shows the daily variation in the regionally weighted average SZA over Greenland during May–September. The period with SZA > 70° occurs primarily in September. For the relationship between the SZAs of MCD43C3 and their spatiotemporally corresponding albedo quality index (Fig. 2b), it can be seen that the percentage of low-quality indices (4 and 5) rises drastically as the SZA increases at a higher SZA. To ensure reliable satellite-retrieved bare-ice physical properties, we excluded all albedo values identified with a low-quality index (4 or 5), regardless of the SZA. Figure 2b shows that the proportion of low-quality indices increases markedly when the SZA exceeds 70°, indicating that such filtering primarily affects high-SZA retrievals.
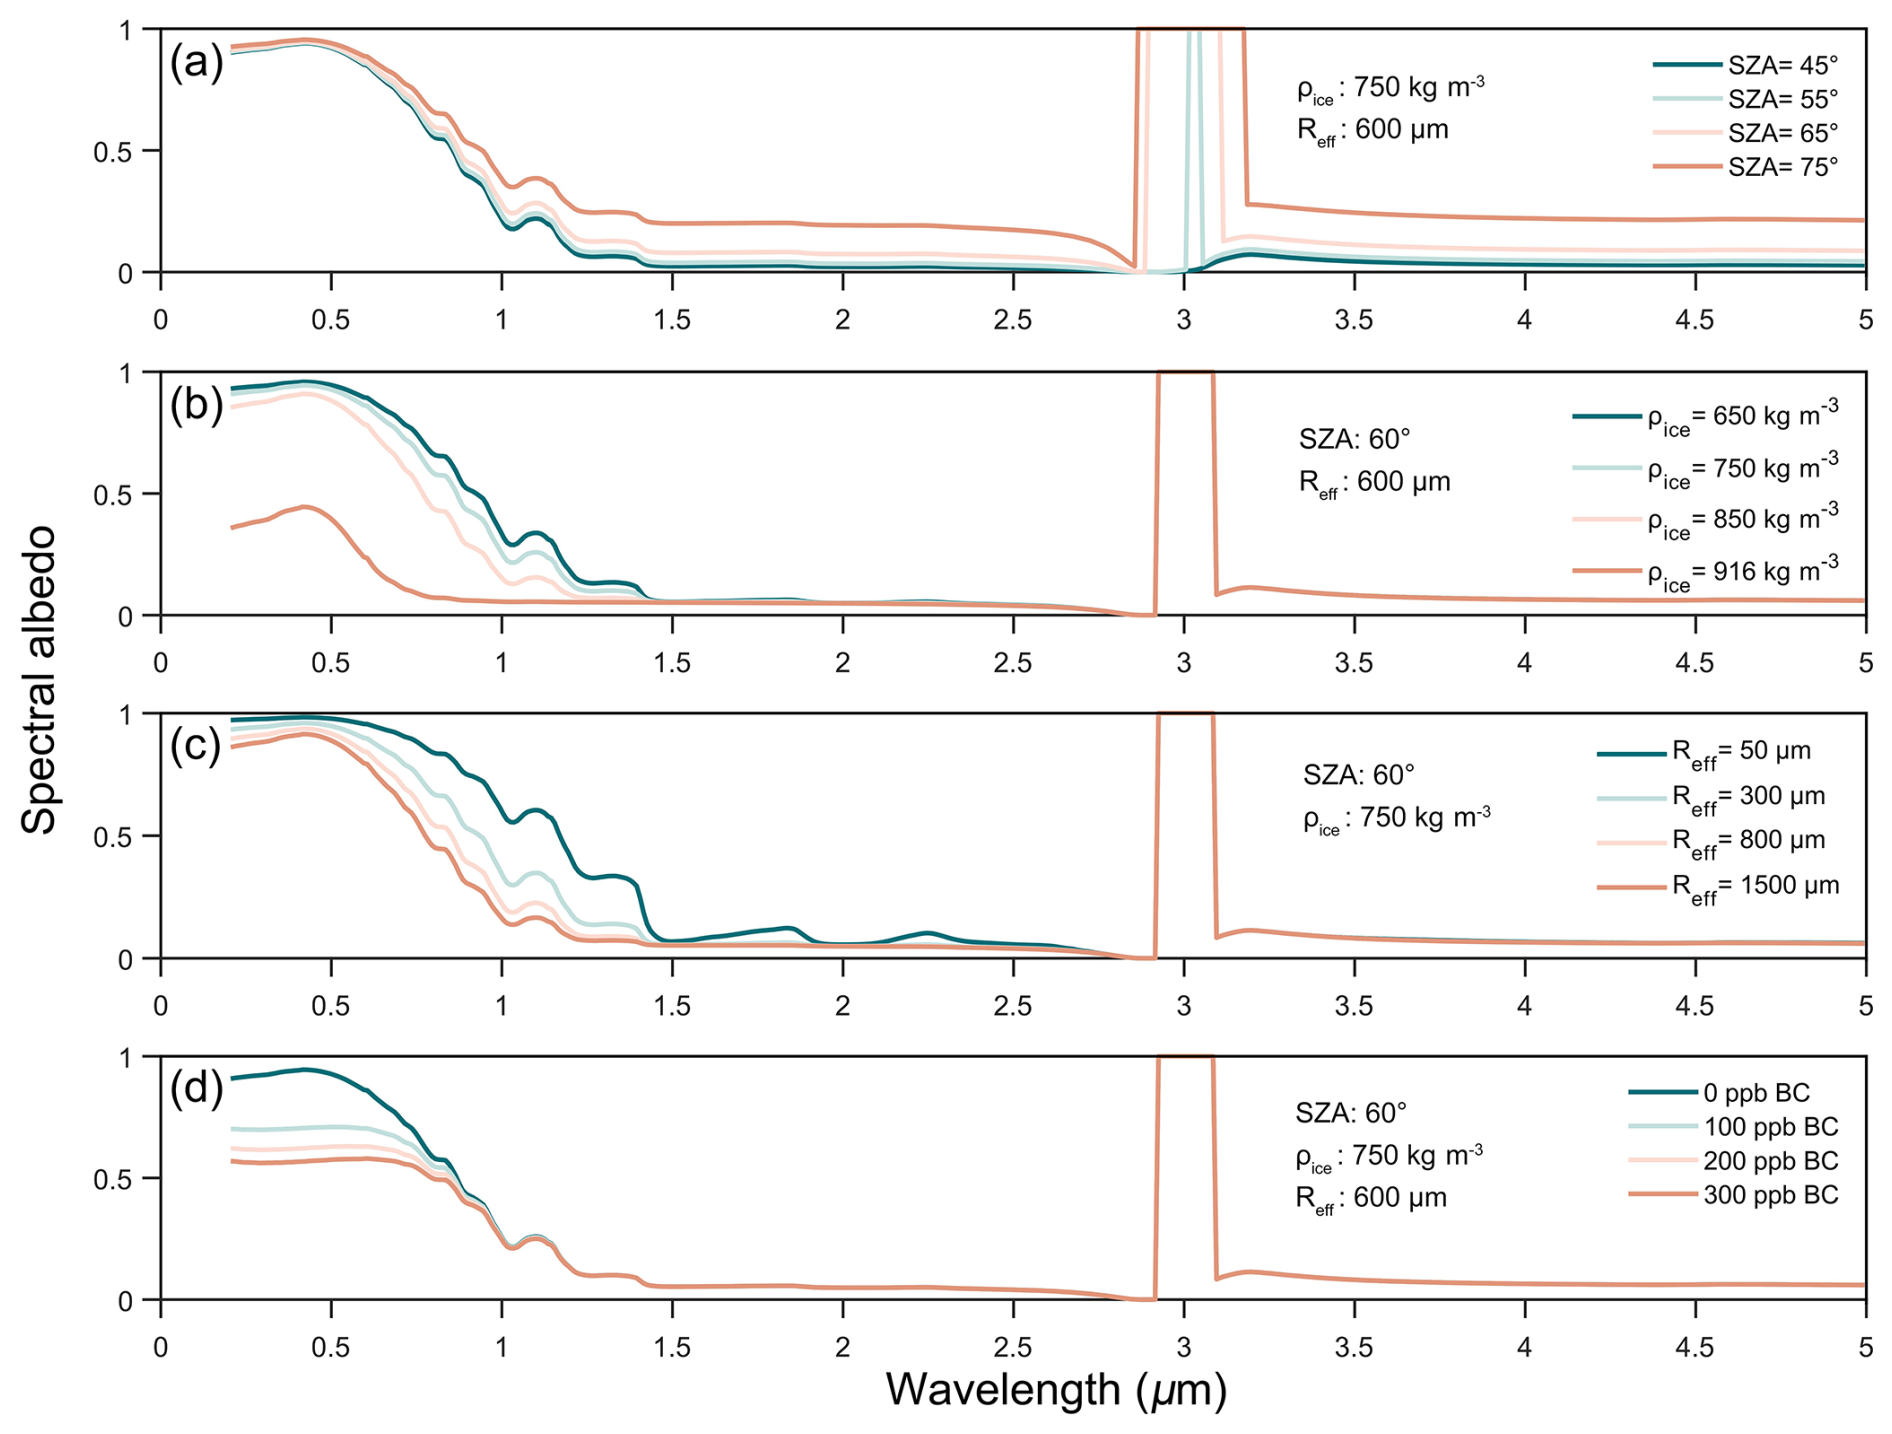
Figure 3Spectral albedo simulated by the standalone SNICAR-ADv4 model under direct incident irradiance with varying levels of (a) SZA, (b) ice density (ρice), (c) the air bubble effective radius, and (d) BC concentration.
2.3 Parameter sensitivity of ice spectral albedo in SNICAR-ADv4
We use the standalone SNICAR-ADv4 model to briefly examine the key factors influencing the spectral albedo of ice under direct illumination conditions. These factors include SZA, ice density, the air bubble effective radius (Reff), and black carbon (BC) concentration. This sensitivity analysis provides a foundation for the subsequent method of obtaining ice physical properties (Sect. 2.4). As shown in Fig. 3a, total internal reflection occurs at wavelengths around 3 µm for an SZA greater than 55° and the wavelength range for total internal reflection expands with the increases in SZAs. This phenomenon occurs for pure and smooth ice surfaces but is not representative of naturally occurring ice, which typically has impurities and rough surfaces. For the dependency of albedo on ice density and the air bubble effective radius, the spectra show that the albedo declines as the ice density and air bubble radius increases since air bubbles within the ice are responsible for the scattering light and smaller bubbles scatter light more efficiently in the visible and near-infrared parts of the spectrum (Fig. 3b and c). Furthermore, BC impacts ice albedo rather uniformly across the visible spectrum and has almost no impact at λ > 1.0 µm (Fig. 3d).
While these controlled simulations clarify the fundamental optical behavior of ice under idealized conditions, natural environments involve more complex interactions shaped by microstructural evolution and meteorological forcing. A synthetic description of bare-ice metamorphism includes the evolution of air bubbles and density: newly fallen snow starts with low density and open pore spaces, which become compacted through wind-driven grain fragmentation and rounding, forming wind slabs. Further densification occurs via grain boundary sliding and pressure-induced deformation, during which air bubbles become sealed and gradually shrink under compression (Tedesco et al., 2016). In ablation zones, these densification processes are coupled with surface metamorphism. Glaciers undergoing melt often develop a porous weathering crust composed of loosely interlocked crystals, formed by differential solar absorption along grain boundaries, a process termed internal ablation (Müller and Keeler, 1969). Under overcast, windy, and warm conditions, this crust is preferentially removed, exposing denser, glazed ice beneath. Temperature-driven grain sintering and densification further reduce specific surface area (SSA) by smoothing and coalescing ice grains (Flanner and Zender, 2006; Hofer et al., 2017). Concurrently, air bubble growth from differential solar heating and subsurface melting continues to modify the microstructure and optical properties of the ice.
2.4 Method
The method for obtaining ice physical properties (ice density, the air bubble effective radius, and equivalent BC) from MODIS bare-ice albedo involves two main steps (Whicker-Clarke et al., 2024). First, as detailed in Sect. 2.2, the bare-ice spatiotemporal distribution was determined through the integrated use of MODIS products, employing MCD12C1 to exclude non-cryospheric pixels, MOD09CMG to distinguish bare ice from snow cover, and MOD10C1 to apply snow and cloud masking. Second, the bare-ice physical properties (ice density and the air bubble effective radius) are retrieved using the physical properties and SZA within the precomputed standalone SNICAR-ADv4 lookup table to match MCD43A3 band 2 BSA. Notably, this step derives only ice density and the air bubble effective radius, whereas equivalent BC concentration requires additional processing steps described later in this section. After obtaining all bare-ice physical properties (ice density, the air bubble effective radius, and equivalent BC concentration), we upscaled the data from a spatial resolution of 0.05° × 0.05° to 0.5° × 0.5°.
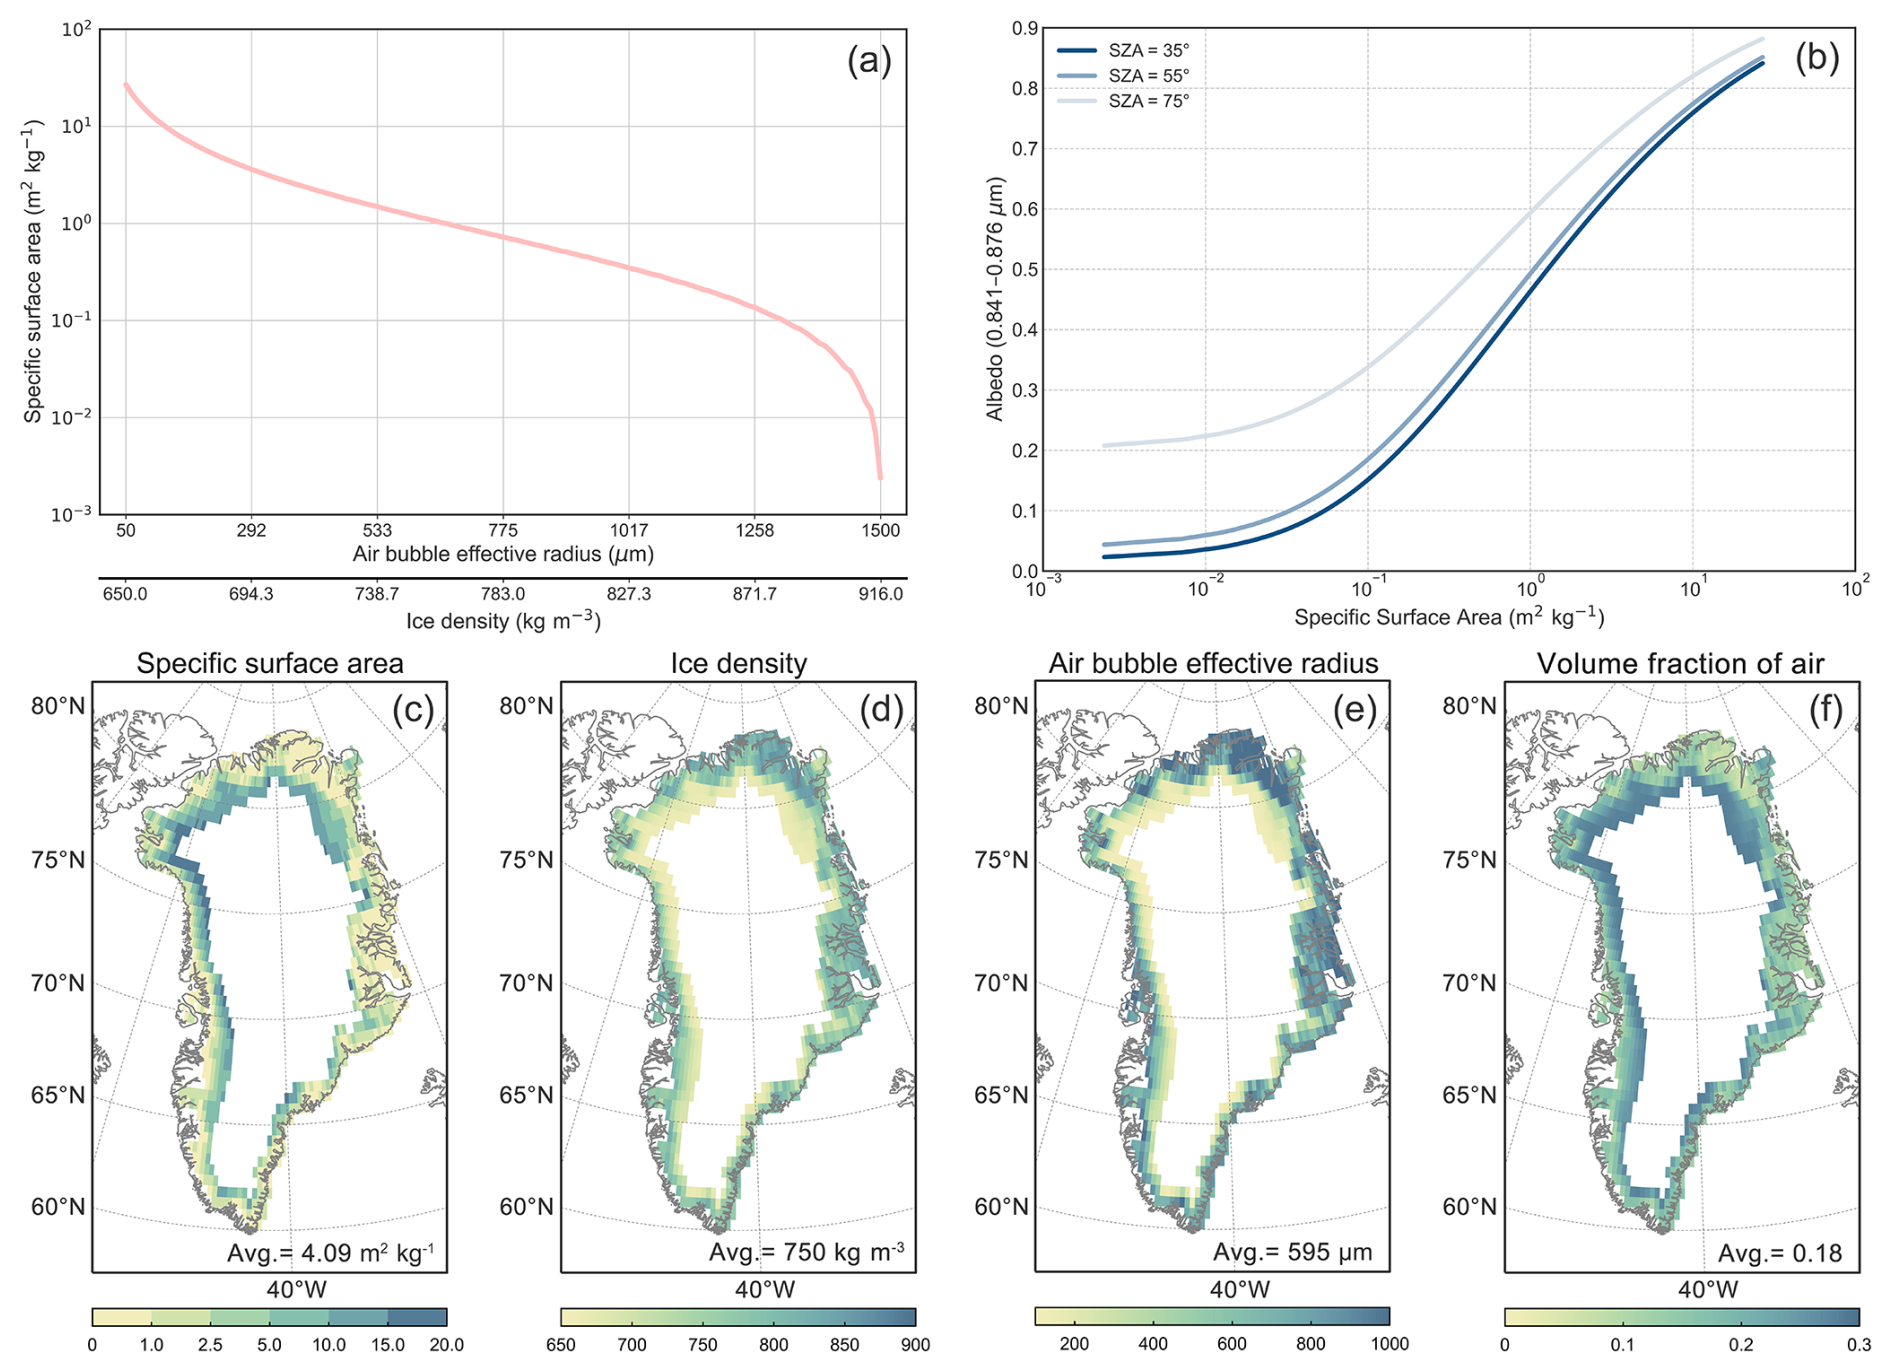
Figure 4(a) The relationship between ice specific surface area (SSA; m2 kg−1), the air bubble effective radius (µm), and ice density (kg m−3) under a linear density–radius relationship (a first-order approximation) assumed in this study. (b) MCD43C3 band 2 (0.841–0.876 µm) albedo as a function of SSA and solar zenith angle. Spatial distribution of the JJA (June, July, and August) (c) specific surface area (m2 kg−1), (d) ice density (kg m−3), (e) air bubble effective radius (µm), and (f) volume fraction of air in the period of 2000–2020.
The lookup table was generated using the standalone SNICAR-ADv4 radiative transfer model by testing a range of parameter combinations within physically constrained ranges, including ice density (650–916 kg m−3) and air bubble radii (100–1500 µm), as well as the SZAs spanning 35 to 75° to represent typical local noon conditions across the GrIS grid cells. Following the SNICAR-ADv4 modeling configuration, ice with densities above 650 kg m−3 is treated as bubbly ice, following the modeling approach in Whicker-Clarke et al. (2022), which showed optimal agreement with in situ measurements. However, because the density–bubble radius relationship for GrIS bare ice remains poorly constrained, we apply a linear density–radius relationship as a first-order approximation for calculating the specific surface area (SSA), where densities of 650 and 916 kg m−3 correspond to bubble radii of 50 and 1500 µm, respectively (Fig. 4a). This parameterization is provisional and awaits future observational validation. For each parameter combination, the band 2 albedo, SSA, and volume fraction of air (Vair) were then output by the standalone SNICAR-ADv4 model. The SSA is a measure of the total surface area of ice–air interfaces relative to the ice mass. The relationship between the SSA (units: m2 kg−1) and ice density and the air bubble effective radius is given by Eq. (1), where ρblk is layer bulk ice density used to calculate the volume fraction of air (Eq. 2) and ρpure_ice is pure ice density (917 kg m−3).
Figure 4b shows the band 2 albedo from the SNICAR-ADv4 lookup table as a function of SSA, illustrating that the modeled albedo is primarily determined by SSA rather than the specific combination of ice density and bubble size. Consequently, the retrieval algorithm selects the (density, radius) combination that most closely reproduces the observed band 2 albedo. Since MCD43C3 provides the band 2 albedo and SZA for each bare-ice grid cell, the corresponding bare-ice physical properties can be inferred from the lookup table. It is important to note, however, that the resulting bare-ice property maps (Fig. 4c–f) represent just one plausible solution among several combinations that could yield similar SSA and albedo values.
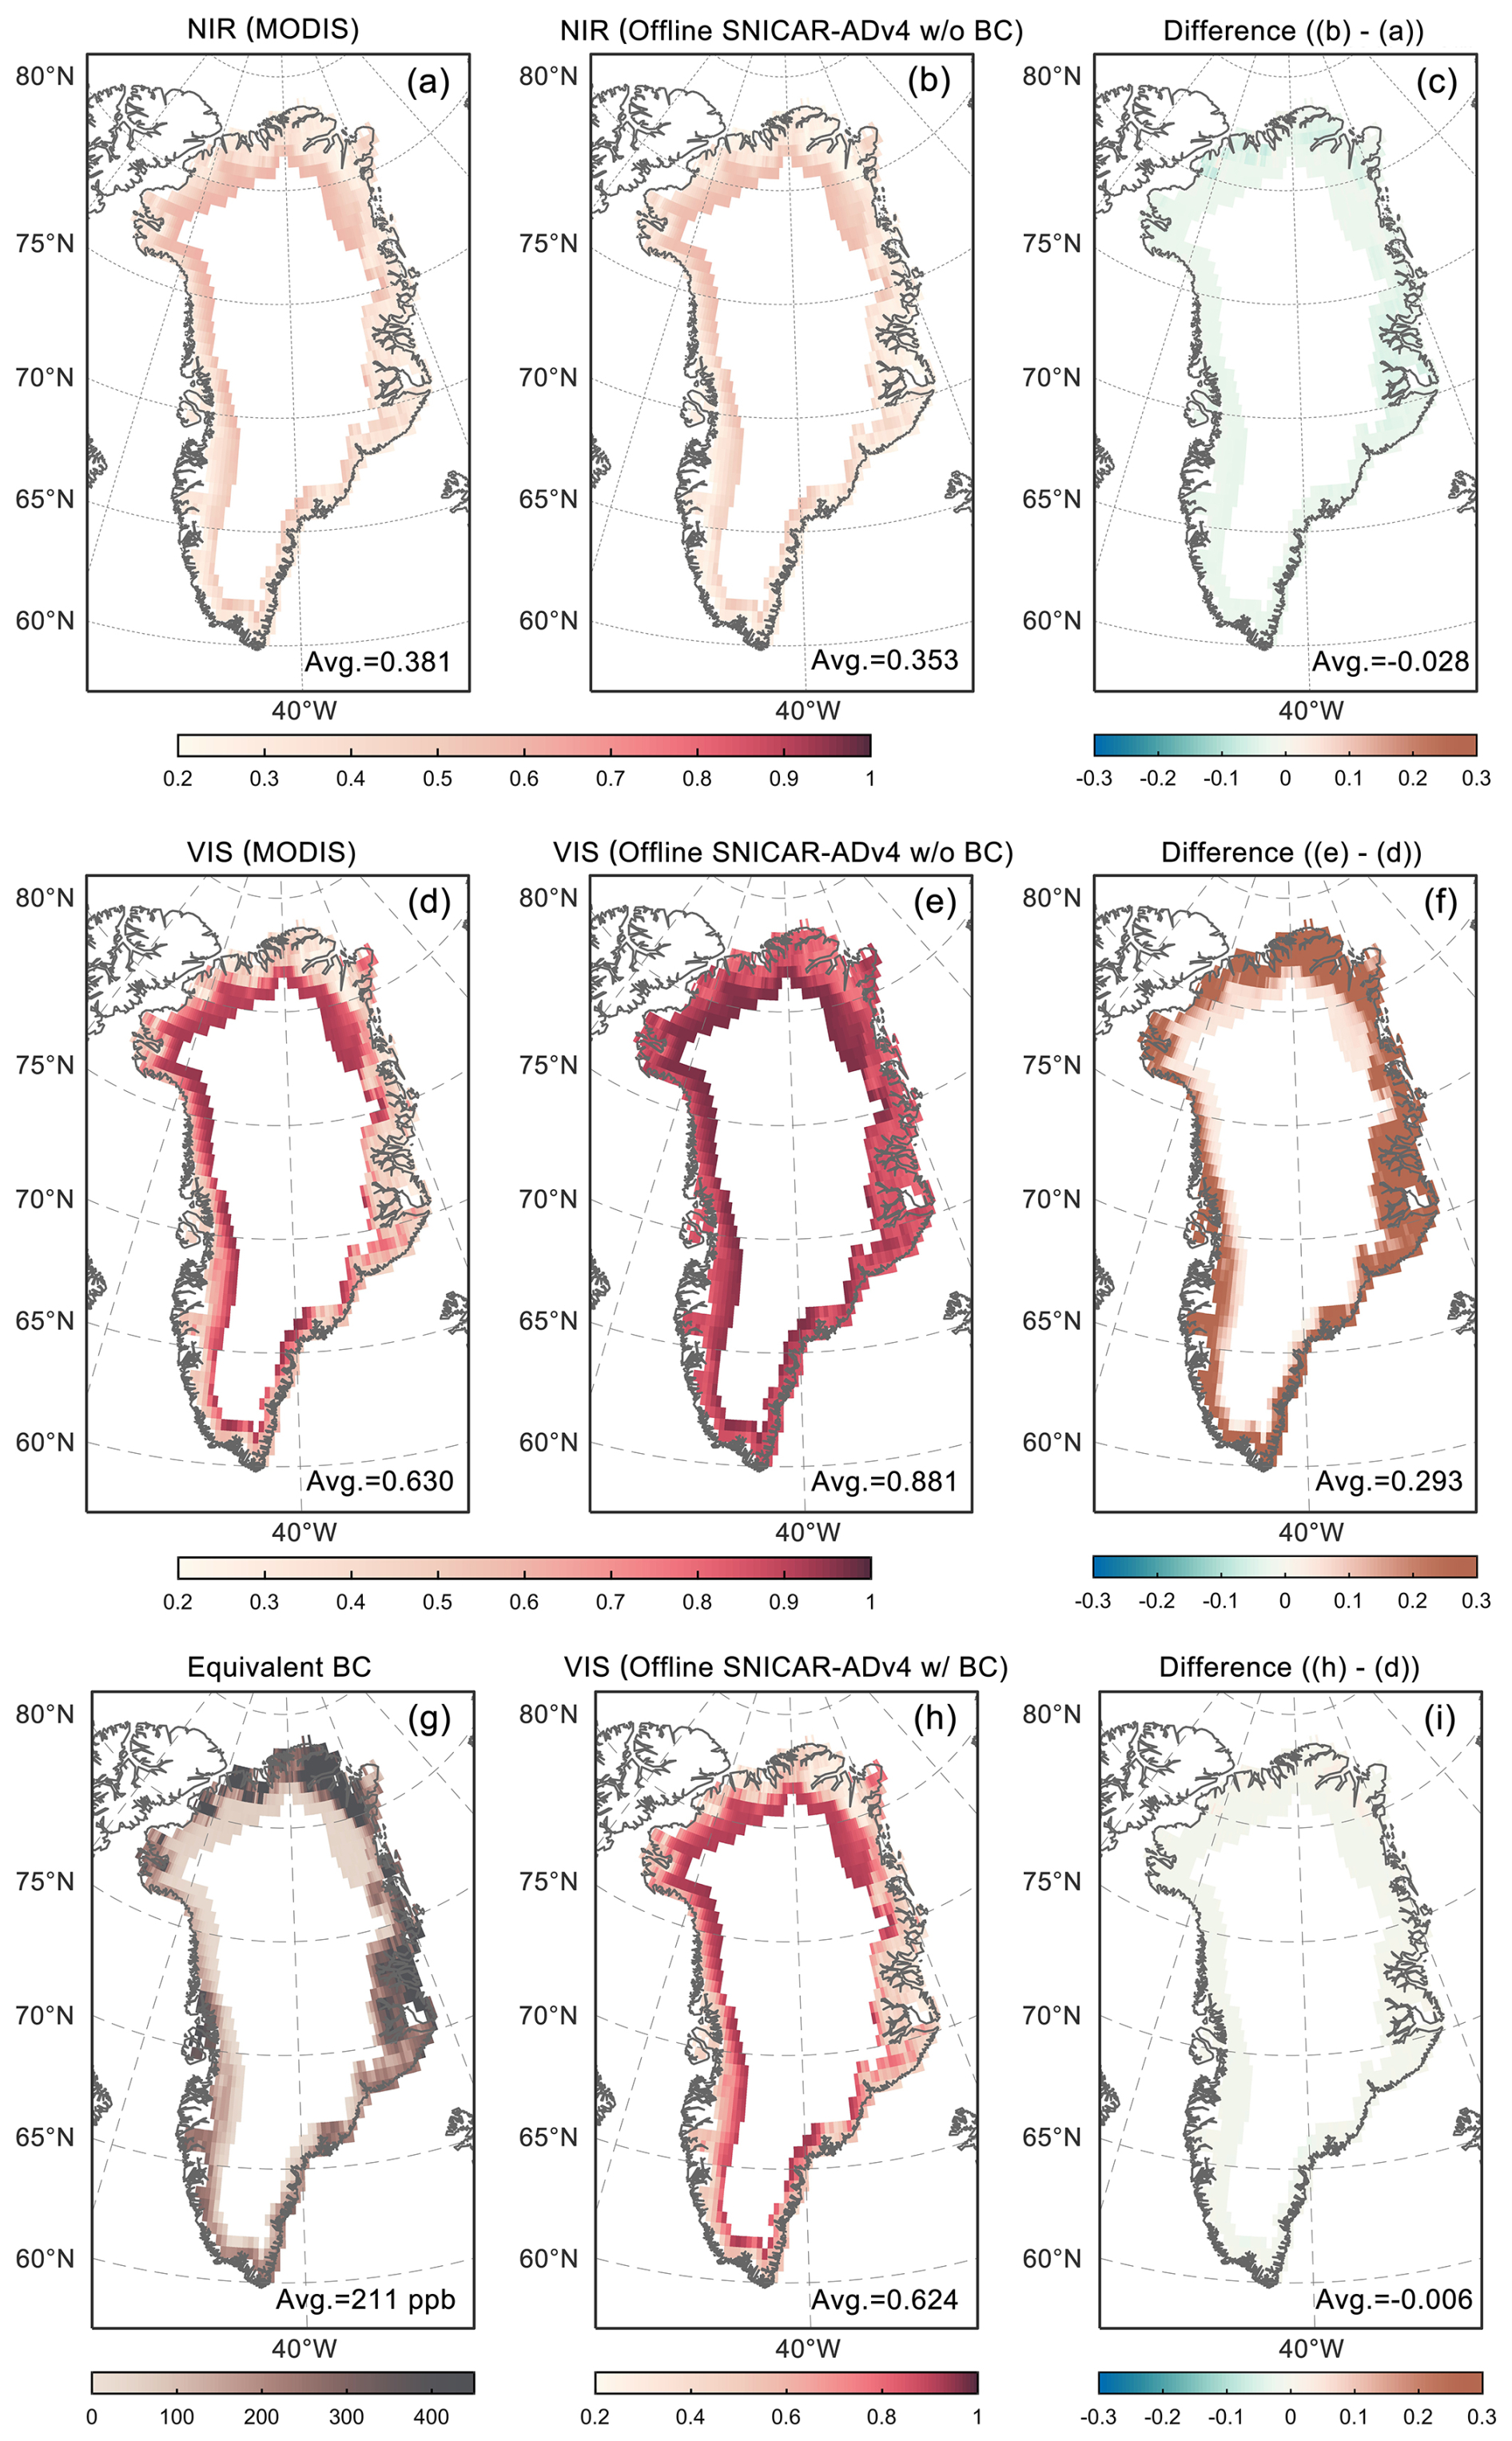
Figure 5The spatial distributions of MODIS bare-ice albedo and standalone SNICAR-ADv4 bare-ice albedo excluding LACs in (a, b) near-infrared and (c, d) visible bands for JJA from 2000 to 2020, along with (c, f) their differences. The spatial distributions of (g) equivalent black carbon, (h) the standalone SNICAR-ADv4 bare-ice visible albedo with equivalent black carbon (ppb), and (i) its difference from the MODIS bare-ice visible albedo.
After acquisition of the daily ice density and air bubble effective radius of the GrIS (Fig. 4d and e), we again employed the standalone SNICAR-ADv4 model to simulate the NIR and visible albedo for each bare-ice grid cell of the GrIS. Using an iterative optimization approach, we derived the equivalent BC concentration by adjusting the BC input parameter in the standalone SNICAR-ADv4 model until its simulated visible albedo matched the MODIS MCD43C3 observations. This inversion method relies on the strong influence of LACs on visible albedo and their negligible impact on NIR albedo over bare ice (Schneider et al., 2019). As seen in Fig. 5a–c, there is minimal difference in the albedo in the NIR band, with a slight underestimation of 0.029 by the standalone SNICAR-ADv4 model. In contrast, the SNICAR-ADv4 significantly overestimated the visible albedo by up to 0.293 when using these bare-ice properties, as it did not account for the LACs (Fig. 5d–f). We incrementally adjusted the input BC concentration in the standalone SNICAR model to match the visible albedo values from MCD43C3 data at each GrIS bare-ice grid cell (Fig. 5h and i). This process yielded the daily equivalent BC concentrations shown in Fig. 5g. Based on the MODIS data and the standalone SNICAR-ADv4 lookup table, the daily 0.5° ice density, air bubble effective radius, and equivalent BC data were then processed into a monthly timescale as input for CoLM. Besides this, it is worth mentioning that not all bare-ice grid cells are informed by the bare-ice physical properties data in each summer month. These grid cells are filled with the climatological mean values of bare-ice physical properties when retrievals fail due to clouds or poor data quality.
2.5 Model simulation
We conduct several offline CoLM simulations with the embedded SNICAR-ADv4 and SNICAR-AD schemes on a 0.25° × 0.25° resolution, driven by the atmospheric forcing from the hourly single-level surface dataset of the European Center for Medium-Range Weather Forecasts' fifth-generation atmospheric reanalysis (ERA5) in the GrIS. Compared with other atmospheric forcings, ERA5's precipitation rates exhibit a higher correlation with measured net accumulation over the GrIS (Schneider et al., 2023). We run the model simulations for the years 1980–2020, and the summer melt season (June, July, and August; JJA) during 2000–2020 is used for analysis. Aerosol concentration in the snow layer is calculated based on the prescribed monthly aerosol (BC; dust; organic carbon, OC) wet- and dry-deposition flux from the CESM2-WACCM simulations in CMIP6 experiments (Danabasoglu et al., 2020). The monthly bare-ice properties for the ice radiative transfer process are inferred from MODIS products using the standalone SNICAR-ADv4 model over the bare-ice region of the GrIS, covering JJA from 2000 to 2020, as the MODIS products have been available since 2000. To prevent possible unusual model behavior when shifting bare-ice albedo schemes, the bare-ice properties from the summer of 2000 were used in a brief spin-up run for the variable bare-ice conditions in our experimental runs from 1998 to 2000. For land ice patches informed by the ice properties, the bare-ice albedo is first calculated and replaces the constant values (0.6 for VIS and 0.4 for NIR). If snow is present over the ice, the new ice albedo of the underlying ice column is used as the lower boundary to calculate snow albedo. The total patch albedo is then determined by the fractional coverage of land types and snow cover.
In this study, we analyzed output variables from three sets of CoLM simulations: (1) those using SNICAR-AD with fixed bare-ice albedo (0.6 for visible and 0.4 for near-infrared), (2) those using SNICAR-ADv4 with annually varying bare-ice properties, and (3) those using SNICAR-ADv4 with bare-ice properties held constant at values from the year 2000 for all years. The simulations output two variable groups: (a) surface albedo (visible, near-infrared, and shortwave under direct radiation) and bare-ice fraction for albedo evaluation and (b) 2 m temperature, snow cover fraction, and snow water equivalent to quantify the effect from the bare-ice metamorphism.
3.1 Mapping of GrIS bare-ice physical properties
Figure 4c–f displays the spatial distribution of the summer climatological mean of the bare-ice physical properties, including SSA, ice density, the air bubble effective radius, and the volume fraction of air. The bare-ice density gradually decreases from the lower-elevation coastal regions toward the interior, while the volume fraction of air shows an opposite pattern, as it is calculated from the bulk ice–air mixture density and the density of pure ice (Fig. 4d and f; Eqs. 1 and 2). SSA represents the total surface area of ice–air interfaces relative to the mass of ice, determined by the volume fraction of air, effective diameter of air bubbles, and bulk density of the ice layer (Whicker-Clarke et al., 2022), with high values distributed in the area along the mean equilibrium line (Fig. 4c). Given the large discrepancy in bare-ice visible albedo between the standalone SNICAR-ADv4 model without LACs and MCD43C3 in the coastal regions of the GrIS (Fig. 5d and e), higher equivalent BC concentrations occur in these areas compared to inland regions, indicating potentially more severe contamination, particularly in the southeastern and northernmost parts of the GrIS (Fig. 5g).
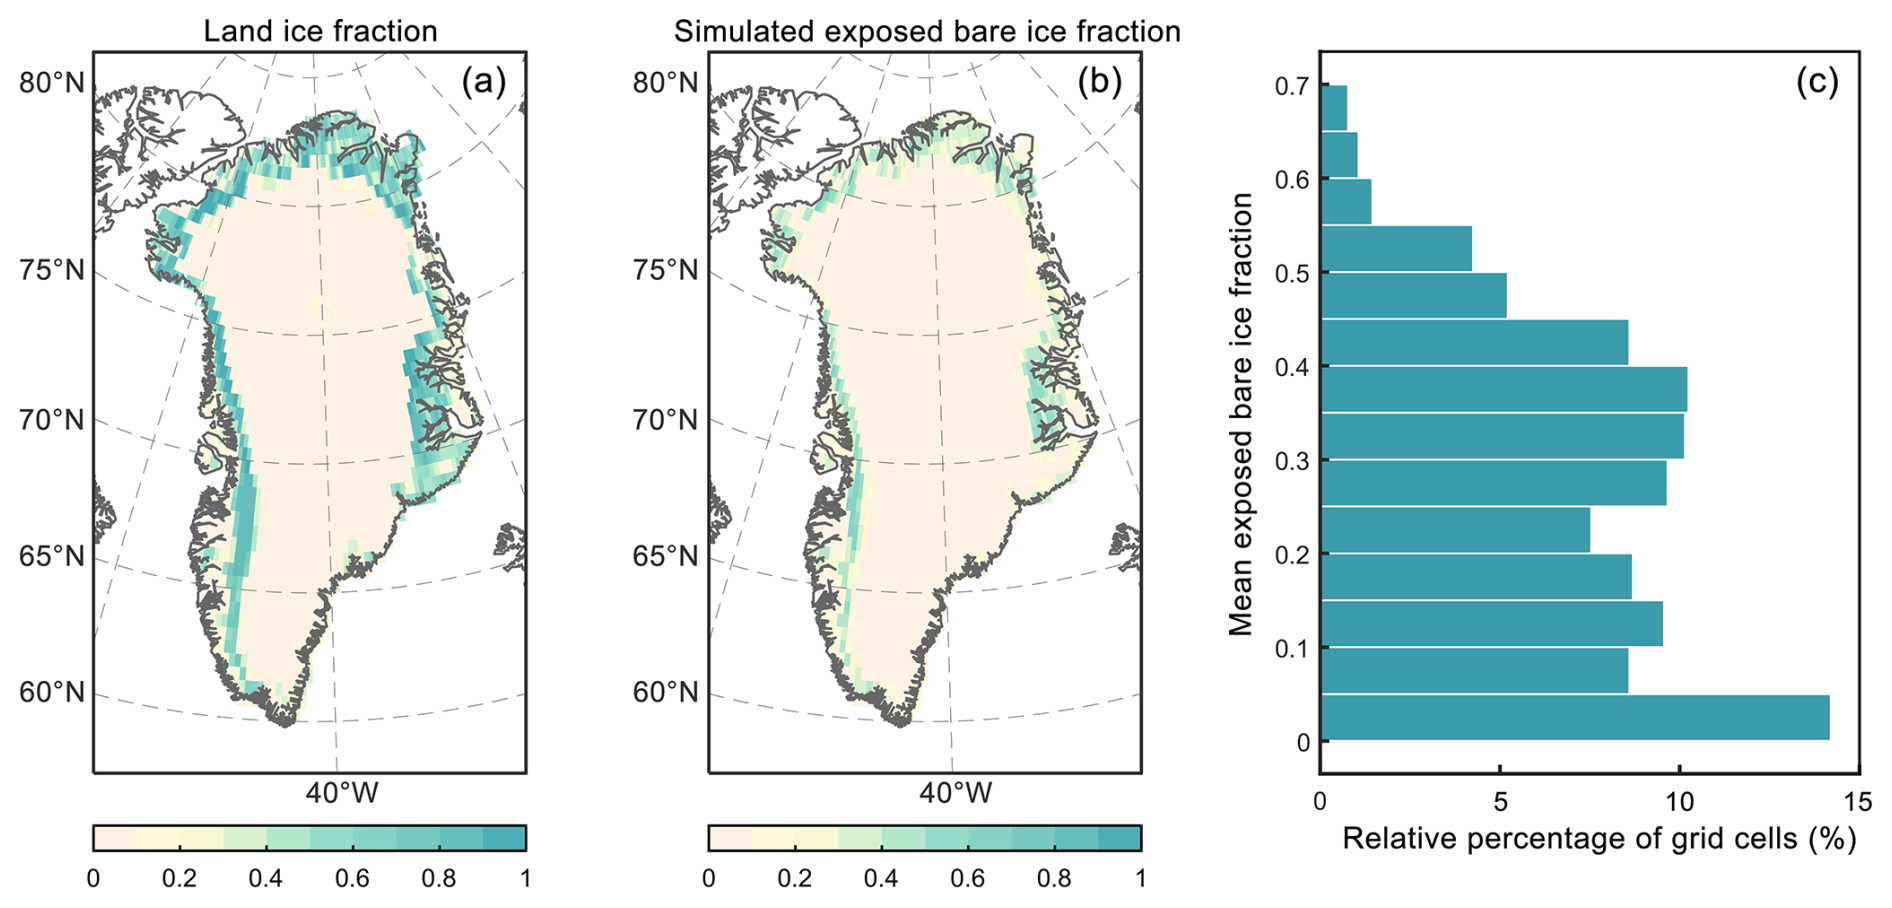
Figure 6Spatial distribution of (a) the fraction of land ice underlying the snowpack, excluding interior regions of the GrIS that remain fully snow-covered throughout JJA (2000–2020) and (b) the mean exposed bare-ice fraction during JJA over the same period, based on snow cover simulated by CoLM using the SNICAR-ADv4 scheme. Panel (c) shows the relative frequency distribution of the mean exposed bare-ice fraction, considering only grid cells with nonzero bare-ice exposure. Each bar indicates the percentage of these grid cells whose mean bare-ice fraction falls within a given interval, relative to the total number of bare-ice grid cells.
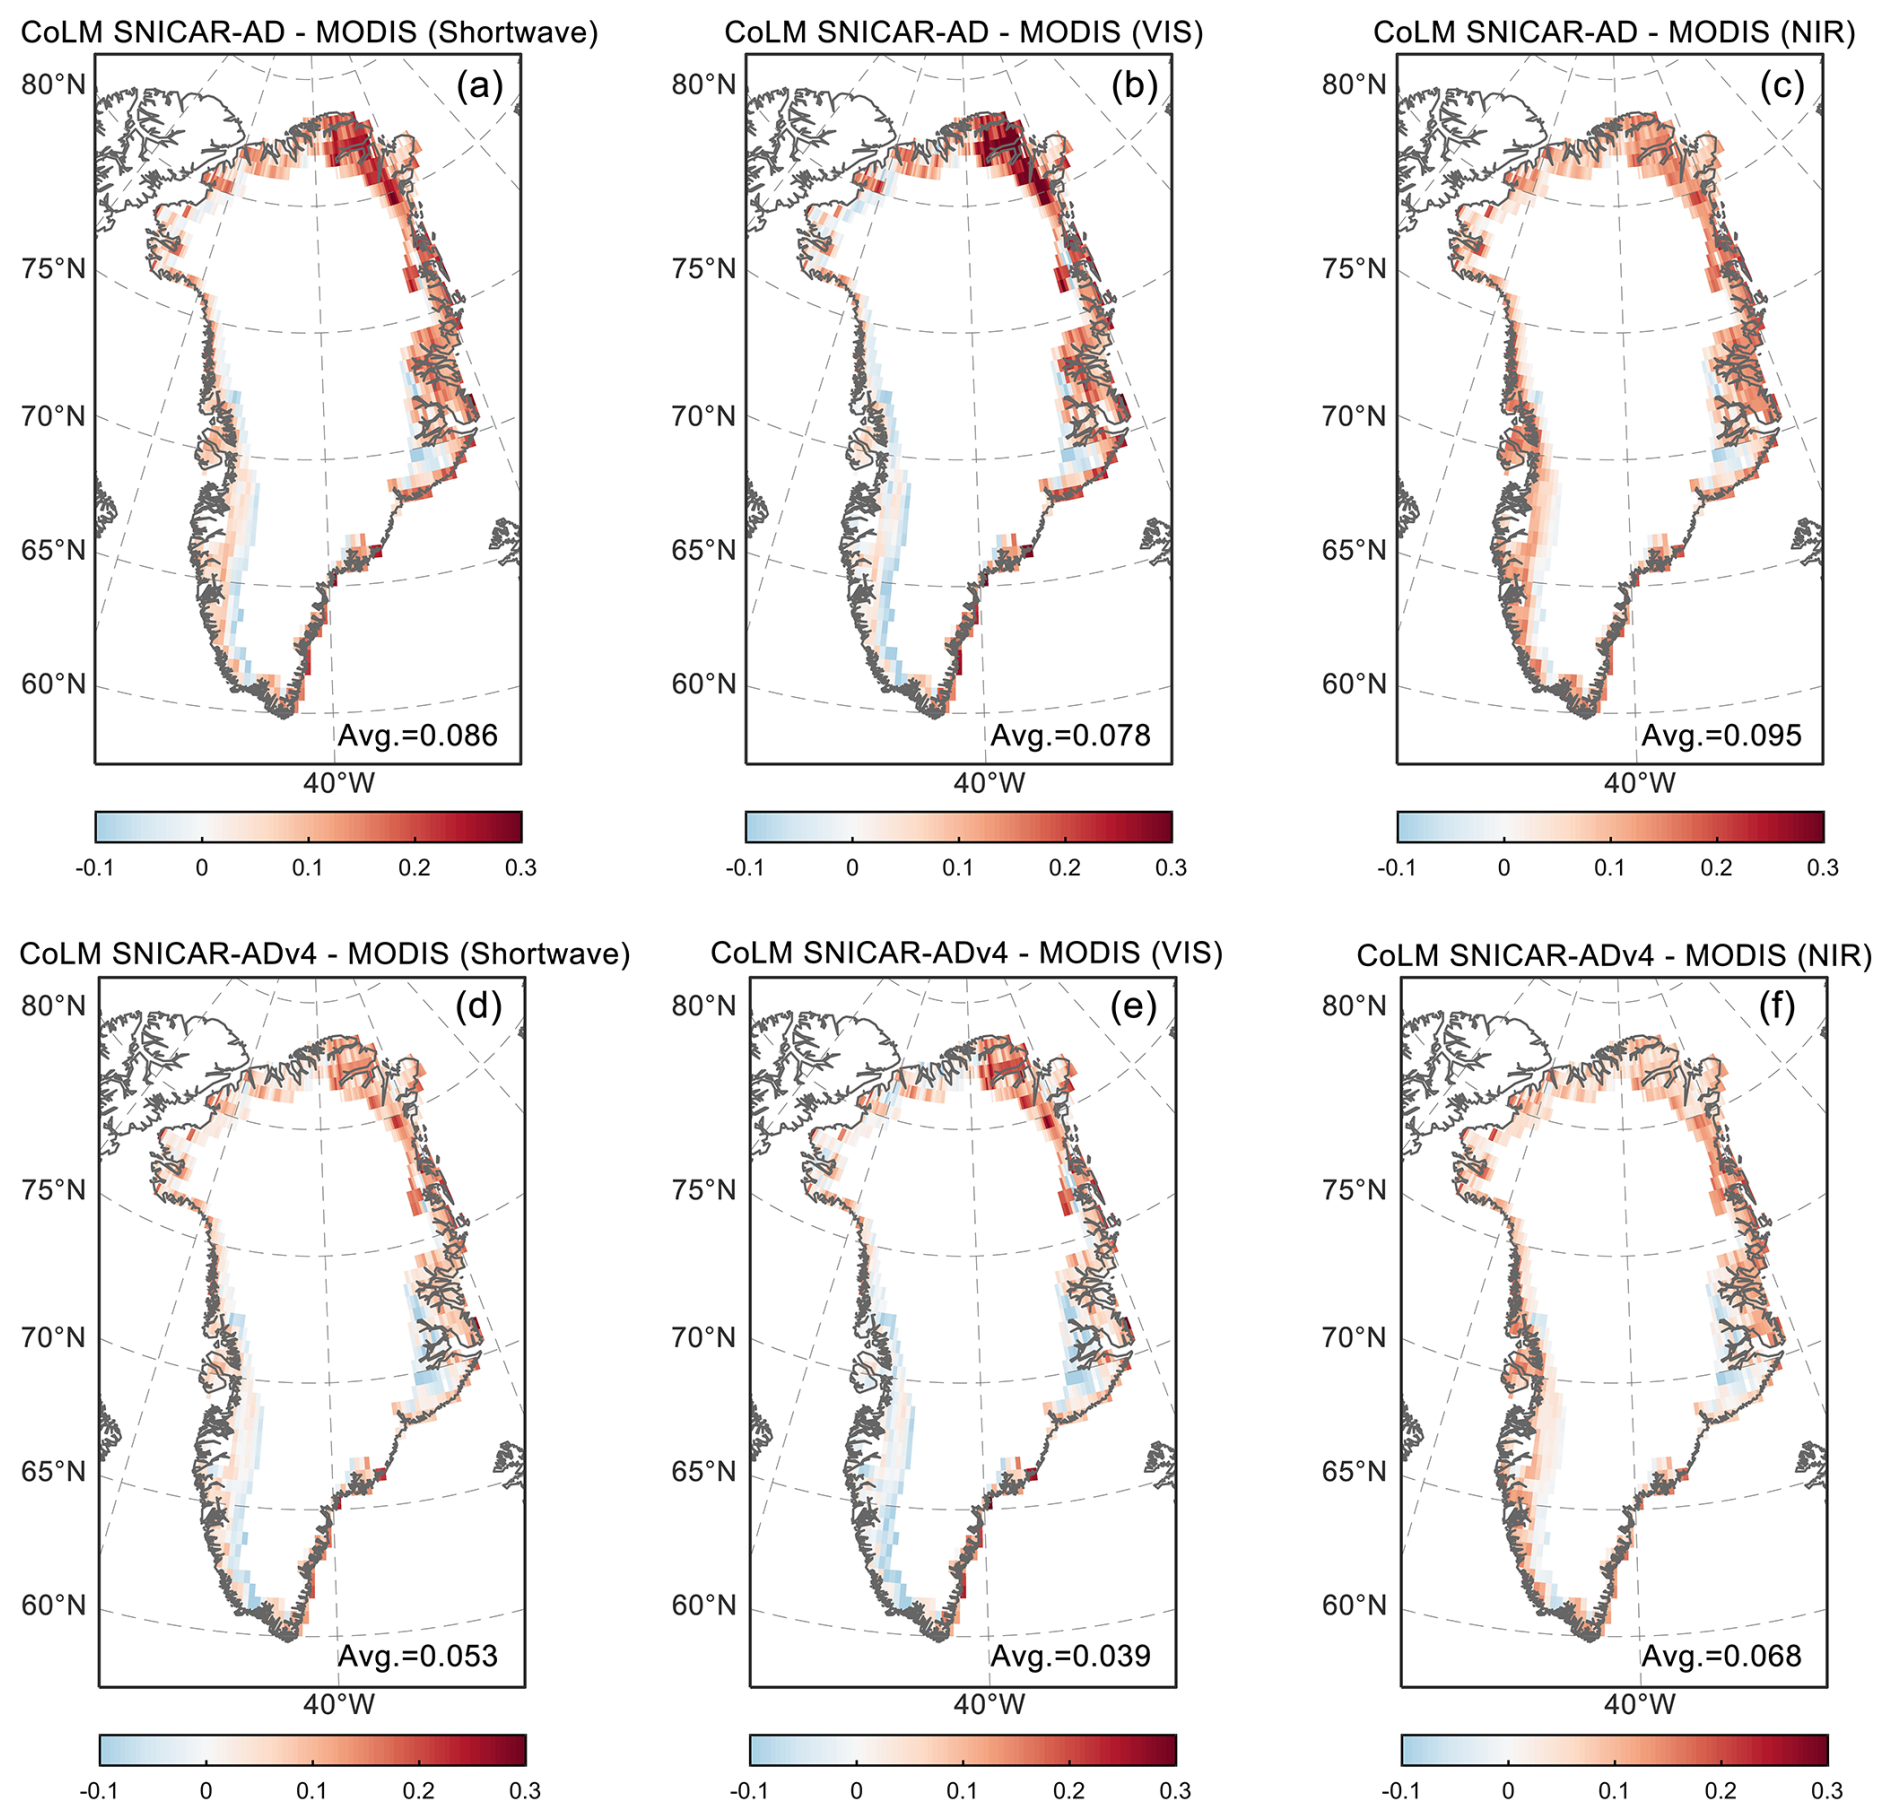
Figure 7Spatial distribution of the difference in the 2000–2020 JJA albedo between CoLM with different snow/ice albedo schemes (SNICAR-AD and SNICAR-ADv4) and MCD43C3 in the (a, d) shortwave (0.3–5.0 µm), (b, e) visible (0.3–0.7 µm), and (c, f) near-infrared (0.7–5.0 µm) bands.
3.2 Spatial and temporal performance of CoLM simulations
In this study, the “land ice” area (Fig. 6a) refers specifically to glacier ice grid cells excluding those persistently covered by snow. Therefore, interior regions of the GrIS, which are continuously overlain by permanent snow cover, are not counted as “land ice” in this figure. This explains the absence of land ice coverage in the GrIS interior. The land ice fraction in Fig. 6a represents the proportion of glacier ice within a grid cell after filtering out areas where the snow cover fraction remains at 100 %. Grid cells with a land ice fraction < 1 contain a mix of glacier ice and other surface types (e.g., bare soil). In contrast, Fig. 6b shows the exposed bare-ice fraction, which further considers seasonal snow cover using the SNICAR-AD scheme. It is important to note that, despite a slight difference in snow cover fraction simulations, the choice of a snow albedo scheme does not affect the selection of bare-ice regions. The frequency distribution of the exposed bare-ice fraction is shown in Fig. 6c. The bare-ice fraction ranges from 0 to 0.7 across the grid cells, with the majority of grid cells exhibiting a bare-ice fraction below 0.5. The histogram bars represent the relative proportion of grid cells within each bare-ice fraction interval.
To assess whether the integration of an ice radiative transfer solver in CoLM improves albedo simulations, we compared simulated albedo with the MCD43C3 albedo in shortwave, visible, and NIR regions of the spectrum during the summer of 2000–2020 in the bare-ice region (Fig. 7). Both SNICAR-AD and SNICAR-ADv4 simulations use the same default snow albedo configuration, which includes spherical snow grains, the adding–doubling radiative transfer solver, and external mixing of BC and dust with snow. In other words, the differences in simulated albedo between SNICAR-AD and SNICAR-ADv4 arise solely from their different treatments of ice albedo, as the snow albedo configuration remains identical. As seen in Fig. 7a–c, it is obvious that the SNICAR-AD-enabled CoLM albedo is significantly overestimated across all bare-ice regions, by 0.086 in the shortwave, 0.078 in the visible, and 0.095 in the NIR. Compared with CoLM–SNICAR-AD, the application of the SNICAR-ADv4 scheme reduced the overestimation of albedo for all bands, by 38 % in the shortwave, 50 % in the visible, and 28 % in the NIR (Fig. 7d–f).
Furthermore, for each grid cell over the GrIS bare-ice region, we computed the root mean square error (RMSE) between the MODIS observed albedo and model-simulated albedo (CoLM–SNICAR-AD/CoLM–SNICAR-ADv4) time series (2000–2020, 21 summer values per cell). Comparative analysis of the spatial distributions of correlation coefficients, RMSE, and linear trends (Figs. S1–S3 in the Supplement) reveals that CoLM–SNICAR-ADv4 outperforms CoLM–SNICAR-AD across all evaluation metrics. These metrics were derived by comparing the 21-year summer albedo time series from model simulations and MODIS observations at each grid cell: correlation coefficients evaluate the phase similarity of interannual variations, RMSE quantifies deviation magnitudes, and linear trends (obtained via least-squares regression) capture interannual albedo changes. The comprehensive spatial evaluation demonstrates consistent improvements in both the spatial pattern and quantitative representation.
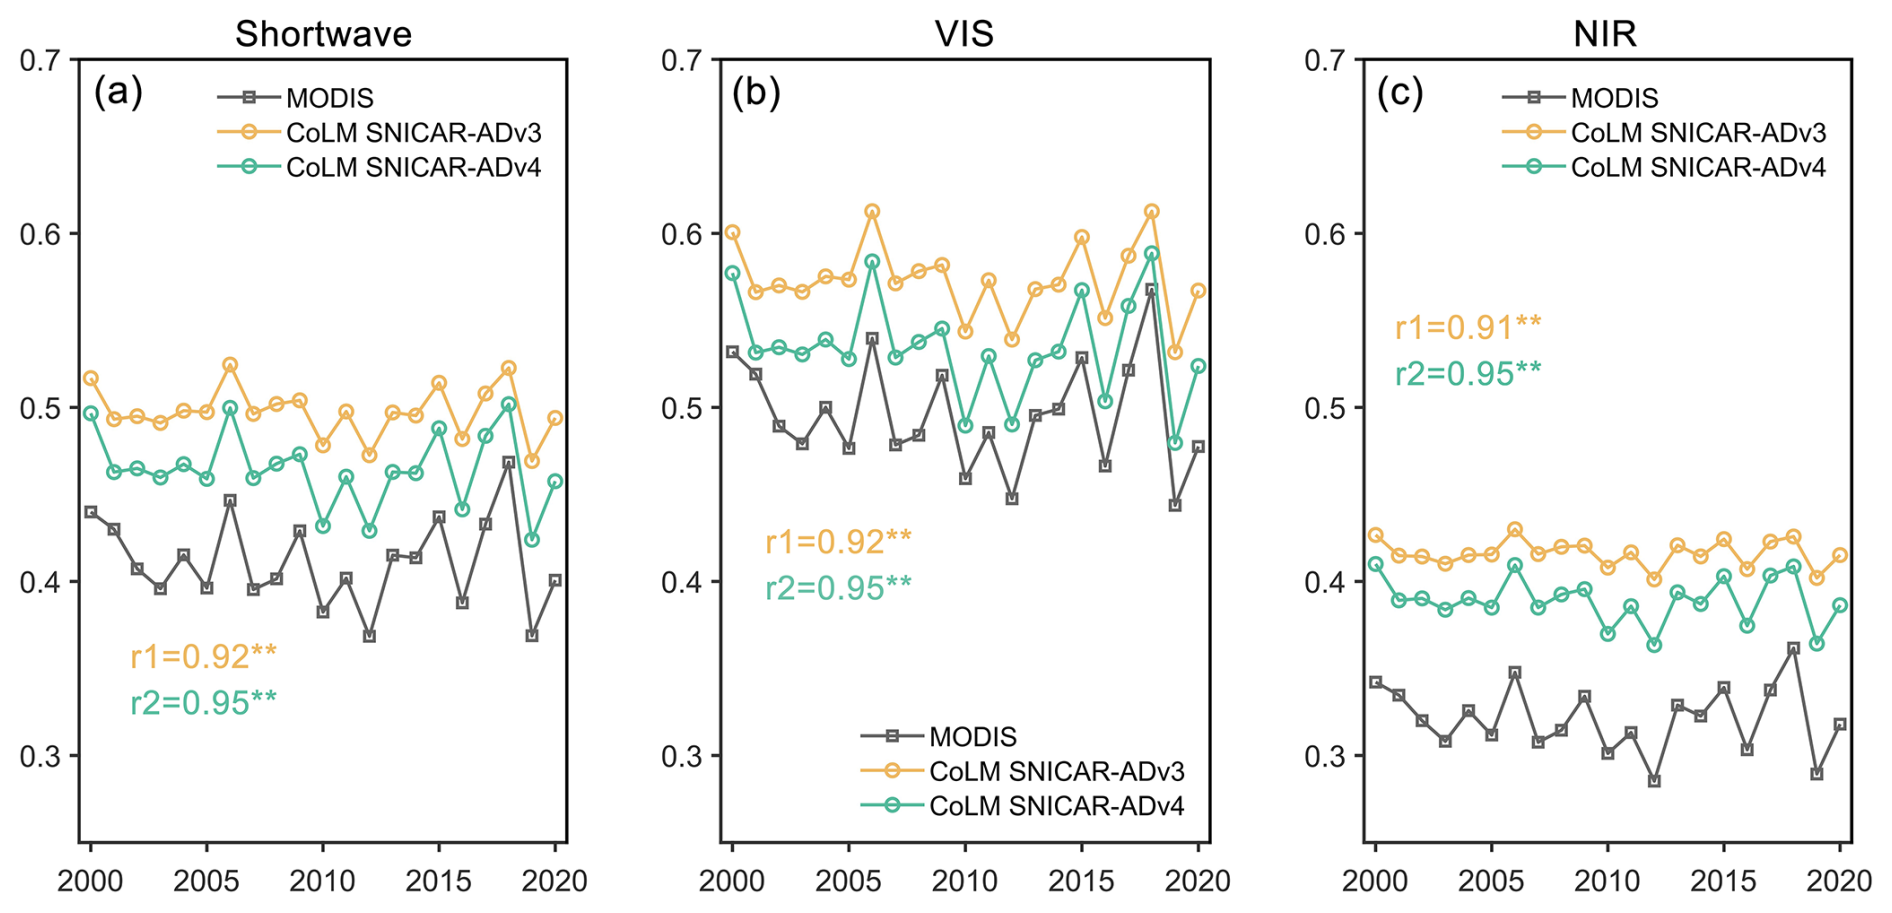
Figure 8Time series of the 2000–2020 JJA CoLM–SNICAR-AD and CoLM–SNICAR-ADv4 albedo versus the MCD43C3 albedo over the bare-ice region, in the (a) shortwave (0.3–5.0 µm), (b) visible (0.3–0.7 µm), and (c) near-infrared (0.7–5.0 µm) bands. Double asterisks indicate significance at the 99 % confidence level.
The decrease in the positive bias of CoLM–SNICAR-ADv4 can also be clearly seen in the shortwave, visible, and near-infrared albedo time series, with the area-weighted mean albedo of the GrIS bare-ice regions steadily decreasing throughout the summer period from 2000 to 2020, compared with CoLM–SNICAR-AD (Fig. 8). The albedo of CoLM–SNICAR-ADv4 fluctuates around 0.47 in the shortwave, 0.53 in the visible, and 0.4 in the NIR, which is approximately 0.05 higher than the corresponding values in MCD43C3. In addition, the CoLM–SNICAR-ADv4 simulations exhibit synchronous variations in albedo with those of MCD43C3, and there are relatively high temporal correlations between the CoLM–SNICAR-ADv4 and MCD43C4 albedo, with the values up to 0.95 for the shortwave, visible, and NIR bands. In contrast, the albedo from CoLM–SNICAR-AD shows lower correlation with MCD43C3 due to its constant ice albedo treatment. It is obvious that large interannual variability in the SNICAR-ADv4-enabled CoLM albedo is consistent with that of MCD43C3, while the simulated albedo using the SNICAR-AD scheme presents weaker interannual variability. Regarding correlation with observations, SNICAR-AD achieves slightly lower correlation (0.91) in the NIR band compared to its performance in the shortwave and visible bands (both 0.92).
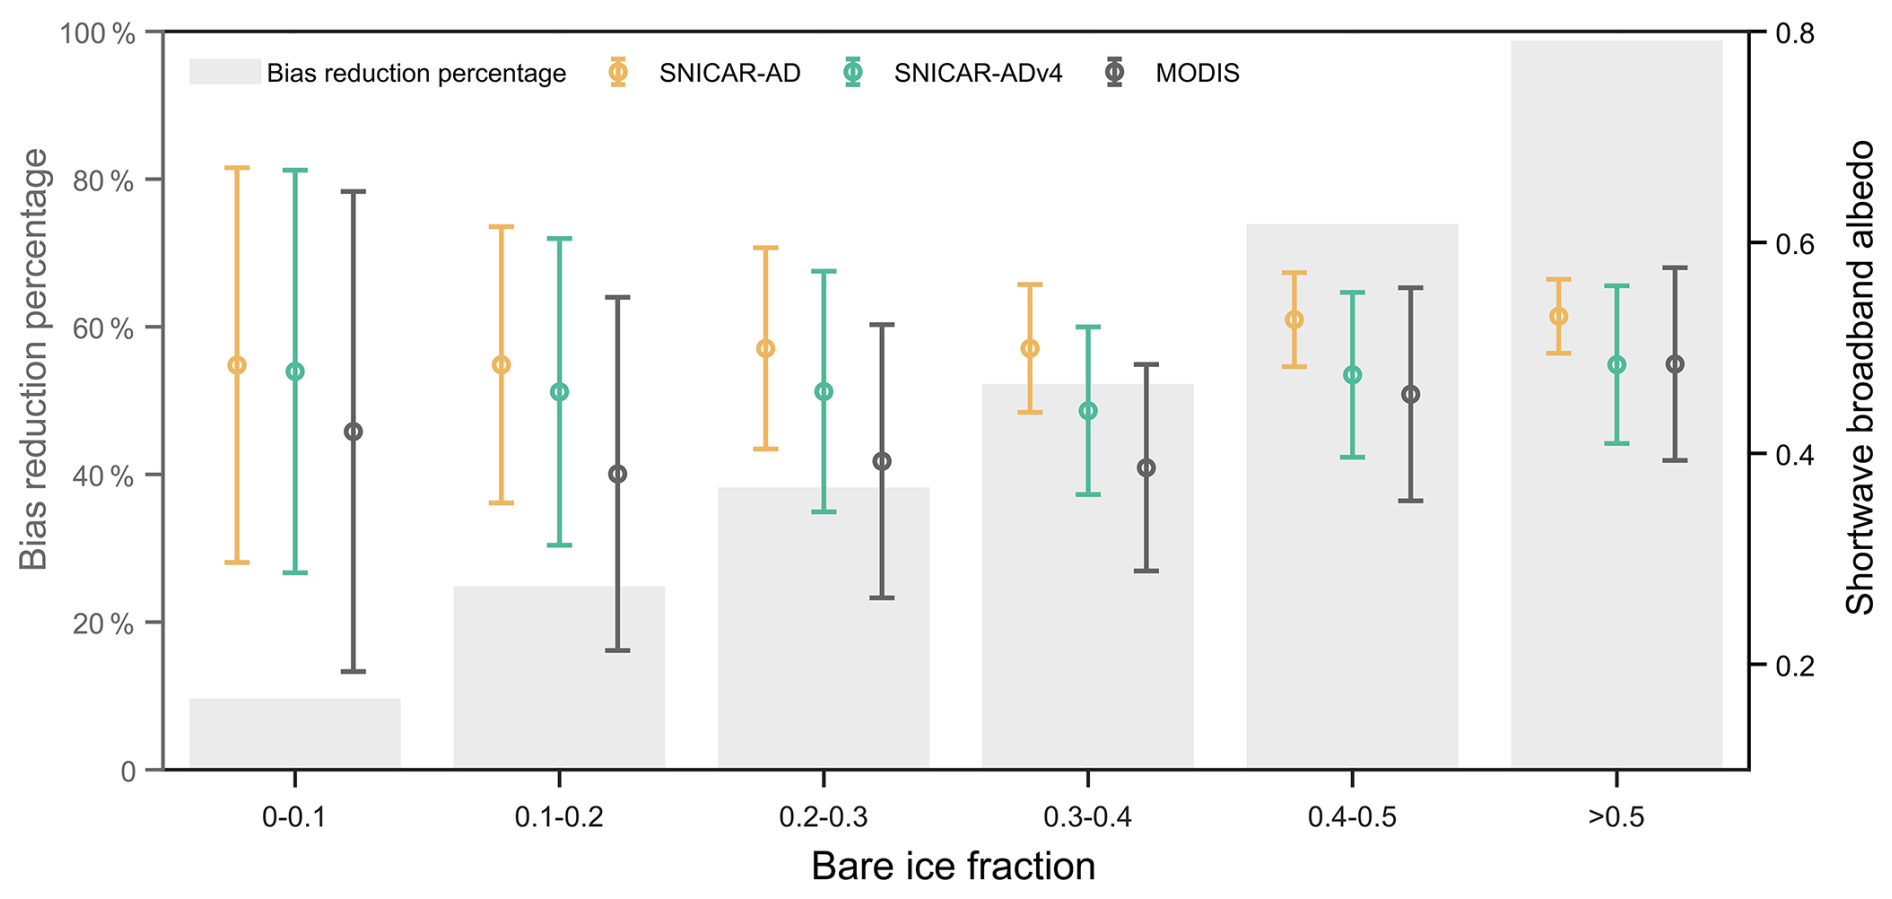
Figure 9Mean shortwave broadband albedo from CoLM–SNICAR-AD, CoLM–SNICAR-ADv4, and MCD43C3 under different bare-ice fractions (error plots). The uncertainty is calculated as double the standard error, which reflects the 95 % confidence interval. The percentages of the CoLM–SNICAR-ADv4 albedo reduction in bias are represented by grey bars.
Given that the bias reduction varies across regions with different levels of bare-ice coverage, we explore the distribution of the albedo from CoLM–SNICAR-AD, CoLM–SNICAR-ADv4, and MCD43C3 under different bare-ice fractions. Generally, as bare-ice fraction increases, CoLM–SNICAR-ADv4 can more effectively reduce the overestimation of shortwave broadband albedo (BBA) compared to CoLM–SNICAR-AD, due to its improved simulation of bare-ice BBA (Fig. 9). For regions where bare-ice covers more than half the area, the albedo overestimation of SNICAR-AD was reduced significantly by up to 99 %. When the bare-ice fraction is between 0.4 and 0.5, the percentage of overestimation reduction in albedo decreases to 74 %, followed by regions with a bare-ice fraction of 0.3–0.4 (52 %), 0.2–0.3 (38 %), 0.1–0.2 (25 %), and 0–0.1 (10 %), respectively.
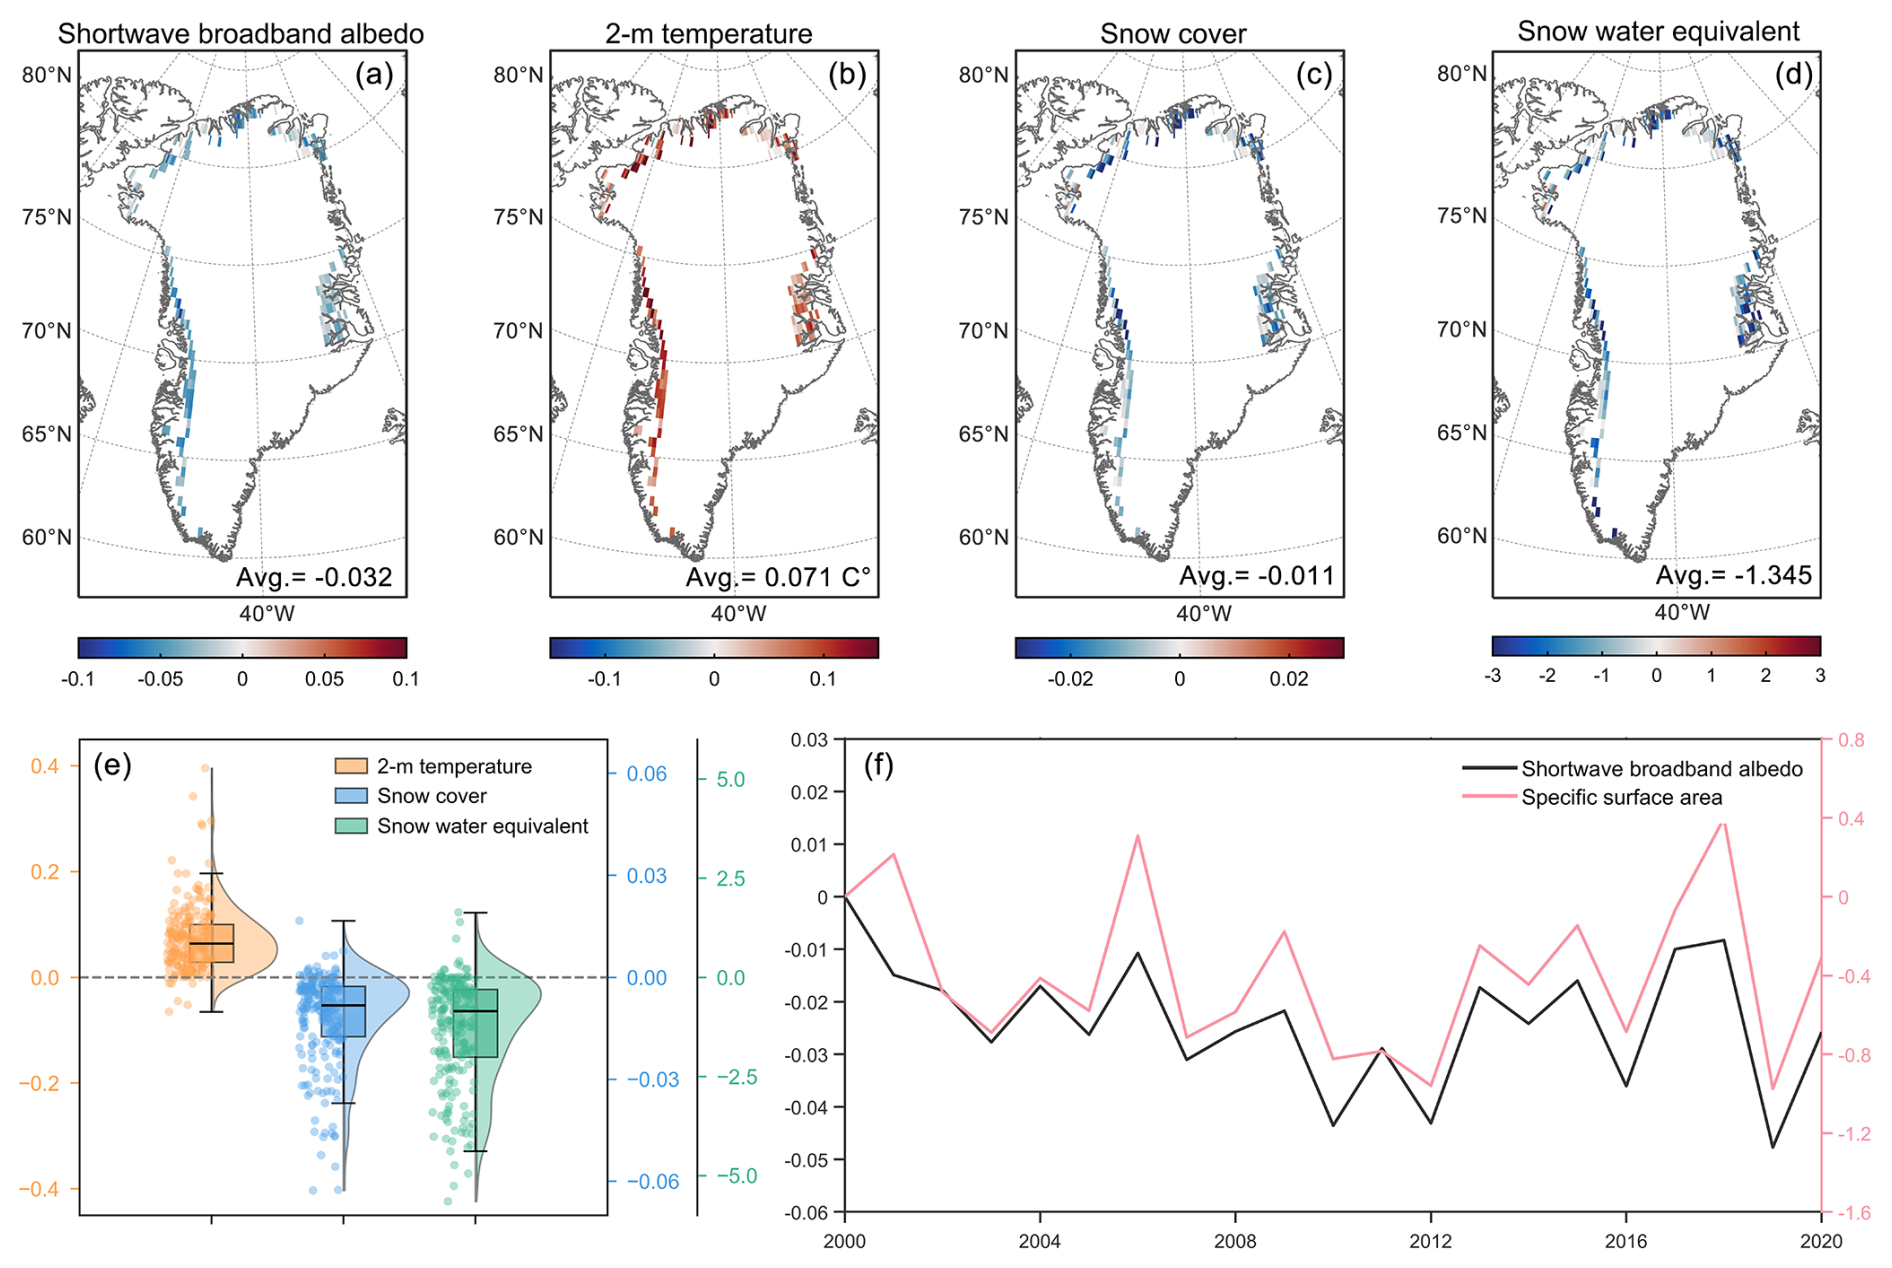
Figure 10Spatial differences between simulations using annually varying bare-ice properties and those using fixed values from the year 2000 during JJA (June–August) from 2000 to 2020: (a) surface albedo, (b) 2 m air temperature (°C), (c) snow cover fraction, and (d) snow water equivalent (mm). (e) Statistical distributions of differences in 2 m air temperature, snow cover, and snow water equivalent, shown using combined boxplots, left-side jittered points, and right-side half-violin plots. (f) Time series of differences in specific surface area (m2 kg−1) and simulated shortwave broadband albedo between the two experiments.
3.3 Feedback revealed by bare-ice property changes
The application of the SNICAR-ADv4 scheme in CoLM has significantly reduced the bias in albedo simulations. To investigate the regional climatic response to bare-ice metamorphism of Greenland's bare-ice region, we conduct a simulation in which the bare-ice physical properties for each year are set to the values from 2000. By calculating the difference in simulated albedo between the simulations with annually varying bare-ice properties and those using the values from 2000, the model sensitivities to the change in summer bare-ice albedo can be assessed to quantify its impact on 2 m temperature and snow cover. To better highlight the impact of changes in bare-ice physical properties, the study area was restricted to regions with a bare-ice fraction larger than 0.4. Fig. 10a–c compares the effects of bare-ice metamorphism on the 21-year summer mean albedo, 2 m temperature, and snow cover fraction, between simulations with annually varying bare-ice properties and those using constant properties from the year 2000. The regionally weighted mean albedo difference between the two experiments reaches 0.032, indicating that the albedo in the bare-ice region is reduced by 0.032 during the summer due to bare-ice metamorphism (Fig. 10a). This leads to a 0.071 °C 2 m temperature forcing and a −0.011 change in snow cover fraction over the study period (Fig. 10b and c). These results suggest that the temperature increase associated with the change in albedo contributes to snow melting.
Spatially, the regions with a strong response of near-surface air temperature to bare-ice albedo changes are concentrated in the edge of the northwestern and western ablation zones, where the 2 m temperature increased by over 0.1 °C in most parts of these areas (Fig. 10b). A similar response pattern can be also seen in the difference distribution of the snow cover (Fig. 10c), with a decrease in the snow cover fraction exceeding 0.04 in parts of the northwestern and western GrIS where temperature increases are most pronounced. To further evaluate the hydrological implications of albedo-induced warming, we examined changes in snow water equivalent, which integrates snow accumulation, meltwater retention, and sublimation processes. This analysis indicates that bare-ice metamorphism represented by annually varying ice properties leads to a forcing that causes an average snow water equivalent decrease of 1.345 mm (Fig. 10d), consistent with the observed snow cover decline. The statistical distributions of changes in 2 m temperature, snow cover, and snow water equivalent (Fig. 10e) reinforce the finding that certain regions of the GrIS are especially sensitive to reductions in bare-ice albedo. Although the mean differences in 2 m air temperature, snow cover, and snow water equivalent appear small, there are a considerable number of grid cells showing substantially higher 2 m air temperature differences and notably lower snow cover and snow water equivalent values. This indicates that certain regions of the GrIS exhibit relatively strong sensitivity to changes in bare-ice albedo (Fig. 10e). These coordinated changes manifest a strong bare-ice albedo feedback in the GrIS bare-ice region because bare-ice albedo is reduced through physical and biological melt albedo processes that darken the ice surface as the warming occurs in the ice surface.
The metamorphism of bare ice could be manifested in the changes in ice density and the air bubble radius with the ice, and these two factors jointly determine the specific surface area (Eq. 1) which has a one-to-one relationship with the bare-ice albedo (Fig. 3b). From Fig. 10f, the difference in BBA shows a strong positive correlation with the specific surface area, with a correlation coefficient of 0.88 (significant at the 99 % confidence level), since the two simulations differ solely in their bare-ice physical property inputs to the land surface model. As more intense melt processes start in the early summer of the GrIS ablation zone after 2000, the lower specific surface area, linked with the bare-ice albedo feedback, consistently contributes to the reduction in the BBA (Fig. 10f). Additionally, according to the sensitivity of modeled spectral albedo to the relevant parameters of the standalone SNICAR-ADv4 model (Fig. 3), the decreased bare-ice albedo, associated with a lower specific surface area, suggests an overall increase in ice density and a larger size of air bubbles within the ice in the GrIS bare-ice region.
After 2000, the metamorphism of bare ice in the Greenland bare-ice region has been mainly reflected in the decrease in SSA, which leads to ice darkening. This, in turn, induces regional near-surface temperature increases, causing snowmelt and ultimately resulting in a reduction in snow cover. Changes in snow cover directly determine the extent of bare-ice exposure and significantly affect the albedo through snow albedo feedback. The obvious snow cover reduction attributed to the changes in the physical properties of bare ice will cause more dark-ice exposure and darkening and make a constant contribution to albedo reduction in this ablation zone, suggesting a potential linkage between the bare-ice albedo and the snow albedo feedback.
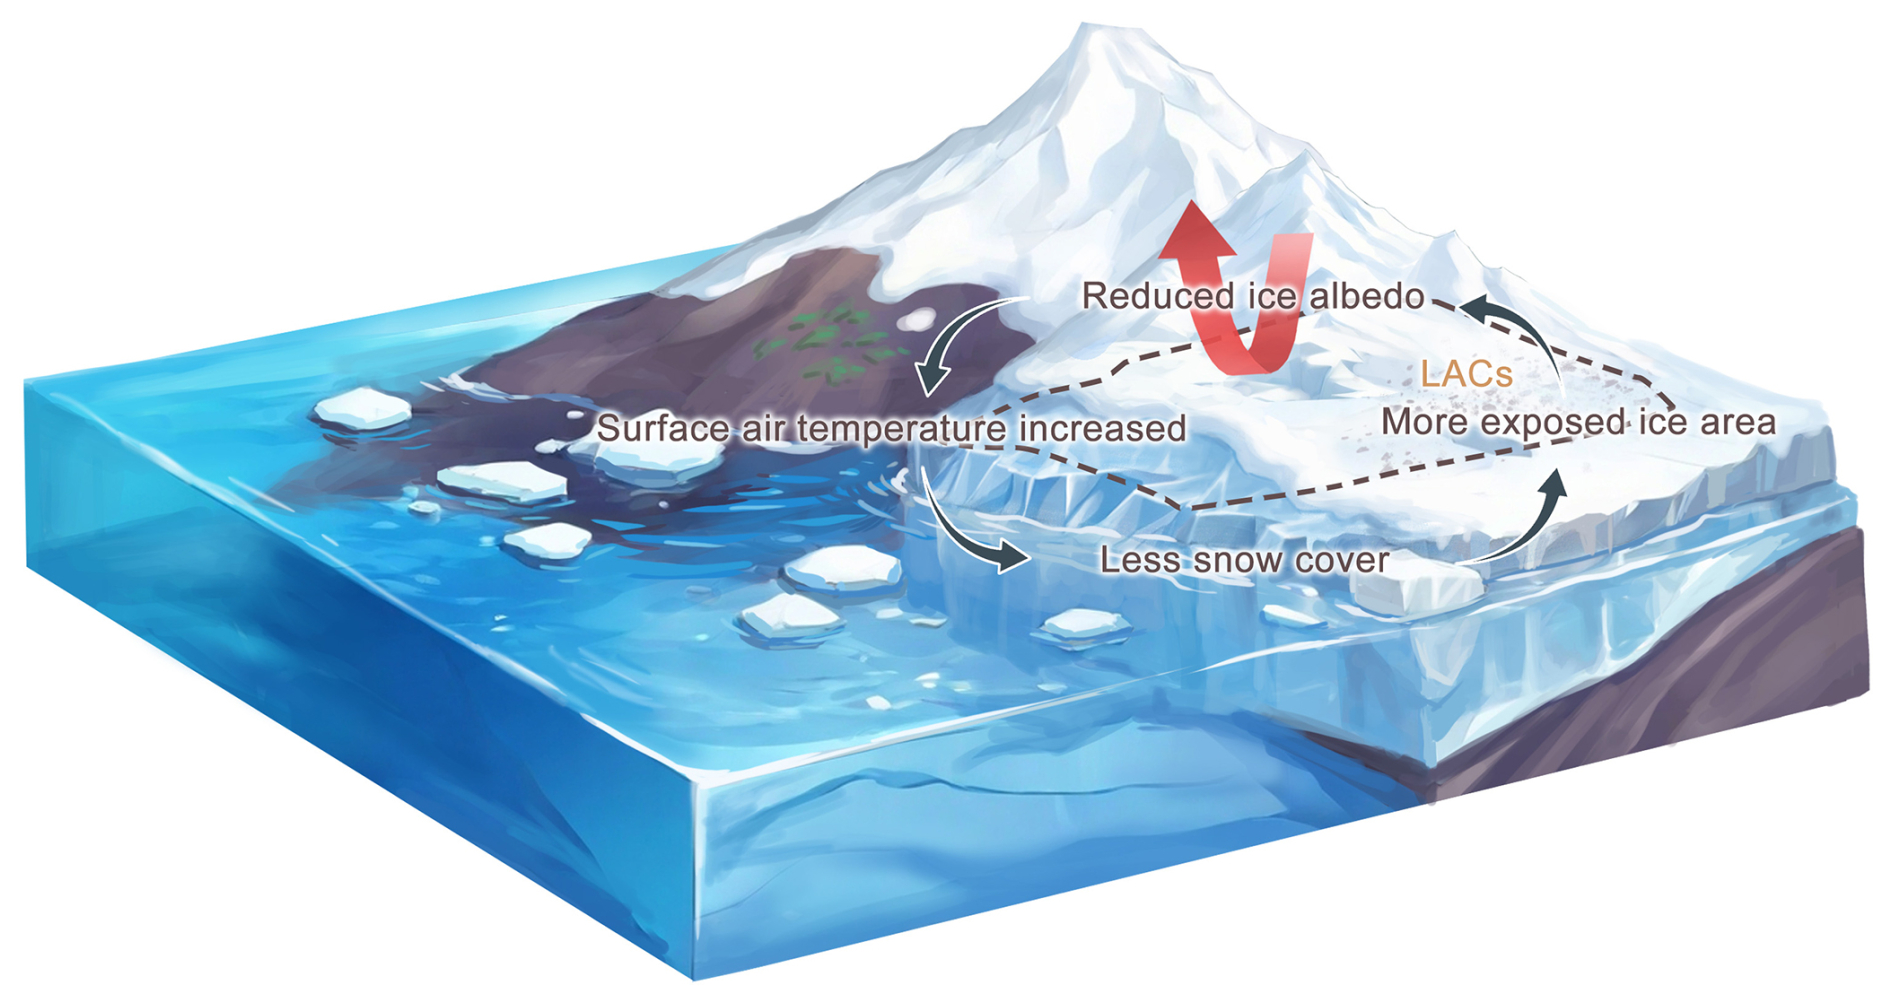
Figure 11Illustration of the bare-ice–snow albedo feedback over the Greenland Ice Sheet. A reduction in ice albedo, primarily driven by changes in bare-ice surface properties, exposes more bare ice, further lowering regional albedo and raising surface air temperatures. This leads to a decline in snow cover, which accelerates bare-ice exposure and reinforces radiative forcing. This positive feedback loop intensifies melt, particularly in the ablation zone, contributing to increased surface darkening and meltwater production.
In this study, we incorporated SNICAR-ADv4 into CoLM and made an enhanced MODIS-informed bare-ice physical properties to explore the response of the bare-ice albedo to ice metamorphism under polar warming. The application of SNICAR-ADv4, together with the integration of MODIS-derived bare-ice properties, significantly improved albedo simulations by reducing the bias introduced by the default constant ice albedo treatment. Specifically, bias reductions of 38 %, 50 %, and 28 % were achieved for broadband, visible, and near-infrared albedo, respectively. This improvement stems not only from the physically enhanced radiative transfer calculations over the ice column in SNICAR-ADv4 but also from the critical incorporation of MODIS-constrained ice optical properties, such as ice density and bubble radius. These additions provide better physical realism and representation of surface conditions across the bare-ice zone. The snow and ice treatment used in the CoLM–SNICAR-ADv4 and CoLM–SNICAR-AD schemes is summarized in Fig. 1, and it is evident that SNICAR-ADv4 performs radiative transfer calculations not only over the snow column but also over the ice column. During the summertime of 2000–2020, the bare-ice BBA decreased by 0.032 due to the changes in bare-ice physical properties. The subsequent darkening of the bare ice led to a 2 m air temperature forcing of 0.071 °C, a change in snow cover of −0.011, and snow water equivalent of −1.345 mm over the 21-year period, suggesting that even a slight reduction in bare-ice albedo can produce measurable climate responses in the ablation region.
Our results are consistent with and extend recent progress in modeling bare-ice albedo modeling over the GrIS. Antwerpen et al. (2022) demonstrated that the regional MAR model overestimated bare-ice albedo by 22.8 % below 70° N, leading to significant underestimation of meltwater production. Similarly, Whicker-Clarke et al. (2024) found that the global E3SM ELM model overestimated shortwave broadband albedo by ∼ 5 % due to the use of fixed albedo parameters and showed that incorporating more realistic bare-ice albedo reduced the SMB by approximately 145 Gt between 2000 and 2021. Although both studies focus on the GrIS, they differ in model structure and spatial resolution: MAR is a high-resolution regional climate model, while E3SM ELM is part of a coarser-resolution global Earth system model. Despite these differences, both studies highlight a persistent systematic bias overestimation of bare-ice albedo. The convergence of evidence from diverse modeling frameworks underscores the need to improve bare-ice representation in land surface models. Building on these insights, our study examines the role of bare-ice metamorphism, particularly changes in specific surface area, in driving progressive surface darkening. By isolating the feedback between evolving ice properties and surface energy balance, we propose a physical mechanism for the observed albedo decline. Our sensitivity analysis underscores how bare-ice metamorphism can influence surface energy balance and the importance of incorporating such processes in future model developments.
Our findings also highlight the role of the bare-ice albedo feedback linked to changes in ice surface properties, as shown in Fig. 11. A marked reduction in snow cover occurred due to lowered albedo in the ablation zone, exposing more bare ice and further reducing regional albedo, especially in northern GrIS. This agrees with previous findings that increased bare-ice exposure has intensified the snow albedo feedback in this region, with its strength rising by 51 % from 2001 to 2017 (Ryan et al., 2019). The physical processes governing snowpack evolution play a crucial role in modulating surface albedo and associated feedbacks, particularly in the ablation zone of the GrIS, where snow loss accelerates bare-ice exposure and amplifies radiative forcing. More specifically, new snow quickly loses reflectivity through grain growth and vapor diffusion, with subsequent changes driven by temperature gradients and compaction (Flanner and Zender, 2006). Meltwater accelerates these processes through melt–refreeze cycles (Brun 1989), creating a self-reinforcing system where both ice exposure and snow aging enhance surface darkening. While biological and hydrological factors such as algal growth play a secondary role in ice darkening (Ryan et al., 2019), our results demonstrate that changes in bare-ice properties, particularly a downward trend in specific surface area at a rate of −0.007 yr−1, exert significant control over meltwater production. We collectively term these processes of the variation in the bare-ice albedo associated with snow melting the bare-ice–snow albedo feedback (Fig. 11). As rising temperatures may further reduce ice albedo, this feedback could substantially increase Greenland's contribution to sea level rise through enhanced melting (Ryan et al., 2019), highlighting the need for improved process understanding in climate projections.
This study advances our understanding of the performances of the GrIS's snow and ice albedo simulations using different snow/ice schemes (SNICAR-AD and SNICAR-ADv4) and the amplifying effect of bare ice on the albedo reduction through a bare-ice–snow feedback mechanism. However, three key limitations constrain our current findings. First, the 0.5° × 0.5° resolution is insufficient to accurately represent the narrow ablation zone, and a big resolution gap between MODIS data and the model output is a limitation of this study. Second, CoLM's representation of GrIS-glacier-prescribed fixed ice thickness and mass with internally retained meltwater prevents calculation of SMB and excludes ice melt contributions to runoff. Although computationally efficient, this simplification systematically underestimates meltwater export from Greenland's ablation zones, where surface processes and especially meltwater runoff are the dominant contributors to mass loss (Ryan et al., 2019; van den Broeke et al., 2016; The IMBIE Team, 2020). Third, methodological constraints prevent independent quantification of ice density and air bubble size effects, as their relationship is prescribed in the lookup table (ρice = 650 kg m−3 corresponds to Reff = 100 µm, ρice = 916 kg m−3 corresponds to Reff = 1500 µm) based on the standalone SNICAR-ADv4 model. Future work will address these limitations by employing higher-resolution modeling for a more precise delineation of bare-ice margins, improving the representation of surface mass balance and ice melt runoff through a more complete physically based snow and ice surface scheme, and establishing observational constraints on ice density and air bubble effective radius evolution to enhance ice albedo modeling. Future efforts are also needed to consider the actual LAC concentrations within the ice, including BC, dust, and snow algae, rather than relying on equivalent BC, and evaluate their impacts on GrIS mass loss using fully coupled land–atmosphere models, which may reveal more pronounced feedbacks than offline simulations.
The SNICAR-ADv4-enabled CoLM2024 code is available on GitHub at https://github.com/guoshuyang23/CoLM-SNICARADv4 (last access: 18 January 2025, https://doi.org/10.5281/zenodo.16936537, Guo et al., 2025). The standalone SNICAR-ADv4 model used in this study can be downloaded at https://github.com/chloewhicker/SNICAR-ADv4 (last access: 22 September 2024; Whicker et al., 2022). MODIS snow cover data (MOD10C1) used to make the cloud and snow mask for bare-ice pixels are available at https://doi.org/10.5067/MODIS/MOD10C1.061 (Hall and Riggs, 2021). MODIS surface reflectance data (MOD09CMG) used to retrieve the bare-ice properties are from https://doi.org/10.5067/MODIS/MOD09CMG.061 (Vermote, 2021). MODIS surface albedo data (MCD43C3) used to evaluate the simulations and retrieve the bare-ice properties are from https://doi.org/10.5067/MODIS/MCD43C3.061 (Schaaf and Wang, 2021).
The supplement related to this article is available online at https://doi.org/10.5194/tc-19-3553-2025-supplement.
SG designed the study and wrote the paper. YD was responsible for the conceptualization, supervision, and funding acquisition. HY contributed to revisions of the manuscript. HL provided technical support.
The contact author has declared that none of the authors has any competing interests.
Publisher's note: Copernicus Publications remains neutral with regard to jurisdictional claims made in the text, published maps, institutional affiliations, or any other geographical representation in this paper. While Copernicus Publications makes every effort to include appropriate place names, the final responsibility lies with the authors.
We thank Chloe A. Whicker-Clarke for sharing the method for processing files on ice optical properties in the standalone SNICAR-ADv4 model for use in land surface models. We acknowledge the two anonymous reviewers for their constructive comments that substantially improved our paper.
This research was funded by the Guangdong Major Project of Basic and Applied Basic Research (grant no. 2021B0301030007), the National Natural Science Foundation of China (grant nos. U2342227, 42075160, and 42088101), the Southern Marine Science and Engineering Guangdong Laboratory (Zhuhai) (grant no. SML2023SP216), and the specific research fund of the Innovation Platform for Academicians of Hainan Province (grant no. YSPTZX202143).
This paper was edited by Xavier Fettweis and reviewed by two anonymous referees.
Alexander, P. M., Tedesco, M., Fettweis, X., van de Wal, R. S. W., Smeets, C. J. P. P., and van den Broeke, M. R.: Assessing spatio-temporal variability and trends in modelled and measured Greenland Ice Sheet albedo (2000–2013), The Cryosphere, 8, 2293–2312, https://doi.org/10.5194/tc-8-2293-2014, 2014.
Antwerpen, R. M., Tedesco, M., Fettweis, X., Alexander, P., and van de Berg, W. J.: Assessing bare-ice albedo simulated by MAR over the Greenland ice sheet (2000–2021) and implications for meltwater production estimates, The Cryosphere, 16, 4185–4199, https://doi.org/10.5194/tc-16-4185-2022, 2022.
Box, J. E., Fettweis, X., Stroeve, J. C., Tedesco, M., Hall, D. K., and Steffen, K.: Greenland ice sheet albedo feedback: thermodynamics and atmospheric drivers, The Cryosphere, 6, 821–839, https://doi.org/10.5194/tc-6-821-2012, 2012.
Briegleb, B. P. and Light, B.: A Delta-Eddington multiple scattering parameterization for solar radiation in the sea ice component of the Community Climate System Model, NCAR/TN472+STR, National Center for Atmospheric Research, https://doi.org/10.5065/D6B27S71, 108 pp., 2007.
Brun, E.: Investigation of wet-snow metamorphism in respect of liquid-water content, Ann. Glaciol., 13, 22–26, https://doi.org/10.3189/S0260305500007576, 1989.
Chen, X., Zhang, X., Church, J. A., Watson, C. S., King, M. A., Monselesan, D., Legresy, B., and Harig C.: The increasing rate of global mean sea-level rise during 1993–2014, Nat. Clim. Change, 7, 492–495, https://doi.org/10.1038/nclimate3325, 2017.
Chevrollier, L. A., Cook, J. M., Halbach, L., Jakobsen, H., Benning, L. G., Anesio, A. M., and Tranter, M.: Light absorption and albedo reduction by pigmented microalgae on snow and ice, J. Glaciol., 69, 333–341, https://doi.org/10.1017/jog.2022.64, 2023.
Cogley, J. G., Hock, R., Rasmussen, L. A., Arendt, A. A., Bauder, A., Braithwaite, R. J., Jansson, P., Kaser, G., Möller, M., and Nicholson, L.: Glossary of glacier mass balance and related terms (p. 86), IHP-VII Technical Documents in Hydrology No, UNESCO-IHP, Paris, 2011.
Cook, J. M., Tedstone, A. J., Williamson, C., McCutcheon, J., Hodson, A. J., Dayal, A., Skiles, M., Hofer, S., Bryant, R., McAree, O., McGonigle, A., Ryan, J., Anesio, A. M., Irvine-Fynn, T. D. L., Hubbard, A., Hanna, E., Flanner, M., Mayanna, S., Benning, L. G., van As, D., Yallop, M., McQuaid, J. B., Gribbin, T., and Tranter, M.: Glacier algae accelerate melt rates on the south-western Greenland Ice Sheet, The Cryosphere, 14, 309–330, https://doi.org/10.5194/tc-14-309-2020, 2020.
Danabasoglu, G., Lamarque, J. F., Bacmeister, J., Bailey, D. A., DuVivier, A. K., Edwards, J., Emmons, L. K., Fasullo, J. T., Garcia, R., Gettelman, A., Hannay, C., Holland, M. M., Large, W. G., Lauritzen, P., Lawrence, D. M., Lenaerts-Jan T. M., Lindsay, K., Lipscomb, W. H, Mills, M. J., Neale, R., Oleson, K., Otto-Bliesner, B., Phillips, A. S., Sacks, W. J., Tilmes, S., van Kampenhout, L., Vertenstein, M., Bertini, A., Dennis, J., Deser, C., Fischer, C., Fox-Kemper, B., Elizabeth-Kay, J., Kinnison, D., Kushner, P., Larson, V. E., Long, M., Mickelson, S., Moore, J. K., Nienhouse, E., Polvani, L., Rasch, P. J., and Strand, W. G.: The community Earth system model version 2 (CESM2), J. Adv. Model. Earth Sy., 12, e2019MS001916, https://doi.org/10.1029/2019MS001916, 2020.
Dang, C., Zender, C. S., and Flanner, M. G.: Intercomparison and improvement of two-stream shortwave radiative transfer schemes in Earth system models for a unified treatment of cryospheric surfaces, The Cryosphere, 13, 2325–2343, https://doi.org/10.5194/tc-13-2325-2019, 2019.
Feng, S., Cook, J. M., Naegeli, K., Anesio, A. M., Benning, L. G., and Tranter, M.: The impact of bare ice duration and geo-topographical factors on the darkening of the Greenland Ice Sheet, Geophys. Res. Lett., 51, e2023GL104894, https://doi.org/10.1029/2023GL104894, 2024.
Flanner, M. G. and Zender, C. S.: Linking snowpack microphysics and albedo evolution, J. Geophys. Res., 111, D12208, https://doi.org/10.1029/2005JD006834, 2006.
Flanner, M. G., Zender, C. S., Randerson, J. T., and Rasch, P. J.: Present-day climate forcing and response from black carbon in snow, J. Geophys. Res., 112, D11202, https://doi.org/10.1029/2006jd008003, 2007.
Flanner, M. G., Liu, X., Zhou, C., Penner, J. E., and Jiao, C.: Enhanced solar energy absorption by internally-mixed black carbon in snow grains, Atmos. Chem. Phys., 12, 4699–4721, https://doi.org/10.5194/acp-12-4699-2012, 2012.
Flanner, M. G., Arnheim, J. B., Cook, J. M., Dang, C., He, C., Huang, X., Singh, D., Skiles, S. M., Whicker, C. A., and Zender, C. S.: SNICAR-ADv3: a community tool for modeling spectral snow albedo, Geosci. Model Dev., 14, 7673–7704, https://doi.org/10.5194/gmd-14-7673-2021, 2021.
Friedl, M. A., Sulla-Menashe, D., Tan, B., Schneider, A., Ramankutty, N., Sibley, A., and Huang X.: Modis collection 5 global land cover: algorithm refinements and characterization of new datasets, Remote Sens. Environ., 114, 168–182, https://doi.org/10.1016/j.rse.2009.08.016, 2010.
Gardner, A. S. and Sharp, M. J.: A review of snow and ice albedo and the development of a new physically based broadband albedo parameterization, J. Geophys. Res., 115, F01009, https://doi.org/10.1029/2009JF001444, 2010.
Guo, S., Dai, Y., Yuan, H., and Liang, H.: CoLM-SNICARADv4 (Version v1.0.0), Zenodo [code], https://doi.org/10.5281/zenodo.16936537, 2025.
Hall, D. K. and Riggs, G. A.: MODIS/Terra Snow Cover Daily L3 Global 0.05Deg CMG. (MOD10C1, Version 61), NASA National Snow and Ice Data Center Distributed Active Archive Center [data set], https://doi.org/10.5067/MODIS/MOD10C1.061, 2021.
Hao, D., Bisht, G., Rittger, K., Bair, E., He, C., Huang, H., Dang, C., Stillinger, T., Gu, Y., Wang, H., Qian, Y., and Leung, L. R.: Improving snow albedo modeling in the E3SM land model (version 2.0) and assessing its impacts on snow and surface fluxes over the Tibetan Plateau, Geosci. Model Dev., 16, 75–94, https://doi.org/10.5194/gmd-16-75-2023, 2023.
He, C. and Flanner, M.: Snow albedo and radiative transfer: Theory, modeling, and parameterization, in: Springer series in light scattering, Springer, 67–133, https://doi.org/10.1007/978-3-030-38696-2_3, 2020.
He, C., Takano, Y., Liou, K. N., Yang, P., Li, Q., and Chen, F.: Impact of snow grain shape and black carbon–snow internal mixing on snow optical properties: Parameterizations for climate models, J. Climate, 30, 10019–10036, https://doi.org/10.1175/jcli-d-17-0300.1, 2017.
He, C., Flanner, M. G., Chen, F., Barlage, M., Liou, K.-N., Kang, S., Ming, J., and Qian, Y.: Black carbon-induced snow albedo reduction over the Tibetan Plateau: uncertainties from snow grain shape and aerosol–snow mixing state based on an updated SNICAR model, Atmos. Chem. Phys., 18, 11507–11527, https://doi.org/10.5194/acp-18-11507-2018, 2018.
He, C., Liou, K. N., Takano, Y., Chen, F., and Barlage, M.: Enhanced snow absorption and albedo reduction by dust-snow internal mixing: Modeling and parameterization, J. Adv. Model. Earth Sy., 11, 3755–3776, https://doi.org/10.1029/2019ms001737, 2019.
He, C., Flanner, M., Lawrence, D. M., and Gu, Y.: New features and enhancements in community land model (CLM5) snow albedo modeling: Description, sensitivity, and evaluation, J. Adv. Model. Earth Sy., 16, e2023MS003861, https://doi.org/10.1029/2023MS003861, 2024.
Hofer, S., Tedstone, A. J., Fettweis, X., and Bamber, J. L.: Decreasing cloud cover drives the recent mass loss on the Greenland Ice Sheet, Sci. Adv., 3, e1700584, https://doi.org/10.1126/sciadv.1700584, 2017.
King, M. D., Howat, I. M., Candela, S. G., Noh, M. J., Jeong, S., Noël, B. P. Y., Van den Broeke, M. R., Wouters, B., and Negrete, A.: Dynamic ice loss from the Greenland Ice Sheet driven by sustained glacier retreat, Commun. Earth Environ., 1, 1, https://doi.org/10.1038/s43247-020-0001-2, 2020.
Kochtitzky, W., Copland, L., King, M., Hugonnet, R., Jiskoot, H., Morlighem, M., Millan, R., Khan, S. A., and Noël, B.: Closing Greenland's mass balance: Frontal ablation of every Greenlandic glacier from 2000 to 2020, Geophys. Res. Lett., 50, e2023GL104095, https://doi.org/10.1029/2023GL104095, 2023.
Li, Y., Yang, K., Gao, S., Smith, L. C., Fettweis, X., and Li, M.: Surface meltwater runoff routing through a coupled supraglacial-proglacial drainage system, Inglefield Land, northwest Greenland, Int. J. Appl. Earth. Obs., 106, 102647, https://doi.org/10.1016/j.jprocont.2022.08.003, 2022.
Mouginot, J., Rignot, E., Bjørk, A. A., van den Broeke, M., Millan, R., Morlighem, M., Noël, B., Scheuchl, B., and Wood, M.: Forty-six years of Greenland Ice Sheet mass balance from 1972 to 2018, P. Natl. Acad. Sci. USA, 116, 9239–9244, https://doi.org/10.1073/pnas.1904242116, 2019.
Mullen, P. C. and Warren, S. G.: Theory of the optical properties of lake ice, J. Geophys. Res., 93, 8403–8414, https://doi.org/10.1029/JD093iD07p08403, 1988.
Müller, F. and Keeler, C. M.: Errors in short term ablation measurements on melting ice surfaces, J. Glaciol., 8, 91–105, 1969.
Naegeli, K., Damm, A., Huss, M., Wulf, H., Schaepman, M., and Hoelzle, M.: Cross-Comparison of albedo products for glacier surfaces derived from airborne and satellite (Sentinel-2 and Landsat 8) optical data, Remote Sens.-Basel, 9, 110, https://doi.org/10.3390/rs9020110, 2017.
Nolin, A. W. and Stroeve, J.: The changing albedo of the Greenland ice sheet: implications for climate modeling, Ann. Glaciol., 25, 51–57, https://doi.org/10.1017/s0260305500013793, 1997.
Picard, G., Libois, Q., and Arnaud, L.: Refinement of the ice absorption spectrum in the visible using radiance profile measurements in Antarctic snow, The Cryosphere, 10, 2655–2672, https://doi.org/10.5194/tc-10-2655-2016, 2016.
Ryan, J. C.: Contribution of surface and cloud radiative feedbacks to Greenland Ice Sheet meltwater production during 2002-2023, Commun. Earth Environ., 5, 538, https://doi.org/10.1038/s43247-024-01714-y, 2024.
Ryan, J. C., Smith, L. C., van As, D., Cooley, S. W., Cooper, M. G., Pitcher, L. H., and Hubbard, A.: Greenland Ice Sheet surface melt amplified by snowline migration and bare ice exposure, Sci. Adv., 5, eaav3738, https://doi.org/10.1126/sciadv.aav3738, 2019.
Sasgen, I., Wouters, B., Gardner, A. S., King, M. D., Tedesco, M., Landerer, F. W., Dahle, C., Save, H., and Fettweis, X.: Return to rapid ice loss in Greenland and record loss in 2019 detected by the GRACE-FO satellites, Commun. Earth Environ, 1, 1–8, https://doi.org/10.1038/s43247-020-0010-1, 2020.
Schaaf, C. and Wang, Z.: MODIS/Terra+Aqua BRDF/Albedo Albedo Daily L3 Global 0.05Deg CMG V061, NASA Land Processes Distributed Active Archive Center [data set], https://doi.org/10.5067/MODIS/MCD43C3.061, 2021.
Schaaf, C., Wang, Z., and Strahler, A. H.: Commentary on Wang and Zender-MODIS snow albedo bias at high solar zenith angles relative to theory and to in situ observations in Greenland, Remote. Sens. Environ., 115, 1296–1300, https://doi.org/10.1016/j.rse.2011.01.002, 2011.
Schneider, A., Flanner, M., De Roo, R., and Adolph, A.: Monitoring of snow surface near-infrared bidirectional reflectance factors with added light-absorbing particles, The Cryosphere, 13, 1753–1766, https://doi.org/10.5194/tc-13-1753-2019, 2019.
Schneider, A., Zender, C., Loeb, N., and Price, S.: Useofshallow icecoremeasurements toevaluate andconstrain 1980–1990 global reanalyses oficesheetprecipitation rates, Geophys. Res. Lett., 50, e2023GL103943, https://doi.org/10.1029/2023GL103943, 2023.
Shimada, R., Takeuchi, N., and Aoki, T.: Inter-annual and geographical variations in the extent of bare ice and dark ice on the Greenland ice sheet derived from MODIS satellite images, Front Earth Sci., 4, 43, https://doi.org/10.3389/feart.2016.00043, 2016.
Stibal, M., Box, J. E., Cameron, K. A., Langen, P. L., Yallop, M. L., Mottram, R. H., Khan, A. L., Molotch, N. P., Chrismas, N. A. M., Quaglia, F. C., Remias, D., Smeets, P., Van den Broeke, M. R., and Ryan, J.: Algae drive enhanced darkening of bare ice on the Greenland ice sheet, Geophys. Res. Lett., 44, 11463–11471, https://doi.org/10.1002/2017GL075958, 2017.
Stroeve, J., Box, J. E., Gao, F., Liang, S., Nolin, A., and Schaaf, C.: Accuracy assessment of the MODIS 16-day albedo product for snow: Comparisons with Greenland in situ measurements, Remote. Sens. Environ., 94, 46–60, https://doi.org/10.1016/j.rse.2004.09.001, 2005.
Tedesco, M., Doherty, S., Fettweis, X., Alexander, P., Jeyaratnam, J., and Stroeve, J.: The darkening of the Greenland ice sheet: trends, drivers, and projections (1981–2100), The Cryosphere, 10, 477–496, https://doi.org/10.5194/tc-10-477-2016, 2016.
Tedstone, A. J., Bamber, J. L., Cook, J. M., Williamson, C. J., Fettweis, X., Hodson, A. J., and Tranter, M.: Dark ice dynamics of the south-west Greenland Ice Sheet, The Cryosphere, 11, 2491–2506, https://doi.org/10.5194/tc-11-2491-2017, 2017.
Tedstone, A. J., Cook, J. M., Williamson, C. J., Hofer, S., McCutcheon, J., Irvine-Fynn, T., Gribbin, T., and Tranter, M.: Algal growth and weathering crust state drive variability in western Greenland Ice Sheet ice albedo, The Cryosphere, 14, 521–538, https://doi.org/10.5194/tc-14-521-2020, 2020.
The IMBIE team: Mass balance of the Greenland ice sheet from 1992 to 2018, Nature, 579, 233–239, https://doi.org/10.1038/s41586-019-1855-2, 2020.
Toon, O. B., McKay, C. P., Ackerman, T. P., and Santhanam, K.: Rapid calculation of radiative heating rates and photodissocia-tion rates in inhomogeneous multiple scattering atmospheres, J. Geophys. Res., 94, 16287–16301, https://doi.org/10.1029/jd094id13p16287, 1989.
Urraca, R., Lanconelli, C., and Cappucci, F.: Gobron, N. Comparison of Long-Term Albedo Products against Spatially Representative Stations over Snow, Remote Sens.-Basel, 14, 3745, https://doi.org/10.3390/rs14153745, 2022.
van den Broeke, M. R., Enderlin, E. M., Howat, I. M., Kuipers Munneke, P., Noël, B. P. Y., van de Berg, W. J., van Meijgaard, E., and Wouters, B.: On the recent contribution of the Greenland ice sheet to sea level change, The Cryosphere, 10, 1933–1946, https://doi.org/10.5194/tc-10-1933-2016, 2016.
van den Broeke, Box, J., Fettweis, X., Hanna, E., Noël, B., Tedesco, M., van As, D., van de Berg, W. J., and van Kampenhout, L.: Greenland Ice Sheet Surface Mass Loss: Recent Developments in Observation and Modeling, Curr. Clim. Change Rep., 3, 345356, https://doi.org/10.1007/s40641-017-0084-8, 2017.
Vermote, E.: MODIS/Terra Surface Reflectance Daily L3 Global 0.05Deg CMG V061, NASA EOSDIS Land Processes Distributed Active Archive Center [data set], https://doi.org/10.5067/MODIS/MOD09CMG.061, 2021.
Warren, S. G. and Wiscombe, W. J.: A model for the spectral albedo of snow. II: Snow containing atmospheric aerosols, J. Atmos. Sci., 37, 2734–2745, https://doi.org/10.1175/1520-0469(1980)037<2734:amftsa>2.0.co;2, 1980.
Whicker, C. A., Flanner, M. G., Dang, C., Zender, C. S., Cook, J. M., and Gardner, A. S.: SNICAR-ADv4: a physically based radiative transfer model to represent the spectral albedo of glacier ice, The Cryosphere, 16, 1197–1220, https://doi.org/10.5194/tc-16-1197-2022, 2022.
Whicker-Clarke, A., Antwerpen, R., Flanner, M. G., Schneider, A., Tedesco, M., and Zender, C. S.: The effect of physically based ice radiative processes on Greenland ice sheet albedo and surface mass balance in E3SM, J. Geophys. Res.-Atmos., 129, e2023JD040241, https://doi.org/10.1029/2023JD040241, 2024.
Williamson, C. J., Anesio, A. M., Cook, J., Tedstone, A., Poniecka, E., Holland, A., Fagan, D., Tranter, M., and Yallop, M.: Ice algal bloom development on the surface of the Greenland Ice Sheet, FEMS Microbiol. Ecol., 94, https://doi.org/10.1093/femsec/fiy025, 2018.
Wiscombe, W. J. and Warren, S. G.: A model for the spectral albedo of snow. I: Pure snow, J. Atmos. Sci., 37, 2712–2733, https://doi.org/10.1175/1520-0469(1980)037<2712:amftsa>2.0.co;2, 1980.
Ye, F., Cheng, Q., Hao, W., Yu, D., Ma, C., Liang, D., and Shen, H.: Reconstructing daily snow and ice albedo series for Greenland by coupling spatiotemporal and physics-informed models, Int. J. Appl. Earth Obs., 124, 103519, https://doi.org/10.1016/j.jag.2023.103519, 2023.