the Creative Commons Attribution 4.0 License.
the Creative Commons Attribution 4.0 License.
 | 03 Sep 2025
Modelling the evolution of permafrost temperatures and active layer thickness in King George Island, Antarctica, since 1950
Joana Pedro Baptista
Gonçalo Brito Guapo Teles Vieira
António Manuel de Carvalho Soares Correia
Hyoungseok Lee
Sebastian Westermann
The dynamics of permafrost and the active layer is crucial for ecosystem processes in the ice-free areas of the Antarctic Peninsula, where a strong long-term warming trend with an increase of 3.4 °C in the mean annual air temperature since 1950 has been recorded. The consequences of this warming for past and future permafrost degradation are still not fully understood, mainly due to the sparse spatial coverage and limited time span of borehole data, which have only been available since the mid- to late 2000s. This motivated the application of the CryoGrid community model (CCM) for modelling ground temperatures at the bedrock drilled King Sejong Station (KSS) borehole on Barton Peninsula, King George Island. The objective was to assess the model's quality and potential for applicability in other ice-free areas of the Antarctic Peninsula, aiming to improve the understanding of the recent evolution of permafrost temperature and active layer thickness and reconstitute the past evolution since 1950. ERA5 reanalysis data underestimated air temperature, strongly impacting the rate and intensity of ground warming during the thawing seasons. Linear regression with in situ observations was used to correct the ERA5 forcing. The results of a short-term simulation from 2020–2022 evaluated against observations show that the model successfully represents the conditions at the KSS borehole. Down to 6 m depth, correlations above 0.9 were obtained, while below 6 m, the correlations were above 0.8. The mean absolute error ranged from 0.1 to 0.7 °C. Active layer depths of 2.9 to 3.1 m showed an overestimation of ca. 0.4 m. The long-term simulation of permafrost and active layer temperatures from 1950 to 2022 using ERA5 data showed a ground warming trend at 20 m of 0.25 °C per decade accompanied by an increase in the active layer thickness from 1.5 m in 1950 to 3.5 m in 2022. From 2015, the warming rate increased significantly to 0.9 °C per decade.
- Article
(5478 KB) - Full-text XML
- BibTeX
- EndNote


Permafrost underlies most ice-free areas of Antarctica, which are estimated to represent 0.5 % (45 000 to 70 000 km2) of its surface and are associated with a high uncertainty regarding the temperature evolution due to the limited number, coverage, and short data series of permafrost boreholes (Biskaborn et al., 2019; Bockheim et al., 2013; Hrbáček et al., 2021, 2023; Vieira et al., 2010). In the Antarctic Peninsula, this uncertainty is especially relevant considering the atmospheric warming trend since 1950, which led to an increase in the mean annual air temperature (MAAT) of 3.4 °C (from −5.3 recorded at Esperanza Station in 1946), making the region a hotspot of climate change (Bockheim et al., 2013; Turner et al., 2020; Vaughan et al., 2003). Several studies have aimed to enhance the understanding of permafrost temperature using statistical–empirical models, such as the temperature at the top of permafrost (TTOP), across different spatial scales to produce temperature estimations for one moment in time. In Obu et al. (2020), the TTOP model was used to estimate the temperature at the top of permafrost for all the ice-free areas of Antarctica at a resolution of 1 km2. The results for the South Shetland Islands show a TTOP value between −2 and 0 °C, with an underestimation of 1 to 2.1 °C when compared to observational data. This difference is attributed to factors such as heat advection from meltwater and rain – common in Maritime Antarctica but not accounted for in the model – or to cloudiness, which contaminated satellite observations of land surface temperature (LST) employed as model forcing (Obu et al., 2020; Østby et al., 2014).
In the South Shetland Archipelago, other studies have used the TTOP model at a local scale, including Ferreira et al. (2017) and Hrbáček et al. (2020), who applied the model on Livingston Island using ground and air temperatures. Ferreira et al. (2017) presented TTOP values ranging from −1.8 °C at 275 m a.s.l. to −0.7 °C at 15 m a.s.l., while Hrbáček et al. (2020) reported values between −1.5 and −0.2 °C. Both studies emphasized the necessity of incorporating detailed information on ground conditions, lithology, and moisture availability to improve TTOP estimations. Aiming to implement a modelling approach that not only incorporates site-specific characteristics but also provides estimations over defined periods rather than for single moments in time, we evaluated the application of the CryoGrid community model (CCM) (Westermann et al., 2017, 2023) in a 1D configuration for Barton Peninsula (King George Island) with the goal of assessing its potential for the reconstruction of recent permafrost temperature evolution in the region of the Antarctic Peninsula. The application was done for the King Sejong Station borehole (13 m depth, 127 m a.s.l.), for which we have hourly data since 2019.
The CCM is a flexible tool for simulating the ground thermal regime and the ice water balance. Its modular structure allows for the integration of surface conditions and subsurface materials. We configured the stratigraphy through a sensitivity analysis of different setups. Modelled temperatures were compared with borehole measurements at nine depths. These initial steps formed the basis for short-term (2020–2022) and long-term (1950–2022) simulations forced with ERA5 data. Two hypotheses were tested: (1) the CCM stratigraphy can accurately represent the surface and subsurface conditions at the King Sejong Station observatory, thereby incorporating detailed information that is missing from other models, and (2) ERA5 data can reliably reproduce meteorological conditions at Barton Peninsula when used to force model simulations. For the validation of the first hypothesis, a sensitivity analysis to subsurface parameters was performed comparing measured and simulated ground temperatures produced by simulations using different configurations. To validate the second hypothesis, a comparison between ERA5 air temperature and in situ observations was conducted.
The King Sejong Station borehole site is located on the Barton Peninsula (Fig. 1), an ice-free area with 10km2 in King George Island (South Shetland Archipelago, Antarctic Peninsula), exposed following the retreat of the Collins Glacier between 15 and 3.7 ka BP (Oliva et al., 2019). The relief is dominated by the Noel Hill, a west–east ridge (290 m a.s.l.) associated with a plutonic intrusion. At lower elevation, two plateaus are present, showing elevations of 170 and 130 m a.s.l. They are formed by volcanic strata dominated by andesitic lava flows with frequent dykes (Birkenmajer, 1989; Hwang et al., 2011; Kim et al., 2002). Cliffs are present on the western and southern coasts, while on the northern coast, a moderate and stepped slope connects from the plateaus to a series of raised beaches.
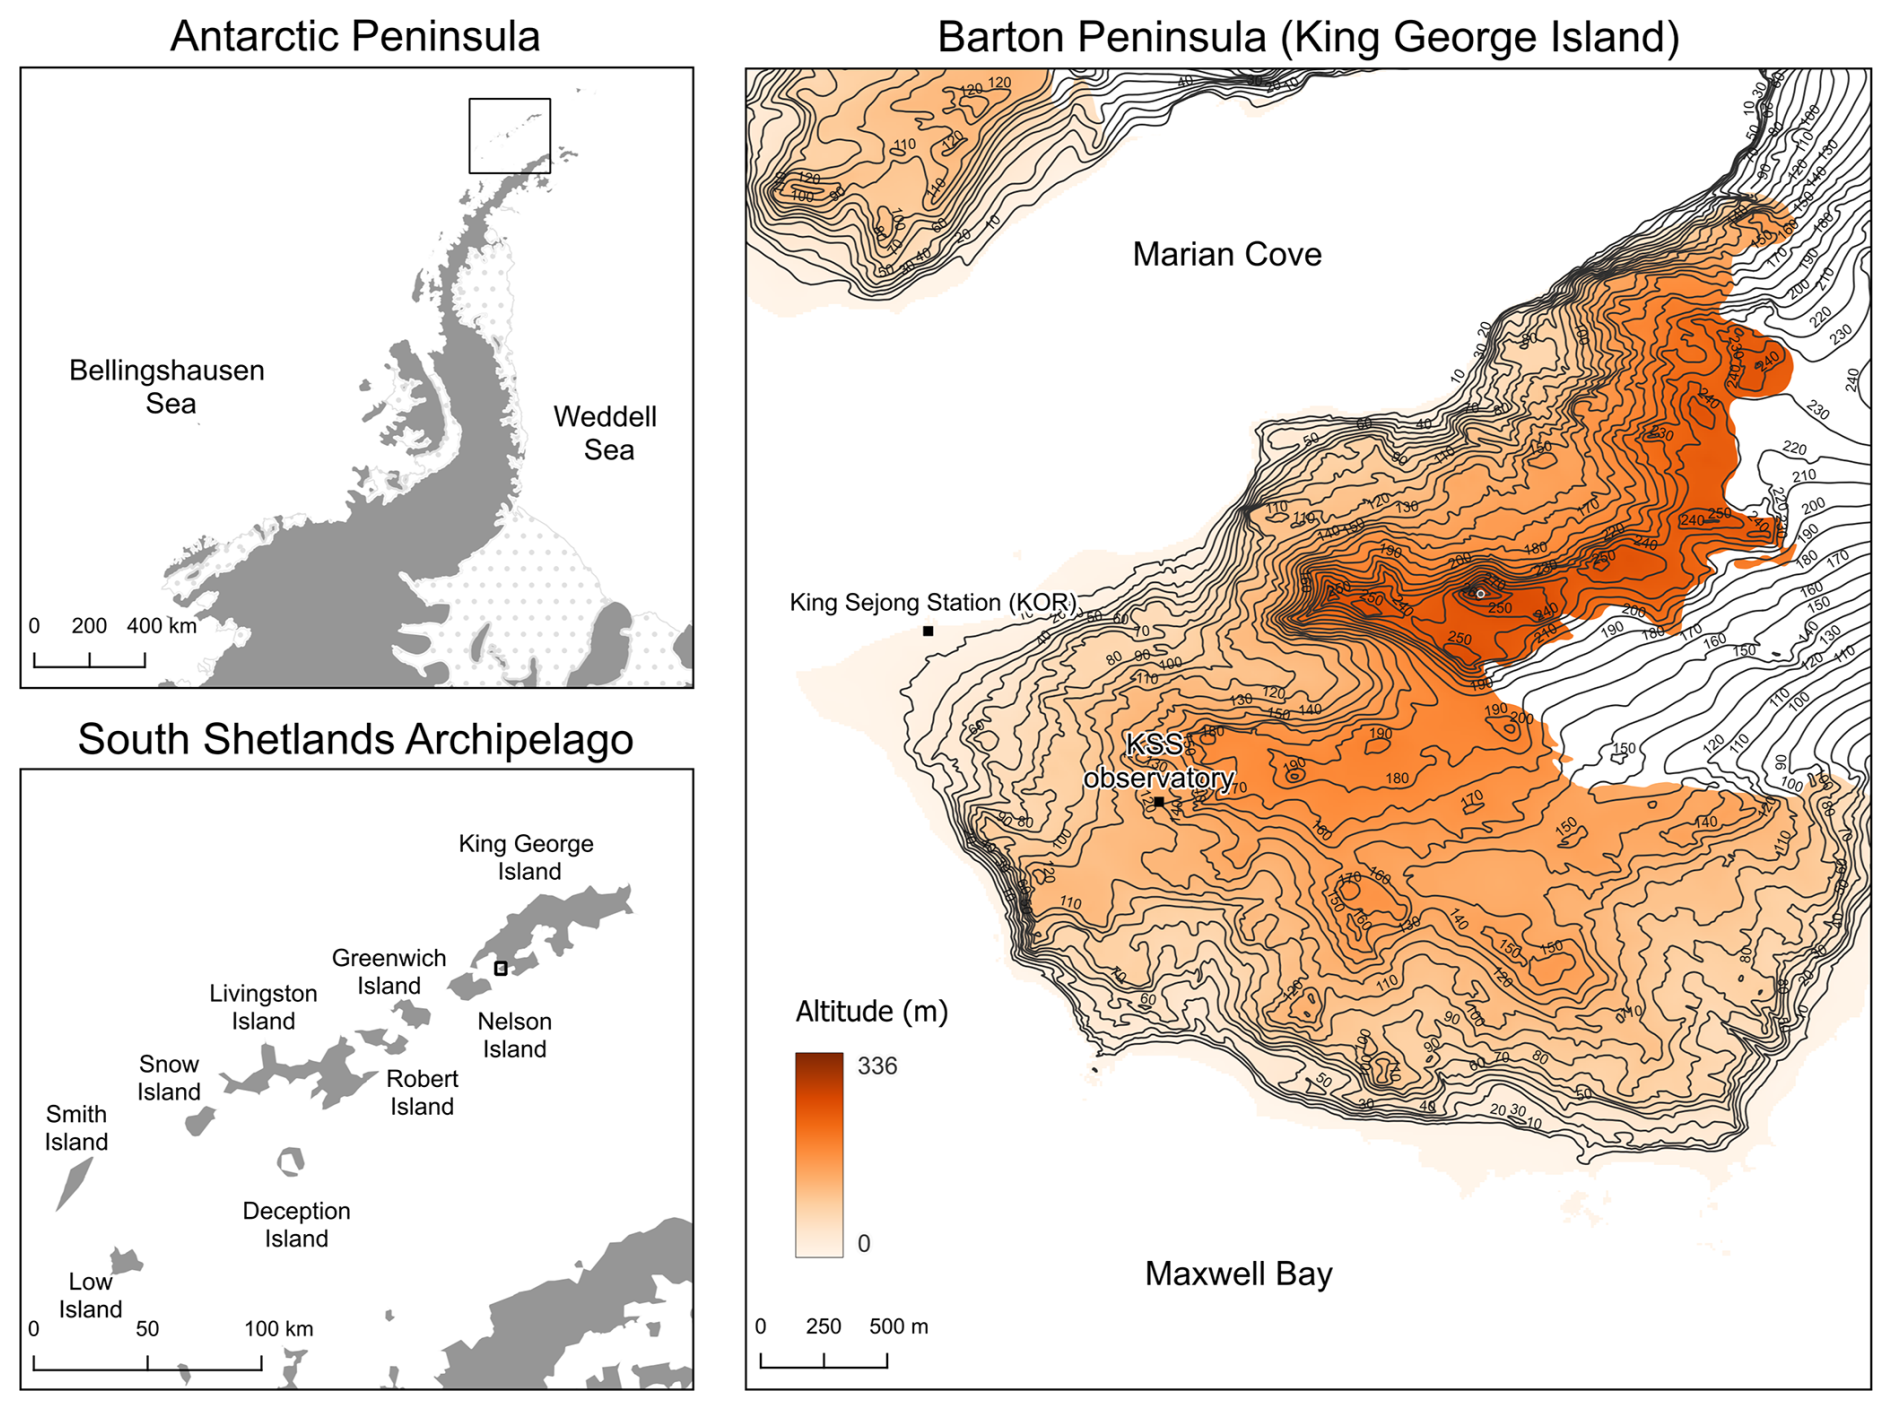
Figure 1Location of the King Sejong Station borehole in Barton Peninsula, King George Island. Contour equidistance 10 m.
The climate in Barton Peninsula is polar maritime and strongly affected by the interannual variability associated with the Southern Annular Mode (SAM), the El Niño–Southern Oscillation (ENSO), and the Amundsen Sea Low (ASL) (Jones et al., 2019). The Bellingshausen Station at nearby Fildes Peninsula recorded a mean annual air temperature of −3.8 °C in 1969 and −0.8 °C in 2022, with a warming rate of 0.02 °C yr−1. Mean monthly air temperatures ranged from −6.2 °C in July to 1.6 °C in February. The freezing season showed the largest interannual differences, with a range of 12.7 °C in July, while the thawing season showed lower interannual differences, with a range of 2.7 °C in January (Fig. 2).
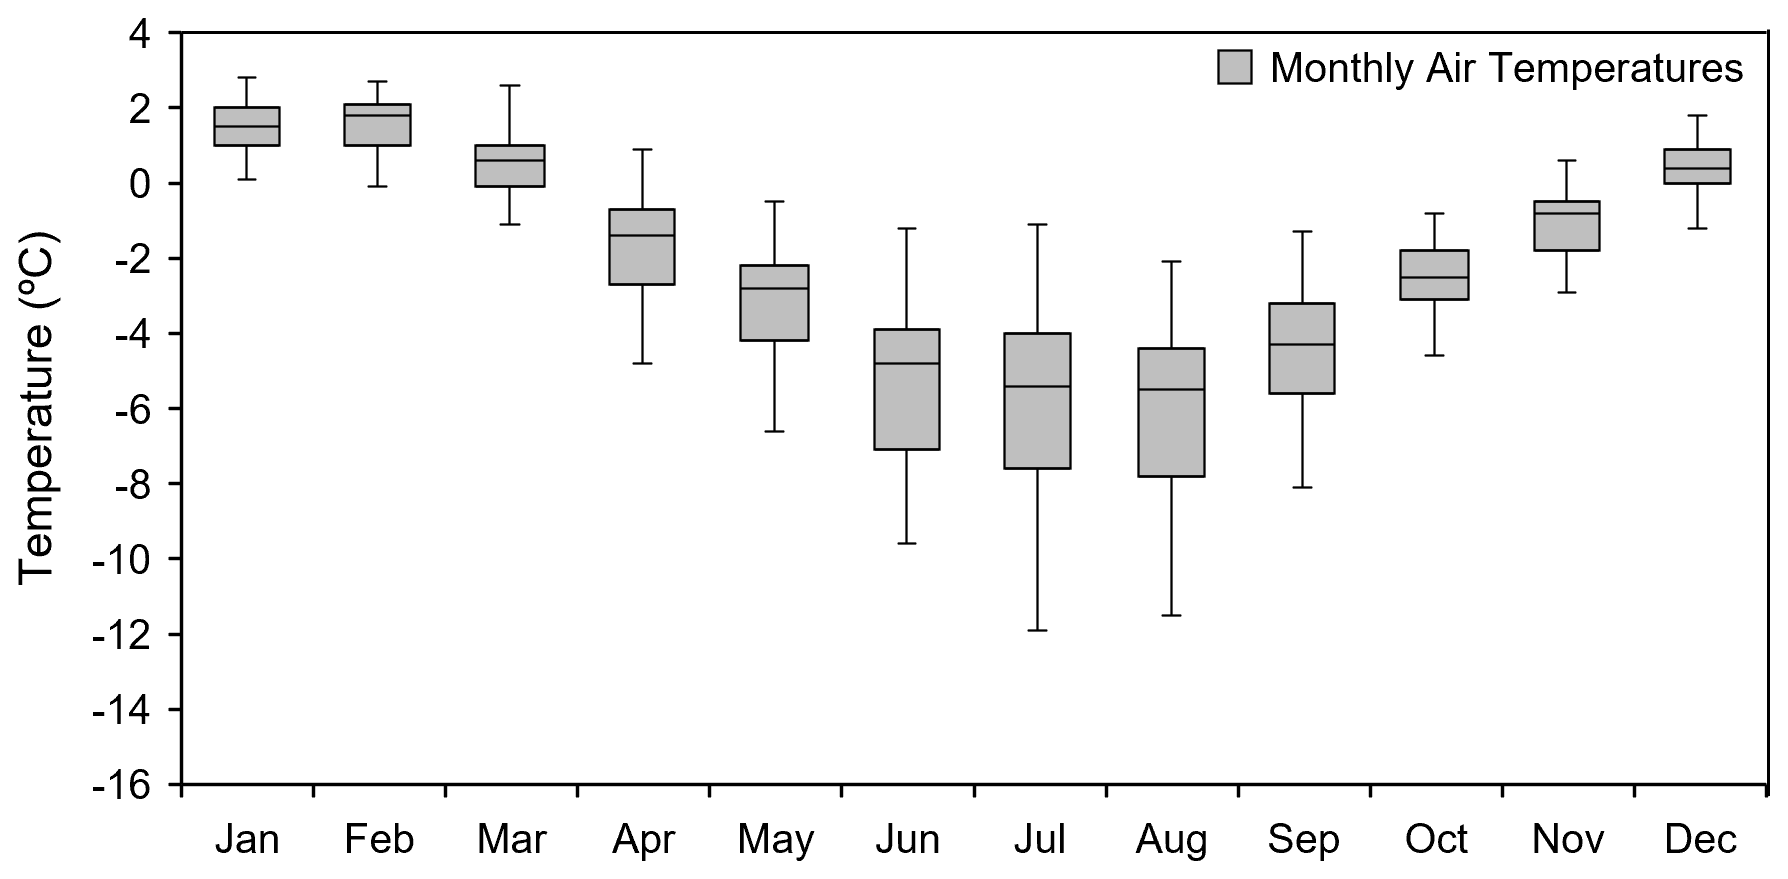
Figure 2Monthly air temperatures in Bellingshausen Station from 1969 to 2022; MET-READER Database (Colwell, 2013).
Ground temperatures on the Barton Peninsula were estimated by Obu et al. (2020), with mean annual ground temperature (MAGT) values ranging from −0.9 °C at sea level to −3.2 °C in unglaciated peaks. Lim et al. (2022) recorded mean annual ground surface temperatures (MAGST) from −3.6 (>200 m a.s.l.) to −0.8 °C (<50 m a.s.l.) while evaluating the snow cover effect on near-surface ground temperature between December 2011 and January 2013. Baptista et al. (2024) recorded MAGSTs between −2 and 0.6 °C, from 13 to 254 m a.s.l. in various topoclimatic settings. The authors identified seven types of ground surface temperature regimes based on the duration of the freezing season and warming velocity in the thawing season. The main controls on ground temperature regimes were elevation, snow cover duration, and potential solar radiation (Baptista et al., 2024).
3.1 Modelling workflow
The evaluation of the CCM potential to model permafrost and active layer thickness at the King Sejong Station observatory followed three main steps: model calibration, ERA5 quality assessment, and model simulations (Fig. 3). In an initial step, the subsurface stratigraphy and associated thermal parameters were defined using a sensitivity analysis, for which simulations forced by the observatory's measured ground surface temperature (GST) were run with different combinations of parameters (referred to as “sensitivity analysis to subsurface parameters” hereafter). Modelled ground temperatures were iteratively compared with observations until the best stratigraphy setup was found.
In the ERA5 quality assessment, air temperatures from the reanalysis data were compared to observations, leading to the implementation of a bias correction scheme. This bias correction was subsequently used to correct ERA5 air temperatures to obtain improved model forcing for short- (2020–2022) (Sect. 4.4) and long-term simulations (1950–2022) (Sect. 4.5).
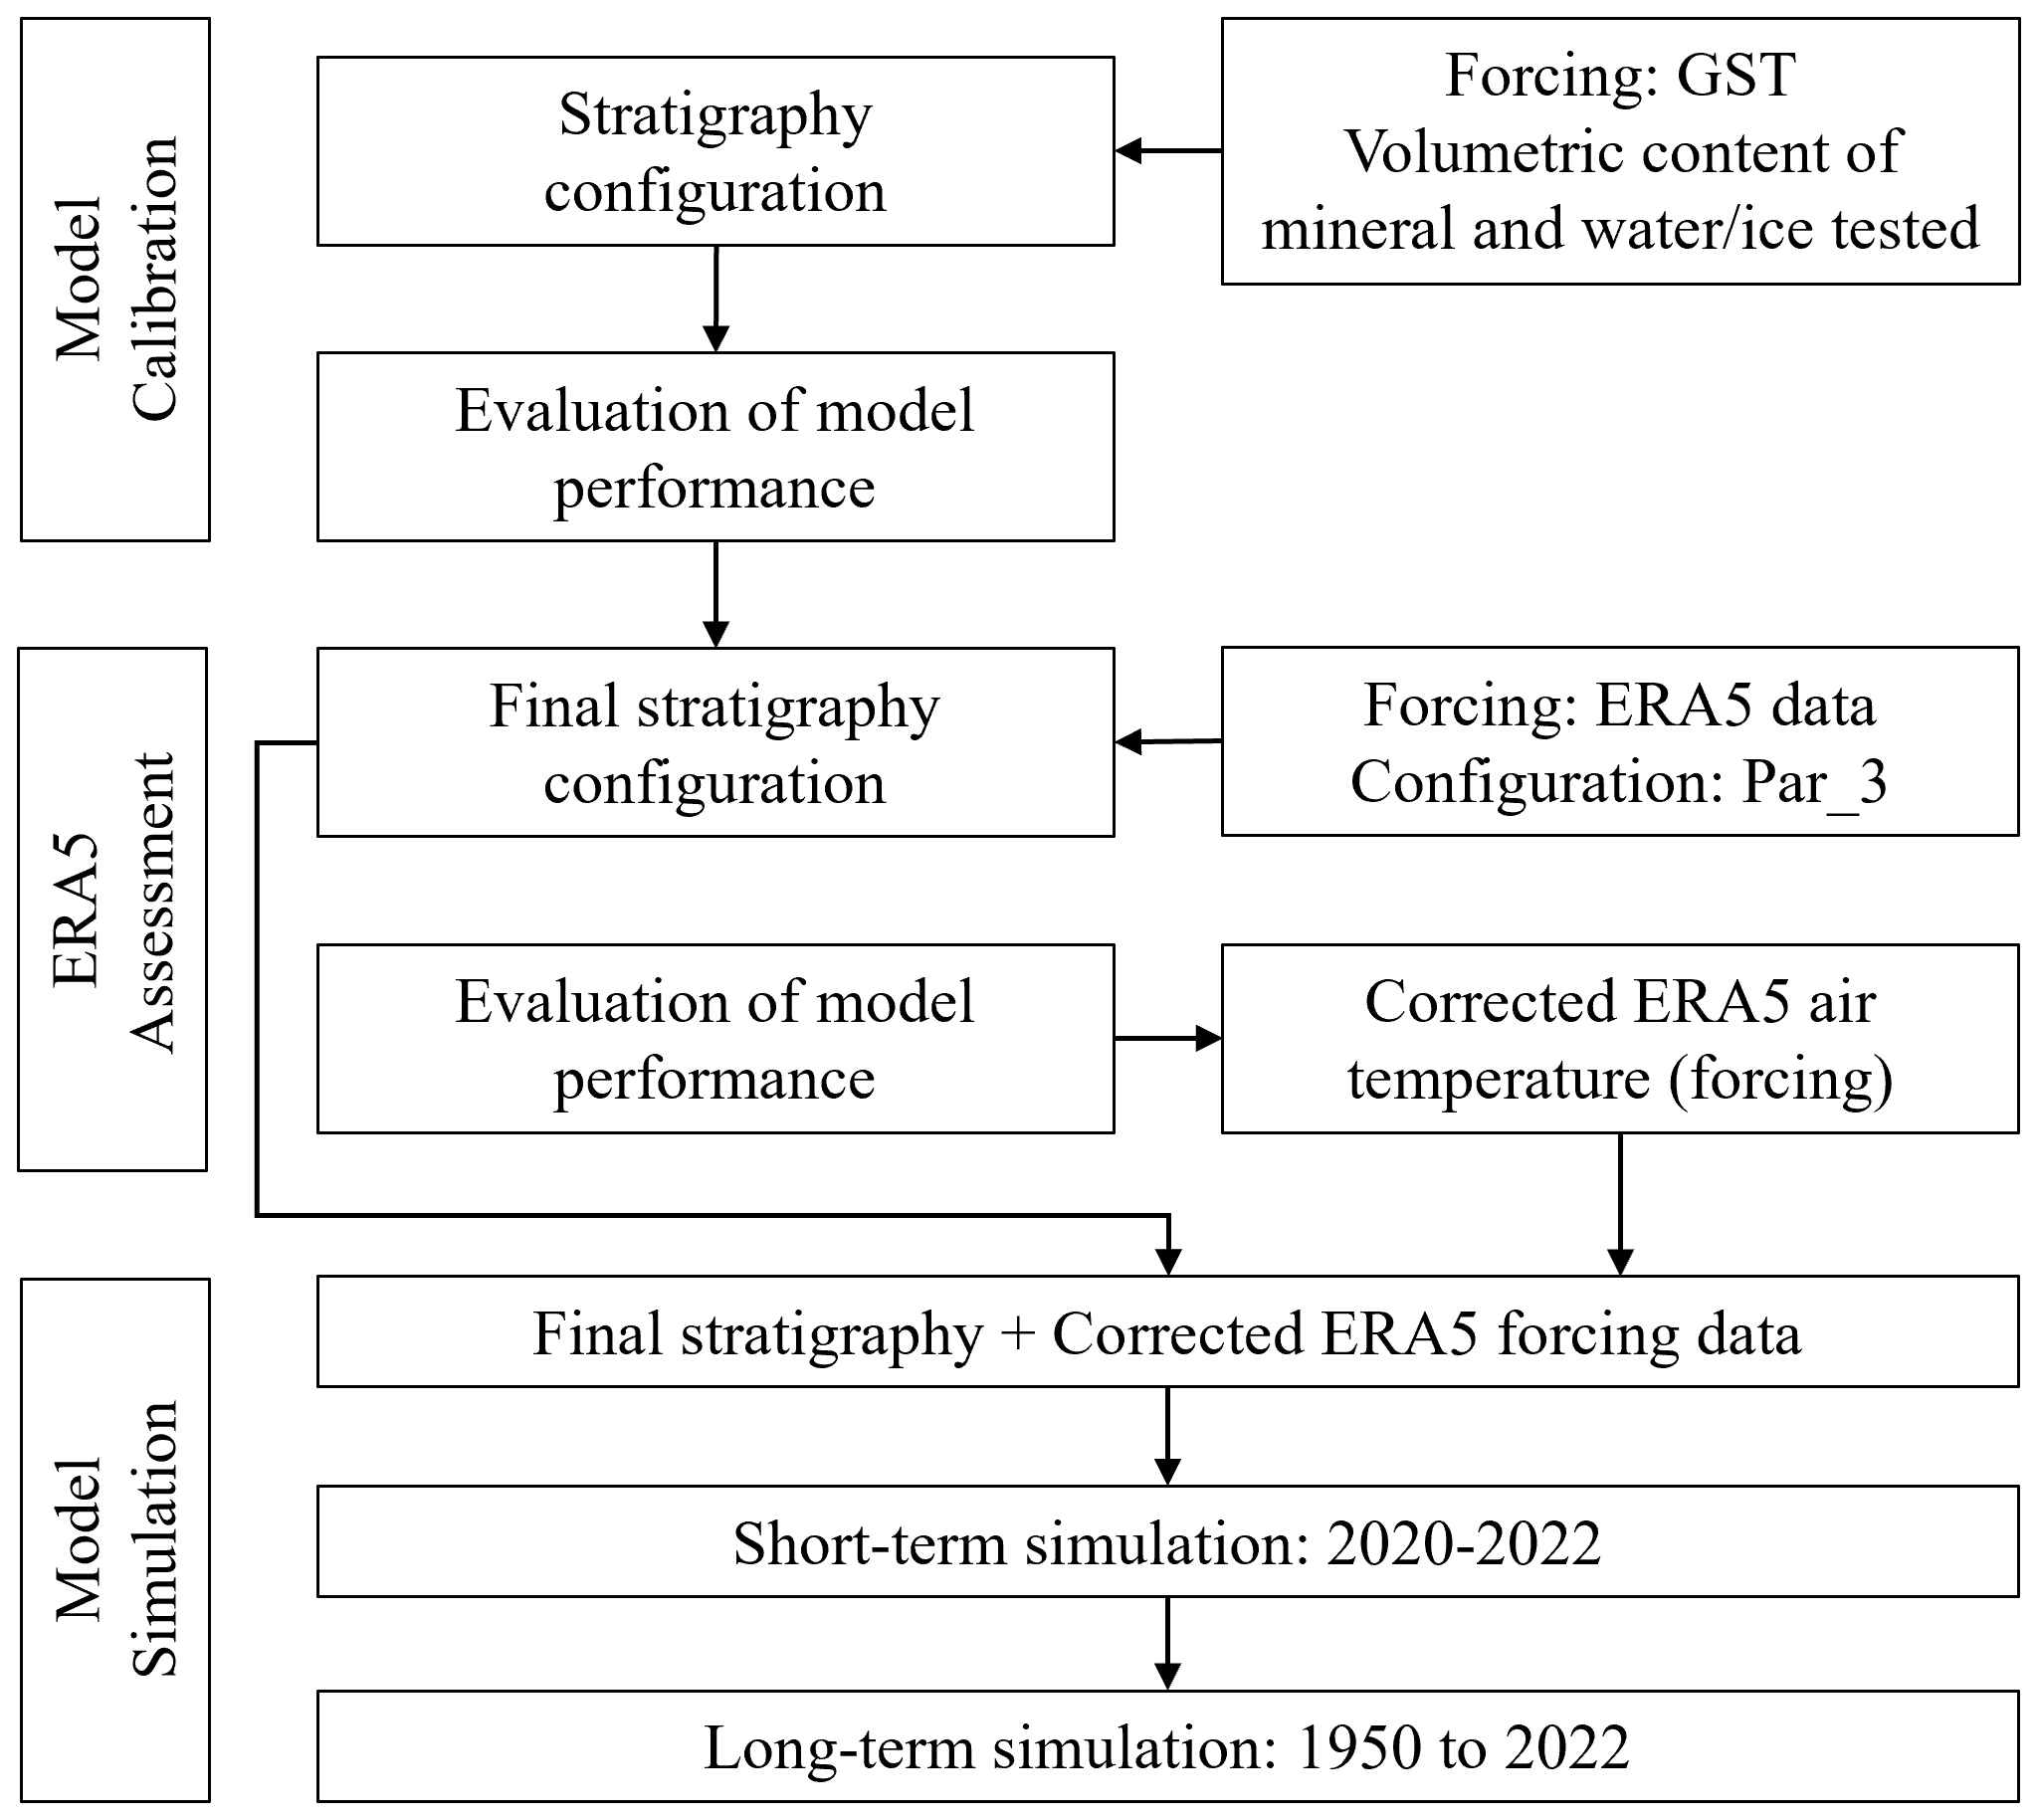
Figure 3Workflow for the application of the CryoGrid community model at 1D for the King Sejong Station (KSS) permafrost observatory.
3.2 Ground temperature data from the King Sejong Station permafrost observatory
The King Sejong Station (KSS) permafrost observatory, installed in March 2019, is part of the PERMANTAR network (University of Lisbon network of permafrost observatories in the western Antarctic Peninsula). It consists of a 13 m depth borehole drilled in an andesite spur in Jeonjaegyu Valley at 127 m a.s.l. The area is at the edge of an incipient glacial cirque where extensive frost shattered debris mantles the slopes, with the formation of active stone circles and solifluction lobes. Ground temperature data are recorded in the borehole with a Geoprecision M-Log5W-String data logger (accuracy ±0.1 °C) with a string with 15 temperature digital sensors at 0.4, 0.8, 1.2, 1.6, 2, 2.5, 3, 3.5, 4, 5, 6, 8, 10, 11.5, and 13 m depth. GST is monitored using a Geoprecision M-Log5W-Cable data logger (accuracy ±0.1 °C) buried at 2 cm depth. Air temperature is measured using a similar data logger protected by a radiation shield at 1.5 m. All data are recorded hourly. Here, we analyse the time series from March 2019 until December 2022. A data gap of 7 d occurred in February 2020.
The active layer thickness (ALT) at KSS was calculated by applying a logarithmic best fit to the maximum monthly temperatures at different depths, allowing us to identify the maximum depth of the 0 °C isotherm.
The freezing and thawing periods were determined following the approach of Karunaratne and Burn (2004), in which the beginning of the freezing (thawing) period corresponds to the date when the mean daily air and ground surface temperatures remain consistently below (above) 0 °C. Freezing degree days (FDD) and thawing degree days (TDD) are defined as the absolute sum of mean daily air and ground surface temperatures below (above) 0 °C during these periods (Klene et al., 2001; Smith and Riseborough, 1996).
Freezing N factors are calculated as the ratio of the FDD of the ground surface (FDDs) to the FDD of the air (FDDa) (Lunardini, 1978). For the thawing N factor, TDD values are used. N factors represent the insulating effect of snow on the ground. When close to 1, a strong thermal coupling exists between the ground and the atmosphere, whereas values below 0.5 indicate a high insulating effect.
3.3 The CryoGrid community model
3.3.1 Model description
The CCM is an adaptable toolbox for simulating the ground thermal regime and the ice water balance for permafrost using a modular structure which allows for combinations of classes that represent the snow conditions and the subsurface materials (Westermann et al., 2023).
It evolved from CryoGrid 1, which computes mean annual ground temperatures at the top of the permafrost (Gisnås et al., 2013). Subsequent versions introduced transient features for mapping temperature changes and a surface energy balance scheme for atmosphere–surface interaction (Westermann et al., 2023).
The model version used here integrates functionalities from previous versions. Its modular structure combines classes representing distinctive surface conditions and ground columns, where their specific physics and state are accounted for (Westermann et al., 2023). The objective is to stack and customize the classes that best represent the site for which the temperature is simulated.
For the KSS permafrost observatory, the CCM was used to produce both short- and long-term simulations of ground temperature depths of up to 20 m as well as active layer thickness. The short-term simulation, used for the validation of the surface energy balance model, covered the period with ground temperature data (2020 to 2022), with the first year (2019) used to define the ground temperature steady state. The long-term simulation spanned from 1950 to 2022.
3.3.2 Model calibration
For the sensitivity analysis to subsurface parameters, a 1D model column with 100 m depth was used, with the temperature boundary condition (class “GROUND_freeW_ubT”). Measured GST was used as the upper boundary input, and a geothermal heat flux was applied as the lower boundary. In this class, water phase change occurs at 0 °C, with the water an ice content remaining constant (Westermann et al., 2023).
All other simulations were performed using a 1D model column with the surface energy balance as the upper boundary condition and again the geothermal heat flux as the lower boundary condition (Westermann et al., 2023). ERA5 reanalysis near-surface variables were used as model forcing, i.e. incoming short- and longwave radiation (Sin and Lin) [W m−2], solid and liquid precipitation (Ps and Pl) [mm d−1], air pressure (p) [Pa], air temperature (Tair) [°C], wind speed (U) [m s−1], and specific humidity (qair) [kg water vapour kg air−1] (Westermann et al., 2023).
For the surface energy balance, the energy flux into the uppermost grid cell is calculated through Eq. (1), where Sout and Lout are the outgoing short- and longwave radiation and Qh and Qe the sensible and latent heat flux.
The seasonal snow cover was represented by a snow microphysics scheme following the Crocus model (Vionnet et al., 2012; Zweigel et al., 2021), again with surface energy balance as the upper boundary condition (class “SNOW_crocus_bucketW_seb” in the CCM). The snow model represents transient snow density changes due to compaction and wind drift, as well as meltwater infiltration and refreezing. However, given the complexity of the topography at the represented sites and the spatial resolution of ERA5 variables, the model may overestimate or underestimate snow depth. To address this, the ERA5-derived snow is corrected by snow multiplication factor, which allows us to phenomenologically increase or reduce the simulated snow depth to facilitate a better fit with observations (Martin et al., 2019). For the KSS permafrost observatory, a snow multiplication factor of 0.3 was used following the simulations for the validation of the surface energy balance model, where GST allows us to define the intensity of the insulating effect and duration of the snow cover. Additionally, snowpack properties such as grain size are computed, which affect the snowpack parameters such as the albedo.
The ground column was represented by the class “GROUND_freeW_ seb_snow” in the CCM (Westermann et al., 2023) using a vertical grid resolution ranging from 0.05 to 0.5 cm and an albedo of 0.3 following Kim et al. (2006). In this class, the phase change of water again occurs at 0 °C and the water and ice contents remain constant, but the surface energy balance is applied to simulate energy exchange processes between the atmosphere and the model's first grid cell (Westermann et al., 2023). The heat conduction is the main mode of heat transport in the subsurface. The conductive heat flux jhc is calculated based on Fourier's law:
The thermal conductivity (Kh) parameters depend on the volumetric contents of water, ice, air, mineral, and organics. For the mineral phase, we used a thermal conductivity of 2.1 W mK−1 obtained from thermophysical analysis performed on the rock cores at the laboratory of the Earth Sciences Institute of the University of Évora. The borehole was drilled in a massive rock outcrop where water infiltration is negligible so that vertical fluxes of water do not need to be considered. We thus assumed the sum of water and ice content to be constant over time for each grid cell, defined by the initialization.
For the sensitivity analysis to subsurface parameters, observed ground surface temperatures from January 2020 to December 2022 were used as the upper boundary condition for the thermal model. The relative volumetric content of mineral and water ice were tested in three combinations, with values ranging from 0.99 to 1 (mineral) and 0 to 0.02 (water and ice). For each simulation, the correlations between daily average ground temperatures at 0.02, 0.4, 1.2, 2, 3, 4, 6, 10, and 13 m depths with the observed temperatures were analysed, enabling us to identify the parameterization that produced the best results.
The short-term simulation was used for the validation of the surface energy balance model. For the long-term simulation starting in 1950, the initial ground temperature profile is unknown. Therefore, a spin-up using the first 10 years of the ERA5 data (1940–1949) and looping it 10 times was conducted to define the temperature profile in the beginning of the simulation (e.g. Westermann et al., 2023).
3.4 Model forcing
ERA5 combines model data with observations using a data assimilation approach which results in a dataset where hourly estimates for atmospheric, ocean-wave, and land surface quantities are provided at a spatial resolution of 0.25° on a lat–long grid (Hersbach et al., 2020). Tetzner et al. (2019) identified a seasonal cold bias on the 2 m air temperature and an underestimation of wind speed in Antarctic Peninsula coastal regions despite a good representation of the wind regimes. Moreover, the extreme and remote conditions of Antarctica pose significant challenges for data assimilation, contributing to potential biases in surface temperature and precipitation estimates (Jones and Lister, 2015).
For the short- and long-term simulations, surface level data from ERA5 were interpolated to the location of the borehole: (a) surface solar radiation downwards (J m−2), (b) surface thermal radiation downwards (J m−2), (c) total precipitation (m), (d) 10 m u component of wind (m s−1), (e) 10 m v component of wind (m s−1), (f) surface pressure (Pa), and (g) 2 m dew point temperature (K).
For air temperature (which is the only atmospheric variable measured in situ), a comparison between ERA5 and in situ measurements was performed which revealed significant deviations in particular during summer. The ERA5-derived air temperature was thus corrected using the downscale protocol described in Westermann et al. (2016) in which a linear regression is used to correct the model forcing.
4.1 Air and ground temperatures at the King Sejong Station observatory
The KSS permafrost observatory is exposed to frequent northwestern and western winds and recorded a MAAT of −1.55 °C from 2020 to 2022. The coldest month is August, with an average of −6 °C. By contrast, in January, we recorded the higher temperatures with an average of 2 °C. The freezing season lasted from March to November, with monthly temperatures ranging from −5.7 °C (August) to 0.3 °C (March) (Fig. 4). This period showed a higher interannual temperature range from −8.8 (2020) to −3 °C (2022), while in the thawing seasons (TSs), ranges were typically below 2 °C (Fig. 4).
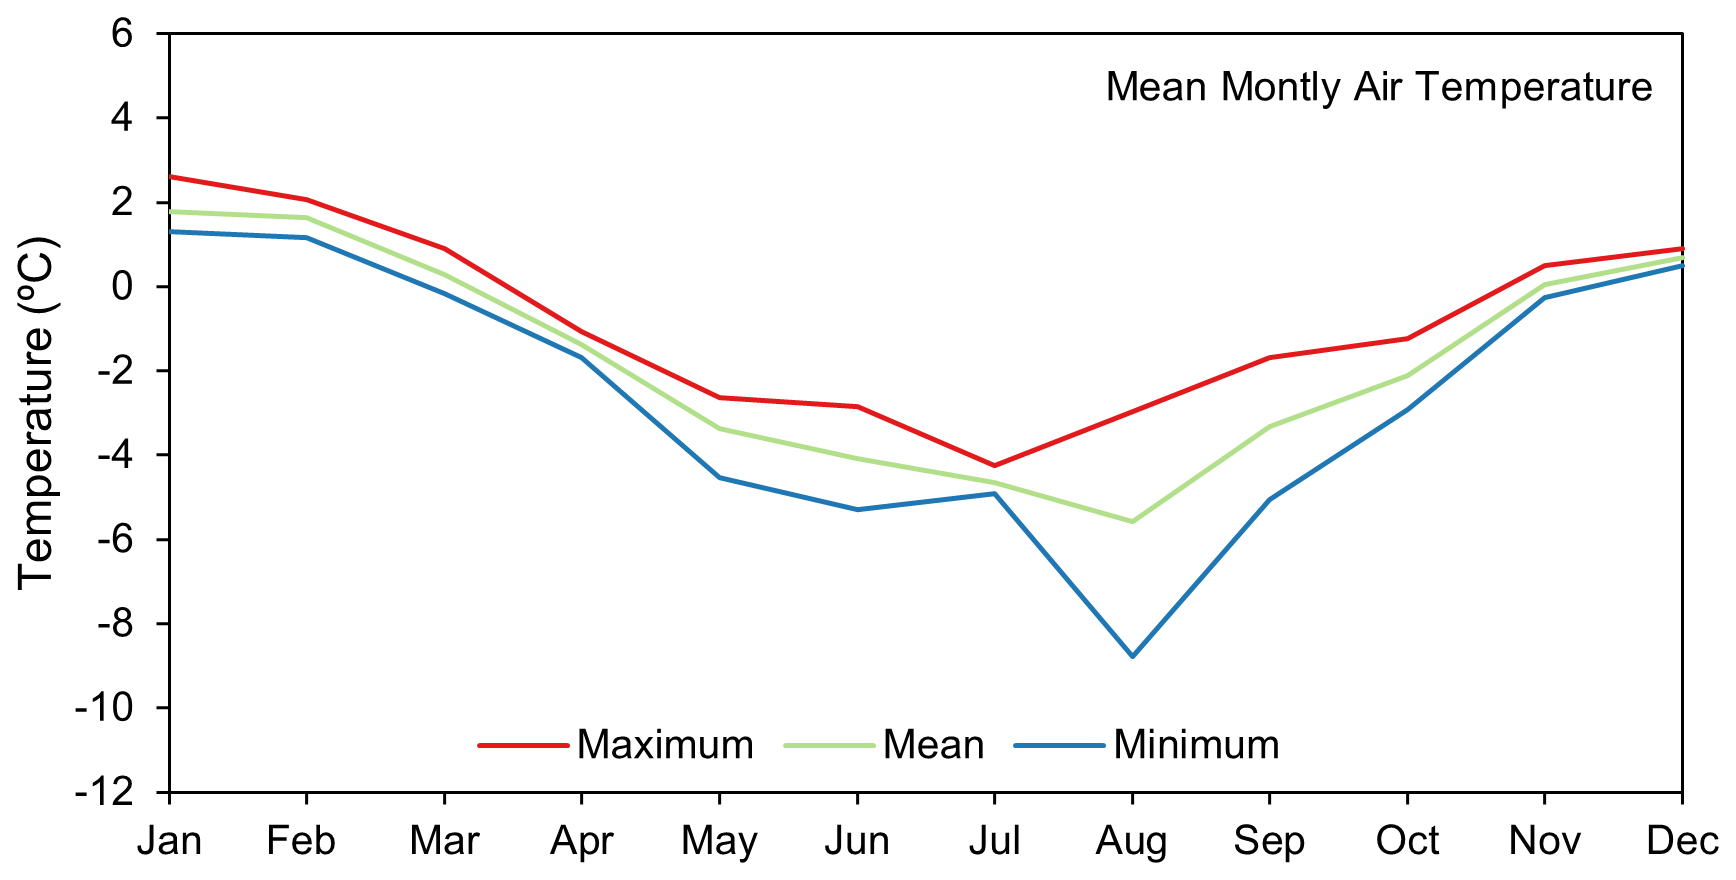
Figure 4Mean monthly air temperatures recorded in King Sejong Station observatory from January 2020 to December 2022.
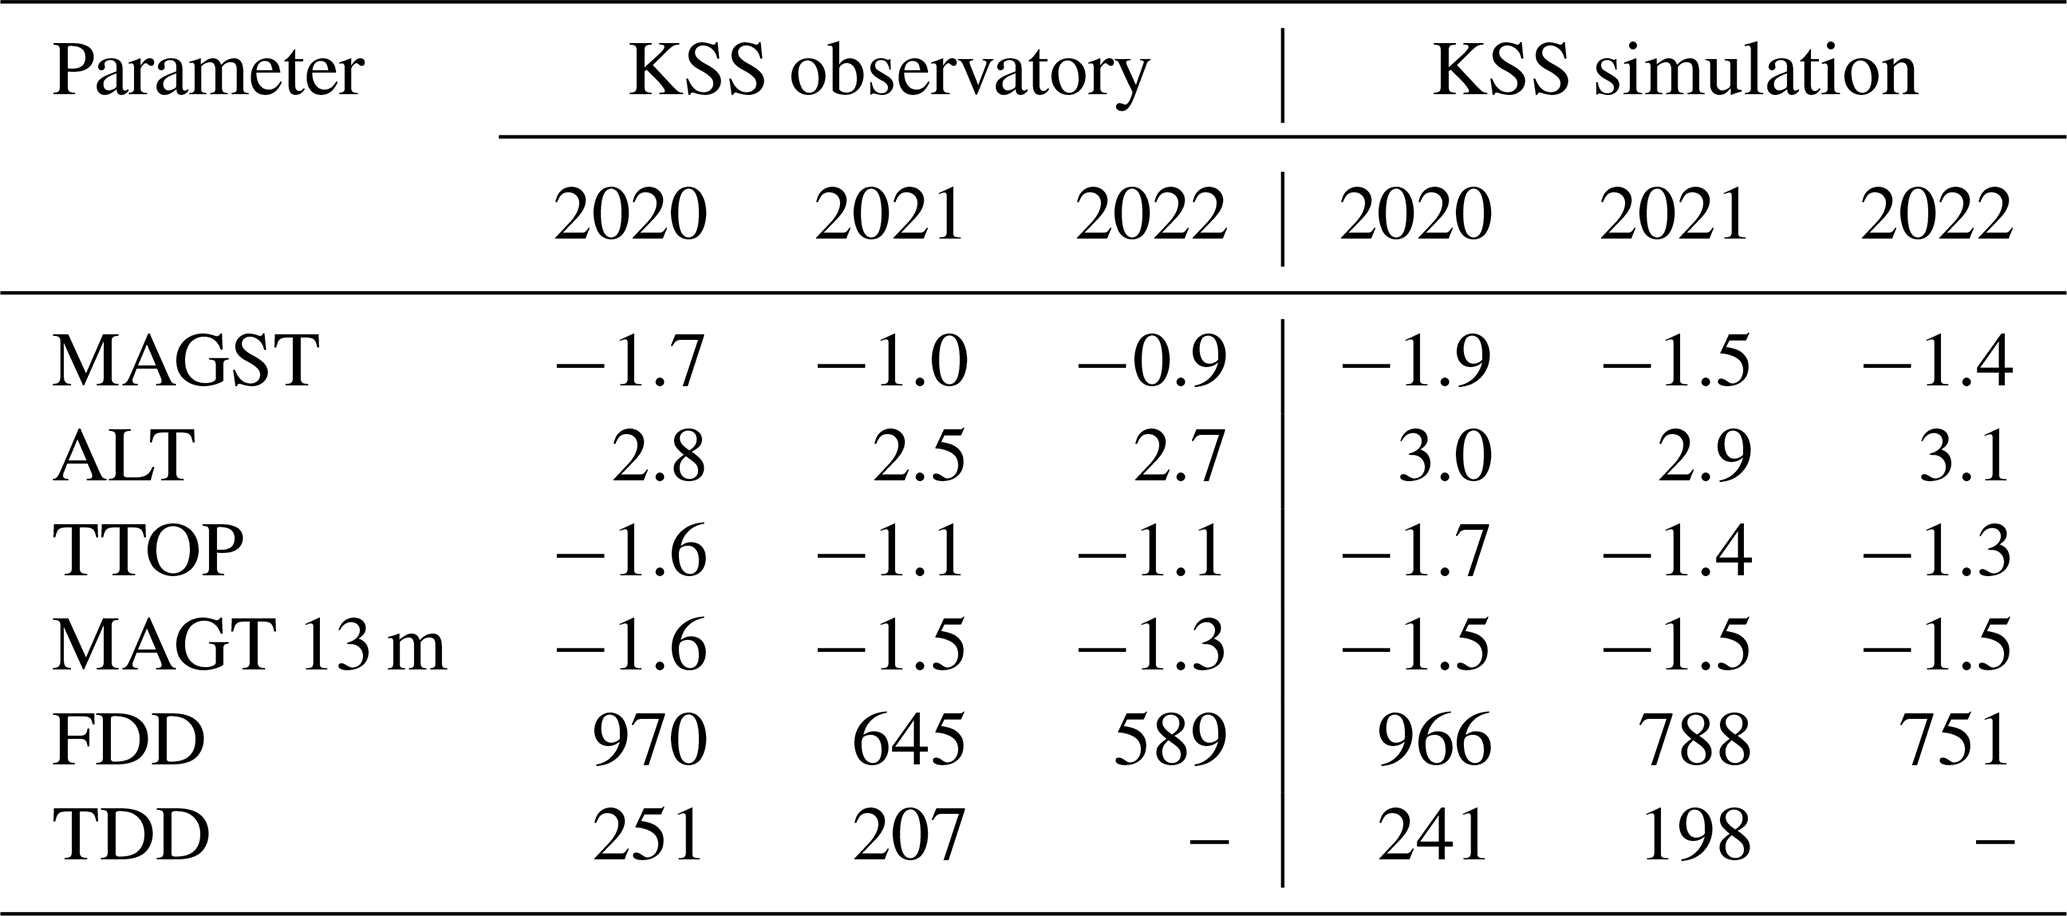
Mean daily ground surface temperatures ranged from −16 to 9 °C, while mean monthly temperatures varied between −8 (August 2020) and 5 °C (January 2020) (Fig. 5). At 13 m depth, the permafrost temperature varied between −1.5 and −1.3 °C (Fig. 5 and Table 1).
During the freezing season (FS) of 2020, intense ground surface cooling was observed due to lower air temperatures that averaged −3.3 °C, with daily lows reaching −20 °C. This, combined with strong thermal coupling due to a thin snow cover (N factor = 1), resulted in 970 FDDs (Table 1). In the freezing season of 2022, air temperatures did not fall below −15 °C, leading to a lower number of FDD (589) and an N factor of 0.9, indicating weaker thermal coupling between the surface and atmosphere. For the thawing season (TS) of 2020/2021, the average air temperature of 1.2 °C was slightly higher compared to the thawing season of 2021/2022 with 1.0 °C. This was also reflected in the TDDs, which decreased from 251 in 2020 to 207 in 2021. Despite this, the N factor increased from 1.7 to 1.9 over the period, suggesting improved thermal coupling.
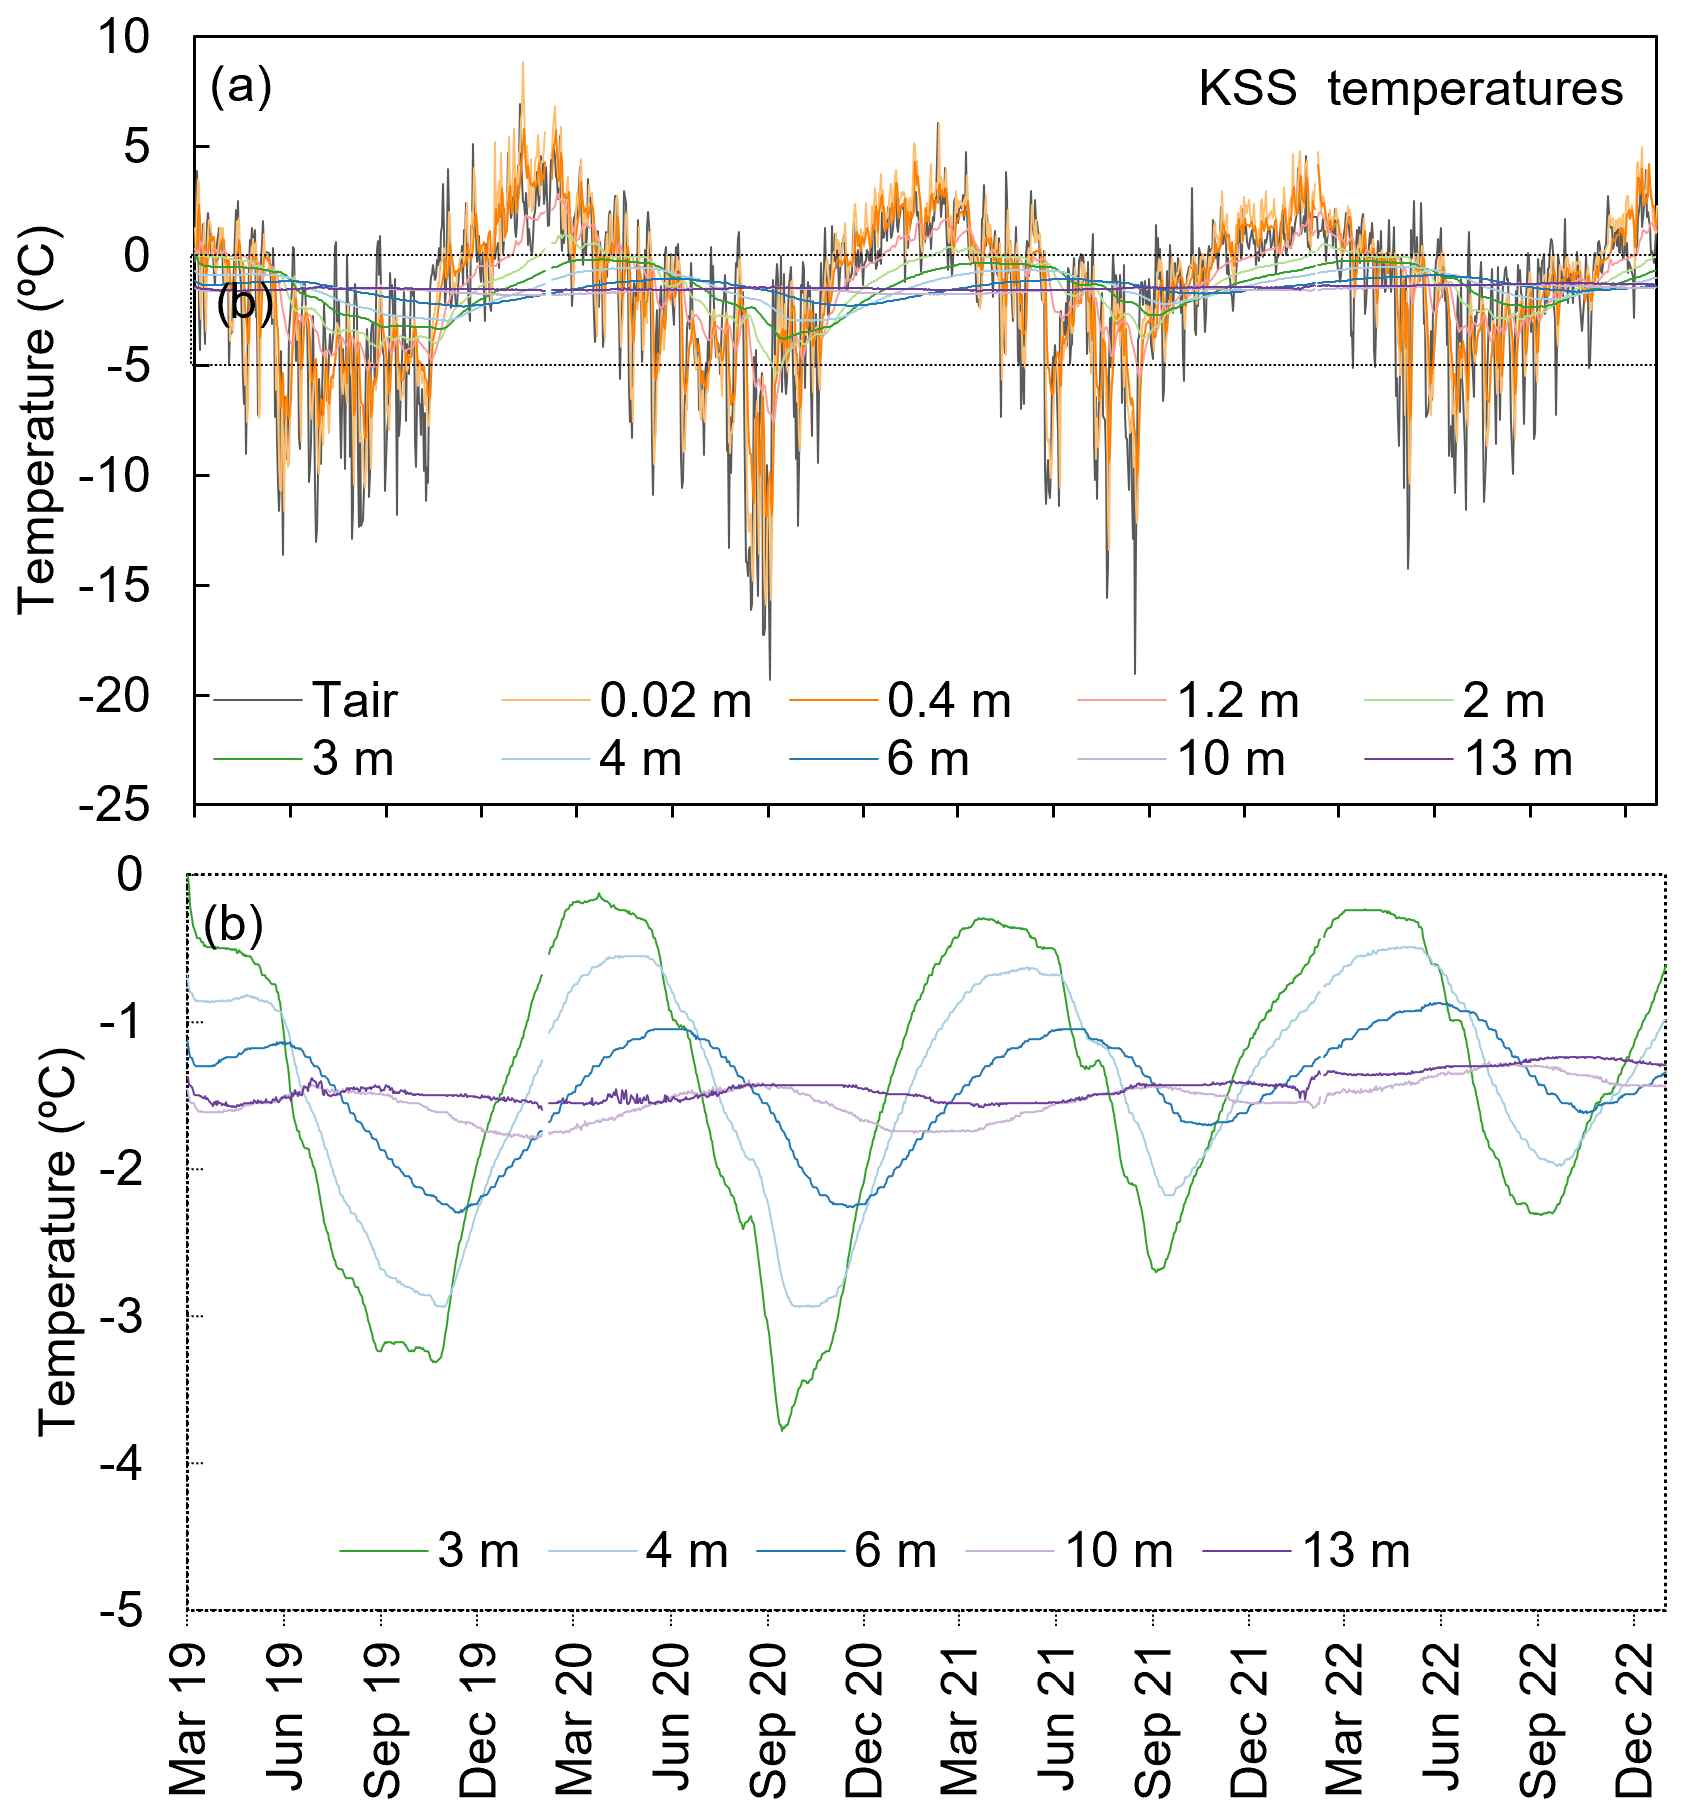
Figure 5Air and ground temperatures in the King Sejong Station permafrost observatory from January 2020 to December 2022.
Table 1Ground temperatures and derived indexes for the King Sejong Station permafrost observatory from January 2020 to December 2022.
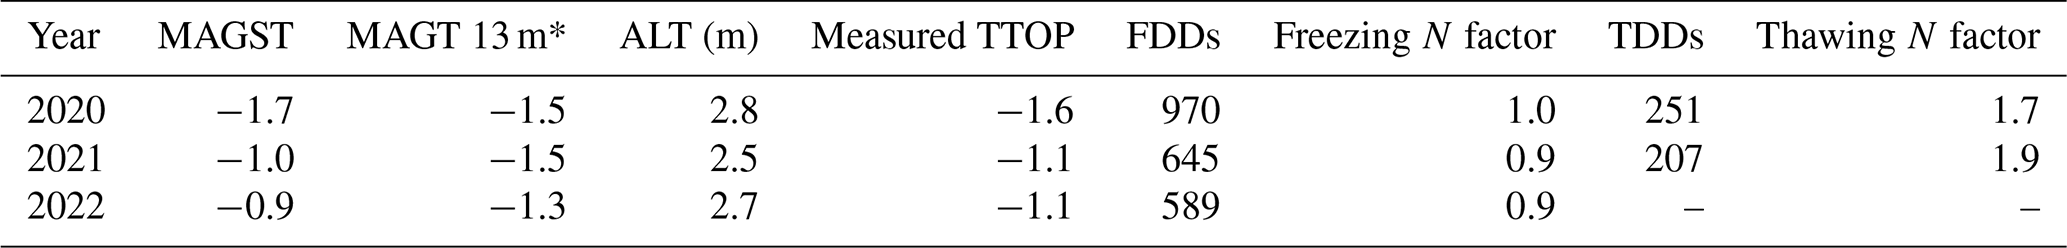
* The depth of zero annual amplitude was not reached.
The active layer showed a thickness of 2.8 m in 2020 and then decreased by 0.3 m in 2021 (Table 1). The MAGST progressively increased from −1.7 °C in 2020 to −0.9 °C in 2022, while at 13 m depth, it increased from −1.5 to −1.3 °C (Table 1).
4.2 Sensitivity analysis to subsurface parameters
In the sensitivity analysis to subsurface parameters, the combination with the best performance is Par_3_gst, which considers a mineral content of 99 % and a water ice content of 1 %, aiming to represent a massive outcrop that is slightly fractured. In these fractures, water is available and freezes during the freezing season, influencing the thermal conductivity.
In the Par_3_gst combination, a very strong correlation above 0.92 (ρ<0.01) was obtained at 0.4, 1.2, 2, 3, 4, and 6 m with an MAE ranging from 0.65 to 0.13 °C (Fig. 6 and Table 2). A very good agreement is obtained between the measured and modelled ground temperatures (Fig. 6). Below 6 m depth, the correlation decreases for values around 0.8; however, MAE also decreases for values ranging from 0.10 to 0.07 °C (Fig. 6 and Table 2).
The zero-curtain effect observed at KSS at 1.2 and 2 m is also well represented on the simulation Par_3_gst when considering a water ice content of 1 %. Both onset and duration have a very good correspondence between measured and estimated ground temperatures which reinforces the necessity of including a low content of water ice in the model stratigraphy.
Table 2Correlation, MAE, and RMSE (°C) between simulated and observed ground temperatures in the King Sejong Station borehole according to different configurations of ground content.
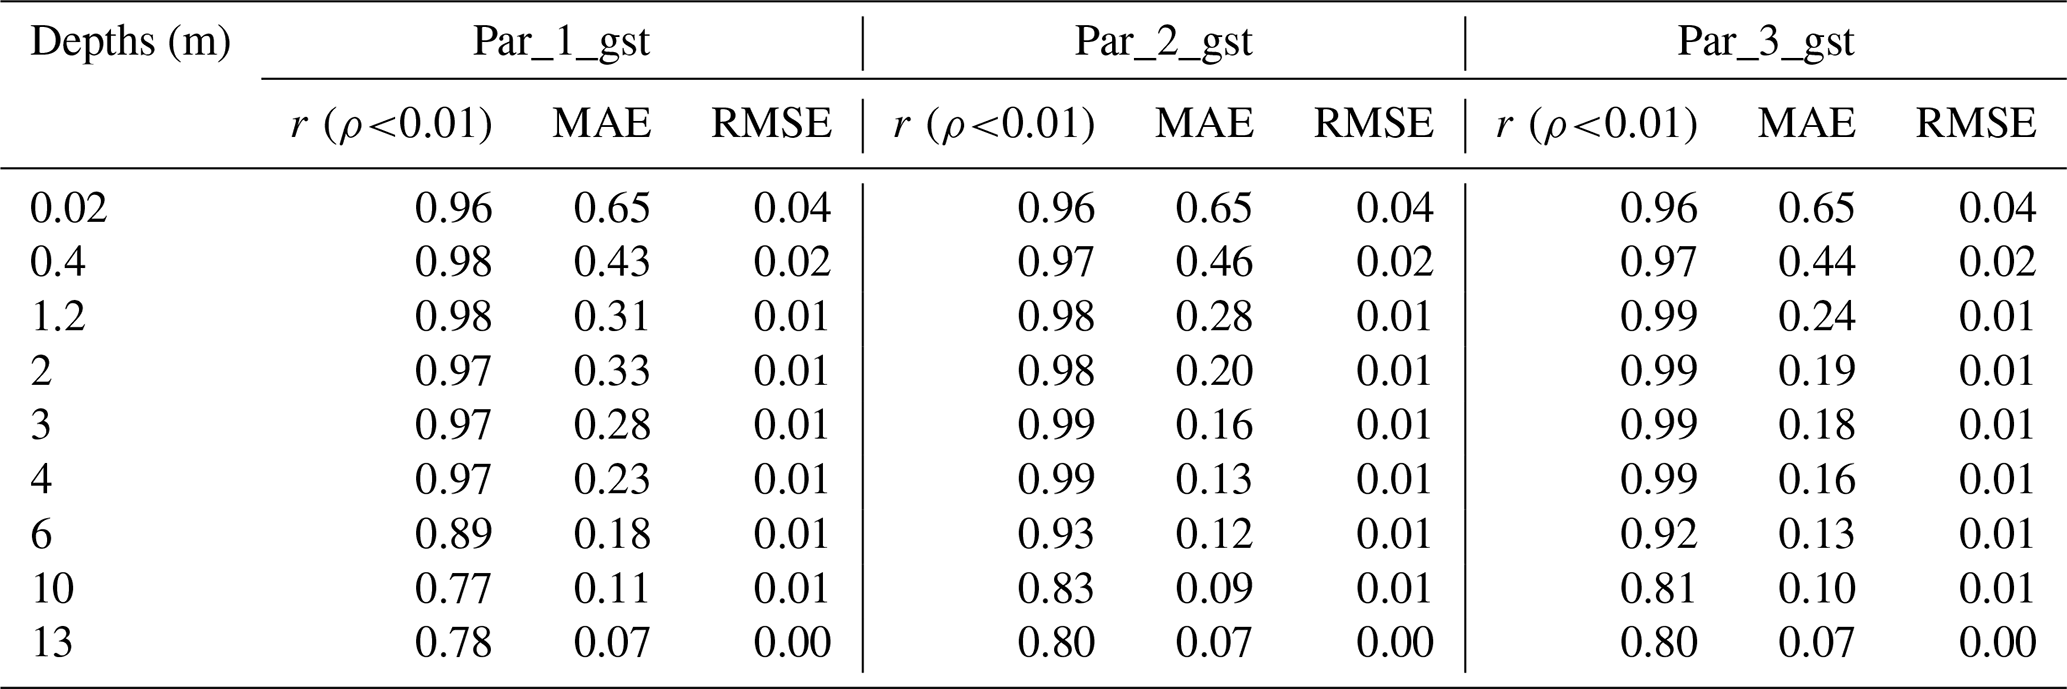
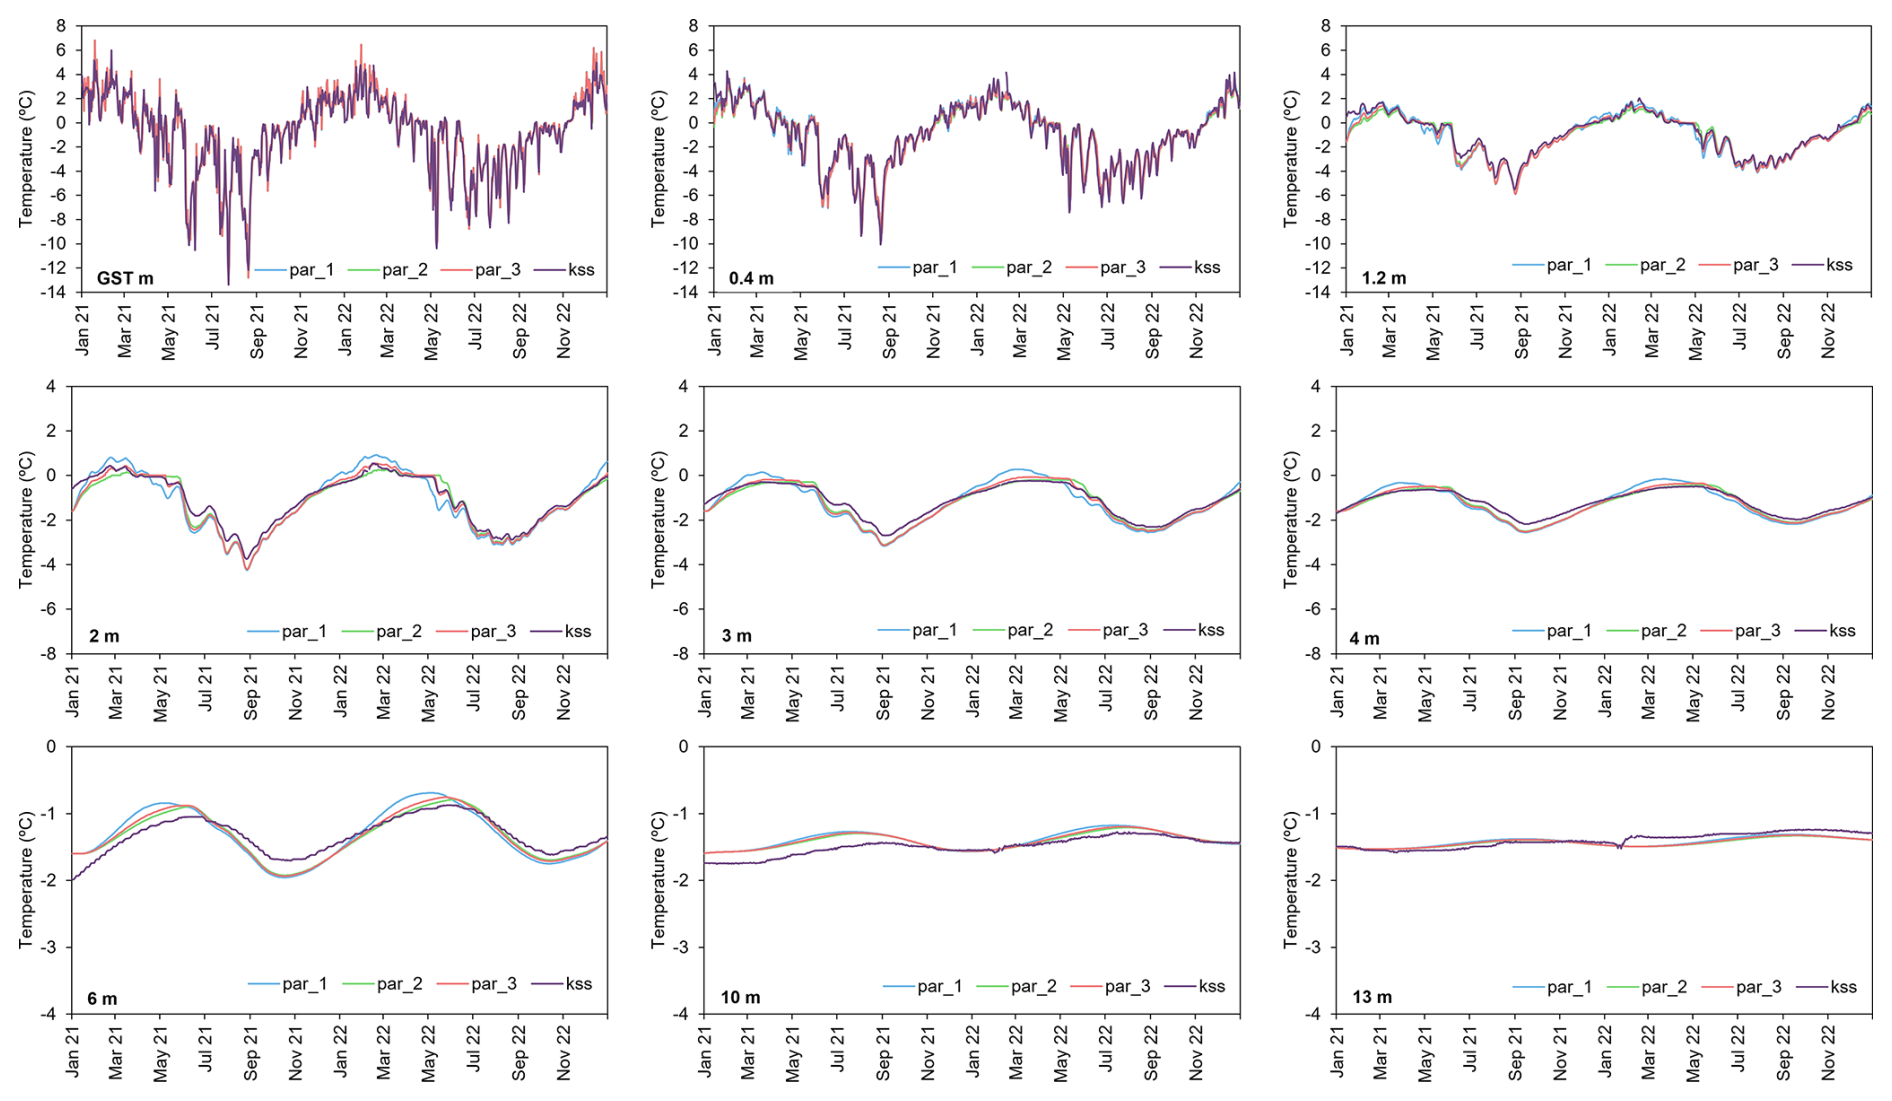
Figure 6Measured and estimated mean daily ground temperatures in the King Sejong Station borehole from January 2021 to December 2022.
4.3 ERA5 air temperature comparison to in situ observations
The quality assessment of the ERA5 air temperature was based on the analysis of the correlation, RMSE, and MAE combined with a visual comparison with the KSS air temperatures. The correlation coefficient was 0.968 (ρ<0.01), indicating a very strong correlation, while the MAE was 0.87 °C and the RMSE 1.2 °C. The percentage of days when the difference exceeded the MAE was 37 %. Despite the significant statistics, the visual comparison revealed substantial differences when considered the thawing and freezing seasons. During the thawing season ERA5 showed a cold bias of up to −3.6 °C for the mean daily temperatures (Fig. 7), while the freezing season was associated with a warm bias of 6.0 °C.
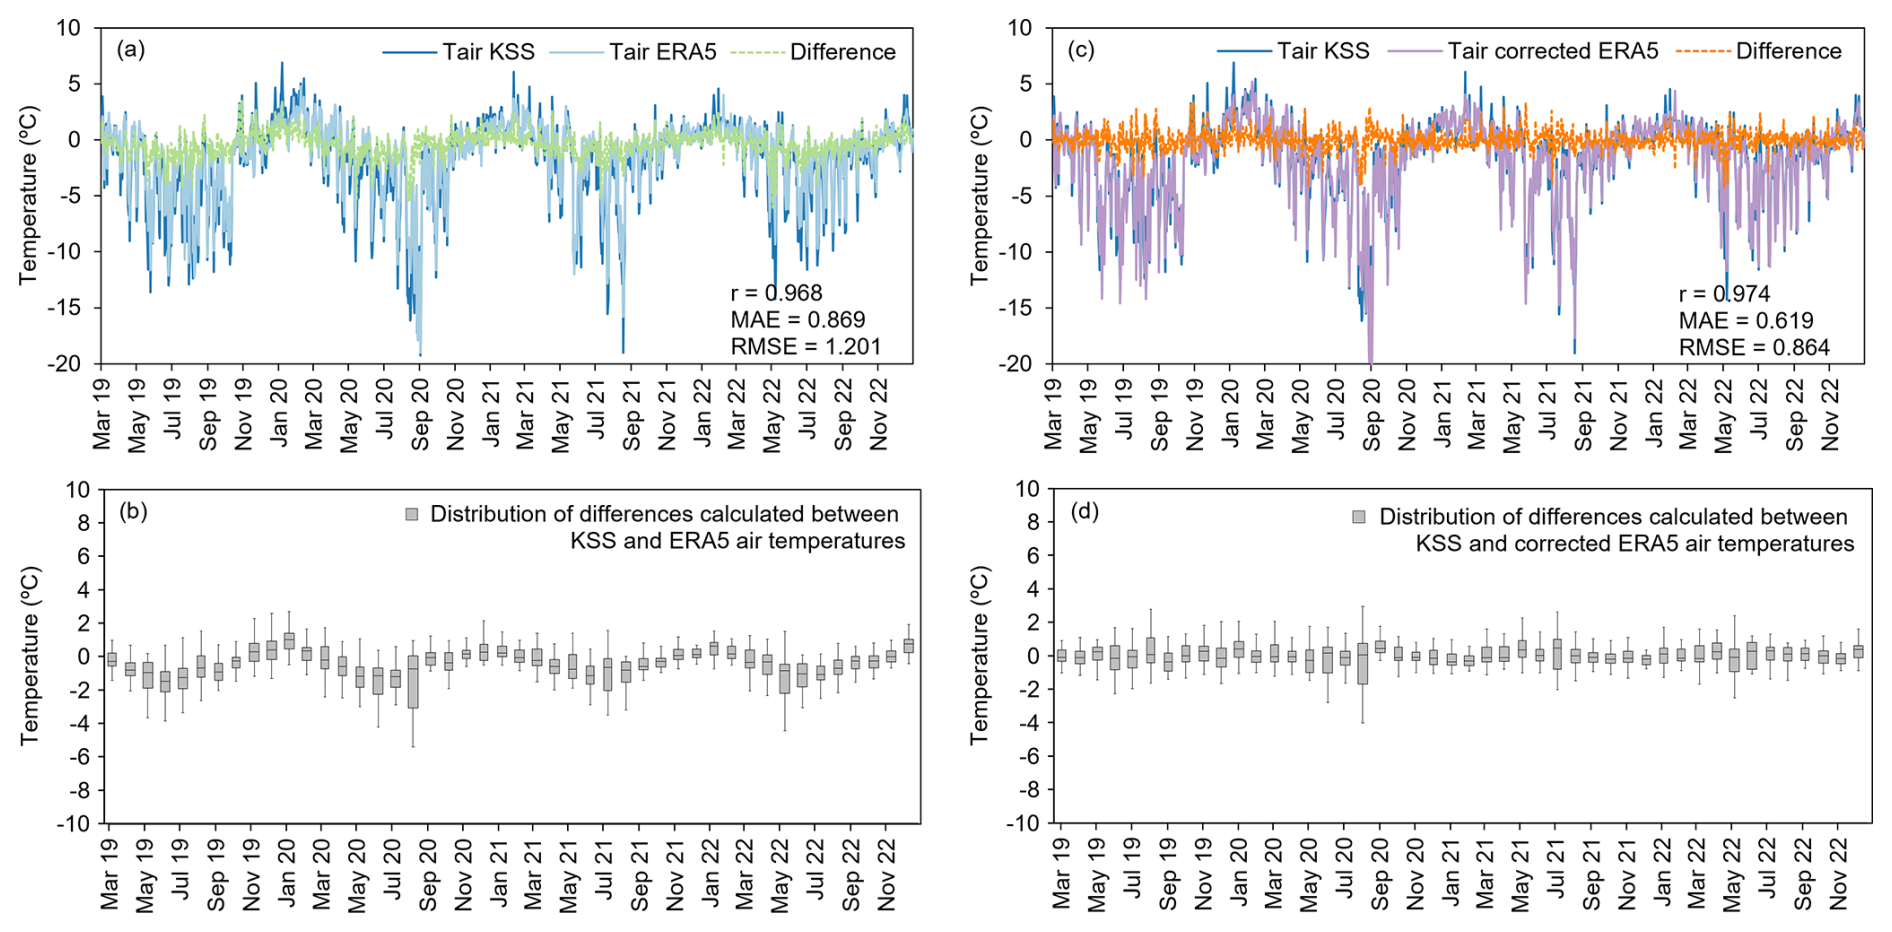
Figure 7Air temperature recorded on the King Sejong Station observatory and air temperature obtained from the ERA5 reanalysis product and calculated difference for the period between March 2019 and December 2022: (a) KSS air temperature, ERA5 2 m temperature, and calculated difference; (b) distribution of air temperature differences between KSS air temperature and ERA5 2 m temperature; (c) KSS air temperature, corrected ERA5 2 m temperature, and calculated difference; and (d) distribution of air temperature differences between KSS air temperature and corrected ERA5 2 m temperature.
The distribution of air temperature differences in Fig. 7b shows that negative differences are dominant during the freezing season when the KSS air temperature is colder, while during the thawing season, the difference is positive, indicating that KSS air temperature is warmer.
The bias correction of the air temperature from ERA5 strongly reduced the seasonal biases, resulting in an r of 0.97, an MAE of 0.62 °C and an RMSE 0.86 °C (Fig. 7c).
Despite the correction, differences are still present (Fig. 7c). These are mainly associated with the winter, specially to August 2020, July 2021, and May 2022, when the daily difference between the KSS and corrected ERA air temperature register a maximum value of −4 °C (Fig. 7c), with the KSS air temperature recording lower values, suggesting the occurrence of a very cold event.
4.4 Validation of surface energy balance model
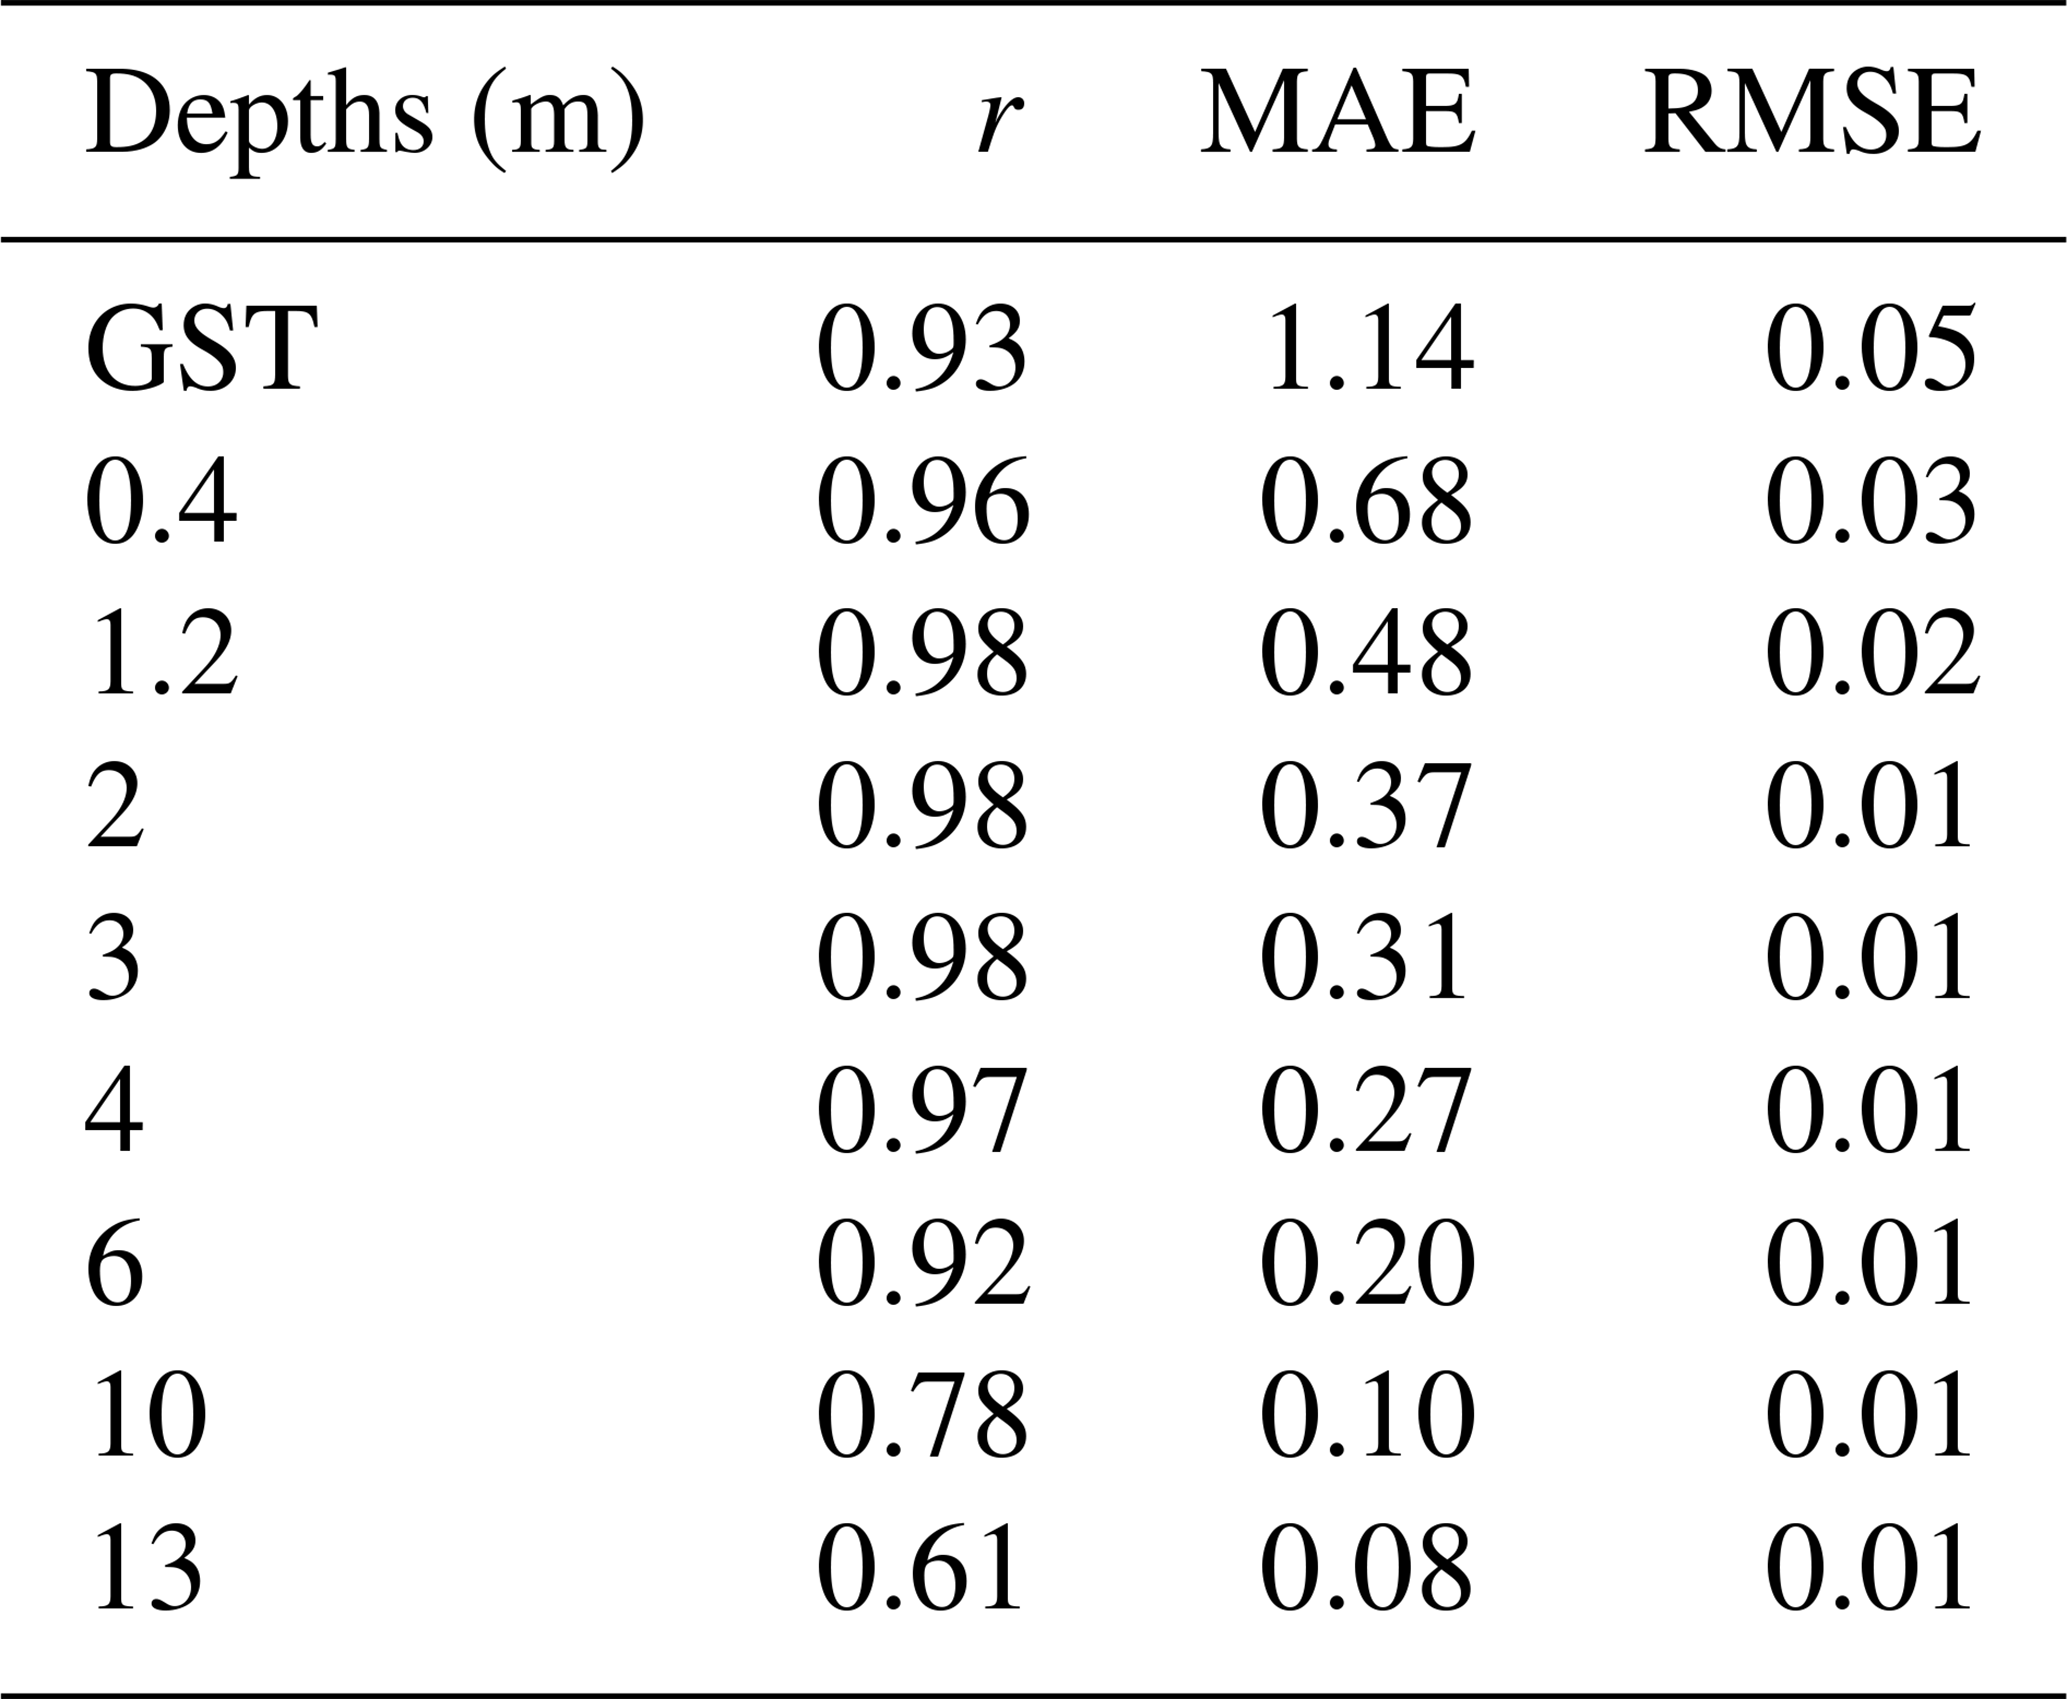
The validation of the surface energy balance model was conducted by comparing simulated ground temperatures at nine levels with the corresponding measured ground temperatures in the borehole (Fig. 8). Analysing the r value, a very strong correlation above 0.9 (ρ<0.01) is observed between the simulated and measured ground temperatures down to a depth of 6 m (Table 3). Below 10 m, the correlation decreases slightly to values between 0.61 and 0.78 (ρ<0.01). Despite the weaker correlations, very low MAE (<0.1) and RMSE (<0.01) values are observed. Figure 8 shows that below 1.2 m, the simulated ground temperature has a slight deviation from the measured temperatures during the freezing season, with lower estimated temperatures. This deviation may result from increased thermal conductivity due to the water ice content on the model stratigraphy. Despite the KSS borehole being in a massive outcrop, the temperature regime suggests an increase in water and ice content between 2 and 3 m, as shown by a short zero curtain. This may be associated with the transient layer at the top of permafrost (Sect. 4.1). The simulation using a water ice content of 1 % effectively captured the thermal regime at these levels, including the observed zero-curtain effect.
When examining the MAE calculated for the nine levels of the borehole profile, a difference of approximately 1 °C is obtained at the ground surface where the deviation between measured and simulated values is more pronounced. However, when the MAE is analysed for the remaining depths, with values ranging from 0.7 to 0.08 °C, a rapid decrease is observed, indicating a very small difference between simulated and measured ground temperatures.
Correlation, MAE and RMSE values show that CCM has a very good performance when simulating the ground temperatures for the KSS observatory using the surface energy balance as the upper boundary condition.
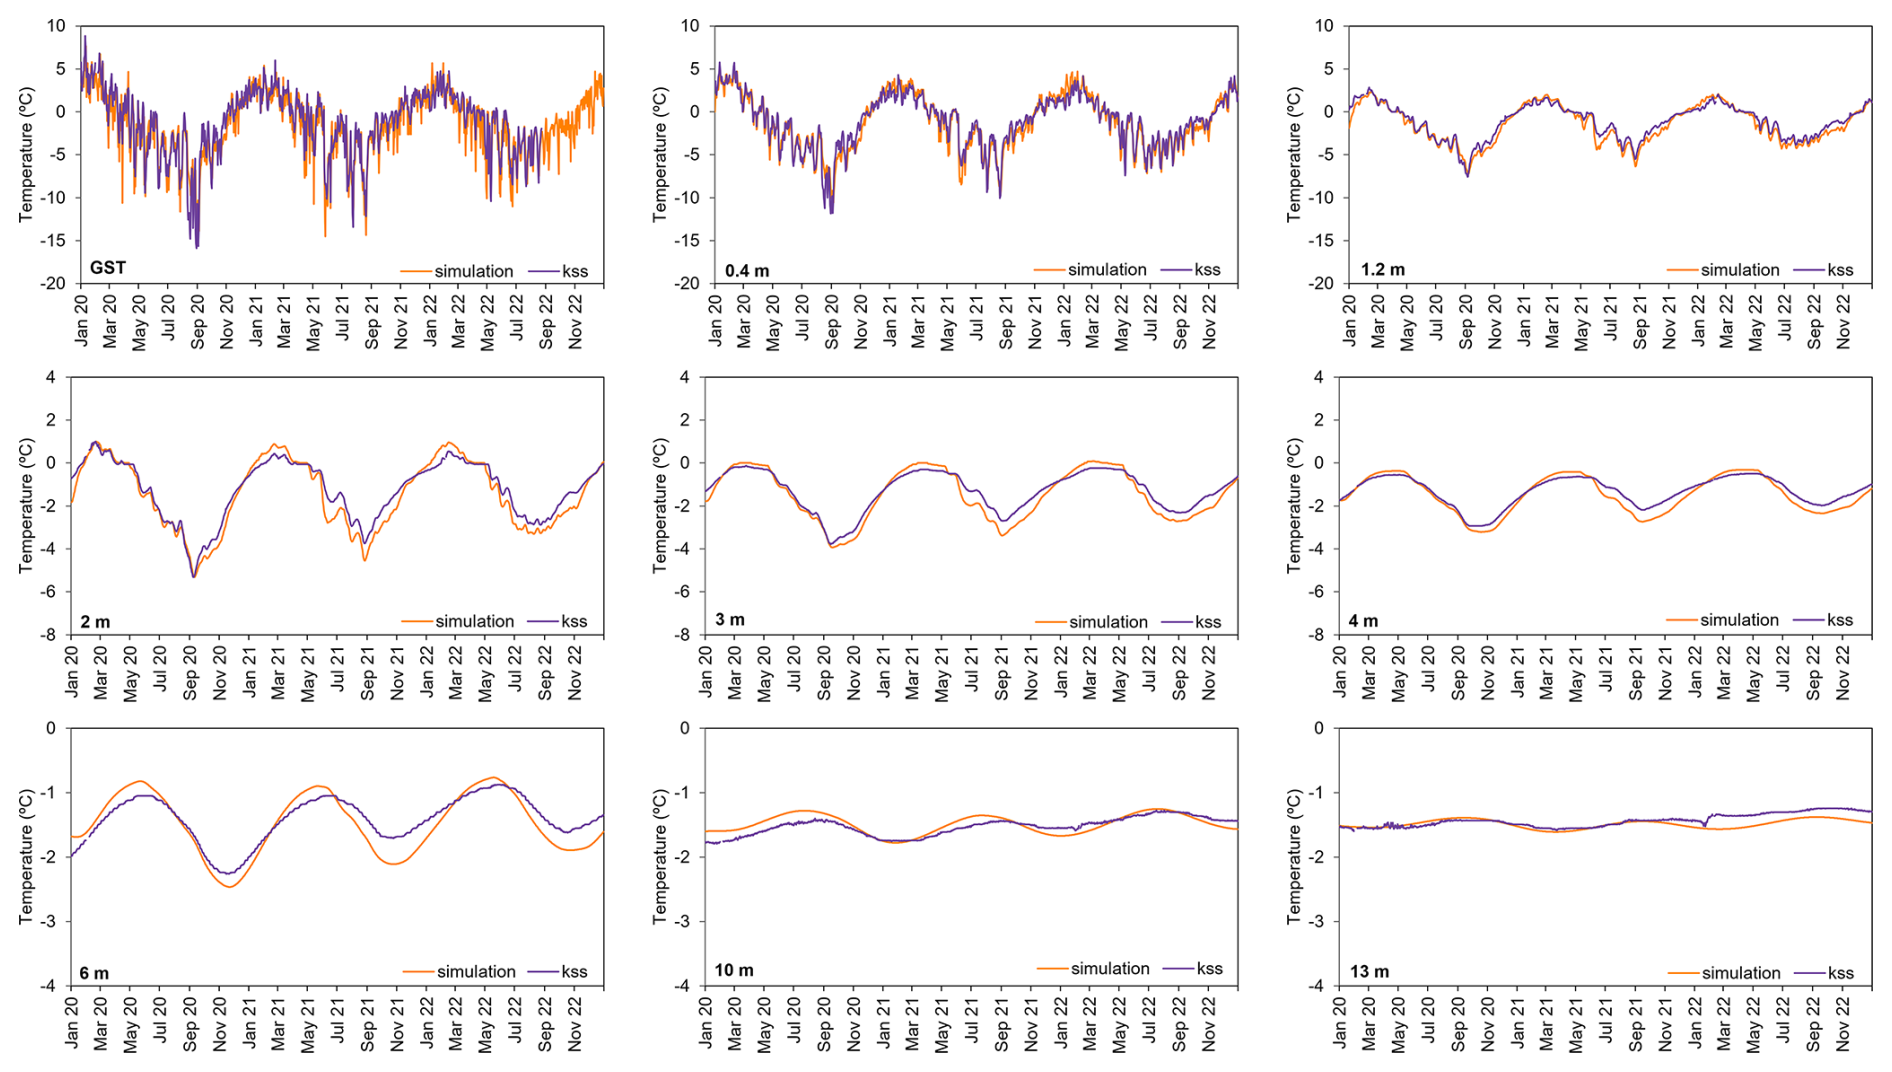
Figure 8Simulated vs. observed ground temperatures for the KSS borehole between January 2020 and December 2022.
Table 3Statistics between observed and simulated ground temperatures for the KSS borehole (March 2019–December 2022).
The comparison between the observed and simulated thaw depths shows that the model forced with the ERA5 data, produced a slightly thicker active layer when compared to observations.
In 2021 and 2022, a maximum difference of 0.4 m was observed, with KSS ALT values of 2.5 and 2.7 m, respectively, while the simulation-predicted values were 2.9 and 3.1 m (Fig. 9). In terms of the onset of thaw propagation, the simulation displayed a delay, with the active layer remaining unfrozen for up to 1 month longer than observed at KSS. This suggests a more pronounced deviation in the timing of ground thawing than in the intensity or depth of thaw propagation.
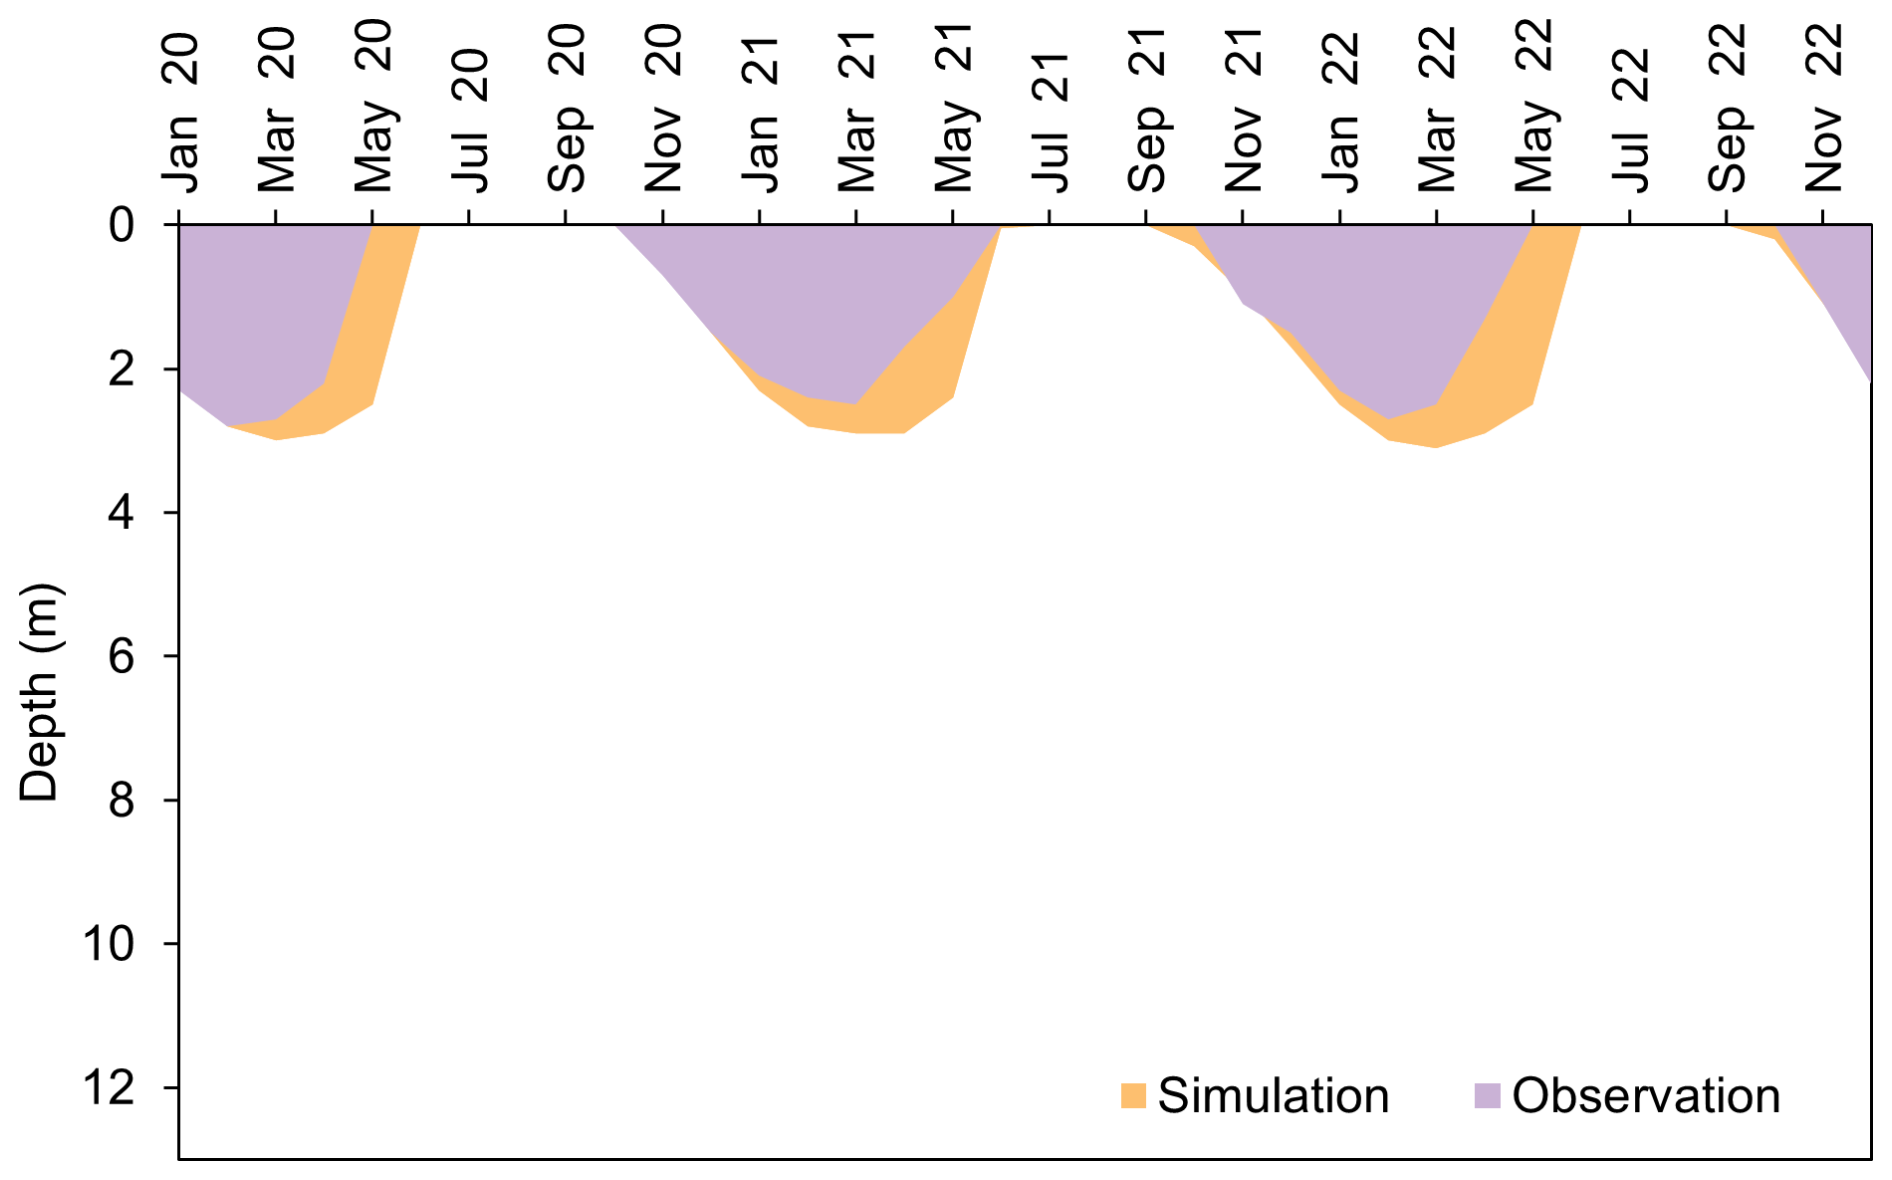
Figure 9Thaw depth at the King Sejong Station borehole between January 2020 and December 2022. Simulated and observed results.
The profile of simulated ground temperatures provides a comprehensive overview of the thermal dynamics at KSS (Fig. 10). At the surface, the succession of thawing and freezing seasons with varying intensities results in a MAGST ranging from −1.9 °C in 2020 to −1.4 °C in 2022 (Table 4). These values are slightly lower than the MAGST recorded at KSS for 2021 (−1.0 °C) and 2022 (−0.9 °C) (Table 4). During the thawing seasons, which lasted from November/December until February, the warming resulted in 241 and 198 TDDs in 2020 and 2021, respectively, indicating slightly lower values compared to the TDDs calculated for KSS, which ranged between 251 and 207 (Fig. 10 and Table 4). During the freezing season, which started in mid-March and lasted until October, the cooling intensity resulted in 966, 788, and 751 FDDs in 2020, 2021, and 2022, showing a decreasing tendency (Fig. 10 and Table 4). If compared with the FDDs calculated for KSS, for the year of 2020, it is seen that the simulation is producing a slightly less severe FS. However, for the following years, the opposite trend is observed with the simulation producing a more severe TS.
The cooling and warming propagate below 13 m, and the zero annual amplitude (ZAA) depth is not reached at KSS. From the simulation, the MAGT is of −1.5 °C, which is very close to the MAGT recorded at KSS with values between −1.6 and −1.3 °C.
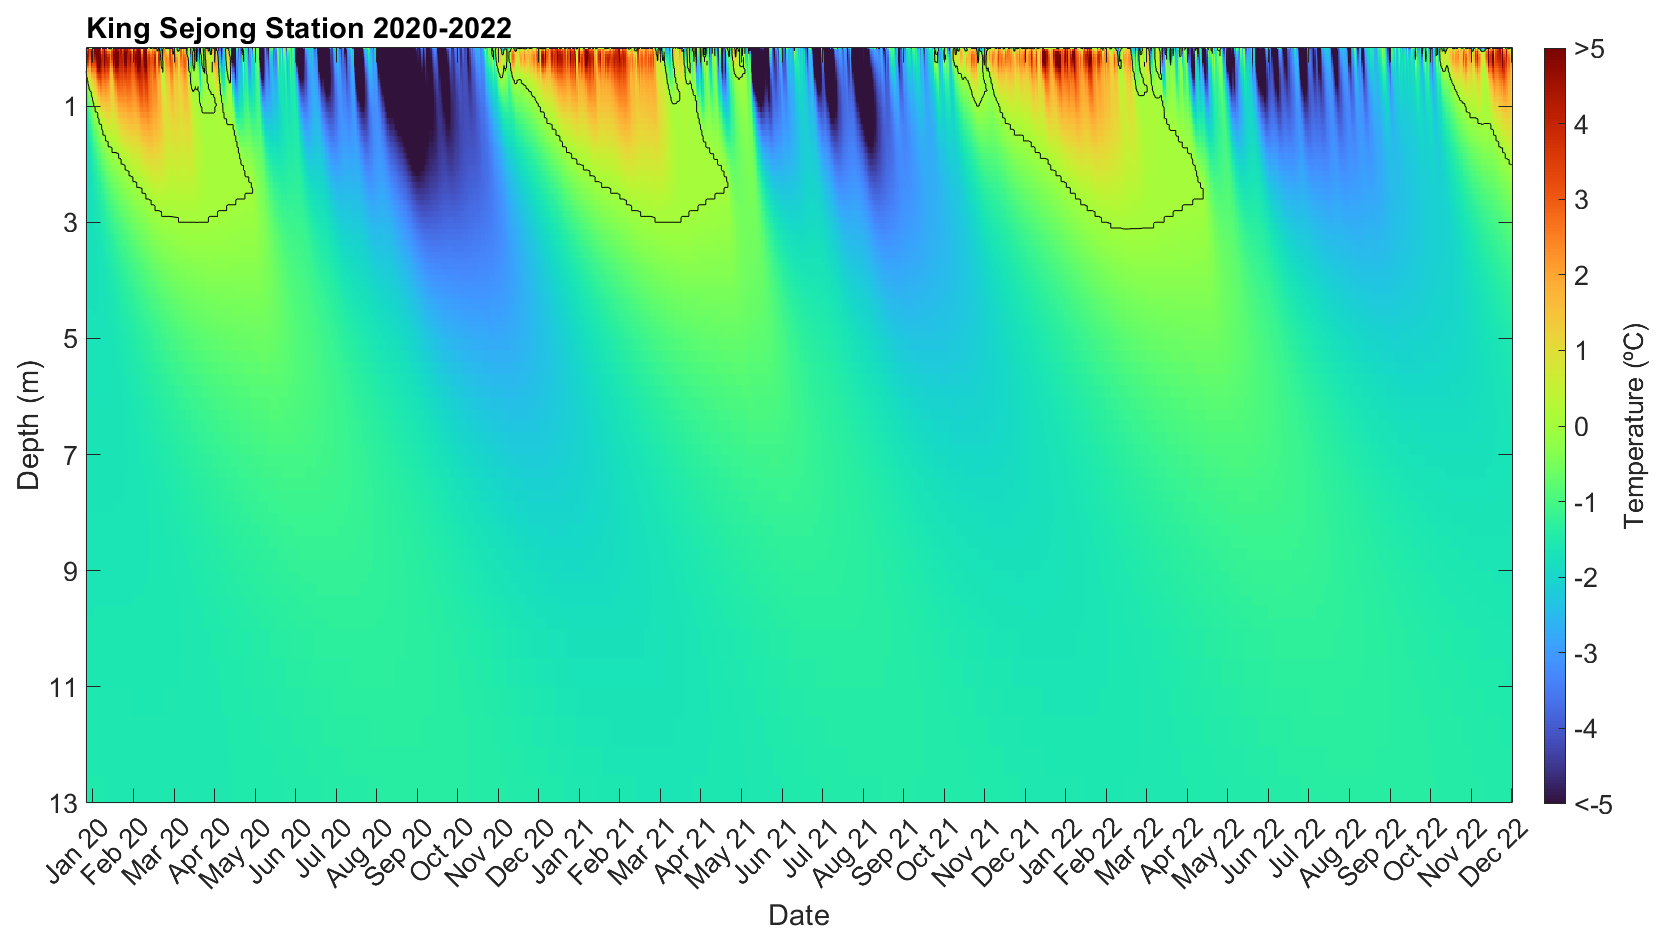
Figure 10Simulated ground temperatures for the KSS borehole between January 2020 and December 2022.
Table 4Ground thermal parameters calculated for the KSS borehole between March 2019 and December 2022.
4.5 Long-term simulation of ground temperature (1950–2022)
The simulation of ground temperatures since 1950 allowed for a first reconstruction of the multi-decadal permafrost evolution at KSS. A warming trend is present in the ground temperature at all depths, including in the permafrost, with an acceleration since 2016 after the cooling also reported in different boreholes in the South Shetlands from 2000 to 2015 (Figs. 11 and 12) (de Pablo et al., 2024; Guglielmin and Cannone, 2012; Hrbáček et al., 2018, 2021, 2023). In 1950, the modelled MAGST was −4.5 °C, while in 2022, it was −0.8 °C, showing an average warming of 0.27 °C per decade. At 20 m depth the temperature changed from −2.7 to −1.2 °C, showing a warming rate of 0.24 °C per decade. The modelled ALT shows an increase from 1.6 m in 1950 to 3.5 m in 2022 (Figs. 11 and 12).
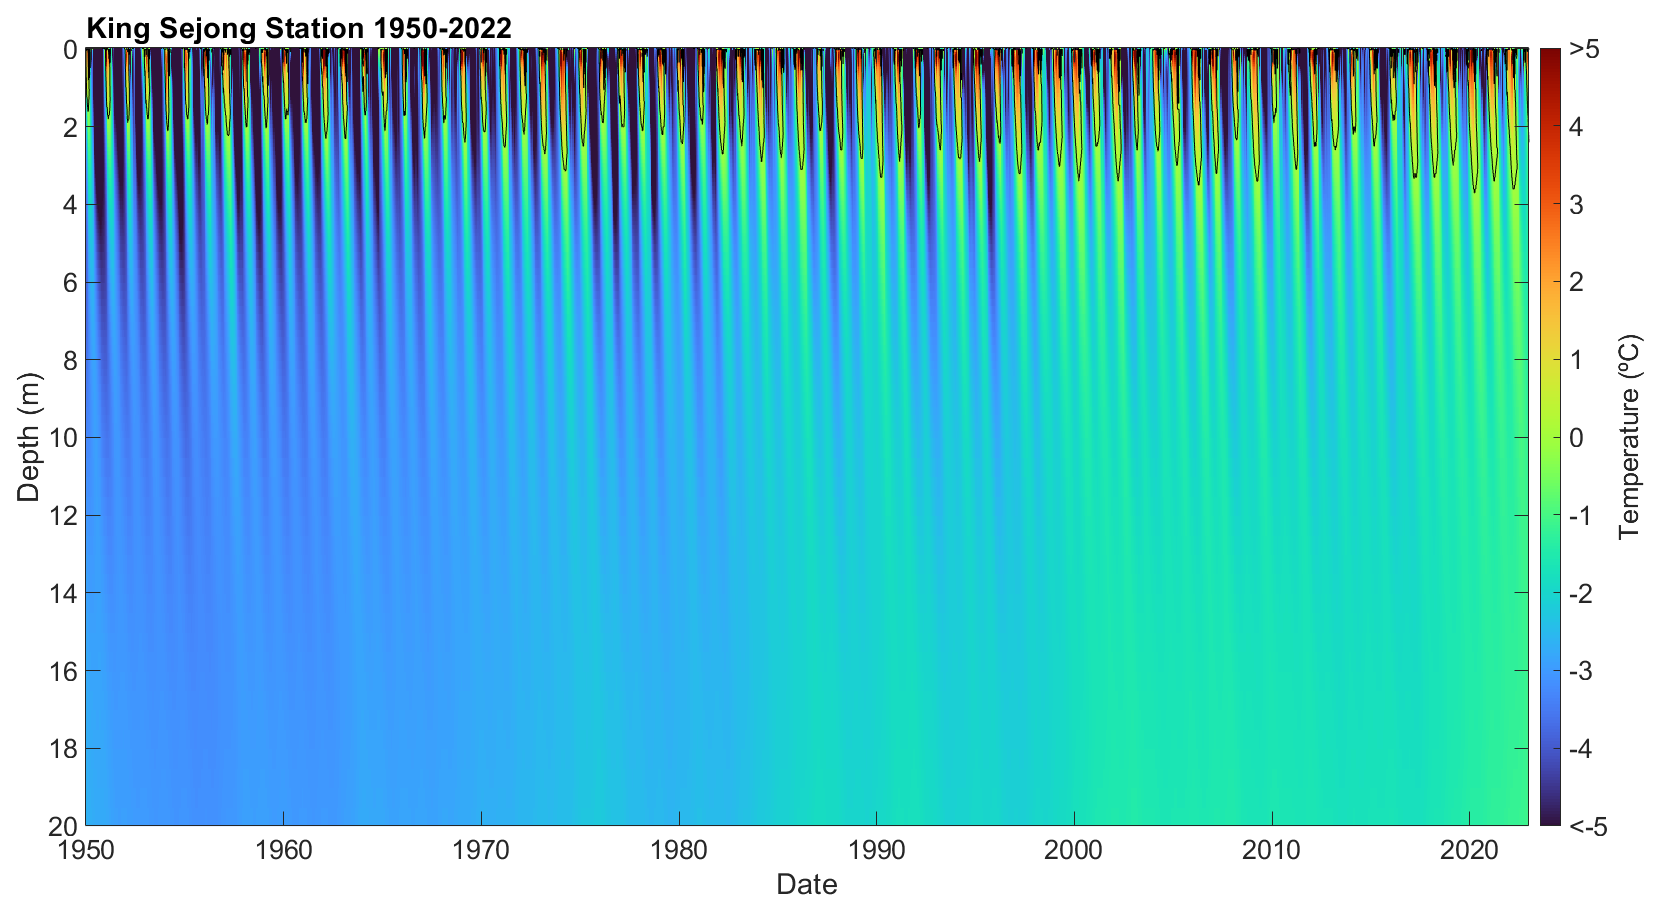
Figure 11Ground temperatures simulated for the KSS borehole between January 1950 and December 2022.
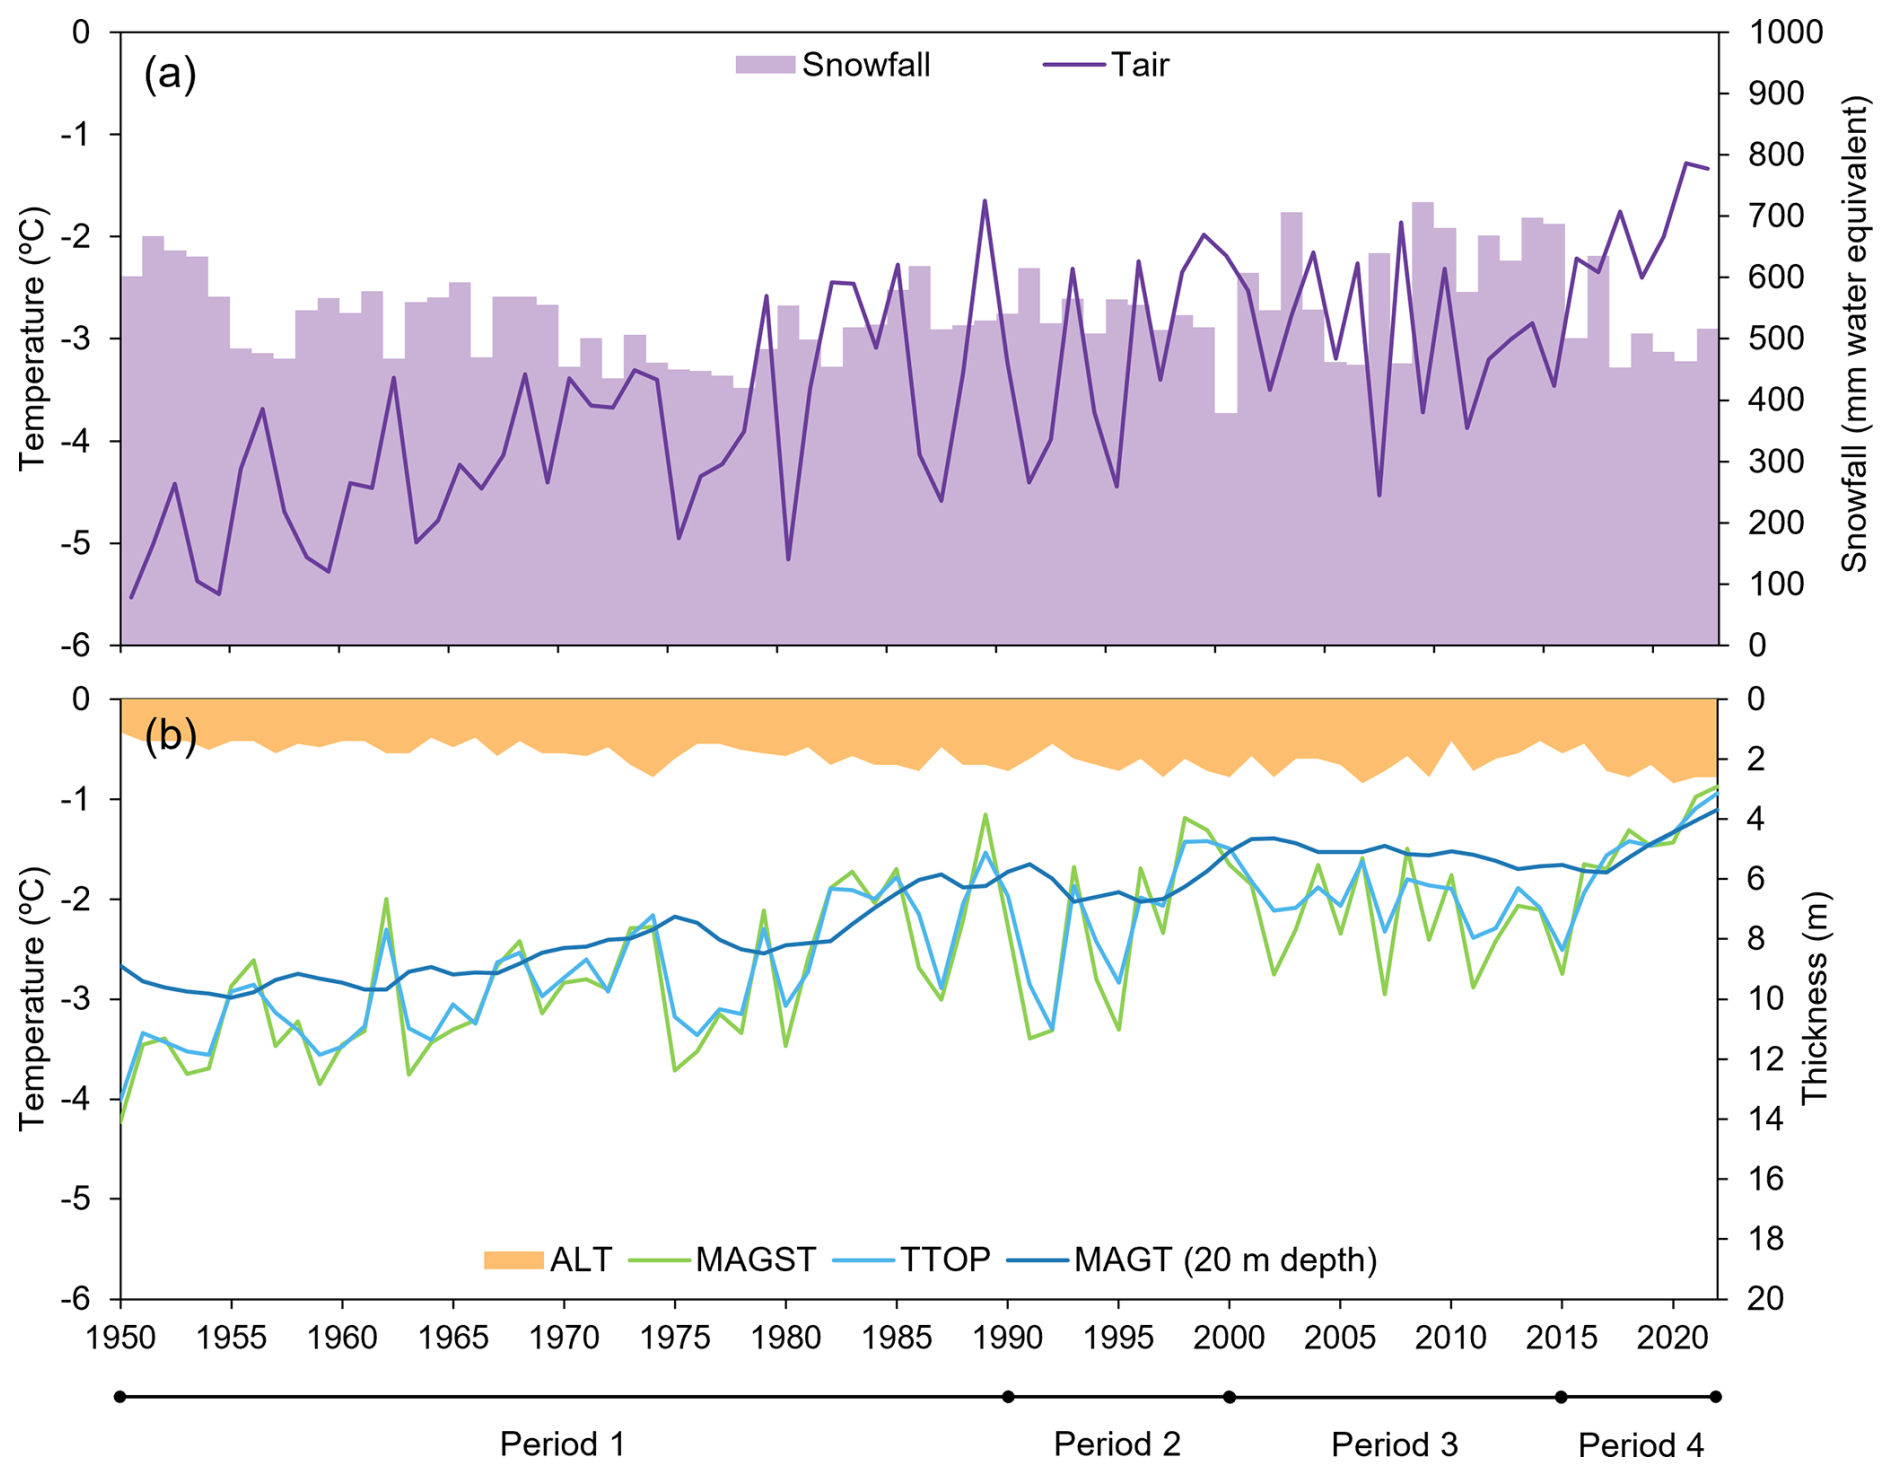
Figure 12Long-term simulation of ground temperature (January 1950 to December 2022): (a) ERA5 variables snowfall (mm water equivalent) and air temperature (°C); (b) mean annual ground temperatures and active layer depth calculated from the KSS borehole simulations.
Despite the general warming trend, the analysis of the reconstructed time series allows for identifying periods with different characteristics. The modelled MAGT at 20 m depth allows for filtering interannual variability and provides the best insight into the trends (Figs. 11 and 12).
The analysis of the evolution of the permafrost and active layer temperatures allowed for identifying four distinct periods since 1950:
-
Period 1 (1950–1990): this period begins with the lowest MAGST and TTOP values of the series, around −4 °C, and an ALT of 1.6 m. During the subsequent years, a progressive warming occurred with a rate of 0.04 °C yr−1 following the increase in the air temperature (0.05 °C yr−1). The snowfall shows the opposite trend, with a slight decrease in precipitation from 602 mm w.e. in 1950 to 541 mm w.e. in 1990. MAGST and TTOP values show higher fluctuations due to short periods of cooling and warming, which control the ALT, that varied from 1.6 to 3.2 m. At 20 m, the temperature increased from −2.7 to −1.8 °C.
-
Period 2 (1990–2000): from 1990 to 1995, warming and cooling periods had a shorter duration of approximately 2 years, influencing the MAGST and TTOP values, which varied between −3 and −2 °C. The MAGT remained constant at around −2 °C. From 1995 to 2000, an intense warming occurred, with the MAGT consistently increasing from −2.0 to −1.7 °C and the MAGST and TTOP values approaching −1.5 °C.
-
Period 3 (2000–2015): this period is characterized by a very small cooling of the air temperature (−0.05 °C yr−1), resulting in a slight decrease in MAGST, TTOP, and MAGT. MAGST and TTOP varied from −1.6 to −2.8 °C and −1.5 to −2.5 °C, respectively. MAGT varied from −1.5 to −1.7 °C. As result, the ALT decreased from 2.6 to 1.8 m.
-
Period 4 (2015–2022): the final years of the series are marked by intense warming, with an increased trend in the air temperature (0.24 °C yr−1), leading to a rapid and sharp increase in MAGST and TTOP, respectively, from −2.9 to −0.8 °C and −2.5 to −0.9 °C. MAGT increased from −1.7 to −1.2 °C. During this period, the ALT increased from 1.9 to 3.5 m.
Concerning the freezing and thawing seasons, which contribute to the characterization of the four periods, a general trend of an intensity decrease is observed for the freezing season, while the opposite trend is evident for the thawing season (Fig. 13).
In the initial period (1950–1990), the interquartile range (IQR) for ground surface intensity was between 1090 and 1407 FDD. By contrast, in the most recent period (2016–2022), the intensity decreased, with an IQR ranging from 638 to 836 FDD, alongside a narrowing of the range between minimum and maximum values. The freezing season duration showed no clear trend in the first three periods, with an IQR of 230–290 d, but decreased to 207–232 d in 2016–2022 (Fig. 13b).
In contrast, the thawing season demonstrates an increase in intensity. During the initial period (1950–1990), the IQR was between 137 and 222 TDD. In the final period (2016–2022), this range increased, with an IQR between 262 to 346 TDD (Fig. 13c). While thawing season duration showed no trend initially, with an IQR spanning from 68 to 150 d, it extended to 138–154 days during the 2016–2022 period (Fig. 13d).
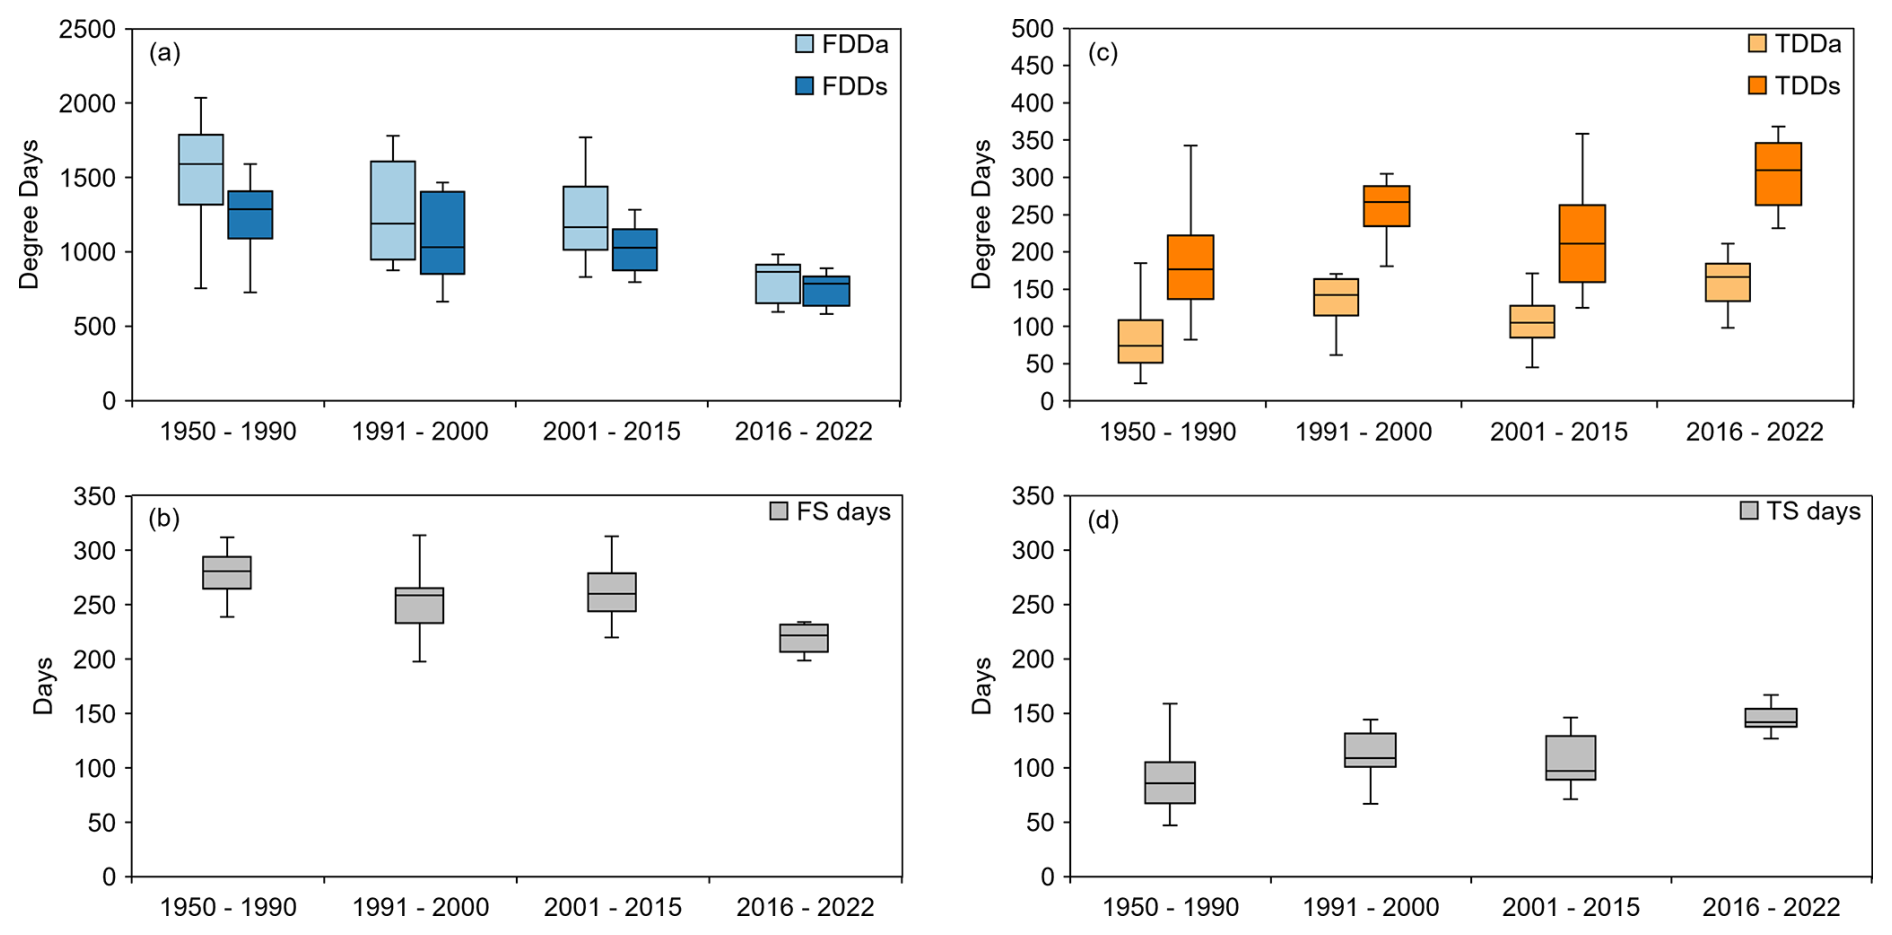
Figure 13Characterization of the freezing and thawing seasons for the four periods from 1950 to 2022: (a) freezing degree days of the air (FDDa) and ground surface (FDDs), (b) duration of the freezing season (FS) in days, (c) thawing degree days of the air (TDDa) and ground surface (TDDs), and (d) duration of the thawing season (TS) in days.
5.1 Temperature at King Sejong Station observatory
During the study period, which had a MAAT of −1.6 °C, two warm-weather episodes occurred in February 2020 and 2022 (González-Herrero et al., 2022; Gorodetskaya et al., 2023). These events led to increases in air and ground surface temperatures, resulting in an ALT of 2.5 m in 2020. These warm episodes are linked to the formation of atmospheric rivers, which transport heat and moisture from the Southern Ocean at lower latitudes (Gorodetskaya et al., 2023; Zou et al., 2023). In the coastal areas of the Antarctic Peninsula, such events can cause intense snowfall (later in the thawing season) or rainfall, and combined with warm temperatures, they have a direct impact on snow cover melting and ground temperature (Bozkurt et al., 2022; Gorodetskaya et al., 2023). Consequently, in ice-free areas, these events can affect the extent and duration of snow patches with an insulating effect and intensify surface warming, particularly due to excessive summertime shortwave radiation associated with warm anomalies (Bevan et al., 2020; Bozkurt et al., 2022), while the effect of warm rainfall water advection has not yet been accounted for.
Freezing and thawing parameters provide insight into ground temperature evolution. de Pablo et al. (2024) analysed interannual variability using Livingston and Deception permafrost observatories, covering the period from 2007 to 2021 and revealing a decrease in FDD and an increase in TDD, which aligns with the trend observed at the KSS observatory. Moreover, the onset and conclusion of the seasons at these locations closely match those observed at KSS. The freezing and thawing season parameters, despite representing a single measure for 1 year, serve as a good indicator of thermal dynamics and are representative of changes caused by atmospheric conditions due to soil surface sensitivity (de Pablo et al., 2024).
5.2 Performance of CryoGrid simulations
The CCM has been used in various spatial contexts and with different purposes, from the simulation of ground thermal regimes in ice-rich permafrost by Westermann et al. (2016), to surface energy balance in permafrost-underlain boreal forest by Stuenzi et al. (2021) or the temperature in rock walls by Schmidt et al. (2021). The diversity of studies reinforces the flexibility of the modular structure in representing different environmental conditions, which is crucial for the model implementation. The workflow followed here, like the one by Schmidt et al. (2021), started with a sensitive analysis where several simulations were performed forced with the GST recorded at KSS, changing one parameter configuration at a time. The main structure stratigraphy was set a priori using the documentation available regarding the model operation and the documentation in which a physical characterization of the Barton conditions is provided (Kim et al., 2006; Vionnet et al., 2012; Westermann et al., 2023; Zweigel et al., 2021).
Observational data, essential for model validation, showed that a simulation with 99 % mineral and 1 % water ice content accurately estimated ground temperatures at various depths, with correlation values exceeding 0.9 down to 6 m depth and 0.8 down to 13 m depth with an MAE below 0.7 °C. Regarding the ALT, the simulated values resulted in a 15 % thicker active layer.
Studies by Schmidt et al. (2021) in rock cracks and Westermann et al. (2016) at the Samoylov Observatory similarly emphasize the role of observational data in evaluating model performance, with accuracy influenced by factors such as snow cover, moisture, and porosity.
The validation of surface energy balance, performed for the short-term simulation, demonstrated a high accuracy in reproducing observed ground temperatures during 2020–2022, with an r between 0.8 and 0.9 and RMSE from 0.01 to 0.05 °C. Other CCM simulations performed for sites in the Northern Hemisphere returned higher RMSE values. Renette et al. (2023) when simulating the thermal regime for blocky terrain in Norway, obtained an RMSE between 1.2 and 2.1 °C. An RMSE of 1 °C was obtained by Westermann et al. (2017) for terraces in the Lena River Delta and by Schmidt et al. (2021) on rock walls in Svalbard.
Regarding the differences between measured and simulated thaw depth, the model predicted an active layer of 2.9 to 3.1 m compared to observations of 2.5 to 2.9 m, resulting in a maximum difference of 0.4 m, which is higher than the difference of 0.1 m obtained by Westermann et al. (2017) for the Lena River Delta. However, in Westermann et al. (2017), the ALT was calculated for sediments, while our site featured bedrock. Due to its higher thermal conductivity and lower heat capacity, heat propagates more efficiently through bedrock than through sediments. As a result, during the thawing season, active layer depths are more sensitive to surface thermal forcing. Furthermore, this higher sensitivity means that even small misrepresentations of the surface boundary conditions - such as air temperature or incoming radiation–can amplify deviations in the simulated ALT. The seasonal analysis of ground temperature, as indicated by freezing and thawing parameters, underscores the model's capability to simulate seasonal variations and the effect of snow. A slight overestimation of FDD was detected for 2021 and 2022, while for the TDD, an underestimation was found. The FDD, higher than the TDD, aligns with observations at KSS and other observatories in the South Shetland Archipelago, such as those on Deception and Livingston islands reported by de Pablo et al. (2024).
5.3 ERA5 limitations
The underestimation of air temperature during the thawing season is a limitation when using ERA5 variables as it constrains surface warming and delays the onset of the season which impacts the active layer thickness and permafrost temperature. This underestimation is linked to the coarse spatial resolution of the ERA5 grid, which may represent areas with significant variations in conditions, such as the presence of ice, bare ground, or water. In the Antarctic context, studies have assessed the quality of ERA5 estimates. Xie et al. (2023) reported a high correlation between ERA5 data and Antarctic station measurements, with coefficients exceeding 0.95 at 121 sites and a bias lower than 4 °C. Similarly, Zhu et al. (2021) found a correlation coefficient of 0.94 for the annual period on the Antarctic Peninsula associated with a bias of 0.6 °C. At the seasonal level, correlations ranged from 0.82 in December–February (DJF) to 0.93 in September–November (SON). A warm bias was detected from May to September, with extreme values in August and December.
On Barton Peninsula, the largest differences in air temperature occurred during the freezing season, with KSS daily temperatures being 5 °C lower than ERA5 estimates in August 2020 and 6 °C lower in May 2022.
5.4 Reconstruction of ground temperatures using ERA5 forcing – long-term simulation (1950–2022)
The long-term simulation from 1950 to 2022 provides for the first time an insight into the evolution of ground temperatures and ALT in Barton Peninsula and in the Antarctic Peninsula region. The model revealed a ground warming trend during the period, with MAGT increasing from −2.7 to −1.2 °C, while MAGST increased from −4.5 to −0.8 °C. Since 2016, an acceleration of the ground temperatures warming was observed. This trend results from the climate warming in the Antarctic Peninsula and the South Shetlands, as addressed by Turner et al. (2016), Bozkurt et al. (2021, 2022), and Gorodetskaya et al. (2023). The limited time span of borehole data, available in the Antarctic Peninsula since the mid- to late 2000s, is a constraint to the understanding of these temperature trends across the observatories for permafrost since it inhibits us from distinguishing between short-term climate fluctuations, e.g. decadal cycles, and longer-term trends caused by climate change.
The reconstruction of historical ground temperature profiles reveals distinct periods. The period from 1950 to 1990 showed a progressive warming of 0.04 °C yr−1, resulting in an increased ALT (0.02 cm yr−1) and more pronounced temperature fluctuations, indicative of short-term climate variability. From 1990 to 2000, the alternating warming and cooling periods of shorter durations highlighted a rapid response in the MAGST and TTOP values, while the MAGT remained stable. The intense warming observed from 1995 to 2000, resulting in a significant increase in MAGST and TTOP of 0.3 °C yr−1 and MAGT of 0.1 °C yr−1, reflects regional warming and their impact on ground temperature.
The period from 2000 to 2015, characterized by a cooling trend, aligns with observations from Deception and Livingston islands by de Pablo et al. (2016). This cooling resulted in a thinning of the ALT from 2.6 to 1.8 m. The same trend was observed by de Pablo et al. (2016, 2020) and Ramos et al. (2017) at the CALM site on Deception Island, where a decrease in ALT was measured, while a longer duration of snow cover was detected.
The recent warming from 2015 to 2022, characterized by an increase in both the frequency and intensity of warm events addressed by González-Herrero et al. (2022) and Gorodetskaya et al. (2023), highlights the sensitivity of ground temperatures to atmospheric changes. This is evidenced by the deepening of the active layer by 1 m and a rapid increase in MAGST, TTOP, and MAGT to approximately −1 °C. For permafrost, which reached a temperature close to −1 °C in 2022, these warmer conditions increase the susceptibility to degradation, placing permafrost near a critical threshold due to the proximity to the freezing point.
In the coastal areas of Alaska, Romanovsky et al. (2010) noted that permafrost temperatures around −1 °C have led to extensive thawing. For the Canadian Arctic, Smith et al. (2010) also discussed how temperatures nearing −1 °C have initiated significant thaw, destabilized permafrost, and led to terrain changes such as subsidence and landslides.
Permafrost and active layer temperatures modelled with the CCM using ERA5 forcing were successfully validated against measurements from the Barton Peninsula King Sejong Station permafrost borehole for 2020 to 2022. The high accuracy of the results allowed us to expand the modelling period using the ERA5 series from 1950 to 2022, reconstructing the history of permafrost in the South Shetlands since 1950.
The flexibility of the CCM hierarchical structure allowed for a good representation of the surface and ground conditions at the KSS borehole, resulting in a correlation between the measured and estimated ground temperatures from 0.9 (down to 6 m depth) to 0.8 (down to 13 m depth). A delay of thaw propagation and an overestimation of 0.4 m were obtained for the active layer thickness. Ground surface temperatures were slightly underestimated by the model, with MAGST varying from −1.9 to −1.4 °C, while observed MAGST values were between −1.7 and −0.9 °C. The same trend was observed for the estimation of the freezing and thawing season intensity.
The parameterization of the model with known site characteristics and the validation results highlights the importance of ground-truthing data. Underestimated ERA5 air temperature during the thawing season is a constraint for the model application since it affects the simulation of surface warming, which is delayed and weakened during the transition from the freezing to the thawing season. Therefore, it must be corrected using field observations following Westermann et al. (2015).
Simulation of permafrost and active layer temperatures since 1950 in the KSS borehole revealed four different periods despite a long-term warming trend which led to the MAGST increased by approximately 3 °C from an initial value of −4.2 °C, while permafrost temperatures at 20 m depth rose by 2 °C from −2.7 °C, corresponding to a warming rate of approximately 0.24 °C per decade.
The recent acceleration of warming since 2016 highlights the impact of climate change, particularly the increasing frequency and intensity of extreme events that directly affect snowmelt and ground temperatures. This intensified warming trend has led to an increase of 2 m in the ALT, emphasizing the growing vulnerability of permafrost to degradation as temperatures approach the critical threshold of −1 °C, a pattern comparable to Arctic regions where similar conditions have resulted in widespread permafrost thaw.
The limited number, coverage, and short data series of permafrost boreholes in Antarctica have constrained the understanding of the permafrost temperature evolution and its susceptibility to climate change. For the first time, this study reconstructed ground temperature trends since 1950 using a modelling approach validated by in situ measurements, providing a better understanding of the impacts of climate change on permafrost temperature and ALT in the region. Moreover, the successful implementation of CCM for the KSS permafrost observatory highlights the model's potential applicability in the Antarctic context, enhancing knowledge of permafrost evolution under past climate change scenarios and raising the possibility of modelling its future evolution.
The current version of the model is available at https://github.com/CryoGrid/CryoGridCommunity_run (last access: 26 August 2025, Westermann, 2022).
The parameter files and forcing data used in this study are available on Zenodo (https://doi.org/10.5281/zenodo.16949851, Baptista, 2025). The field data from the King Sejong Station observatory are available on Zenodo (https://doi.org/10.5281/zenodo.16949851, Baptista, 2025).
JPB, GBGTV, and SW conceptualized the study; JPB and GBGTV collected data from the PERMANTAR observatories; HL provided data from the King Sejong meteorological station; AMdCSC supported the thermophysical analysis of rock cores collected at the PERMANTAR observatory; JPB and SW worked on the modelling implementation; GBGTV secured financial support for the project; SW developed the software; GBGTV and SW supervised the study; JB drafted the manuscript; and GBGTV and SW reviewed the manuscript.
The contact author has declared that none of the authors has any competing interests.
Publisher’s note: Copernicus Publications remains neutral with regard to jurisdictional claims made in the text, published maps, institutional affiliations, or any other geographical representation in this paper. While Copernicus Publications makes every effort to include appropriate place names, the final responsibility lies with the authors.
The Portuguese Polar Program (PROPOLAR), the Korea Polar Research Institute (KOPRI), and the Spanish Antarctic Program are thanked for the logistical support. The ESA Permafrost_cci project (grant no. 4000123681/18/I-NB) is thanked for the support provided for the model implementation. We are also very grateful for the support by the 32nd and 33rd overwintering teams at the Korean Antarctic King Sejong Station.
This research has been supported by the Fundação para a Ciência e a Tecnologia (grant nos. 2022.06628.PTDC, 2021.05119.BD) and the European Space Agency (grant no. 4000123681/18/I-NB).
This paper was edited by Jeannette Noetzli and reviewed by Vladimir Romanovsky and one anonymous referee.
Baptista, J.: Parameters files, forcing data and observatory data used in “Modelling the evolution of permafrost temperatures and active layer thickness in King George Island, Antarctica, since 1950”, Zenodo [data set], https://doi.org/10.5281/zenodo.16949851, 2025.
Baptista, J., Vieira, G., and Lee, H.: Ground surface temperature regimes are controlled by the topography and snow cover in the ice-free areas of Maritime Antarctica, Catena (Amst), 240, 107947, https://doi.org/10.1016/j.catena.2024.107947, 2024.
Bevan, S., Luckman, A., Hendon, H., and Wang, G.: The 2020 Larsen C Ice Shelf surface melt is a 40-year record high, The Cryosphere, 14, 3551–3564, https://doi.org/10.5194/tc-14-3551-2020, 2020.
Birkenmajer, K.: A guide to Tertiary geochronology of King George Island, West Antarctica, Pol. Polar Res., 10, 555–579, 1989.
Biskaborn, B. K., Smith, S. L., Noetzli, J., Matthes, H., Vieira, G., Streletskiy, D. A., Schoeneich, P., Romanovsky, V. E., Lewkowicz, A. G., Abramov, A., Allard, M., Boike, J., Cable, W. L., Christiansen, H. H., Delaloye, R., Diekmann, B., Drozdov, D., Etzelmüller, B., Grosse, G., Guglielmin, M., Ingeman-Nielsen, T., Isaksen, K., Ishikawa, M., Johansson, M., Johannsson, H., Joo, A., Kaverin, D., Kholodov, A., Konstantinov, P., Kröger, T., Lambiel, C., Lanckman, J. P., Luo, D., Malkova, G., Meiklejohn, I., Moskalenko, N., Oliva, M., Phillips, M., Ramos, M., Sannel, A. B. K., Sergeev, D., Seybold, C., Skryabin, P., Vasiliev, A., Wu, Q., Yoshikawa, K., Zheleznyak, M., and Lantuit, H.: Permafrost is warming at a global scale, Nat. Commun., 10, 264, https://doi.org/10.1038/s41467-018-08240-4, 2019.
Bockheim, J., Vieira, G., Ramos, M., López-Martínez, J., Serrano, E., Guglielmin, M., Wilhelm, K., and Nieuwendam, A.: Climate warming and permafrost dynamics in the Antarctic Peninsula region, Global Planet. Change, 100, 215–223, https://doi.org/10.1016/j.gloplacha.2012.10.018, 2013.
Bozkurt, D., Bromwich, D. H., Carrasco, J., and Rondanelli, R.: Temperature and precipitation projections for the Antarctic Peninsula over the next two decades: contrasting global and regional climate model simulations, Clim. Dynam., 56, 3853–3874, https://doi.org/10.1007/s00382-021-05667-2, 2021.
Bozkurt, D., Marín, J. C., and Barrett, B. S.: Temperature and moisture transport during atmospheric blocking patterns around the Antarctic Peninsula, Weather Clim. Extrem., 38, 100506, https://doi.org/10.1016/j.wace.2022.100506, 2022.
Colwell, S.: Surface meteorology at British Antarctic Survey Stations, 1947–2013, Version 1.0, [Met READER], https://legacy.bas.ac.uk/met/READER/surface/stationpt.html (last access: 29 November 2023), 2013.
de Pablo, M. A., Ramos, M., Molina, A., Vieira, G., Hidalgo, M. A., Prieto, M., Jiménez, J. J., Fernández, S., Recondo, C., Calleja, J. F., Peón, J. J., and Mora, C.: Frozen ground and snow cover monitoring in the South Shetland Islands, Antarctica: Instrumentation, effects on ground thermal behaviour and future research, Cuadernos de Investigación Geográfica, 42, 475, https://doi.org/10.18172/cig.2917, 2016.
de Pablo, M. A., Jiménez, J. J., Ramos, M., Prieto, M., Molina, A., Vieira, G., Hidalgo, M. A., Fernández, S., Recondo, C., Calleja, J. F., Peón, J. J., Corbea-Pérez, A., Maior, C. N., Morales, M., and Mora, C.: Frozen ground and snow cover monitoring in Livingston and Deception islands, Antarctica: preliminary results of the 2015-2019 PERMASNOW project, Cuadernos de Investigación Geográfica, 46, 187–222, https://doi.org/10.18172/cig.4381, 2020.
de Pablo, M. A., Ramos, M., Vieira, G., Molina, A., Ramos, R., Maior, C. N., Prieto, M., and Ruiz-Fernández, J.: Interannual variability of ground surface thermal regimes in Livingston and Deception islands, Antarctica (2007–2021), Land Degrad. Dev., 35, 378–393, https://doi.org/10.1002/ldr.4922, 2024.
Ferreira, A., Vieira, G., Ramos, M., and Nieuwendam, A.: Ground temperature and permafrost distribution in Hurd Peninsula (Livingston Island, Maritime Antarctic): An assessment using freezing indexes and TTOP modelling, Catena, 149, 560–571, https://doi.org/10.1016/j.catena.2016.08.027, 2017.
Gisnås, K., Etzelmüller, B., Farbrot, H., Schuler, T. V., and Westermann, S.: CryoGRID 1.0: Permafrost Distribution in Norway estimated by a Spatial Numerical Model, Permafrost Periglac., 24, 2–19, https://doi.org/10.1002/ppp.1765, 2013.
González-Herrero, S., Barriopedro, D., Trigo, R. M., López-Bustins, J. A., and Oliva, M.: Climate warming amplified the 2020 record-breaking heatwave in the Antarctic Peninsula, Commun. Earth Environ., 3, 122, https://doi.org/10.1038/s43247-022-00450-5, 2022.
Gorodetskaya, I. V, Durán-Alarcón, C., González-Herrero, S., Clem, K. R., Zou, X., Rowe, P., Imazio, P. R., Campos, D., Santos, C. L.-D., Dutrievoz, N., Wille, J. D., Chyhareva, A., Favier, V., Blanchet, J., Pohl, B., Cordero, R. R., Park, S.-J., Colwell, S., Lazzara, M. A., Carrasco, J., Gulisano, A. M., Krakovska, S., Ralph, F. M., Dethinne, T., and Picard, G.: Record-high Antarctic Peninsula temperatures and surface melt in February 2022: a compound event with an intense atmospheric river, NPJ Clim. Atmos. Sci., 6, 202, https://doi.org/10.1038/s41612-023-00529-6, 2023.
Guglielmin, M. and Cannone, N.: A permafrost warming in a cooling Antarctica?, Climatic Change, 111, 177–195, https://doi.org/10.1007/s10584-011-0137-2, 2012.
Hersbach, H., Bell, B., Berrisford, P., Hirahara, S., Horányi, A., Muñoz-Sabater, J., Nicolas, J., Peubey, C., Radu, R., Schepers, D., Simmons, A., Soci, C., Abdalla, S., Abellan, X., Balsamo, G., Bechtold, P., Biavati, G., Bidlot, J., Bonavita, M., De Chiara, G., Dahlgren, P., Dee, D., Diamantakis, M., Dragani, R., Flemming, J., Forbes, R., Fuentes, M., Geer, A., Haimberger, L., Healy, S., Hogan, R. J., Hólm, E., Janisková, M., Keeley, S., Laloyaux, P., Lopez, P., Lupu, C., Radnoti, G., de Rosnay, P., Rozum, I., Vamborg, F., Villaume, S., and Thépaut, J.: The ERA5 global reanalysis, Q. J. Roy. Meteor. Soc., 146, 1999–2049, https://doi.org/10.1002/qj.3803, 2020.
Hrbáček, F., Vieira, G., Oliva, M., Balks, M., Guglielmin, M., de Pablo, M. Á., Molina, A., Ramos, M., Goyanes, G., Meiklejohn, I., Abramov, A., Demidov, N., Fedorov-Davydov, D., Lupachev, A., Rivkina, E., Láska, K., Knǎžková, M., Nývlt, D., Raffi, R., Strelin, J., Sone, T., Fukui, K., Dolgikh, A., Zazovskaya, E., Mergelov, N., Osokin, N., and Miamin, V.: Active layer monitoring in Antarctica: an overview of results from 2006 to 2015, Polar Geography, 1–15, https://doi.org/10.1080/1088937X.2017.1420105, 2018.
Hrbáček, F., Oliva, M., Fernández, J. R., Kňažková, M., and de Pablo, M. A.: Modelling ground thermal regime in bordering (dis)continuous permafrost environments, Environ. Res., 181, 108901, https://doi.org/10.1016/j.envres.2019.108901, 2020.
Hrbáček, F., Vieira, G., Oliva, M., Balks, M., Guglielmin, M., de Pablo, M. Á., Molina, A., Ramos, M., Goyanes, G., Meiklejohn, I., Abramov, A., Demidov, N., Fedorov-Davydov, D., Lupachev, A., Rivkina, E., Láska, K., Kňažková, M., Nývlt, D., Raffi, R., Strelin, J., Sone, T., Fukui, K., Dolgikh, A., Zazovskaya, E., Mergelov, N., Osokin, N., and Miamin, V.: Active layer monitoring in Antarctica: an overview of results from 2006 to 2015, Polar Geography, 44, 217–231, https://doi.org/10.1080/1088937X.2017.1420105, 2021.
Hrbáček, F., Oliva, M., Hansen, C., Balks, M., O'Neill, T. A., de Pablo, M. A., Ponti, S., Ramos, M., Vieira, G., Abramov, A., Kaplan Pastíriková, L., Guglielmin, M., Goyanes, G., Francelino, M. R., Schaefer, C., and Lacelle, D.: Active layer and permafrost thermal regimes in the ice-free areas of Antarctica, Earth Sci. Rev., 242, 104458, https://doi.org/10.1016/j.earscirev.2023.104458, 2023.
Hwang, J., Zheng, X., Ripley, E. M., Lee, J.-I., and Shin, D.: Isotope geochemistry of volcanic rocks from the Barton Peninsula, King George Island, Antarctica, Journal of Earth Science, 22, 40–51, https://doi.org/10.1007/s12583-011-0156-y, 2011.
Jones, P. D. and Lister, D. H.: Antarctic near-surface air temperatures compared with ERA-Interim values since 1979, Int. J. Climatol., 35, 1354–1366, https://doi.org/10.1002/joc.4061, 2015.
Jones, M. E., Bromwich, D. H., Nicolas, J. P., Carrasco, J., Plavcová, E., Zou, X., and Wang, S.-H.: Sixty Years of Widespread Warming in the Southern Middle and High Latitudes (1957–2016), J Clim, 32, 6875–6898, https://doi.org/10.1175/JCLI-D-18-0565.1, 2019.
Karunaratne, K. C. and Burn, C. R.: Relations between air and surface temperature in discontinuous permafrost terrain near Mayo, Yukon Territory, Can. J. Earth Sci., 41, 1437–1451, https://doi.org/10.1139/E04-082, 2004.
Kim, H., Cho, M., and Lee, J.-I.: Thermal metamorphism of volcanic rocks on Barton Peninsula, King George Island, Antarctica, Geosci. J., 6, 303–317, 2002.
Kim, J., Cho, H. K., Jung, Y. J., Lee, Y. G., and Lee, B. Y.: Surface Energy Balance at Sejong Station, King George Island, Antarctica, Atmosphere (Basel), 16, 111–124, 2006.
Klene, A. E., Nelson, F. E., Shiklomanov, N. I., and Hinkel, K. M.: The N-factor in Natural Landscapes: Variability of Air and Soil-Surface Temperatures, Kuparuk River Basin, Alaska, U.S.A., Arct. Antarct. Alp. Res., 33, 140–148, https://doi.org/10.1080/15230430.2001.12003416, 2001.
Lim, H. S., Kim, H. C., Kim, O. S., Jung, H., Lee, J., and Hong, S. G.: Statistical understanding for snow cover effects on near-surface ground temperature at the margin of maritime Antarctica, King George Island, Geoderma, 410, 115661, https://doi.org/10.1016/j.geoderma.2021.115661, 2022.
Lunardini, V. J.: Theory of N-factors, in: Proceedings of the Third International Conference on Permafrost, 40–46, 1978.
Martin, L. C. P., Nitzbon, J., Aas, K. S., Etzelmüller, B., Kristiansen, H., and Westermann, S.: Stability Conditions of Peat Plateaus and Palsas in Northern Norway, J. Geophys. Res.-Earth, 124, 705–719, https://doi.org/10.1029/2018JF004945, 2019.
Obu, J., Westermann, S., Vieira, G., Abramov, A., Balks, M. R., Bartsch, A., Hrbáček, F., Kääb, A., and Ramos, M.: Pan-Antarctic map of near-surface permafrost temperatures at 1 km2 scale, The Cryosphere, 14, 497–519, https://doi.org/10.5194/tc-14-497-2020, 2020.
Oliva, M., Antoniades, D., Serrano, E., Giralt, S., Liu, E. J., Granados, I., Pla-Rabes, S., Toro, M., Hong, S. G., and Vieira, G.: The deglaciation of Barton Peninsula (King George Island, South Shetland Islands, Antarctica) based on geomorphological evidence and lacustrine records, Polar Rec., 55, 177–188, https://doi.org/10.1017/S0032247419000469, 2019.
Østby, T. I., Schuler, T. V., and Westermann, S.: Severe cloud contamination of MODIS Land Surface Temperatures over an Arctic ice cap, Svalbard, Remote Sens. Environ., 142, 95–102, https://doi.org/10.1016/j.rse.2013.11.005, 2014.
Ramos, M., Vieira, G., de Pablo, M. A., Molina, A., Abramov, A., and Goyanes, G.: Recent shallowing of the thaw depth at Crater Lake, Deception Island, Antarctica (2006–2014), Catena, 149, 519–528, https://doi.org/10.1016/j.catena.2016.07.019, 2017.
Renette, C., Aalstad, K., Aga, J., Zweigel, R. B., Etzelmüller, B., Lilleøren, K. S., Isaksen, K., and Westermann, S.: Simulating the effect of subsurface drainage on the thermal regime and ground ice in blocky terrain in Norway, Earth Surf. Dynam., 11, 33–50, https://doi.org/10.5194/esurf-11-33-2023, 2023.
Romanovsky, V. E., Smith, S. L., and Christiansen, H. H.: Permafrost thermal state in the polar Northern Hemisphere during the international polar year 2007–2009: a synthesis, Permafrost Periglac., 21, 106–116, https://doi.org/10.1002/ppp.689, 2010.
Schmidt, J. U., Etzelmüller, B., Schuler, T. V., Magnin, F., Boike, J., Langer, M., and Westermann, S.: Surface temperatures and their influence on the permafrost thermal regime in high-Arctic rock walls on Svalbard, The Cryosphere, 15, 2491–2509, https://doi.org/10.5194/tc-15-2491-2021, 2021.
Smith, M. W. and Riseborough, D. W.: Permafrost monitoring and detection of climate change, Permafrost Periglac., 7, 301–309, https://doi.org/10.1002/(SICI)1099-1530(199610)7:4<301::AID-PPP231>3.0.CO;2-R, 1996.
Smith, S. L., Romanovsky, V. E., Lewkowicz, A. G., Burn, C. R., Allard, M., Clow, G. D., Yoshikawa, K., and Throop, J.: Thermal state of permafrost in North America: a contribution to the international polar year, Permafrost Periglac., 21, 117–135, https://doi.org/10.1002/ppp.690, 2010.
Stuenzi, S. M., Boike, J., Cable, W., Herzschuh, U., Kruse, S., Pestryakova, L. A., Schneider von Deimling, T., Westermann, S., Zakharov, E. S., and Langer, M.: Variability of the surface energy balance in permafrost-underlain boreal forest, Biogeosciences, 18, 343–365, https://doi.org/10.5194/bg-18-343-2021, 2021.
Tetzner, D., Thomas, E., and Allen, C.: A Validation of ERA5 Reanalysis Data in the Southern Antarctic Peninsula–Ellsworth Land Region, and Its Implications for Ice Core Studies, Geosciences (Basel), 9, 289, https://doi.org/10.3390/geosciences9070289, 2019.
Turner, J., Lu, H., White, I., King, J. C., Phillips, T., Hosking, J. S., Bracegirdle, T. J., Marshall, G. J., Mulvaney, R., and Deb, P.: Absence of 21st century warming on Antarctic Peninsula consistent with natural variability, Nature, 535, 411–415, https://doi.org/10.1038/nature18645, 2016.
Turner, J., Marshall, G. J., Clem, K., Colwell, S., Phillips, T., and Lu, H.: Antarctic temperature variability and change from station data, International J. Climatol., 40, 2986–3007, https://doi.org/10.1002/joc.6378, 2020.
Vaughan, D. G., Marshall, G. J., Connolley, W. M., Parkinson, C., Mulvaney, R., Hodgson, D. A., King, J. C., Pudsey, C. J., and Turner, J.: Recent rapid regional climate warming on the Antarctic Peninsula, Climatic Change, 60, 243–274, https://doi.org/10.1023/A:1026021217991, 2003.
Vieira, G., Bockheim, J., Guglielmin, M., Balks, M., Abramov, A. A., Boelhouwers, J., Cannone, N., Ganzert, L., Gilichinsky, D. A., Goryachkin, S., López-Martínez, J., Meiklejohn, I., Raffi, R., Ramos, M., Schaefer, C., Serrano, E., Simas, F., Sletten, R., and Wagner, D.: Thermal state of permafrost and active-layer monitoring in the antarctic: Advances during the international polar year 2007–2009, Permafrost Periglac., 21, 182–197, https://doi.org/10.1002/ppp.685, 2010.
Vionnet, V., Brun, E., Morin, S., Boone, A., Faroux, S., Le Moigne, P., Martin, E., and Willemet, J.-M.: The detailed snowpack scheme Crocus and its implementation in SURFEX v7.2, Geosci. Model Dev., 5, 773–791, https://doi.org/10.5194/gmd-5-773-2012, 2012.
Westermann, S.: Parameter files and code for simulations in “The CryoGrid community model – a multi-physics toolbox for climate-driven simulations in the terrestrial cryosphere”, GMD-2022-127, Zenodo [code], https://doi.org/10.5281/zenodo.6522424, 2022.
Westermann, S., Østby, T. I., Gisnås, K., Schuler, T. V., and Etzelmüller, B.: A ground temperature map of the North Atlantic permafrost region based on remote sensing and reanalysis data, The Cryosphere, 9, 1303–1319, https://doi.org/10.5194/tc-9-1303-2015, 2015.
Westermann, S., Langer, M., Boike, J., Heikenfeld, M., Peter, M., Etzelmüller, B., and Krinner, G.: Simulating the thermal regime and thaw processes of ice-rich permafrost ground with the land-surface model CryoGrid 3, Geosci. Model Dev., 9, 523–546, https://doi.org/10.5194/gmd-9-523-2016, 2016.
Westermann, S., Peter, M., Langer, M., Schwamborn, G., Schirrmeister, L., Etzelmüller, B., and Boike, J.: Transient modeling of the ground thermal conditions using satellite data in the Lena River delta, Siberia, The Cryosphere, 11, 1441–1463, https://doi.org/10.5194/tc-11-1441-2017, 2017.
Westermann, S., Ingeman-Nielsen, T., Scheer, J., Aalstad, K., Aga, J., Chaudhary, N., Etzelmüller, B., Filhol, S., Kääb, A., Renette, C., Schmidt, L. S., Schuler, T. V., Zweigel, R. B., Martin, L., Morard, S., Ben-Asher, M., Angelopoulos, M., Boike, J., Groenke, B., Miesner, F., Nitzbon, J., Overduin, P., Stuenzi, S. M., and Langer, M.: The CryoGrid community model (version 1.0) – a multi-physics toolbox for climate-driven simulations in the terrestrial cryosphere, Geosci Model Dev, 16, 2607–2647, https://doi.org/10.5194/gmd-16-2607-2023, 2023.
Xie, A., Zhu, J., Qin, X., and Wang, S.: The Antarctic Amplification Based on MODIS Land Surface Temperature and ERA5, Remote Sens. (Basel), 15, 3540, https://doi.org/10.3390/rs15143540, 2023.
Zhu, J., Xie, A., Qin, X., Wang, Y., Xu, B., and Wang, Y.: An Assessment of ERA5 Reanalysis for Antarctic Near-Surface Air Temperature, Atmosphere (Basel), 12, 217, https://doi.org/10.3390/atmos12020217, 2021.
Zou, X., Rowe, P. M., Gorodetskaya, I., Bromwich, D. H., Lazzara, M. A., Cordero, R. R., Zhang, Z., Kawzenuk, B., Cordeira, J. M., Wille, J. D., Ralph, F. M., and Bai, L. S.: Strong Warming Over the Antarctic Peninsula During Combined Atmospheric River and Foehn Events: Contribution of Shortwave Radiation and Turbulence, J. Geophys. Res.-Atmos., 128, e2022JD038138, https://doi.org/10.1029/2022JD038138, 2023.
Zweigel, R. B., Westermann, S., Nitzbon, J., Langer, M., Boike, J., Etzelmüller, B., and Schuler, T. V.: Simulating Snow Redistribution and its Effect on Ground Surface Temperature at a High-Arctic Site on Svalbard, J. Geophys. Res.-Earth, 126, e2020JF005673, https://doi.org/10.1029/2020JF005673, 2021.