the Creative Commons Attribution 4.0 License.
the Creative Commons Attribution 4.0 License.
 | 31 Jul 2025
Dynamic identification of snow phenology in the Northern Hemisphere
Le Wang
Xinyun Hu
Yizhuo Li
Bo Qiu
Weidong Guo
Snow phenology characterizes the cyclical changes in snow and has become an important indicator of climate change in recent decades. Changes in snow phenology can significantly impact climate and hydrological conditions. Previous studies commonly employed fixed-threshold methods to extract snow phenology, which cannot represent the differences in the beginning and/or end of the snow period under different snow conditions in the Northern Hemisphere, leading to potential uncertainties in terms of snow phenology. In this study, we observe that snow phenology extracted from different snow data and methods shows significant differences but consistently underestimates snow duration at low and middle latitudes. After normalizing, the percentage snow depth curve turns significantly at the 10 % position, marking the transition between the snow and non-snow seasons. Therefore, we propose a dynamic snow phenology method with a 10 % threshold. Using the dynamic-threshold method, there is an earlier snow cover onset day (SCOD), a later snow cover end day (SCED), and a longer snow cover duration (SCD) at low and middle latitudes, especially on the Tibetan Plateau, where the SCD differences can reach 28 d. The differences in terms of snow phenology at higher latitudes are reversed. The dynamic snow phenology accounts for the spatial heterogeneity of Northern Hemisphere snow cover and excludes the influence of inter-annual variability of snow cover on snow phenology extraction, providing a novel perspective for identifying and understanding snow cover variations in the Northern Hemisphere.
- Article
(6996 KB) - Full-text XML
-
Supplement
(1982 KB) - BibTeX
- EndNote


Snow, an important component of the Earth's cryosphere, has also become a sensitive indicator of climate change (Brown and Mote, 2009; Dong, 2018; Kang et al., 2010). Approximately 98 % of seasonal snow cover is concentrated in the Northern Hemisphere (Armstrong and Brodzik, 2001; Dietz et al., 2012), and its variability has a significant influence on both the global climate system and the hydrological cycle (Déry and Brown, 2007; Cohen et al., 2012; Furtado et al., 2015; Harpold and Brooks, 2018; You et al., 2020). Snow has high albedo and low thermal conductivity, regulating the surface energy balance and subsequently influencing atmospheric circulation (Marks et al., 1992; Gouttevin et al., 2012; Brutel-Vuilmet et al., 2013; Henderson et al., 2018). Meanwhile, the seasonal snow is an important natural reservoir that provides freshwater resources for more than a billion people (Barnett et al., 2005; Immerzeel et al., 2010; Sturm et al., 2017; Bormann et al., 2018). Therefore, accurate quantification of snow dynamics across the Northern Hemisphere (NH) is urgently needed.
Under global warming, the snow cover extent (SCE) of the NH has undergone a notable decline over the past few decades, with this trend being projected to persist into the foreseeable future (Brown and Robinson, 2011; Estilow et al., 2015; Hori et al., 2017; Tang et al., 2022). Meanwhile, the variation rate of each season's average snow depth (SD) exhibited great fluctuations in different seasons. Compared with those in spring and autumn, the average SD in winter decreased at the highest rate (Xiao et al., 2020). In a warmer climate, the snow-melting date will advance in time, and the melting amount will also increase (Barnett et al., 2005; Nijssen et al., 2001; Musselman et al., 2021). Moreover, the length of the snow season and the number of snow days are shortened in global mountain regions (Notarnicola, 2020a). At low and middle latitudes, the continuity of snowfall becomes poorer, and snowfall time is more scattered and irregular (Li et al., 2022; Wang et al., 2024). These indicators suggest that snow in the Northern Hemisphere is undergoing significant changes.
In recent decades, snow phenology has been widely used to characterize seasonal changes in snow. Common snow phenology parameter indicators include snow cover onset day (SCOD), snow cover end day (SCED), and snow cover duration (SCD) (Liston, 1999; Liston and Hiemstra, 2011; Ke et al., 2016; Lin and Jiang, 2017; Notarnicola, 2020b). With climate change, snow phenology has changed significantly, with regional differences (Whetton et al., 1996; Choi et al., 2010; Wang et al., 2013; Peng et al., 2013). Opposite changes in snow phenology occurred across northern middle and high latitudes from 2001 to 2014, with SCD decreasing by 5.57 ± 2.55 d at high latitudes and increasing by 9.74 ± 2.58 d at middle latitudes (Chen et al., 2015). Over the whole of High Mountain Asia, SCD generally decreases, SCOD is delayed, and SCED advances, except in the western Himalayas, where snow cover and SCD increase (Tang et al., 2022; Xu et al., 2024). Changes in snow phenology can significantly impact climate and hydrological conditions. An earlier onset of snowmelt can modify the seasonal distribution of runoff, increasing the frequency of droughts and floods (Chen et al., 2016; Wang et al., 2024). Moreover, snow not only provides essential moisture for vegetation but also offers thermal insulation, protecting plants from harsh winds and cold temperatures (Knowles et al., 2017; Liu et al., 2023). Wipf and Rixen (2010) have demonstrated that the timing of the vegetation growing season is notably affected by snowmelt. Therefore, thorough studies of spatiotemporal changes in snow phenology are essential for understanding regional and global climate dynamics, managing water resources, supporting vegetation growth, and predicting potential climatic crises.
Snow phenology was generally obtained through a two-step process in previous studies, i.e., identifying the presence or absence of snow in the grid based on a given threshold and calculating snow phenology indicators (Peng et al., 2013; Yang et al., 2019; Notarnicola, 2020a). Various types of snow data are used to extract snow phenology, including SD, snow cover fraction, and snow water equivalent, leading to possible differences in terms of identified snow phenology (Chen et al., 2015; Guo et al., 2022). Numerous studies have demonstrated that improving the accuracy of snow cover products is the primary means of enhancing snow phenology metrics (Frei et al., 2012; Estilow et al., 2015; Xiao et al., 2024). However, whether the extraction methods of snow phenology are reasonable has received little attention. Notarnicola (2020b) suggested that global snow cover analyses should consider snow characteristics such as accumulation, duration, and melt. The selection of thresholds is optimized according to different snow cover characteristics (in terms of regularity and maximum snow depth). However, most studies still employ a fixed threshold to extract snow phenology in different regions and years (Brown et al., 2007; Gao et al., 2011; Yue et al., 2022; Tang et al., 2022). In fact, applying a single threshold without accounting for local snow properties, atmospheric conditions, and land cover types often reduces snow detection accuracy (Riggs et al., 2017; Gao et al., 2019). Snow cover increases with latitude, with thick and stable snow cover at high latitudes and shallow and short-lived snow cover at middle and low latitudes, especially on the Tibetan Plateau (TP) (Orsolini et al., 2019). In addition, the snow changes from year to year due to many aspects of the climate, and the regional snow cover trends exhibit a heterogeneous and non-linear response to the regional warming rate (Blau et al., 2024). Snow conditions are variable, but thresholds are always fixed, which can lead to uncertainties in snow phenology. At present, it has been proven that, in the methods of extracting vegetation phenology, fixed thresholds cannot accommodate spatiotemporal heterogeneity, ignore inter-annual variations, and are not applicable to diverse vegetation types, among a series of other problems (White et al., 1997; Mo et al., 2012). However, this issue regarding snow phenology extraction methods has not yet received attention and resolution. We aim to propose a novel method that incorporates both spatial heterogeneity in snow cover and temporal variability to extract snow phenology, reducing the uncertainty associated with the fixed-threshold method from a physical-meaning perspective.
In this study, we compare the snow phenology extracted from different snow data and develop a dynamic-threshold method for snow phenology extraction across the NH. Section 2 describes the details of the data and the snow phenology extraction methods (including the traditional fixed-threshold method and the new dynamic-threshold method) used in this study. Snow phenology extraction and comparison results are presented in Sect. 3. The discussion and conclusions are presented in Sect. 4.
2.1 Snow data
We use the Interactive Multi-Sensor Snow and Ice Mapping System (IMS; Helfrich et al., 2007) dataset to represent the change in snow cover area (SCA). The IMS dataset is produced by the United States National Ice Center (USNIC) to provide cloud-free snow cover products for the NH. The IMS dataset combines multiple optical and microwave sensors to classify snow and non-snow areas. It offers three spatial resolutions of 1, 4, and 24 km, and the daily 24 km snow cover product covers the period from early 1997 to the present, which is used in this work.
The 8 d snow cover component product (MOD10C2) is also used to represent the SCA variation. The MOD10C2 product delivered by the Moderate Resolution Imaging Spectrometer Satellite (MODIS) combines data from the 8 d composite product of the MOD10A2 at a resolution of 500 m (Hall and Riggs, 2007). Utilizing an 8 d composite is advantageous as it accommodates areas where frequent cloud cover obstructs continuous surface observations (Frei et al., 2012). It is worth noting that polar darkness prevents the mapping of snow cover in arctic regions in boreal winter in this dataset (Riggs et al., 2019).
Meanwhile, we employ a separate dataset of snow depth (SD) for comparative analysis with the SCA dataset. The long-term series of daily global SD are obtained by means of a passive microwave remote sensing inversion method (Che et al., 2019). The remote sensing inversion method uses a dynamic brightness temperature gradient algorithm, which considers temporal and spatial variations in snow characteristics and establishes a dynamic spatial and seasonal relationship between brightness temperature differences at different frequencies and snow depths. Long time series of passive microwave brightness temperature data are obtained from three sensors: SMMR, SSM/I, and SSMI/S. The dataset is a daily product covering the period of 1980–2018 at a spatial resolution of 25067.53 m and shows a relative deviation of within 30 %.
The long-term series of daily global SD is affected by satellite orbits, leading to substantial missing measurements at low and middle latitudes. To minimize the negative effects of data gaps, we substitute the China region in the global dataset with another set of snow depth data for the China region (Che et al., 2015). This dataset is extracted from satellite-borne passive microwave brightness temperature data using the Chinese passive microwave SD inversion algorithm of Che et al. (2015). These data have been validated against meteorological observations, and absolute errors of less than 5 cm account for approximately 65 % of all of the data (Che et al., 2008). For snow products with different resolutions, we have standardized them to a resolution of 0.25°.
2.2 Definition of snow phenology
In this study, we calculate the snow phenology in the hydrological year, which is defined as the period from 1 September to 31 August of the following year. For different data, snow cover phenology indicators are defined in different ways (Table 1). For the daily IMS binary SCA dataset, no additional processing is required to determine if the grid is covered with snow. However, a fixed threshold of snow cover is used to classify grids as snow-covered or snow-free for the SD datasets. Additionally, snow cover is considered to be present for the MOD10C2 dataset when the MOD10C2 exceeds 50 % (Brown et al., 2007; Gao et al., 2011; Ke et al., 2016).
Table 1Definitions of fixed-threshold methods for snow phenology parameters with different datasets.
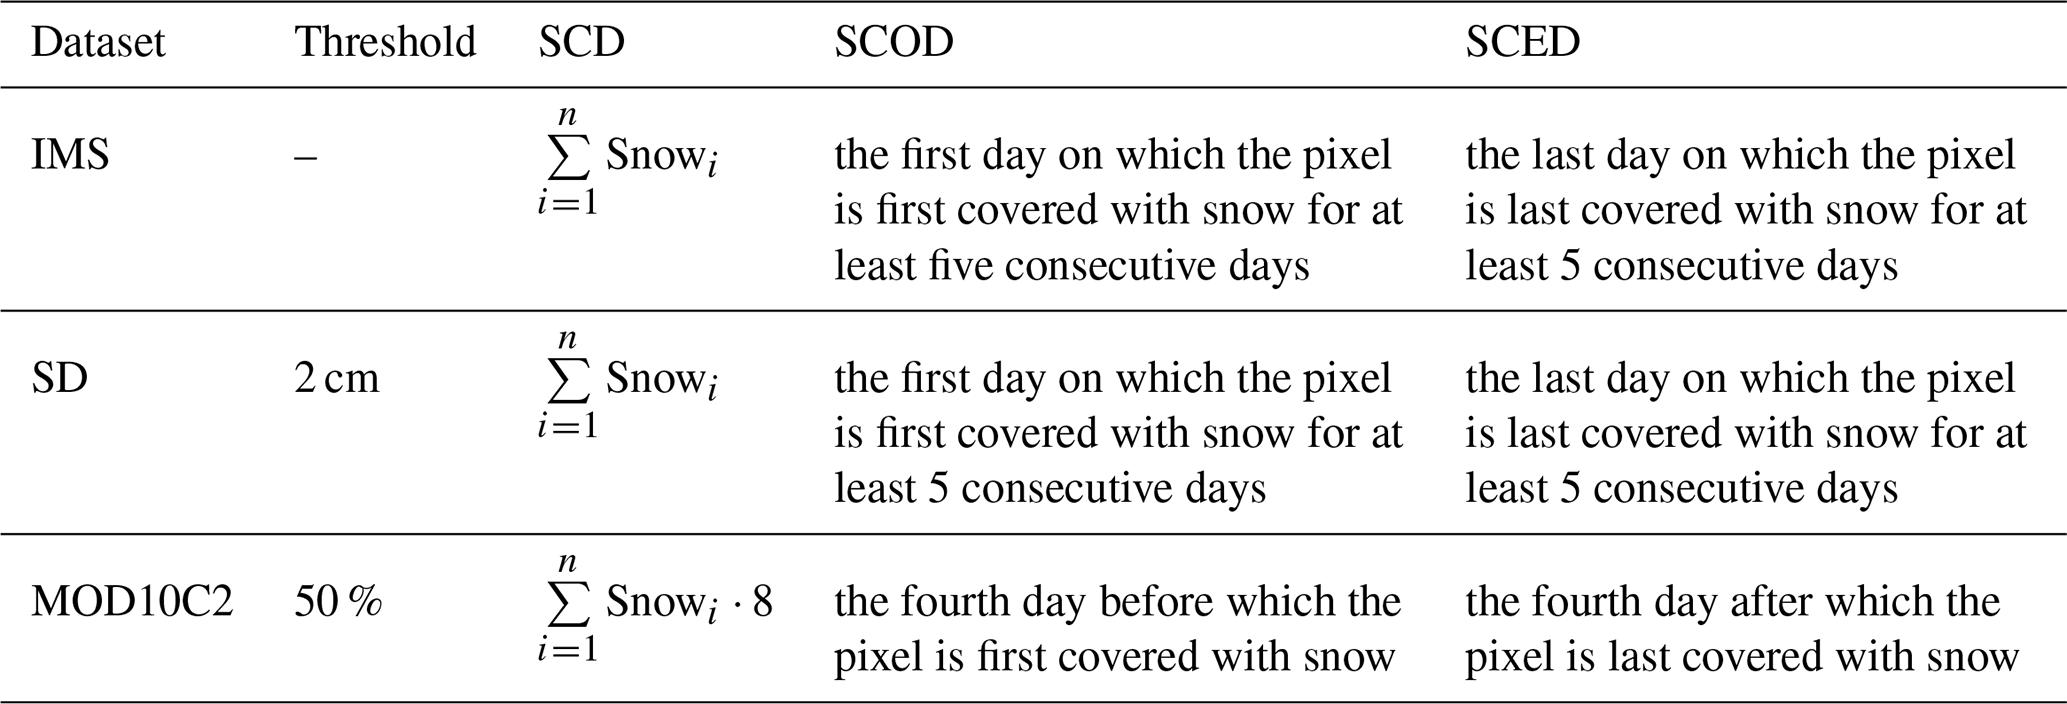
Note that, in the equations, “snow” is the snow element used. n is the total number of days in the hydrologic year, which is 365 and 366 for the IMS and SD datasets and 46 for the MOD10C2 dataset.
Following the identification of snow in the grid, SCD, SCOD, and SCED are extracted for every dataset. SCD values for the SD and IMS datasets are calculated by summing snow-covered days. SCOD is defined as the first day with the first continuous snow cover exceeding 5 d in a hydrological year, whereas SCED is the last day with the last continuous snow cover exceeding 5 d. For the MOD10C2 dataset, considering the 8 d temporal resolution, the SCOD is the date 4 d before the first identified snow cover, and the SCED is 4 d after the last identified snow cover. SCD is determined by multiplying the number of snow occurrences by eight (Notarnicola, 2020a; Yue et al., 2022; Guo et al., 2022; Chen et al., 2015).
2.3 Dynamic threshold for snow phenology
In this study, we develop a dynamic snow phenology method with reference to the vegetation phenology extraction method. The vegetation phenology extraction method was proposed by White et al. (1997) based on the normalized difference vegetation index (NDVI), which detects the start of the growing season (SOS) and the end of the growing season (EOS) across land cover. The formula is as follows:
where NDVImax is the annual maximum NDVI, and NDVImin is the annual minimum NDVI. When the NDVIratio is above a certain threshold, the corresponding day of the year is determined to be the SOS. When the NDVIratio is below a certain threshold, the corresponding day of the year is determined to be the EOS. Employing this approach instead of using a fixed threshold enables the comparison of vegetation phenology across different land types (White et al., 2014; Yu et al., 2010; Sun et al., 2022).
To investigate the snow phenology in different areas across the globe, we propose a dynamic threshold for snow phenology:
where Snowmax is the annual maximum snow element (e.g., snow cover fraction, snow depth), and Snowminis the annual minimum snow element. The grid is determined to be snowy when Snowratio exceeds a certain threshold.
To identify the optimal Snowradio, we normalize and smooth the inter-annual SD variation curves for the entire NH and each latitudinal zone (including the Tibetan Plateau) with a 30 d moving window and then calculate their first-order derivatives. Occasional snowfall events, such as short-duration or localized snowfall, can introduce anomalous fluctuations into the snow curve, leading to multiple small peaks or atypical maxima. These fluctuations represent short-term meteorological noise rather than the long-term seasonal evolution of the snow cover. This is particularly common, especially in unstable snow areas (e.g., the Tibetan Plateau). Smoothing can reduce these instabilities and make the snow curve more reflective of seasonal snowpack changes. The dynamic-threshold method relies on the trend of the snow curve. If the snow curve is affected by chance snowfall events, it may lead to a misjudgment of the dynamic threshold. Therefore, we smooth the snow data to eliminate the effect of noise. Additionally, we design pre-experiments and conclude that a sliding window of 30 d would be most appropriate (see Fig. S1 in Supplement). The first-order derivative represents the slope of the tangent line. Its extreme points show where the slope is steepest, meaning the curve changes most significantly. We assume the smoothed snow accumulation curve has a single-peak structure. The first-order derivative can be seen as the actual rate of snow accumulation or melting. The extreme points of the first-order derivative indicate the maximum rate of snow changes. When the first-order derivative equals zero (at the beginning and end of the curve, not the maximum), this shows that snow has not started accumulating or has completely melted. The intermediate state between the maximum rate of snow changes and no change represents when snow starts to accumulate or when melting is nearly complete, which is what we are looking for in SCOD and SCED. So, here, we simply choose the extreme midpoint of the first-order derivative as the snow curve turning point. The percentage of the turning point is the threshold we need. The above process is carried out for each grid in the NH, and Fig. 1 shows a schematic of the entire NH. The midpoints of the extreme are labeled A and B, which correspond to the snow curves as SCOD and SCED. The percentages for SCOD and SCED fall between 5 % and 15 % (marked by red circles). Below this threshold, the snow curve changes slowly, while, above it, the curve changes rapidly. This threshold range (i.e., Snowratio) can therefore serve as an indicator for the beginning and/or end of the snow season.
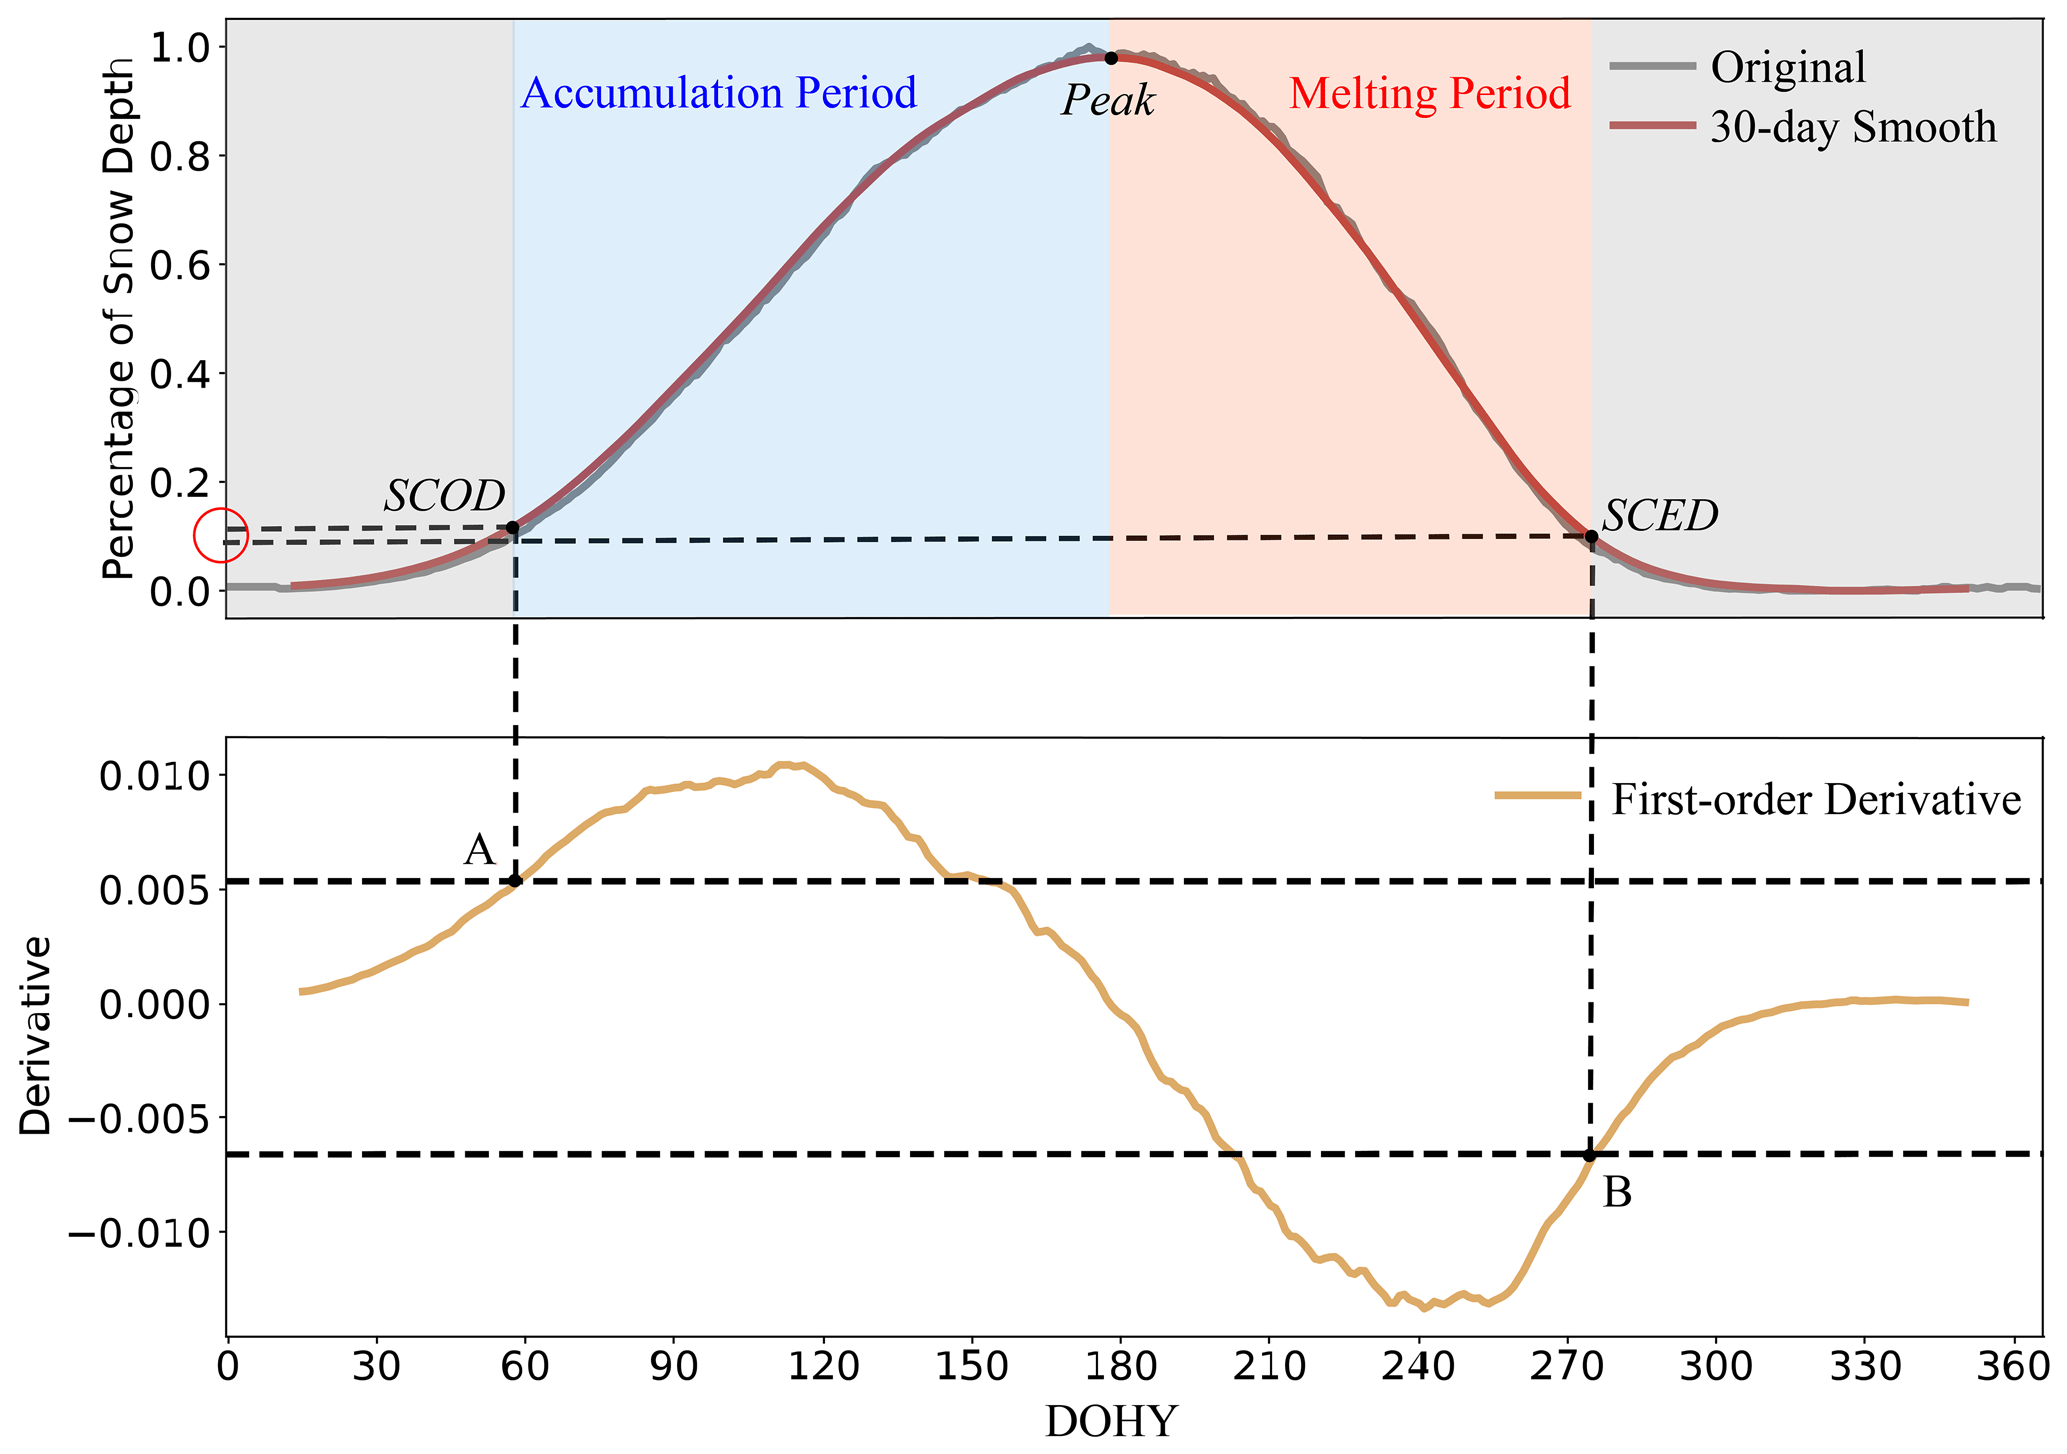
Figure 1Intra-annual variability in the normalized SD in the Northern Hemisphere. The gray curves represent the original SD, the red curves represent the 30 d smoothed SD, and the yellow curves represent the first-order derivative. A and B represent the midpoints of the extreme of the first-order derivative. Gray shading indicates that the snow season has not started or has ended, blue shading indicates the snow accumulation period, and red shading indicates the snow-melting period. The unit DOHY is an abbreviation for day of the hydrological year, defined as 1 September through 31 August of the following year.
2.4 Elevation data and standard deviation of topography
To explore the relationship between topography and snow phenology, we use an elevation dataset with a spatial resolution of 0.008° derived from the NASA digital elevation model (DEM). The dataset is used for calculations of the gridded standard deviation of topography (SDtopo). Compared with the average topographic height, the SDtopo provides a more accurate representation of topographic variability, which is essential for predicting snow cover distributions in mountainous regions (Douville et al., 1995; Swenson and Lawrence, 2012; Miao et al., 2022). Specifically, the 0.1° SDtopo data are obtained by calculating the standard deviation of all elevation values within each 0.1° grid cell.
3.1 Comparison of snow phenology extracted from different data
Due to the spatial heterogeneity of snow distributions in the NH, the diversity of snow data types, and the choice of fixed thresholds, the snow phenology extraction in the NH is subject to great uncertainty. To accurately capture snow phenology and reflect the effects of different methods on snow phenology, we first compare the snow phenology results of three datasets (IMS, MOD10C2, and SD) during the hydrological years of 2000–2018. Notably, snow phenology above 60° N is not extracted from the MOD10C2 dataset due to the effects of the polar night.
Overall, the spatial distribution of snow phenology across the NH exhibits pronounced heterogeneity, characterized by distinct latitudinal and altitudinal zonal patterns. In detail, as latitudes and altitudes increase, the SCD extends with earlier SCOD and later SCED (Fig. 2). At high latitudes (above 60° N), SCD generally exceeds 180 d, with SCOD occurring from September through October and SCED occurring from June through August. Within the latitudinal range of 40–60° N, SCD exhibits a broader range from a minimum of approximately 20 d to a maximum of around 180 d. SCOD occurs from November to December, while SCED occurs from March to May. In areas below 40° N, except for the highlands on the TP, SCD is generally less than 30 d. Snow phenology on the TP increases with altitude, with SCD being greater than 280 d in the western mountainous region but less than 20 d in the central basin region.
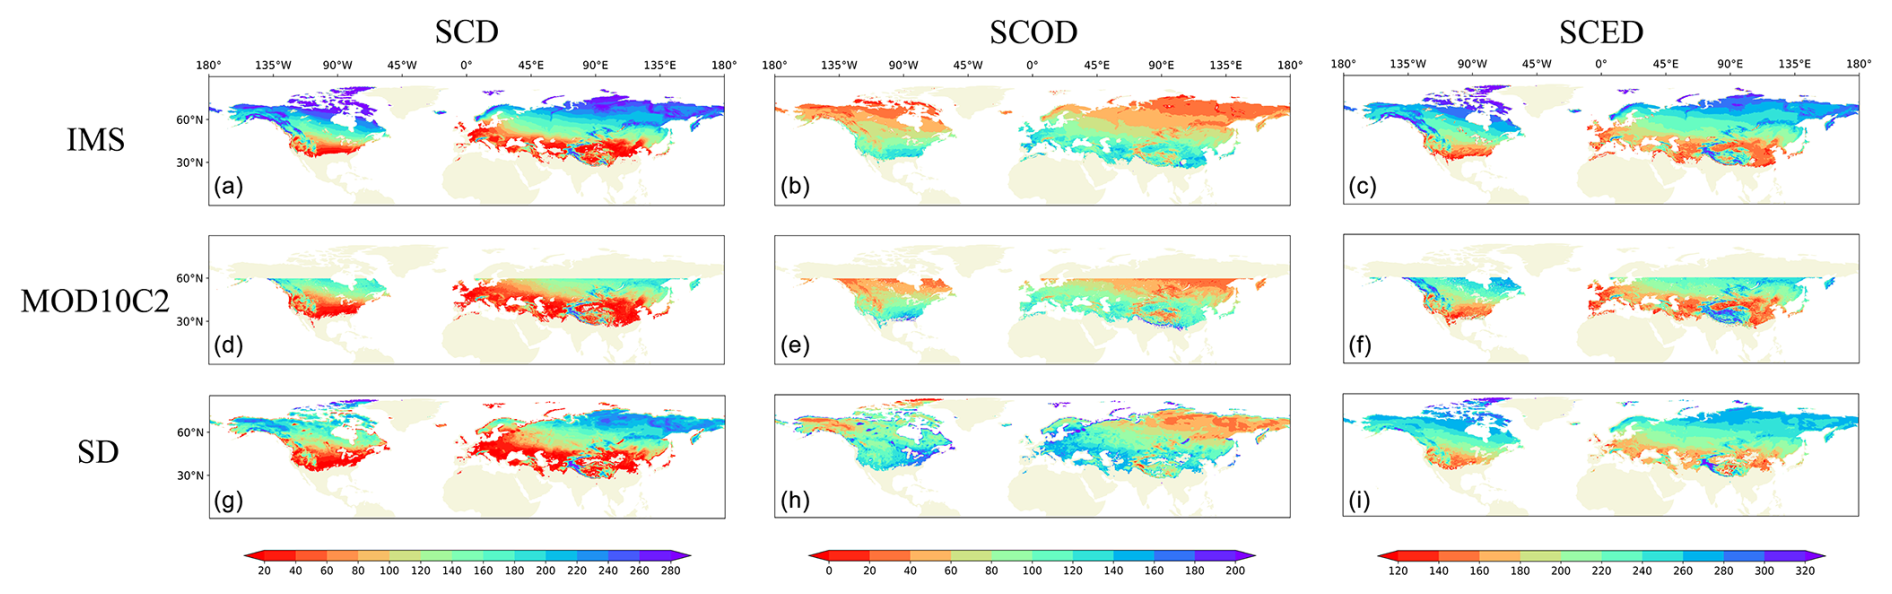
Figure 2Spatial distribution of snow phenology extracted by the fixed-threshold method over the Northern Hemisphere for the hydrological years of 2000–2018. (a) Multi-year averaged snow cover duration (SCD), (b) snow cover onset day (SCOD), and (c) snow cover end day (SCED) based on the IMS dataset. (d, e, f) Same as (a), (b), and (c) but for the MOD10C2 dataset. (g, h, i) Same as (a), (b), and (c) but for the SD dataset. The unit DOHY is an abbreviation for day of the hydrological year, defined as 1 September through 31 August of the following year.
In the NH, snow characteristics across various latitudinal zones exhibit notable distinctions, leading to diverse snow phenology patterns. To thoroughly assess the impact of varying snow data types and extraction methods on the snow phenology results, we further compare snow phenology across different latitudinal zones (including the Tibetan Plateau) using three datasets. From Table 2, the statistical results reveal a substantial difference (22 d) in terms of SCD between the IMS and SD datasets across the entire NH. Specifically, this difference is primarily attributed to SCOD, which shows a notable variation of 33 d, while SCED displays a marginal difference of only 1 d.
Table 2Different snow phenology indicators extracted from the three datasets in different latitudinal zones (including the Tibetan Plateau).
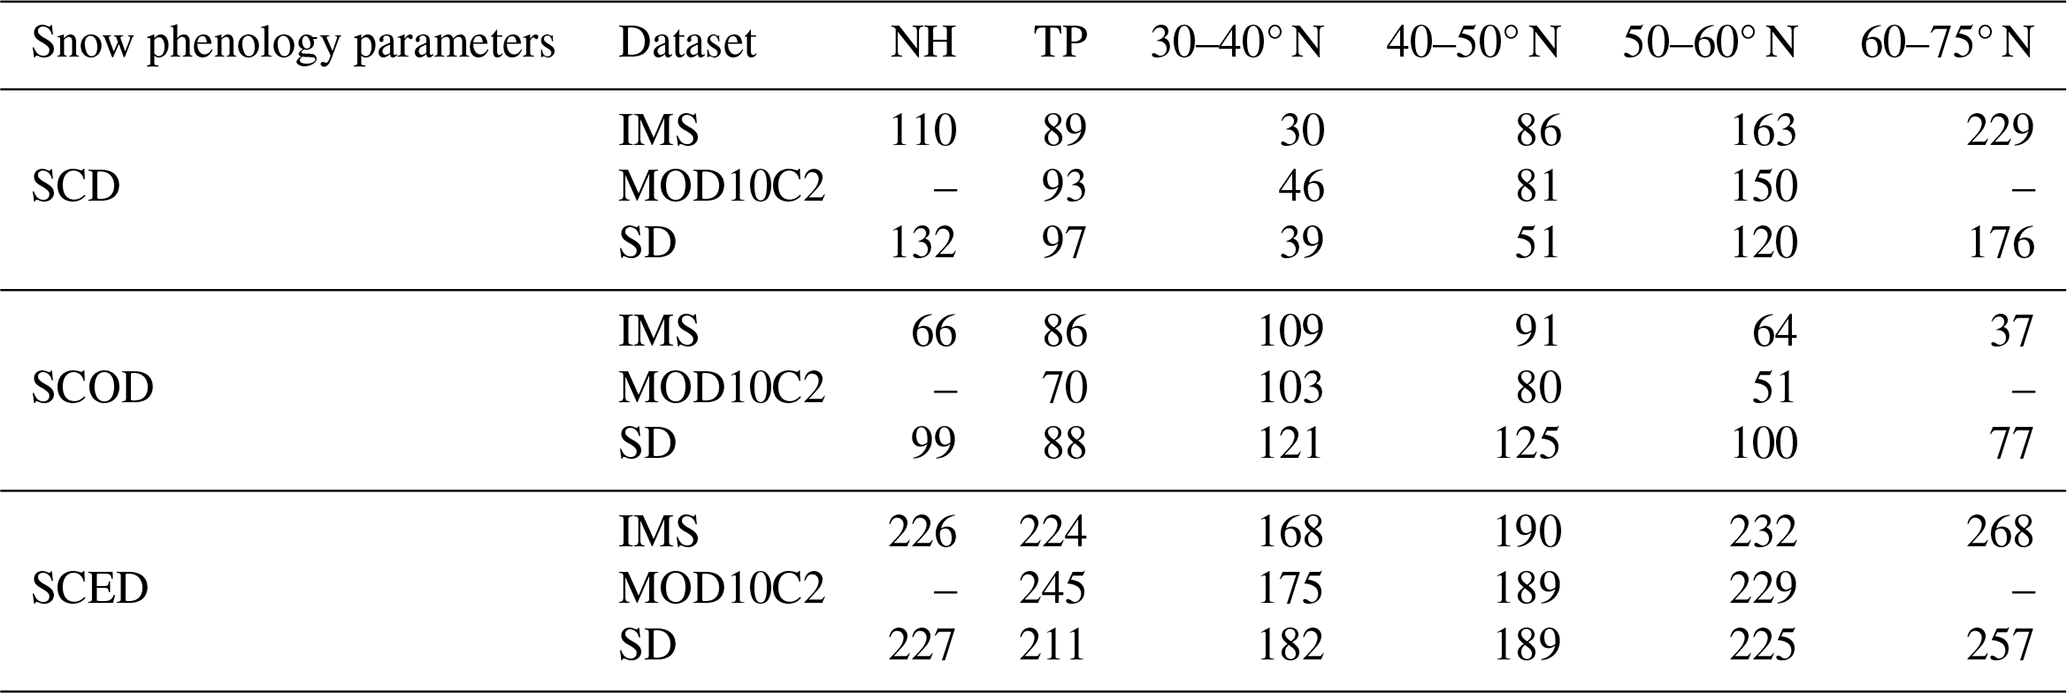
Note that NH is short for the Northern Hemisphere, and TP is short for the Tibetan Plateau. The unit DOHY is an abbreviation for day of the hydrological year, defined as 1 September through 31 August of the following year.
Further analysis at different latitudinal zones emphasizes the significant variability in snow phenology among the three datasets. For the SCD, the differences among the three datasets are relatively small in the middle- and low-latitude zones and are more pronounced at high latitudes (53 d) between the IMS and SD. Besides, the SD dataset consistently identifies the latest SCOD across all latitudinal zones, while the MOD10C2 dataset identifies the earliest SCOD, with the difference between them exceeding 1 month north of 40° N latitude. In comparison to the above two snow phenology indicators, the SCED has smaller differences, exhibiting pronounced magnitudes only at low and middle latitudes. The most substantial deviation is observed between the MOD10C2 and SD datasets on the TP, reaching 34 d.
Among the three datasets, the IMS and MOD10C2 both serve as representations of snow coverage. The comparative analysis indicates that both datasets exhibit synchronous latitudinal variations, with a turning point at 40° N (Fig. 3). South of 40° N, the mean snow coverage from IMS is larger than that of the MOD10C2, and the opposite is true north of 40° N. To explore the influence of threshold selection on snow phenology extraction, different thresholds of 30 % and 50 % are also implemented within the MOD10C2 dataset. The results show that the variations in snow phenology extracted from the two datasets are basically the same. For SCD, 40° N also serves as a turning point, with IMS extracting the shortest SCD south of 40° N and the longest SCD north of 40° N. Additionally, the IMS consistently extracts the latest SCOD across all latitudes, while SCED is the latest for the MOD10C2 with a 30 % threshold. There are significant differences in snow phenology when different thresholds are used. Specifically, when the threshold is reduced, snow conditions at given grid points are more easily reached, resulting in a longer SCD, earlier SCOD, and later SCED. This indicates the importance of threshold selection in accurately capturing snow dynamics and temporal changes in snow coverage.
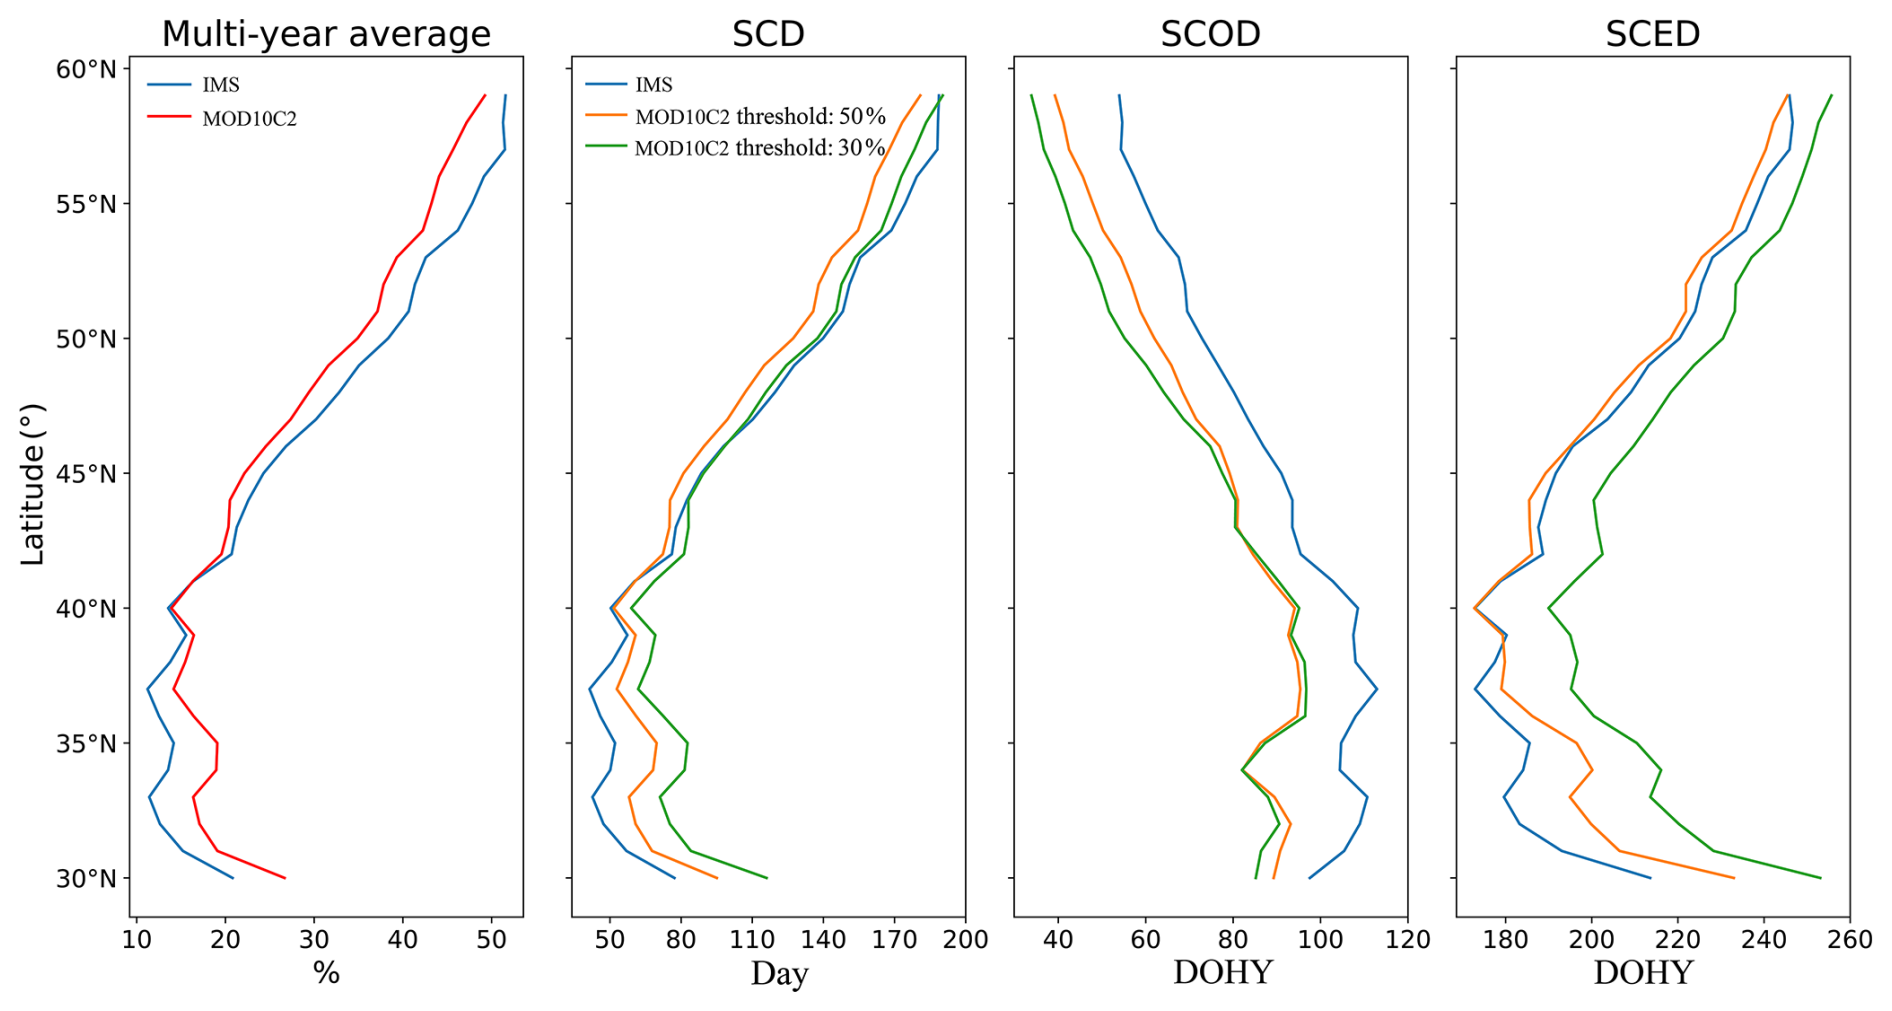
Figure 3Changes in snow phenology indicators from the IMS and MOD10C2 datasets with latitude. The figures indicate the latitudinal variations of (a) the snow cover fraction (SCF), (b) snow cover duration (SCD), (c) snow cover onset day (SCOD), and (d) snow cover end day (SCED). The blue curve in (a) represents the IMS, and the red curve represents the MOD10C2. The blue curves in (b), (c), and (d) represent the snow phenology extracted by the IMS, the orange curves represent the snow phenology extracted by the MOD10C2 with a threshold value of 50 %, and the green curves represent the snow phenology extracted by the MOD10C2 with a threshold value of 30 %. The unit DOHY is an abbreviation for day of the hydrological year, defined as 1 September through 31 August of the following year.
Temporally, the IMS, MOD10C2, and SD datasets show different intra-annual variations (Fig. 4). At low and middle latitudes, such as in the latitudinal zone of 30–40° N, the annual average maximum MOD10C2 is 26.4 %, and the maximum SD reaches 2.19 cm. Although perennial snow is prevalent at high elevations on the TP, the annual mean maximum MOD10C2 remains below 50 %, and the maximum SD is only 3.92 cm. It is evident that the thresholds of 50 % for the MOD10C2 and 2 cm for SD cannot realistically characterize the seasonal variations of snow at low and middle latitudes.
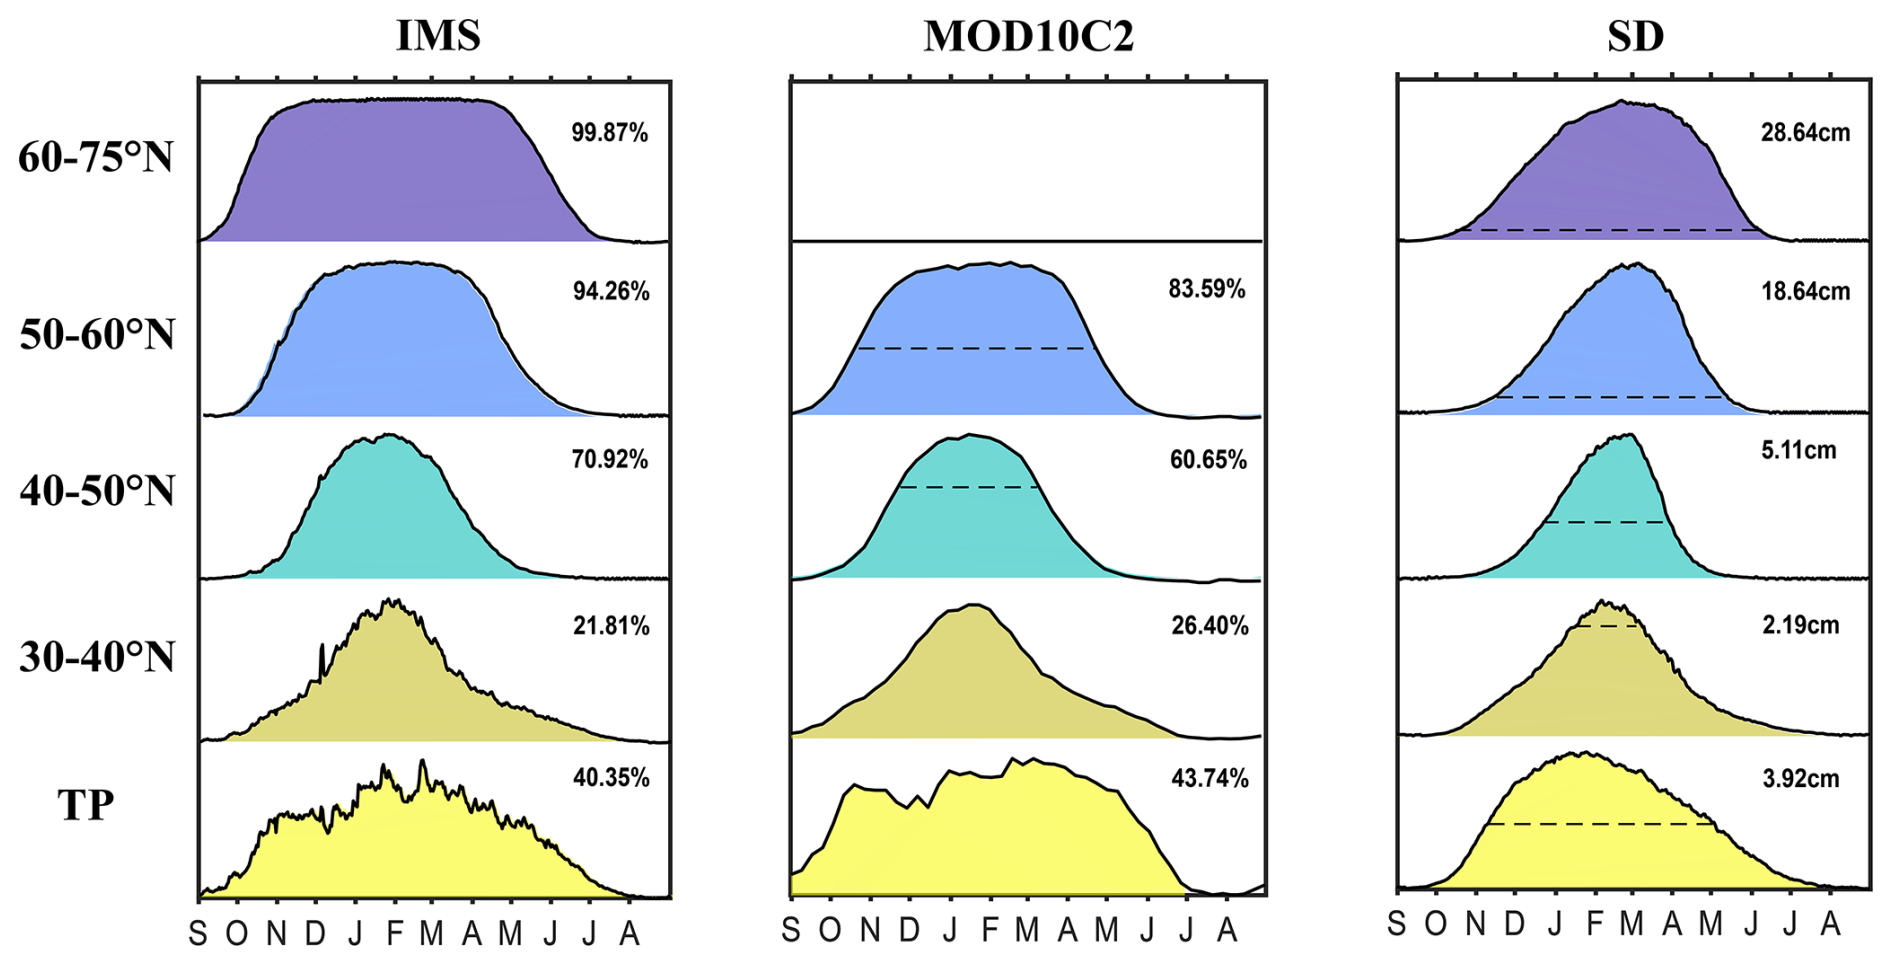
Figure 4Intra-annual variations in the IMS, MOD10C2, and SD in five latitudinal zones (including the Tibetan Plateau) from 2000 to 2018. The dashed lines in the MOD10C2 curve represent the MOD10C2 of 50 %, and the dashed lines in the SD curves represent the SD of 2 cm. The MOD10C2 dataset north of 60° N is not analyzed due to the effects of the polar night. The values in the graphs characterize the annual snow maximum over the respective areas.
Furthermore, SD consistently displays a stable, single-peak change, effectively capturing the snow processes from accumulation to ablation. In contrast, the IMS and MOD10C2 curves exhibit significant fluctuations at low latitudes, particularly on the TP, where multiple peaks are observed. As latitude increases, the IMS and MOD10C2 curves become smooth. However, in the latitudinal zones north of 50° N, snow cover can become extensive or even reach complete coverage over time, masking the variability of snow and resulting in a lack of distinct peaks. In our study, the snow peak is also used as an indicator, and snow accumulation and melting processes are analyzed separately. The stable single-peak structure of the SD curve is more suitable for our study, and the MOD10C2 data are affected by the polar night, which prevents the use of data at high latitudes. Therefore the subsequent snow phenological correction is to use SD data.
Based on the above results, we believe that improving the accuracy of snow cover products is one of the primary means for enhancing snow phenology and that the soundness of snow phenology extraction methods is crucial. In the next section, we aim to enhance the snow phenology extraction method using SD data to obtain a more reasonable snow phenology in the NH.
3.2 Dynamic snow phenology threshold
Snow cover in the Northern Hemisphere (NH) exhibits a latitudinal distribution pattern opposite to that of vegetation, where vegetation decreases with increasing latitude (Wang et al., 2016; Zeng et al., 2020), while snow cover increases. Given this similarity in zonal variation, we propose a dynamic-threshold method for extracting snow phenology, inspired by a commonly used approach in vegetation phenology (see Sect. 2.3). This method assigns varying thresholds to grid points based on their local snow conditions, enabling more accurate characterization of spatial and temporal snow phenology compared to a fixed threshold. To enhance the robustness of our analysis, we extend the study period to the hydrological years of 1989–2018.
To determine an appropriate dynamic threshold, we calculate first-order derivatives of snow depth time series across five latitudinal zones in the NH. The results indicate that the Snowratio values predominantly fall within the range of 5 %–15 %. A grid-point-level analysis further supports the generalizability of this threshold interval, with 73.05 % and 82.65 % of areas falling within this range during snow accumulation and during snowmelt, respectively (Fig. 5). Notably, areas with SCD of fewer than 10 d were masked to ensure statistical reliability. Based on these findings, we establish a 10 % threshold – the midpoint of the 5 %–15 % range – to define snow presence at a given grid point. Specifically, a grid is considered to be snow-covered if its snow depth reaches a value corresponding to 10 % of the difference between its maximum and minimum snow depth; otherwise, it is classified as snow-free.
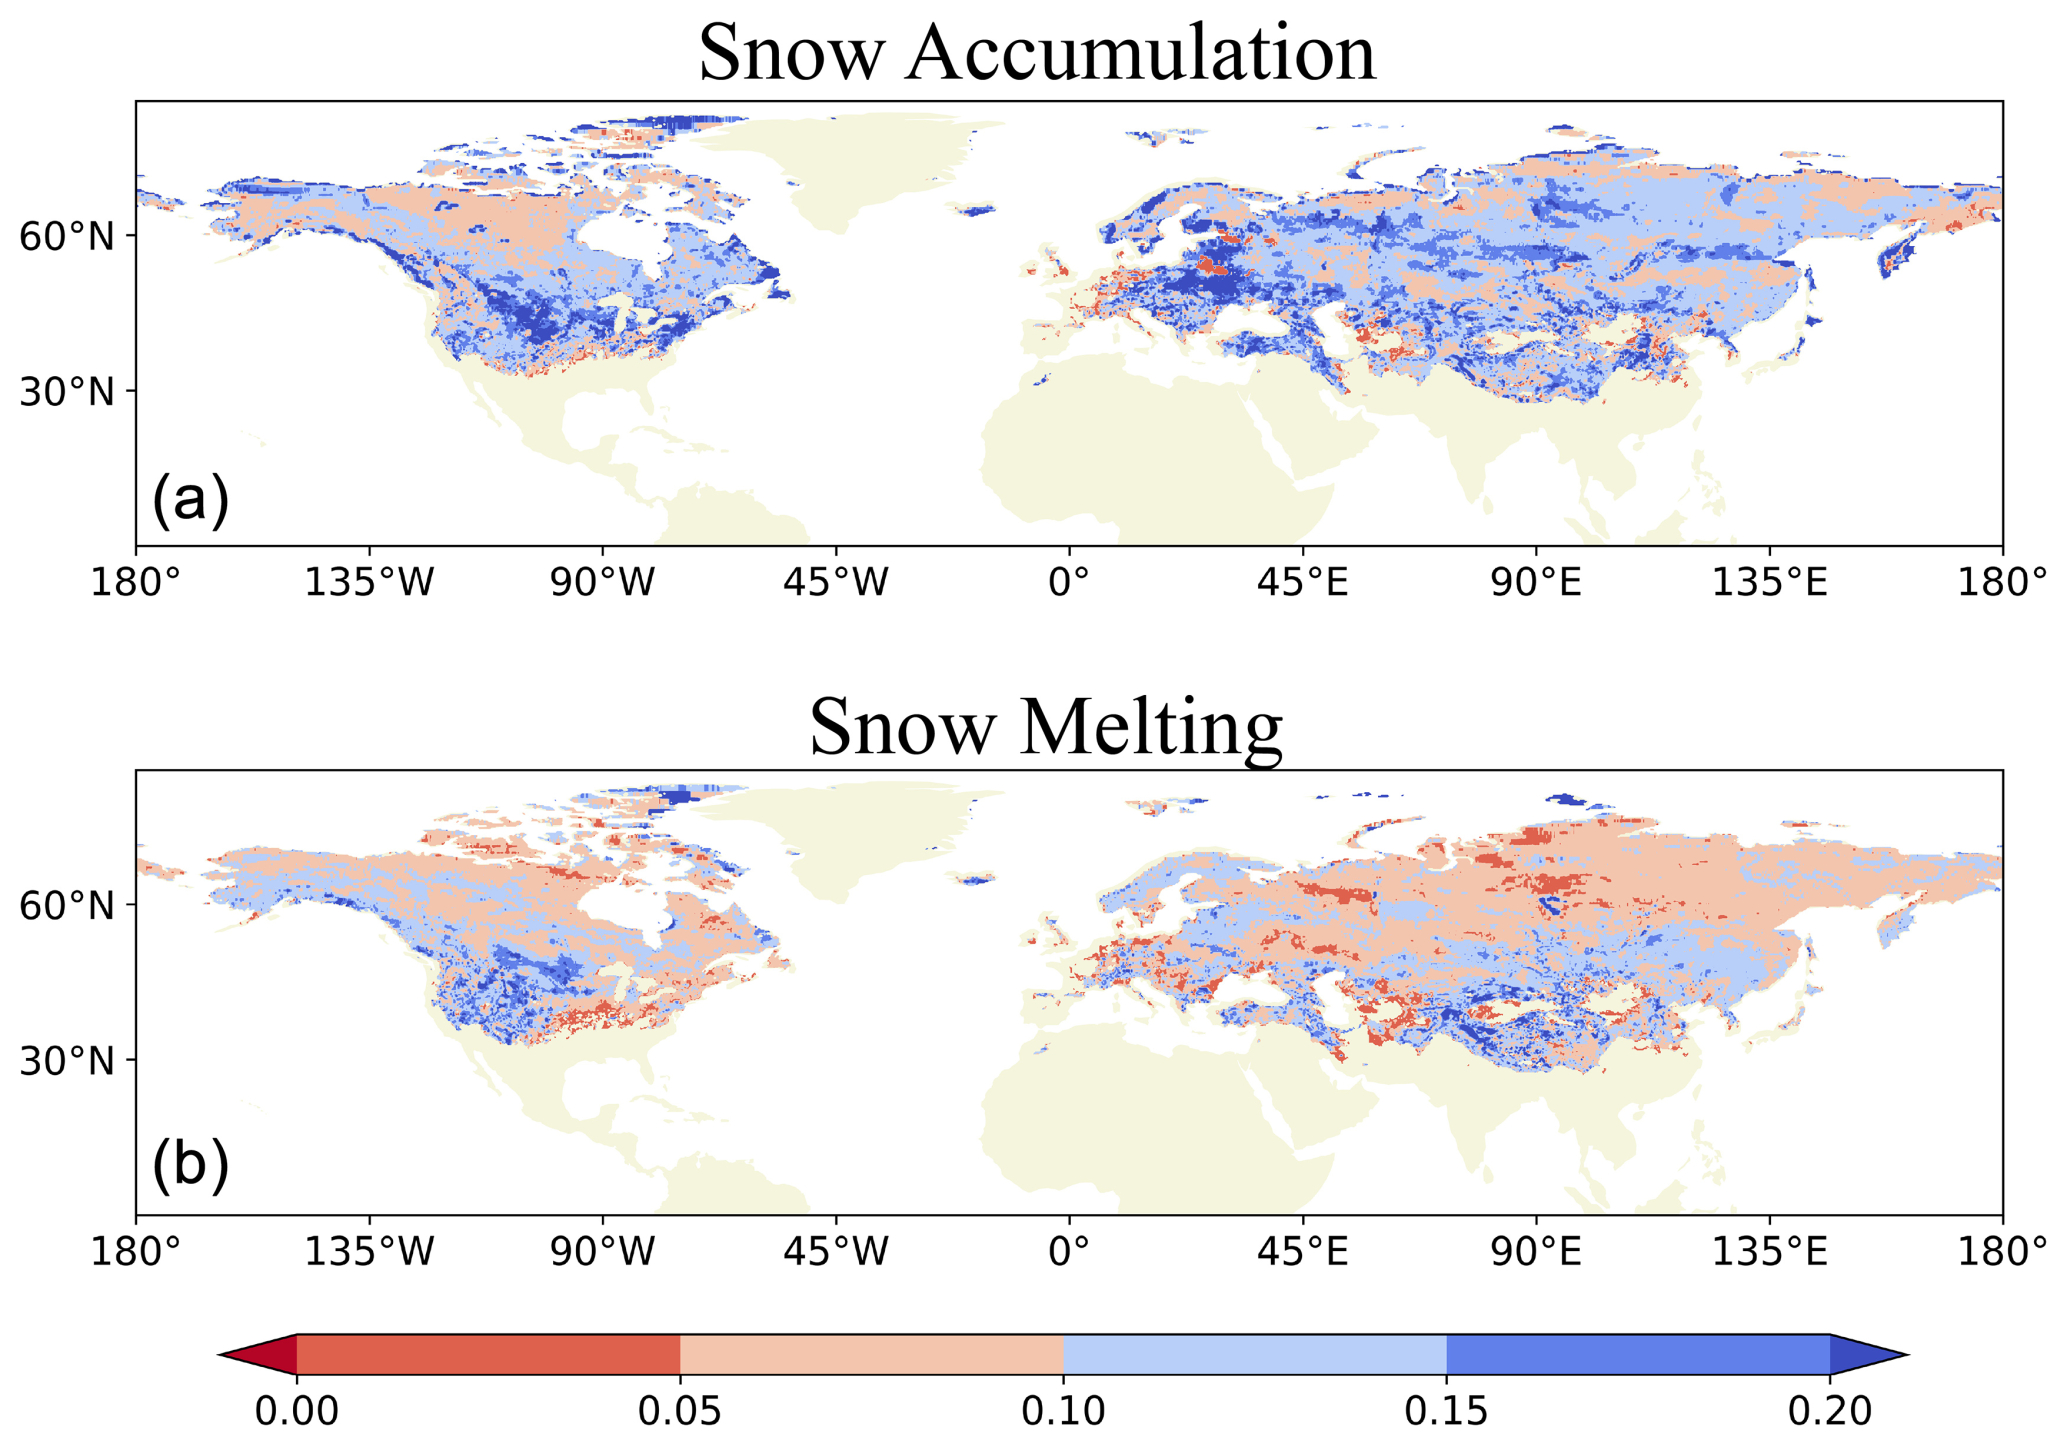
Figure 5Spatial distribution of Northern Hemisphere threshold percentages extracted from the first-order derivatives. (a) Percentage thresholds associated with snow accumulation (SCOD) from the first half of the first-order derivative maximum value. (b) Percentage thresholds associated with snow melting (SCED) from the last point of half of the first-order derivative minimum value. The extraction of threshold percentages is preceded by a sliding-average process with a window of 30 %.
Normalizing and plotting the intra-annual variation of SD curves for five latitudinal zones of the Northern Hemisphere on the same graph, it is evident that the 10 % threshold generally corresponds to the position of the turn in the curve slope for each latitudinal zone (Fig. 6a). The percentage SD curves show minimal change below the 10 % threshold, indicating little snow cover and that the snow season has either not started or has ended. In contrast, the curves rise and/or fall sharply when percentage SD curves are above the 10 % threshold, indicating ongoing snow accumulation and/or melting. The position of 10 % is exactly at the inflection point of the transition between the two states of snow, which can be recognized as an indicator for judging the beginning and/or end of the snow season. Meanwhile, the unified results of multiple latitudinal bands confirm the universality and reasonability of the 10 % threshold. We plot the relationship between the percentage threshold and the smoothing window for the Northern Hemisphere and for each latitude zone and find that the percentage threshold, similarly, stabilizes around 10 % when the window reaches 30 d, justifying the window (see Fig. S1 in Supplement). Defining a SDtopo greater than 200 as a mountain range divides the Northern Hemisphere into mountain ranges and non-mountain ranges. Regardless of the latitudinal belt, the snow curve in the non-mountainous region would be narrower than that in the mountainous region, implying a shorter snow season in the non-mountainous region. Snow curves in mountainous regions are more stable and show the same pattern in the five latitudinal zones. Therefore, the location of the 10 % threshold is appropriate in both mountain range and non-mountain range areas where the turnover change occurs.
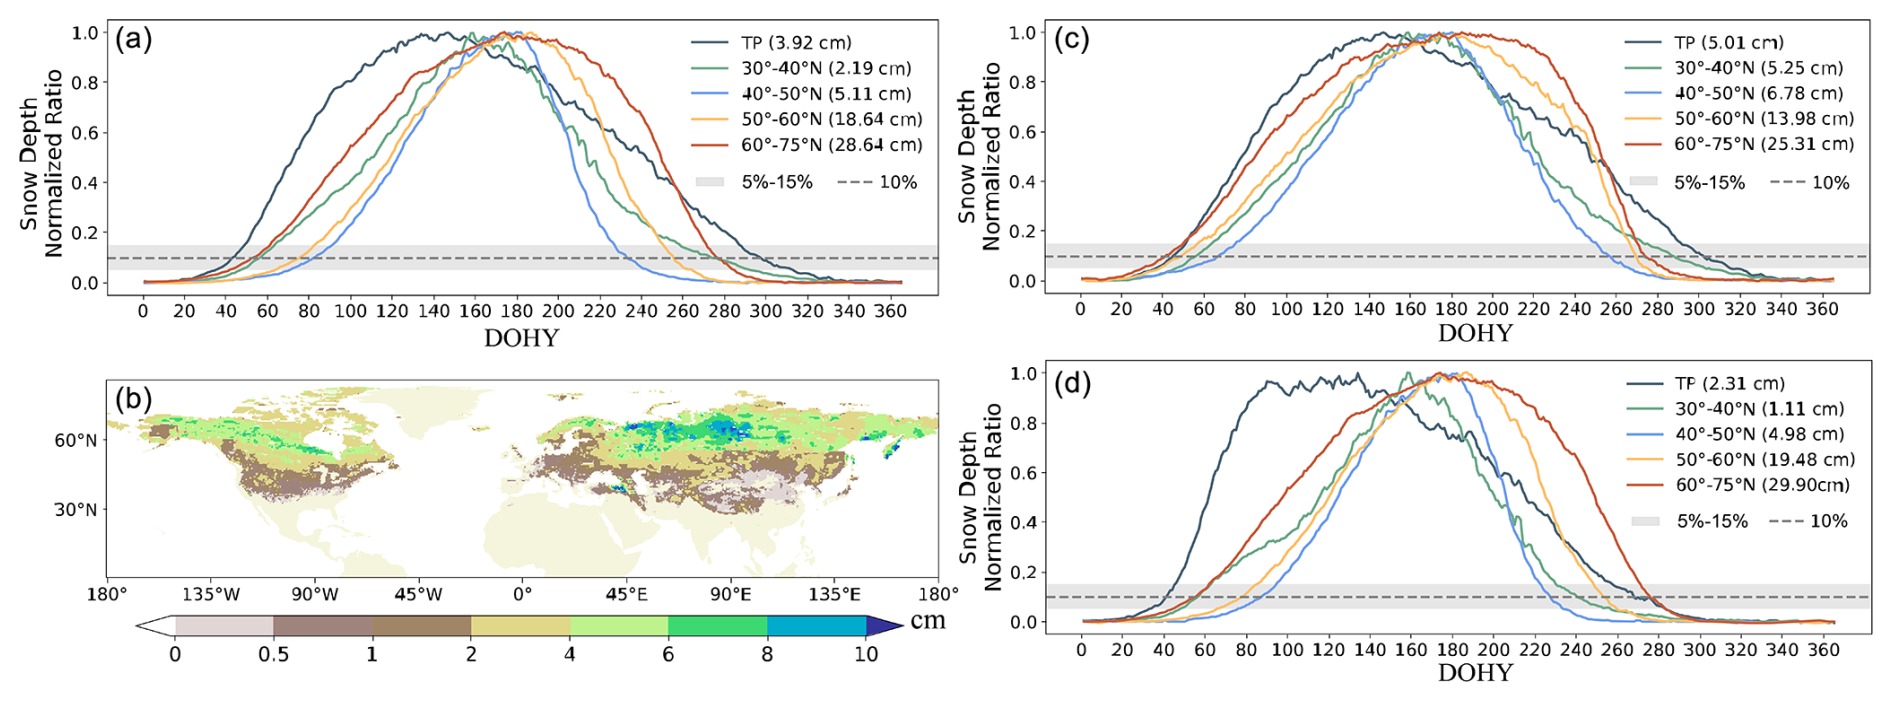
Figure 6Intra-annual variability in the normalized SD for five latitudinal zones in (a) the whole Northern Hemisphere, (c) the Northern Hemisphere mountain ranges, and (d) the Northern Hemisphere non-mountain ranges. Shading represents the interval of 5 %–15 %, and the dashed line represents the dynamic threshold of 10 %. Actual maximum snow depths for each latitude band are in parentheses. The unit DOHY is an abbreviation for day of the hydrological year, defined as 1 September through 31 August of the following year. (b) Spatial distribution of multi-year average snow depth thresholds in the Northern Hemisphere extracted using the snow dynamic-threshold method.
The SD curves exhibit a similar single-peak pattern across latitudes, with the curves at high latitudes (60–75° N) displaying the widest shape, gradually narrowing towards lower latitudes. This trend is consistent with the gradual reduction in SCD with decreasing latitude. An exception is observed in the SD curve of the TP, which shows a broad shape similar to that of high latitudes, even with a leftward shift in its position. This suggests that the TP has a longer SCD and earlier SCOD than expected despite being located at low to middle latitudes. The SD peak also increases with latitude. North of 60° N, the SD peak reaches 28.64 cm, while south of 40° N, it is only 2.19 cm. In the TP region, the peak snow depth is 3.92 cm, occurring approximately 1 month earlier compared to in other latitudinal zones. The timing of snow peaks plays a crucial role in influencing the dynamics of snow accumulation and melting processes.
Employing the 10 % dynamic-threshold method, we extract SD thresholds for 30 years in the NH and then average (Fig. 6b). The cutoff for the traditional 2 cm threshold falls within the middle latitudes between approximately 40 and 50° N. At low and middle latitudes, the thresholds tend to be less than 2 cm and even below 0.5 cm on half of the TP. In contrast, high-latitude SD thresholds exceed 2 cm. The majority of the extracted snow depth thresholds at high latitudes range from 4 to 6 cm. These findings indicate that employing a fixed SD threshold of 2 cm overestimates the snow phenology for high latitudes and underestimates it for regions at low and middle latitudes. Each grid in the Northern Hemisphere has varying SD thresholds annually, and the multi-year average SD threshold pattern closely resembles the spatial distribution of SD. This suggests that the method can dynamically adjust the threshold based on the annual and regional SD variations, thereby reducing the uncertainty in snow phenology extraction caused by large-scale climatic influences.
The temporal and spatial distributions of snow cover vary across different regions, leading to varying snow peak times. The time of snow peaks is crucial for the hydrological and ecological dynamics of climate systems and should be included as an indicator of snow phenology. Here, we propose a novel snow phenology index named the snow peak day (SPD). Next, we extract the SCD, SCOD, SCED, and SPD using the dynamic SD threshold during the hydrological years of 1989–2018. The spatial distributions of the snow phenology indicators are similar to those of the original method: with increasing latitude and elevation, SCD lengthens, SCOD advances, and SCED is delayed. Furthermore, SPD also exhibits distinct latitudinal and altitudinal characteristics, with SPD typically occurring in January at middle and low latitudes, in April at high latitudes, and even later in perennial snow regions. It is noteworthy that the SCD and SPD exhibit contrasting patterns in Europe and North Asia at around 60° N latitude. While Europe experiences a shorter SCD than North Asia does, the SPD occurs later, implying sustainable snow accumulation at the onset of the snow season. In contrast, North Asia displays a longer SCD but with less accumulated snow, resulting in reduced snow cover towards the later period and an earlier SPD. These findings emphasize the unique significance of each snow indicator, highlighting their complementary nature. Therefore, analyzing multiple snow phenology indicators can help to comprehensively understand the snow evolution process from multiple perspectives.
Here, we further compare the results extracted using the traditional fixed-threshold method and the new dynamic-threshold method. Overall, the SCD and SCOD are significantly different between the two methods, but SCED varies relatively little. This suggests that snowmelt is a rapid and transient process that is less sensitive to the choice of threshold. Besides, it can still be seen that 40–50° N is a dividing line (Fig. 7e), where there are no significant differences between the two methods. In areas north of 50° N, employing the dynamic-threshold method leads to a reduction in SCD and a retardation in SCOD compared with those of the traditional method, while the modification in SCED proves to be non-significant. Conversely, at low and middle latitudes below 40° N, SCD is extended, SCOD is advanced, and SCED is delayed. Thus, the reduced SD threshold induces a longer snow phenology at low and middle latitudes. Noteworthily, the TP shows the most marked divergence among the five regions, with SCD increasing by 28 d, SCOD advancing by 12 d, and SCED being delayed by 15 d. The application of snow dynamic thresholds yields the most substantial difference for the TP in comparison to fixed thresholds.
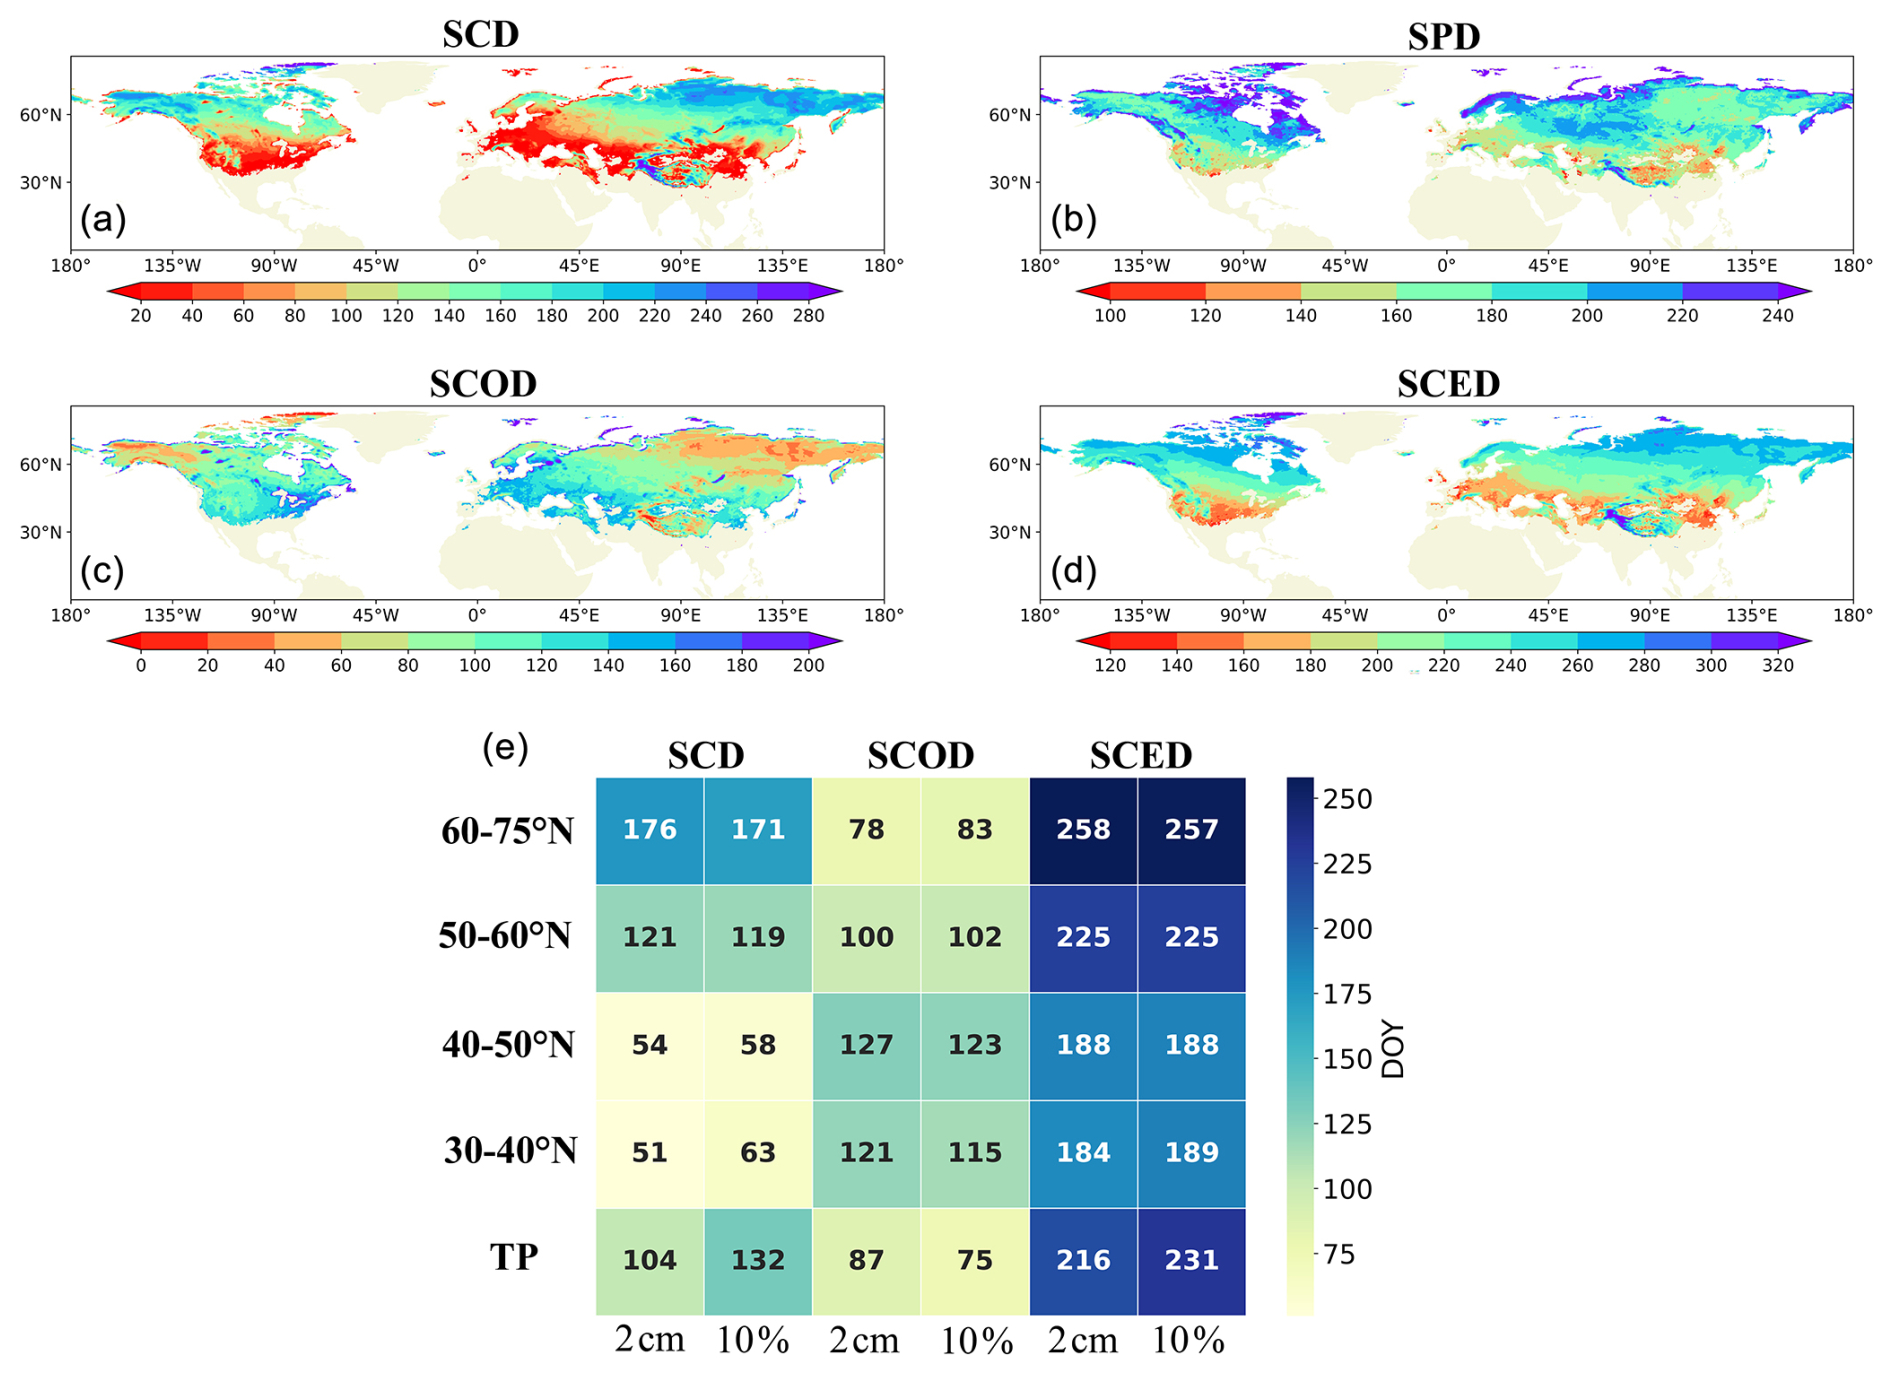
Figure 7Spatial distributions of (a) snow cover duration (SCD), (b) snow peak day (SPD), (c) snow cover onset day (SCOD), and (d) snow cover end day (SCED) in the Northern Hemisphere, extracted using the dynamic-threshold method. The unit DOHY is an abbreviation for day of the hydrological year, defined as 1 September through 31 August of the following year. (e) Hotspot map of comparison of snow phenology extracted by the snow dynamic-threshold method and the traditional fixed-threshold method in five latitudinal zones.
We further investigate the spatial distribution and temporal variations of the snow season (Fig. 8). The interval between SCOD and SPD is classified as the snow accumulation period, while the duration from SPD to SCED is the snow-melting period. Across the NH, the average length of the snow accumulation period significantly exceeds that of the melting period, with mean durations of 88 and 43 d, respectively. Notably, both the snow accumulation and melting periods are longer with increasing latitude and altitude. Over the last 3 decades, the NH's SPD has advanced by −0.0439 d yr−1, indicating an advancement in the SPD over time. Employing the snow dynamic-threshold method, we observe an increase in the trend of the SCOD from −0.1304 to −0.1212 d yr−1, while the trend of the SCED increases from −0.1284 to −0.1265 d yr−1. These changes suggest a lengthening of the snow accumulation period and a shortening of the melting period as time progresses. However, the magnitude of the extended accumulation period has diminished, and the reduction in the magnitude of the melting period is also notable.
Given the limitations of MOD10C2 data, such as their susceptibility to polar-night effects and fluctuations, we select SD as the primary driving data for this study. However, to demonstrate the robustness of the dynamic-threshold method, we also apply MOD10C2 data for dynamic snow phenology extraction (see Figs. S1–5 in Supplement). Our results indicate that, for MOD10C2 data, a dynamic threshold of 15 % is more appropriate. After applying the dynamic-threshold method, the snow phenology results closely align with those obtained from SD, exhibiting longer SCD, earlier SCOD, and later SCED in mid- and low-latitude regions. The most pronounced discrepancies are observed over the TP. However, since snow cover data are influenced by the polar night at high latitudes, direct comparisons cannot be made at these latitudes.
In summary, the inter-annual variability and heterogeneity in the spatial distribution of snow highlight the limitations of using fixed thresholds at different times and in different regions. Therefore, it is unreasonable to use a uniform SD threshold of 2 cm as a criterion for assessing snow phenology across the entire NH. Through the implementation of a snow dynamic-threshold method, the snow phenology of individual pixels can be evaluated in relation to their unique seasonal fluctuations, allowing for a more accurate representation of the actual snow phenology. In addition, the snow phenology dynamic-threshold method is more reasonable in areas with complex topographic and climatic features, such as the TP.
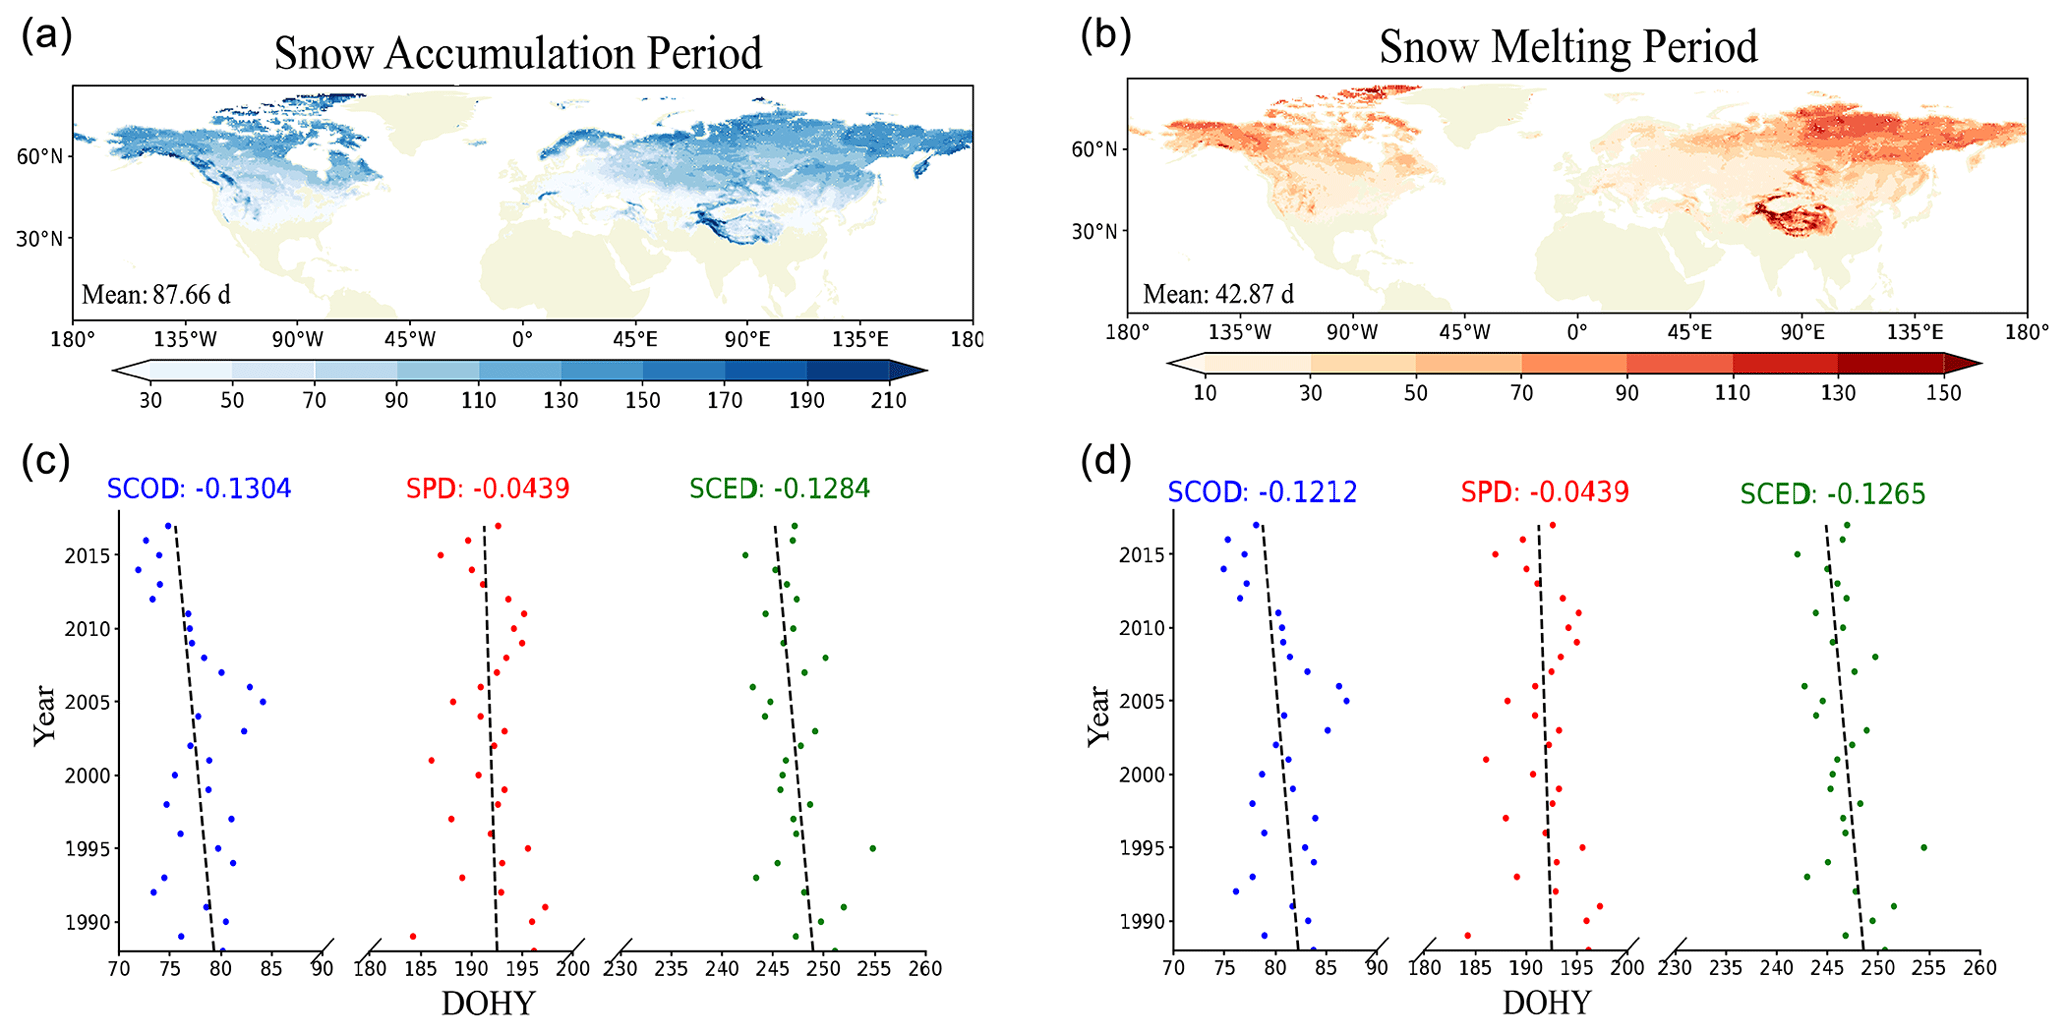
Figure 8Spatial distribution of snow depth during the (a) snow accumulation period and (b) snow-melting period in the Northern Hemisphere, extracted using the snow dynamic-threshold method. Scatterplots of SCOD, SPD, and SCED, extracted using (c) the traditional 2 cm fixed-threshold method and (d) the snow dynamic-threshold method in the Northern Hemisphere. The blue dots represent SCOD, the red dots represent SPD, and the green dots represent SCED. The numbers are the slopes of the linearly fitting lines. The unit DOHY is an abbreviation for day of the hydrological year, defined as 1 September through 31 August of the following year.
3.3 Characteristics of TP snow phenology
In the previous sections, we elucidate that the TP exhibits the most substantial alterations in snow phenology after using the novel method. Consequently, this region is the focus of our attention in the following analysis.
Shallow and unstable snow covers the central TP with a short SCD of rarely more than 1 month. Conversely, the SCD of perennial snow cover in the mountainous areas of the western TP can exceed 10 months. Meanwhile, SCD can reach approximately 200 d in the southeastern TP due to sufficient water vapor, with SCOD typically occurring in October and SCED occurring in May. Figure 9 demonstrates that the dynamic-threshold approach induces extended SCD, advanced SCOD, and delayed SCED. The largest difference in the snow phenology is concentrated in the southwestern and east-central TP, with disparities of up to 165 d in SCD, 126 d in SCOD, and 113 d in SCED. Furthermore, there are consistent trends in terms of SCD and SCED across the TP, while SCOD shows a certain variability. There is an advanced SCOD in the majority of the TP, particularly in high-altitude areas, while a slight delay in SCOD is observed in the central TP.
Our analysis indicates that the spatial distribution of snow phenology on the TP and the differences between the two methods are closely related to the topography. The TP has a diverse topography, with an SDtopo below 200 m in the central region and over 200 m and even over 800 m in the mountainous areas of the northwestern and southeastern TP (Fig. 9e). The complex topography causes spatially heterogeneous land surface characteristics and snow conditions (Helbig et al., 2015). Obviously, the SD on the TP clearly shows a spatial pattern that is consistent with that of the SDtopo. SD exceeds 10 cm in the northwestern and southeastern TP, whereas it is less than 2 cm in the central region. Therefore, we divide snow on the TP into two categories based on the SDtopo: mountain snow areas and non-mountain snow areas. Areas where SDtopo exceeds 200 m are classified as mountain areas, while those with SDtopo values below 200 m are considered to be non-mountain areas.
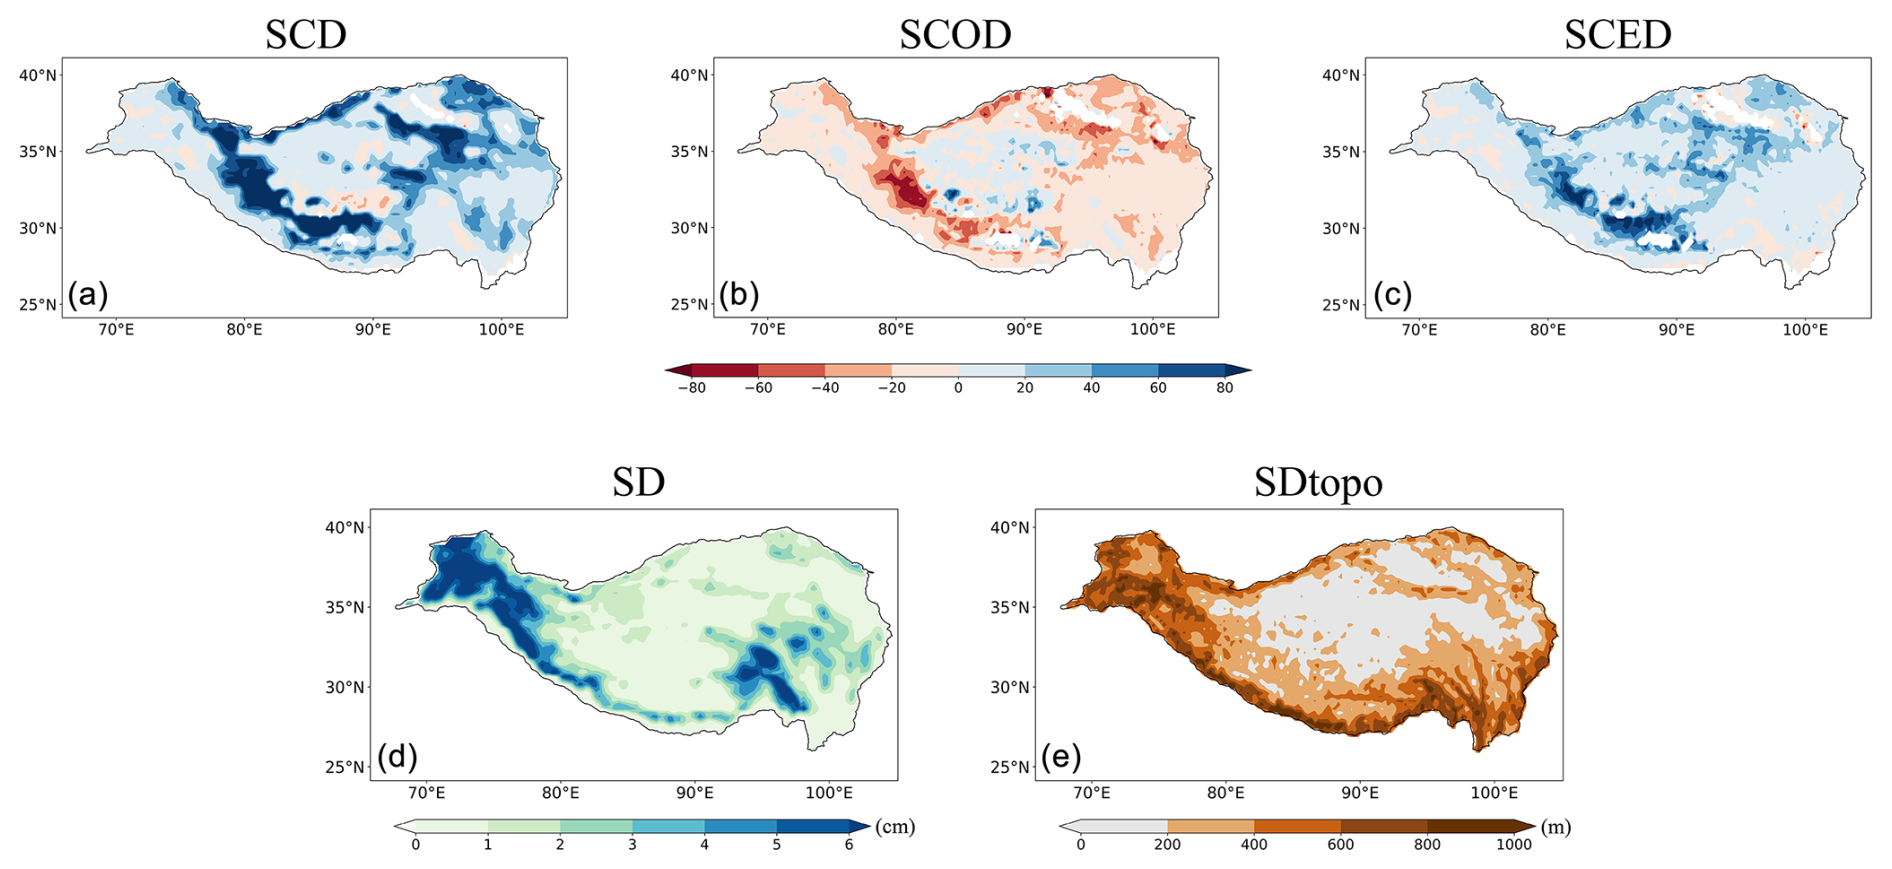
Figure 9Spatial distribution of differences in (a) snow cover duration (SCD), (b) snow cover onset day (SCOD), and (c) snow cover end day (SCED), extracted by means of the snow dynamic-threshold method and the traditional fixed-threshold method on the Tibetan Plateau. Unit is DOHY (day of the hydrological year). Spatial distribution of (d) multi-year mean snow depth (SD) and (e) standard deviation of topography (SDtopo) on the Tibetan Plateau (TP).
The snow phenology characteristics differ significantly between mountain and non-mountain areas of the TP (Fig. 10). Specifically, the SCD in mountain areas amounts to 152 d, whereas it is significantly shorter in non-mountain areas (90 d). The SCD's variation is also evident across different snow phenology indicators. The SCOD occurs earlier in mountain areas, and the SPD and SCED occur later. This discrepancy is attributed to the higher altitudes and lower temperatures observed in mountain regions, leading to more snow and then delayed snow peaks and SCED. In contrast to the NH overall, the difference in SCED between the TP mountains and non-mountainous areas is more significant than that of SCOD, which plays a greater role in shaping the SCD differences. The discrepancy in SCOD between these two areas is 14 d, whereas the discrepancy in SCED extends to 35 d.
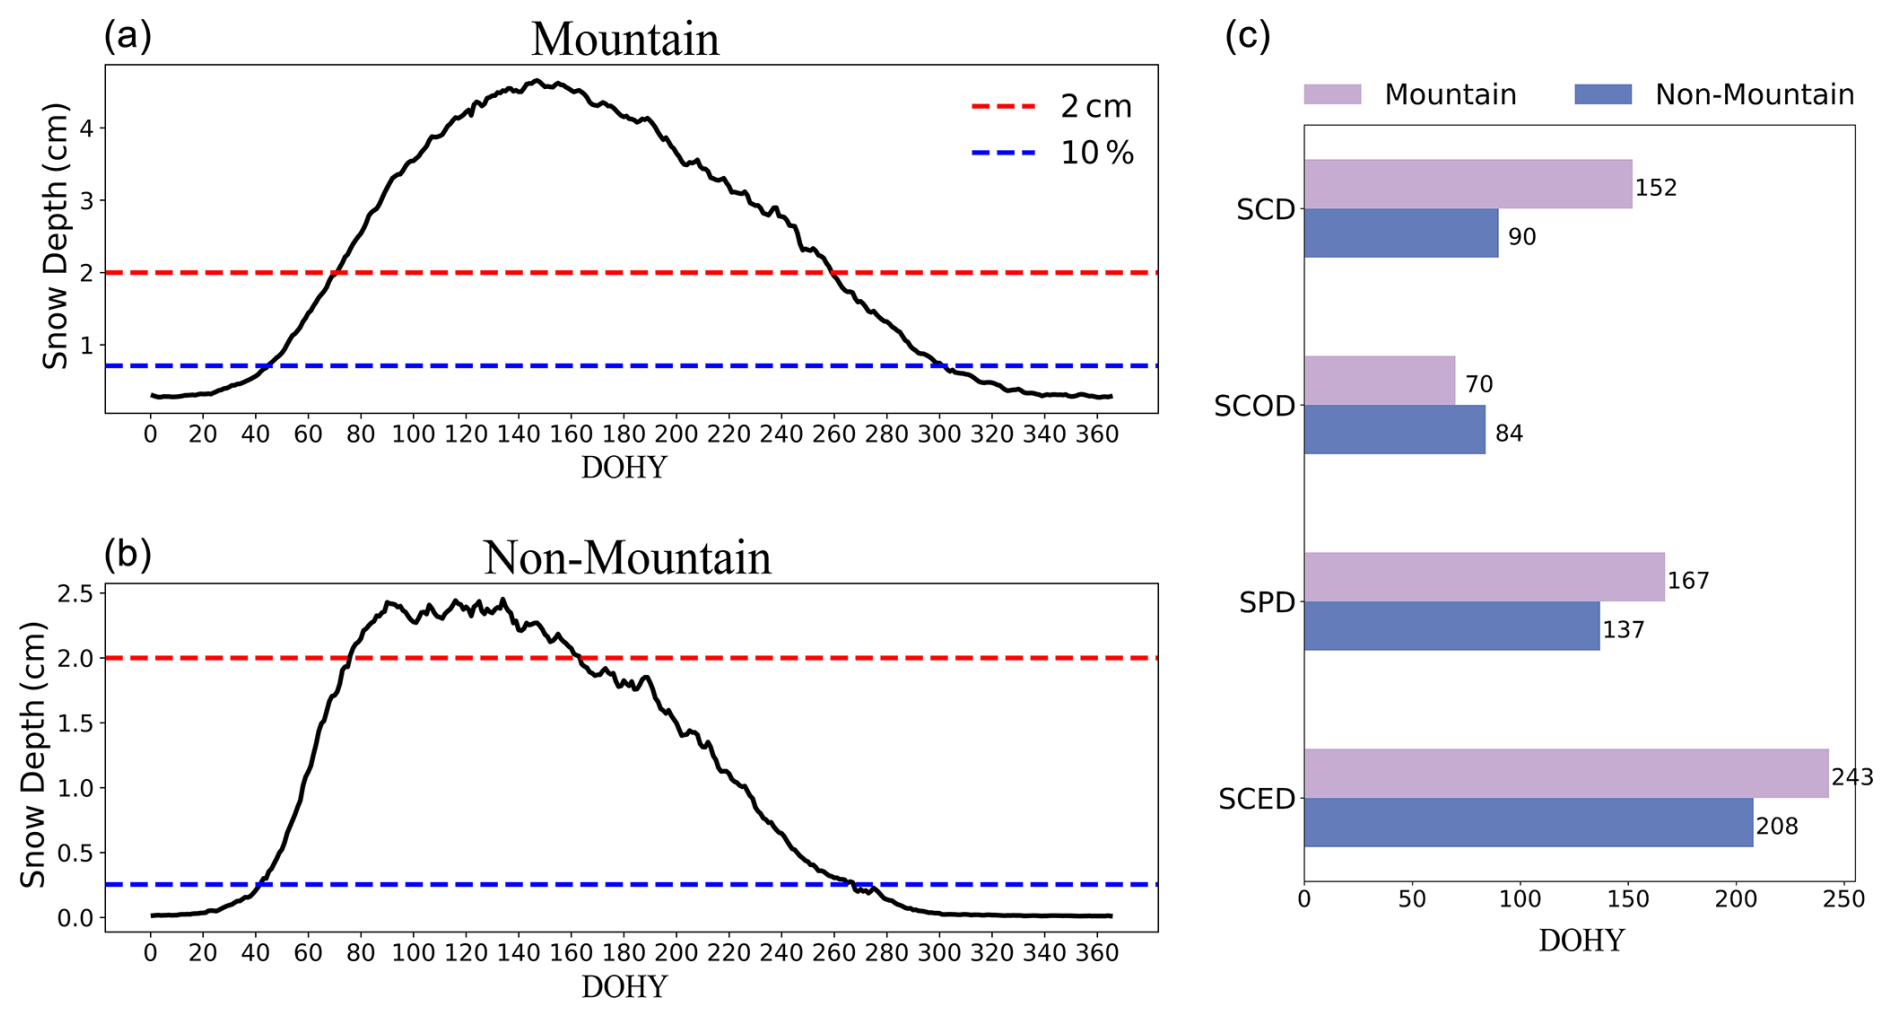
Figure 10Intra-annual variation of snow depth in (a) mountain, and (b) non-mountain areas on the Tibetan Plateau (TP). The dashed red line represents the location of the fixed threshold of 2 cm, and the blue line represents the location of the threshold extracted using the snow dynamic-threshold method. (c) Histogram of snow phenology in non-mountain and mountain regions of the TP using the dynamic-threshold method. The unit DOHY is an abbreviation for day of the hydrological year, defined as 1 September through 31 August of the following year.
In mountain areas, the annual average maximum SD reaches 4.653 cm. Employing the snow dynamic-threshold method led to a reduction from the original 2 cm threshold to 0.712 cm, which is more consistent with the position of the turn change in the curve slope. Conversely, snow in non-mountain areas remains shallow and unstable, with an annual average maximum SD below 2.5 cm. After using the dynamic-threshold method, the threshold is adjusted to 0.254 cm. The original 2 cm threshold nearly reaches the snow peak, indicating a great underestimation of snow phenology. However, a 0.3 cm threshold may be excessively low and too easy to reach, potentially losing its phenological significance. For areas with shallow snow, the snow cover fraction (SCF) may capture more accurate snow phenology information than the SD. This is because the SD at individual grid points within sparse snow cover fails to accumulate cumulatively, whereas the SCF effectively captures the transition from less to greater snow cover. Therefore, the use of the SCF dataset may be more helpful in extracting accurate snow phenology information when analyzing shallow and unstable snow areas.
The distribution of TP snow cover shows significant spatial heterogeneity due to the complex topography. Consequently, snow phenology is also profoundly influenced by topographic factors. Specifically, with an increasing SDtopo, the SD becomes larger, SCD becomes longer, SCOD advances, and SPD and SCED are delayed, which leads to distinctive differences in terms of snow phenology between mountain and non-mountain areas. The snow dynamic-threshold method demonstrates substantial enhancements for snow phenology in mountain areas. However, the availability of this method for improving snow phenology assessments in non-mountain areas with shallow snow requires further investigation.
In this study, we explore the spatial distribution of snow phenology in the Northern Hemisphere (NH) using several sets of satellite remote sensing snow data and multiple methods. A new extraction method for snow phenology is proposed for the NH, and the differences in snow phenology using the traditional and new methods are compared to evaluate the new snow phenology method. The conclusions are described below.
Snow phenology extracted from the fixed-threshold method and different snow data (SD, MOD10C2, and IMS) exhibits approximately the same spatial distribution across the NH. As the latitude and altitude increase, SCD extends, SCOD advances, and SCED is delayed. However, notable discrepancies exist in the SCD and SCOD across the datasets, with peak variances reaching 53 and 49 d, respectively. In contrast, the SCED exhibits less variability, with a maximum difference of merely 34 d.
Considering the inter-annual variability of snow, as well as regional differences, in the NH, the dynamic method is more applicable to the extraction of snow phenology. The 10 % threshold coincides with the inflection point of the rapid change in the snow depth curve, which marks the entry into the snow season. The new method induces a shortening of SCD and a delay in SCOD at higher latitudes, while SCED exhibits minimal change. In contrast, at lower latitudes, the adjustments in these metrics are inversely related.
The snow phenology experiences the most substantial changes on the TP when the new method is used, with SCD increasing by 28 d, SCOD advancing by 12 d, and SCED delaying by 15 d. Due to complex topographic and climatic features, there are also large differences in snow between mountainous and non-mountainous areas on the TP. The mountainous areas have longer SCD, earlier SCOD and later SPD and SCED, with a substantial 62 d variation in SCD. Meanwhile, the dynamic-threshold method for snow phenology is well-suited for analyzing mountainous regions of the TP. However, its applicability to non-mountainous areas with shallow snow remains to be further investigated.
This study proposes an algorithm based on dynamic thresholds to recognize snow phenology, similarly to what has been done for vegetation phenology. The snow accumulation period corresponds to the start of season (SOS), and the melting period aligns with the end of season (EOS). Similarly to vegetation, the state of snow in the NH shows different trends (Armstrong and Brodzik, 2001; Brown and Robinson, 2011; Guo et al., 2021). Compared to the fixed-threshold method, the dynamic method improves accuracy by adjusting thresholds according to regional characteristics and temporal changes (Burgan and Hartford, 1993; White et al., 1997; White and Nemani, 2006). It selects inflection points, peaks, or specific percentiles of snow curves to be more flexible and universal. Therefore, the approach is particularly suitable for large-scale and multi-temporal studies of snow phenology and demonstrates significant advantages when dealing with complex environmental changes. By dynamically adjusting snow thresholds, each year's accumulation and melting periods are determined based on actual conditions, replacing the dependence on traditional seasonal divisions. This offers a new “reference system” for describing seasonal changes, similarly to the Twenty-Four Solar Terms in climate research (Qian et al., 2010, 2012), providing a novel perspective and method for understanding snow changes in the Northern Hemisphere under global warming.
Despite improvements in snow phenology extraction, variations in the data and in definitions of snow phenology and hydrological years lead to differences in terms of extracted snow phenological characteristics, which are further compounded by inherent data uncertainties (Xie et al., 2017; Ma et al., 2020; Guo et al., 2022). The fundamental principles underlying snow information acquisition vary across observation methods, impacting binary snow results (Hall and Riggs, 2007; Dietz et al., 2012; Zhang et al., 2024). Factors like the observational instrument's orbit and cloud cover can further affect the accuracy of snow datasets (Gao et al., 2010; Coll and Li, 2018). Second, the performance of snow data varies geographically. Since the accuracy of passive microwave detection increases with snow depth, the passive microwave remote sensing data are more effective for analyzing snow phenology in regions with consistent snow cover (Armstrong and Brodzik, 2001; Savoie et al., 2009). In areas with shallow snow and with wet snow, the accuracy of passive microwave remote sensing data is reduced, and the snow depth indicator may not accurately capture accumulation and melting processes. In addition, for the transient-snow area, the snow depth curve is more volatile, which makes the assumed single-peak structure untenable. After comprehensive consideration, the snow cover fraction may be a more reliable indicator in such cases. Therefore, we perform another extraction of dynamic snow phenology using the snow cover fraction data, and the results are similar to SD but with greater differences for the TP (see Figs. S1–5 in Supplement). Regardless of the threshold method, problems with the data itself increase the uncertainty of snow phenology analysis. Therefore, it is necessary to integrate ground observation data with different remote sensing data to form a more comprehensive and accurate snow phenology extraction system.
We propose a dynamic approach to defining snow phenology by adjusting the threshold for snow presence in this study. However, snow and vegetation differ in terms of their fundamental dynamics. Vegetation grows gradually, while snow can change rapidly over short periods. Therefore, there is a second key step in the extraction of snow phenology, which requires that the threshold be met for several consecutive days. This condition ensures that the detected event reflects a stable and meaningful snow presence and mitigates the influence of sporadic snowfall events. While we retain the traditional threshold of 5 consecutive days, this may not be suitable for all regions. In some areas, such as the central TP, shallow snow plays an important role, with its surface albedo having a strong influence on snow ablation (Wang et al., 2020). Moreover, snow there is highly discontinuous over time, with an annual average of 14 snow cover events and prolonged periods without snow cover (Li et al., 2022; Wang et al., 2024). It is difficult to achieve 5 consecutive snow days, leading to barriers to identifying the snow season. Future work will take the dynamic consecutive snow day threshold into account.
In conclusion, this study reveals significant differences in terms of snow phenology extracted from diverse snow data and methods and reveals that employing the fixed-threshold method cannot accurately capture the actual snow season. We therefore develop a novel physically based snow phenology extraction method based on a spatiotemporally dynamic threshold, enhancing the snow phenology extraction in the Northern Hemisphere, especially on the TP. The dynamic snow phenology accounts for the spatial heterogeneity of Northern Hemisphere snow cover and excludes the influence of the inter-annual variability of snow cover on snow phenology extraction, providing a novel perspective for identifying and understanding snow cover variations in the Northern Hemisphere.
The Interactive Multi-Sensor Snow and Ice Mapping System (IMS) is available through the National Snow and Ice Data Center at https://doi.org/10.7265/N52R3PMC (U.S. National Ice Center, 2008). The 8 d snow cover component product (MOD10C2) is available through the National Snow and Ice Data Center at https://doi.org/10.5067/MODIS/MOD10C2.006 (Hall and Riggs, 2016). The long-term series of daily global snow depth is available through National Tibetan Plateau Center/Third Pole Environment Data Center at https://doi.org/10.11888/Snow.tpdc.270925 (Che et al., 2019). The long-term series of daily snow depth datasets in China is available through National Tibetan Plateau Center/ Third Pole Environment Data Center at https://cstr.cn/18406.11.Geogra.tpdc.270194 (Che et al., 2015). The 0.008° elevation dataset for the TP can be found through National Tibetan Plateau Center/ Third Pole Environment Data Center at https://data.tpdc.ac.cn/en/data/ddf4108a-d940-47ad-b25c-03666275c83a (National, 2019).
The supplement related to this article is available online at https://doi.org/10.5194/tc-19-2733-2025-supplement.
LW and XM formulated the original ideas presented in this paper. LW led the data analysis and wrote the original manuscript draft. XM participated in the result interpretation, manuscript preparation, and improvement. XH and YL assisted in data analysis and writing. WG, BQ and JG participated in the discussion of the idea and the improvement of the writing. All of the authors contributed to the article and approved the submitted version.
The contact author has declared that none of the authors has any competing interests.
Publisher’s note: Copernicus Publications remains neutral with regard to jurisdictional claims made in the text, published maps, institutional affiliations, or any other geographical representation in this paper. While Copernicus Publications makes every effort to include appropriate place names, the final responsibility lies with the authors.
We thank Yvan Orsolini, David Robinson, Xiongxin Xiao and two anonymous referees for their helpful comments.
This study was jointly supported by the National Natural Science Foundation of China (grant nos. 42305033 and 42375115) and the Second Tibetan Plateau Scientific Expedition and Research Program (STEP) (grant no. 2019QZKK0103).
This paper was edited by Cécile Ménard and reviewed by Yvan Orsolini and two anonymous referees.
Armstrong, R. L. and Brodzik, M. J.: Recent northern hemisphere snow extent: A comparison of data derived from visible and microwave satellite sensors, Geophys. Res. Lett., 28, 3673–3676, https://doi.org/10.1029/2000GL012556, 2001.
Barnett, T. P., Adam, J. C., and Lettenmaier, D. P.: Potential impacts of a warming climate on water availability in snow-dominated regions, Nature, 438, 303–309, https://doi.org/10.1038/nature04141, 2005.
Blau, M. T., Kad, P., Turton, J. V., and Ha, K.-J.: Uneven global retreat of persistent mountain snow cover alongside mountain warming from ERA5-land, Npj Clim. Atmos. Sci., 7, 278, https://doi.org/10.1038/s41612-024-00829-5, 2024.
Bormann, K. J., Brown, R. D., Derksen, C., and Painter, T. H.: Estimating snow-cover trends from space, Nat. Clim. Change, 8, 924–928, https://doi.org/10.1038/s41558-018-0318-3, 2018.
Brown, R. D. and Mote, P. W.: The Response of Northern Hemisphere Snow Cover to a Changing Climate, J. Clim., 22, 2124–2145, https://doi.org/10.1175/2008JCLI2665.1, 2009.
Brown, R. D. and Robinson, D. A.: Northern Hemisphere spring snow cover variability and change over 1922–2010 including an assessment of uncertainty, The Cryosphere, 5, 219–229, https://doi.org/10.5194/tc-5-219-2011, 2011.
Brown, R., Derksen, C., and Wang, L.: Assessment of spring snow cover duration variability over northern Canada from satellite datasets, Remote Sens. Environ., 111, 367–381, https://doi.org/10.1016/j.rse.2006.09.035, 2007.
Brutel-Vuilmet, C., Ménégoz, M., and Krinner, G.: An analysis of present and future seasonal Northern Hemisphere land snow cover simulated by CMIP5 coupled climate models, The Cryosphere, 7, 67–80, https://doi.org/10.5194/tc-7-67-2013, 2013.
Burgan, R. E. and Hartford, R. A.: Monitoring vegetation greenness with satellite data (INT-GTR-297; p. INT-GTR-297), U.S. Department of Agriculture, Forest Service, Intermountain Research Station, https://doi.org/10.2737/INT-GTR-297, 1993.
Che, T., Li, X., Jin, R., Armstrong, R., and Zhang, T.: Snow depth derived from passive microwave remote-sensing data in China, Ann. Glaciol., 49, 145–154, https://doi.org/10.3189/172756408787814690, 2008.
Che, T., Dai, L., and Li, X.: Long-term series of daily snow depth dataset in China (1979–2024), National Tibetan Plateau/Third Pole Environment Data Center [data set], https://doi.org/10.11888/Geogra.tpdc.270194, 2015.
Che, T., Li, X., and Dai, L.: Long-term series of daily global snow depth (1979–2017), National Tibetan Plateau/Third Pole Environment Data Center [data set], https://doi.org/10.11888/Snow.tpdc.270925, 2019.
Chen, X., Liang, S., Cao, Y., He, T., and Wang, D.: Observed contrast changes in snow cover phenology in northern middle and high latitudes from 2001–2014, Sci. Rep., 5, 16820, https://doi.org/10.1038/srep16820, 2015.
Chen, Y., Li, W., Deng, H., Fang, G., and Li, Z.: Changes in Central Asia's water tower: past, present and future, Sci. Rep., 6, 35458, https://doi.org/10.1038/srep35458, 2016.
Choi, G., Robinson, D. A., and Kang, S.: Changing Northern Hemisphere Snow Seasons, J. Clim., 23, 5305–5310, https://doi.org/10.1175/2010JCLI3644.1, 2010.
Cohen, J. L., Furtado, J. C., Barlow, M. A., Alexeev, V. A., and Cherry, J. E.: Arctic warming, increasing snow cover and widespread boreal winter cooling, Environ. Res. Lett., 7, 014007, https://doi.org/10.1088/1748-9326/7/1/014007, 2012.
Coll, J. and Li, X.: Comprehensive accuracy assessment of MODIS daily snow cover products and gap filling methods, ISPRS J. Photogramm., 144, 435–452, https://doi.org/10.1016/j.isprsjprs.2018.08.004, 2018.
Déry, S. J. and Brown, R. D.: Recent Northern Hemisphere snow cover extent trends and implications for the snow-albedo feedback, Geophys. Res. Lett., 34, 2007GL031474, https://doi.org/10.1029/2007GL031474, 2017.
Dong, C.: Remote sensing, hydrological modeling and in situ observations in snow cover research: A review, J. Hydrol., 561, 573–583, https://doi.org/10.1016/j.jhydrol.2018.04.027, 2018.
Douville, H., Royer, J. F., and Mahfouf, J. F.: A new snow parameterization for the Meteo-France climate model, Part II: Validation in a 3-D GCM experiment, Clim. Dynam., 12, 37–52, https://doi.org/10.1007/BF00208761, 1995.
Dietz, A. J., Kuenzer, C., Gessner, U., and Dech, S. W.: Remote sensing of snow – a review of available methods, Int. J. Remote Sens., 33, 4094–4134, https://doi.org/10.1080/01431161.2011.640964, 2012.
Estilow, T. W., Young, A. H., and Robinson, D. A.: A long-term Northern Hemisphere snow cover extent data record for climate studies and monitoring, Earth Syst. Sci. Data, 7, 137–142, https://doi.org/10.5194/essd-7-137-2015, 2015.
Frei, A., Tedesco, M., Lee, S., Foster, J., Hall, D. K., Kelly, R., and Robinson, D. A.: A review of global satellite-derived snow products, Adv. Space Res., 50, 1007–1029, https://doi.org/10.1016/j.asr.2011.12.021, 2012.
Furtado, J. C., Cohen, J. L., Butler, A. H., Riddle, E. E., and Kumar, A.: Eurasian snow cover variability and links to winter climate in the CMIP5 models, Clim. Dynam., 45, 2591–2605, https://doi.org/10.1007/s00382-015-2494-4, 2015.
Gao, Y., Xie, H., Lu, N., Yao, T., and Liang, T.: Toward advanced daily cloud-free snow cover and snow water equivalent products from Terra–Aqua MODIS and Aqua AMSR-E measurements, J. Hydrol., 385, 23–35, https://doi.org/10.1016/j.jhydrol.2010.01.022, 2010.
Gao, Y., Xie, H., and Yao, T.: Developing Snow Cover Parameters Maps from MODIS, AMSR-E, and Blended Snow Products, Photogramm. Eng. Rem. S., 77, 351–361, https://doi.org/10.14358/PERS.77.4.351, 2011.
Gao, Y., Hao, X., He, D., Huang, G., Wang, J., Zhao, H., Wwi, Y., Shao, D., and Wang, W.: Snow cover mapping algorithm in the Tibetan Plateau based on NDSI threshold optimization of different land cover types. Journal of Glaciology and Geocryology, 41, 1162–1172, https://doi.org/10.7522/j.issn.1000-0240.2019.1155, 2019.
Gouttevin, I., Menegoz, M., Dominé, F., Krinner, G., Koven, C., Ciais, P., Tarnocai, C., and Boike, J.: How the insulating properties of snow affect soil carbon distribution in the continental pan-Arctic area, J. Geophys. Res.-Biogeo., 117, 2011JG001916, https://doi.org/10.1029/2011JG001916, 2012.
Guo, H., Yang, Y., Zhang, W., Zhang, C., and Sun, H.: Attributing snow cover extent changes over the Northern Hemisphere for the past 65 years, Environ. Res. Commun., 3, 061001, https://doi.org/10.1088/2515-7620/ac03c8, 2021.
Guo, H., Wang, X., Guo, Z., Zhu, G., Che, T., Wang, J., Huang, X., Han, C., and Ouyang, Z.: Review of snow phenology variation in the Northern Hemisphere and its relationship with climate and vegetation, The Cryosphere Discuss. [preprint], https://doi.org/10.5194/tc-2022-229, 2022.
Hall, D. K. and Riggs, G. A.: Accuracy assessment of the MODIS snow products, Hydrol. Process., 21, 1534–1547, https://doi.org/10.1002/hyp.6715, 2007.
Hall, D. K. and Riggs, G. A.: MODIS/Terra Snow Cover 8-Day L3 Global 0.05Deg CMG, Boulder, Colorado USA, NASA National Snow and Ice Data Center Distributed Active Archive Center [data set], https://doi.org/10.5067/MODIS/MOD10C2.006, 2016.
Harpold, A. A. and Brooks, P. D.: Humidity determines snowpack ablation under a warming climate, P. Natl. Acad. Sci. USA, 115, 1215–1220, https://doi.org/10.1073/pnas.1716789115, 2018.
Helbig, N., Van Herwijnen, A., Magnusson, J., and Jonas, T.: Fractional snow-covered area parameterization over complex topography, Hydrol. Earth Syst. Sci., 19, 1339–1351, https://doi.org/10.5194/hess-19-1339-2015, 2015.
Helfrich, S. R., McNamara, D., Ramsay, B. H., Baldwin, T., and Kasheta, T.: Enhancements to, and forthcoming developments in the Interactive Multisensor Snow and Ice Mapping System (IMS), Hydrol. Process., 21, 1576–1586, https://doi.org/10.1002/hyp.6720, 2007.
Henderson, G. R., Peings, Y., Furtado, J. C., and Kushner, P. J.: Snow–atmosphere coupling in the Northern Hemisphere, Nat. Clim. Change, 8, 954–963, https://doi.org/10.1038/s41558-018-0295-6, 2018.
Hori, M., Sugiura, K., Kobayashi, K., Aoki, T., Tanikawa, T., Kuchiki, K., Niwano, M., and Enomoto, H.: A 38-year (1978–2015) Northern Hemisphere daily snow cover extent product derived using consistent objective criteria from satellite-borne optical sensors, Remote Sens. Environ., 191, 402–418, https://doi.org/10.1016/j.rse.2017.01.023, 2017.
Immerzeel, W. W., Van Beek, L. P. H., and Bierkens, M. F. P.: Climate Change Will Affect the Asian Water Towers, Science, 328, 1382–1385, https://doi.org/10.1126/science.1183188, 2010.
Kang, S., Xu, Y., You, Q., Flügel, W.-A., Pepin, N., and Yao, T.: Review of climate and cryospheric change in the Tibetan Plateau, Environ. Res. Lett., 5, 015101, https://doi.org/10.1088/1748-9326/5/1/015101, 2010.
Ke, C.-Q., Li, X.-C., Xie, H., Ma, D.-H., Liu, X., and Kou, C.: Variability in snow cover phenology in China from 1952 to 2010, Hydrol. Earth Syst. Sci., 20, 755–770, https://doi.org/10.5194/hess-20-755-2016, 2016.
Knowles, J. F., Lestak, L. R., and Molotch, N. P.: On the use of a snow aridity index to predict remotely sensed forest productivity in the presence of bark beetle disturbance, Water Resour. Res., 53, 4891–4906, https://doi.org/10.1002/2016WR019887, 2017.
Li, H., Zhong, X., Zheng, L., Hao, X., Wang, J., and Zhang, J.: Classification of Snow Cover Persistence across China, Water, 14, 933, https://doi.org/10.3390/w14060933, 2022.
Lin, Y. and Jiang, M.: Maximum temperature drove snow cover expansion from the Arctic, 2000–2008, Sci. Rep., 7, 15090, https://doi.org/10.1038/s41598-017-15397-3, 2017.
Liu, H., Xiao, P., Zhang, X., Chen, S., Wang, Y., and Wang, W.: Winter snow cover influences growing-season vegetation productivity non-uniformly in the Northern Hemisphere, Commun. Earth Environ., 4, 487, https://doi.org/10.1038/s43247-023-01167-9, 2023.
Liston, G. E.: Interrelationships among Snow Distribution, Snowmelt, and Snow Cover Depletion: Implications for Atmospheric, Hydrologic, and Ecologic Modeling, J. Appl. Meteorol., 38, 1474–1487, https://doi.org/10.1175/1520-0450(1999)038<1474:IASDSA>2.0.CO;2, 1999.
Liston, G. E. and Hiemstra, C. A.: The Changing Cryosphere: Pan-Arctic Snow Trends (1979–2009), J. Clim., 24, 5691–5712, https://doi.org/10.1175/JCLI-D-11-00081.1, 2011.
Ma, N., Yu, K., Zhang, Y., Zhai, J., Zhang, Y., and Zhang, H.: Ground observed climatology and trend in snow cover phenology across China with consideration of snow-free breaks, Clim. Dynam., 55, 2867–2887, https://doi.org/10.1007/s00382-020-05422-z, 2020.
Marks, D., Dozier, J., and Davis, R. E.: Climate and energy exchange at the snow surface in the Alpine Region of the Sierra Nevada: 1. Meteorological measurements and monitoring, Water Resour. Res., 28, 3029–3042, https://doi.org/10.1029/92WR01482, 1992.
Miao, X., Guo, W., Qiu, B., Lu, S., Zhang, Y., Xue, Y., and Sun, S.: Accounting for Topographic Effects on Snow Cover Fraction and Surface Albedo Simulations Over the Tibetan Plateau in Winter, J. Adv. Model. Earth Sy., 14, e2022MS003035, https://doi.org/10.1029/2022MS003035, 2022.
Mo, J., Zhu, W., Wang, L., Xu, Y., and Liu J.: Evaluation of remote sensing extraction methods for vegetation phenology based on flux tower net ecosystem carbon exchange data, Chinese J. Appl. Ecol., 23, 319–327, https://doi.org/10.13287/j.1001-9332.2012.0072, 2012.
Musselman, K. N., Addor, N., Vano, J. A. and Molotch, N. P.: Winter melt trends portend widespread declines in snow water resources, Nat. Clim. Change, 11, 418–424, https://doi.org/10.1038/s41558-021-01014-9, 2021.
National, A.: Elevation dataset of the Third pole (2013), National Tibetan Plateau/Third Pole Environment Data Center [data set], https://data.tpdc.ac.cn/en/data/ddf4108a-d940-47ad-b25c-03666275c83a, 2019.
Nijssen, B., O'Donnell, G. M., Hamlet, A. F., and Lettenmaier, D. P.: Hydrologic sensitivity of global rivers to climate change, Climatic Change, 50, 143–175, https://doi.org/10.1023/A:1010616428763, 2001.
Notarnicola, C.: Hotspots of snow cover changes in global mountain regions over 2000–2018, Remote Sens. Environ., 243, 111781, https://doi.org/10.1016/j.rse.2020.111781, 2020a.
Notarnicola, C.: Overall negative trends for snow cover extent and duration in global mountain regions over 1982–2020, Sci. Rep., 12, 13731, https://doi.org/10.1038/s41598-022-16743-w, 2020b.
Orsolini, Y., Wegmann, M., Dutra, E., Liu, B., Balsamo, G., Yang, K., De Rosnay, P., Zhu, C., Wang, W., Senan, R., and Arduini, G.: Evaluation of snow depth and snow cover over the Tibetan Plateau in global reanalyses using in situ and satellite remote sensing observations, The Cryosphere, 13, 2221–2239, https://doi.org/10.5194/tc-13-2221-2019, 2019.
Peng, S., Piao, S., Ciais, P., Friedlingstein, P., Zhou, L., and Wang, T.: Change in snow phenology and its potential feedback to temperature in the Northern Hemisphere over the last three decades, Environ. Res. Lett., 8, 014008, https://doi.org/10.1088/1748-9326/8/1/014008, 2013.
Qian, C., Wu, Z., Fu, C., and Zhou, T.: On multi-timescale variability of temperature in China in modulated annual cycle reference frame, Adv. Atmos. Sci., 27, 1169–1182, https://doi.org/10.1007/s00376-009-9121-4, 2010.
Qian, C., Yan, Z., and Fu, C.: Climatic changes in the Twenty-four Solar Terms during 1960–2008, Chinese Sci. Bull., 57, 276–286, https://doi.org/10.1007/s11434-011-4724-4, 2012.
Riggs, G. A., Hall, D. K., and Román, M. O.: Overview of NASA's MODIS and Visible Infrared Imaging Radiometer Suite (VIIRS) snow-cover Earth System Data Records, Earth Syst. Sci. Data, 9, 765–777, https://doi.org/10.5194/essd-9-765-2017, 2017.
Riggs, G. A., Hall, D. K., and Román, M. O.: MODIS Snow Products Collection 6.1 User Guide (Version 1.0), NASA, https://doi.org/10.5067/MODIS/MOD10C2.006, 2019.
Savoie, M. H., Armstrong, R. L., Brodzik, M. J., and Wang, J. R.: Atmospheric corrections for improved satellite passive microwave snow cover retrievals over the Tibet Plateau, Remote Sens. Environ., 113, 2661–2669, https://doi.org/10.1016/j.rse.2009.08.006, 2009.
Sturm, M., Goldstein, M. A., and Parr, C.: Water and life from snow: A trillion dollar science question, Water Resour. Res., 53, 3534–3544, https://doi.org/10.1002/2017WR020840, 2017.
Sun, H., Chen, Y., Xiong, J., Ye, C., Yong, Z., Wang, Y., He, D., and Xu, S.: Relationships between climate change, phenology, edaphic factors, and net primary productivity across the Tibetan Plateau, Int. J. Appl. Earth Observ. Geoinform., 107, 102708, https://doi.org/10.1016/j.jag.2022.102708, 2022.
Swenson, S. C. and Lawrence, D. M.: A new fractional snow-covered area parameterization for the Community Land Model and its effect on the surface energy balance: CLM SNOW COVER FRACTION, J. Geophys. Res.-Atmos., 117, D21107, https://doi.org/10.1029/2012JD018178, 2012.
Tang, Z., Deng, G., Hu, G., Zhang, H., Pan, H., and Sang, G.: Satellite observed spatiotemporal variability of snow cover and snow phenology over high mountain Asia from 2002 to 2021, J. Hydrol., 613, 128438, https://doi.org/10.1016/j.jhydrol.2022.128438, 2022.
U.S. National Ice Center.: IMS Daily Northern Hemisphere Snow and Ice Analysis at 1 km, 4 km, and 24 km Resolutions, Boulder, Colorado USA, National Snow and Ice Data Center [data set], https://doi.org/10.7265/N52R3PMC, 2008.
Wang, J., Tang, L., and Lu, H.: The new indices to describe temporal discontinuity of snow cover on the Qinghai-Tibet Plateau, Npj Clim. Atmos. Sci., 7, 189, https://doi.org/10.1038/s41612-024-00733-y, 2024.
Wang, L., Derksen, C., Brown, R., and Markus, T.: Recent changes in pan-Arctic melt onset from satellite passive microwave measurements, Geophys. Res. Lett., 40, 522–528, https://doi.org/10.1002/grl.50098, 2013.
Wang, S., Yang, B., Yang, Q., Lu, L., Wang, X., and Peng, Y.: Temporal Trends and Spatial Variability of Vegetation Phenology over the Northern Hemisphere during 1982–2012, PLOS ONE, 11, e0157134, https://doi.org/10.1371/journal.pone.0157134, 2016.
Wang, W., Yang, K., Zhao, L., Zheng, Z., Lu, H., Mamtimin, A., Ding, B., Li, X., Zhao, L., Li, H., Che, T., and Moore, J. C.: Characterizing Surface Albedo of Shallow Fresh Snow and Its Importance for Snow Ablation on the Interior of the Tibetan Plateau, J. Hydrometeorol., 21, 815–827, https://doi.org/10.1175/JHM-D-19-0193.1, 2020.
Whetton, P. H., Haylock, M. R., and Galloway, R.: Climate change and snow-cover duration in the Australian Alps, Climatic Change, 32, 447–479, https://doi.org/10.1007/BF00140356, 1996.
White, M. A. and Nemani, R. R.: Real-time monitoring and short-term forecasting of land surface phenology, Remote Sens. Environ., 104, 43–49, https://doi.org/10.1016/j.rse.2006.04.014, 2006.
White, M. A., Thornton, P. E., and Running, S. W.: A continental phenology model for monitoring vegetation responses to interannual climatic variability, Global Biogeochem. Cy., 11, 217–234, https://doi.org/10.1029/97GB00330, 1997.
White, K., Pontius, J., and Schaberg, P.: Remote sensing of spring phenology in northeastern forests: A comparison of methods, field metrics and sources of uncertainty, Remote Sens. Environ., 148, 97–107, https://doi.org/10.1016/j.rse.2014.03.017, 2014.
Wipf, S. and Rixen, C.: A review of snow manipulation experiments in Arctic and alpine tundra ecosystems, Polar Res., 29, 95–109, https://doi.org/10.3402/polar.v29i1.6054, 2010.
Xiao, X., He, T., Liang, S., Liang, S., Liu, X., Ma, Y., and Wan, J.: Towards a gapless 1 km fractional snow cover via a data fusion framework, ISPRS J. Photogramm. Remote Sens., 215, 419–441, https://doi.org/10.1016/j.isprsjprs.2024.07.018, 2024.
Xiao, X., Zhang, T., Zhong, X., and Li, X.: Spatiotemporal Variation of Snow Depth in the Northern Hemisphere from 1992 to 2016, Remote Sens., 12, 2728, https://doi.org/10.3390/rs12172728, 2020.
Xie, J., Kneubühler, M., Garonna, I., Notarnicola, C., De Gregorio, L., De Jong, R., Chimani, B., and Schaepman, M. E.: Altitude-dependent influence of snow cover on alpine land surface phenology, J. Geophys. Res.-Biogeo., 122, 1107–1122, https://doi.org/10.1002/2016JG003728, 2017.
Xu, J., Tang, Y., Dong, L., Wang, S., Yu, B., Wu, J., Zheng, Z., and Huang, Y: Temperature-dominated spatiotemporal variability in snow phenology on the Tibetan Plateau from 2002 to 2022, The Cryosphere, 18, 1817–1834, https://doi.org/10.5194/tc-18-1817-2024, 2024.
Yang, T., Li, Q., Ahmad, S., Zhou, H., and Li, L.: Changes in Snow Phenology from 1979 to 2016 over the Tianshan Mountains, Central Asia, Remote Sens., 11, 499, https://doi.org/10.3390/rs11050499, 2019.
You, Q., Wu, T., Shen, L., Pepin, N., Zhang, L., Jiang, Z., Wu, Z., Kang, S., and AghaKouchak, A.: Review of snow cover variation over the Tibetan Plateau and its influence on the broad climate system, Earth-Sci. Rev., 201, 103043, https://doi.org/10.1016/j.earscirev.2019.103043, 2020.
Yu, H., Luedeling, E., and Xu, J.: Winter and spring warming result in delayed spring phenology on the Tibetan Plateau, P. Natl. Acad. Sci. USA, 107, 22151–22156, https://doi.org/10.1073/pnas.1012490107, 2010.
Yue, S., Che, T., Dai, L., Xiao, L., and Deng, J.: Characteristics of Snow Depth and Snow Phenology in the High Latitudes and High Altitudes of the Northern Hemisphere from 1988 to 2018, Remote Sens., 14, 5057, https://doi.org/10.3390/rs14195057, 2022.
Zeng, Z., Li, Y., Wu, W., Zhou, Y., Wang, X., Huang, H., and Li, Z.: Spatio-Temporal Variation of Drought within the Vegetation Growing Season in North Hemisphere (1982–2015), Water, 12, 2146, https://doi.org/10.3390/w12082146, 2020.
Zhang, L., Zhang, H., Sun, X., and Luo, L.: Combined Use of Multiple Cloud-Free Snow Cover Products in China and Its High-Mountain Region: Implications From Snow Cover Identification to Snow Phenology Detection, Water Resour. Res., 60, e2023WR036274, https://doi.org/10.1029/2023WR036274, 2024.