the Creative Commons Attribution 4.0 License.
the Creative Commons Attribution 4.0 License.
 | 08 Jul 2025
The role of snowmelt, glacier melt and rainfall in streamflow dynamics on James Ross Island, Antarctic Peninsula
Ondřej Nedělčev
Michael Matějka
Kamil Láska
Zbyněk Engel
Jan Kavan
Michal Jenicek
The Antarctic Peninsula is experiencing a rapid increase in air temperature, which has a major impact on the entire ecosystem, including the runoff process. Understanding the water balance dynamics in such a fragile and sensitive environment is therefore crucial. Although water availability plays an important role in polar ecosystems, runoff generation in the Antarctic Peninsula region is still poorly understood. We analysed the variability in rain, snow and glacier contributions to runoff in relation to climate variability in a small, partly glaciated catchment on James Ross Island in the north-eastern Antarctic Peninsula. We used the hydrological model HBV to simulate the runoff process from June 2010 to May 2021 at a daily resolution. The model was calibrated against both measured discharge and glacier mass balance. Model simulations showed the negative mass balance of Triangular Glacier for 9 out of 11 study years, with an average annual mass loss of 49 mm water equivalent. About 92 % of the annual runoff occurred between October and May. On average, peak runoff occurred in the second half of the summer season due to the combination of glacier melt and snowmelt. The majority (76 %) of runoff originated from snowmelt, 14 % originated from glacier melt and 10 % from rainfall. Higher total annual runoff occurred in warmer and drier years associated with high glacier melt runoff. The contribution of snowmelt to total runoff was higher in colder years with more precipitation. Our simulation showed the presence of significant runoff-generating events outside the usual high summer runoff measurement season.
- Article
(5679 KB) - Full-text XML
- BibTeX
- EndNote


The Antarctic Peninsula region has experienced a rapid increase in air temperature during the second half of the 20th century (Vaughan et al., 2003; Turner et al., 2005). Although the warming of this region was interrupted in the early part of the 21st century (Turner et al., 2016; Oliva et al., 2017), the cooling period ended in the mid-2010s (Carrasco et al., 2021); since then, the region has experienced several warm events with record high temperatures (González-Herrero et al., 2022; Gorodetskaya et al., 2023). Regardless of short-term climate oscillations, future climate projections indicate that air temperature is expected to rise significantly in both the near and far future (Bozkurt et al., 2021; Zhu et al., 2022).
Increasing air temperature leads to a shift in the phase of precipitation from solid to liquid (Vignon et al., 2021) and accelerates snow cover melting (Abram et al., 2013), glacier mass loss (Cook et al., 2005; Vaughan, 2006; Chuter et al., 2022; Seehaus et al., 2023) and changes in the permafrost active layer (Hrbáček and Uxa, 2020; Kaplan Pastíriková et al., 2023). These changes have a significant impact on the runoff regime of catchments in proglacial areas (Gooseff et al., 2007; Nowak et al., 2021). Streams in proglacial environments represent a key driver for changes in the entire ecosystem, as they form the landscape through fluvial erosion and sediment transport (Rosa et al., 2014; Kavan et al., 2017). Streamflow variations and water availability have a major influence on the evolution of terrestrial ecosystems (Gooseff et al., 2017), and changes in the amount of freshwater and sediment released into coastal seas can affect marine ecosystems (Meredith et al., 2018; Braeckman et al., 2021). Available liquid water is a necessary condition for the existence of life in extremely cold and dry environments, and shifts in the hydrological cycle introduced by climate change may significantly alter local fragile ecosystems and organisms (Gutt et al., 2021). It is therefore essential to quantify water balance components and identify their relative contribution to the overall hydrological regime of the environment.
In Antarctica, runoff is mainly studied in the McMurdo Dry Valleys (Chinn and Mason, 2016; Gooseff et al., 2022). In this area, an increase in the flow season duration has been observed (Gooseff et al., 2007). However, climatic conditions in the McMurdo Dry Valleys differ significantly from those in the Antarctic Peninsula region. Annual precipitation in the McMurdo Dry Valleys is less than 100 mm (Doran et al., 2002; Fountain et al., 2010), several times lower than the modelled amount of 300–700 mm on James Ross Island in the north-eastern Antarctic Peninsula (van Wessem et al., 2016). In addition, rainfall events occur in this region, unlike the Dry Valleys, where only snowfall has been observed (Fountain et al., 2010).
In the Antarctic Peninsula region, runoff has been studied on King George Island, James Ross Island, the South Orkney Islands and Vega Island. Nonetheless, these studies covered only one summer season and focused mainly on sediment transport (Rosa et al., 2014; Hodson et al., 2017; Sziło and Bialik, 2017; Kavan et al., 2017, 2023; Stott and Convey, 2021; Kavan, 2021). A limited number of studies have focused on the runoff generation process (Moreno et al., 2012; Lyons et al., 2013; Lee et al., 2020). The most complex study in this field so far was conducted by Jung et al. (2022), who described the different contributions of old and new water during warm and cold periods on King George Island based on the chemical and stable isotopic water composition. Falk et al. (2018) analysed the variability of surface runoff in a small partly glaciated catchment on King George Island during one summer season using a simple hydrological model developed by the authors. Kavan et al. (2017) analysed the runoff variability of two streams on James Ross Island for the 2014/15 summer season. Their results indicate that the runoff variability of these streams was mainly driven by air and ground temperatures, with maximum runoff occurring at the end of January. The subsequent study (Kavan, 2021) focused primarily on fluvial sediment transport but also described runoff variability for the 2017/18 summer season.
Although changes in the runoff process affect both terrestrial and marine ecosystems, as runoff variability plays an essential role in erosion, sediment transport and water availability (Foreman et al., 2004; Kohler et al., 2015; Hodson et al., 2017), runoff generation in the Antarctic Peninsula region is still poorly understood. This is partly due to the severe limitations of direct measurements of individual components of the precipitation-runoff process, which can be made only during the short austral summer season and are often subject to large measurement errors (Tang et al., 2018; Seefeldt et al., 2021). Therefore, the objectives of our research were (1) to reconstruct streamflow in a small, partly glaciated catchment on James Ross Island, Antarctic Peninsula, and (2) to assess the inter-annual variations in rain, snow and glacier contributions to streamflow in relation to recent climate variability. The study area belongs to the largest deglaciated area in the Antarctic Peninsula, with ongoing changes in water source contributions to streamflow affecting the seasonal runoff distribution, which further impacts terrestrial ecosystems. To our knowledge, studies on the runoff process in the Antarctic Peninsula region have been conducted only for individual summer seasons. Therefore, the inter-annual variability of the runoff process has not been investigated. To fill this gap, we used a conceptual hydrological model coupled with a glacier mass balance model to perform runoff simulations of individual water balance components from June 2010 to May 2021 based on available climate, glacier mass balance, snow depth and streamflow data.
2.1 Study area
The analyses were performed in the Triangular Glacier catchment, which is situated in the Ulu Peninsula in the northern part of James Ross Island (Fig. 1). The catchment area covers 2.8 km2, and the elevation ranges from 70 to 588 The catchment is situated on the Lachman Crags plateau, its south-western slopes and an adjacent low-elevated plain forming part of the Abernethy Flats to the west. The highest part of the catchment spreads over the Lachman Crags plateau (∼ 400 to 600 ), which is separated from the rest of the catchment by up to 300 m high cliffs (Engel et al., 2023). The lower part of the catchment is covered by glaciers, ice-cored moraines and braid plains (Jennings et al., 2021). A small, shallow ice-marginal lake is located near the terminus of Triangular Glacier.
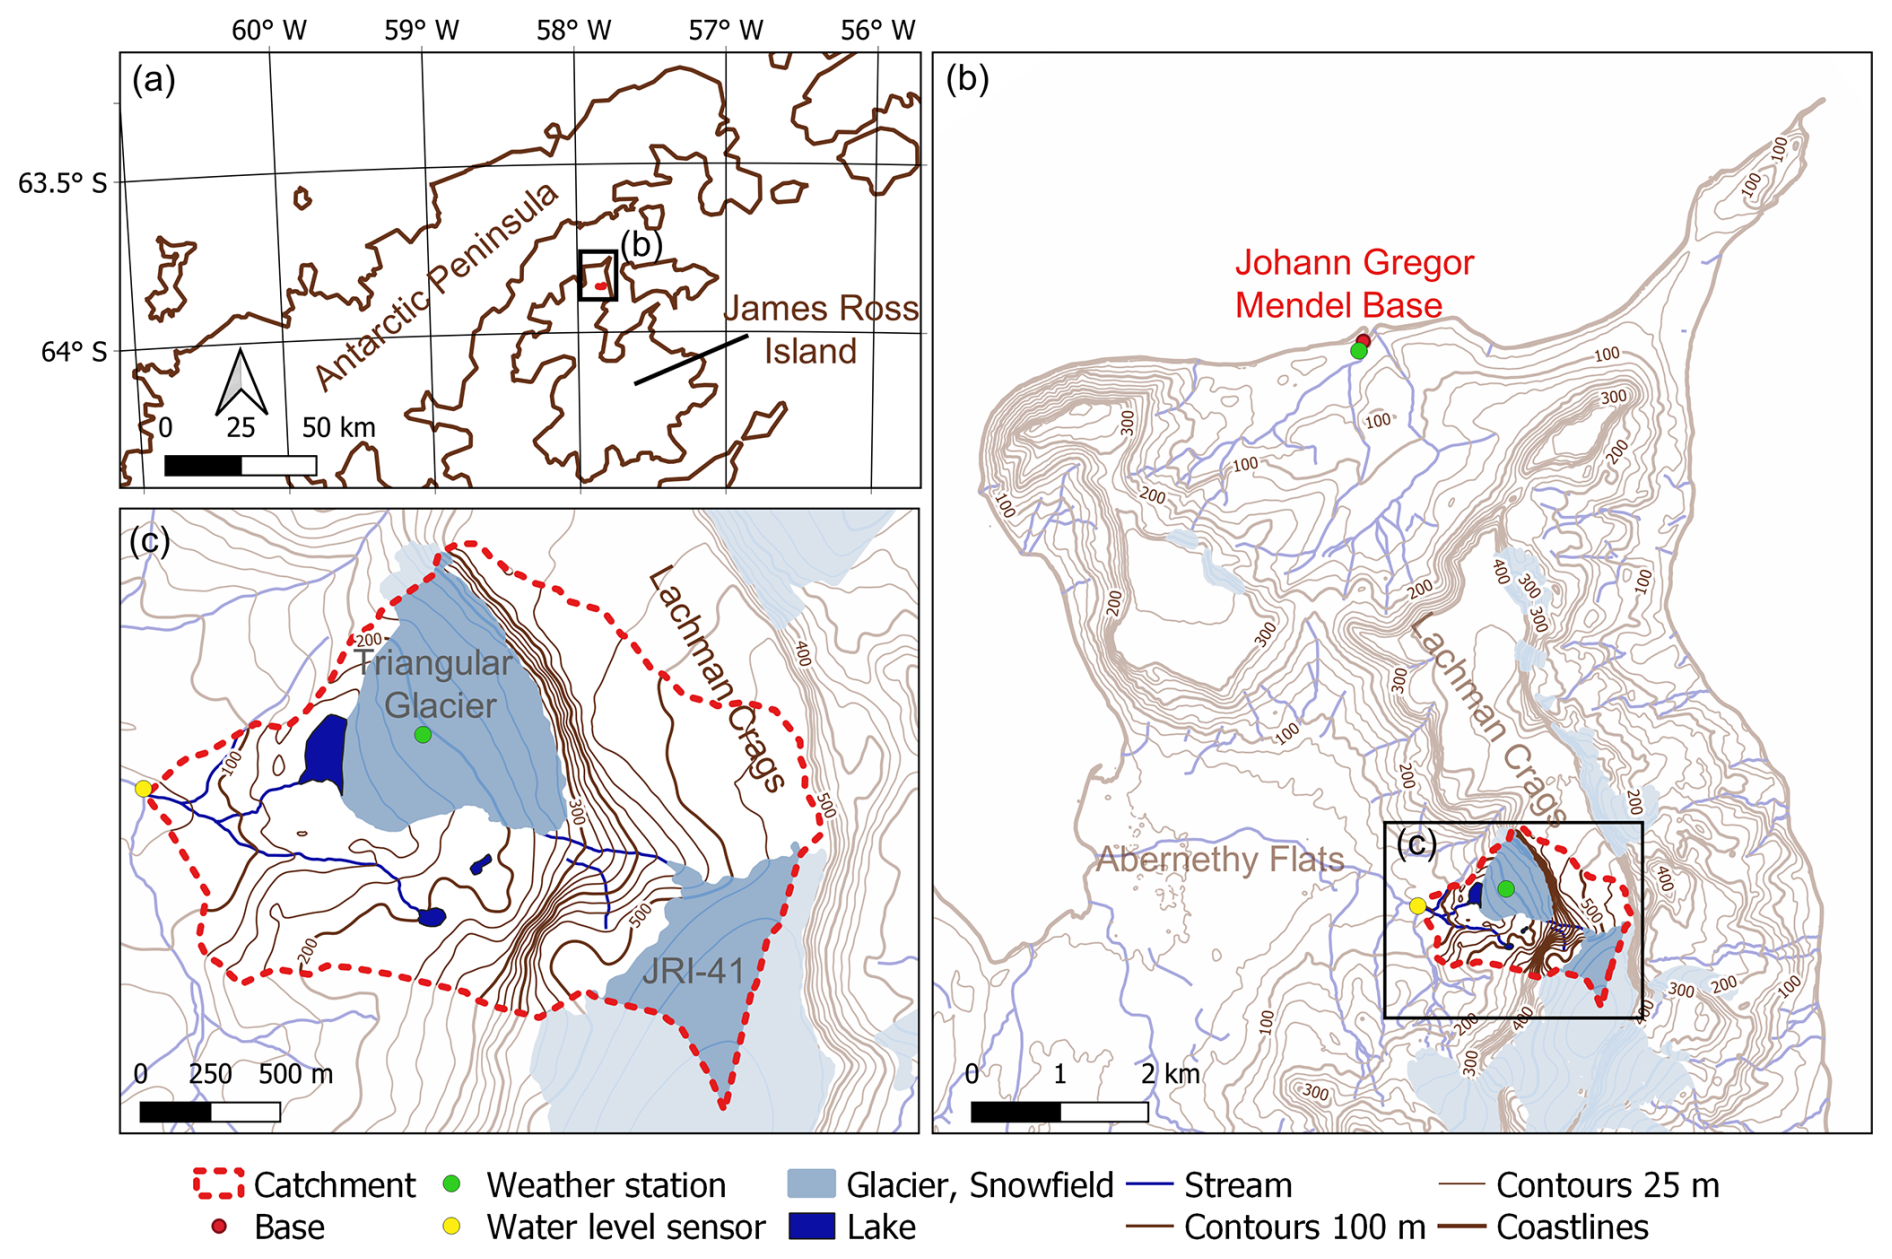
Figure 1Location of the study catchment in the northern part of James Ross Island (Matsuoka et al., 2018; Czech Geological Survey, 2009).
The catchment area was delineated from the digital terrain model produced by GEODIS (Czech Geological Survey, 2009) for the northern part of James Ross Island at an 8 m spatial resolution. Almost one-third of the catchment (28 %) is glaciated, and 19 % of the catchment is covered by Triangular Glacier (GLIMS Glacier ID: G302151E63856S), which represents the smallest glacier on James Ross Island (Engel et al., 2023). The south-eastern part of the catchment (9 %) is covered by the northernmost tip of the Lachman Crags ice cap (GLIMS Glacier ID: G302158E63874S).
The mean annual air temperature measured on the north coast of James Ross Island near the Johann Gregor Mendel Station (Fig. 1b) was −6.7 °C for the period 2011–2021 (Ambrozova et al., 2019; Kaplan Pastíriková et al., 2023). Estimated annual precipitation ranges from 300 to 700 mm of water equivalent (van Wessem et al., 2016). Data from three stations located on the northern tip of the Antarctic Peninsula showed an increase in precipitation from 1970 to the early 1990s, followed by a decrease from 1991 to 1999 (Carrasco and Cordero, 2020). From the mid-1990s to the mid-2010s, snowfall increased and rainfall decreased due to the cooling period (Carrasco and Cordero, 2020). Snow depth in the lowland plains of James Ross Island is typically less than 30 cm (Hrbáček et al. 2016). In contrast, seasonal changes in snow depth varied from 30 to 90 cm in Triangular Glacier (Engel et al., 2023). This uneven accumulation of snow is largely due to the prevailing strong south-westerly winds, which have a significant impact on both snowfall distribution and snow redistribution by wind (Kňažková et al., 2020; Kavan et al., 2020). According to Engel et al. (2023), snow drift accounts for a 43 % reduction in snow depth in Triangular Glacier.
The evolution of Triangular Glacier followed the changes in air temperature. From 1979 to 2006, the glacier lost almost one-third of its volume. After that, the rate of retreat decreased for almost a decade. Since 2015, the retreat rate has increased again (Engel et al., 2023).
2.2 Data
The semi-distributed bucket-type hydrological model HBV – in its software implementation HBV-light version 4.0.0.25 (Seibert and Vis, 2012; Seibert and Bergström, 2022) – was used to simulate the runoff process for the period 1 June 2010 to 31 May 2021. The date of 1 June was estimated as the start of a water year. Mean daily air temperature and total precipitation were used as input to the model. Daily runoff and seasonal glacier mass-balance series were used for model calibration (see below).
Air temperature was measured at the Johann Gregor Mendel Station (Fig. 1b) using the Minikin TH data logger and EMS33 temperature sensor (EMS, Brno, Czechia), with an accuracy of ± 0.15 °C. A linear regression was used to adjust the time series based on air temperature measurements performed in the middle part of Triangular Glacier during the 2017/18 summer season.
Direct measurement of precipitation, mostly occurring as snowfall, is very difficult and inaccurate in the study area due to strong winds, which limits the usage of standard approaches, e.g. a heated rain gauge. Short-term precipitation measurements were taken in January and February 2022 at the Johann Gregor Mendel Station using a Thies laser precipitation monitor (disdrometer) and a manual rain gauge.
Due to incomplete and inaccurate measured data, daily precipitation was simulated by the Weather Research and Forecasting model 4.3 (WRF; Skamarock et al., 2019). The model was run in a two-nested-domain setup with a horizontal resolution in the inner domain of 5 km. In the vertical coordinate, 65 eta-levels were used for the simulation of atmospheric dynamics. The WRF model was forced by ERA5 reanalysis (Hersbach et al., 2020). The WRF model has been successfully applied in previous studies on James Ross Island (Matějka et al., 2021; Matějka and Láska, 2022). Following these validation studies, the model used the 3DTKE boundary layer scheme (Zhang et al., 2018), Thompson microphysics scheme (Thompson et al., 2008) and NoahMP (Niu et al., 2011) as a land surface scheme dealing with interactions between the surface and the atmosphere. Both shortwave and longwave radiation were parameterised with the RRTMG scheme (Iacono et al., 2008). The ability of WRF to simulate precipitation reliably has been confirmed by validation against measured data (Matějka et al., 2022).
The time series of runoff for the period 8 February–15 March 2018 was calculated from automatic water level measurements (in 10 min intervals; station indicated with a yellow dot, Fig. 1b and c) using a hydrostatic pressure sensor (DipperLog F100/M30, Heron Instruments, CA) and the rating curve derived from manual velocity measurements (Flowtracker Handheld Acoustic Doppler Velocimeter, SonTek, USA).
The annual surface mass balance of Triangular Glacier for the years 2014/15–2019/20 was determined by the glaciological method (Kaser et al., 2003) reported by Engel et al. (2023). The initial volume of Triangular Glacier at the start of the model simulation (2009/10) and calibration (2014/15) periods was calculated based on the ice surface digital elevation model (February 2006) and the ground-penetrating radar survey of 25 January 2017 (Engel et al., 2023). To account for the change in glacier extent between 2005/06 and 2009/10, we adopted the value of −0.3 % a−1 reported by Engel et al. (2023) as the mean annual retreat rate between 2005/06 and 2014/15.
Snow depth was measured using a sonic distance sensor (Judd Communication, USA) fixed at the automatic weather station located in the central part of Triangular Glacier during the period 6 February 2017 to 23 January 2020. The zero point level was chosen arbitrarily (Engel et al., 2023). The snow depth was used only to calculate the snow water equivalent (SWE) as the observed snow depth multiplied by a constant density of 389 kg m−3, which represents the mean measured density in the summer season 2022. The estimated SWE time series was used only for model evaluation.
Global solar radiation was measured using the CMP11 pyranometer (Kipp and Zonen, the Netherlands) near the Johann Gregor Mendel Station from 1 January 2015 to 10 March 2018. The global radiation time series was used only for the correlation analysis between climate and runoff data.
2.3 Hydrological model HBV coupled with glacier routine
For runoff simulations, the HBV model was used (Seibert and Vis, 2012). The study catchment was divided into sub-zones based on elevation intervals of 100 m for glacier-free areas and 50 m for glaciated areas. The model inputs are formed by air temperature, precipitation and potential evapotranspiration (PET). The temperature-based method defined by Oudin et al. (2005) was used for the calculation of daily PET using the observed air temperature measured at the Johann Gregor Mendel Station. Available measured data of glacier mass balance and runoff were used for model calibration.
The HBV model consists of five routines: (1) a degree-day method-based snow routine, which controls snow accumulation and melt, (2) a degree-day method-based glacier routine, which simulates glacier mass balance, (3) a soil moisture routine, which calculates daily groundwater recharge and actual evaporation simulated as functions of daily PET and the actual soil moisture, (4) a response routine in which runoff from two groundwater boxes is calculated and (5) a routing routine that simulates the propagation of runoff through the catchment by applying a triangular weighting function. A more detailed model description is given by Seibert and Vis (2012).
The HBV model partitions snowfall and rainfall using the concept of a single threshold temperature (TT). TT is one of the calibrated model parameters. Because the catchment is divided into elevation zones, the precipitation phase is calculated separately for the specific elevation zone using a calibrated temperature lapse rate. The snowmelt is calculated using a degree-day method, which additionally accounts for snow water holding capacity and potential refreezing of meltwater. The most important parameter of this method is the melt (degree-day) factor, which was calibrated by the model. The snow routine does not account for either sublimation or evaporation from snow cover.
The ice water equivalent (WE) was calculated using the Δh parameterisation method that links glacier area and thickness and allows for the representation of the glacier advance. This method is implemented in the model and is described in detail by Seibert et al. (2018). The ice melt is simulated only in the case where there is no snow on the glacier using the degree-day approach with a calibrated melt factor. The melt water is added to the liquid water content of the glacier. The outflow is then computed for each elevation zone (Seibert et al., 2018).
The snow redistribution function was set up in the model, which redistributes snow above a certain amount from elevations above a defined threshold to lower elevations. Specifically for the study catchment, snow accumulations above 1000 mm that occurred above 525 were redistributed evenly over the lower zones. A small section of the Lachman Crags ice cap located in the highest part of the catchment was not considered in the model. This part of the catchment was considered as glacier-free in the simulation.
The tracking algorithm implemented in the model and described by Stahl et al. (2017) was used to determine the contribution of rain, snowmelt, and glacier meltwater to runoff. The separation method is based on the complete mixing of the three components in a “virtual mixing tank” that runs parallel to the system of individual storages and fluxes of the HBV model. Unlike many other separation methods, the method applied in this study considers rain falling on snow or glaciers as the rain component (in case it does not refreeze). Similarly, melting snow on glaciers is considered as the snow contribution to runoff (Weiler et al., 2018; Jenicek and Ledvinka, 2020).
The model was calibrated against both runoff (available only for the 2017/18 summer season) and glacier mass balance using a genetic algorithm procedure (Seibert, 2000) for the period 2017/18–2019/20 with the warming-up period 2014/15–2017/18. Before the calibration, the upper and lower limits of all calibrated parameters were applied to ensure that the parameters are physically relevant. Two objective functions were used for calibration: (1) Kling–Gupta efficiency KGE (Gupta et al. 2009; 70 % weight), which combines the evaluation of the bias of mean runoff, flow variability and flow dynamics, and (2) mean absolute error of glacier water equivalent (30 % weight). To reduce the issue of parameter equifinality, a median simulation calculated from 100 calibration runs was used for further analysis. The model performance was additionally evaluated using an approximately 3 year long time series of estimated SWE. During this evaluation, the mean simulated SWE in the elevation zone, in which the weather station is located, was compared to the estimated SWE.
2.4 Runoff and climate characteristics and data analysis
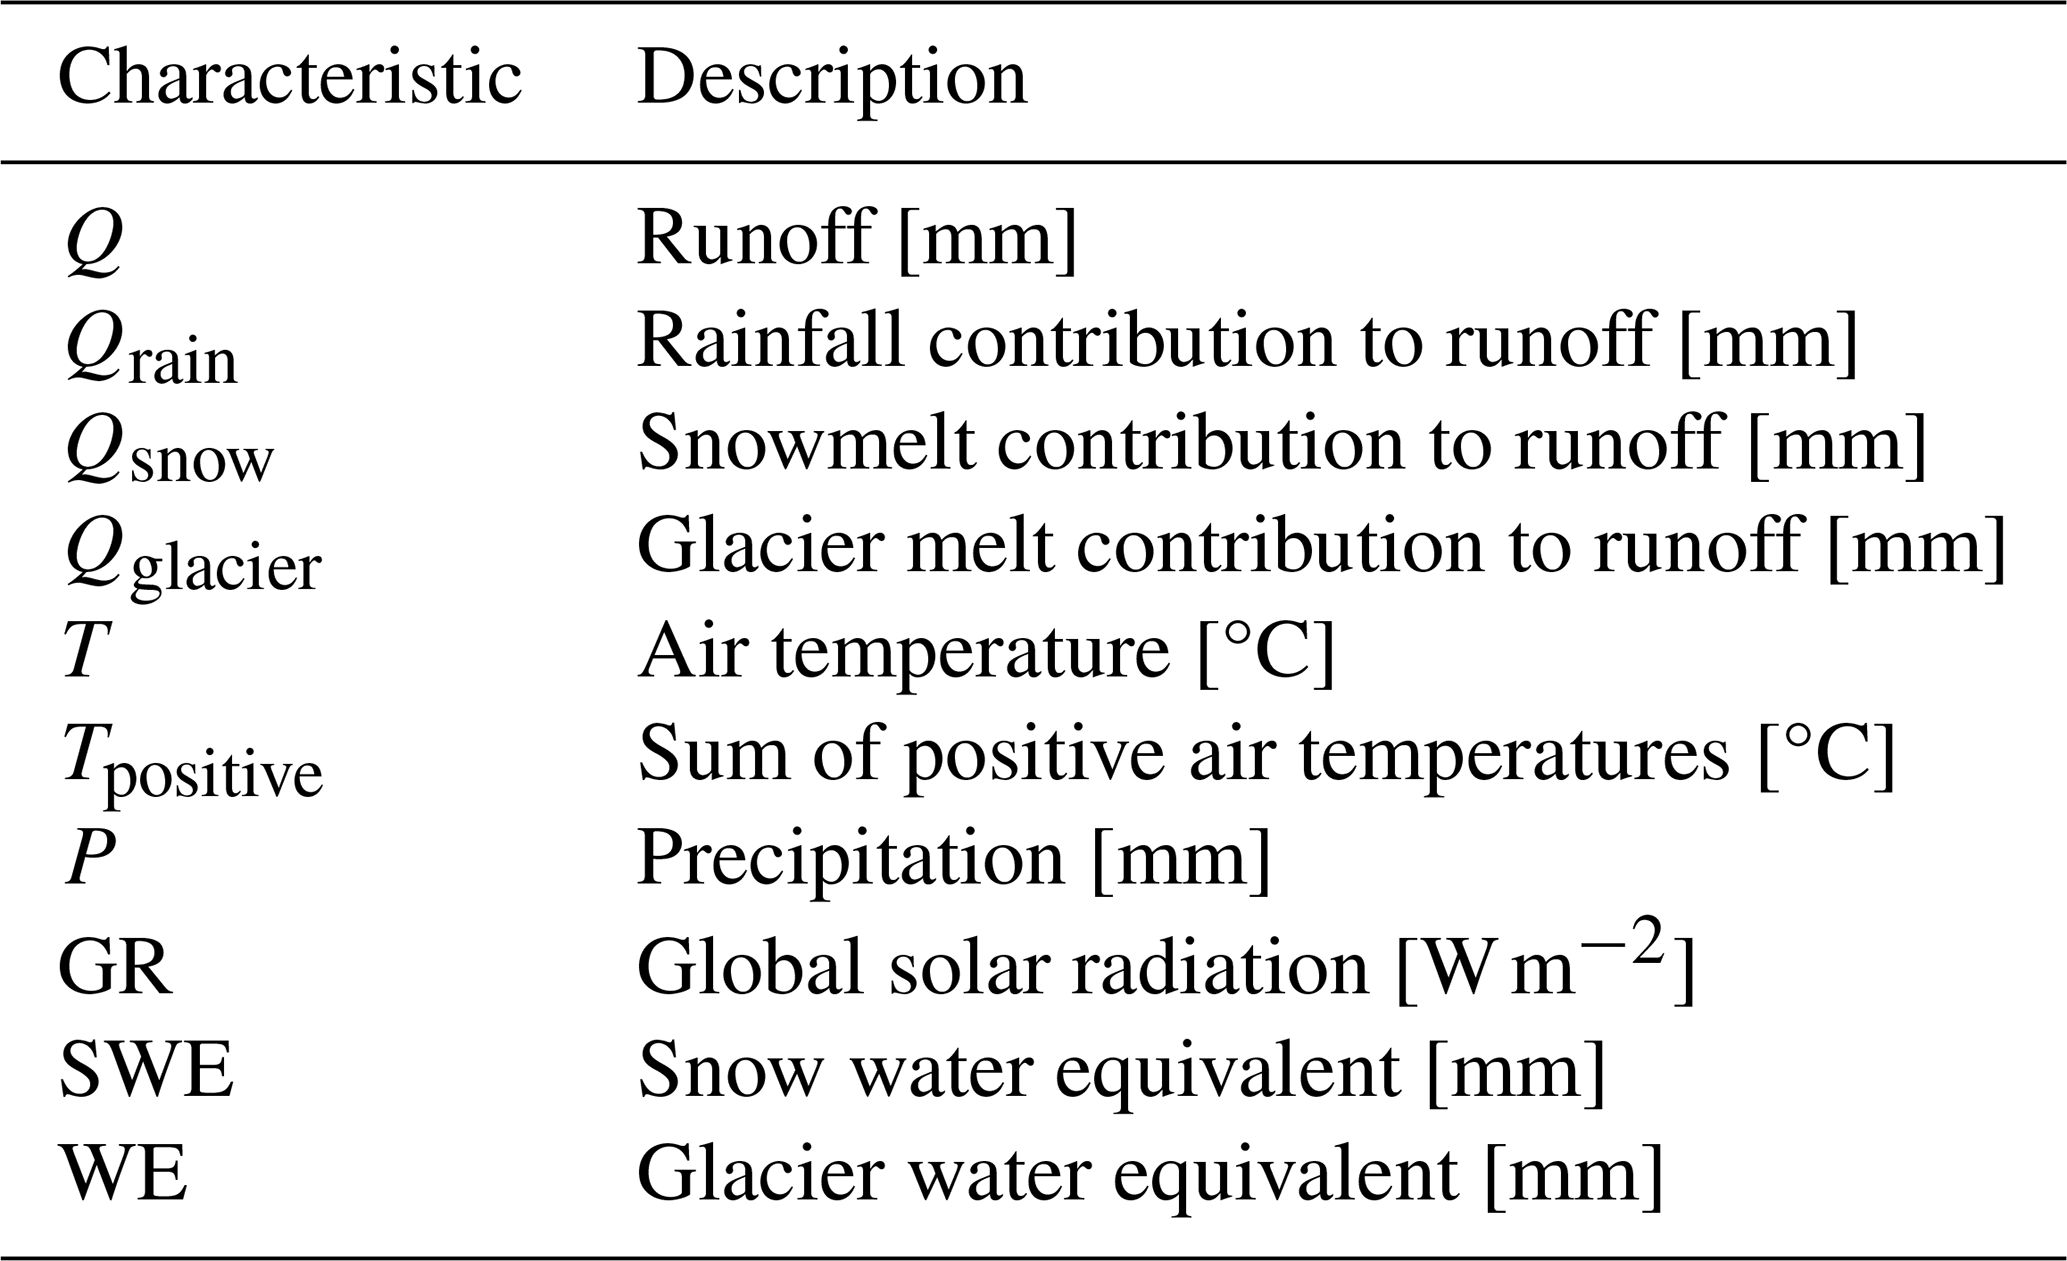
Several runoff and climate characteristics were used in the analysis. Mean daily or annual air temperature (T), precipitation (P), SWE, annual sum of positive air temperature (Tpositive) and average daily global solar radiation (GR) were used to describe climate variability (Table 1). All of the above characteristics represent mean catchment values. Additionally, glacier water equivalent (WE) was analysed separately for each elevation zone. Runoff variability was represented by daily, monthly and annual runoff (Q) and by rainfall, snowmelt and glacier melt runoff components (Qrain, Qsnow and Qglacier, respectively). Spearman's correlation coefficient (rs) was calculated to analyse the relationship between runoff and climate characteristics.
Table 1Runoff and climate characteristics used in the analyses.
3.1 Evaluation of the model performance
The values of the objective functions resulting from the model calibration showed acceptable performance for runoff and good performance for glacier mass balance. The median values of 100 calibration runs were 0.33 and −11.9 mm for the Kling–Gupta efficiency and glacier absolute mean error, respectively (Fig. 2). For selected objective functions not used for calibration, the median values were 0.32 for the Nash–Sutcliffe efficiency, 0.64 for the runoff volume error, 0.83 for the runoff Spearman rank correlation coefficient and 0.98 for the glacier water equivalent (absolute mean relative error).
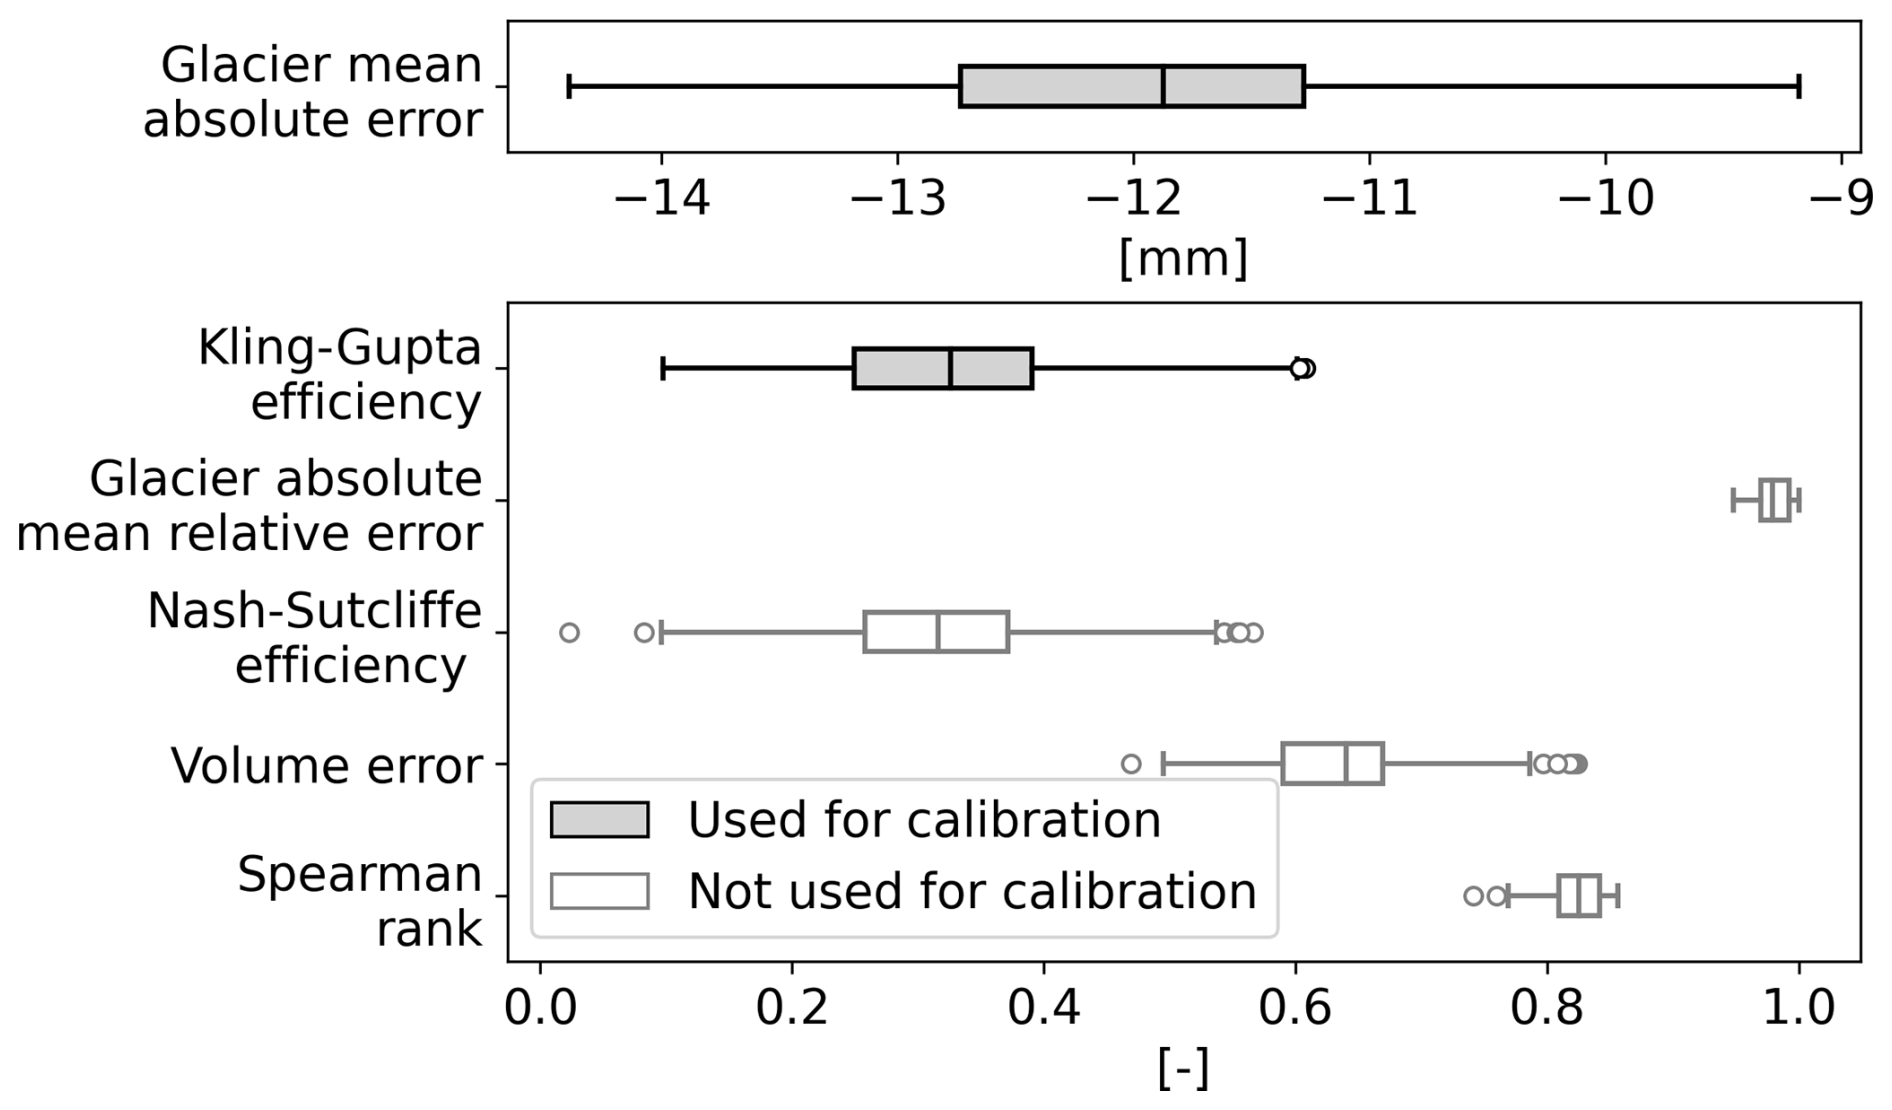
Figure 2The objective function values for 100 calibration runs. Functions used for calibration of the model are shaded in grey.
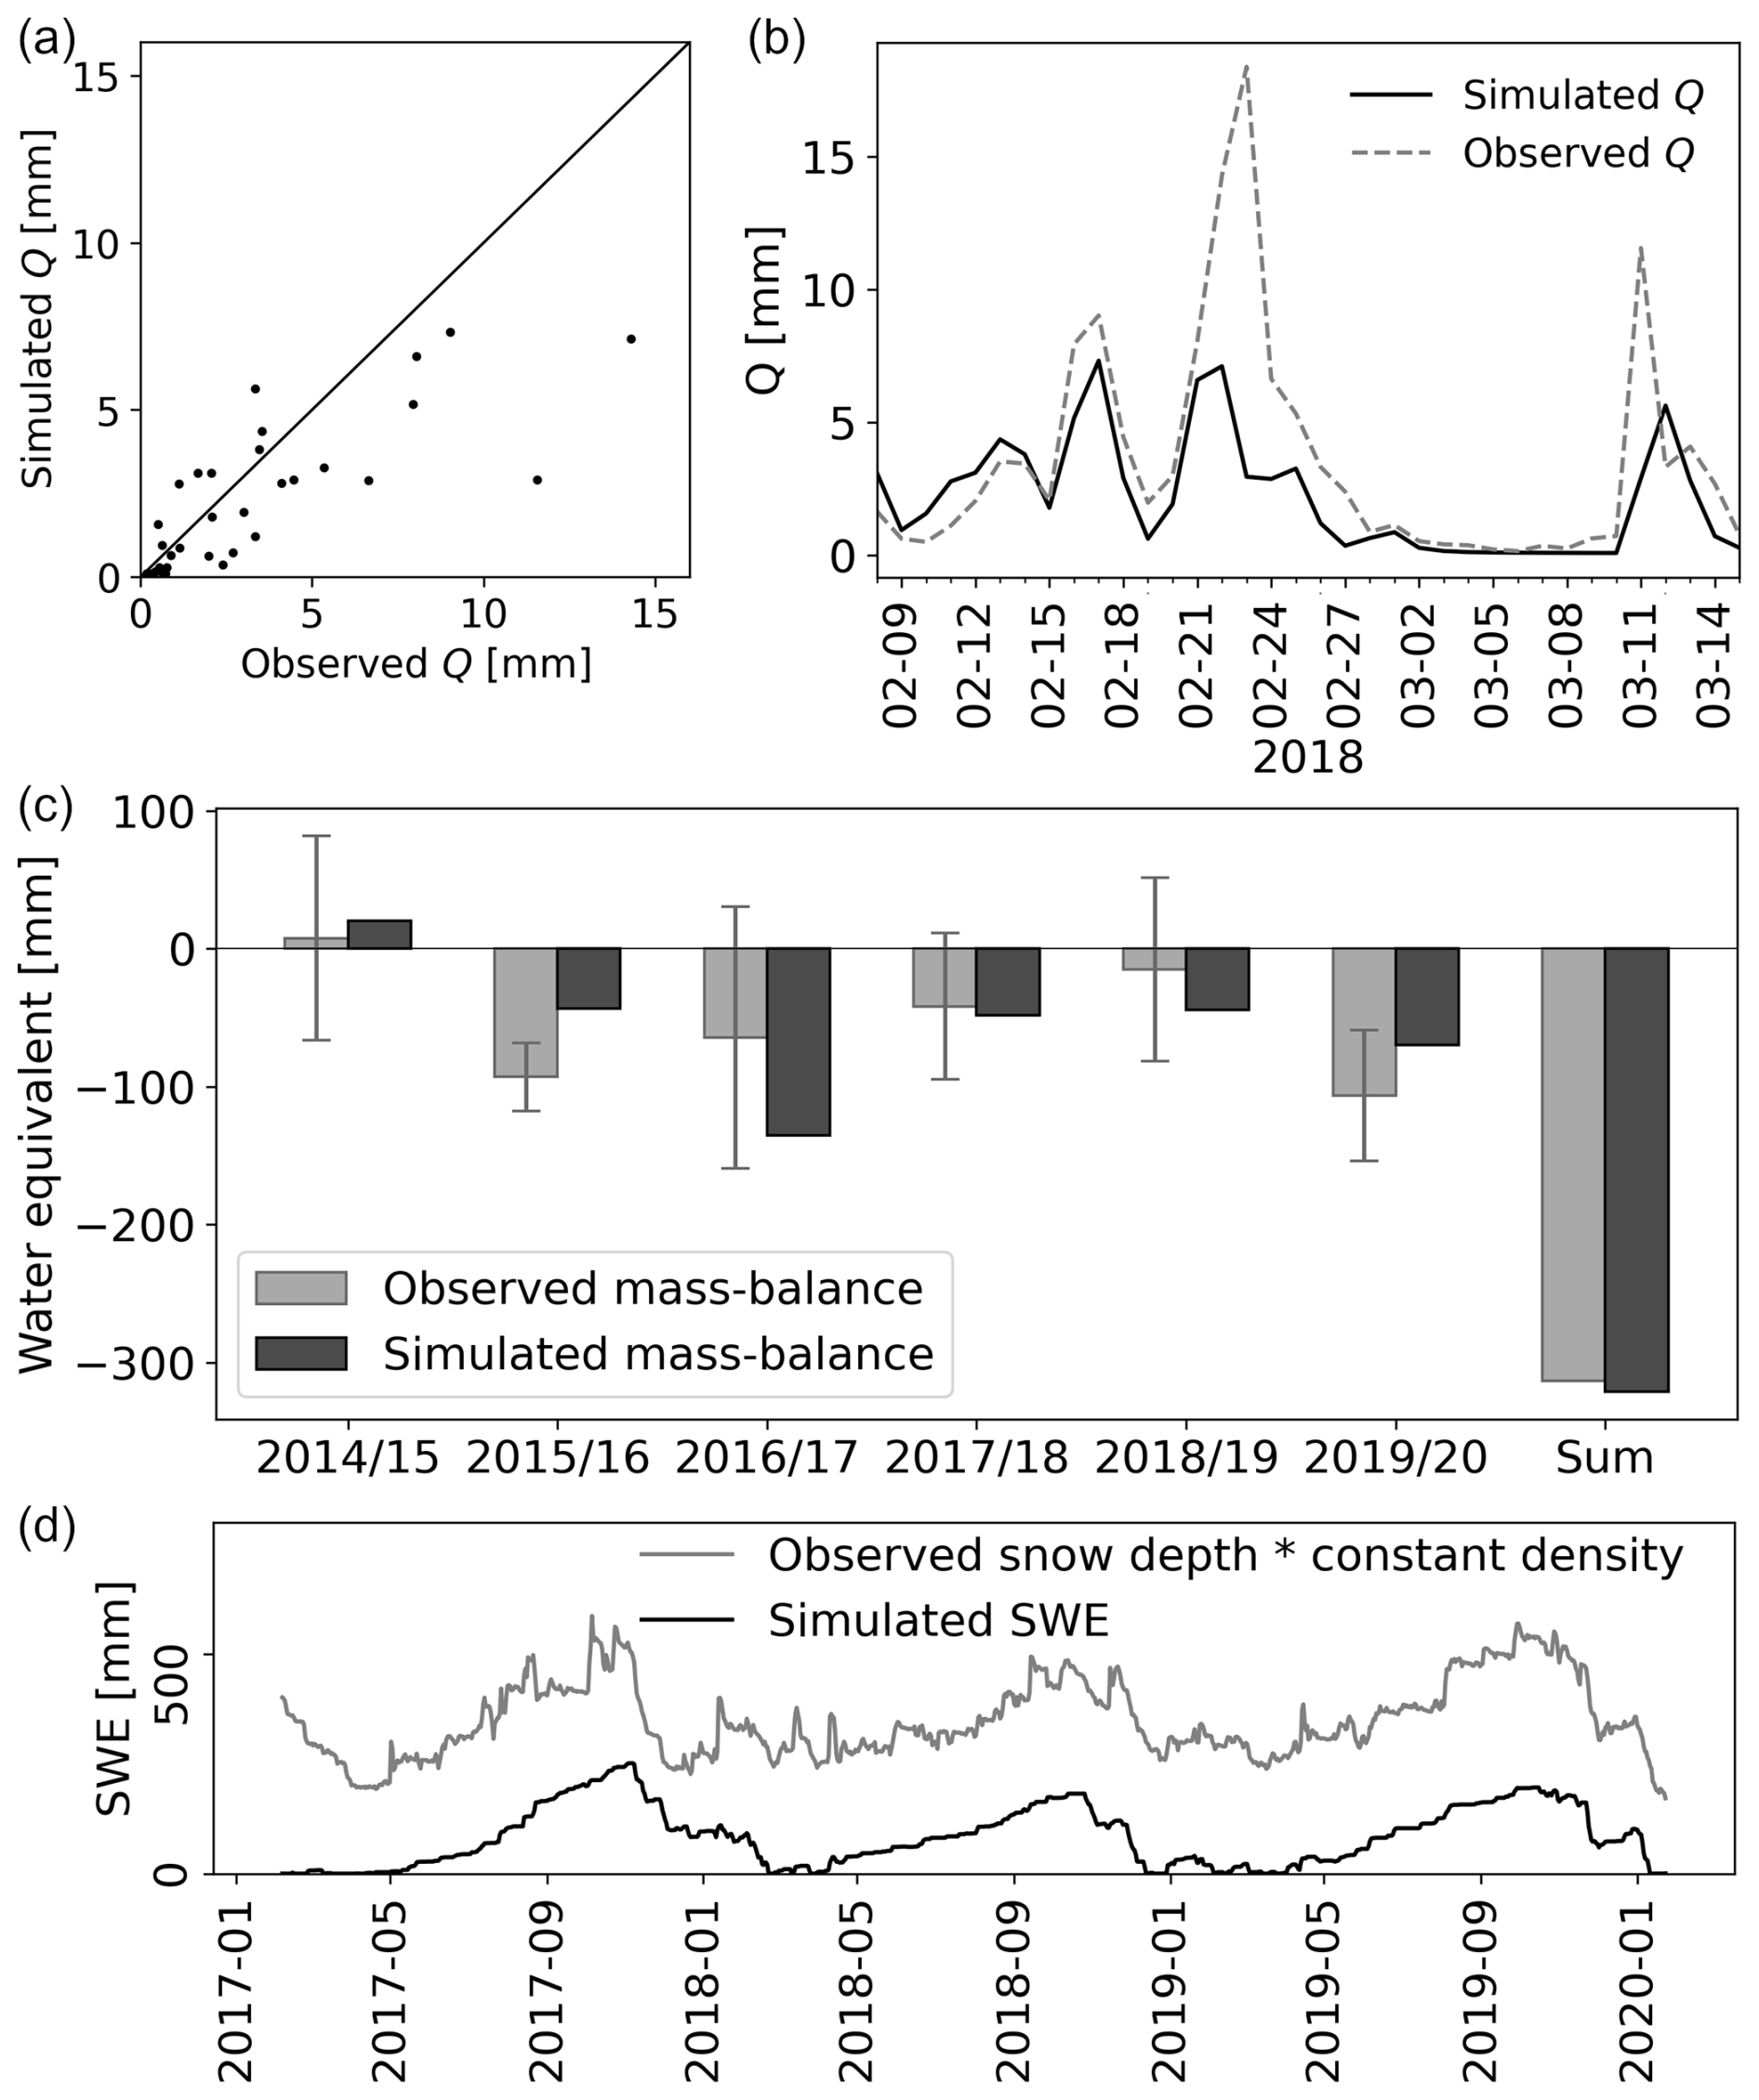
Figure 3(a, b) Simulated versus observed runoff (Q) in the Triangular Glacier catchment for the period 8 February–15 March 2018. (c) Simulated and observed mass balance. Observed mass balance with estimated uncertainty was taken from Engel et al. (2023). (d) Mean simulated SWE in the elevation zone, in which the weather station is located, and the estimated SWE, which was calculated as the observed snow depth on Triangular Glacier (with a zero point level that was chosen arbitrarily (Engel et al., 2023)) multiplied by a density of 389 kg m−3, which was the mean measured density in the summer season of 2022.
A comparison of the observed and simulated runoff showed that the model simulated the daily variability of the runoff relatively well, although peak runoffs were generally underestimated (Fig. 3a). The simulated glacier mass balance matched well with the observed glacier mass balance for years with available measurements (cumulative difference 7.6 mm of WE for the period 2014/15–2019/20; Fig. 3c). For all years but one (2015/16), the simulated mass balance was within the estimated uncertainty of the measured mass balance (Fig. 3c).
The model was further evaluated by a comparison of the simulated SWE and the estimated SWE. There was a strong correlation between observed and simulated values, although the absolute values differ (Pearson correlation coefficient equal to 0.82; Fig. 3d). The fact that the estimated SWE was not used for model calibration suggests the model's ability to simulate the snow storage sufficiently well.
3.2 Variability in snow cover and glacier mass balance
The model results showed that the average annual mass loss of Triangular Glacier was −49.7 mm (± 1 mm considering the variability of 50 % of the model simulations given by different calibrated parameter sets). The negative mass balance during the first two water years of the study period was followed by the highest positive mass balance (19 mm) in 2012/13, followed by two years of near-equilibrium mass balance in 2013/14 and 2014/15 (Fig. 4a). From 2015/16 until the end of the study period, the mass balance remained negative. The highest mass loss occurred in the last year of the study period in 2020/21 (−150 mm). The second-highest mass loss was found in 2016/17 (−130 mm).
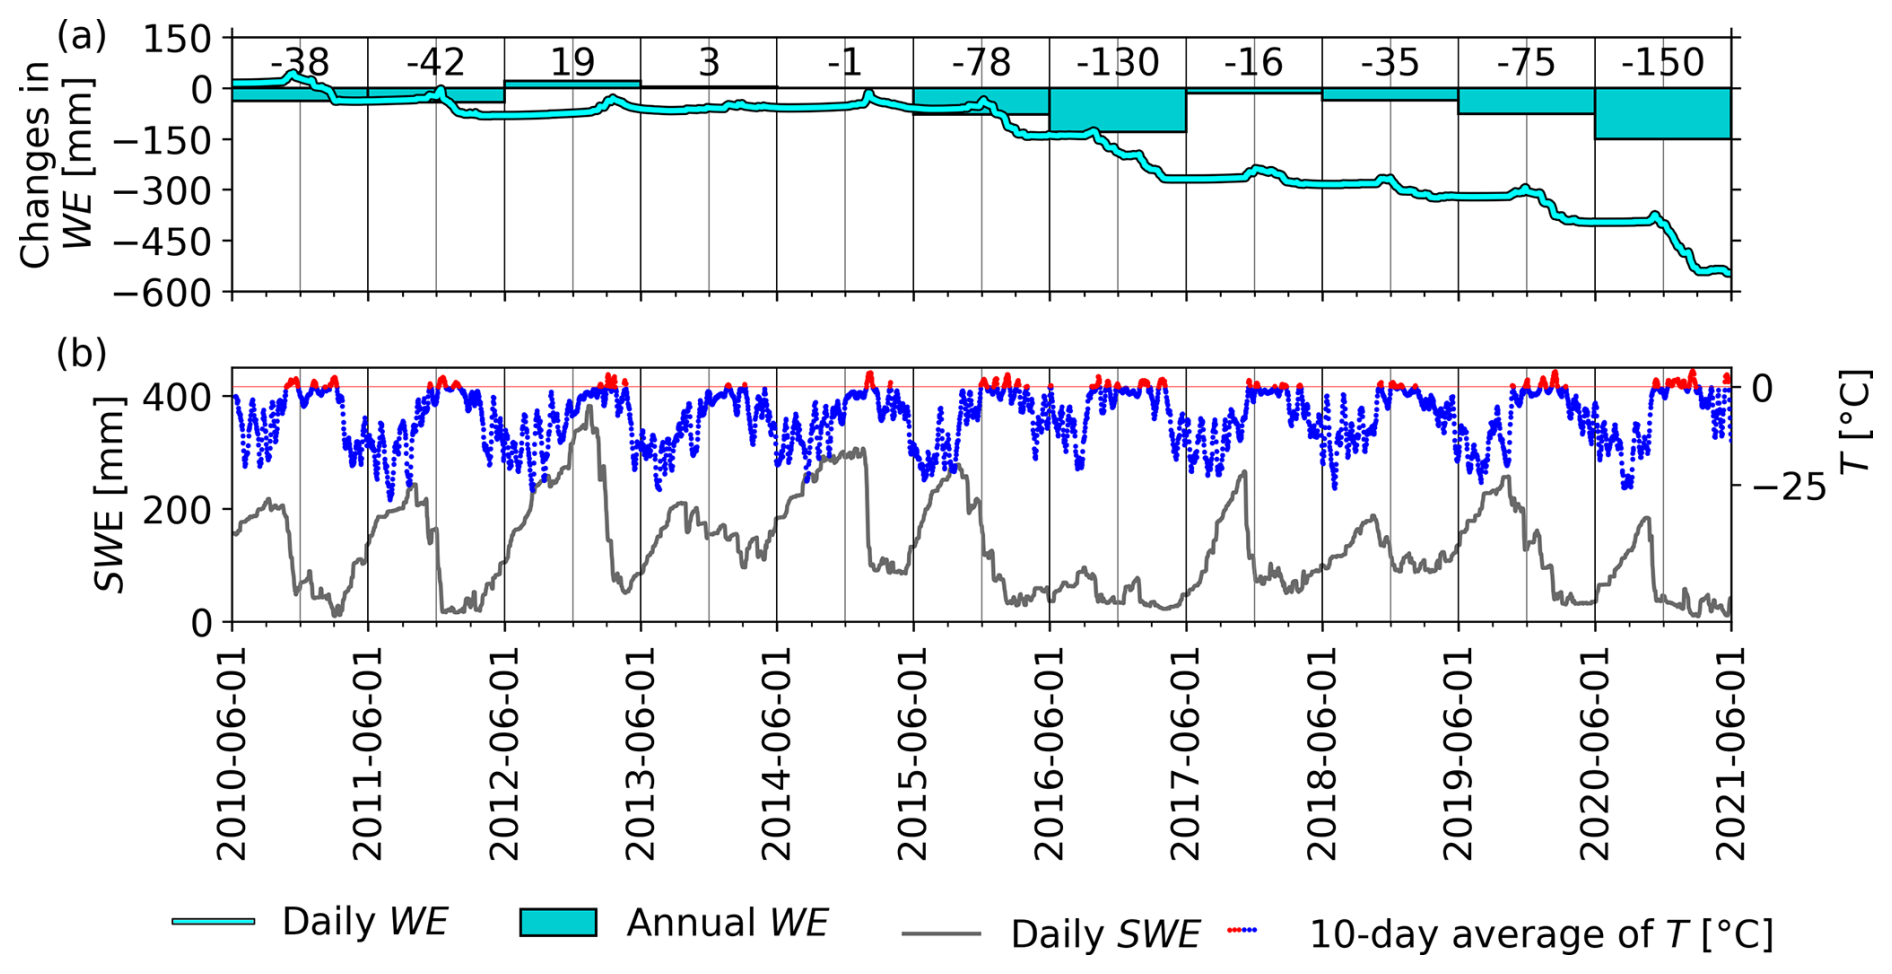
Figure 4(a) Cumulative daily changes in glacier water equivalent (WE) from the start of the simulation (cyan line), and changes in WE in individual water years (bars). (b) Daily snow water equivalent (SWE; grey line), and 10 d moving average of the air temperature (negative values in blue, positive values in red).
In terms of the variability of the glacier mass balance with elevation, the lower-middle part of the glacier, at elevations between 150 and 200 , which is the second-largest part of the glacier by area, experienced the largest absolute decrease in glacier water equivalent, with a reduction of 217 mm. In contrast, the highest parts of the glacier did not lose any mass.
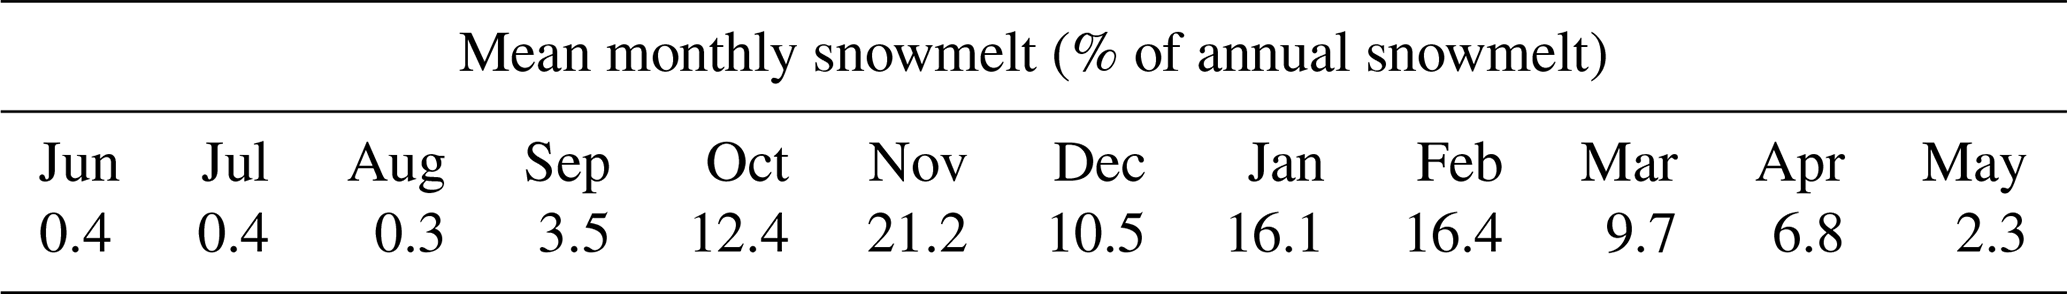
Mean catchment daily SWE ranged from 59 mm on 18 March to 216 mm on 29 September. The highest SWE (382 mm) occurred on 12 January 2013 (Fig. 4b). It was caused by an unusually cold beginning of summer, resulting in almost no snowmelt until late January (see Fig. 7a). The lowest SWE was 9 mm, which occurred on 4 March 2021, associated with very high air temperatures during the warm part of the year (Fig. 4b). Mean monthly snowmelt was highest in November (21.2 % of the total snowmelt; Table 2), followed by January and February (16.1 % and 16.4 % of the total snowmelt, respectively).
3.3 Runoff regime
The simulated mean annual runoff for the study period was 415 mm (± 45 mm). The majority of runoff (92 %) occurred from October to May. The mean annual evapotranspiration was 7 mm, and the mean annual precipitation was 369 mm (Fig. 5). About 76 % (315 ± 39 mm) of the runoff originated from snowmelt, 14 % (58 ± 5 mm) from glacier melt and 10 % (42 ± 7 mm) from rainfall. The flow regime is characterised by two peaks, one in November and the second in February. During the winter, the air temperature was well below the freezing point, and thus almost no runoff occurred. In general, as the air temperature rises at the start of the warm season and causes snow to melt, the contribution of Qsnow to the total runoff increases. In contrast, Qglacier starts to contribute during summer, as parts of the glacier are often snow-free. Qrain contributes to the total runoff throughout the warm season, primarily from October to March (Fig. 5). In Figs. 4 and 5, we can see that, throughout the year, Qsnow was the primary contributor to runoff. From December to March, the mean monthly Qglacier exceeded the mean monthly Qrain.
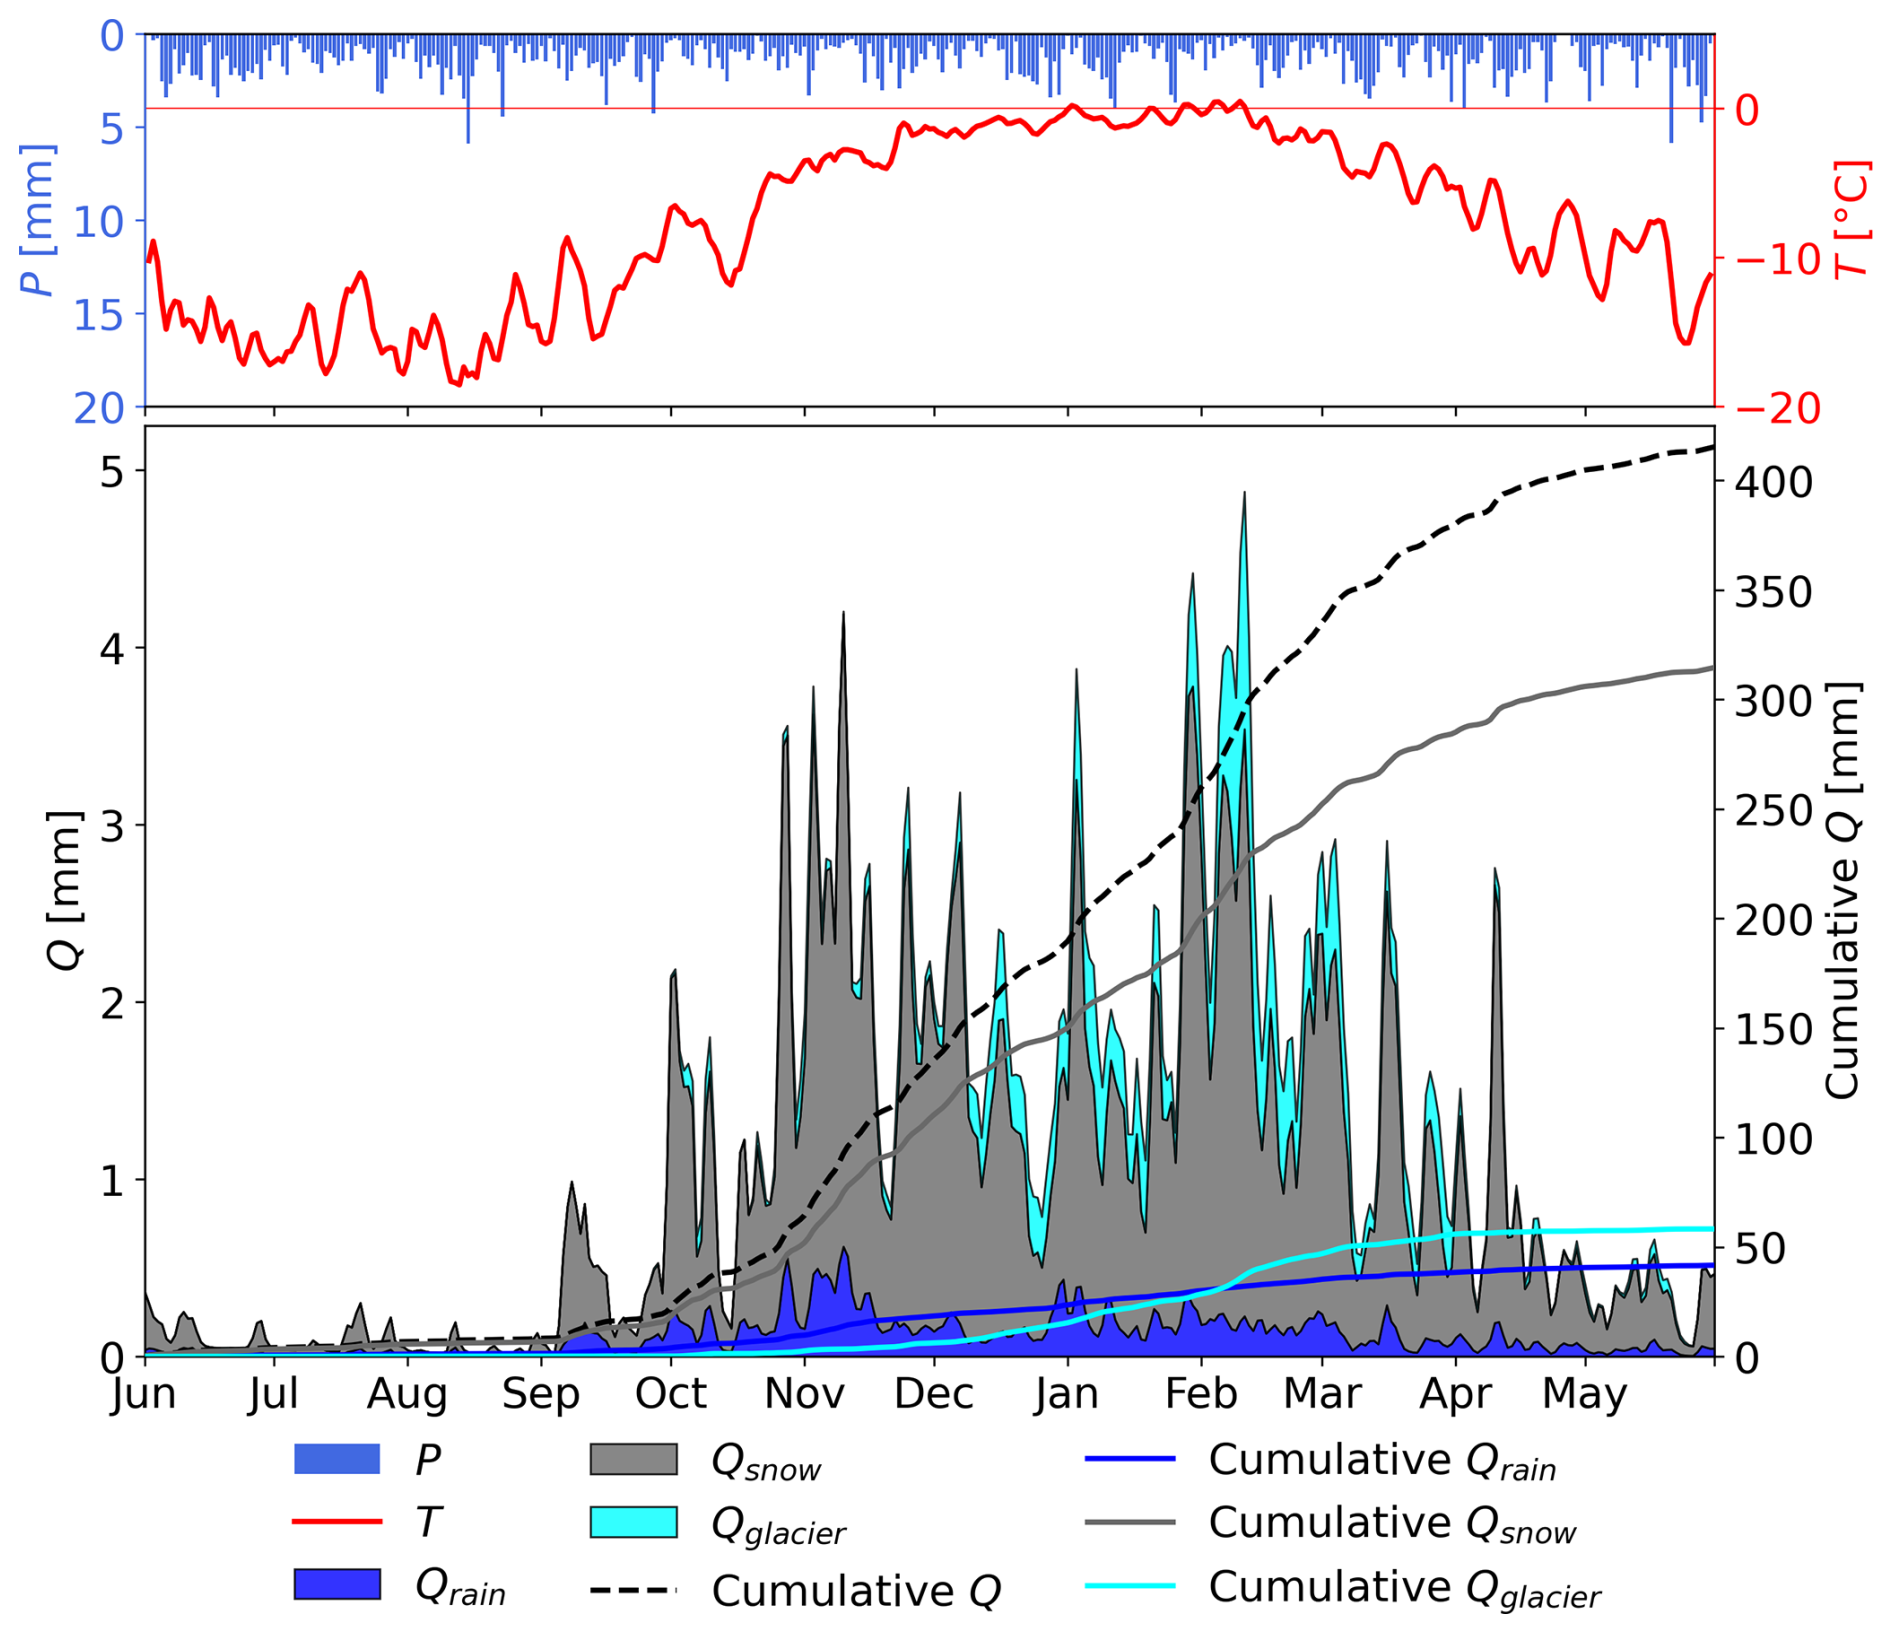
Figure 5Mean daily precipitation (P; blue bars), 3 d moving average of air temperature (T; red line), mean daily rainfall runoff (Qrain), snowmelt runoff (Qsnow), glacier melt runoff (Qglacier; stacked areas, left axis), cumulative Q, Qrain, Qsnow and Qglacier (lines, right axis) in the Triangular Glacier catchment for the period 2010/11–2020/21.
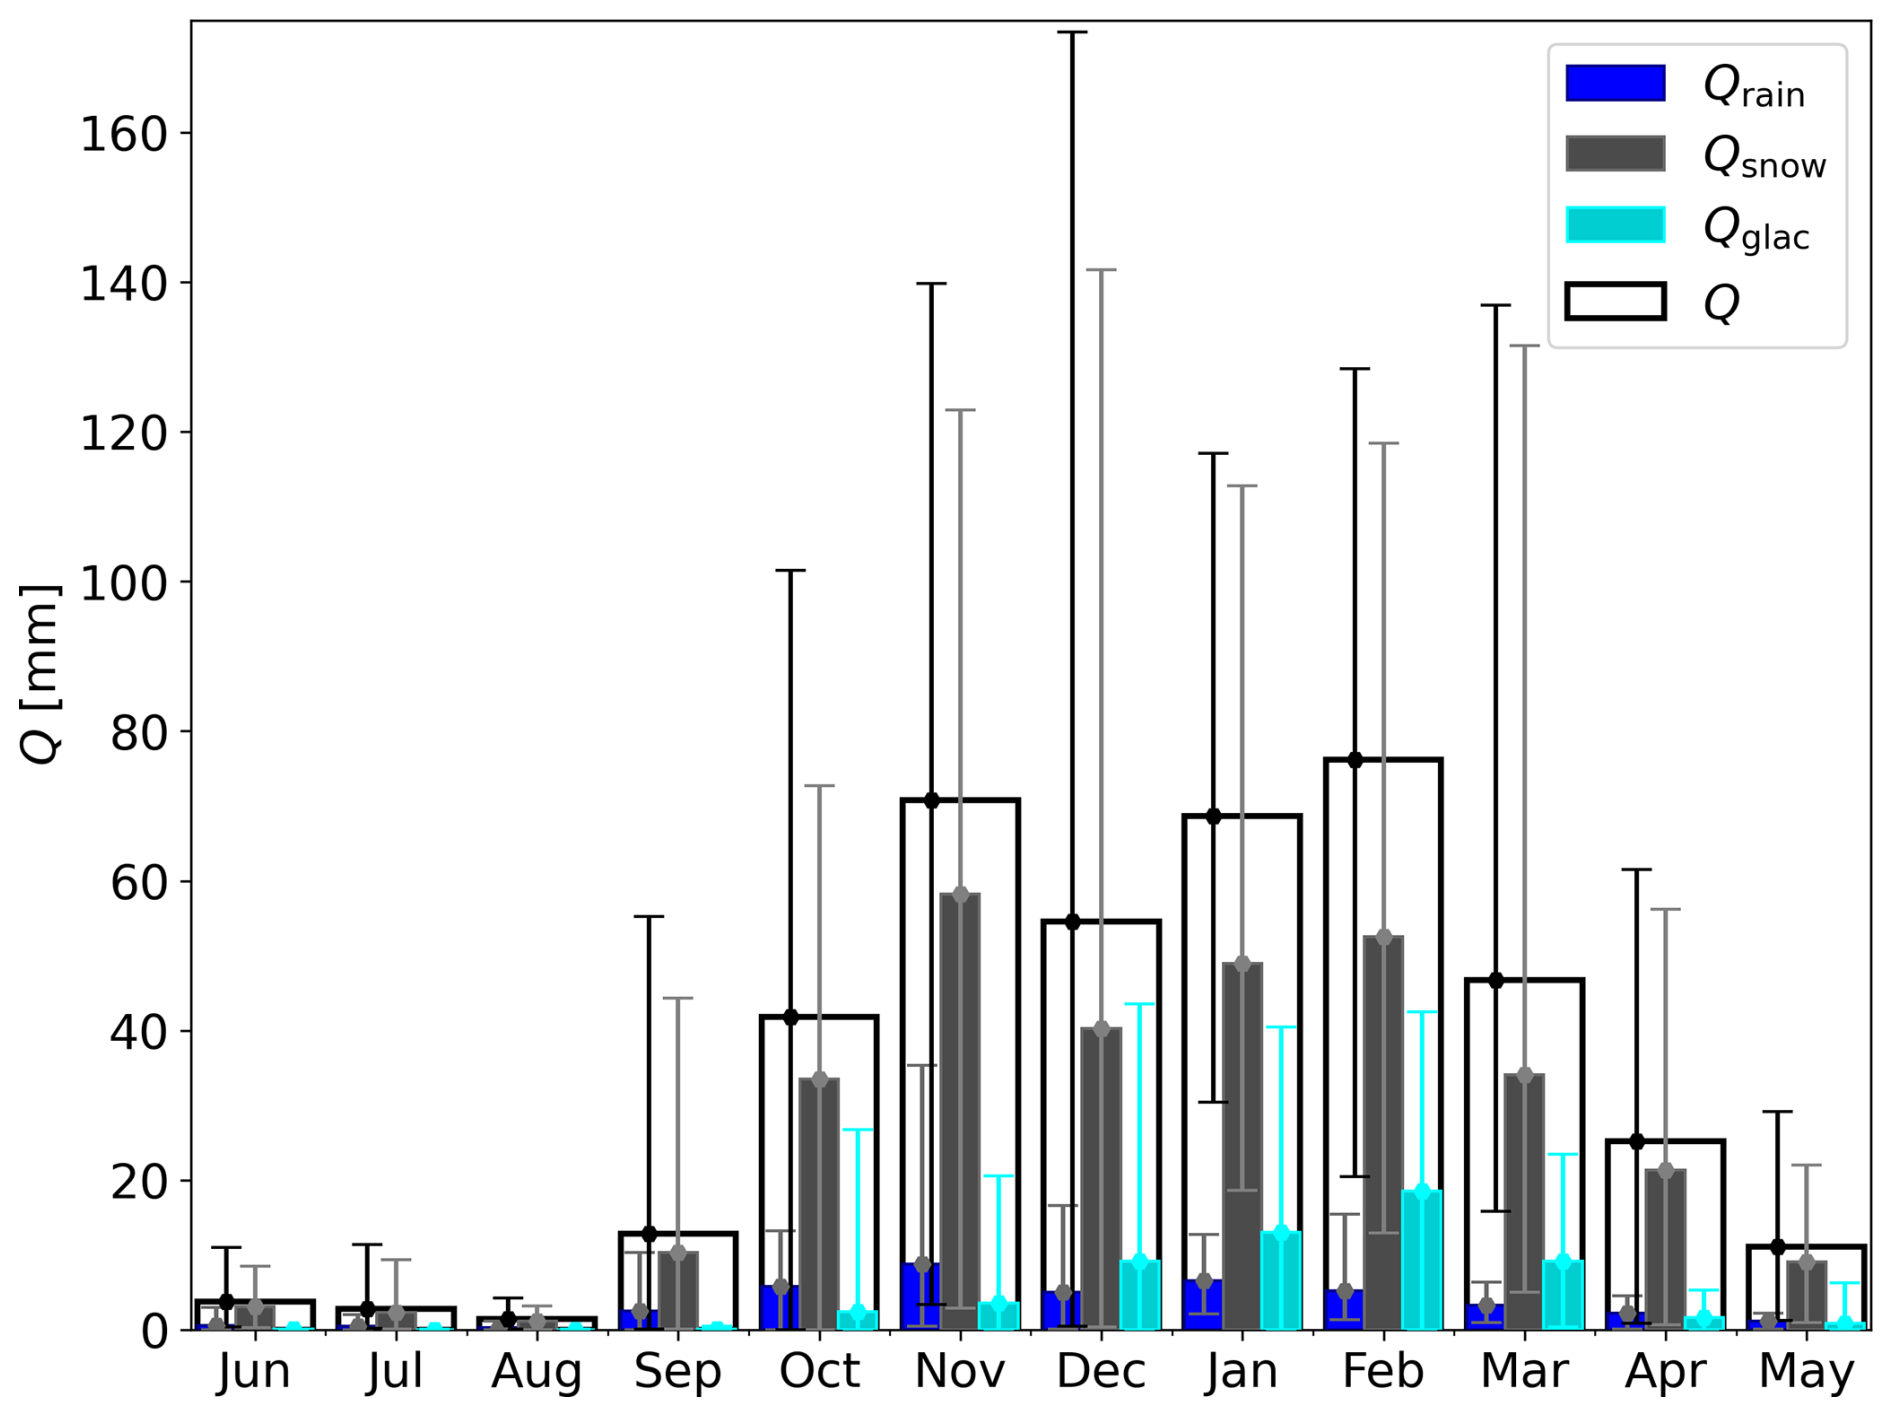
Figure 6Mean (bars), minimal and maximal (error bars) monthly runoff (Q), rainfall runoff (Qrain), snowmelt runoff (Qsnow) and glacier melt runoff (Qglac) in the Triangular Glacier catchment for the period 2010/11–2020/21.
In order to further analyse the runoff regime, we calculated the monthly values of runoff and its components. Several distinct peaks can be seen in the mean monthly values: Qsnow in November and February, Qrain in November and January and Qglacier in February (Fig. 6). The mean monthly runoff was highest in February, accounting for 18.3 % of the annual runoff. The high runoff during this month was primarily caused by the combination of the highest monthly Qglacier and the second-highest monthly Qsnow. In November, which had the highest mean monthly Qsnow, the second-highest mean monthly runoff (17 % of the annual runoff) was recorded. Additionally, November had the highest mean monthly Qrain. In contrast, the lowest monthly runoff occurred in August, accounting for only 0.3 % of the annual runoff. The runoff was also very low in June and July (0.9 % and 0.7 % of the annual runoff, respectively). Large variability of the monthly runoff was found between individual years (Fig. 6). The highest variability of monthly Q was observed in December (from 0.5 mm in 2013 to 173 mm in 2012), as a result of the highest variability of monthly Qsnow and Qglacier occurring. These variations are mainly determined by the timing of seasonal snowmelt, which can occur throughout the warm season based on variations in the air temperature (Fig. 4b).
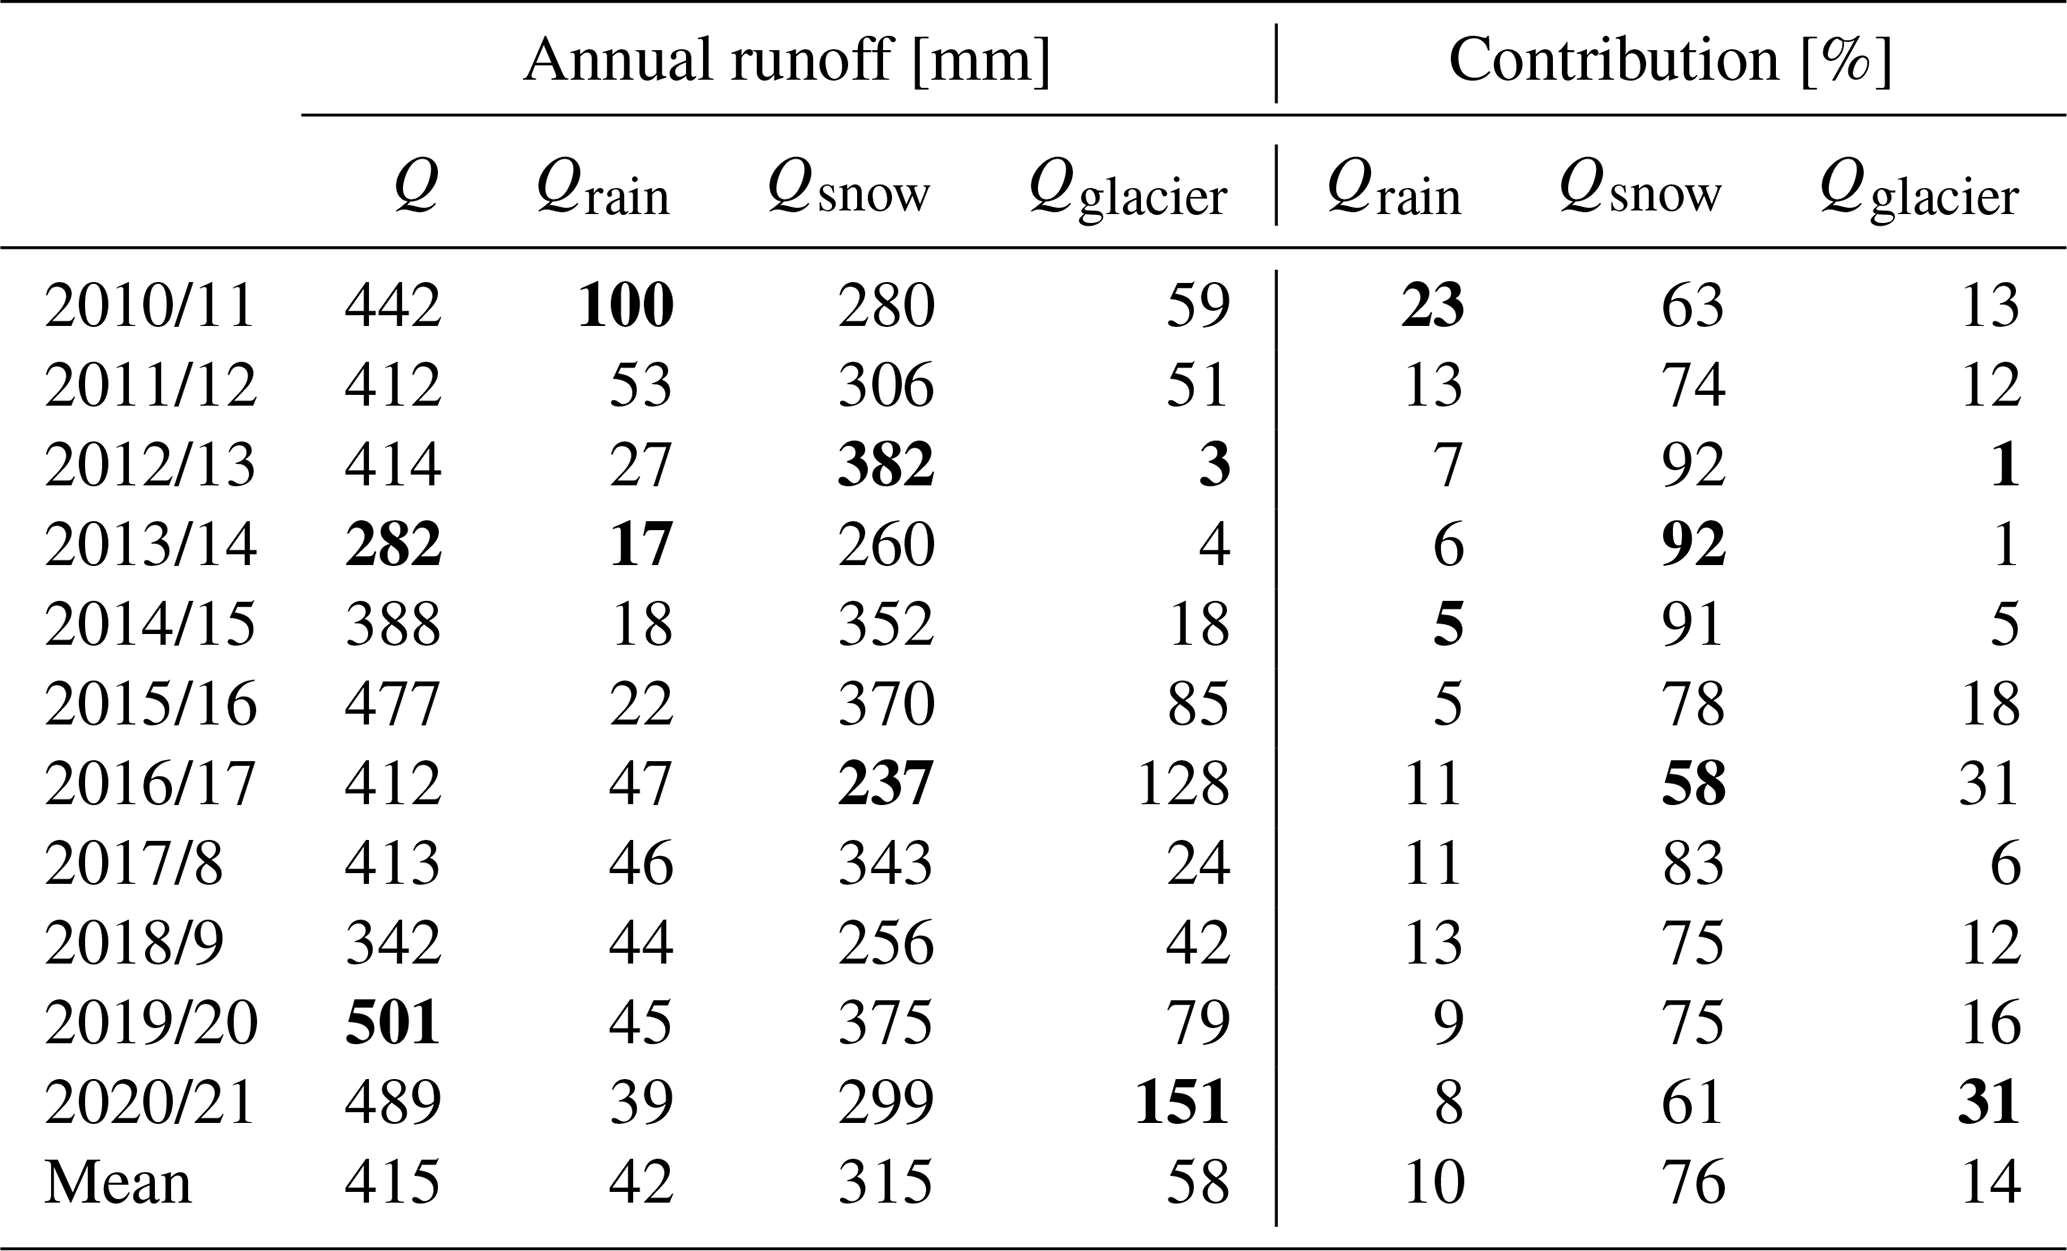
Table 3Annual Q, Qrain, Qsnow and Qglacier, and the contribution of Qrain, Qsnow and Qglacier to runoff. Minimum and maximum values are shown in bold.
3.4 Inter-annual runoff variability
Annual runoff varied between 282 and 501 mm during the period of 2010/11–2020/21 (Table 3). In 2013/14, the lowest annual runoff occurred due to a cold summer (as can be seen in Fig. 3), resulting in the lowest annual Qrain (17 mm), low annual Qsnow (260 mm), and almost no annual Qglacier (4 mm). The highest annual runoff was observed in 2019/20 as a result of the second-highest annual Qsnow (375 mm) combined with above-average Qrain (45 mm) and above-average Qglacier (79 mm).
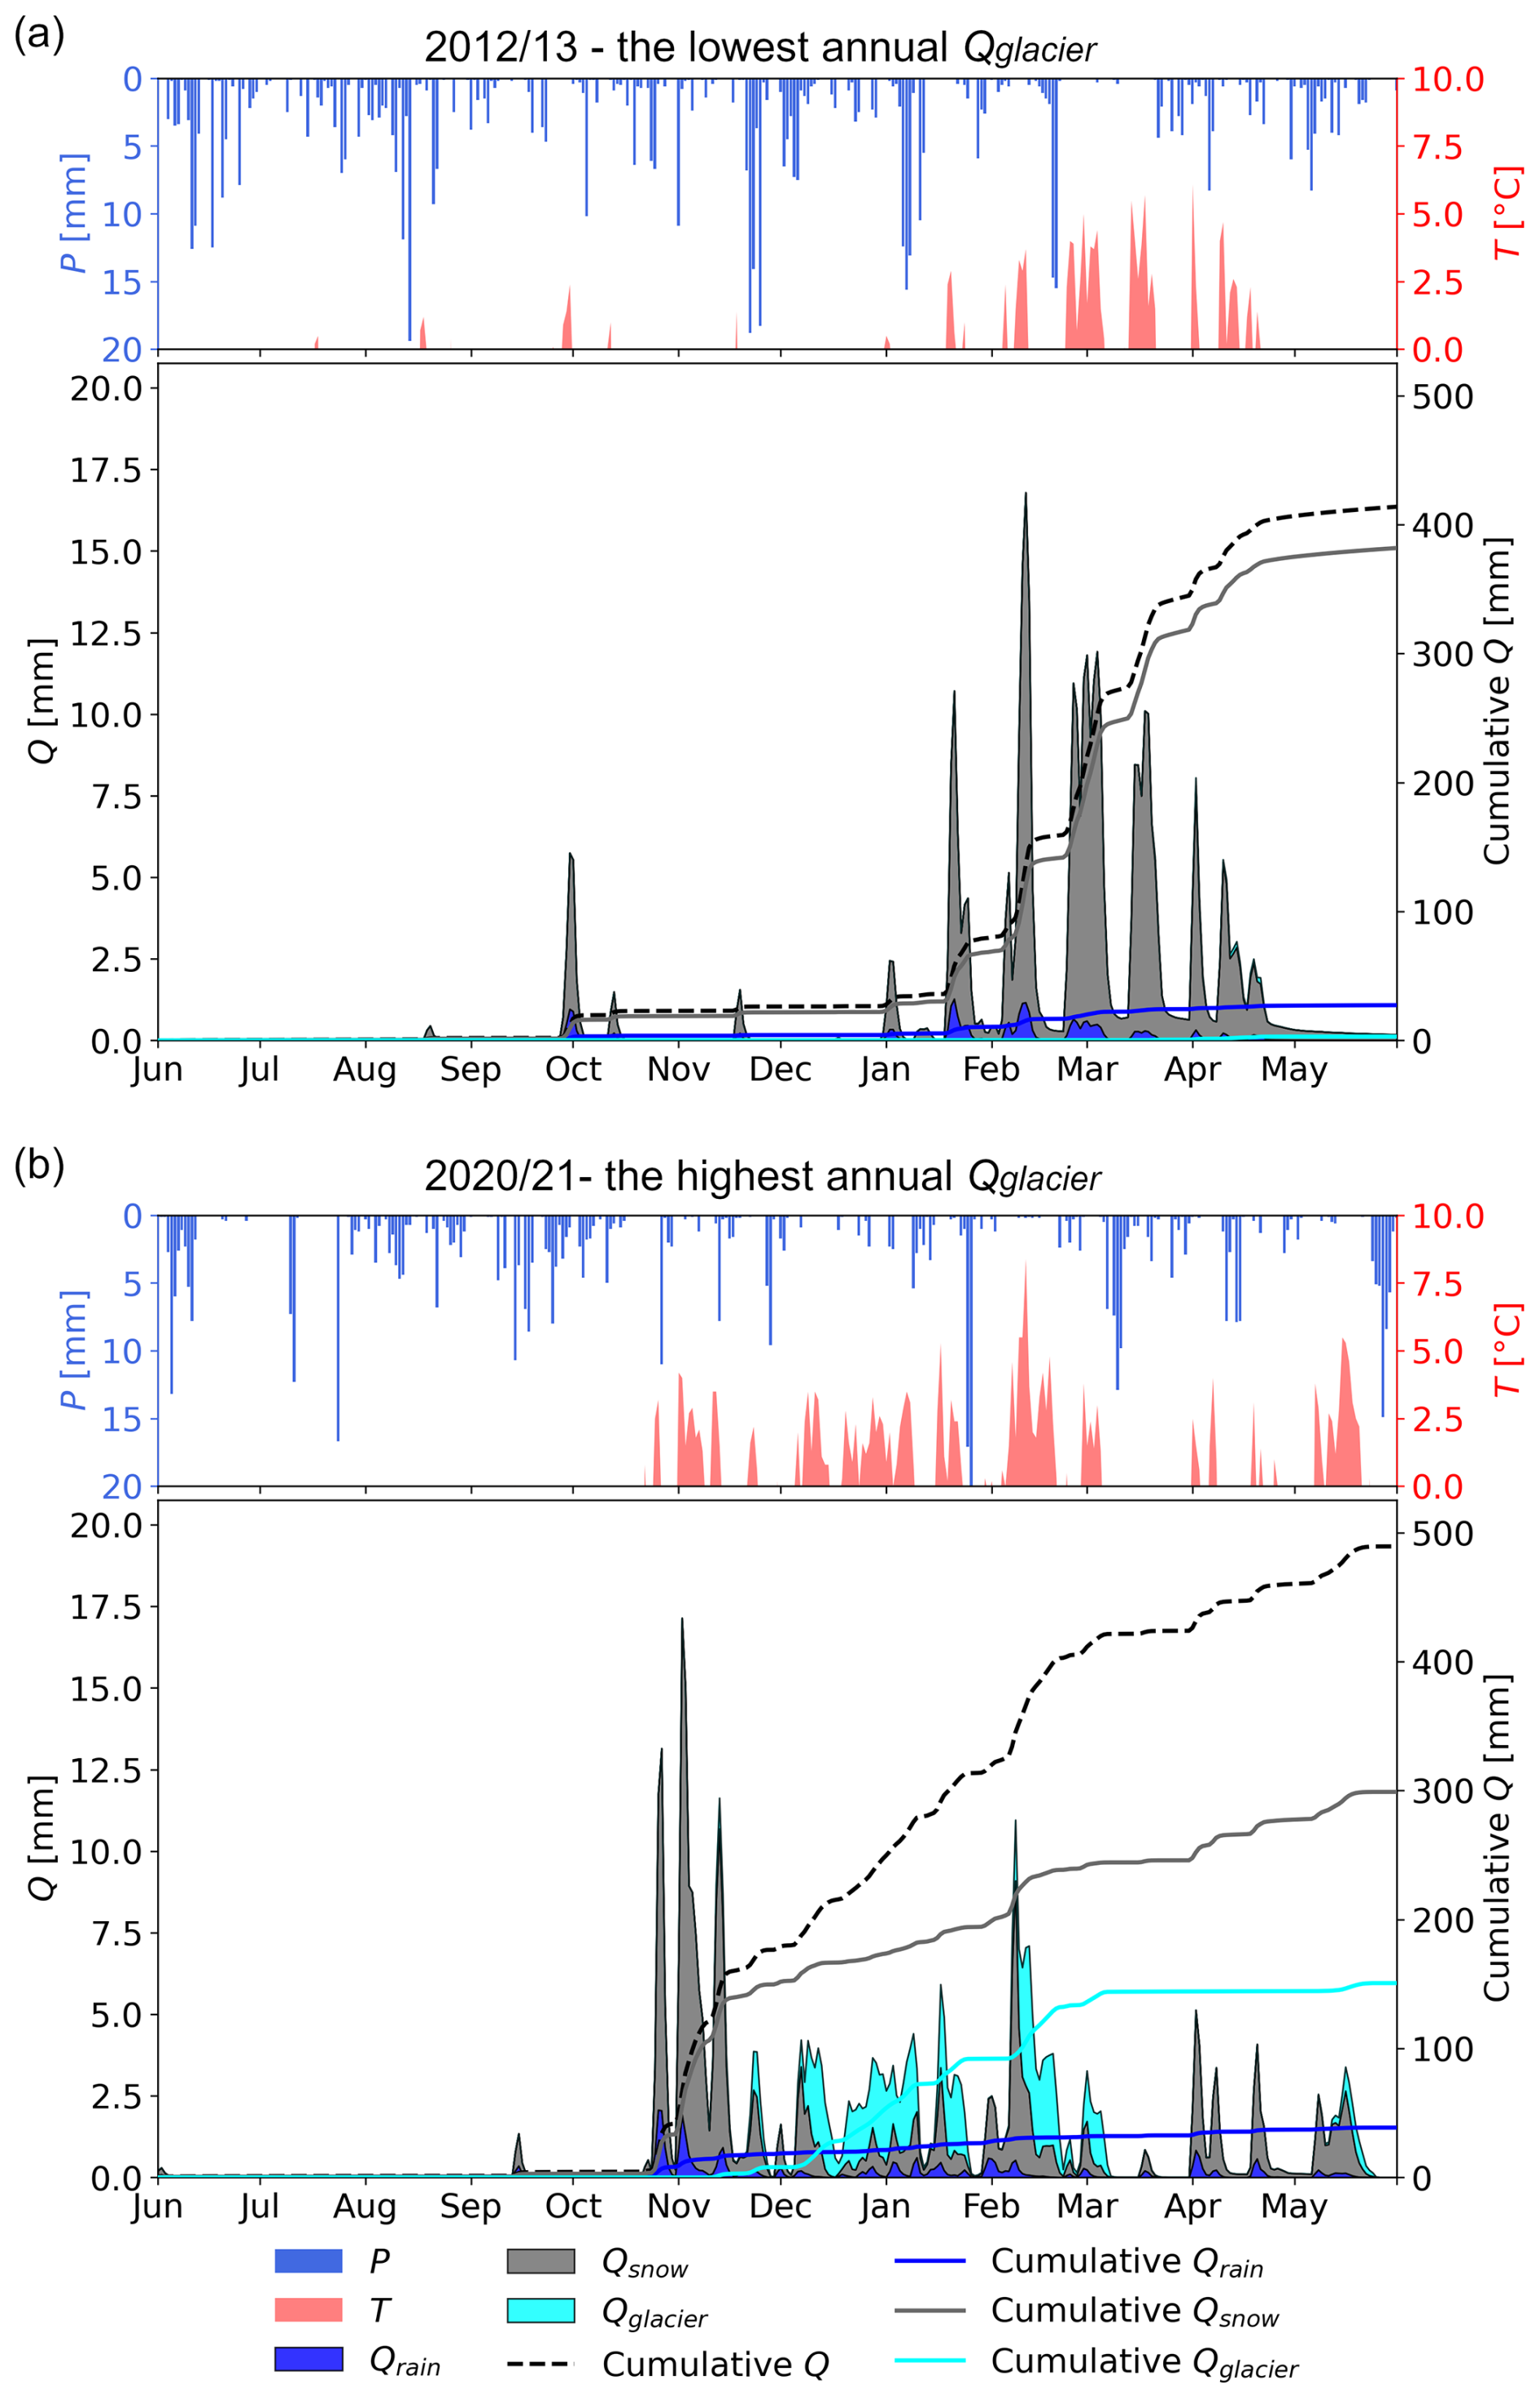
Figure 7Contribution of rainfall runoff (Qrain), snowmelt runoff (Qsnow) and glacier melt runoff (Qglacier) to total runoff (Q) during two selected years: (a) the year 2012/13 with the lowest annual glacier melt contribution and (b) the year 2020/21 with the highest glacier melt contribution.
The contributions of rainfall, snowmelt and glacier melt to runoff varied significantly from year to year. The lowest annual Qglacier occurred in the year 2012/13 (3 mm; Table 3), and the contribution to runoff was 1 % (Fig. 7a). Over this year, the highest annual Qsnow (382 mm) was observed. This was due to the cold beginning and middle of the summer, resulting in the largest snow accumulation during the observed period, which did not melt until the end of the summer (Fig. 4b). In both years 2012/13 and 2013/14, Qsnow contributed the most to the total runoff, accounting for 92 % of it.
The highest annual Qglacier (151 mm) occurred in 2020/21 (Table 3, Fig. 7b). This was due to the large number of days with high air temperature from November to May (72 d with positive daily air temperature from November to February), which caused the snow cover to melt-out earlier than in other years (Fig. 4b). In 2020/21, Qglacier accounted for 31 % of the annual runoff. Despite below-average annual Qrain and Qsnow, the annual runoff was the second-highest (489 mm) in 2020/21. In 2016/17, annual Qglacier also contributed 31 % to total runoff. This was due to the low snow accumulation during the winter (Fig. 4b), which caused the lowest annual Qsnow (237 mm).
In 2010/11, the highest annual Qrain occurred (100 mm; Table 3), which accounted for 23 % of the total annual runoff. This is an unusually high amount, as the second-highest annual Qrain was only about half of the previous year's amount (53 mm in 2011/12).
3.5 Seasonality in peak flows
In addition to examining the inter-annual variability of runoff, we analysed individual extreme runoff events and their causes. Most of the annual peak flows occurred from November to the first half of February. Only in 2013/14 did the annual peak occur at the start of October (Fig. 8). These annual peak flows were caused by different water sources contributing to the total runoff at different times. Annual peak flows were consistently associated with high Qsnow and occurred during the same runoff episode as the annual peak Qsnow, except in 2015/16. In that year, the annual peak runoff in January was due to a combination of the annual peak Qglacier and high Qsnow, while the annual peak Qsnow occurred in October.
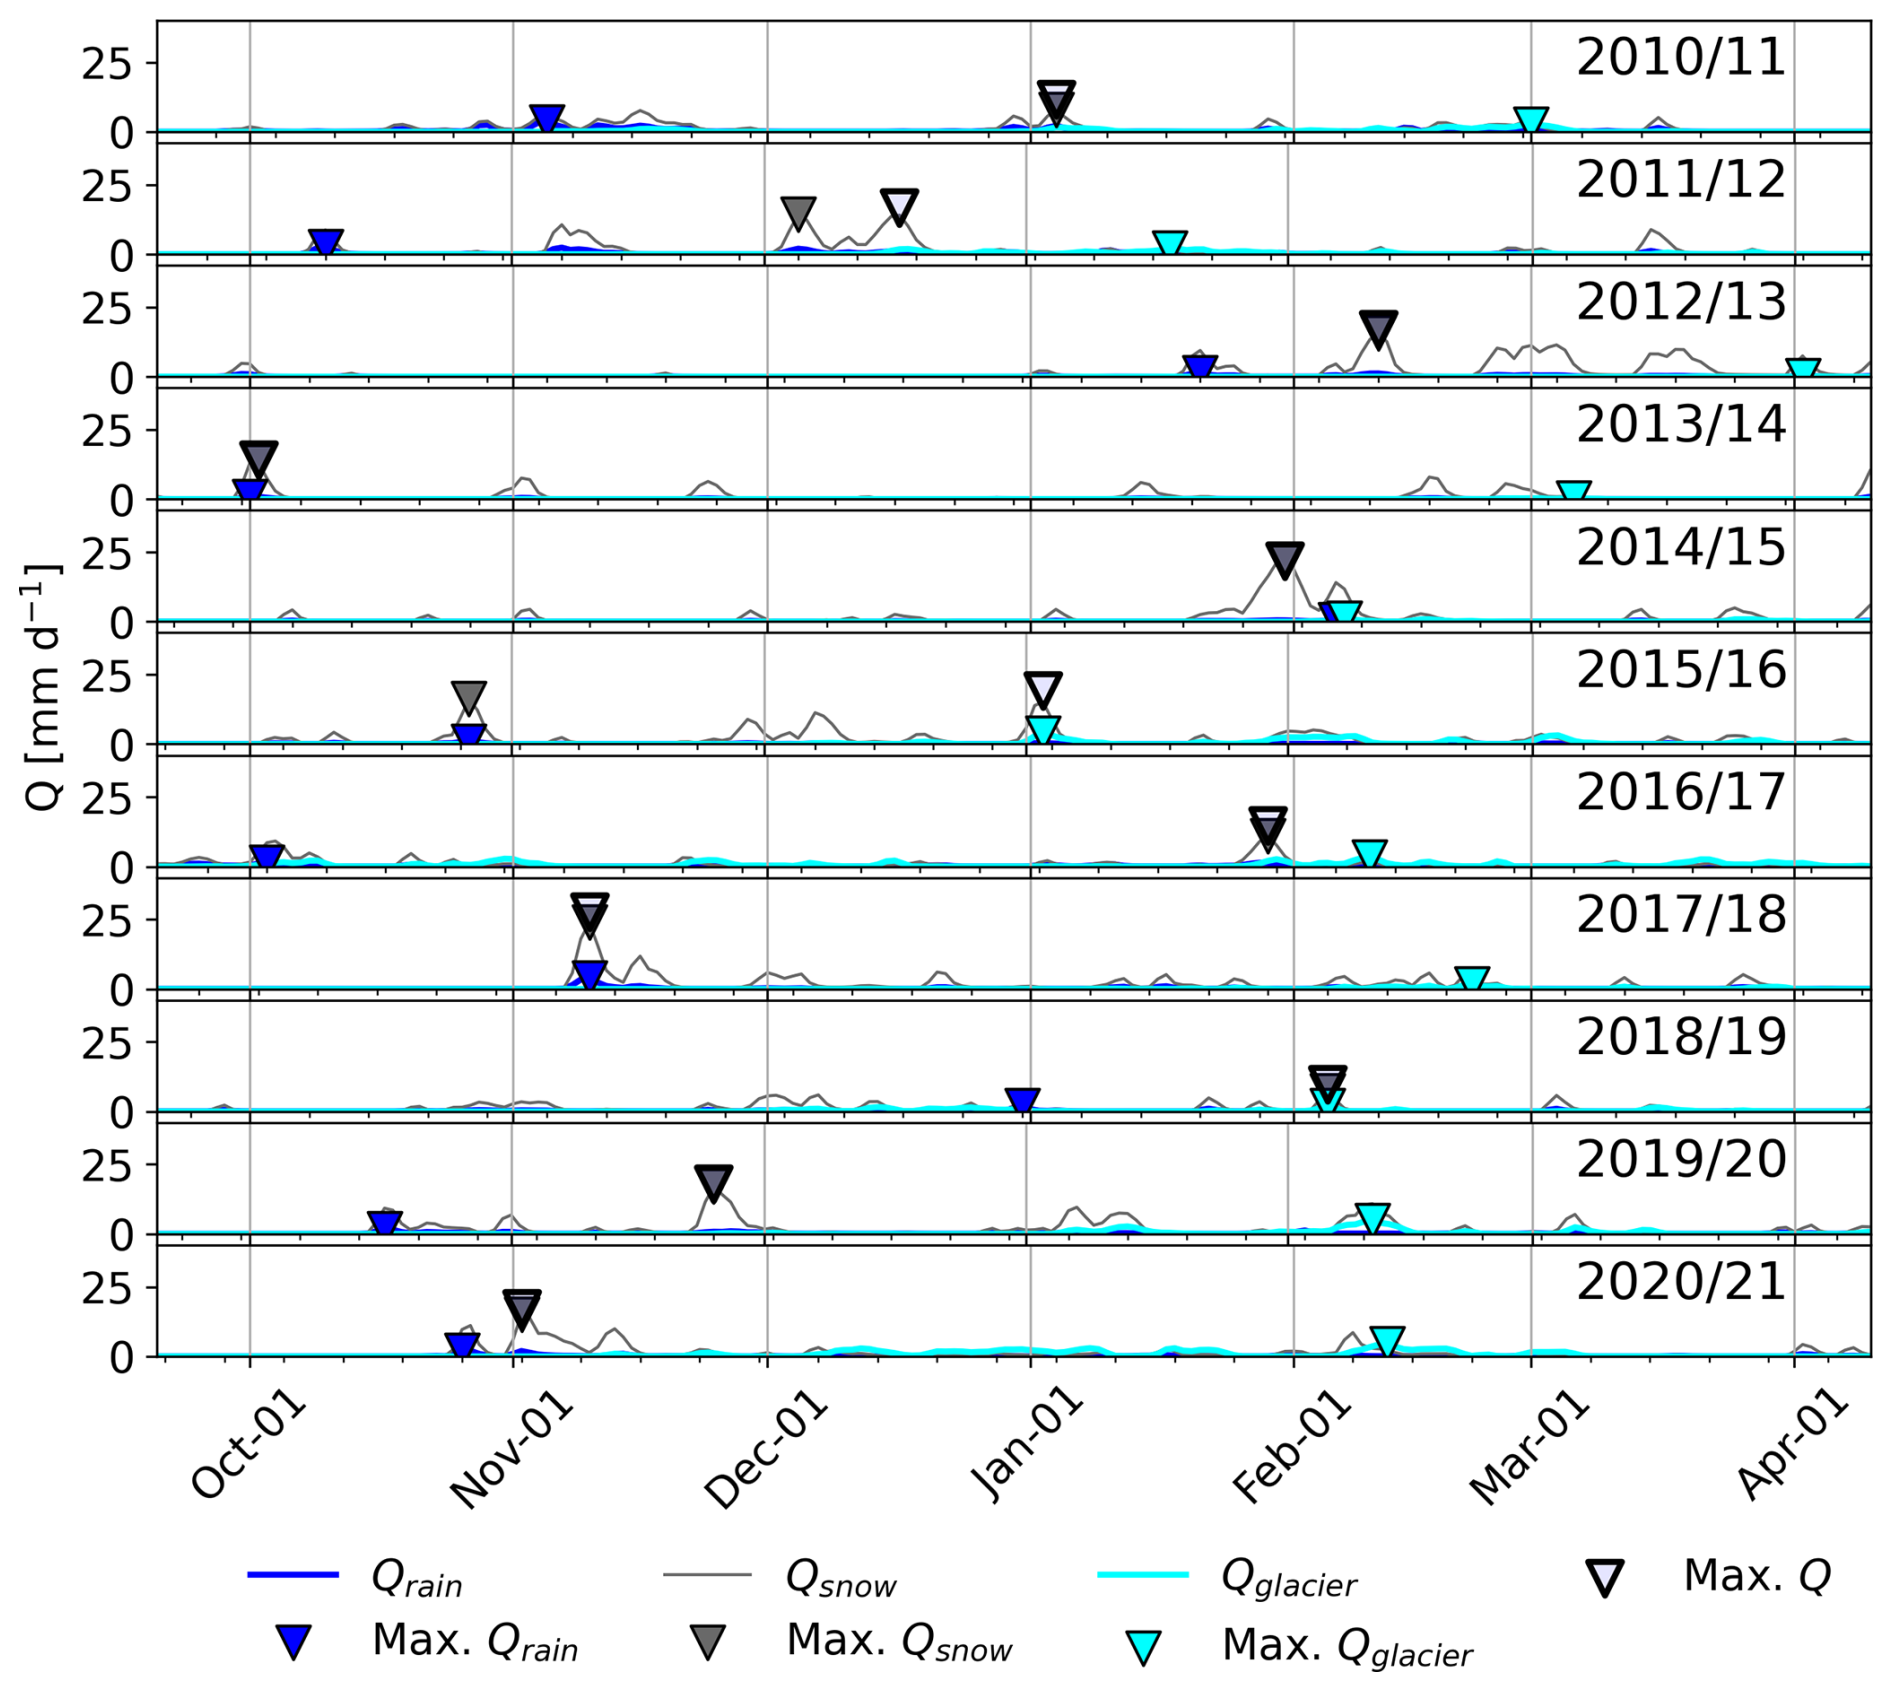
Figure 8Daily rainfall runoff (Qrain), snowmelt runoff (Qsnow), glacier melt runoff (Qglacier) (lines) and maximal values of Q, Qrain, Qsnow and Qglacier (triangles) for individual water years.
The annual peak Qrain typically occurs during October and November in most years. However, in 2012/13, 2014/15 and 2018/19, the annual peak Qrain occurred in January, February and December, respectively (Fig. 8). The annual Qglacier peak mostly occurred in February, except for January in 2011/12 and 2015/16 and April and March in 2012/13 and 2013/14, respectively (Fig. 8). However, in these two years (2012/13 and 2013/14), almost no Qglacier was observed (see Table 1).
3.6 Impact of climate on runoff variability
To identify the climatic factors that show the greatest impact on runoff variability, we conducted a correlation analysis. This analysis of climate and runoff characteristics showed strong positive correlations between annual Tpositive and annual Qglacier (rs = 0.82, p-value < 0.05; Fig. 9a). A weaker correlation was found between annual Tpositive and annual Q (rs = 0.68, p-value < 0.05) and between annual Qglacier and annual T (rs = 0.63; p-values < 0.05). Additionally, annual Qglacier showed a negative correlation with annual P (rs = −0.62, p-value < 0.05), and annual Q was similarly correlated with P but with lower statistical significance (rs = −0.6, p-value < 0.1). In contrast, neither annual Qrain nor annual Qsnow showed a significant correlation with annual T or annual P. Among the three runoff components, only annual Qglacier showed a significant correlation with total annual Q (rs = 0.59, p-value < 0.1), indicating that annual Qglacier strongly influences the variability of total annual runoff.
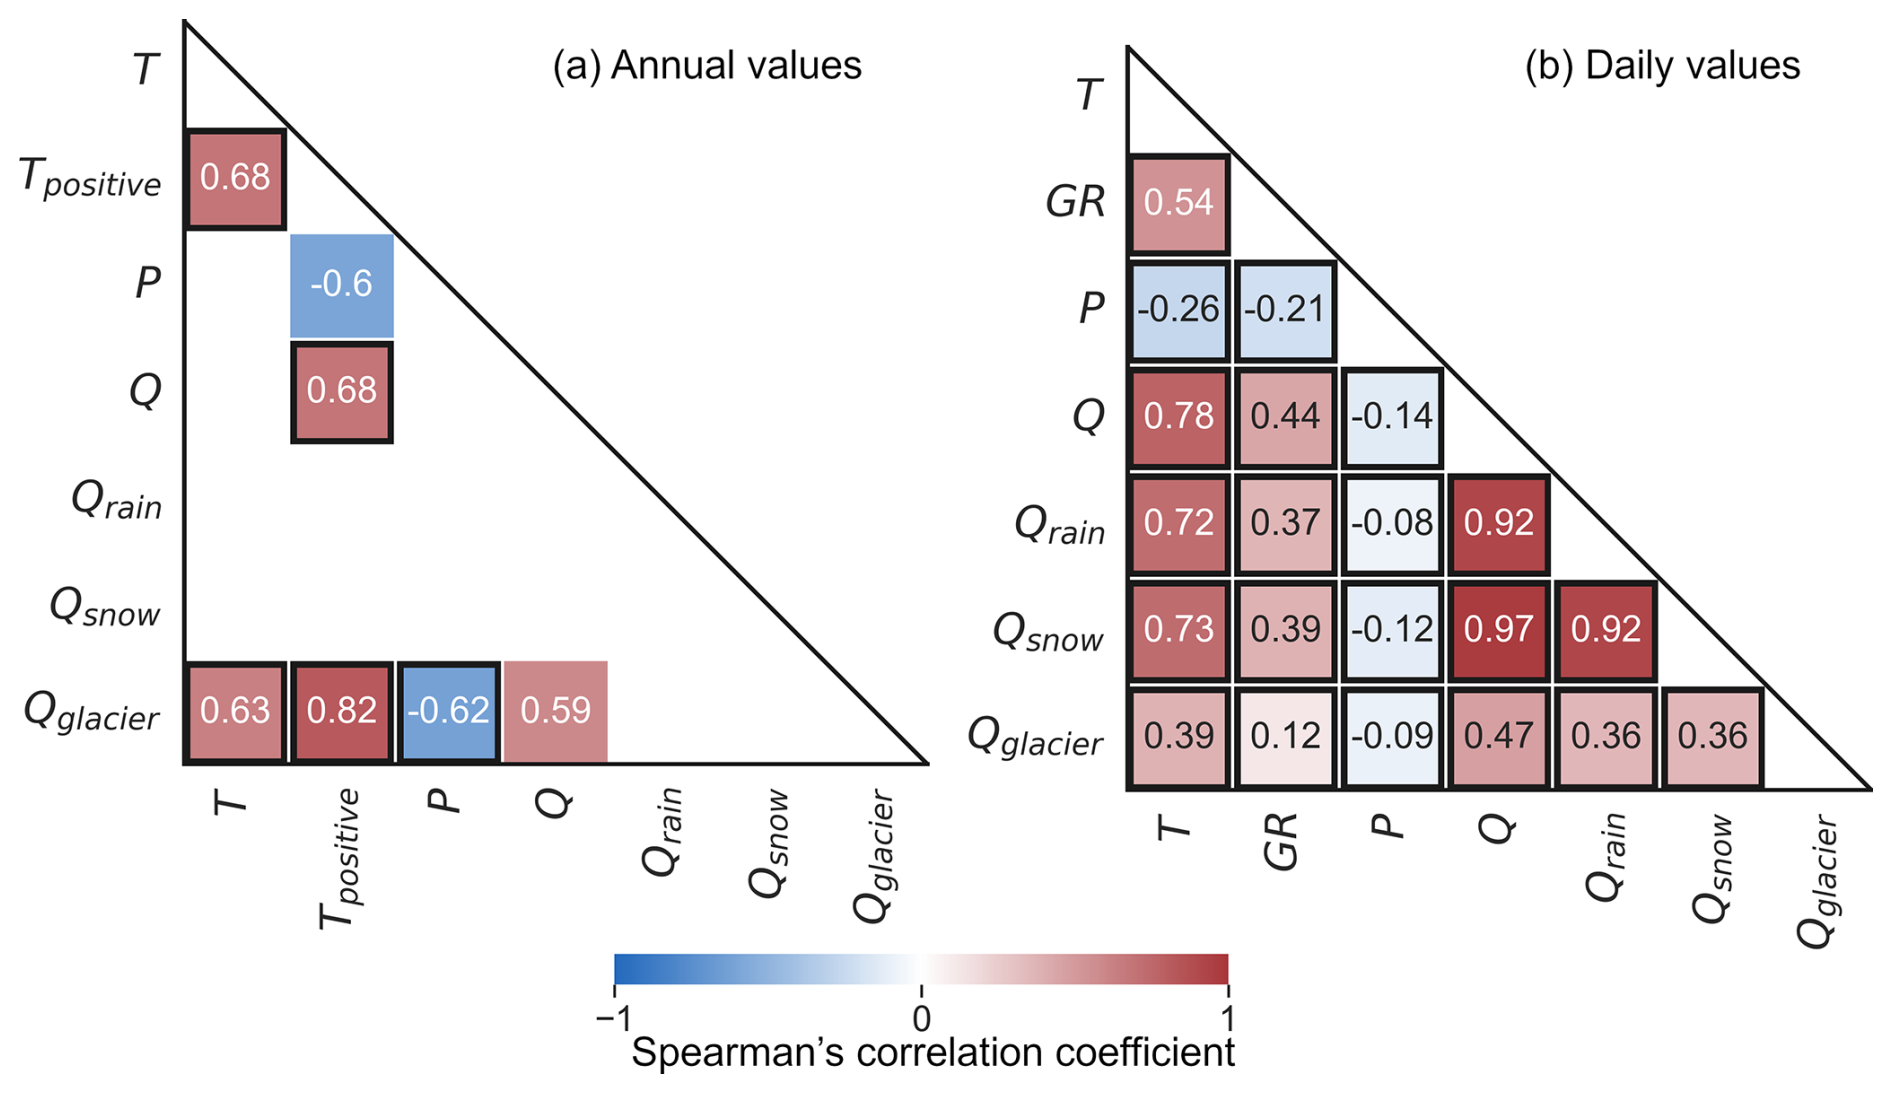
Figure 9Spearman's rank correlation coefficients for the selected meteorological and hydrological characteristics at the (a) annual and (b) daily level. The colours indicate the value of the Spearman's rank correlation coefficient. Only statistically significant correlations are shown; correlations with p-value < 0.1 are shown with a coloured rectangle without a border, and correlations with p-value < 0.05 have a black border. Correlations obtained using daily data (b) were calculated for the period from 1 January 2015 to 10 March 2018, which represents the intersection of the data available for the selected variables.
The correlation analysis for daily values was conducted on a subset of the data (from 1 January 2015 to 10 March 2018) for which measured global radiation was available. This analysis showed that daily Q, Qrain, Qsnow and Qglacier were more strongly correlated with daily air temperature (rs = 0.78, 0.72, 0.73, 0.39, respectively; p-values < 0.05) than with daily global radiation (rs = 0.44, 0.37, 0.39, 0.12, respectively; p-values < 0.05; Fig. 9b). A significant, although weak, negative correlation was found between daily runoff characteristics and daily precipitation (rs > −0.15; p-value < 0.05). All daily runoff components were strongly correlated with daily runoff. However, correlations involving Qglacier were much weaker than those associated with the other runoff components.
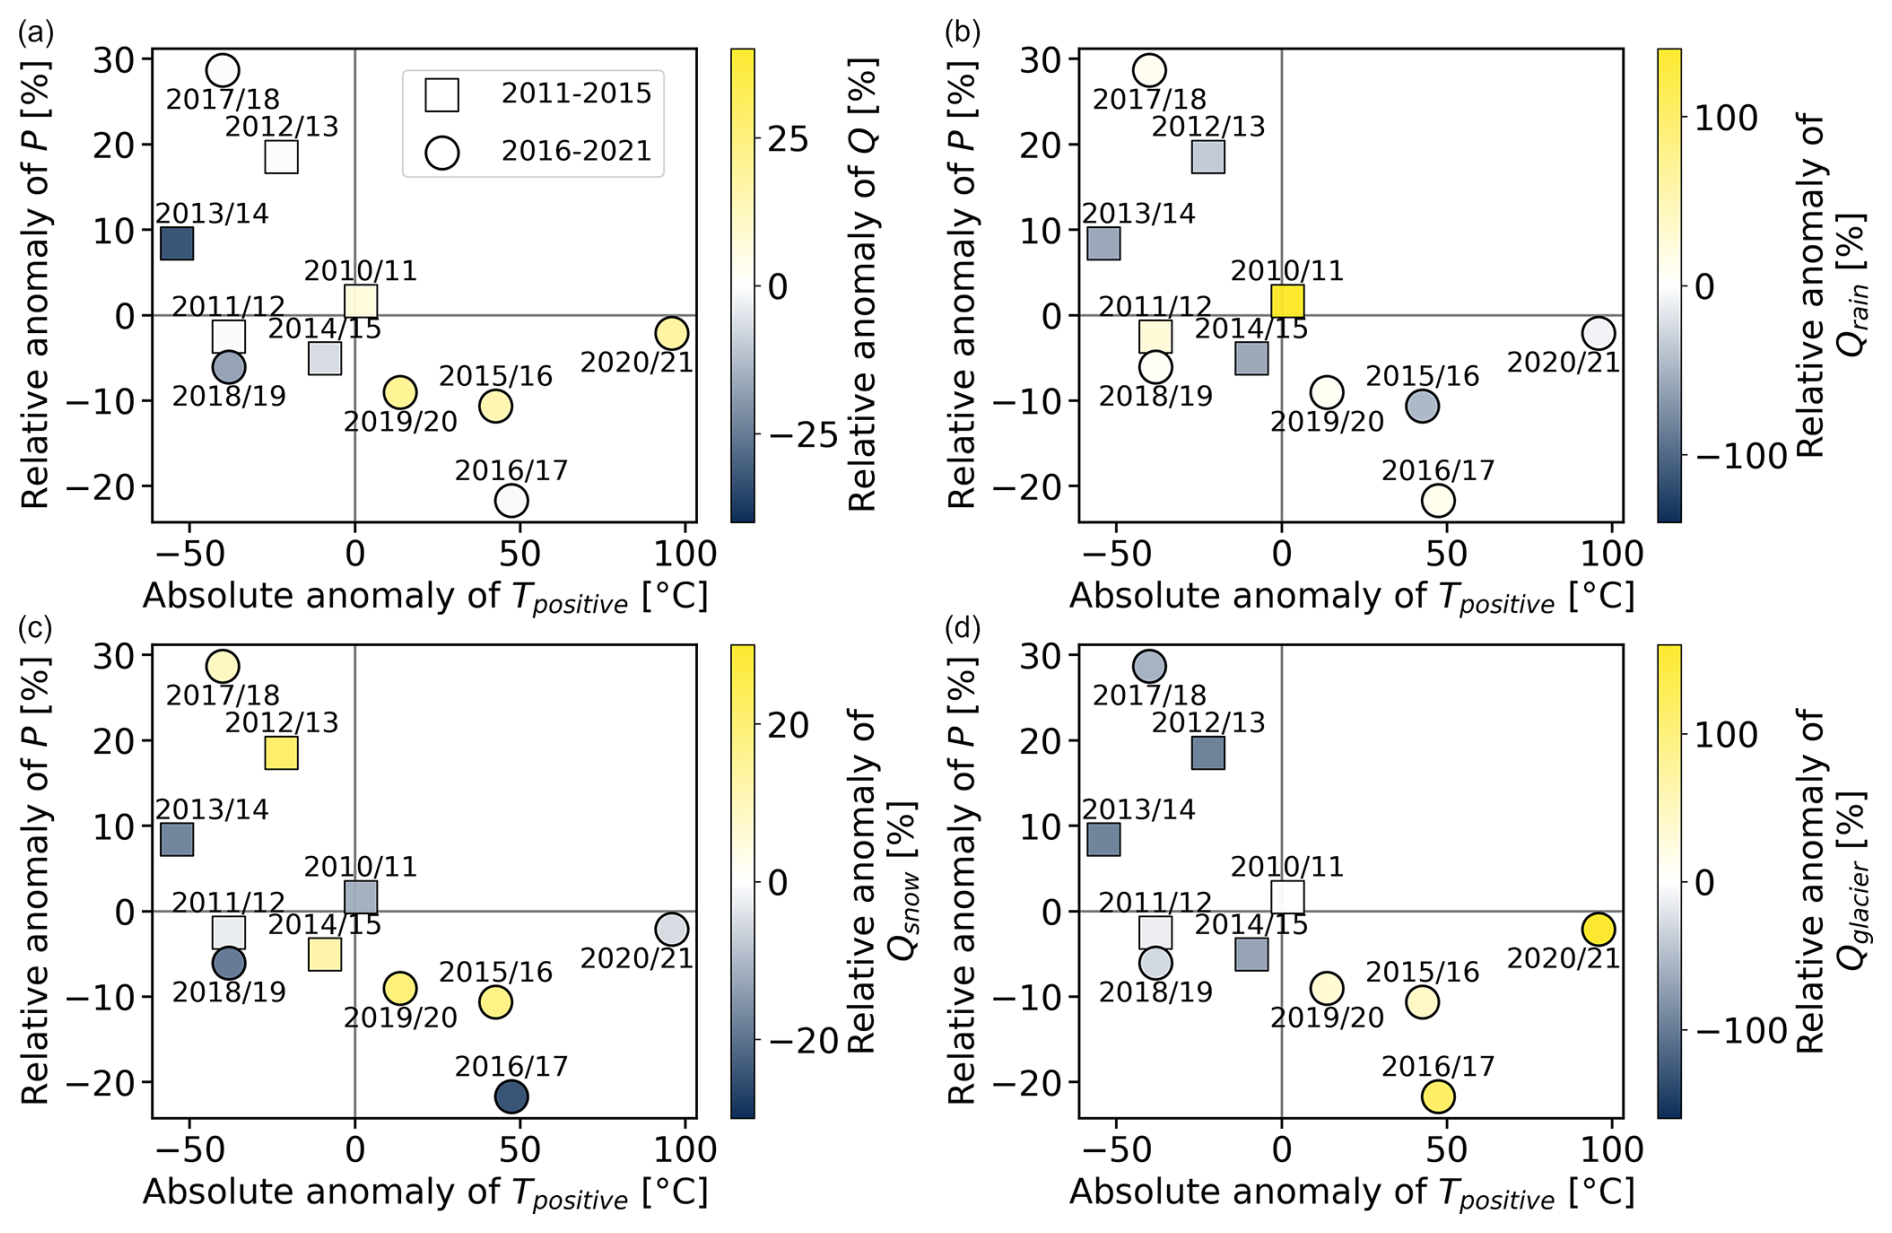
Figure 10Relationship between absolute anomaly of Tpositive, relative anomaly of P and relative anomaly of (a) mean annual runoff Q, (b) rainfall runoff Qrain, (c) snowmelt runoff Qsnow and (d) glacier melt runoff Qglacier for the years 2010/11–2014/15 (squares) and 2015/16–2020/21 (circles). Note that colour map ranges differ across panels.
To further shape the interpretation of the results of the correlation analysis, we investigated the relationships between the absolute anomaly of Tpositive and the relative anomalies of P and Q and the individual runoff components (Fig. 10).
Higher annual runoff occurred during warmer (positive anomaly of Tpositive) and drier (negative anomaly of precipitation) years (Fig. 10a). Such years rather occurred in the second half of the study period (circles in Fig. 10). The high annual runoff in these years was associated with the higher Qglacier (Fig. 10d). However, Qsnow and Qrain did not show the same behaviour as Q and Qglacier (Fig. 10b an c). All four years with above-average Q were among the five years with above-average Qglacier. However, only two (one) years with above-average Qsnow (Qrain) were also years with above-average Q.
Of the three runoff components, annual Qglacier had the highest inter-annual variability, with a coefficient of variation (CV) of 0.79. The second-highest CV was for annual Qrain (0.53). The CVs for Q and Qsnow were much lower (0.15 and 0.16, respectively). Inter-annual variations in total runoff are mostly caused by variations in annual Qglacier rather than variations in annual Qsnow, even though Qsnow is a dominant component of the total runoff.
4.1 Mass balance of Triangular Glacier
In their study, Engel et al. (2023) linked the changes in the Triangular Glacier mass balance to air temperature variability. The simulated mass balance of Triangular Glacier is generally consistent with the direct mass balance measurements by Engel et al. (2023), who reported a low melt rate between 2006 and 2014, followed by a period of large mass loss. The simulated mass balance of Triangular Glacier was negative in all water years except for 2012/12 and 2013/14. In water year 2014/15, the simulated balance was slightly negative (−1 mm; Fig. 3). However, if the year would be defined by dates of mass balance measurement, the simulated mass balance would be positive (20.25 mm; Fig. 2c), which is in agreement with Engel et al. (2023). The difference between the simulated and measured mass balance may be due to the location of the glacier on the leeward side of Lachman Crags, which has a significant effect on snow accumulation (Kavan et al., 2020).
The simulated mass balance variability from 2010/11 to 2013/14 corresponds well with the mass balance pattern of the nearby Whisky and Davis Dome glaciers, as described by Engel et al. (2018). Both of these glaciers had a positive balance in these years, except for 2011/12, which was the year with the highest simulated mass loss for Triangular Glacier from 2010/11 to 2013/14. Similar to Davis Dome, the simulated mass balance of the Triangular Glacier was also slightly negative in 2014/15, while Whisky Glacier had a positive balance in that year. However, in contrast to the positive mass balance for Davis Dome and Whisky Glacier, our simulation shows a negative mass balance in 2010/11.
4.2 Runoff regime
According to Kavan et al. (2023), seven studies have been devoted to measuring runoff in the Antarctic Peninsula area between 1991 and 2020 (Inbar, 1995; Kavan et al., 2017; Sziło and Bialik, 2017; Falk et al., 2018; Stott and Convey, 2021; Kavan, 2021; Kavan et al., 2023). For most of the studies, the duration of the measurements did not exceed 2 months. Only one study (Stott and Convey, 2021) measured for 78 d. The measurements were mostly made during January and February and sometimes also in March. Only one study (Stott and Convey, 2021) covered most of December. However, no study took measurements during September, October, November or May. Therefore, our results, which include 11 years of simulated daily runoff, provide valuable information, although they are subject to the uncertainties of modelling based on limited amounts of data.
The results showed that the flow season in the study catchment lasts from September to May, with snowmelt being the main contributor to runoff throughout the year. Based on the mean monthly runoff, the seasonal hydrograph may be characterised by two peaks (Fig. 6). The first peak, occurring in November, was mainly caused by snowmelt. The second and higher peak, occurring in February, was a result of a combination of snowmelt and glacier melt contributing to the runoff. In most years, the highest daily runoff was observed in January or February, and it was associated with peak Qsnow.
The occurrence of maximum runoff at the turn of January and February is in agreement with conclusions by Kavan et al. (2017), who measured streamflow in two proglacial streams near the Johann Gregor Mendel Station during the 2014/15 summer season (Fig. 1b). However, these results are limited to measurements of less than 2 months. Gooseff et al. (2007), based on long-term measurements in the McMurdo Dry Valleys, reported that peak flows occur at the beginning of the flow season. The reason for this finding may be that the total precipitation amount is lower than that for our study area, resulting in lower snow accumulation on glaciers and thus its earlier melt-out, causing the earlier initiation of glacier melt, which is the primary source of runoff. It is important to note that the flow season in the McMurdo Dry Valleys is shorter than that observed in the study area, with an average length of 70 d (Gooseff et al., 2007).
On King George Island, runoff variability is primarily driven by air temperature associated with snowmelt at the beginning of the season (Falk et al., 2018). This is because the climate is warmer, and the region experiences higher rainfall during the summer season compared to our study area. Towards the end of the summer season, runoff variability is driven by rain events. Of the three components, rain contributed the least to total runoff in our study catchment; however, an increase in rainfall frequency and intensity is expected in the future (Vignon et al., 2021).
The results showed high inter-annual variability of runoff mainly associated with glacier melt. The persistent mass loss of small land-terminating glaciers around the Antarctic Peninsula may lead to the depletion of water storage in catchments, and a larger dependency of runoff generation on seasonal snow cover will very likely lead to increased variability of runoff (Huss and Hock, 2018). This, in turn, can affect freshwater ecosystems, as runoff variability has a significant impact on both stream (Kohler et al., 2015; Gooseff et al., 2017) and lake (Obryk et al., 2016; Foreman et al., 2004) habitats by controlling nutrient transport and modulating water levels. In polar arid areas, long-term changes to the ecosystem can be caused by even short-term extreme events associated with high runoff (Fountain et al., 2016).
Glacier melt and associated high runoff also support sediment delivery to the ocean, providing the marine ecosystems with important minerals and nutrients (Hodson et al., 2017). The marine ecosystem is highly sensitive to changes in sediment loads (Sahade et al., 2015). Sediment transport is expected to increase in the near future due to rising air temperatures (Stott and Convey, 2021). There are several studies from the Antarctic Peninsula region analysing the amount of transported sediment, but none of them analysed a period longer than 3 months (Kavan et al., 2023). Our results, showing the variability of the runoff over 11 years, may improve the estimates of the amount of transported sediment.
4.3 Impact of climate on runoff variability
Higher total annual runoff was simulated in warmer and drier years with above-average Qglacier. Despite being the largest contributor to total runoff, Qsnow showed little inter-annual variability as the seasonal snow cover eventually melts each year.
Inter-annual variation in runoff was primarily influenced by variations in annual Qglacier, which showed considerably higher variability compared to annual Qsnow and annual Qrain. This increased variability in annual Qglacier resulted from its moderate dependence on annual temperature and annual precipitation and strong dependence on annual Tpositive. However, it should be noted that the analysis is based on a relatively short period of 11 years, which limited the variability of climate characteristics in individual years, such as sufficient cases of wet and warm years in the study period (see Fig. 10).
The relative contribution of snowmelt to total runoff was higher in years with relatively higher precipitation and lower air temperatures. This outcome was due to the fact that, in these years, more snow accumulated and therefore melted later in the season, leaving the glaciers snow-covered for most of the summer season and resulting in low glacier melt.
The correlation between daily runoff and daily Qglacier was weaker compared to other runoff components. The reason is that glacier melt in each elevation zone is simulated only in the case of the snow-free glacier. In contrast to snow and rain contributions, this resulted in a reduced number of days in the study period where Qglacier contributed to total runoff.
Additionally, Qglacier often follows after Qsnow; therefore, total runoff on a given day includes both Qglacier and Qsnow from that day (Qsnow comes from higher elevation zones where the snow is still present), as well as Qsnow from previous days, taking into account the response time simulated by the HBV response function. These factors cause the total runoff during glacier melt to be mixed from different water sources, resulting in a lower correlation coefficient between Qglacier and Q.
Mean daily runoff showed a stronger correlation with air temperature than with global radiation, which is consistent with the findings of Kavan et al. (2017) and Falk et al. (2018). Additionally, Kavan et al. (2017) reported a similarly strong relationship between ground temperature at a 5 cm depth and discharge in glacier-free catchments, which contrasts with the weak relationship between ground temperature and discharge in glaciated catchments reported by Falk et al. (2018).
4.4 Input data and hydrological modelling uncertainty
The modelling of the precipitation-runoff process is subject to uncertainties, which must be considered in the interpretation of the results. Uncertainties are mostly associated with the model structure and with the amount and accuracy of input and calibration data. Our study catchment is located in a very remote, poorly accessible region, where limited data are available for model calibration. For example, streamflow data are typically available only during the austral summer, when the polar station is in operation (Kavan et al., 2017; Kavan, 2021).
It must be noted that the model calibration and simulation were carried out on different data sets, which, except for air temperature, did not cover the whole study period, and in the case of precipitation, it was a fully modelled time series. The streamflow measurements were taken during only one summer season (8 February–15 March 2018) and may not fully represent the variability of streamflow during the whole study period. The glacier mass balance measurements were carried out in 2014–2020, which, in combination with the glacier volume measurements in 2015/16, gave us sufficient information for the model calibration period. However, the volume of Triangular Glacier at the start of the simulation in 2009/10 was estimated from a digital elevation model of the ice surface of Triangular Glacier in February 2006, assuming a constant change in glacier extent of −0.3 % per year, as stated in Engel et al. (2023) as the mean annual retreat rate between 2005/06 and 2014/15. For this reason, the uncertainty of the initial state of the glacier was introduced into the simulation.
Additionally, the streamflow measurements themselves are more uncertain than in more accessible regions because it is not possible to construct a standard gauge profile. Therefore, the measured profile (cross-section) may change during the measurement period, which additionally causes lower accuracy of the respective rating curve. Due to this constraint, the HBV model was chosen for the water balance components simulations, as it has been found, despite several limitations, to be suitable for simulating the runoff process in polar environments (Wawrzyniak et al., 2017; Osuch et al., 2019, 2022). Additionally, it has been repeatedly tested in catchments where only very short or episodic streamflow time series are available or even single measurements exist (e.g. Seibert and McDonnell 2015, Pool et al. 2017). The HBV model structure is rather simple compared to physically based models, but it has been shown to achieve better results than more complex models (Seibert and Bergström, 2022; Girons Lopez et al., 2020). However, a limitation of the HBV for modelling runoff in polar regions is that it does not include soil thermal processes (Bui et al., 2020).
Another possible source of uncertainty is the WRF-modelled precipitation. However, when compared to observations in summer 2021/2022, this model performed very well (Matějka et al., 2022). The model was validated using four nested domains in resolutions 8100, 2700, 900 and 300 m. For all domains, the bias for cumulative precipitation from 2 January 2022 to 26 February 2022 reached −16 % to −1 % with the Spearman's rank correlation coefficient for daily amounts of 0.86 to 0.87. This result suggests a relatively low sensitivity of simulated precipitation accuracy to model resolution in contrast to, e.g. wind speed in complex terrain (Matějka and Láska, 2022). The impact of the WRF model resolution on simulated precipitation in the Antarctic Peninsula region was also discussed by Pishniak and Beznoshchenko (2020).
The above data limitations may be partially overcome by calibrating the model against multiple components of the runoff process, leading to better overall performance (Konz and Seibert, 2010; Finger et al., 2015; Nedelcev and Jenicek, 2021). In the case of our study catchment, the HBV model was calibrated against both runoff and glacier mass balance. In addition, simulated SWE correlated well with estimated SWE (Fig. 2d). All of the above procedures reduced model uncertainty and increased overall model performance and reliability (van Tiel et al., 2020).
The degree-day factor for snow is one of the model parameters; thus, it was calibrated. Before the calibration, the upper and lower limits were applied to ensure that the parameter is physically relevant. After the automatic calibration, a fine-tuning of the degree-day factor was performed to prevent an unrealistic increase in snow storage over the study period (so-called “snow towers”). The final median values resulting from 100 calibration runs were 6.01 (non-glaciated areas) and 2.23 (snow over the glaciers); the median value of TT was −0.21 °C.
Another source of uncertainty in our study is not considering the Lachman Crags ice cap in the hydrological modelling, although a part of the glacier is located in the highest part of the study catchment at elevations above 500 Unfortunately, there are no measurements of the mass balance of this glacier. Because we did not consider this glacier in the hydrological model, only snow accumulation and snowmelt were simulated from this part of the catchment. This could lead to an underestimation of Qglacier. However, we assume the overall influence of the glacier on the total catchment water balance as negligible because our model did not simulate any glacier melt above an elevation of 350 (results not shown).
We simulated water balance and daily runoff in a small partly glaciated catchment on James Ross Island over the period 2010/11–2020/21. Specifically, we analysed the inter-annual variability of glacier, snow and rain contributions to total runoff. The main findings are given in the following points.
The mean annual runoff for the study period from June 2010 to May 2021 simulated by the HBV model was 415 mm, the mean annual evapotranspiration was 7 mm and the mean annual precipitation was 369 mm. The water budget is largely influenced by the negative mass balance of Triangular Glacier (for 9 of 11 years), with an average annual mass loss of −50 mm WE. About 76 % of runoff originates from snow cover, 14 % from glaciers and only 10 % from rainfall.
The majority (92 %) of annual runoff occurred between October and May, with the highest mean monthly runoff occurring in the second half of summer due to a combination of glacier melt and snowmelt. Additionally, high runoff was found in November due to the rapid melting of the seasonal snow cover. In all months, Qsnow was the dominant contributor to runoff.
Of the three runoff components, only annual Qglacier was significantly correlated with annual T and P. Annual Qglacier also had the highest variability and was the only component significantly correlated with total annual Q, indicating its importance for inter-annual runoff variability.
The contribution of snowmelt to total runoff was higher in colder years with more precipitation (mostly snowfall), while glacier melt contributed more during warmer years with overall less precipitation.
Overall, the results showed that runoff on James Ross Island is highly variable from year to year. The main driver of this variability was the variability in air temperature, which affected the variation in annual glacier runoff more than annual snowmelt runoff. Our simulation showed the presence of runoff-generating events outside the usual summer runoff measurement season (January-March). These warm events contribute significantly to the total annual runoff and are usually omitted in conventional observational studies that cover only the peak melt season.
The HBV model outputs were published as an open data set (https://doi.org/10.5281/zenodo.11001370, Nedělčev et al., 2024).
MJ and ON designed the study; ON performed hydrological modelling and analysed the data; MM performed meteorological modelling; KL, ZE and JK provided meteorological, glaciological and hydrological data; ON and MJ wrote the manuscript draft; MM, KL, ZE and JK reviewed and edited the manuscript.
The contact author has declared that none of the authors has any competing interests.
Publisher's note: Copernicus Publications remains neutral with regard to jurisdictional claims made in the text, published maps, institutional affiliations, or any other geographical representation in this paper. While Copernicus Publications makes every effort to include appropriate place names, the final responsibility lies with the authors.
Support from the Czech Science Foundation (project no. 20-20240S) and from the Johannes Amos Comenius Programme (P JAC), project No. CZ.02.01.01/00/22_008/0004605, are gratefully acknowledged. This work was additionally supported by the Ministry of Education, Youth and Sports of the Czech Republic (e-INFRA CZ; ID: 90254) and Masaryk University project MUNI/A/1469/2023. Many thanks are due to Jan Seibert and Marc Vis from the University of Zurich for providing valuable consultations and feedback regarding the HBV model calibration and evaluation and to Tracy Ewen for improving the language. We also thank the crew of Johann Gregor Mendel Station for the extensive fieldwork support and EMS Brno (Czechia) for the long-term support and advice in meteorological measuring systems. Finally, we thank the associated editor Kang Yang, reviewer Rijan Bhakta Kayastha and two anonymous reviewers for handling the manuscript and providing valuable feedback.
This research has been supported by the Grantová Agentura České Republiky (grant no. 20-20240S); the Ministerstvo Školství, Mládeže a Tělovchovy (grant no. CZ.02.01.01/00/22_008/0004605); the Ministerstvo Školství, Mládeže a Tělovchovy (grant no. 90254); and Masaryk University (grant no. MUNI/A/1469/2023).
This paper was edited by Kang Yang and reviewed by Rijan Kayastha and two anonymous referees.
Abram, N. J., Mulvaney, R., Wolff, E. W., Triest, J., Kipfstuhl, S., Trusel, L. D., Vimeux, F., Fleet, L., and Arrowsmith, C.: Acceleration of snow melt in an Antarctic Peninsula ice core during the twentieth century, Nat. Geosci., 6, 404–411, https://doi.org/10.1038/ngeo1787, 2013.
Ambrozova, K., Laska, K., Hrbacek, F., Kavan, J., and Ondruch, J.: Air temperature and lapse rate variation in the ice-free and glaciated areas of northern James Ross Island, Antarctic Peninsula, during 2013–2016, Int. J. Climatol., 39, 643–657, https://doi.org/10.1002/joc.5832, 2019.
Bozkurt, D., Bromwich, D. H., Carrasco, J., and Rondanelli, R.: Temperature and precipitation projections for the Antarctic Peninsula over the next two decades: contrasting global and regional climate model simulations, Clim. Dynam., 56, 3853–3874, https://doi.org/10.1007/s00382-021-05667-2, 2021.
Braeckman, U., Pasotti, F., Hoffmann, R., Vázquez, S., Wulff, A., Schloss, I. R., Falk, U., Deregibus, D., Lefaible, N., Torstensson, A., Al-Handal, A., Wenzhöfer, F., and Vanreusel, A.: Glacial melt disturbance shifts community metabolism of an Antarctic seafloor ecosystem from net autotrophy to heterotrophy, Commun. Biol., 4, 1–11, https://doi.org/10.1038/s42003-021-01673-6, 2021.
Bui, M. T., Lu, J., and Nie, L.: A review of hydrological models applied in the permafrost-dominated Arctic region, Geosciences, 10, 1–27, https://doi.org/10.3390/geosciences10100401, 2020.
Carrasco, J. F. and Cordero, R.: Analyzing Precipitation Changes in the Northern Tip of the Antarctic Peninsula during the 1970–2019 Period, 11, 1270, https://doi.org/10.3390/atmos11121270, 2020.
Carrasco, J. F., Bozkurt, D., and Cordero, R. R.: A review of the observed air temperature in the Antarctic Peninsula. Did the warming trend come back after the early 21st hiatus?, Polar Sci., 28, 100653, https://doi.org/10.1016/j.polar.2021.100653, 2021.
Chinn, T. and Mason, P.: The first 25 years of the hydrology of the Onyx River, Wright Valley, Dry Valleys, Antarctica, Polar Rec., 52, 16–65, https://doi.org/10.1017/S0032247415000212, 2016.
Chuter, S. J., Zammit-Mangion, A., Rougier, J., Dawson, G., and Bamber, J. L.: Mass evolution of the Antarctic Peninsula over the last 2 decades from a joint Bayesian inversion, The Cryosphere, 16, 1349–1367, https://doi.org/10.5194/tc-16-1349-2022, 2022.
Cook, A. J., Fox, A. J., Vaughan, D. G., and Ferrigno, J. G.: Retreating glacier fronts on the Antarctic Peninsula over the past half-century, Science, 308, 541–544, https://doi.org/10.1126/science.1104235, 2005.
Czech Geological Survey: James Ross Island – Northern Part, topographic map 1:25 000, Czech Geological Survey, ISBN 978-80-7075-734-5, 2009.
Doran, P. T., McKay, C. P., Clow, G. D., Dana, G. L., Fountain, A. G., Nylen, T., and Lyons, W. B.: Valley floor climate observations from the McMurdo dry valleys, Antarctica, 1986–2000, J. Geophys. Res.-Atmos., 107, ACL 13-1–ACL 13-12, https://doi.org/10.1029/2001JD002045, 2002.
Engel, Z., Láska, K., Nývlt, D., and Stachoň, Z.: Surface mass balance of small glaciers on James Ross Island, north-eastern Antarctic Peninsula, during 2009–2015, J. Glaciol., 64, 349–361, https://doi.org/10.1017/jog.2018.17, 2018.
Engel, Z., Láska, K., Kavan, J., and Smolíková, J.: Persistent mass loss of Triangular Glacier, James Ross Island, north-eastern Antarctic Peninsula, J. Glaciol., 69, 27–39, https://doi.org/10.1017/jog.2022.42, 2023.
Falk, U., Silva-Busso, A., and Pölcher, P.: A simplified method to estimate the run-off in Periglacial Creeks: A case study of King George Islands, Antarctic Peninsula, Philos. T. R. Soc. A, 376, 20170166, https://doi.org/10.1098/rsta.2017.0166, 2018.
Finger, D., Vis, M., Huss, M., and Seibert, J.: The value of multiple data set calibration versus model complexity for improving the performance of hydrological models in mountain catchments, Water Resour. Res., 51, 1939–1958, https://doi.org/10.1002/2014WR015712, 2015.
Foreman, C. M., Wolf, C. F., and Priscu, J. C.: Impact of episodic warming events on Dry Valley lakes and processes, Aquat. Geochem., 10, 239–268, 2004.
Fountain, A. G., Nylen, T. H., Monaghan, A., Basagic, J., and Bromwich, D.: Snow in the McMurdo Dry Valleys, Antarctica, Int. J. Climatol., 642, 633–642, https://doi.org/10.1002/joc.1933, 2010.
Fountain, A. G., Saba, G., Adams, B., Doran, P., Fraser, W., Gooseff, M., Obryk, M., Priscu, J. C., Stammerjohn, S., and Virginia, R. A.: The Impact of a Large-Scale Climate Event on Antarctic Ecosystem Processes, Bioscience, 66, 848–863, https://doi.org/10.1093/biosci/biw110, 2016.
Girons Lopez, M., Vis, M. J. P., Jenicek, M., Griessinger, N., and Seibert, J.: Assessing the degree of detail of temperature-based snow routines for runoff modelling in mountainous areas in central Europe, Hydrol. Earth Syst. Sci., 24, 4441–4461, https://doi.org/10.5194/hess-24-4441-2020, 2020.
González-Herrero, S., Barriopedro, D., Trigo, R. M., López-Bustins, J. A., and Oliva, M.: Climate warming amplified the 2020 record-breaking heatwave in the Antarctic Peninsula, Commun. Earth Environ., 3, 1–9, https://doi.org/10.1038/s43247-022-00450-5, 2022.
Gooseff, M. N., McKnight, D. M., Doran, P. T., and Lyons, W. B.: Trends in discharge and flow season timing of the Onyx River, Wright Valley, Antarctica since 1969., Int. Symp. Antarct. Earth Sci., Santa Barbara, California, USA, 26 August–1 September 2007, SRP 088, https://doi.org/10.3133/ofr20071047SRP088, 2007.
Gooseff, M. N., Barrett, J. E., Adams, B. J., Doran, P. T., Fountain, A. G., Lyons, W. B., McKnight, D. M., Priscu, J. C., Sokol, E. R., Takacs-Vesbach, C., Vandegehuchte, M. L., Virginia, R. A., and Wall, D. H.: Decadal ecosystem response to an anomalous melt season in a polar desert in Antarctica, Nat. Ecol. Evol., 1, 1334–1338, https://doi.org/10.1038/s41559-017-0253-0, 2017.
Gooseff, M. N., McKnight, D. M., Doran, P. T., and Fountain, A.: Long-term stream hydrology and meteorology of a Polar Desert, the McMurdo Dry Valleys, Antarctica, Hydrol. Process., 36, 1–5, https://doi.org/10.1002/hyp.14623, 2022.
Gorodetskaya, I. V, Durán-alarcón, C., González-herrero, S., Clem, K. R., Zou, X., Rowe, P., Imazio, P. R., Campos, D., Santos, C. L., Dutrievoz, N., and Wille, J. D.: Record-high Antarctic Peninsula temperatures and surface melt in February 2022: a compound event with an intense atmospheric river, npj Clim. Atmos. Sci., 6, 202, https://doi.org/10.1038/s41612-023-00529-6, 2023.
Gupta, H. V., Kling, H., Yilmaz, K. K., and Martinez, G. F.: Decomposition of the mean squared error and NSE performance criteria: Implications for improving hydrological modelling, J. Hydrol., 377, 80–91, https://doi.org/10.1016/j.jhydrol.2009.08.003, 2009.
Gutt, J., Isla, E., Xavier, J. C., Adams, B. J., Ahn, I. Y., Cheng, C. H. C., Colesie, C., Cummings, V. J., di Prisco, G., Griffiths, H., Hawes, I., Hogg, I., McIntyre, T., Meiners, K. M., Pearce, D. A., Peck, L., Piepenburg, D., Reisinger, R. R., Saba, G. K., Schloss, I. R., Signori, C. N., Smith, C. R., Vacchi, M., Verde, C., and Wall, D. H.: Antarctic ecosystems in transition – life between stresses and opportunities, Biol. Rev., 96, 798–821, https://doi.org/10.1111/brv.12679, 2021.
Hersbach, H., Bell, B., Berrisford, P., Hirahara, S., Horányi, A., Muñoz-Sabater, J., Nicolas, J., Peubey, C., Radu, R., Schepers, D., Simmons, A., Soci, C., Abdalla, S., Abellan, X., Balsamo, G., Bechtold, P., Biavati, G., Bidlot, J., Bonavita, M., De Chiara, G., Dahlgren, P., Dee, D., Diamantakis, M., Dragani, R., Flemming, J., Forbes, R., Fuentes, M., Geer, A., Haimberger, L., Healy, S., Hogan, R. J., Hólm, E., Janisková, M., Keeley, S., Laloyaux, P., Lopez, P., Lupu, C., Radnoti, G., de Rosnay, P., Rozum, I., Vamborg, F., Villaume, S., and Thépaut, J. N.: The ERA5 global reanalysis, Q. J. Roy. Meteor. Soc., 146, 1999–2049, https://doi.org/10.1002/qj.3803, 2020.
Hodson, A., Nowak, A., Sabacka, M., Jungblut, A., Navarro, F., Pearce, D., Ávila-Jiménez, M. L., Convey, P., and Vieira, G.: Climatically sensitive transfer of iron to maritime Antarctic ecosystems by surface runoff, Nat. Commun., 8, 14499, https://doi.org/10.1038/ncomms14499, 2017.
Hrbáček, F. and Uxa, T.: The evolution of a near-surface ground thermal regime and modeled active-layer thickness on James Ross Island, Eastern Antarctic Peninsula, in 2006–2016, Permafrost Periglac., 31, 141–155, https://doi.org/10.1002/ppp.2018, 2020.
Hrbáček, F., Láska, K., and Engel, Z.: Effect of Snow Cover on the Active-Layer Thermal Regime – A Case Study from James Ross Island, Antarctic Peninsula, Permafrost Periglac., 27, 307–315, https://doi.org/10.1002/ppp.1871, 2016.
Huss, M. and Hock, R.: Global-scale hydrological response to future glacier mass loss, Nat. Clim. Change, 8, 135–140, https://doi.org/10.1038/s41558-017-0049-x, 2018.
Iacono, M. J., Delamere, J. S., Mlawer, E. J., Shephard, M. W., Clough, S. A., and Collins, W. D.: Radiative forcing by long-lived greenhouse gases: Calculations with the AER radiative transfer models, J. Geophys. Res.-Atmos., 113, D13103, https://doi.org/10.1029/2008JD009944, 2008.
Inbar, M.: Fluvial Morphology and Streamflow on Deception Island, Antarctica, Geogr. Ann. A, 77, 221–23, https://doi.org/10.1080/04353676.1995.11880442, 1995.
Jenicek, M. and Ledvinka, O.: Importance of snowmelt contribution to seasonal runoff and summer low flows in Czechia, Hydrol. Earth Syst. Sci., 24, 3475–3491, https://doi.org/10.5194/hess-24-3475-2020, 2020.
Jennings, S. J. A., Davies, B. J., Nývlt, D., Glasser, N. F., Engel, Z., Hrbáček, F., Carrivick, J. L., Mlčoch, B., and Hambrey, M. J.: Geomorphology of Ulu Peninsula, James Ross Island, Antarctica, J. Maps, 17, 125–139, https://doi.org/10.1080/17445647.2021.1893232, 2021.
Jung, H., Jeen, S. W., Lee, H., and Lee, J.: Diel variations in chemical and isotopic compositions of a stream on King George Island, Antarctica: Implications for hydrologic pathways of meltwater, Sci. Total Environ., 825, 153784, https://doi.org/10.1016/j.scitotenv.2022.153784, 2022.
Kaplan Pastíriková, L., Hrbáček, F., Uxa, T., and Láska, K.: Permafrost table temperature and active layer thickness variability on James Ross Island, Antarctic Peninsula, in 2004–2021, Sci. Total Environ., 869, 161690, https://doi.org/10.1016/j.scitotenv.2023.161690, 2023.
Kaser, G., Fountain, A. G., and Jansson, P.: A Manual for monitoring the mass balance of mountain glaciers with particular attention to low latitude characteristics; Technical documents in hydrology, UNESCO, Paris, 1–137, https://unesdoc.unesco.org/ark:/48223/pf0000129593 (last access: 10 October 2023), 2003.
Kavan, J.: Fluvial transport in the deglaciated Antarctic catchment – Bohemian Stream, James Ross Island Bohemian Stream, James Ross Island, Geogr. Ann. A, 104, 1–10, https://doi.org/10.1080/04353676.2021.2010401, 2021.
Kavan, J., Ondruch, J., Nývlt, D., Hrbáček, F., Carrivick, J. L., and Láska, K.: Seasonal hydrological and suspended sediment transport dynamics in proglacial streams, James Ross Island, Antarctica, Geogr. Ann. A, 99, 38–55, https://doi.org/10.1080/04353676.2016.1257914, 2017.
Kavan, J., Nývlt, D., Láska, K., Engel, Z., and Kňažková, M.: High-latitude dust deposition in snow on the glaciers of James Ross Island, Antarctica, Earth Surf. Proc. Land., 45, 1569–1578, https://doi.org/10.1002/esp.4831, 2020.
Kavan, J., Hrbáček, F., and Stringer, C. D.: Proglacial streams runoff dynamics in Devil's Bay, Vega Island, Antarctica, Hydrolog. Sci. J., 68, 967–981, https://doi.org/10.1080/02626667.2023.2195559, 2023.
Kňažková, M., Hrbáček, F., Kavan, J., and Nývlt, D.: Effect of hyaloclastite breccia boulders on meso-scale periglacial-aeolian landsystem in semi-arid antarctic environment, james ross island, antarctic peninsula1, Geogr. Res. Lett., 46, 7–31, https://doi.org/10.18172/cig.3800, 2020.
Kohler, T. J., Stanish, L. F., Crisp, S. W., Koch, J. C., Liptzin, D., Baeseman, J. L., and McKnight, D. M.: Life in the Main Channel: Long-Term Hydrologic Control of Microbial Mat Abundance in McMurdo Dry Valley Streams, Antarctica, Ecosystems, 18, 310–327, https://doi.org/10.1007/s10021-014-9829-6, 2015.
Konz, M. and Seibert, J.: On the value of glacier mass balances for hydrological model calibration, J. Hydrol., 385, 238–246, https://doi.org/10.1016/j.jhydrol.2010.02.025, 2010.
Lee, J., Hur, S. Do, Lim, H. S., and Jung, H.: Isotopic characteristics of snow and its meltwater over the Barton Peninsula, Antarctica, Cold Reg. Sci. Technol., 173, 102997, https://doi.org/10.1016/j.coldregions.2020.102997, 2020.
Lyons, W. B., Welch, K. A., Welch, S. A., Camacho, A., Rochera, C., Michaud, L., Dewit, R., and Carey, A. E.: Geochemistry of streams from byers peninsula, livingston island, Antarct. Sci., 25, 181–190, https://doi.org/10.1017/S0954102012000776, 2013.
Matějka, M. and Láska, K.: Impact of the selected boundary layer schemes and enhanced horizontal resolution on the Weather Research and Forecasting model performance on James Ross Island, Antarctic Peninsula, Czech Polar Reports, 12, 15–30, https://doi.org/10.5817/cpr2022-1-2, 2022.
Matějka, M., Láska, K., Jeklová, K., and Hošek, J.: High-resolution numerical modelling of near-surface atmospheric fields in the complex terrain of james ross island, antarctic peninsula, Atmosphere, 12, , 360, https://doi.org/10.3390/atmos12030360, 2021.
Matějka, M., Láska, K., Zbyněk, E., and Ondřej, N.: Assessment of summer precipitation on James Ross Island, Antarctic Peninsula based on the WRF model output and in-situ observations, EMS Annual Meeting 2022, Bonn, Germany, 5–9 Sep 2022, EMS2022-320, https://doi.org/10.5194/ems2022-320, 2022.
Matsuoka, K., Skoglund, A., and Roth, G.: Quantarctica, Norwegian Polar Institute [data set], https://doi.org/10.21334/npolar.2018.8516e961, 2018.
Meredith, M. P., Falk, U., Bers, A. V., Mackensen, A., Schloss, I. R., Barlett, E. R., Jerosch, K., Busso, A. S., and Abele, D.: Anatomy of a glacial meltwater discharge event in an Antarctic cove, Philos. T. R. Soc. A, 376, 20170163, https://doi.org/10.1098/rsta.2017.0163, 2018.
Moreno, L., Silva-Busso, A., López-Martínez, J., Durán-Valsero, J. J., Martínez-Navarrete, C., Cuchí, J. A., and Ermolin, E.: Hydrogeochemical characteristics at Cape Lamb, Vega Island, Antarctic Peninsula, Antarct. Sci., 24, 591–607, https://doi.org/10.1017/S0954102012000478, 2012.
Nedelcev, O. and Jenicek, M.: Trends in seasonal snowpack and their relation to climate variables in mountain catchments in Czechia, Hydrolog. Sci. J., 66, 2340–2356, https://doi.org/10.1080/02626667.2021.1990298, 2021.
Nedělčev, O., Matějka, M., Láska, K., Engel, Z., Kavan, J., and Jenicek, M.: The role of snowmelt, glacier melt and rainfall in streamflow dynamics on James Ross Island, Antarctic Peninsula, Zenodo [data set], https://doi.org/10.5281/zenodo.11001370, 2024.
Niu, G. Y., Yang, Z. L., Mitchell, K. E., Chen, F., Ek, M. B., Barlage, M., Kumar, A., Manning, K., Niyogi, D., Rosero, E., Tewari, M., and Xia, Y.: The community Noah land surface model with multiparameterization options (Noah-MP): 1. Model description and evaluation with local-scale measurements, J. Geophys. Res.-Atmos., 116, 1–19, https://doi.org/10.1029/2010JD015139, 2011.
Nowak, A., Hodgkins, R., Nikulina, A., Osuch, M., Wawrzyniak, T., Kavan, J., Majerska, M., Romashova, K., Vasilevich, I., Sobota, I., and Rachlewicz, G.: From land to fjords: The review of Svalbard hydrology from 1970 to 2019 (SvalHydro), Zenodo, https://doi.org/10.5281/zenodo.4294063, 176–201, 2021.
Obryk, M. K., Doran, P. T., Friedlaender, A. S., Gooseff, M. N., Li, W., Morgan-Kiss, R. M., Priscu, J. C., Schofield, O., Stammerjohn, S. E., Steinberg, D. K., and Ducklow, H. W.: Responses of Antarctic Marine and Freshwater Ecosystems to Changing Ice Conditions, Bioscience, 66, 864–879, https://doi.org/10.1093/biosci/biw109, 2016.
Oliva, M., Navarro, F., Hrbáček, F., Hernández, A., Nývlt, D., Pereira, P., Ruiz-Fernández, J., and Trigo, R.: Recent regional climate cooling on the Antarctic Peninsula and associated impacts on the cryosphere, Sci. Total Environ., 580, 210–223, https://doi.org/10.1016/j.scitotenv.2016.12.030, 2017.
Osuch, M., Wawrzyniak, T., and Nawrot, A.: Diagnosis of the hydrology of a small Arctic permafrost catchment using HBV conceptual rainfall-runoff model, Hydrol. Res., 50, 459–478, https://doi.org/10.2166/nh.2019.031, 2019.
Osuch, M., Wawrzyniak, T., and Łepkowska, E.: Changes in the flow regime of High Arctic catchments with different stages of glaciation, SW Spitsbergen, Sci. Total Environ., 817, 152924, https://doi.org/10.1016/j.scitotenv.2022.152924, 2022.
Oudin, L., Frédéric, H., Michel, C., Perrin, C., Andréassian, V., Anctil, F., and Loumagne, C.: Which potential evapotranspiration input for a lumped rainfall – runoff model? Part 2 – Towards a simple and efficient potential evapotranspiration model for rainfall – runoff modelling, J. Hydrol., 303, 290–306, https://doi.org/10.1016/j.jhydrol.2004.08.026, 2005.
Pishniak, D. and Beznoshchenko, B.: Improving the detailing of atmospheric processes modelling using the Polar WRF model: a case study of a heavy rainfall event at the Akademik Vernadsky station, Ukr. Antarct. J., 2020, 26–41, https://doi.org/10.33275/1727-7485.2.2020.650, 2020.
Pool, S., Viviroli, D., and Seibert, J.: Prediction of hydrographs and flow-duration curves in almost ungauged catchments: Which runoff measurements are most informative for model calibration?, J. Hydrol., 554, 613–622, https://doi.org/10.1016/j.jhydrol.2017.09.037, 2017.
Rosa, K. K., Vieira, R., Fernandez, G. B., Simões, L., and Simões, J. C.: Meltwater drainage and sediment transport in a small glaciarized basin, Wanda glacier, King George Island, Antarctica, Geociências, 33, 181–191, 2014.
Sahade, R., Lagger, C., Torre, L., Momo, F., Monien, P., Schloss, I., Barnes, D. K. A., Servetto, N., Tarantelli, S., Tatián, M., Zamboni, N., and Abele, D.: Climate change and glacier retreat drive shifts in an Antarctic benthic ecosystem, Sci. Adv., 1, e1500050, https://doi.org/10.1126/sciadv.1500050, 2015.
Seefeldt, M. W., Low, T. M., Landolt, S. D., and Nylen, T. H.: Remote and autonomous measurements of precipitation for the northwestern Ross Ice Shelf, Antarctica, Earth Syst. Sci. Data, 13, 5803–5817, https://doi.org/10.5194/essd-13-5803-2021, 2021.
Seehaus, T., Sommer, C., Dethinne, T., and Malz, P.: Mass changes of the northern Antarctic Peninsula Ice Sheet derived from repeat bi-static synthetic aperture radar acquisitions for the period 2013–2017, The Cryosphere, 17, 4629–4644, https://doi.org/10.5194/tc-17-4629-2023, 2023.
Seibert, J.: Multi-criteria calibration of a conceptual runoff model using a genetic algorithm, Hydrol. Earth Syst. Sci., 4, 215–224, https://doi.org/10.5194/hess-4-215-2000, 2000.
Seibert, J. and Bergström, S.: A retrospective on hydrological catchment modelling based on half a century with the HBV model, Hydrol. Earth Syst. Sci., 26, 1371–1388, https://doi.org/10.5194/hess-26-1371-2022, 2022.
Seibert, J. and McDonnell, J. J.: Gauging the Ungauged Basin: Relative Value of Soft and Hard Data, J. Hydrol. Eng., 20, A4014004, https://doi.org/10.1061/(asce)he.1943-5584.0000861, 2015.
Seibert, J. and Vis, M. J. P.: Teaching hydrological modeling with a user-friendly catchment-runoff-model software package, Hydrol. Earth Syst. Sci., 16, 3315–3325, https://doi.org/10.5194/hess-16-3315-2012, 2012.
Seibert, J., Vis, M. J. P., Kohn, I., Weiler, M., and Stahl, K.: Technical note: Representing glacier geometry changes in a semi-distributed hydrological model, Hydrol. Earth Syst. Sci., 22, 2211–2224, https://doi.org/10.5194/hess-22-2211-2018, 2018.
Skamarock, W. C., Klemp, J. B., Dudhia, J., Gill, D. O., Liu, Z., Berner, J., Wang, W., Powers, J. G., Duda, M. G., Barker, D. M., and Huang, X.: A Description of the Advanced Research WRF Version 4, NCAR Tech. Note NCAR/TN-556+STR, 145 pp., https://doi.org/10.5065/1dfh-6p97, 2019.
Stahl, K., Weiler, M., Kohn, I., Freudiger, D., Seibert, J., Vis, M., Gerlinger, K., and Böhm, M.: The snow and glacier melt components of streamflow of the river Rhine and its tributaries considering the influence of climate change, Final Rep. to Int. Comm. Hydrol. Rhine Basin, https://www.chr-khr.org/sites/default/files/chrpublications/asg-rhein_synthesis_en.pdf (last access: 13 January 2023), 2017.
Stott, T. and Convey, P.: Seasonal hydrological and suspended sediment transport dynamics and their future modelling in the Orwell Glacier proglacial stream, Signy Island, Antarctica, Antarct. Sci., 33, 192–212, https://doi.org/10.1017/S0954102020000607, 2021.
Sziło, J. and Bialik, R. J.: Bedload transport in two creeks at the ice-free area of the Baranowski Glacier, King George Island, West Antarctica, Pol. Polar Res., 38, 21–39, https://doi.org/10.1515/popore-2017-0003, 2017.
Tang, M. S. Y., Chenoli, S. N., Colwell, S., Grant, R., Simms, M., Law, J., and Abu Samah, A.: Precipitation instruments at Rothera Station, Antarctic Peninsula: a comparative study, Polar Res., 37, 1503906, https://doi.org/10.1080/17518369.2018.1503906, 2018.
Thompson, G., Field, P. R., Rasmussen, R. M., and Hall, W. D.: Explicit forecasts of winter precipitation using an improved bulk microphysics scheme. Part II: Implementation of a new snow parameterization, Mon. Weather Rev., 136, 5095–5115, https://doi.org/10.1175/2008MWR2387.1, 2008.
Turner, J., Colwell, S. R., Marshall, G. J., Lachlan-Cope, T. A., Carleton, A. M., Jones, P. D., Lagun, V., Reid, P. A., and Iagovkina, S.: Antarctic climate change during the last 50 years, Int. J. Climatol., 25, 279–294, https://doi.org/10.1002/joc.1130, 2005.
Turner, J., Lu, H., White, I., King, J. C., Phillips, T., Hosking, J. S., Bracegirdle, T. J., Marshall, G. J., Mulvaney, R., and Deb, P.: Absence of 21st century warming on Antarctic Peninsula consistent with natural variability, Nature, 535, 411–415, https://doi.org/10.1038/nature18645, 2016.
van Tiel, M., Stahl, K., Freudiger, D., and Seibert, J.: Glacio-hydrological model calibration and evaluation, WIREs Water, 7, e1483, https://doi.org/10.1002/wat2.1483, 2020.
van Wessem, J. M., Ligtenberg, S. R. M., Reijmer, C. H., van de Berg, W. J., van den Broeke, M. R., Barrand, N. E., Thomas, E. R., Turner, J., Wuite, J., Scambos, T. A., and van Meijgaard, E.: The modelled surface mass balance of the Antarctic Peninsula at 5.5 km horizontal resolution, The Cryosphere, 10, 271–285, https://doi.org/10.5194/tc-10-271-2016, 2016.
Vaughan, D. G.: Recent trends in melting conditions on the Antarctic Peninsula and their implications for ice-sheet mass balance and sea level, Arct. Antarct. Alp. Res., 38, 147–152, https://doi.org/10.1657/1523-0430(2006)038[0147:RTIMCO]2.0.CO;2, 2006.
Vaughan, D. G., Marshall, G. J., Connolley, W. M., Parkinson, C., Mulvaney, R., Hodgson, D. A., King, J. C., Pudsey, C. J., and Turner, J.: Recent rapid regional climate warming on the Antarctic Peninsula, Climatic Change, 60, 243–274, https://doi.org/10.1023/A:1026021217991, 2003.
Vignon, Roussel, M. L., Gorodetskaya, I. V., Genthon, C., and Berne, A.: Present and Future of Rainfall in Antarctica, Geophys. Res. Lett., 48, e2020GL092281, https://doi.org/10.1029/2020GL092281, 2021.
Wawrzyniak, T., Osuch, M., Nawrot, A., and Napiorkowski, J. J.: Run-off modelling in an Arctic unglaciated catchment (Fuglebekken, Spitsbergen), Ann. Glaciol., 58, 36–46, https://doi.org/10.1017/aog.2017.8, 2017.
Weiler, M., Seibert, J., and Stahl, K.: Magic components – why quantifying rain, snowmelt, and icemelt in river discharge is not easy, Hydrol. Process., 32, 160–166, https://doi.org/10.1002/hyp.11361, 2018.
Zhang, X., Bao, J. W., Chen, B., and Grell, E. D.: A three-dimensional scale-adaptive turbulent kinetic energy scheme in the WRF-ARW model, Mon. Weather Rev., 146, 2023–2045, https://doi.org/10.1175/MWR-D-17-0356.1, 2018.
Zhu, J., Xie, A., Qin, X., Xu, B., and Wang, Y.: Projected changes in Antarctic daily temperature in CMIP6 under different warming scenarios during two future periods, J. South. Hemisph. Earth Syst. Sci., 72, 165–178, https://doi.org/10.1071/es22008, 2022.