the Creative Commons Attribution 4.0 License.
the Creative Commons Attribution 4.0 License.
 | 03 Jul 2025
The impact of regional-scale upper-mantle heterogeneity on glacial isostatic adjustment in West Antarctica
Natalya Gomez
Terry Wilson
West Antarctica is underlain by a laterally heterogenous upper mantle, with localized regions of mantle viscosity reaching several orders of magnitude below the global average. Accounting for 3-D viscosity variability in glacial isostatic adjustment (GIA) simulations has been shown to impact the predicted spatial rates and patterns of crustal deformation, geoid, and sea level changes in response to surface ice loading changes. Uncertainty in the viscoelastic structure of the solid Earth remains a major limitation in GIA modeling. To date, investigations of the impact of 3-D Earth structure on GIA have adopted solid Earth viscoelastic models based on global- and continental-scale seismic imaging, with variability at spatial length scales >150 km. However, regional body-wave tomography shows mantle structure variability at smaller length scales (∼50–100 km) in central West Antarctica. Here, we investigate the effects of incorporating smaller-scale lateral variability in upper-mantle viscosity into 3-D GIA simulations. Lateral variability in upper-mantle structure at the glacial drainage basin scale is found to impact GIA model predictions for modern and projected ice mass changes, especially in coastal regions that undergo rapid ice mass loss. Differences between simulations adopting upper-mantle viscosity structure inferred from regional- versus coarser continental-scale seismic imaging are large enough to impact the interpretation of crustal motion observations and reach up to ∼15 % of the total predicted sea level change during the instrumental record. Incorporating a strong transition from lower viscosities at the mouth of the Thwaites and Pine Island glaciers to higher viscosities in the interior of the glacier basins results in a ∼10 %–20 % difference in predicted sea level change in the vicinity of the grounding line over the next ∼300 years. These findings have a range of implications for the interpretation of geophysical observables and improving constraints on feedbacks between the West Antarctic Ice Sheet and the solid Earth.
- Article
(8698 KB) - Full-text XML
-
Supplement
(10731 KB) - BibTeX
- EndNote


Of the West Antarctic Ice Sheet, the Amundsen Sea Embayment sector (ASE) (Fig. 1a) is the dominant contributor to sea level rise at the present and will likely remain a primary contributor for decades to come (e.g., Rignot et al., 2019; Shepherd et al., 2019; DeConto et al., 2021; Seroussi et al., 2023). Within the ASE, the Pine Island and Thwaites glacier drainage basins, which encompass the Pope, Smith, and Kohler glaciers, have undergone the greatest ice mass losses in recent decades (Shepherd et al., 2019). Along with a wide range of cryospheric and climatic processes, glacial isostatic adjustment (GIA) – the deformational and gravitational response of the solid Earth to changes in ice mass distribution – must be accounted for when evaluating the current and future stability of Thwaites Glacier (TG), Pine Island Glacier (PIG), and the West Antarctic Ice Sheet more broadly (e.g., Gomez et al., 2015; Konrad et al., 2015; Barletta et al., 2018; Kachuck et al., 2020; Coulon et al., 2021; Book et al., 2022; Gomez et al., 2024). GIA also introduces substantial uncertainty into modern ice mass loss estimates derived from satellite remote sensing (King et al., 2012; The IMBIE team, 2018; Valencic et al., 2024). Improving the accuracy of GIA predictions is not only important for advancing our current understanding of ice sheet stability but is critical for the interpretation of geophysical and geological records of ice change.
Accurate modeled predictions of GIA are heavily reliant upon estimates of mantle viscosity and lithospheric thickness in Antarctica (e.g., Barletta et al., 2018; Nield et al., 2018; Powell et al., 2020, 2022; Wan et al., 2022). While many studies have adopted a 1-D varying Earth structure when modeling GIA in Antarctica, recent work has demonstrated the importance of accounting for a realistic 3-D Earth structure in GIA models (e.g., Powell et al., 2020; Wan et al., 2022; Gomez et al., 2024). To develop models of the Earth's viscosity structure for input to 3-D GIA models, studies typically infer viscosity from seismic wave speeds and other physical parameters (e.g., Ivins and Sammis, 1995; Latychev et al., 2005b; Paulson et al., 2005; Wu et al., 2005; Ivins et al., 2023). Improved seismic station coverage across Antarctica over the past 2 decades has permitted continental-, regional-, and local-scale seismic investigations of upper-mantle structure from the analysis of passive seismic data (e.g., Wiens et al., 2023). Investigations spanning a range of geographic scales have revealed strong lateral variations in upper-mantle seismic structure across West Antarctica (e.g., Hansen et al., 2014; Lloyd et al., 2015; Heeszel et al., 2016; Shen et al., 2018; O'Donnell et al., 2017, 2019; White-Gaynor et al., 2019; Lloyd et al., 2015, 2020; Lucas et al., 2020, 2021, 2022). Upper-mantle velocities near the global average reference velocity are found across the interior of West Antarctica (e.g., Lloyd et al., 2020). Low upper-mantle velocity anomalies have been imaged beneath Marie Byrd Land extending along the ASE coast, beneath the mouths of TG and PIG, and towards the Antarctica Peninsula (e.g., Heeszel et al., 2016; Shen et al., 2018; O'Donnell et al., 2019; Lloyd et al., 2020; Lucas et al., 2020). Localized low velocity anomalies have also been imaged in the interior of central West Antarctica in regional-scale seismic investigations (e.g., Lloyd et al., 2015; Lucas et al., 2020). Here we define central West Antarctica as the region approximately outlined in Fig. 1e, which encompasses the Thwaites and Pine Island glacier drainage basis and extends west into Marie Byrd Land. As referred to here, the Amundsen Sea Embayment sector (ASE) is the region of central West Antarctica that sits along and adjacent to the coast (Fig. 1).
While previous 3-D GIA modeling studies have adopted mantle viscosity structure from continental-scale seismic imaging, glacial-basin scale investigations of GIA have remained elusive due to limited seismic resolution. However, benefiting from improved seismic station coverage in West Antarctica, recent regional-scale (∼400–1000 km length-scale) seismic imaging has revealed notable heterogeneity in upper-mantle seismic velocities within the TG and PIG glacial drainage basins (“glacial drainage basins” will hereafter be referred to as “basins” for simplicity) (Lucas et al., 2020, 2021). The heterogeneity observed within the TG and PIG basins is consistent with the presence of upper-mantle viscosity changes up to ∼2 orders of magnitude over geographic length-scales of ∼50–200 km.
In this study, we evaluate the impact of regional-scale variability in upper-mantle viscosity on predictions of changes in relative sea level (i.e., the height of the sea surface equipotential relative to the solid surface), crustal deformation, and geoid in response to modern (last ∼25–125 years) and projected (next ∼300 years) ice mass changes in West Antarctica. For modern ice mass changes, we explore the impact of short-wavelength upper-mantle viscosity variations on the interpretation of crustal motion rates observed at GPS sites across central West Antarctica. We also assess how regional-scale upper-mantle viscosity variations impact bedrock elevation predictions at the grounding line of TG and PIG and discuss the implications of our findings for placing improved constraints on solid Earth – ice sheet – sea level feedback processes.
To investigate the length-scale over which lateral variations in upper-mantle viscosity impact GIA predictions, we perform a suite of simulations with Earth models that incorporate upper-mantle viscosity variations in West Antarctica inferred from regional- and continental-scale seismic imaging. We adopt the Seakon model, a global, 3-D, finite-volume GIA forward model (Latychev et al., 2005b), with regional grid refinement (as described in Gomez et al., 2018) for all simulations. The Seakon GIA model solves the sea-level equation (Kendall et al., 2005) with time-varying shorelines and computes the response of an elastically compressible Maxwell viscoelastic Earth to a specified ice loading history while accounting for Earth rotational effects. Various surface observables, including vertical and horizontal crustal displacements, relative sea level, and geoid changes, are predicted by Seakon. Computations are performed on a global tetrahedral grid comprised of ∼28 million grid nodes and ∼160 million elements. The adopted computational grid is regionally refined in our study area, with a lateral surface resolution of ∼3 km over central West Antarctica, ∼7 km over the rest of Antarctica, and ∼12–15 km globally outside of Antarctica. According to the Wan et al. (2022) sensitivity analysis of grid resolution on predictions of GIA, the computational grid adopted here is adequate for capturing the GIA response resulting from modern and future ice mass loading changes. Lateral resolution in the computational grid decreases with depth, with coarsest resolution of ∼50 km at the core-mantle boundary. Seakon's grid refinement capabilities are advantageous for this study as they permit the incorporation of short-wavelength lateral variability in solid Earth structure. We describe the Earth structure and ice cover model inputs to Seakon below.
2.1 Earth model
To test the influence of incorporating various degrees of lateral upper-mantle heterogeneity on GIA predictions, we adopt one 1-D (i.e., radially varying) Earth model representative of the structure of low-viscosity zones in West Antarctica inferred in the literature and three 3-D viscoelastic Earth models with variations in upper-mantle viscosity inferred from global-, continental-, and regional-scale seismic velocity models. For all Earth models, lateral variations in lithospheric thickness are based on the LithoRef18 global model (Afonso et al., 2019) combined with the model of Wiens et al. (2023) in Antarctica (Fig. 1b). As in Wan et al. (2022) and Gomez et al. (2024), the elastic and density structure for all Earth models varies radially and is based on the STW105 seismic tomography model (Kustowski et al., 2008).
The 1-D Earth model, which has an upper-mantle viscosity of 1019 Pa s (bottom of lithosphere to 670 km depth) and a lower-mantle viscosity of 5×10²¹ Pa s (670 km to core-mantle boundary), is calibrated to best reflect absolute upper-mantle viscosity estimates from GIA models with the best fits to GPS uplift rates in West Antarctica (Nield et al., 2014; Zhao et al., 2017; Barletta et al., 2018; Samrat et al., 2021). The 1-D Earth model will hereafter be referred to as “1D_WAIS”. The adopted 1D _WAIS model allows for more direct comparison with recent studies on solid Earth – ice sheet feedbacks in the ASE, which use 1-D Earth models with upper-mantle viscosities in the 1018–1019 Pa s range (e.g., Kachuck et al., 2020; Book et al., 2022). As this study primarily focuses on GIA predictions using 3-D viscosity models, results from simulations with 1D_WAIS are largely presented in the Supplement (Figs. S4–S7).
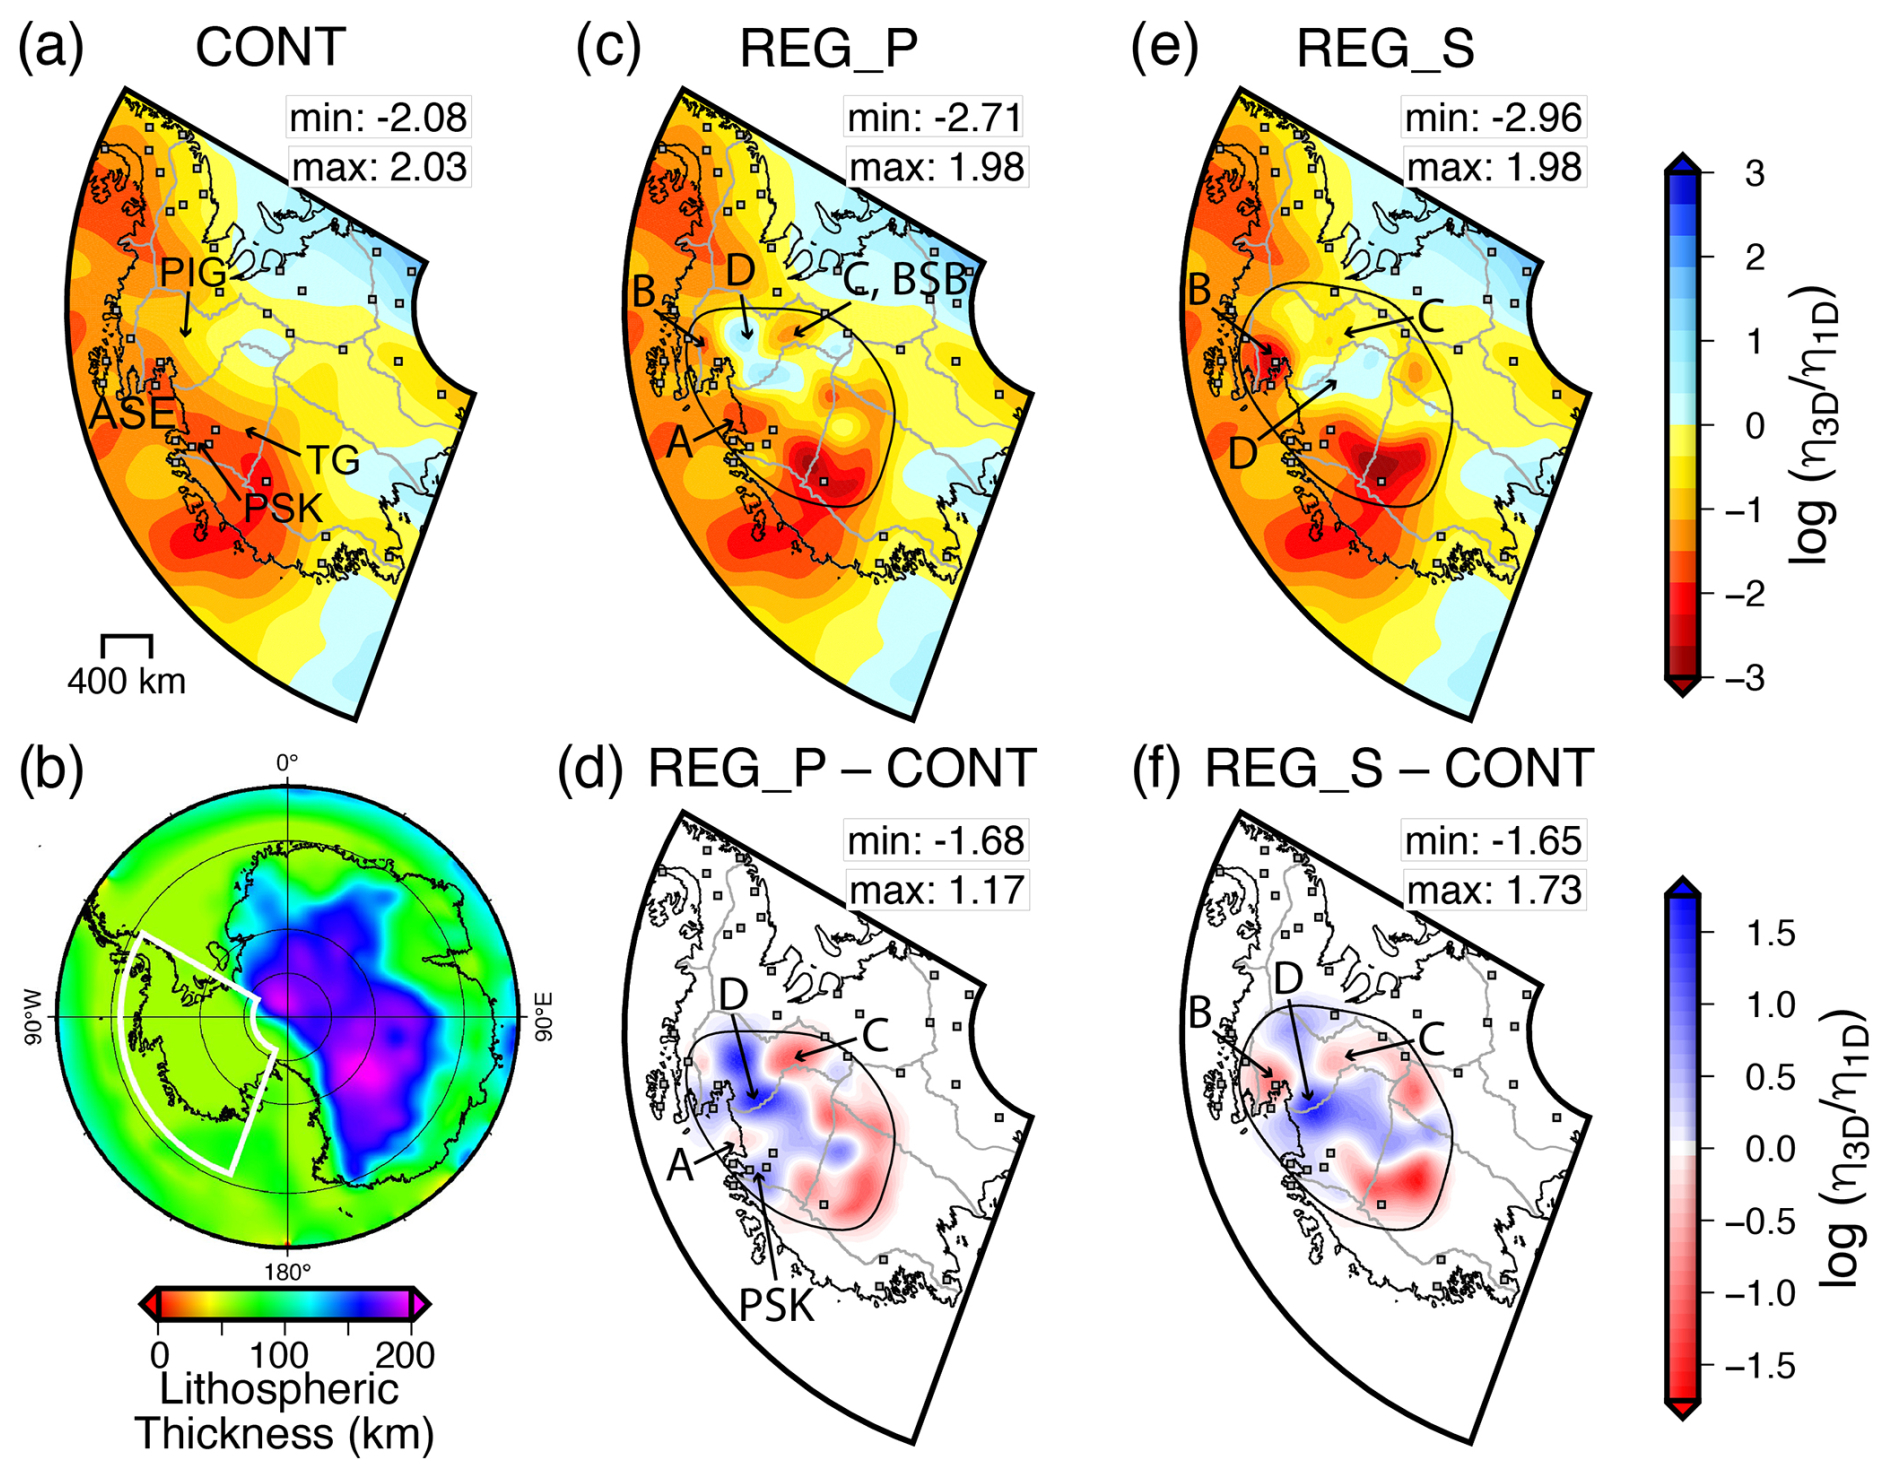
Figure 1Configuration of 3-D Earth models. (a) Mantle viscosity variation at 150 km depth for the CONT viscosity model. Mantle viscosity variation is presented as the logarithm of mantle viscosity variations relative to the 1-D reference viscosity profile, which has viscosities of 5×10²⁰ Pa s in the upper mantle and 5×10²¹ Pa s in the lower mantle. Thwaites Glacier and Pine Island Glacier are labeled TG and PIG, respectively. The region in which the Pope, Smith, and Kohler glaciers are located is labeled PSK. Glaciers within the PSK are labeled individually in Fig. 6c. The location of maps (a), (c–f) is outlined in white in (b). (b) Lithospheric thickness model of Wiens et al. (2023) for Antarctica. (c, e) Logarithmic viscosity perturbation maps at 150 km depth for the (c) REG_P and (e) REG_S viscosity models. The extent over which the regional seismic models are patched into the composite ANT-20 and GLAD-M25 seismic model is outlined in solid black in (c)–(f). Panels (c) and (e) are annotated with the maximum and minimum logarithmic viscosity perturbation in the respective Earth model at 150 km depth. (d, f) Difference in logarithmic viscosity perturbations between the (d) REG_P and CONT viscosity models and the (f) REG_S and CONT viscosity model. Panels (d) and (f) are annotated with the maximum and minimum differences in logarithmic velocity perturbations between the (d) REG_P and (f) REG_S and CONT viscosity models. The grounding line is delineated in black (Fretwell et al., 2013). POLENET-ANET and UKANET GPS station locations are plotted with squares in (a), (c)–(f). Glacial drainage basin system boundaries are outlined in gray in (a), (c)–(f) (Mouginot et al., 2017). The locations of upper-mantle viscosity Features A, B, C, and D are labeled in (c)–(f). The location of upper-mantle viscosity Feature C coincides with the location of the Byrd Subglacial Basin (BSB).
In constructing the 3-D Earth models, variations in mantle viscosity are estimated from relative variations in seismic velocity following Latychev et al. (2005b) and Austermann et al. (2013). Assuming that temperature is the only factor controlling seismic velocity variability, relative variations in seismic velocity are first converted to density, then temperature, and finally viscosity. A scaling factor, ϵ, is adopted in the conversion of temperature to viscosity variations. Lateral mantle viscosity variations are superimposed on a 1-D reference viscosity profile in the 3-D Earth models. The 1-D reference viscosity profile has viscosities of 5×10²⁰ and 5×10²¹ Pa s in the upper and lower mantle, respectively, which is typical for most GIA-based inferences of mantle viscosity (e.g., Mitrovica and Forte, 2004). Like previous 3-D GIA modeling studies, in Fig. 1 we plot 3-D viscosity variations relative to the 1-D reference viscosity profile. In Fig. 1, positive viscosity variations correspond to regions where upper-mantle viscosity values in our 3-D viscosity models are greater than those found in the 1-D reference viscosity profile and the opposite holds for negative viscosity variations.
2.1.1 Continental-scale viscosity model (CONT)
The continental viscosity model, which will hereafter be referred to as the “CONT” model, is constructed by inserting the ANT-20 continental-scale shear-wave seismic model (Lloyd et al., 2020) into the GLAD-M25 global shear-wave seismic model (Lei et al., 2020) between the base of the lithosphere and 670 km depth in the region south of 47° S (Fig. 1a). Global viscosity variations are estimated from GLAD-M25 because it offers improved mantle structure resolution compared to the S362ANI seismic model (Kustowski et al., 2008) that was used to construct the Earth model adopted in Gomez et al. (2024). Consistent with Gomez et al. (2024), a scaling factor of 0.033 °C−1 is adopted in Antarctica and 0.04 °C−1 for the global model in relating temperature to viscosity. The length-scale of features imaged in ANT-20 are limited by lateral and vertical smoothing factors employed in the tomographic inversion. Lateral features in the upper mantle and transition zone are resolved at length-scales of ∼140 and ∼340 km, respectively, and vertical smoothing is fixed at ∼45 km for all depths (Lloyd et al., 2020).
2.1.2 Regional-scale viscosity models (REG_P, REG_S)
We construct two regional viscosity models (REG_P and REG_S) inferred from composite seismic velocity models, in which the Lucas et al. (2020) P-wave and S-wave body wave seismic models of central West Antarctica (Fig. 1c–f) are inserted into the composite ANT-20 and GLAD-M25 seismic model described in Sect. 2.1.1. The composite viscosity models incorporating regional upper-mantle variations inferred from the P-wave and S-wave models in central West Antarctica will hereafter be referred to as “REG_P” and “REG_S”, respectively. Several decisions must be made in constructing the REG_P and REG_S models, including the spatial and depth extent over which the Lucas et al. (2020) models are inserted into the composite model and how to correct for underestimated seismic velocity anomaly amplitudes in the Lucas et al. (2020) models. The approach followed to construct the regional viscosity models is described briefly below and in more detail in Sect. S1 of the Supplement.
The Lloyd et al. (2020) continental model (ANT-20) and Lucas et al. (2020) regional models show comparable first-order upper-mantle structure; however, with different tomographic approaches and datasets, discrepancies exist between the seismic tomography models (Figs. 1, S1). Different from the adjoint tomography approach employed in Lloyd et al. (2020) to image upper-mantle structure across Antarctica, Lucas et al. (2020) invert for upper-mantle structure within just central West Antarctica using a ray-path based travel-time tomography approach (VanDecar, 1991). The relative travel-time tomography approach employed to image regional upper-mantle structure in Lucas et al. (2020) incorporates information from short-period body waves (1–25 s period), whereas the Lloyd et al. (2020) continental model only incorporates information from long-period body waves (15–50 s period) and surface waves (25–150 s period). As shorter-period seismic waves are more sensitive to finer-scale structures compared to longer-period waves, it is expected that shorter wavelength lateral variability in upper-mantle structure is better resolved in the regional seismic tomography models compared to the continental seismic tomography model.
The Lucas et al. (2020) study evaluates model resolution using a series of synthetic checkerboard tests, which is a standard procedure to test the resolution of body-wave tomography models. Between depths of 100–400 km, lateral structures ∼100 and ∼200 km in length are resolved in the P-wave and S-wave models, respectively. As is common in body wave tomography, vertical resolution is limited in the Lucas et al. (2020) regional seismic models; however, resolution tests indicate that the imaged velocity anomalies primarily originate from mantle structure between the Moho and ∼250 km depth. Given that resolution tests show >150 km of vertical smearing in the Lucas et al. (2020) regional models, ANT-20 likely provides superior resolution of vertical variability in upper-mantle structure with vertical smoothing fixed at ∼45 km. We construct viscosity models using both the P- and S-wave regional seismic models of Lucas et al. (2020) because the models show somewhat different structure throughout central West Antarctica (Figs. 1, S1). The regional seismic tomography models are inserted into the ANT-20 model between the base of the lithosphere to 250 km depth in regions where the synthetic checkerboard tests are well-resolved. Further details on the steps followed to merge the regional and continental seismic models to construct the regional viscosity models can be found in Sect. S1 of the Supplement.
2.1.3 On viscosity model uncertainty
The resolution and accuracy of the 3-D viscosity models in our study is intrinsically dependent upon the seismic tomography models. While the Lucas et al. (2020) body wave tomography models capture shorter wavelength lateral variability in upper-mantle structure compared to the Lloyd et al. (2020) model, there is still significant uncertainty associated with the pattern and magnitude of lateral variations in upper-mantle seismic velocities throughout West Antarctica. There is also uncertainty associated with the adopted radial viscosity variability and the quantitative relations and assumptions used to convert seismic tomography models to viscosity (e.g., Ivins et al., 2023). With recent work showing the impact of transient rheology on GIA predictions (e.g., Lau et al., 2021; Adhikari et al., 2021; Ivins et al., 2022; Lau, 2023), we also acknowledge potential limitations associated with the adoption of Maxwell rheology in our modeling approach. Overall, given the substantial Earth model uncertainty, we emphasize that the intent of this study is to evaluate the degree to which laterally varying upper-mantle viscosities have the potential to impact GIA predictions; the viscosity models adopted here adequately serve this goal. We do not argue for the accuracy of GIA predictions made using one viscosity model over another; instead, we intend to compare predictions made using various viscosity models that capture different degrees of heterogeneity in upper-mantle structure.
2.2 Ice models
We adopt ice models to represent two modern (1892–2017 and 1992–2017) ice loading scenarios and one future (2000–2300) ice loading scenario in Antarctica (Fig. 2). The first of the two modern ice models, which will be referred to as ICE-25 throughout this study, is constructed based on the Shepherd et al. (2019) time series of surface elevation change (Δh) across the Antarctic Ice Sheet between 1992 and 2017 (Fig. 2a). The Shepherd et al. (2019) Δh time series is derived from multi-mission satellite altimetry data and is resolved over a 5 km grid at 5 year time intervals. Following the same procedure as Wan et al. (2022), we construct the modern ice model used in the GIA simulations by treating Δh as a proxy for ice thickness change (Carrivick et al., 2019). The initial ice thickness and bedrock topography across Antarctica is based on Bedmap2 (Fretwell et al., 2013), noting that results are relatively insensitive to this choice since minimal grounding line changes occur during this time frame. A grounded ice mask is constructed using the Bedmap2 grounding line extent, and ice thickness changes >20 m yr−1 are saturated to mitigate for spurious data. In addition to the 25 year modern ice model, we construct a longer modern ice model (ICE-125) for 125 years, from 1892–2017 (Fig. 2b). This extension is motivated by evidence for upper-mantle viscosities between ∼1018 and 1019 Pa s in the ASE and the GIA response timescales ranging from decades up to a century (e.g., Barletta et al., 2018). From 1992–2017 in ICE-125, we adopt the same ice history as that in the ICE-25 model. Limited observations exist to constrain ice history prior to the satellite altimetry era; therefore, we construct an ice model using the pattern and rate of ice change between 1992–2002 from the ICE-25 model rescaled by a factor of 25 % for the period between 1892 and 1992 (Fig. 2b).
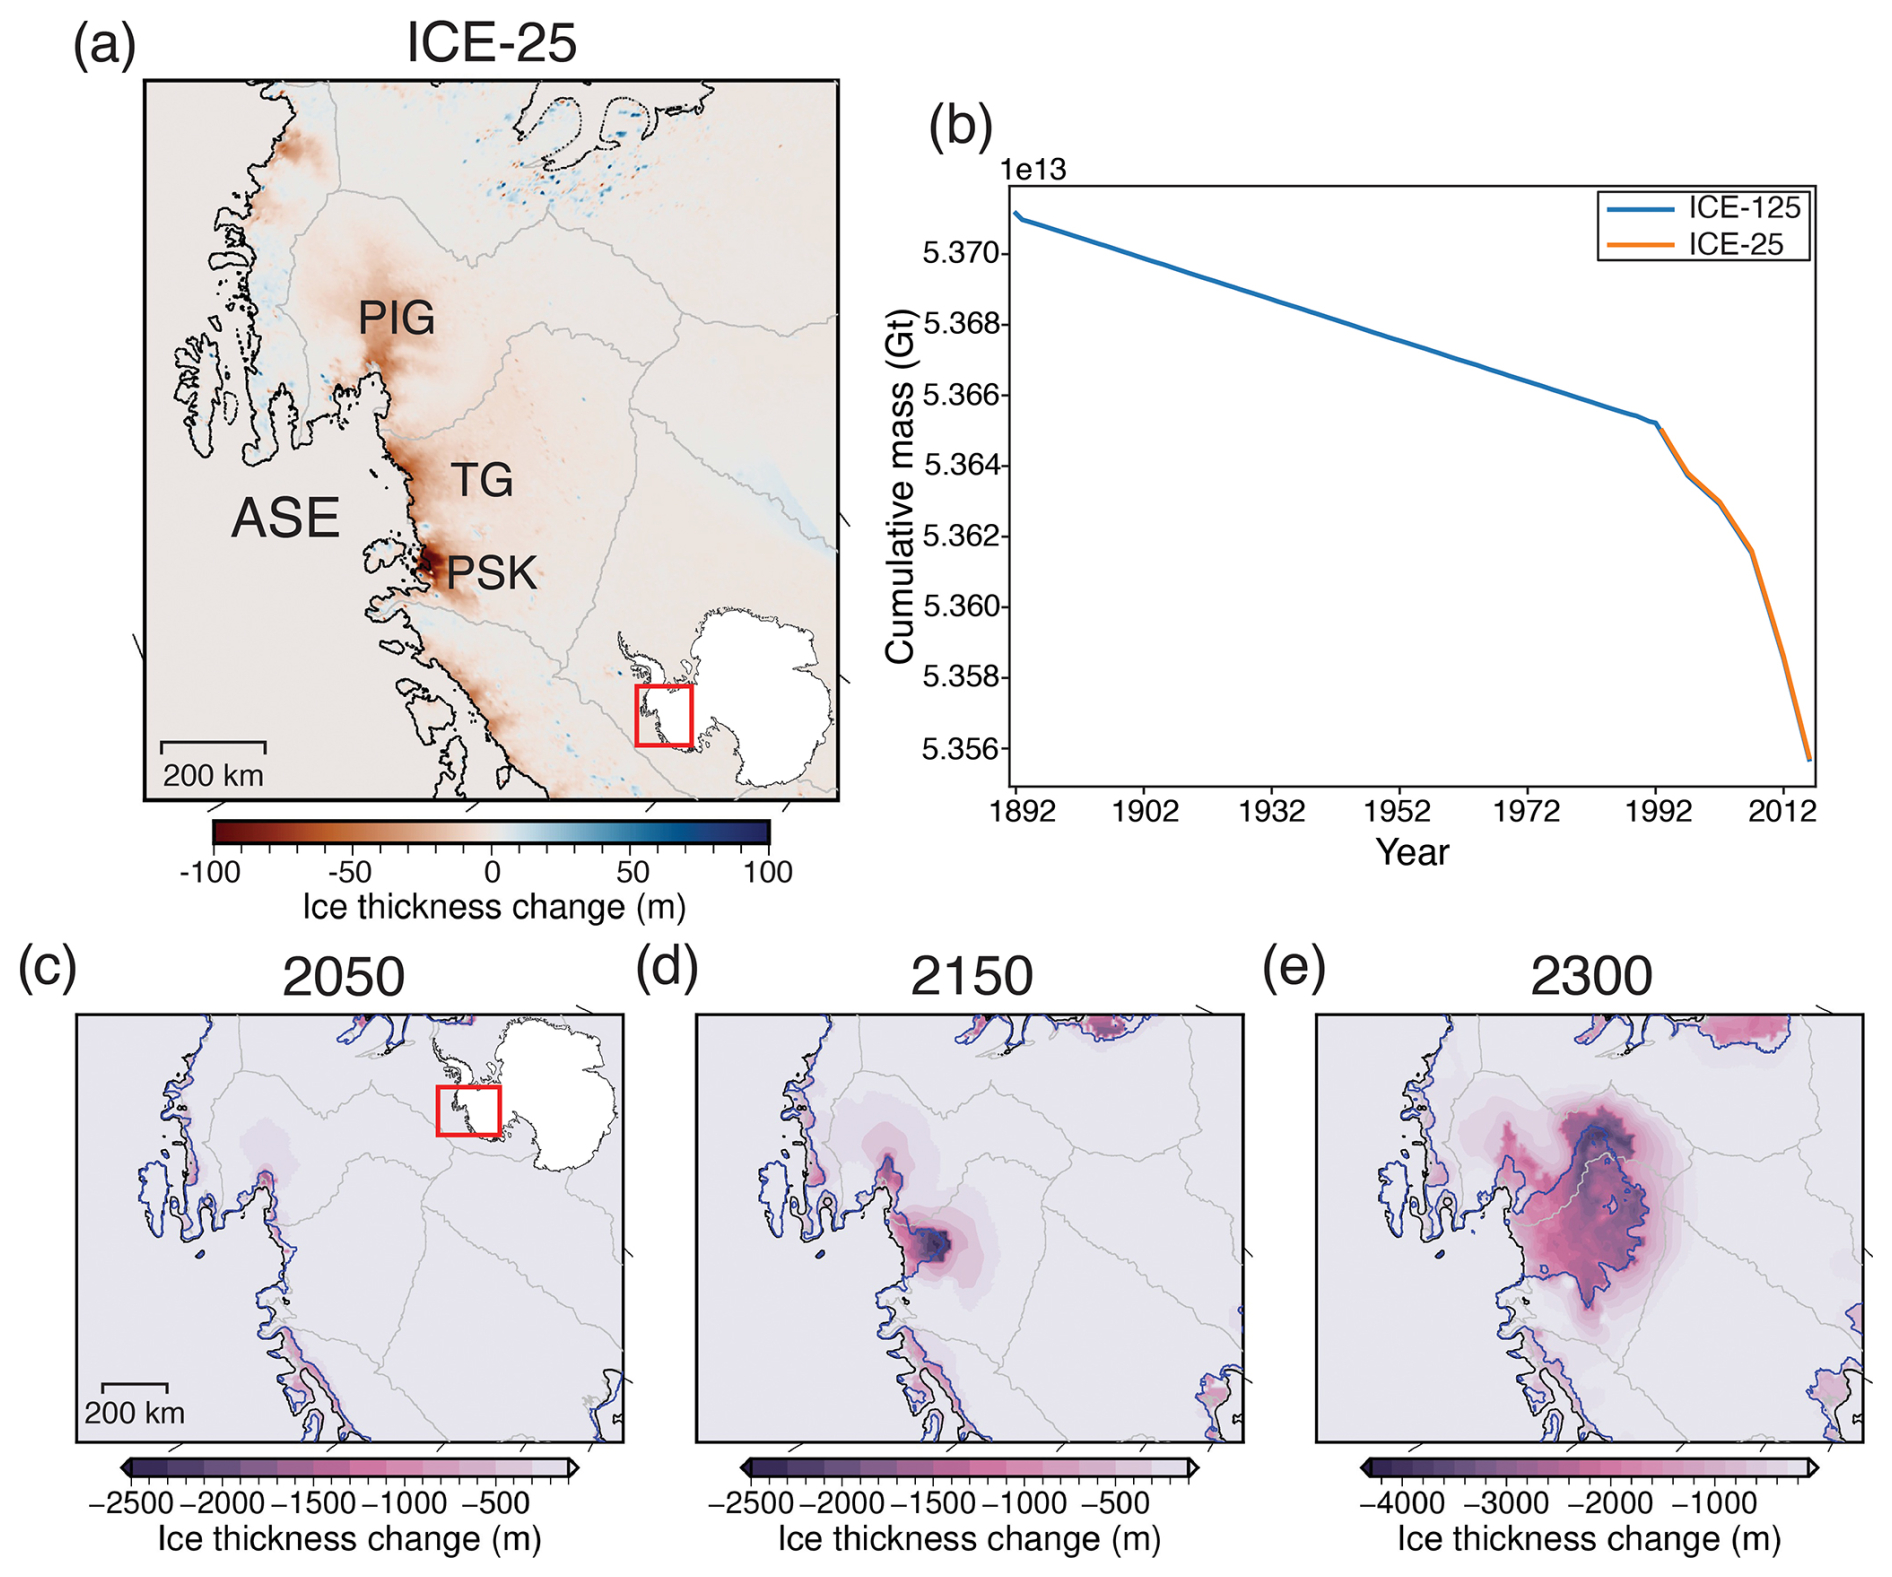
Figure 2Ice models: (a) Total ice thickness change in meters from 1992 to 2017 for the observation-based ICE-25 ice model (Shepherd et al., 2019). (b) Cumulative mass in Gt for ice history ICE-25 between 1992 and 2017 and ICE-125 between 1892 and 2017 over the entire Antarctic Ice Sheet. Figure 6c includes a map of total ice thickness change for the ICE-125 model like that plotted for ICE-25 in (a). (c–d) Total ice thickness change and predicted grounding line positions (blue) in (c) 2050, (d) 2150, and (e) 2300 for the ICE-FUT ice model.
In addition to the modern ice loading models, we complete GIA simulations with an Antarctica-wide ice sheet model projection from Gomez et al. (2024) to represent future ice thickness changes (Fig. 2c–e). Using an ice sheet-sea-level coupling approach, Gomez et al. (2024) model Antarctic Ice Sheet thickness change and global GIA from 1950 to 2500 under a range of climate forcings and ice physics assumptions. Here, we utilize an ice-sheet projection produced from a simulation performed with the Representative Concentration Pathway (RCP) 2.6 climate forcing that incorporates the effects of hydrofracturing and mechanical failure of marine-terminating ice cliffs (DeConto et al., 2021). The Gomez et al. (2024) model predicts a contribution of the West Antarctic Ice Sheet to global mean sea level rise of 0.33 m by 2150 and 1.23 m by 2300, with significant ice loss and grounding line retreat in the ASE. This ice model projection will be referred to as ICE-FUT hereafter. The ICE-FUT ice model simulation has a continent-wide resolution of 10 km, with 5 km resolution in West Antarctica, and ice thickness is provided to the GIA model at 2 year time intervals from 1950–2500. We adopt the same initial bedrock topography, Bedmap2 (Fretwell et al., 2013), as that used in Gomez et al. (2024).
2.3 Crustal motion rates observed at POLENET-ANET GPS sites
In Sect. 4.1, we compare vertical and horizontal crustal motion rates predicted in our GIA simulations to crustal motion rates observed at select POLENET-ANET GPS sites located throughout central West Antarctica. The Antarctic GPS data were processed within a global network composed of ∼2500 stations (with data spanning from 1993 to 2022, ∼4 million station-days) using a parallelized Python wrapper for GAMIT/GLOBK v10.71 (Gómez, 2017). Processing of GPS data used the orbits and antenna calibration parameters available from the International GNSS Service (IGS14 reference frame), the Vienna Mapping Functions (Boehm et al., 2006) to estimate the atmospheric delays, and the ocean tide loading model FES2014b (Lyard et al., 2021). We use an automated procedure to fit trajectory models to the displacement time series of each Continuous Global Positioning System (CGPS) station (Bevis and Brown, 2014; Bevis et al., 2019). Reference frame (RF) realization and trajectory modeling are implemented simultaneously, to ensure internal geometrical consistency (Bevis and Brown, 2014). The horizontal aspect of the RF, in velocity or rate space, is imposed by minimizing the RMS horizontal velocities of a set of stations considered to be part of the rigid portions of the Antarctica plate, in which there are no relative velocities driven by tectonics. The vertical aspect of the RF in velocity space is that which minimizes the RMS vertical velocities of a global set of CGPS stations called VREF, chosen using the “ensemble of RFs” approach described by Bevis et al. (2013). There are 15 HREF stations on the Antarctic continent and 1 on Kerguelen Island. The RMS horizontal velocity of these stations in the final ANET frame is 0.29 mm yr−1. The RMS vertical velocity of the 850 VREF stations is 0.92 mm yr−1. The station displacement time series and best-fit trajectory models referred to this RF are denoted as the geodetic solution pg03f_PC_H16. An elastic correction for surface mass balance is not applied to the GPS crustal motion rates.
The goal of this analysis is to assess how regional-scale lateral variations in upper-mantle viscosity impact GIA predictions in central West Antarctica in response to modern and future ice loading. We start by briefly summarizing key upper-mantle features in the viscosity models. Then we compare the predicted crustal deformation rates, sea level changes, and geoid changes from simulations adopting the CONT, REG_P, REG_S, and 1D_WAIS viscosity models for ice mass changes over the past 125 years (ICE-125). While we focus on interpreting results from simulations with the 125 year modern ice model in the main text, a detailed assessment comparing GIA predictions from simulations adopting ICE-125 versus ICE-25 can be found in Sect. S2 of the Supplement. Notably, up to 10 % faster crustal motion rates are found when adopting the ICE-125 ice history (Fig. S7; Table S1). Finally, we evaluate predictions of sea level and bedrock elevation change from simulations adopting the CONT, REG_P, and REG_S, and 1D_WAIS viscosity models with the ICE-FUT ice sheet projection.
3.1 Regional upper-mantle viscosity model features
We start by highlighting key features of our regional-scale viscosity models and their relation to the geologic history and mantle dynamics in central West Antarctica (Features A, B, C, D in Fig. 1c–f). Feature A, most evident in REG_P but also present to a lesser degree in the CONT and REG_S models, corresponds to a region with lower-viscosity upper-mantle material located at the mouth of TG (Fig. 1c–d). Seismic imaging studies have attributed this feature to warm mantle material flowing away from Marie Byrd Land (e.g., Lucas et al., 2020; Lloyd et al., 2020). Feature B, located beneath PIG, corresponds to a region with lower upper-mantle viscosity in REG_P and REG_S compared to CONT (Fig. 1c–f). Lower-viscosity upper-mantle material beneath PIG is consistent with a range of processes that have affected the region in the recent geologic past or continue to affect the region, including (1) warm upper-mantle material flowing from Marie Byrd Land, (2) focused Neogene extension (Jordan et al., 2010; Granot et al., 2010, 2013), and (3) volcanism (Corr and Vaughan, 2008; Quartini et al., 2021; Geyer, 2021). Low-viscosity Feature C, most prominent in REG_P, is located beneath a portion of the Byrd Subglacial Basin (Fig. 1c–f), a deep ice-filled graben in a region that likely underwent Neogene extension (e.g., LeMasurier, 2008; Jordan et al., 2010; Granot et al., 2010, 2013; Chaput et al., 2014; Lucas et al., 2020). Finally, high-viscosity Feature D, located in the interior of the Thwaites and Pine Island glacier drainage basins, is evident in both the REG_P and REG_S viscosity models (Fig. 1c–f). Higher viscosities in the interior of central West Antarctica are consistent with relatively cool upper-mantle material that has remained unperturbed by tectonic activity since the major extensional phase of the West Antarctic Rift System in the late Cretaceous (e.g., Siddoway, 2008; Lucas et al., 2020; Lloyd et al., 2020).
3.2 Results with the continental viscosity model (CONT) and modern ice mass changes (ICE-125)
For all simulations, regardless of the adopted viscosity model, relative sea level fall is predicted over most of the study region because of viscoelastic bedrock uplift and geoid subsidence in response to ice mass loss, with the former being the dominant signal (Fig. 3). Earth rotational effects are negligible compared to other effects in the vicinity of ice mass loss. For simulations with the CONT viscosity model, up to 87 cm of sea level fall is predicted in the ASE at the end of the 125 year simulation (Fig. 3a). Peak sea level fall and crustal uplift rates are found in the region of the Pope, Smith, and Kohler glaciers (PSK), which is situated in the TG drainage basin, coincident with the region of greatest ice mass loss in the ICE-125 ice history (Figs. 2a, 3a, d). Horizontal crustal motions generally point outward from the region of greatest ice mass loss in the TG, PIG, and PSK regions (Fig. 3g). Peak predicted horizontal crustal rates (11.45 mm yr−1) are localized in the eastern Thwaites Glacier basin, ∼60 km inland from the grounding line (Fig. 3g). In agreement with previous work (Powell et al., 2020; Wan et al., 2022), the addition of continental-scale 3-D variations in viscosity structure results in GIA predictions that diverge from simulations adopting the 1D_WAIS model (Fig. S4). The largest discrepancies in GIA predictions between the simulations adopting the 1D_WAIS and CONT viscosity models are found in the TG basin, where less relative sea level fall and lower magnitude modern-day vertical crustal rates are found for simulations adopting the 1D_WAIS viscosity model (Figs. S4, S5).
3.3 Results with the regional viscosity models (REG_P, REG_S) and modern ice mass changes (ICE-125)
Comparing continental simulations to those adopting the REG_P and REG_S viscosity models, it is evident that regional-scale upper-mantle viscosity variability impacts GIA predictions associated with modern ice mass changes (Figs. 3, S5). The largest discrepancies between sea level and crustal motion predictions amongst simulations adopting CONT, REG_P, and REG_S are found proximal to the grounding line in central West Antarctica (Figs. 3, S5).
In the PSK region (Fig. 3a), ∼1–5.4 cm less sea level fall is predicted for simulations adopting REG_P and REG_S compared to the simulation with the CONT viscosity model (Fig. 3b–c). Compared to the CONT model, the PSK region is largely underlain by higher-viscosity upper mantle in both REG_P and REG_S (Fig. 1c–f), contributing to less change in relative sea level. ∼5 %–20 % slower vertical crustal uplift rates are also predicted with the regional viscosity models in this region at the end of the 125 year modern ice loading history (Fig. 3e–f). Here and throughout this study, percent difference is calculated by taking the difference between predictions from two simulations of interest (i.e., prediction from simulation 1 − prediction from simulation 2) and dividing this difference by the prediction from simulation 2. Within central West Antarctica, the greatest discrepancies in predictions of horizontal crustal motions between simulations adopting the regional versus continental viscosity models are focused in the PSK region (Fig. 3h–i). Up to ∼5 mm yr−1 difference in horizontal crustal rates are found between simulations adopting the REG_P and REG_S models compared to the CONT model (Fig. 3h–i).
Now to focus on the TG and PIG regions, in both the CONT and REG_P viscosity models, there is a particularly low-viscosity upper-mantle feature that extends from the coastal PSK region across the grounding line of the TG (Fig. 1a, c). While this viscosity feature extends further east along coastal ASE beneath the PIG with a relatively constant magnitude in CONT, stronger spatial variations in viscosity are found across the TG and PIG in REG_P (Fig. 1a, c, d). Notably, compared to CONT, the central portion of the TG grounding line is underlain by lower-viscosity upper-mantle material in REG_P (Feature A; Fig. 1c–d). The inclusion of Feature A may contribute to slightly more sea level fall evident adjacent to the central portion of the TG grounding line in simulations with REG_P compared to CONT (Fig. 3b). On the other hand, higher viscosities more broadly across the TG basin in the REG_P model compared to CONT (Fig. 1d) produce slower present-day uplift rates across the TG and PIG grounding lines (Fig. 3e). While faster uplift rates may be expected in a region with higher sea level fall, relative sea level predictions reflect variation over the entire simulation period whereas present-day uplift rates represent a snapshot in time at the end of the simulation period. Discrepancies in horizontal motion predictions between CONT and REG_P models occur across notably shorter spatial length-scales across the TG and PIG grounding line region compared to predictions of vertical motion and sea level change (Fig. 3h).
Unlike the REG_P viscosity model, the REG_S model includes higher-viscosity upper-mantle material across the mouth of TG which results in up to 5.4 cm (or ∼10 %–15 %) less sea fall in the region compared to simulations with CONT (Fig. 3c). As the resolution of the P-wave tomography model used to construct the REG_P viscosity model is notably better than the resolution of the S-wave model in the TG grounding line region (Lucas et al., 2020), predictions made using the REG_P model are likely to be more reliable than predictions made using the REG_S model in this region. Compared to simulations with CONT, a low-viscosity upper-mantle feature prominent in REG_S beneath PIG (Feature B; Fig. 1e–f) produces up to 6.5 cm more sea level fall across the modern simulation throughout the PIG region (Fig. 3c) and up to 2.9 mm yr−1 faster crustal uplift rates at the end of the simulation (Fig. 3f). Across much of the PSK, TG, and PIG grounding line region, a ∼0.5–4.0 mm yr−1 difference in horizontal crustal motion predictions is found between simulations adopting REG_S versus CONT (Fig. 3i). Similar to the REG_P simulation, we find strong discrepancies in predictions of horizonal crustal motions over short length-scales (∼50–100 km) between simulations adopting the REG_S and CONT viscosity models.
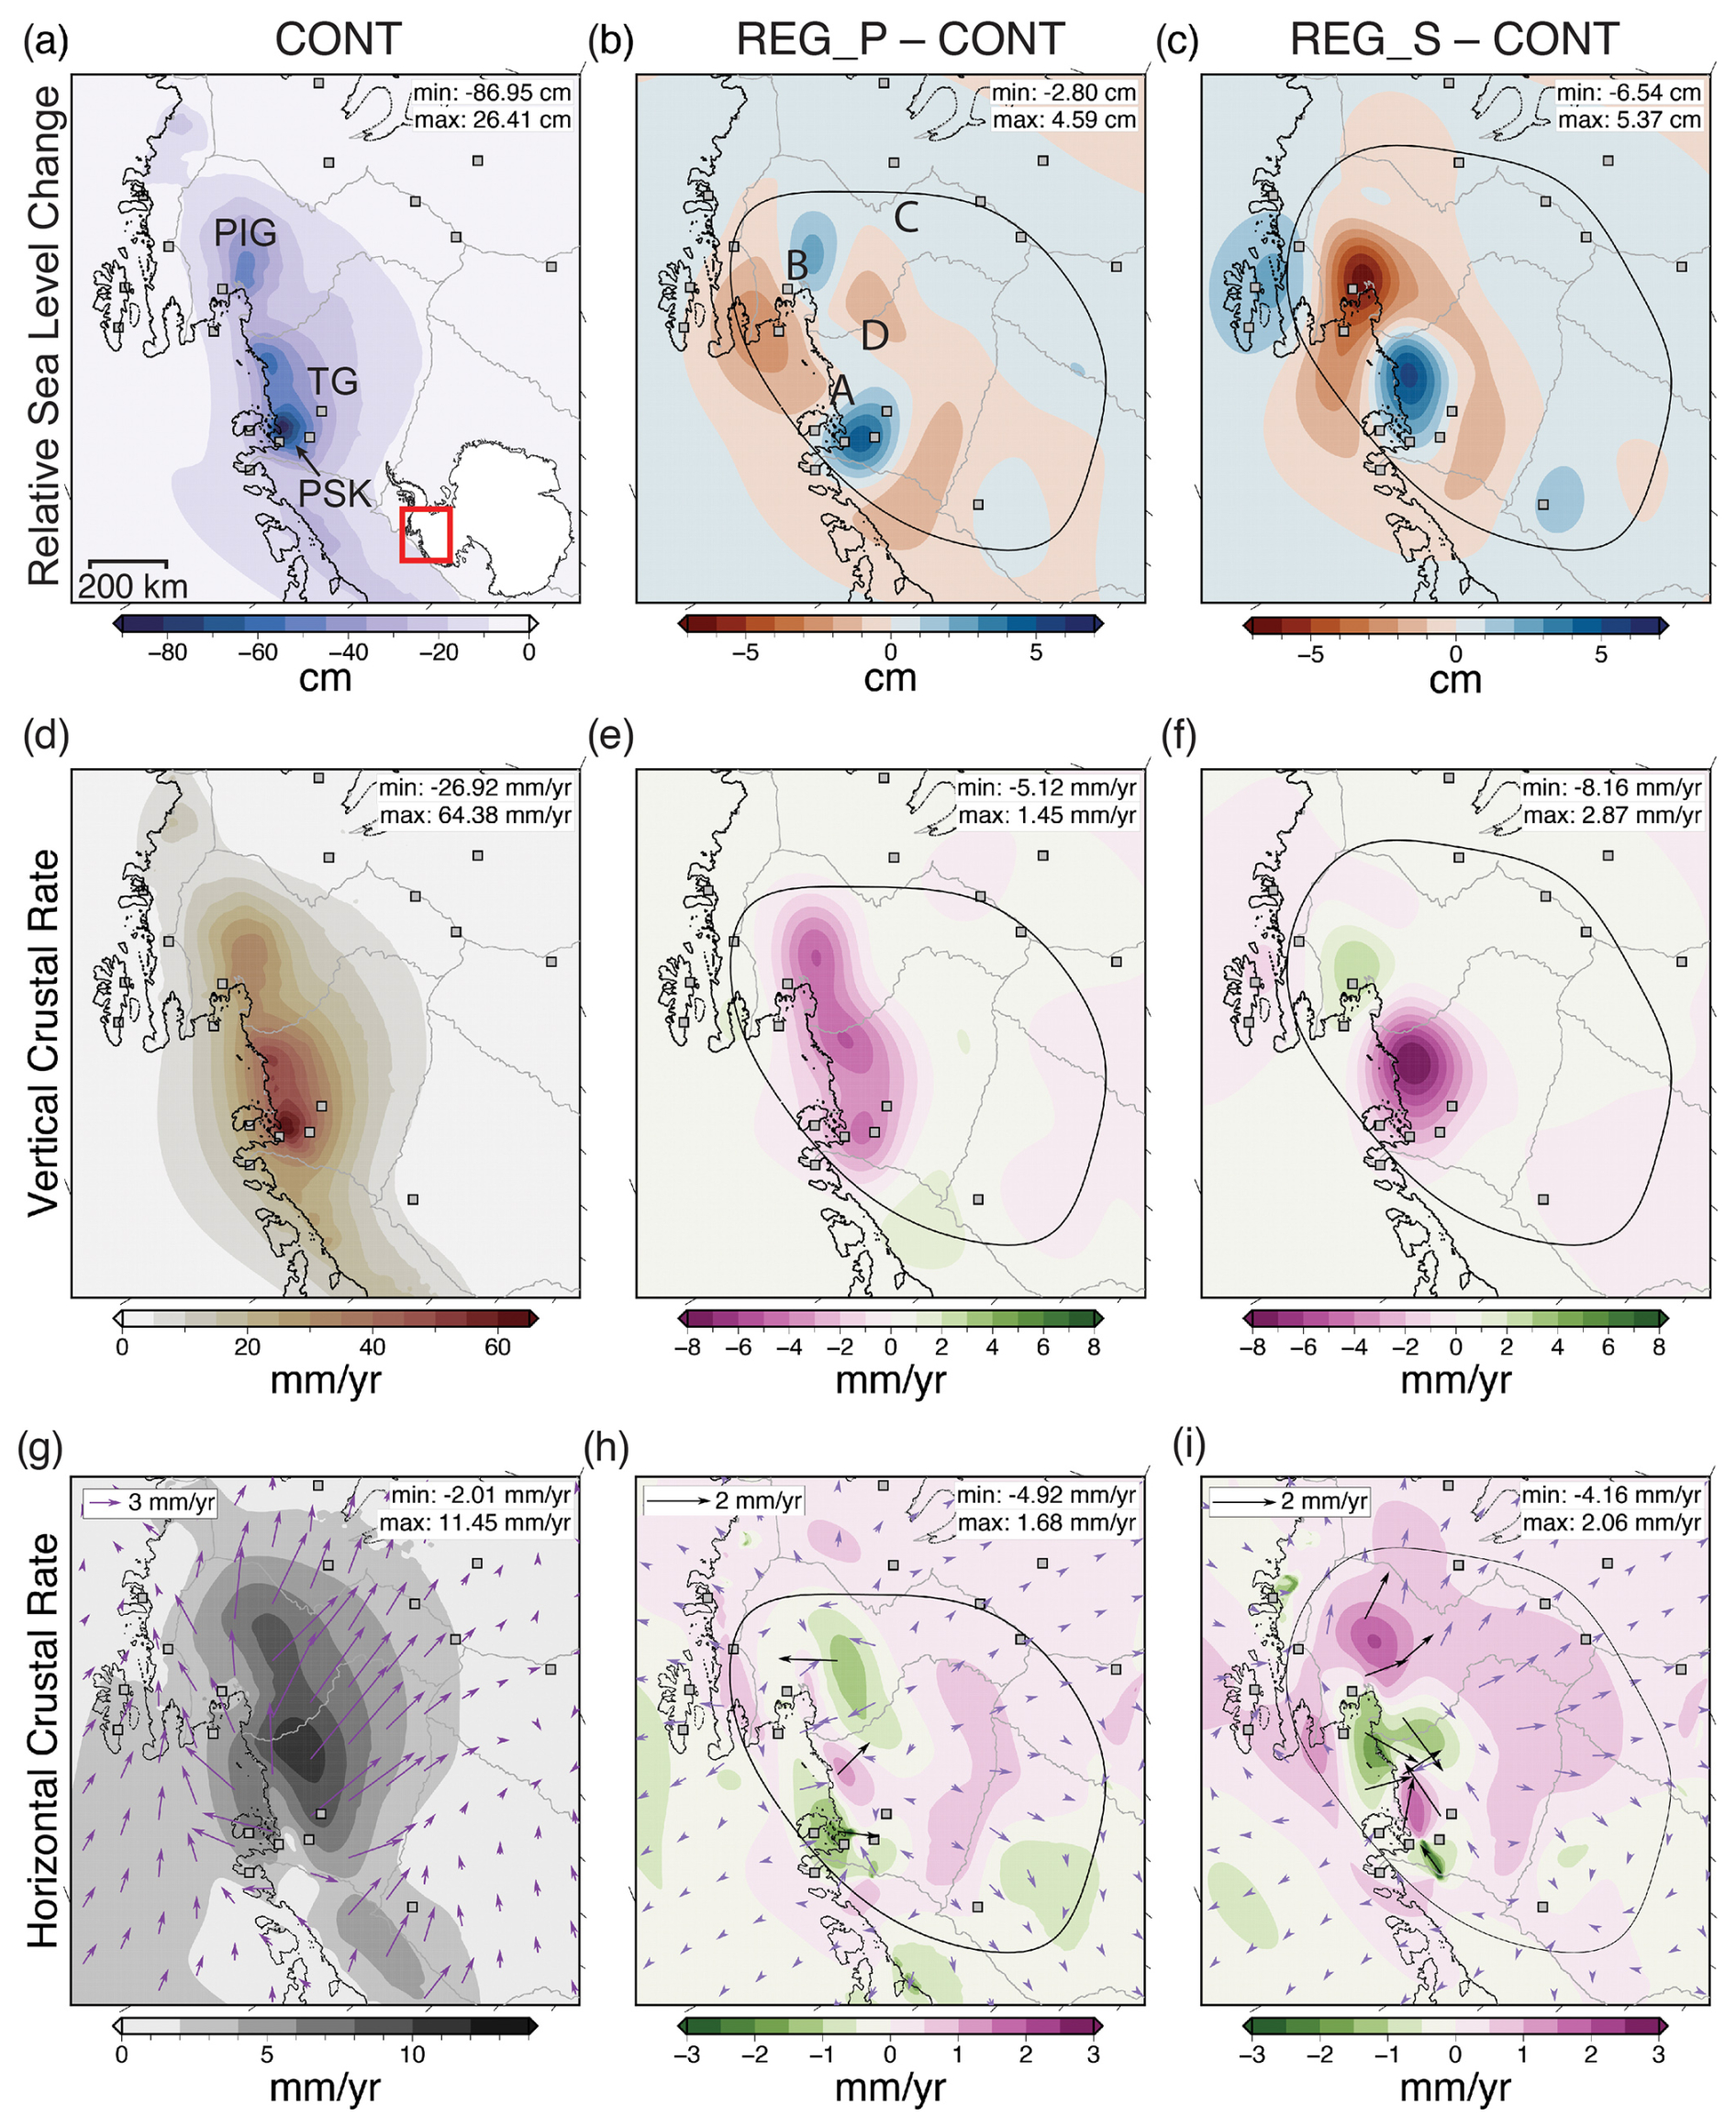
Figure 3Influence of regional upper-mantle structure on predictions of relative sea level and crustal motion rates for modern ice loading (ICE-125). (a) Total relative sea level change for a GIA simulation with the CONT viscosity model and the ICE-125 ice model. (b–c) Difference in predicted relative sea level change between simulations adopting the (b) REG_P and CONT viscosity models (REG_P minus CONT predictions) and the (c) REG_S and CONT viscosity models (REG_S minus CONT predictions). In (b)–(c), positive values correspond to less sea level fall predicted in simulations adopting the regional viscosity models compared to those adopting CONT, while negative values correspond to greater sea level fall. (d) Predicted vertical crustal rates at the end of the 125 year simulation with the CONT viscosity model. (e–f) Difference in predicted vertical crustal rates between simulations adopting the (e) REG_P and CONT viscosity models and the (f) REG_S and CONT viscosity models. (g) Horizontal crustal rates predicted at the end of the simulation adopting the CONT viscosity model. (h–i) Difference in horizontal crustal rates after 125 years of loading between the (h) REG_P, (i) REG_S and CONT viscosity models. Color contours represent the difference in the predicted magnitude of horizontal crustal rates between simulations adopting the (h) REG_P and CONT viscosity models and (i) REG_S and CONT viscosity models. Vectors show the difference in the predicted direction and magnitude of horizontal crustal rates between the respective panel's viscosity model and the CONT viscosity model. Black and purple arrows correspond to locations where horizontal crustal rate differences are ≥1 and <1 mm yr−1, respectively. Extent of maps area shown in (a). The locations of upper-mantle viscosity Features A, B, C, and D are labeled in (b).
3.4 Incorporating regional upper-mantle viscosity into future GIA simulations
Figures 4 and 5 compare predictions of sea level change and bedrock elevation profiles with continental and regional viscosity models due to projected ice cover changes from 1950 to 2300 adopting the ICE-FUT ice sheet model projection (Gomez et al., 2024). As expected, regions undergoing projected ice mass loss experience uplift and sea level fall in the vicinity of the grounding line in all simulations (Fig. 4). The differences between results with the regional and continental viscosity models can be understood by considering the combined spatial patterns of ice mass loss (Fig. 2c–e) and mantle viscosity differences (Fig. 1d, f).
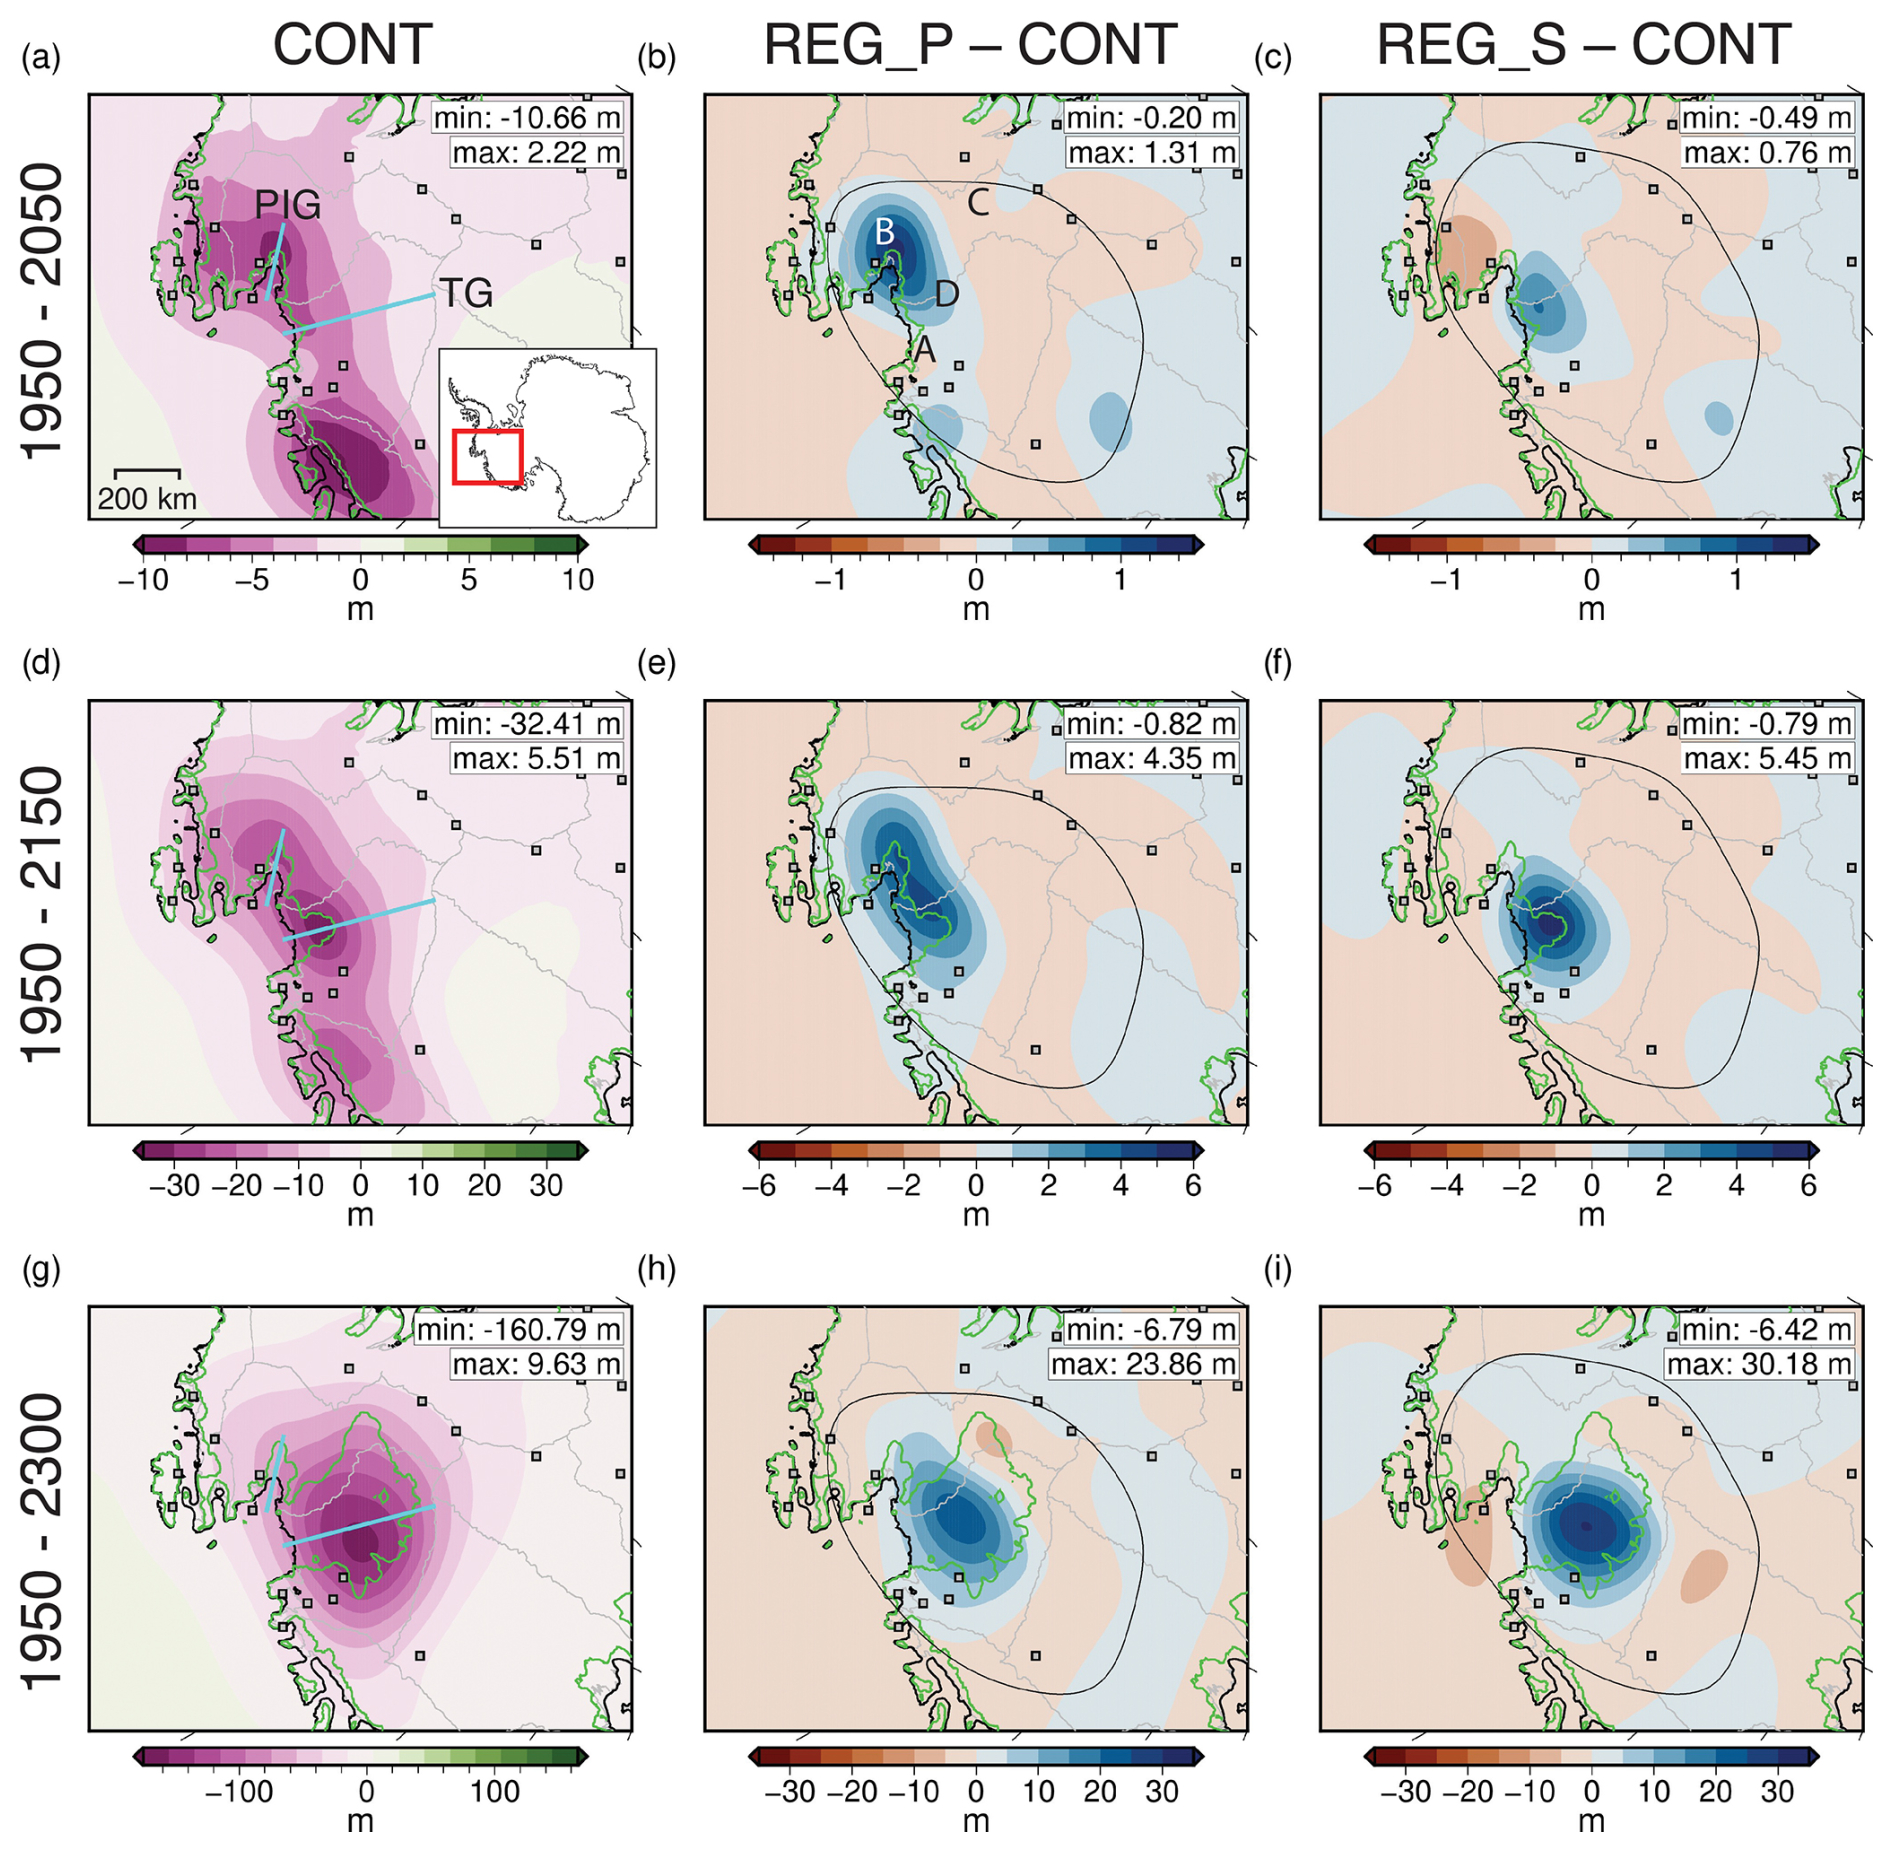
Figure 4Impact of regional upper-mantle structure on relative sea level predictions for the ICE-FUT ice sheet projection. (a, d, g) Total predicted relative sea level change at (a) 2050, (d) 2150, and (g) 2300 for GIA simulations with the CONT viscosity model. The current grounding line position is shown in black, and the grounding line position predicted by the ICE-FUT model is shown in green (Gomez et al., 2024). (b, e, h) Difference in predicted sea level change between simulations adopting the REG_P and CONT viscosity models for (b) 2050, (e) 2150, and (h) 2300. In the REG_P – CONT and REG_S – CONT plots, positive values indicate overall less sea level fall in simulations adopting the regional model during the labeled time period, while negative values indicate greater overall sea level fall. (c, f, i) Difference in predicted sea level change between simulations with the REG_S and CONT viscosity models for (c) 2050, (f) 2150, and (i) 2300. The location of profiles across the TG and PIG shown in Fig. 5 are plotted in the first column. Extent of maps in all panels is shown in (a). The locations of upper-mantle viscosity Features A, B, C, and D are labeled in (b).
In 2050, simulations with REG_P and REG_S produce distinct patterns of relative sea level change throughout the ASE (Fig. 4a–c). In the central PIG basin, the REG_P simulation predicts less overall sea level fall from 1950 to 2050 compared to the CONT simulation, which ultimately produces 1.31 m higher relative sea level in 2050 in the REG_P simulation (Fig. 4b). Unlike the REG_P simulation, greater overall sea level fall (−0.49 m) is predicted from 1950 to 2050 in the northern PIG basin in the simulation adopting REG_S versus CONT (Fig. 4c). These discrepancies in relative sea level predictions in the PIG basin can be attributed to differences in the REG_P and REG_S viscosity models. More specifically, the presence of low-viscosity Feature B in REG_S, which is not as prominent in REG_P, is what produces greater overall sea level fall in the REG_S simulation. While only slight variability is found in relative sea level predictions throughout the TG basin between simulations adopting REG_P versus CONT in 2050 (Fig. 4b), up to ∼ 0.6 m higher relative sea level is predicted at the TG grounding line in the simulation with REG_S compared to CONT (Figs. 4c, 5c).
A transition from lower upper-mantle viscosities to higher viscosities moving from the grounding line towards the interior of the TG and PIG basins is found in the CONT model (Fig. 1a). Compared to CONT, this viscosity transition is much sharper, occurring over a significantly shorter distance in the REG_P and REG_S models (Fig. 1c–f). Including the ∼1 order of magnitude upper-mantle viscosity transition over ∼100 km in simulations with the REG_P and REG_S models has a notable impact on the spatial pattern and magnitude of sea level change predictions in the TG and PIG basins, resulting in up to ∼18 % less sea level fall at and adjacent to the grounding line as soon as 2150 (compare REG_P, REG_S profiles to CONT profile in Fig. 5e–f).
In 2300, the largest difference in predicted sea level change between simulations adopting the regional (REG_P, REG_S) versus continental viscosity models is focused in a region interior to the modern TG catchment over which the TG grounding line has migrated during the simulation (Fig. 4h). Up to ∼25 % less sea level fall is predicted by 2300 in simulations with the regional viscosity models compared to the continental model (Fig. 4g–i). The location in which less overall sea level fall is predicted in simulations adopting the regional viscosity models (Fig. 4h–i) coincides with the location of a high-viscosity upper-mantle feature in both the REG_P and REG_S viscosity models (Feature D, Figs. 1c–f, 4b). The effect of including high-viscosity Feature D is evident across the TG profile in Fig. 5g, which shows lower bedrock elevation change predicted in simulations with REG_P and REG_s versus CONT. Additionally, best resolved in REG_P, a localized low-viscosity upper-mantle feature, coincident with the location of the Byrd Subglacial Basin (Feature C; Figs. 1c, 4b), also appears to produce up to ∼10 m of additional sea level fall at the eastern portion of the TG grounding line by 2300 (Fig. 4h).
Our simulations indicate that regional-scale lateral variability in upper-mantle viscosity has spatially variable impacts on the rate and magnitude of the solid Earth response to modern and future ice mass changes in central West Antarctica. We adopted central West Antarctica as our study location because it is a region characterized by strong lateral variability in upper-mantle structure and is undergoing active marine ice sheet retreat that is projected to continue. However, our findings may provide useful guidance to future studies that aim to evaluate solid Earth deformation in response to ice mass changes in other regions underlain by strongly varying Earth structure, such as Alaska, Cascadia, Patagonia, other sectors of Antarctica, and Greenland. In this section, we will start by discussing the implications of our findings for the interpretation of crustal motion rates observed at select GPS sites deployed across central West Antarctica and then proceed to discuss implications of incorporating regional-scale upper-mantle structure into future GIA projections.
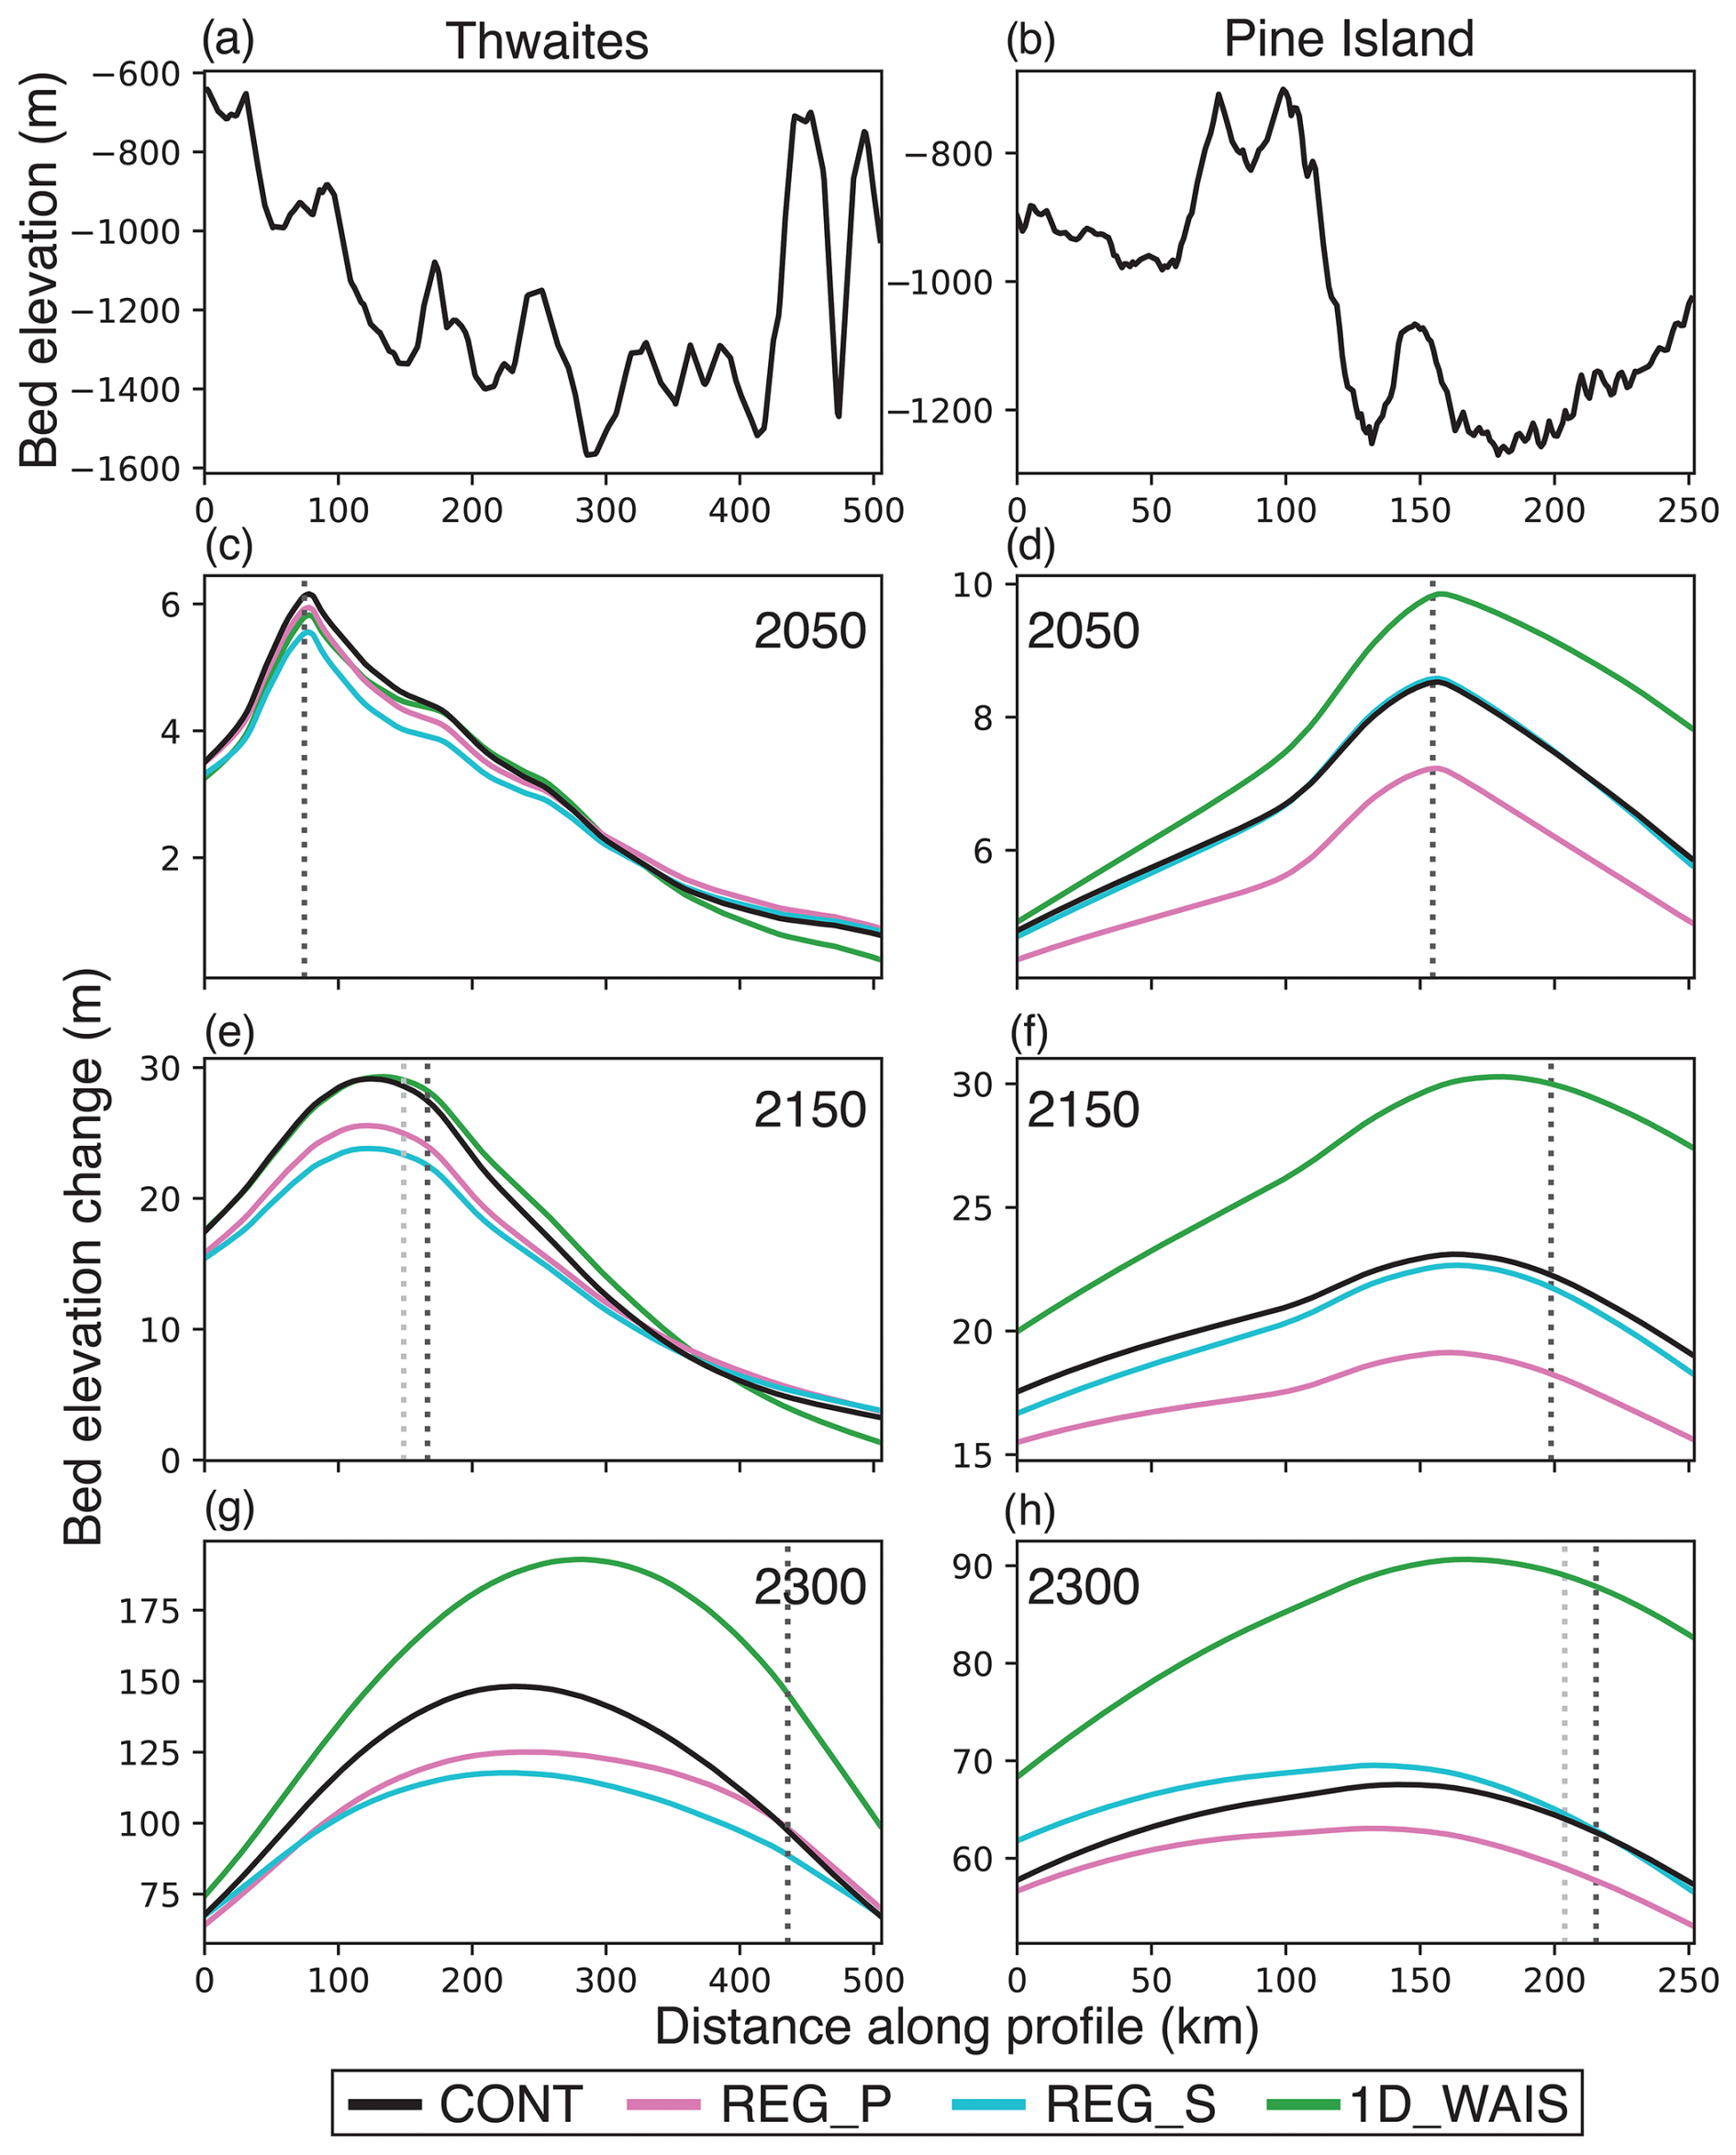
Figure 5Bedrock elevation change predicted at profiles across the Thwaites Glacier and Pine Island Glacier with the ICE-FUT ice sheet model projection. (a–b) Bedrock elevation profiles moving upstream TG and PIG shown in Fig. 4a. (c–h) Total bedrock elevation change in meters predicted along the TG profile (c, e, g) and PIG profile (d, f, h) for the CONT, REG_P, REG_S, and 1D_WAIS viscosity models for 2050, 2150, and 2300. Projected grounding line positions from the REG_P simulation are marked with dark gray dashed lines in panels (c)–(h). These grounding line positions are calculated by applying the floatation criterion to the output of the REG_P simulation. Because projected grounding line positions from simulations with CONT, REG_S, and 1D_WAIS show minimal difference from REG_P, only grounding line positions from the REG_P simulation are plotted. The location of projected grounding line positions from the ICE-FUT ice sheet model projection are also plotted with a light gray dashed line in (c)–(h). The grounding line positions from the REG_P simulation and ICE-FUT overlap in many of the panels.
4.1 Implications for the interpretation of bedrock motion observations
In Fig. 6, we compare our predicted crustal motion rates to observed rates at GPS sites in the study region (see Sect. 2.3, black dots in Fig. 6). Note that the solid Earth has a multi-normal mode response to surface loading (Peltier, 1974) and while very low-viscosity zones in the uppermost mantle may have largely finished responding to Late Pleistocene and Holocene ice loading signals by the modern era, ongoing viscous deformation at other modes remains and must be considered (i.e., what is often referred to as a “GIA correction” in the literature must be made to the observed rates before comparing them to our model predictions for modern ice mass change). Estimates of vertical crustal motion resulting from ice mass changes since the Last Glacial Maximum (LGM) differ widely in the literature (e.g., see Fig. 2 in Whitehouse et al., 2019), but within central West Antarctica, most studies predict <5 mm yr−1 contribution to vertical crustal rates (e.g., Argus et al., 2014; van der Wal et al., 2015; Whitehouse et al., 2012; Ivins et al., 2013; Peltier et al., 2015; Gomez et al., 2018). Along with uncertainty associated with ice loading changes throughout the Late Pleistocene and Holocene, significant uncertainty is also associated with the more recent evolution of the West Antarctic Ice Sheet over the millennia preceding the satellite altimetry era. Some work suggests that ice sheet retreat and subsequent readvance affected the ASE in the Holocene (Balco et al., 2023), while others argue against retreat and readvance in the Holocene (Clark et al., 2024). Here we note that ongoing work, which applies Fréchet derivatives to the GIA problem (Lloyd et al., 2024), is focused on better characterizing the sensitivity of crustal rate observations in West Antarctica to past ice loading (Powell et al., 2023). Notwithstanding the substantial uncertainty, here we remove the contribution from ice changes prior to the modern era from the observed vertical crustal rates using two differing estimates from the literature: the Gomez et al. (2018) model and the ICE-6G_C model of Peltier et al. (2015) (light and dark gray dots in Fig. 6a). These models are chosen because they represent low- and high-end predictions of vertical crustal rates compared to other GIA models (e.g., Whitehouse et al., 2019). Note that neither model attempts to accurately treat Late Holocene ice mass changes.
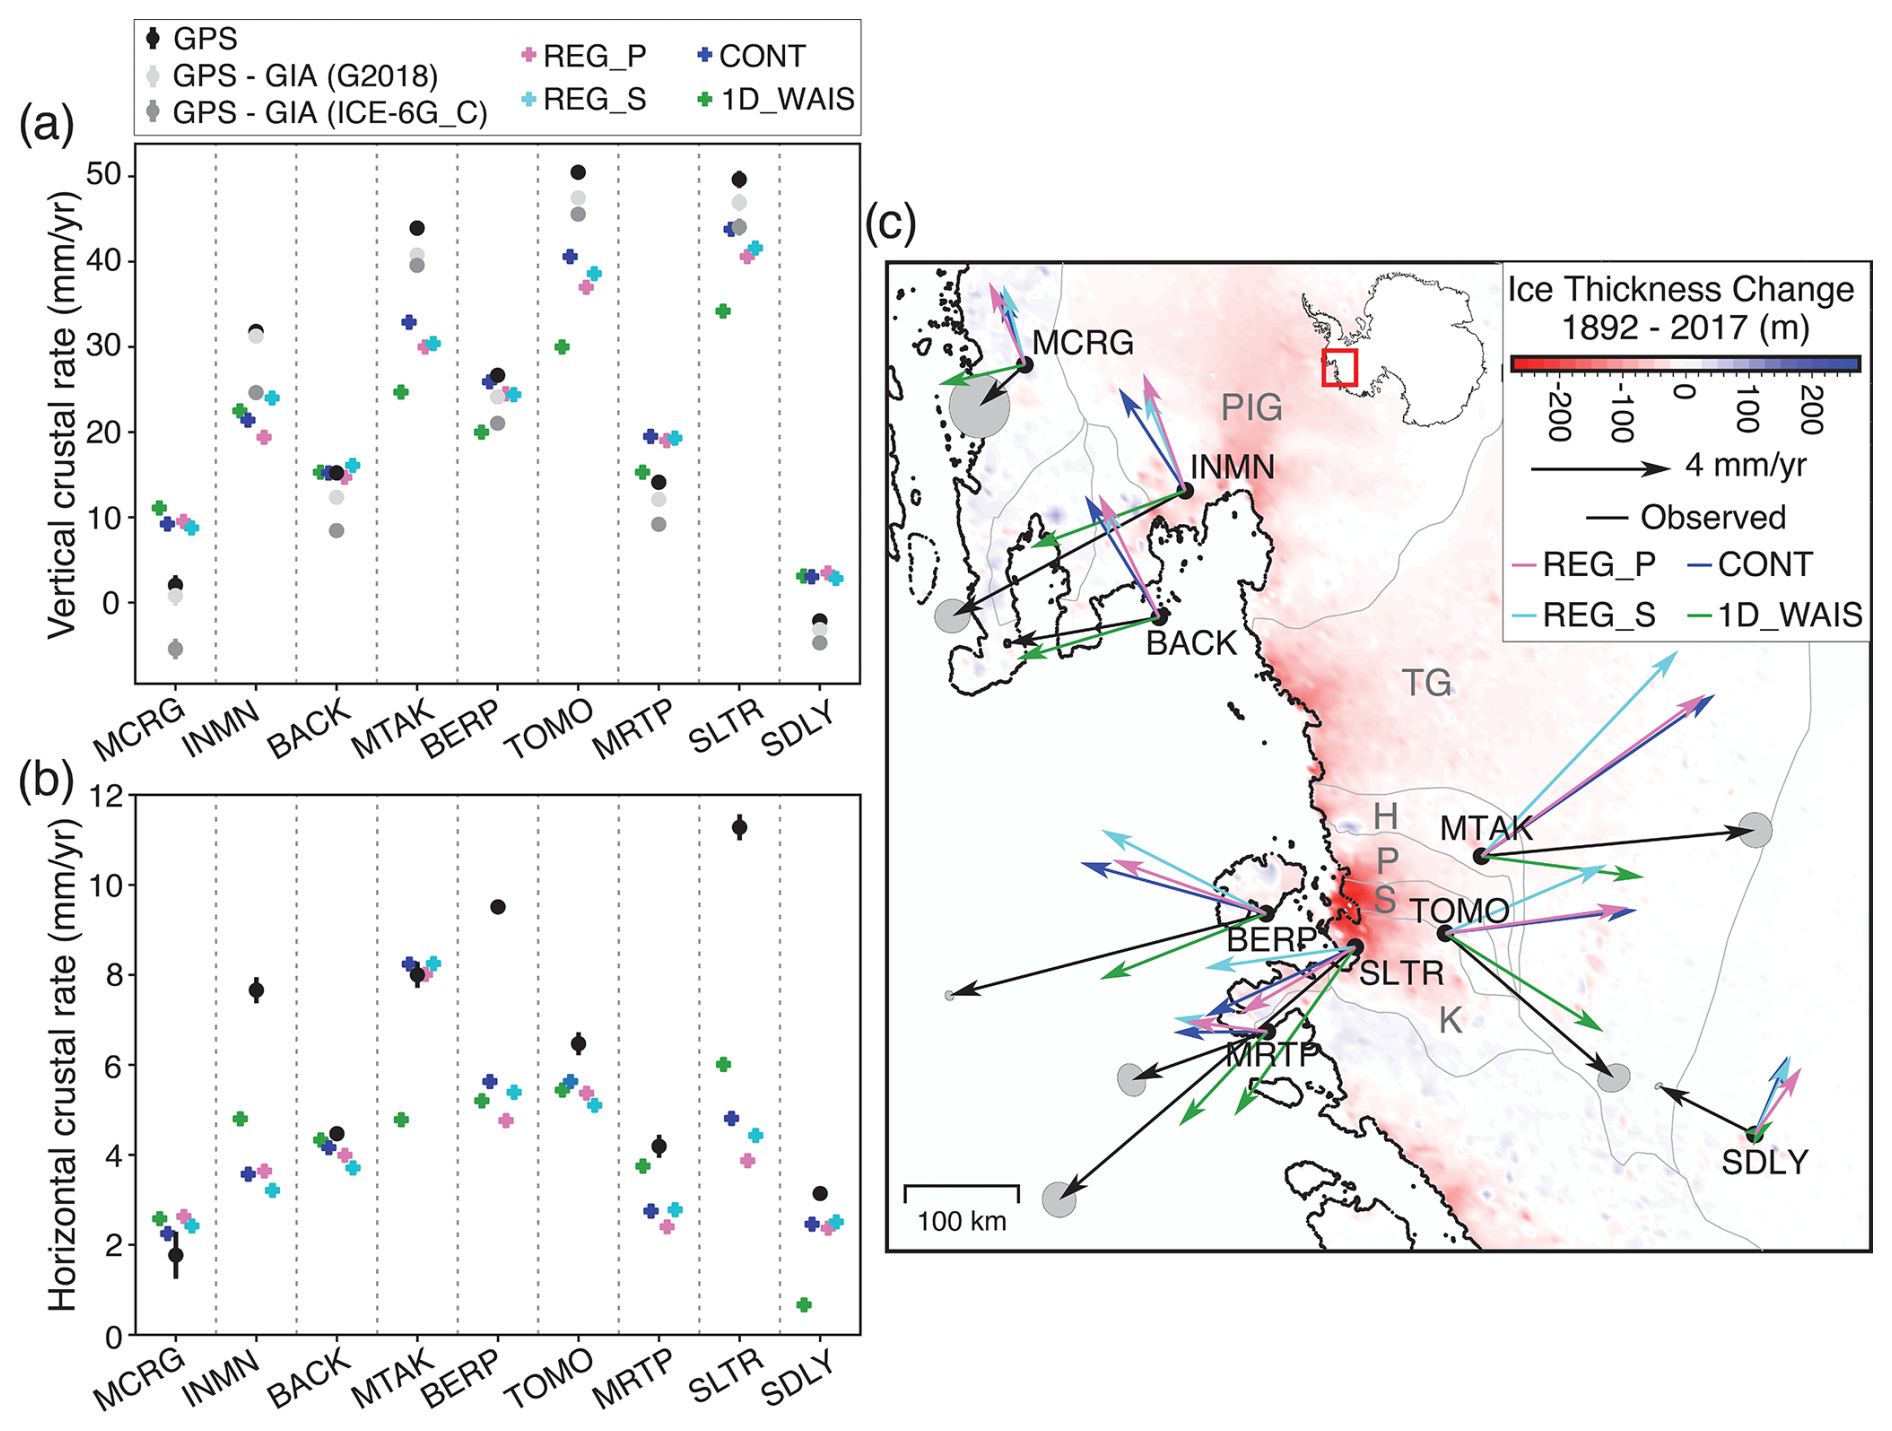
Figure 6Comparison between predicted and observed crustal rates for modern ice loading. (a) Vertical crustal rates observed at select GPS sites located throughout central West Antarctica plotted with predicted vertical crustal rates from simulations adopting the ICE-125 ice model with the REG_P, REG_S, CONT, and 1D_WAIS viscosity models. Predicted crustal rates are calculated as the average crustal rate over the last five years of each simulation. Observed vertical crustal rates are corrected based on the predictions from the Gomez et al. (2018) (abbreviated G2018 in the legend) and ICE-6G_C (Peltier et al., 2015) models. (b) Horizontal crustal rates observed at GPS sites plotted with predicted horizontal crustal rate predictions. Refer to the legend in (a) for details on which symbols correspond to which model runs. (c) Observed and predicted horizontal crustal rates plotted atop the ICE-125 modern ice loading history. Refined glacier basin outlines of the Haynes, Pope, Smith, and Kohler Glaciers, respectively labeled H, P, S, and K, are shown in (c) (Mouginot et al., 2017).
Discrepancies exist between the vertical crustal rates observed at GPS sites across central West Antarctica and those predicted in our GIA simulations (Fig. 6a; Table S1). Regardless of the adopted viscosity model, observed vertical crustal rates are under-predicted by GIA simulations at INMN, MTAK, TOMO, and SLTR, however, over-predicted at MCRG, BACK, MRTP, and SDLY (Fig. 6a). Compared to simulations with 1D_WAIS viscosity model, accounting for heterogeneous upper-mantle structure, whether it be at the continental- or regional-scale, generally leads to the greatest reduction in discrepancies between predicted and observed vertical crustal rates (Fig. 6a; Table S1). Across all GPS sites, the average residual between observed vertical crustal rates (corrected using Gomez et al. (2018) predictions) and our model predictions is 9.1 mm yr−1 for simulations adopting the 1D_WAIS viscosity model. In comparison, the average residuals for simulations using the CONT, REG_P, and REG_S models are 6.1, 6.7, and 7.2 mm yr−1, respectively. Amongst simulations adopting regional- versus continental-scale viscosity structure, differences in vertical crustal rates of up to ∼ 3.6 mm yr−1 are found at individual GPS sites. We find that introducing regional variations in viscosity reduces differences between predicted and observed vertical crustal rates at a number of GPS sites (INMN, BERP, MRTP, SDLY). For example, low-viscosity Feature B prominent in the REG_S model in the PIG basin (Fig. 1e–f) likely produced a faster uplift rate at INMN (+24.0 mm yr−1), which is closer to the observed rate, compared to simulations adopting the REG_P and CONT viscosity models (+21.4 and +19.4 mm yr−1 at INMN, respectively) (Fig. 6a).
Discrepancies between observed and predicted horizontal crustal rates vary significantly with the adopted viscosity model and from site to site (Fig. 6b–c). Note that horizontal crustal rate observations are not adjusted for horizontal motion associated with ice mass changes following the LGM given the great uncertainty associated with such predictions. Unlike with the vertical rates, adopting realistic viscosity structure does not always reduce discrepancies between the magnitude and direction of predicted and observed horizontal crustal rates (Fig. 6b–c). In fact, the direction of horizontal crustal rates predicted using the 1D_WAIS viscosity model generally aligns better with the observed horizontal crustal rates than those predicted in simulations with 3-D viscosity models (Fig. 6c).
While previous work has successfully modeled the direction and magnitude of observed horizontal crustal rates using 1-D GIA models for the ASE (Barletta et al., 2018), horizontal crustal rates predicted by 3-D GIA models have never been compared to observed rates in the region. Comparing predictions from GIA simulations adopting 1-D and 3-D Earth models for modern ice mass changes (1992–2017) in West Antarctica, Powell et al. (2020) show that 3-D Earth structure is necessary to model horizontal crustal rates and capture the viscous signal driving horizontal deformation. However, Powell et al. (2020) did not compare predicted and observed horizontal crustal rates in their analysis. On the other hand, from analyses with a 1-D GIA model and a modern ice history for 1900–2014, Barletta et al. (2018) model observed horizontal crustal rates in the ASE relatively well and finds that horizontal crustal motion predictions are strongly dependent on the geometry of the ice load, more so than vertical crustal motions. From previous work in Antarctica and elsewhere (e.g., Kaufmann et al., 2005; Latychev et al., 2005a; Steffen et al., 2006; Hermans et al., 2018; Vardić et al., 2022), it is evident that horizontal crustal motions depend both on the spatial pattern of ice mass changes and solid Earth structure. Like this study, other studies have also found greater discrepancies between observed and predicted horizontal crustal rates with the adoption of more complex, laterally varying Earth structure (e.g., Steffen et al., 2006). It is possible that inaccuracies in the 3-D viscosity models and ice history adopted in this study compound, in a sense, to produce the discrepant predictions of observed horizontal crustal rates.
Overall, we find that accounting for regional-scale viscosity structure is likely necessary to accurately interpret vertical crustal rate observations at GPS sites, particularly in regions with localized low-/high-viscosity upper-mantle features that are not well-resolved in continental-scale viscosity models. On the other hand, interpretations of horizontal crustal motions are substantially more complex, and our results suggest that introducing 3-D structure may not improve these predictions without more accurate ice history models. These findings have implications for studies that estimate lithospheric thickness and upper-mantle viscosity using bedrock motion observations (e.g., Nield et al., 2014; Wolstencroft et al., 2015; Zhao et al., 2017; Barletta et al., 2018; Samrat et al., 2021). Because regional, basin-scale (∼50–100 km) variability in upper-mantle viscosity will impact GIA predictions, caution is warranted in estimating upper-mantle viscosity using 1-D GIA models in concert with observations of bedrock motion. It should also be noted that discrepancies between predicted and observed crustal rates in the ASE may indicate that mantle deformation is better represented by transient or non-linear rheology (e.g., Lau et al., 2021; Blank et al., 2021; Ivins et al., 2022) rather than the adopted Maxwell viscoelastic rheology. Finally, we emphasize that improving constraints on ice history is critical for reducing data–model misfits of crustal rates.
4.2 Implications of accounting for regional-scale upper structure in future GIA predictions
Our results show that accounting for regional variability in upper-mantle structure has an impact on both sea level and bedrock elevation changes in central West Antarctica over the next few centuries (Figs. 4, 5). It is well established that the evolution of the West Antarctic Ice Sheet depends on the elevation of the solid Earth and sea level change at the grounding line (e.g., Gomez et al., 2010, 2015, 2024; Konrad et al., 2015; Larour et al., 2019). A sea level feedback on grounding line dynamics arises in the marine basins of West Antarctic Ice Sheet, where solid Earth uplift and sea level fall can act to slow and reduce grounding line retreat (Gomez et al., 2010). Several studies have highlighted the importance of Earth structure when assessing feedbacks between GIA and ice dynamics in the ASE (e.g., Kachuck et al., 2020; Book et al., 2022; Gomez et al, 2024). Recent studies (Gomez et al., 2018, 2024; Coulon et al., 2021) demonstrated the importance of considering lateral heterogeneity in Earth structure at a continental-scale for assessing the impact of the sea level feedback on past and future ice sheet evolution in Antarctica; however, regional-scale variability in upper-mantle viscosity has never been accounted for in coupled GIA-ice sheet models.
Across the same TG profile in Fig. 5, Gomez et al. (2024) find that on the order of 100 m of GIA-induced bedrock uplift in a simulation with 3-D, continental-scale viscoelastic Earth model slows and limits grounding line retreat by up to 100 km in 2200 compared to simulations on a rigid bed. Our results indicate that accounting for regional-scale viscosity structure could reduce the amount of uplift at the TG grounding line by up to 20 % (up to ∼20 m), which would negatively impact the strength of the sea level feedback in the region. However, it will be necessary to incorporate regional-scale viscosity structure into a coupled model to rigorously quantify the potential impact.
Kachuck et al. (2020) and Book et al. (2022) adopt simplified, 1-D treatments of Earth deformation to explore the sensitivity of ice sheet model projections to Earth structure and find that a laterally homogeneous low-viscosity upper mantle (1×10¹⁸–4×10¹⁸ Pa s) reduces projected ice mass loss at PIG and TG, respectively. However, these studies do not account for strong lateral variations in upper-mantle viscosity between the grounding line and the interior of the TG and PIG basins (Fig. 1). Our results indicate that this transition from lower- to higher-viscosity upper-mantle material on a transect from the grounding line to the interior of the TG and PIG basins results in higher sea level and lower bedrock elevation predictions at the grounding line of the TG and PIG as soon as 2050 (Figs. 4, 5). As higher sea level at the grounding line will produce greater ice mass flux, the Kachuck et al. (2020) and Book et al. (2022) studies may over-predict the stabilizing effect of solid Earth – ice sheet feedback processes at PIG and TG by neglecting lateral variations in upper-mantle viscosity.
Placing high-resolution constraints on the viscoelastic structure of the solid Earth proximal to the modern-day grounding line will be important for improving the accuracy of GIA predictions for ice mass changes projected over the next ∼100 years; however, localized upper-mantle viscosity features located hundreds of kilometers inland can also impact GIA predictions on multi-century timescales (Figs. 4, 5). For instance, as discussed in Sect. 3.4, the simulation with REG_P predicts ∼10 m lower sea level along the eastern portion of the TG grounding line in 2300 due to the presence of low-viscosity upper-mantle material beneath the Byrd Subglacial Basin (Feature C; Fig. 4b, h), a graben that likely underwent Neogene extension (e.g., LeMasurier, 2008; Granot et al., 2010; Lucas et al., 2020). The influence of accounting for such a localized upper-mantle feature on GIA predictions underscores the need for improved geophysical constraints on the spatial distribution and geometry of similar low-viscosity mantle features across West Antarctica. In particular, further refining constraints on Earth structure in other areas that may have experienced localized Neogene extension – such as the Pine Island Rift (beneath Pine Island Glacier) and Bentley Subglacial Trench (adjacent to Byrd Subglacial Basin) – as well as various Cenozoic volcanic provinces will improve the accuracy of GIA predictions and reduce data–model misfits.
Our results also suggest that accounting for regional variability in upper-mantle viscosity offshore in the Amundsen Sea may be necessary to accurately constrain solid Earth – sea level feedback processes that likely impacted grounding line retreat from the continental shelf since the Last Glacial Maximum (e.g., Kodama et al., 2024) and grounding line retreat and readvance that has been proposed for the ASE during the Holocene (e.g., Johnson et al., 2022; Balco et al., 2023). Overall, accurately accounting for short-wavelength viscosity features (∼50–100 km) across central West Antarctica, not just those proximal to the modern grounding line, is important for improving constraints on the magnitude of solid Earth – ice sheet feedback processes.
In this study, we assess the impact of accounting for regional-scale variations in upper-mantle viscosity, at length scales of 50–100 km, on GIA model predictions in central West Antarctica. We show that differences between simulations adopting upper-mantle viscosity structure inferred from regional- versus continental-scale seismic imaging are large enough to impact the interpretation of crustal motion observations and reach ∼15 % of the total predicted sea level change during the instrumental record. Differences of up to ∼25 % occur between predictions of future sea level change with continental and regional viscosity models in response to future ice loss out to 2300. The largest discrepancies in sea level change predictions between simulations adopting regional versus continental viscosity models are predominantly found proximal to the grounding line for both modern and projected ice mass changes. Generally, we find that horizontal crustal motion predictions are more sensitive than vertical crustal motion predictions to regional-scale variations in upper-mantle viscosity. While there is considerable mismatch between our model predictions of crustal motion rates and the rates observed at GPS sites in central West Antarctica, our results suggest that it may be important to account for regional-scale viscosity structure in areas with localized high-/low-viscosity upper-mantle features that are not well-resolved in continental-scale viscosity models. Accurately accounting for the transition from lower-viscosity upper-mantle material in the coastal ASE to higher viscosities in the interior of the TG and PIG basins will contribute to improving our current understanding of solid Earth – ice sheet – sea level feedbacks in the region.
Our findings highlight that accurately constraining the solid Earth deformational response and sea level changes associated with modern and future ice mass changes in central West Antarctica will be critical for improving our current understanding of ice sheet stability, the interpretation of geophysical observables, and geological records of ice change. Continuing to improve constraints on 3-D solid Earth structure, both proximal to the modern grounding line and across West Antarctica more broadly, will be important for improving the accuracy of GIA predictions. As up to 10 % faster crustal motion rates are found when considering a 125 year modern ice history compared to a 25 year ice history, further constraints on ice sheet evolution prior to the 1990s will also be important for improving data–model fits of crustal motion rates. Finally, while this study focuses on central West Antarctica, the conclusion that regional-scale mantle structure impacts the predicted spatial pattern and rates of crustal deformation and sea level changes in response to surface ice loading changes should be considered when modeling GIA in other regions of the planet, especially those underlain by strongly varying solid Earth structure.
The Seakon 3-D GIA model, which has been used in many previous studies, is described in Latychev et al. (2005b). Efforts are currently underway to make the code publicly available. POLENET-ANET GPS data used for the OSU solution are available at the following DOIs: https://doi.org/10.7283/T5D21VWM (Wilson et al., 2012a), https://doi.org/10.7283/T54J0CC2 (Wilson et al., 2011), https://doi.org/10.7283/T52N50J2 (Wilson et al., 2013), https://doi.org/10.7283/0X9A-H884 (Wilson, 2019a), https://doi.org/10.7283/GRW7-3531 (Wilson, 2018a), https://doi.org/10.7283/TJT4-RW44 (Wilson, 2019b), https://doi.org/10.7283/T5S46Q7F (Wilson et al., 2010), https://doi.org/10.7283/F4P1-MB62 (Wilson, 2018b), https://doi.org/10.7283/T5BZ64B0 (Wilson et al., 2012b). We have made all Seakon model output from simulations with the CONT, REG_P, REG_S, and 1D_WAIS viscosity models and the ICE-125, ICE-25, and ICE-FUT ice models publicly available at https://doi.org/10.20383/103.01249 (Lucas et al., 2025).
The supplement related to this article is available online at https://doi.org/10.5194/tc-19-2387-2025-supplement.
Conceptualization: EML, NG. Methodology: all. Data acquisition and curation: TW and EML. Investigation: all. Visualization: EML. Funding acquisition: all. Supervision: NG and TW. Writing (original draft): EML and NG. Writing (review and editing): all.
The contact author has declared that none of the authors has any competing interests.
Publisher's note: Copernicus Publications remains neutral with regard to jurisdictional claims made in the text, published maps, institutional affiliations, or any other geographical representation in this paper. While Copernicus Publications makes every effort to include appropriate place names, the final responsibility lies with the authors.
This article is part of the special issue “Improving the contribution of land cryosphere to sea level rise projections (TC/GMD/NHESS/OS inter-journal SI)”. It is not associated with a conference.
We thank three anonymous reviewers and the editor, Jan De Rydt, for their insightful feedback that helped us to improve the manuscript. We acknowledge the work of the OSU ANET team, Demián Gómez, Eric Kendrick, Michael Bevis, and David Saddler, for processing the GPS data. We thank Konstantin Latychev for support and advice on working with the Seakon GIA model. We thank the individuals and organizations who have helped with the installation and maintenance of GPS sites across Antarctica. Figures were generated using the Generic Mapping Tools (GMT; Wessel et al., 2019). We thank authors from the Lloyd et al. (2020), Lei et al. (2020), and Afonso et al. (2019) studies for making their models readily available.
This research was supported by Natural Sciences and Engineering Research Council of Canada (grant no. RGPIN-2016-05159 to Natalya Gomez); Canada Research Chairs program (grant no. 241814 to Natalya Gomez). Erica M. Lucas received support from the Wares Postdoctoral Fellowship and the McGill Space Institute Postdoctoral Fellowship. This material is based upon work supported by the National Science Foundation (award no. 1745074 to the Ohio State University).
This paper was edited by Jan De Rydt and reviewed by three anonymous referees.
Adhikari, S., Milne, G. A., Caron, L., Khan, S. A., Kjeldsen, K. K., Nilsson, J., Larour, E., and Ivins, E. R.: Decadal to centennial timescale mantle viscosity inferred from modern crustal uplift rates in Greenland, Geophys. Res. Lett., 48, e2021GL094040, https://doi.org/10.1029/2021GL094040, 2021.
Afonso, J. C., Salajegheh, F., Szwillus, W., Ebbing, J., and Gaina, C.: A global reference model of the lithosphere and upper mantle from joint inversion and analysis of multiple data sets, Geophys. J. Int., 217, 1602–1628, https://doi.org/10.1093/gji/ggz094, 2019.
Argus, D. F., Peltier, W. R., Drummond, R., and Moore, A. W.: The Antarctica component of postglacial rebound model ICE-6G_C (VM5a) based on GPS positioning, exposure age dating of ice thicknesses, and relative sea level histories, Geophys. J. Int., 198, 537–563, https://doi.org/10.1093/Gji/Ggu140, 2014.
Austermann, J., Mitrovica, J. X., Latychev, K., and Milne, G. A.: Barbados-based estimate of ice volume at Last Glacial Maximum affected by subducted plate, Nat. Geosci., 6, 553–557, https://doi.org/10.1038/ngeo1859, 2013.
Balco, G., Brown, N., Nichols, K., Venturelli, R. A., Adams, J., Braddock, S., Campbell, S., Goehring, B., Johnson, J. S., Rood, D. H., Wilcken, K., Hall, B., and Woodward, J.: Reversible ice sheet thinning in the Amundsen Sea Embayment during the Late Holocene, The Cryosphere, 17, 1787–1801, https://doi.org/10.5194/tc-17-1787-2023, 2023.
Barletta, V. R., Bevis, M., Smith, B. E., Wilson, T., Brown, A., Bordoni, A., Willis, M., Khan, S. A., Rovira-Navarro, M., Dalziel, I., Smalley, R., Jr., Kendrick, E., Konfal, S., Caccamise 2nd, D. J., Aster, R. C., Nyblade, A., and Wiens, D. A.: Observed rapid bedrock uplift in Amundsen Sea Embayment promotes ice-sheet stability, Science, 360, 1335–1339, https://doi.org/10.1126/science.aao1447, 2018.
Bevis, M. and Brown, A.: Trajectory models and reference frames for crustal motion geodesy, J. Geod., 88, 283–311, https://doi.org/10.1007/s00190-013-0685-5, 2014.
Bevis, M., Brown, A., and Kendrick, E.: Devising stable geometrical reference frames for use in geodetic studies of vertical crustal motion, J. Geod., 87, 311–321, https://doi.org/10.1007/s00190-012-0600-5, 2013.
Bevis, M., Bedford, J., and Caccamise II, D.: The Art and Science of Trajectory Modeling, in: Geodetic Time Series Analysis in Earth Sciences, edited by: Montillet, J.-P. and Bos, M., 1–28, https://doi.org/10.1007/978-3-030-21718-1_1, 2019.
Blank, B., Barletta, V., Hu, H., Pappa, F., and van der Wal, W.: Effect of Lateral and Stress-Dependent Viscosity Variations on GIA Induced Uplift Rates in the Amundsen Sea Embayment, Geochem. Geophys. Geosys., 22, e2021GC009807, https://doi.org/10.1029/2021GC009807, 2021.
Boehm, J., Niell, A., Tregoning, P., and Schuh, H.: Global Mapping Function (GMF): A new empirical mapping function based on numerical weather model data, Geophys. Res. Lett., 33, L07304, https://doi.org/10.1029/2005GL025546, 2006.
Book, C., Hoffman, M. J., Kachuck, S. B., Hillebrand, T. R., Price, S. F., Perego, M., and Bassis, J. N.: Stabilizing effect of bedrock uplift on retreat of Thwaites Glacier, Antarctica, at centennial timescales, Earth Planet. Sc. Lett., 597, 117798, https://doi.org/10.1016/j.epsl.2022.117798, 2022.
Carrivick, J. L., Davies, B. J., James, W. H., McMillan, M., and Glasser, N. F.: A comparison of modelled ice thickness and volume across the entire Antarctic Peninsula region, Geogr. Ann. A, 101, 45–67, https://doi.org/10.1080/04353676.2018.1539830, 2019.
Chaput, J., Aster, R. C., Huerta, A., Sun, X., Lloyd, A. D., Wiens, D., Nyblade, A. A., Anandakrishnan, S., Winberry, J. P., and Wilson, T.: The crustal thickness of West Antarctica, J. Geophys. Res.-Sol. Ea., 119, 378–395, https://doi.org/10.1002/2013jb010642, 2014.
Clark, R. W., Wellner, J. S., Hillenbrand, C. D., Totten, R. L., Smith, J. A., Miller, L. E., Larter, R. D., Hogan, K. A., Graham, A. G. C., Nitsche, F. O., Lehrmann, A. A., Lepp, A. P., Kirkham, J. D., Fitzgerald, V. T., Garcia-Barrera, G., Ehrmann, W., and Wacker, L.: Synchronous retreat of Thwaites and Pine Island glaciers in response to external forcings in the presatellite era, P. Natl. Acad. Sci. USA, 121, e2211711120, https://doi.org/10.1073/pnas.2211711120, 2024.
Corr, H. F. J. and Vaughan, D. G.: A recent volcanic eruption beneath the West Antarctic ice sheet, Nat. Geosci., 1, 122-125, https://doi.org/10.1038/ngeo106, 2008.
Coulon, V., Bulthuis, K., Whitehouse, P. L., Sun, S., Haubner, K., Zipf, L., and Pattyn, F.: Contrasting response of West and East Antarctic ice sheets to glacial isostatic adjustment, J. Geophys. Res.-Earth Surf., 126, e2020JF006003, https://doi.org/10.1029/2020JF006003, 2021.
DeConto, R. M., Pollard, D., Alley, R. B., Velicogna, I., Gasson, E., Gomez, N., Sadai, S., Condron, A., Gilford, D. M., Ashe, E. L., Kopp, R. E., Li, D., and Dutton, A.: The Paris Climate Agreement and future sea-level rise from Antarctica, Nature, 593, 83–89, https://doi.org/10.1038/s41586-021-03427-0, 2021.
Fretwell, P., Pritchard, H. D., Vaughan, D. G., Bamber, J. L., Barrand, N. E., Bell, R., Bianchi, C., Bingham, R. G., Blankenship, D. D., Casassa, G., Catania, G., Callens, D., Conway, H., Cook, A. J., Corr, H. F. J., Damaske, D., Damm, V., Ferraccioli, F., Forsberg, R., Fujita, S., Gim, Y., Gogineni, P., Griggs, J. A., Hindmarsh, R. C. A., Holmlund, P., Holt, J. W., Jacobel, R. W., Jenkins, A., Jokat, W., Jordan, T., King, E. C., Kohler, J., Krabill, W., Riger-Kusk, M., Langley, K. A., Leitchenkov, G., Leuschen, C., Luyendyk, B. P., Matsuoka, K., Mouginot, J., Nitsche, F. O., Nogi, Y., Nost, O. A., Popov, S. V., Rignot, E., Rippin, D. M., Rivera, A., Roberts, J., Ross, N., Siegert, M. J., Smith, A. M., Steinhage, D., Studinger, M., Sun, B., Tinto, B. K., Welch, B. C., Wilson, D., Young, D. A., Xiangbin, C., and Zirizzotti, A.: Bedmap2: improved ice bed, surface and thickness datasets for Antarctica, The Cryosphere, 7, 375–393, https://doi.org/10.5194/tc-7-375-2013, 2013.
Geyer, A.: Antarctic volcanism: active volcanism overview, Volcanism in Antarctica: 200 Million Years of Subduction, Rifting and Continental Break-up, Memoirs, vol. 55, edited by: Smellie, J. L., Panter, K. S., and Geyer, A., Geological Society, London, https://doi.org/10.1144/M55-2020-12, 2021.
Gómez, D.: Parallel.GAMIT (Version 1.0.0) [software], https://github.com/demiangomez/Parallel.GAMIT (last access: 30 June 2025), 2017.
Gomez, N., Mitrovica, J. X., Huybers, P., and Clark, P. U.: Sea level as a stabilizing factor for marine-ice-sheet grounding lines, Nat. Geosci., 3, 850–853, https://doi.org/10.1038/ngeo1012, 2010.
Gomez, N., Pollard, D., and Holland, D.: Sea-level feedback lowers projections of future Antarctic Ice-Sheet mass loss, Nat. Commun., 6, 8798, https://doi.org/10.1038/ncomms9798, 2015.
Gomez, N., Latychev, K., and Pollard, D.: A coupled ice sheet–sea level model incorporating 3D earth structure: variations in Antarctica during the last deglacial retreat, J. Climate, 31, 4041–4054, https://doi.org/10.1175/JCLI-D-17-0352.1, 2018.
Gomez, N. Yousefi, M., Pollard, D., DeConto, R. M., Sadai, S., Lloyd, A., Nyblade, A., Wiens, D. A., Aster, R. C., and Wilson, T.: The influence of realistic 3D mantle viscosity on Antarctica's contribution to future global sea levels, Sci. Adv., 10, eadn1470, https://doi.org/10.1126/sciadv.adn1470, 2024.
Granot, R., Cande, S. C., Stock, J. M., Davey, F. J., and Clayton, R. W.: Postspreading rifting in the Adare Basin, Antarctica: Regional tectonic consequences, Geochem. Geophys. Geosyst., 11, Q08005, https://doi.org/10.1029/2010GC003105, 2010.
Granot, R., Cande, S. C., Stock, J. M., and Damaske, D.: Revised Eocene-Oligocene kinematics for the West Antarctic rift system, Geophys. Res. Lett., 40, 279–284, https://doi.org/10.1029/2012GL054181, 2013.
Hansen, S. E., Graw, J. H., Kenyon, L. M., Nyblade, A. A., Wiens, D. A., Aster, R. C., Huerta, A. D., Anandakrishnan, S., and Wilson, T.: Imaging the Antarctic mantle using adaptively parameterized P-wave tomography: Evidence for heterogeneous structure beneath West Antarctica, Earth Planet. Sc. Lett., 408, 66–78, https://doi.org/10.1016/j.epsl.2014.09.043, 2014.
Heeszel, D. S., Wiens, D. A., Anandakrishnan, S., Aster, R. C., Dalziel, I. W., Huerta, A. D., Nyblade, A. A., Wilson, T. J., and Winberry, J. P.: Upper mantle structure of central and West Antarctica from array analysis of Rayleigh wave phase velocities, J. Geophys. Res.-Sol. Ea., 121, 1758–1775, https://doi.org/10.1002/2015JB012616, 2016.
Hermans, T., van der Wal, W., and Broerse, T.: Reversal of the direction of horizontal velocities induced by GIA as a function of mantle viscosity, Geophys. Res. Lett., 45, 9597–9604, https://doi.org/10.1029/2018GL078533, 2018.
Ivins, E. R. and Sammis, C. G.: On lateral viscosity contrast in the mantle and the rheology of low-frequency geodynamics, Geophys. J. Int., 123, 305–322, https://doi.org/10.1111/j.1365-246X.1995.tb06856.x, 1995.
Ivins, E. R., James, T. S., Wahr, J., Schrama, E. J. O., Landerer, F. W., and Simon, K. M.: Antarctic Contribution to Sea-Level Rise Observed by GRACE with Improved GIA Correction, J. Geophys. Res.-Sol. Ea., 118, 3126–3141, https://doi.org/10.1002/jgrb.50208, 2013.
Ivins, E. R., Caron, L., Adhikari, S., and Larour, E.: Notes on a compressible extended Burgers model of rheology, Geophys. J. Int., 228, 1975–1991, https://doi.org/10.1093/gji/ggab452, 2022.
Ivins, E. R., van der Wal, W., Wiens, D. A., Lloyd, A. J., and Caron, L.: Antarctic upper mantle rheology, The Geochemistry and Geophysics of Antarctic Mantle, Memoirs, vol. 56, edited by: Martin, A., and van der Wal, W., Geol. Soc. Lond., 267–294, https://doi.org/10.1144/M56-2020-19, 2023.
Johnson, J. S., Venturelli, R. A., Balco, G., Allen, C. S., Braddock, S., Campbell, S., Goehring, B. M., Hall, B. L., Neff, P. D., Nichols, K. A., Rood, D. H., Thomas, E. R., and Woodward, J.: Review article: Existing and potential evidence for Holocene grounding line retreat and readvance in Antarctica, The Cryosphere, 16, 1543–1562, https://doi.org/10.5194/tc-16-1543-2022, 2022.
Jordan, T. A., Ferraccioli, F., Vaughan, D. G., Holt, J. W., Corr, H., Blankenship, D. D., and Diehl, T. M.: Aerogravity evidence for major crustal thinning under the Pine Island Glacier region (West Antarctica), Geol. Soc. Am. Bull., 122, 714–726, https://doi.org/10.1130/B26417.1, 2010.
Kachuck, S. B., Martin, D. F., Bassis, J. N., and Price, S. F.: Rapid viscoelastic deformation slows marine ice sheet instability at Pine Island Glacier, Geophys. Res. Lett., 47, e2019GL086446, https://doi.org/10.1029/2019GL086446, 2020.
Kaufmann, G., Wu, P., and Ivins, E. R.: Lateral viscosity variations beneath Antarctica and their implications on regional rebound motions and seismotectonics, J. Geodyn. 39, 165–181, https://doi.org/10.1016/j.jog.2004.08.009, 2005.
Kendall, R. A., Mitrovica, J. X., and Milne, G. A.: On post-glacial sea level–II. Numerical formulation and comparative results on spherically symmetric models, Geophys. J. Int., 161, 679–706, https://doi.org/10.1111/j.1365-246X.2005.02553.x, 2005.
King, M. A., Bingham, R. J., Moore, P., Whitehouse, P. L., Bentley, M. J., and Milne, G. A.: Lower satellite-gravimetry estimates of Antarctic sea-level contribution, Nature, 491, 586–589, https://doi.org/10.1038/nature11621, 2012.
Kodama, S. T., Pico, T., Robel, A. A., Christian, J. E., Gomez, N., Vigilia, C., Powell, E., Gagliardi, J., Tulaczyk, S., and Blackburn, T.: Impact of glacial isostatic adjustment on zones of potential grounding line stability in the Ross Sea Embayment (Antarctica) since the Last Glacial Maximum, EGUsphere [preprint], https://doi.org/10.5194/egusphere-2024-3465, 2024.
Konrad, H., Sasgen, I., Pollard, D., and Klemann, V.: Potential of the solid-Earth response for limiting long-term West Antarctic Ice Sheet retreat in a warming climate, Earth Planet. Sc. Lett., 432, 254–264, https://doi.org/10.1016/j.epsl.2015.10.008, 2015.
Kustowski, B., Ekström, G., and Dziewoński, A.: Anisotropic shear-wave velocity structure of the Earth's mantle: A global model, J. Geophys. Res.-Sol. Ea., 113, B06306, https://doi.org/10.1029/2007JB005169, 2008.
Larour, E., Seroussi, H., Adhikari, S., Ivins, E., Caron, L., Morlighem, M., and Schlegel, N.: Slowdown in Antarctic mass loss from solid Earth and sea-level feedbacks, Science, 364, eaav7908, https://doi.org/10.1126/science.aav7908, 2019.
Latychev, K., Mitrovica, J. X., Tamisiea, M. E., Tromp, J., and Moucha, R.: Influence of lithospheric thickness variations on 3-D crustal velocities due to glacial isostatic adjustment, Geophys. Res. Lett., 32, L01304, https://doi.org/10.1029/2004GL021454, 2005a.
Latychev, K., Mitrovica, J. X., Tromp, J., Tamisiea, M. E., Komatitsch, D., and Christara, C. C.: Glacial isostatic adjustment on 3-D Earth models: a finite-volume formulation, Geophys. J. Int., 161, 421–444, https://doi.org/10.1111/j.1365-246X.2005.02536.x, 2005b.
Lau, H. C. P.: Transient rheology in sea level change: Implications for Meltwater Pulse 1A, Earth Planet. Sc. Lett., 609, 118106, https://doi.org/10.1016/j.epsl.2023.118106, 2023.
Lau, H. C. P., Austermann, J., Holtzman, B. K., Havlin, C., Lloyd, A. J., Book, C., and Hopper, E.: Frequency dependent mantle viscoelasticity via the complex viscosity: Cases from Antarctica, J. Geophys. Res.-Sol. Ea., 126, e2021JB022622, https://doi.org/10.1029/2021JB022622, 2021.
Lei, W., Ruan, Y., Bozdağ, E., Peter, D., Lefebvre, M., Komatitsch D., Tromp J., Hill J., Podhorszki N., and Pugmire D.: Global adjoint tomography – model GLAD-m25, Geophys. J. Int., 223, 1–21, https://doi.org/10.1093/gji/ggaa253, 2020.
LeMasurier, W. E.: Neogene extension and basin deepening in the West Antarctic rift inferred from comparisons with the East African rift and other analogs, Geology, 36, 247–250, https://doi.org/10.1130/G24363A.1, 2008.
Lloyd, A., Wiens, D., Zhu, H., Tromp, J., Nyblade, A., Aster, R., Hansen, S., Dalziel, I., Wilson, T., and Ivins, E.: Seismic structure of the Antarctic upper mantle imaged with adjoint tomography, J. Geophys. Res.-Sol. Ea., 125, 3, https://doi.org/10.1029/2019JB017823, 2020.
Lloyd, A., Crawford, O., Al-Attar, D., Austermann, J., Hoggard, M. J., Richards, F. D., and Syvret, F.: GIA imaging of 3-D mantle viscosity based on palaeo sea level observations – Part I: Sensitivity kernels for an Earth with laterally varying viscosity, Geophys. J. Int., 236, 1139–1171, https://doi.org/10.1093/gji/ggad455, 2024.
Lloyd, A. J., Wiens, D. A., Nyblade, A. A., Anandakrishnan, S., Aster, R. C., Huerta, A. D., Wilson, T. J., Dalziel, I. W. D., Shore, P. J., and Zhao, D.: A seismic transect across West Antarctica: Evidence for mantle thermal anomalies beneath the Bentley subglacial Trench and the Marie Byrd Land Dome, J. Geophys. Res.-Sol. Ea., 120, 8439–8460, https://doi.org/10.1002/2015jb012455, 2015.
Lucas, E. M., Soto, D., Nyblade, A. A., Lloyd, A. J., Aster, R. C., Wiens, D. A., O'Donnell, J. P., Stuart, G. W., Wilson, T. J., Dalziel, I. W., and Winberry, J. P.: P-and S-wave velocity structure of central West Antarctica: implications for the tectonic evolution of the West Antarctic Rift System, Earth Planet. Sc. Lett., 546, 116437, https://doi.org/10.1016/j.epsl.2020.116437, 2020.
Lucas, E. M., Nyblade, A. A., Lloyd, A. J., Aster, R. C., Wiens, D. A., O'Donnell, J. P., Stuart, G. W., Wilson, T. J., Dalziel, I. W. D., Winberry, J. P., and Huerta, A. D.: Seismicity and Pn velocity structure of Central West Antarctica. Geochem. Geophys. Geosyst., 22, e2020GC009471, https://doi.org/10.1029/2020GC009471, 2021.
Lucas, E. M., Nyblade, A. A., Accardo, N. J., Lloyd, A. J., Wiens, D. A., Aster, R. C., Wilson, T. J., Dalziel, I. W., Stuart, G. W., O'Donnell, J. P., Winberry, J. P., and Huerta, A. D.: Shear wave splitting across Antarctica: Implicaaations for Upper Mantle Seismic Anisotropy, J. Geophys. Res.-Sol. Ea., 127, e2021JB023325, https://doi.org/10.1029/2021JB023325, 2022.
Lucas, E., Gomez, N., and Wilson, T.: Materials from Lucas et al. (2025) “The impact of regional-scale upper mantle heterogeneity on glacial isostatic adjustment in West Antarctica”, Federated Research Data Repository [data set], https://doi.org/10.20383/103.01249, 2025.
Lyard, F. H., Allain, D. J., Cancet, M., Carrère, L., and Picot, N.: FES2014 global ocean tide atlas: design and performance, Ocean Sci., 17, 615–649, https://doi.org/10.5194/os-17-615-2021, 2021.
Mitrovica, J. and Forte, A.: A new inference of mantle viscosity based upon joint inversion of convection and glacial isostatic adjustment data, Earth Planet. Sc. Lett., 225, 177–189, https://doi.org/10.1016/j.epsl.2004.06.005, 2004.
Mouginot, J., Rignot, E., Scheuchl, B., and Millan, R.: Comprehensive Annual Ice Sheet Velocity Mapping Using Landsat-8, Sentinel-1, and RADARSAT-2 Data, Remote Sens., 9, 364, https://doi.org/10.3390/rs9040364, 2017.
Nield, G. A., Barletta, V. R., Bordoni, A., King, M. A., Whitehouse, P. L., Clarke, P. J., Domack, E., Scambos, T. A., and Berthier, E.: Rapid bedrock uplift in the Antarctic Peninsula explained by viscoelastic response to recent ice unloading, Earth Planet. Sc. Lett., 397, 32–41, https://doi.org/10.1016/j.epsl.2014.04.019, 2014.
Nield, G. A., Whitehouse, P. L., van der Wal, W., Blank, B., O'Donnell, J. P., and Stuart, G. W.: The impact of lateral variations in lithospheric thickness on glacial isostatic adjustment in West Antarctica, Geophys. J. Int., 214, 811–824, https://doi.org/10.1093/gji/ggy158, 2018.
O'Donnell, J. P., Selway, K., Nyblade, A. A., Brazier, R. A., Wiens, D. A., Anandakrishnan, S., Aster, R. C., Huerta, A. D., Wilson, T., and Winberry, J. P.: The uppermost mantle seismic velocity and viscosity structure of central West Antarctica, Earth Planet. Sc. Lett., 472, 38-49, https://doi.org/10.1016/j.epsl.2017.05.016, 2017.
O'Donnell, J. P., Stuart, G. W., Brisbourne, A. M., Selway, K., Yang, Y., and Nield, G. A.: The uppermost mantle seismic velocity structure of West Antarctica from Rayleigh wave tomography: Insights into tectonic structure and geothermal heat flow, Earth Planet. Sc. Lett., 522, 219–233, https://doi.org/10.1016/j.epsl.2019.06.024, 2019.
Paulson, A., Zhong, S. J., and Wahr, J.: Modelling post-glacial rebound with lateral viscosity variations, Geophys. J. Int., 163, 357–371, https://doi.org/10.1111/j.1365-246X.2005.02645.x, 2005.
Peltier, W. R.: The impulse response of a Maxwell Earth, Rev. Geophys., 12, 649–669, https://doi.org/10.1029/RG012i004p00649, 1974.
Peltier, W., Argus, D. F., and Drummond, R.: Space geodesy constrains ice age terminal deglaciation: The global ICE-6G_C (VM5a) model, J. Geophys. Res.-Sol. Ea., 120, 450–487, https://doi.org/10.1002/2014JB011176, 2015.
Powell, E., Gomez, N., Hay, C., Latychev, K., and Mitrovica, J.: Viscous effects in the solid Earth response to modern Antarctic ice mass flux: Implications for geodetic studies of WAIS stability in a warming world, J. Climate, 33, 443–459, https://doi.org/10.1175/JCLI-D-19-0479.1, 2020.
Powell, E., Latychev, K., Gomez, N., and Mitrovica, J. X.: The robustness of geodetically-derived 1-D Antarctic viscosity models in the presence of complex 3-D viscoelastic Earth structure, Geophys. J. Int., 231, ggac129, https://doi.org/10.1093/gji/ggac129, 2022.
Powell, E., Lloyd, A., Austermann, J., Al-Attar, D., and Mitrovica, J.: What portion of the ice load do Antarctic GPS observations “see”?, in: INSTANT2023 Abstracts, 11–14 September 2023, Trieste, Italy, 232, https://instant2023.org/wp-content/uploads/2023/09/INSTANT2023-Book-of-Abstracts.pdf (last access: 30 June 2025), 2023.
Quartini, E., Blankenship, D. D., and Young, D. A.: Active subglacial volcanism in West Antarctica, Geological Society, London, Memoirs, 55, 785–803, https://doi.org/10.1144/M55-2019-3, 2021.
Rignot, E., Mouginot, J., Scheuchl, B., van den Broeke, M., van Wessem, M. J., and Morlighem, M.: Four decades of Antarctic Ice Sheet mass balance from 1979–2017, P. Natl. Acad. Sci. USA, 116, 1095–1103, https://doi.org/10.1073/pnas.1812883116, 2019.
Samrat, N. H., King, M. A., Watson, C., Hay, A., Barletta, V. R., and Bordoni, A., Upper Mantle Viscosity Underneath Northern Marguerite Bay, Antarctic Peninsula Constrained by Bedrock Uplift and Ice Mass Variability, Geophys. Res. Lett., 48, e2021GL097065, https://doi.org/10.1029/2021GL097065, 2021.
Seroussi, H., Verjans, V., Nowicki, S., Payne, A. J., Goelzer, H., Lipscomb, W. H., Abe-Ouchi, A., Agosta, C., Albrecht, T., Asay-Davis, X., Barthel, A., Calov, R., Cullather, R., Dumas, C., Galton-Fenzi, B. K., Gladstone, R., Golledge, N. R., Gregory, J. M., Greve, R., Hattermann, T., Hoffman, M. J., Humbert, A., Huybrechts, P., Jourdain, N. C., Kleiner, T., Larour, E., Leguy, G. R., Lowry, D. P., Little, C. M., Morlighem, M., Pattyn, F., Pelle, T., Price, S. F., Quiquet, A., Reese, R., Schlegel, N.-J., Shepherd, A., Simon, E., Smith, R. S., Straneo, F., Sun, S., Trusel, L. D., Van Breedam, J., Van Katwyk, P., van de Wal, R. S. W., Winkelmann, R., Zhao, C., Zhang, T., and Zwinger, T.: Insights into the vulnerability of Antarctic glaciers from the ISMIP6 ice sheet model ensemble and associated uncertainty, The Cryosphere, 17, 5197–5217, https://doi.org/10.5194/tc-17-5197-2023, 2023.
Shen, W., Wiens, D. A., Anandakrishnan, S., Aster, R. C., Gerstoft, P., Bromirski, P. D., Hansen, S. E., Dalziel, I. W., Heeszel, D. S., and Huerta, A. D.: The crust and upper mantle structure of central and West Antarctica from Bayesian inversion of Rayleigh wave and receiver functions, J. Geophys. Res.-Sol. Ea., 123, 7824–7849, https://doi.org/10.1029/2017JB015346, 2018.
Shepherd, A., Gilbert, L., Muir, A. S., Konrad, H., McMillan, M., Slater, T., Briggs, K. H., Sundal, A. V., Hogg, A. E., and Engdahl, M. E.: Trends in Antarctic Ice Sheet elevation and mass, Geophys. Res. Lett., 46, 8174–8183, https://doi.org/10.1029/2019GL082182, 2019.
Siddoway, C. S.: Tectonics of the West Antarctic Rift System: New light on the history and dynamics of distributed intracontinental extension. Antarctica: A keystone in a changing world, edited by: Cooper, A. K., Barrett, P., Stagg, H., Storey, B., Stump, E., Wise. W., and the 10th ISAES editorial team, 91–114, National Academies Press, https://doi.org/10.3133/ofr20071047KP09, 2008.
Steffen, H., Kaufmann, G., and Wu. P.: Three-dimensional finite-element modeling of the glacial isostatic adjustment in Fennoscandia, Earth Planet. Sc. Lett., 250, 358–375, https://doi.org/10.1016/j.epsl.2006.08.003, 2006.
The IMBIE team: Mass balance of the Antarctic Ice Sheet from 1992 to 2017, Nature, 558, 219–222, https://doi.org/10.1038/s41586-018-0179-y, 2018.
Valencic, N., Pan, L., Latychev, K., Gomez, N., Powell, E., and Mitrovica, J. X.: Mapping geodetically inferred Antarctic ice surface height changes into thickness changes: a sensitivity study, The Cryosphere, 18, 2969–2978, https://doi.org/10.5194/tc-18-2969-2024, 2024.
VanDecar, J. C.: Upper-Mantle Structure of the Cascadia Subduction Zone from Non-Linear Teleseismic Travel-Time Inversion, Ph.D. thesis, University of Washington, United States, 1991.
van der Wal, W., Whitehouse, P. L., and Schrama, E. J.: Effect of GIA models with 3D composite mantle viscosity on GRACE mass balance estimates for Antarctica, Earth Planet. Sc. Lett., 414, 134–143, https://doi.org/10.1016/j.epsl.2015.01.001, 2015.
Vardić, K., Clarke, P. J., and Whitehouse, P. L.: A GNSS velocity field for crustal deformation studies: the influence of glacial isostatic adjustment on plate motion models, Geophys. J. Int., 231, 426–458, https://doi.org/10.1093/gji/ggac047, 2022.
Wan, J. X. W., Gomez, N., Latychev, K., and Han, H. K.: Resolving glacial isostatic adjustment (GIA) in response to modern and future ice loss at marine grounding lines in West Antarctica, The Cryosphere, 16, 2203–2223, https://doi.org/10.5194/tc-16-2203-2022, 2022.
Wessel, P., Luis, J. F., Uieda, L., Scharroo, R., Wobbe, F., Smith, W. H. F., and Tian, D.: The Generic Mapping Tools Version 6, Geochem. Geophys. Geosyst., 20, 5556–5564, https://doi.org/10.1029/2019GC008515, 2019.
White-Gaynor, A. L., Nyblade, A. A., Aster, R. C., Wiens, D. A., Bromirski, P. D., Gerstoft, P., Stephen, R. A., Hansen, S. E., Wilson, T., Dalziel, I. W., Huerta, A. D., Winberry, J. P., and Anandakrishnan, S.: Heterogeneous upper mantle structure beneath the Ross Sea Embayment and Marie Byrd Land, West Antarctica, revealed by P-wave tomography, Earth Planet. Sc. Lett., 513, 40–50, https://doi.org/10.1016/j.epsl.2019.02.013, 2019.
Whitehouse, P. L., Bentley, M. J., Milne, G. A., King, M. A., and Thomas, I. D.: A new glacial isostatic adjustment model for Antarctica: calibrated and tested using observations of relative sea-level change and present-day uplift rates, Geophys. J. Int., 190, 1464–1482, https://doi.org/10.1111/j.1365-246X.2012.05557.x, 2012.
Whitehouse, P. L., Gomez, N., King, M. A., and Wiens, D. A.: Solid Earth change and the evolution of the Antarctic Ice Sheet, Nat. Commun., 10, 503, https://doi.org/10.1038/s41467-018-08068-y, 2019.
Wiens, D. A., Shen, W., and Lloyd, A. J.: The seismic structure of the Antarctic upper mantle, The Geochemistry and Geophysics of Antarctic Mantle, Memoirs, vol. 56, edited by: Martin, A., and van der Wal, W., Geol. Soc. Lond., 267–294, https://doi.org/10.1144/M56-2020-19, 2023.
Wilson, T.: Antarctica-POLENET GPS Network – MRTP-Martin_Peninsula P.S., The NSF GAGE Facility operated by EarthScope Consortium, GPS/GNSS Observations Dataset [data set], https://doi.org/10.7283/GRW7-3531, 2018a.
Wilson, T.: Antarctica-POLENET GPS Network – SLTR-Slater_Rocks____ P.S., The NSF GAGE Facility operated by EarthScope Consortium, GPS/GNSS Observations Dataset [data set], https://doi.org/10.7283/F4P1-MB62, 2018b.
Wilson, T.: Antarctica-POLENET GPS Network – MCRG-Miller_Crag_____ P.S., The NSF GAGE Facility operated by EarthScope Consortium, GPS/GNSS Observations Dataset [data set], https://doi.org/10.7283/0X9A-H884, 2019a.
Wilson, T.: Antarctica-POLENET GPS Network – MTAK-Mount_Takahe____ P.S., The NSF GAGE Facility operated by EarthScope Consortium, GPS/GNSS Observations Dataset [data set], https://doi.org/10.7283/TJT4-RW44, 2019b.
Wilson, T., Bevis, M., Smalley Jr., R., Dalziel, I., Kendrick, E., Konfal, S., Saddler, D., and Willlis, M.: Antarctica-POLENET GPS Network - SDLY-Mount Sidley P.S., The NSF GAGE Facility operated by EarthScope Consortium, GPS/GNSS Observations Dataset [data set], https://doi.org/10.7283/T5S46Q7F, 2010.
Wilson, T., Bevis, M., Smalley Jr., R., Dalziel, I., Kendrick, E., Konfal, S., Saddler, D., and Willlis, M.: Antarctica-POLENET GPS Network – BERP-Bear Peninsula P.S., The NSF GAGE Facility operated by EarthScope Consortium, GPS/GNSS Observations Dataset [data set], https://doi.org/10.7283/T54J0CC2, 2011.
Wilson, T., Bevis, M., Smalley Jr., R., Dalziel, I., Kendrick, E., Konfal, S., Saddler, D., and Willlis, M.: Antarctica-POLENET GPS Network – BACK-Backer Island P.S., The NSF GAGE Facility operated by EarthScope Consortium, GPS/GNSS Observations Dataset [data set], https://doi.org/10.7283/T5D21VWM, 2012a.
Wilson, T., Bevis, M., Smalley Jr., R., Dalziel, I., Kendrick, E., Konfal, S., Saddler, D., and Willlis, M.: Antarctica-POLENET GPS Network - TOMO-Toney Mountain P.S., The NSF GAGE Facility operated by EarthScope Consortium, GPS/GNSS Observations Dataset [data set], https://doi.org/10.7283/T5BZ64B0, 2012b.
Wilson, T., Bevis, M., Smalley Jr., R., Dalziel, I., Kendrick, E., Konfal, S., Saddler, D., and Willlis, M.: Antarctica-POLENET GPS Network – INMN-Inman Nunatak P.S., The NSF GAGE Facility operated by EarthScope Consortium, GPS/GNSS Observations Dataset [data set], https://doi.org/10.7283/T52N50J2, 2013.
Wolstencroft, M., King, M. A., Whitehouse, P. L., Bentley, M. J., Nield, G. A., King, E. C., McMillan, M., Shepherd, A., Barletta, V., Bordoni, A., Riva, R. E. M., Didova, O., and Gunter, B. C.: Uplift rates from a new high-density GPS network in Palmer Land indicate significant late Holocene ice loss in the southwestern Weddell Sea, Geophys. J. Int., 203, 737–754, https://doi.org/10.1093/gji/ggv327, 2015.
Wu, P., Wang, H., and Schotman, H.: Postglacial induced surface motions, sea-levels and geoid rates on a spherical, self-gravitating laterally heterogeneous earth, J. Geodyn., 39, 127–142, https://doi.org/10.1016/j.jog.2004.08.006, 2005.
Zhao, C., King, M. A., Watson, C. S., Barletta, V. R., Bordoni, A., Dell, M., and Whitehouse, P. L.: Rapid ice unloading in the Fleming Glacier region, southern Antarctic Peninsula, and its effect on bedrock uplift rates, Earth Planet. Sc. Lett., 473, 164–176, https://doi.org/10.1016/j.epsl.2017.06.002, 2017.