the Creative Commons Attribution 4.0 License.
the Creative Commons Attribution 4.0 License.
 | 03 Jul 2025
Development and fluctuation of crystal orientation fabric in the deep sections of the Dome Fuji ice core, Antarctica: impacts of dust particles and migration recrystallization
Tomotaka Saruya
Atsushi Miyamoto
Kumiko Goto-Azuma
Motohiro Hirabayashi
Akira Hori
Makoto Igarashi
Yoshinori Iizuka
Takao Kameda
Hiroshi Ohno
Wataru Shigeyama
Shun Tsutaki
This study investigated the crystalline textural properties of an Antarctic deep ice core with a length of 3035 m acquired from an inland plateau dome, with a focus on depths below 2400 m. The cluster strength of the c axes was ascertained using the dielectric tensor method to assess the bulk properties of thick sections, and detailed orientation distributions of the c and a axes were determined using the Laue X-ray diffraction technique. The c- and a-axis fabric data were compared with various other characteristics of the same ice core. Microstructural observations were made using optical microscopy. The clustering strength of the single-pole c-axis fabric was at a maximum at depths between 2400 and 2640 m. The relationship between the cluster strength and the concentration of dusty impurities was found to change at approximately 2640 m, and fluctuations in strength increased significantly below this depth. Impurity-rich layers maintained a high degree of clustering, whereas layers with fewer impurities showed relaxation. The latter layers also exhibited evidence of nucleation and grain boundary migration. In ice such as this, the degree of a-axis organization was increased with one or two sets of three preferred orientations. Dynamic recrystallization evidently played a critical role, with more pronounced effects in impurity-poor layers than in impurity-rich layers. This phenomenon promoted the relaxation of the c-axis clustering, deformation based on dislocation creep and organization of the a axis. Below 2580 m, the angles of inclination of the c-axis cluster and layers deviated significantly from the vertical, suggesting that the system rotated as a rigid body as a result of simple shear.
- Article
(9973 KB) - Full-text XML
-
Supplement
(7079 KB) - BibTeX
- EndNote


Crystal orientation fabric is one of the most important factors controlling the physical properties of polar ice sheets. In particular, both the deformation and flow of ice sheets are significantly affected by the crystal orientation fabric, and the deformation response of individual ice crystals to stress exhibits pronounced anisotropy. Specifically, these crystals readily undergo shearing along the slip systems within their basal planes, whereas nearly 100 times greater shear stress must be applied to induce deformation along other slip systems within the crystals (e.g. Duval et al., 1983). In the case that ice crystals are randomly oriented, these crystals will behave isotropically, while non-random orientations will result in anisotropic behaviour. As an example, the internal deformation of an ice sheet can lead to the preferred orientation of ice crystals that, in turn, affects the flow of the sheet. The ice flow is also affected by the concentrations of ionic species and dust particles as well as by disturbances or folds in the layer structure (e.g. Cuffey and Paterson, 2010; Durand et al., 2007; Saruya et al., 2022a). These factors can introduce either positive or negative feedback that modulates the flow characteristics of the ice sheet. Considering this complexity, it is evident that a systematic understanding of the internal layered structure of polar ice sheets is required.
The rheology in the deepest several hundred metres of an ice sheet is complicated by geothermal effects and increased stresses resulting from the bedrock topography. Even so, to date, there have been limited reports concerning the crystal properties of ice near the bed at central plateau dome summits of ice sheets (e.g. Thorsteinsson et al., 1997; Durand et al., 2009; Faria et al., 2014a; Ohno et al., 2016). Deep ice is characterized by higher temperatures at which enhanced phenomena related to molecular transport becomes important (e.g. Petrenko and Whitworth, 1999). These phenomena include plastic deformation, molecular diffusion processes and recrystallization, and studies concerning dynamic recrystallization in ice sheets have been performed (e.g. Poirier, 1985; De La Chapelle et al., 1998; Humphreys and Hatherly, 2004; Weikusat et al., 2009; Kipfstuhl et al., 2009; Montagnat et al., 2012, 2014; Faria et al., 2014a; Stoll et al., 2021a). The work reported herein took advantage of the unique opportunity that the Dome Fuji (DF) ice core offers with regard to assessing the role of dynamic recrystallization in the formation of textures and fabrics in the deeper parts of the East Antarctic ice sheet.
The crystal orientation fabric contains information concerning the history of deformation, grain growth and recrystallization (e.g. Cuffey and Paterson, 2010; Faria et al., 2014a, b). Saruya et al. (2022a) investigated the development of the c-axis fabric in the DF ice core at depths above 2400 m using thick sections of ice (ranging in thickness from 33 to 79 mm) in conjunction with radio wave birefringence. Using the dielectric tensor method (DTM), this prior work assessed the degree of dielectric anisotropy (Δε) along ice cores. This parameter is defined as the difference in relative permittivity along the vertical (εv) and horizontal planes (εh), such that , and indicates the clustering strength of the c axes. The value of Δε is linearly compatible with the normalized eigenvalues of the second-order tensor (Saruya et al., 2022a, b). These authors also found that Δε not only steadily increases with depth but also exhibits fluctuations. In addition, significant decreases in Δε were identified at depths associated with major glacial-to-interglacial transitions. These observed changes in Δε can be explained by variations in the deformational history of regions of the ice sheet over which vertical compression is the primary cause of stress. The Δε data have additionally been shown to positively correlate with the concentration of chloride ions in the ice and inversely correlate with the number of dust particles. As both chloride ions and dust originate from atmospheric deposition, Saruya et al. (2022a) proposed that fluctuations in clustering strength might be common across wide areas of ice sheets.
On this basis, the present research studied the deepest 20 % of the DF core (specifically, the depth range of 2400–3035 m) to provide a more complete understanding of the development of texture and fabric throughout the entire ice sheet column. A major challenge to this work was the inclination of the ice sheet layers, which becomes steeper at deeper depths (Dome Fuji Ice Core Project Members (DFICPM), 2017). This research utilized the DTM in conjunction with thick sections and techniques utilizing thin sections, including the Laue X-ray diffraction method and microstructural observations. The textural data obtained with these methods are compared herein with various datasets produced from prior studies of the same ice core. This paper provides an advanced, updated dataset concerning the crystal orientation fabric with regard to both the c axis and a axis along with additional textural data for the DF ice core. Using these data, the development of the crystal orientation fabric as well as variations in the microstructure, layered structure and rheology of polar ice sheets is discussed. This new information increases our understanding of the development of layered structures in ice sheets.
As noted, this work utilized the DTM based on thick sections along with Laue X-ray diffraction method and microstructural observations using thin sections. The DTM provided data concerning the c-axis fabric in the form of eigenvalues with high sampling frequency, spatial resolution and continuity. However, this method does not produce information regarding the crystal axes of individual grains. Additionally, if a cluster of c axes is significantly inclined from the vertical, it is impossible to derive correct eigenvalues without knowing both the angle of inclination and horizontal orientation of the c-axis cluster. In contrast, the Laue X-ray diffraction technique provides detailed information concerning both the c axis and the a axis of each crystal grain. Additionally, the use of an automatic fabric analyser (model G50, Russell–Head Instruments) allowed an assessment of variations in crystal orientation between grains. Using both the G50 analyser and microscopy, microstructural observations were performed as a means of assessing dynamic recrystallization and grain morphology. The methods described above provided a significant quantity of data concerning variations in crystalline texture along the ice core.
2.1 DF ice cores
The DF ice core was drilled on the Antarctic Plateau (Fig. 1) at 77°19′ S latitude, 39°42′ E longitude and 3810 m above sea level. The ice thickness at the location is 3028 ± 15 m (DFICPM, 2017). The annual surface mass balance at this location has ranged from approximately 24 to 28 over the last 5000 years (Oyabu et al., 2023), and the annual mean surface air temperature is −54.4 °C (Yamanouchi et al., 2003). Deep ice cores have been drilled at DF on two occasions (e.g. Motoyama et al., 2020). The first core, DF1, was 2503 m in length and was drilled in the 1990s. The second core, DF2, had a length of 3035 m and was drilled between 2004 and 2007 in a borehole 44 m removed from the previous borehole (Fig. 1c). The DF2 core specimen was employed in the present study. Both drilling sites are situated above a subglacial slope, positioned between bedrock high in the east and a subglacial trough with an ice thickness of approximately 3100 m in the west (Fig. 1b and c). An ice thickness of approximately 2850 m marks the boundary between a thawed bed (in the case of thicker ice) and a frozen bed (in thinner ice) (Fujita et al., 2012). It is thought that spatially inhomogeneous basal melting has produced the localized inclination of layers within the ice sheet (DFICPM, 2017). The layered structures are inclined by less than approximately 5° at shallow depths, whereas, in the deeper sections, the inclination reaches angles as high as 45° at a depth of 3000 m. Ohno et al. (2016) reported the distribution of air hydrates and the isotopic composition of water in the deepest 1 % (3000–3035 m) of the DF ice core. These factors were found to reflect the basic layered structure of the ice core except in the deepest few metres. However, this prior work did not investigate crystalline textural properties.
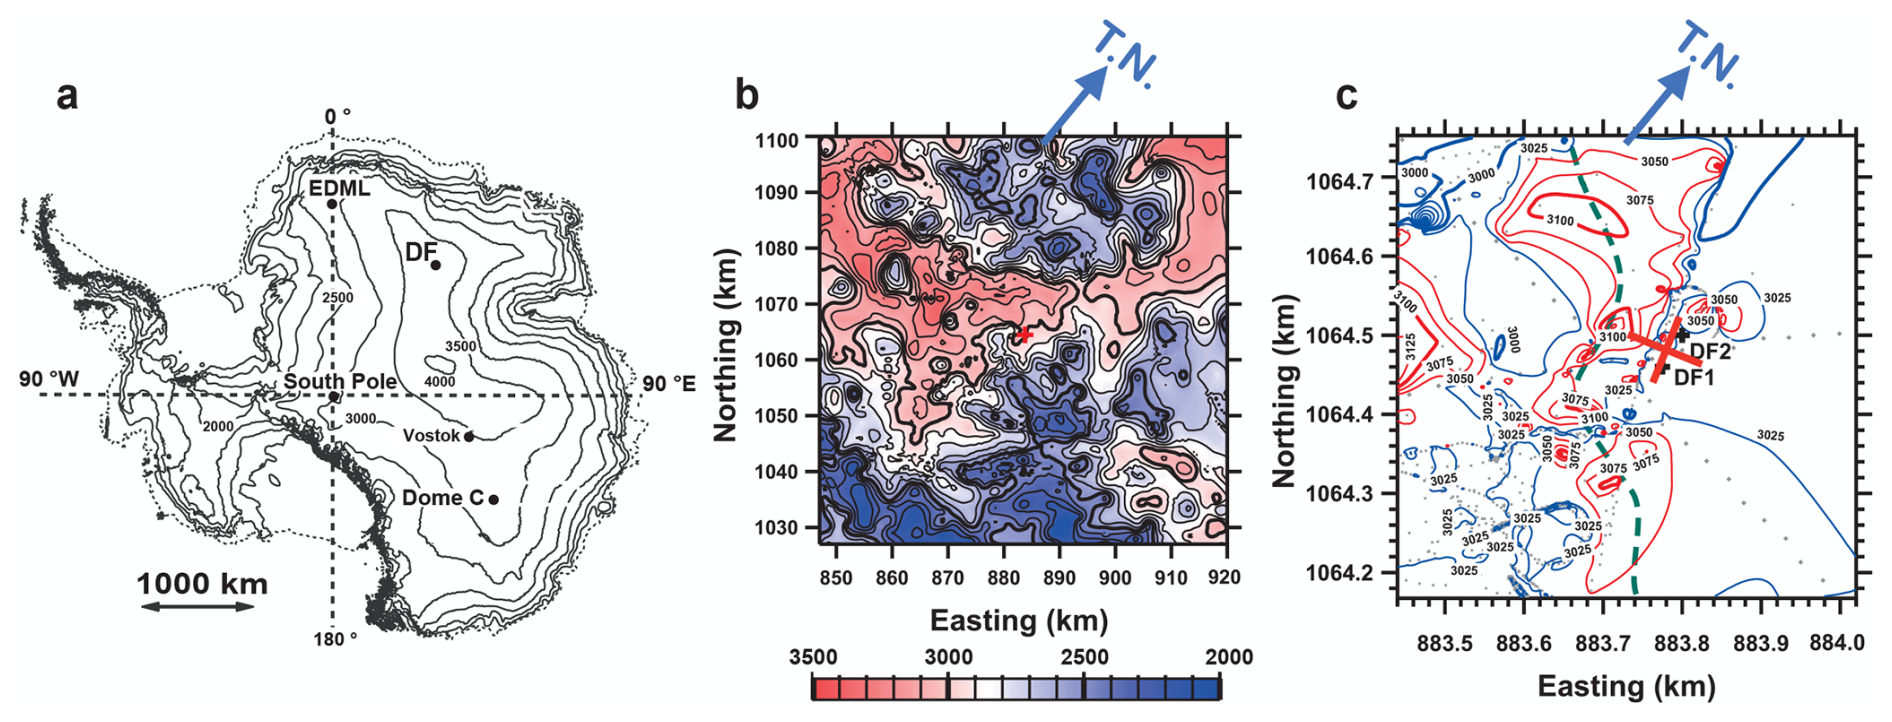
Figure 1Maps of the coring site. (a) Surface elevation using a digital elevation model (Bamber et al., 2009). Maps showing ice thickness over areas of (b) 72 km2 and (c) 580 m2. In panels (b) and (c), the small red/black crosses near the centre of each map indicate the coring site. “T.N.” indicates true north. In panel (c), ice thickness is indicated by dots representing data from Tsutaki et al. (2022) and by markers representing data from Eisen et al. (2020). Thin and thick areas are shown in red and blue, respectively, and the boundary is set at a thickness of 3000 m. The bold dashed green line indicates the presence of the local trough. The DF coring sites were located at the bank of this local trough, aligning with the estimated drainage routes of subglacial water (as shown in Fig. 8d in Tsutaki et al., 2022). In panel (c), the two principal axes of the elongated single-pole fabric inferred from polarimetric radar sounding (Fujita et al., 2006) are indicated as a large red cross.
At present, DF is very close (within 10 km) to the dome summit and associated with a steep north–south surface mass balance gradient (Fujita et al., 2011; Tsutaki et al., 2022). This morphology implies that the DF summit has migrated along this gradient in the north–south direction during glacial and interglacial periods over which the accumulation rate changed dramatically (e.g. Parrenin et al., 2016). Thus, DF is subject to deviatoric stress in the direction of maximum inclination at each time. Azuma et al. (1999, 2000) reported that, in the case of the DF1 core, the c-axis fabric exhibited an elongated single-pole fabric that was already observable at shallow depths. Fujita et al. (2006) investigated DF using polarimetric radar sounding and assessed the extent of radio wave birefringence caused by this elongated single-pole fabric to depths of approximately 2200 m. Fujita's work demonstrated that the orientations of the elongated single-pole fabric remained well-defined at least to this depth. Figure 1c presents the two principal axes assumed for the elongated c-axis fabric as a large red cross, aligning with the orientation of the subglacial slope (WNW) and its orthogonal direction.
2.2 Dielectric tensor method
2.2.1 Method
The principles of the open resonator method for determining the relative permittivity (ε) of thin samples have been previously described in the literature (Jones, 1976a, b; Cullen, 1983; Komiyama et al., 1991). The authors have since developed this technique to allow investigation of the tensorial permittivity of thick samples based on continuous radio birefringence scanning along an ice core (Matsuoka et al., 1998; Fujita et al., 2009, 2014, 2016; Saruya et al., 2022a, b; Inoue et al., 2024). The present work employed a microwave beam to study thick samples, and ε values were obtained as volume-weighted averages within the volume encompassed by the Gaussian distribution of the beam. By setting the angle between the axis of the c-axis cluster and that of the electric field to approximately 45°, radio birefringence was generated as a result of the macroscopic permittivity of the crystals (e.g. Hargreaves, 1978). Sweeping the radio wave frequency to detect resonances satisfying TEM modes (where TEM is an acronym for transverse electromagnetic and q is an integer) allowed twin resonant peaks caused by dual permittivity components to be detected. These two components corresponded to ε along the axis of the c-axis cluster and along the orthogonal axis, representing components on the plane of the electric field vector (orthogonal to the axis of beam incidence).
2.2.2 Open resonator and samples
This work employed two resonators (designated nos. 1 and 2), the specifications of which are summarized in Table S1 in Sect. S1.1 in the Supplement. An open resonator employing frequencies between 26.5 and 40 GHz (entry 1 in Table S1) was utilized to assess the ice in the lowermost 20 %. This resonator differed from that employed to study the ice above 2400 m, which operated at frequencies between 15 and 20 GHz (entry 2 in Table S1). These two resonators, each having a semi-confocal shape with a flat mirror and a concave mirror, were designed to produce beam diameters of 16 and 38 mm, respectively (Fig. 2). The consistency of the data obtained with the two resonators was confirmed by comparing the Δε values at depths between 2400 and 2500 m (Fig. S1 in Sect. S1.1). The smaller beam size of resonator no. 1 allowed the analysis of smaller samples (such as narrow quadrangular prisms) with higher spatial resolution. The no. 1 and no. 2 resonators were able to analyse ice specimens with thicknesses of at least 40 and 90 mm, respectively. The sizes of the samples examined in this work are summarized in Fig. 2 and Table S2. Both the upper and lower surfaces of each specimen were microtomed to provide extremely smooth and precisely parallel surfaces. The DTM involved a series of measurements at 20 mm intervals along core segments with lengths of 0.5 m acquired at 2.5 m depth intervals. In the case of samples acquired below 2736 m, the core axis was rotated horizontally in the open resonator apparatus to ensure that the twin resonances could be detected. The experimental data were acquired at temperatures in the range of −30 ± 1.5 °C.
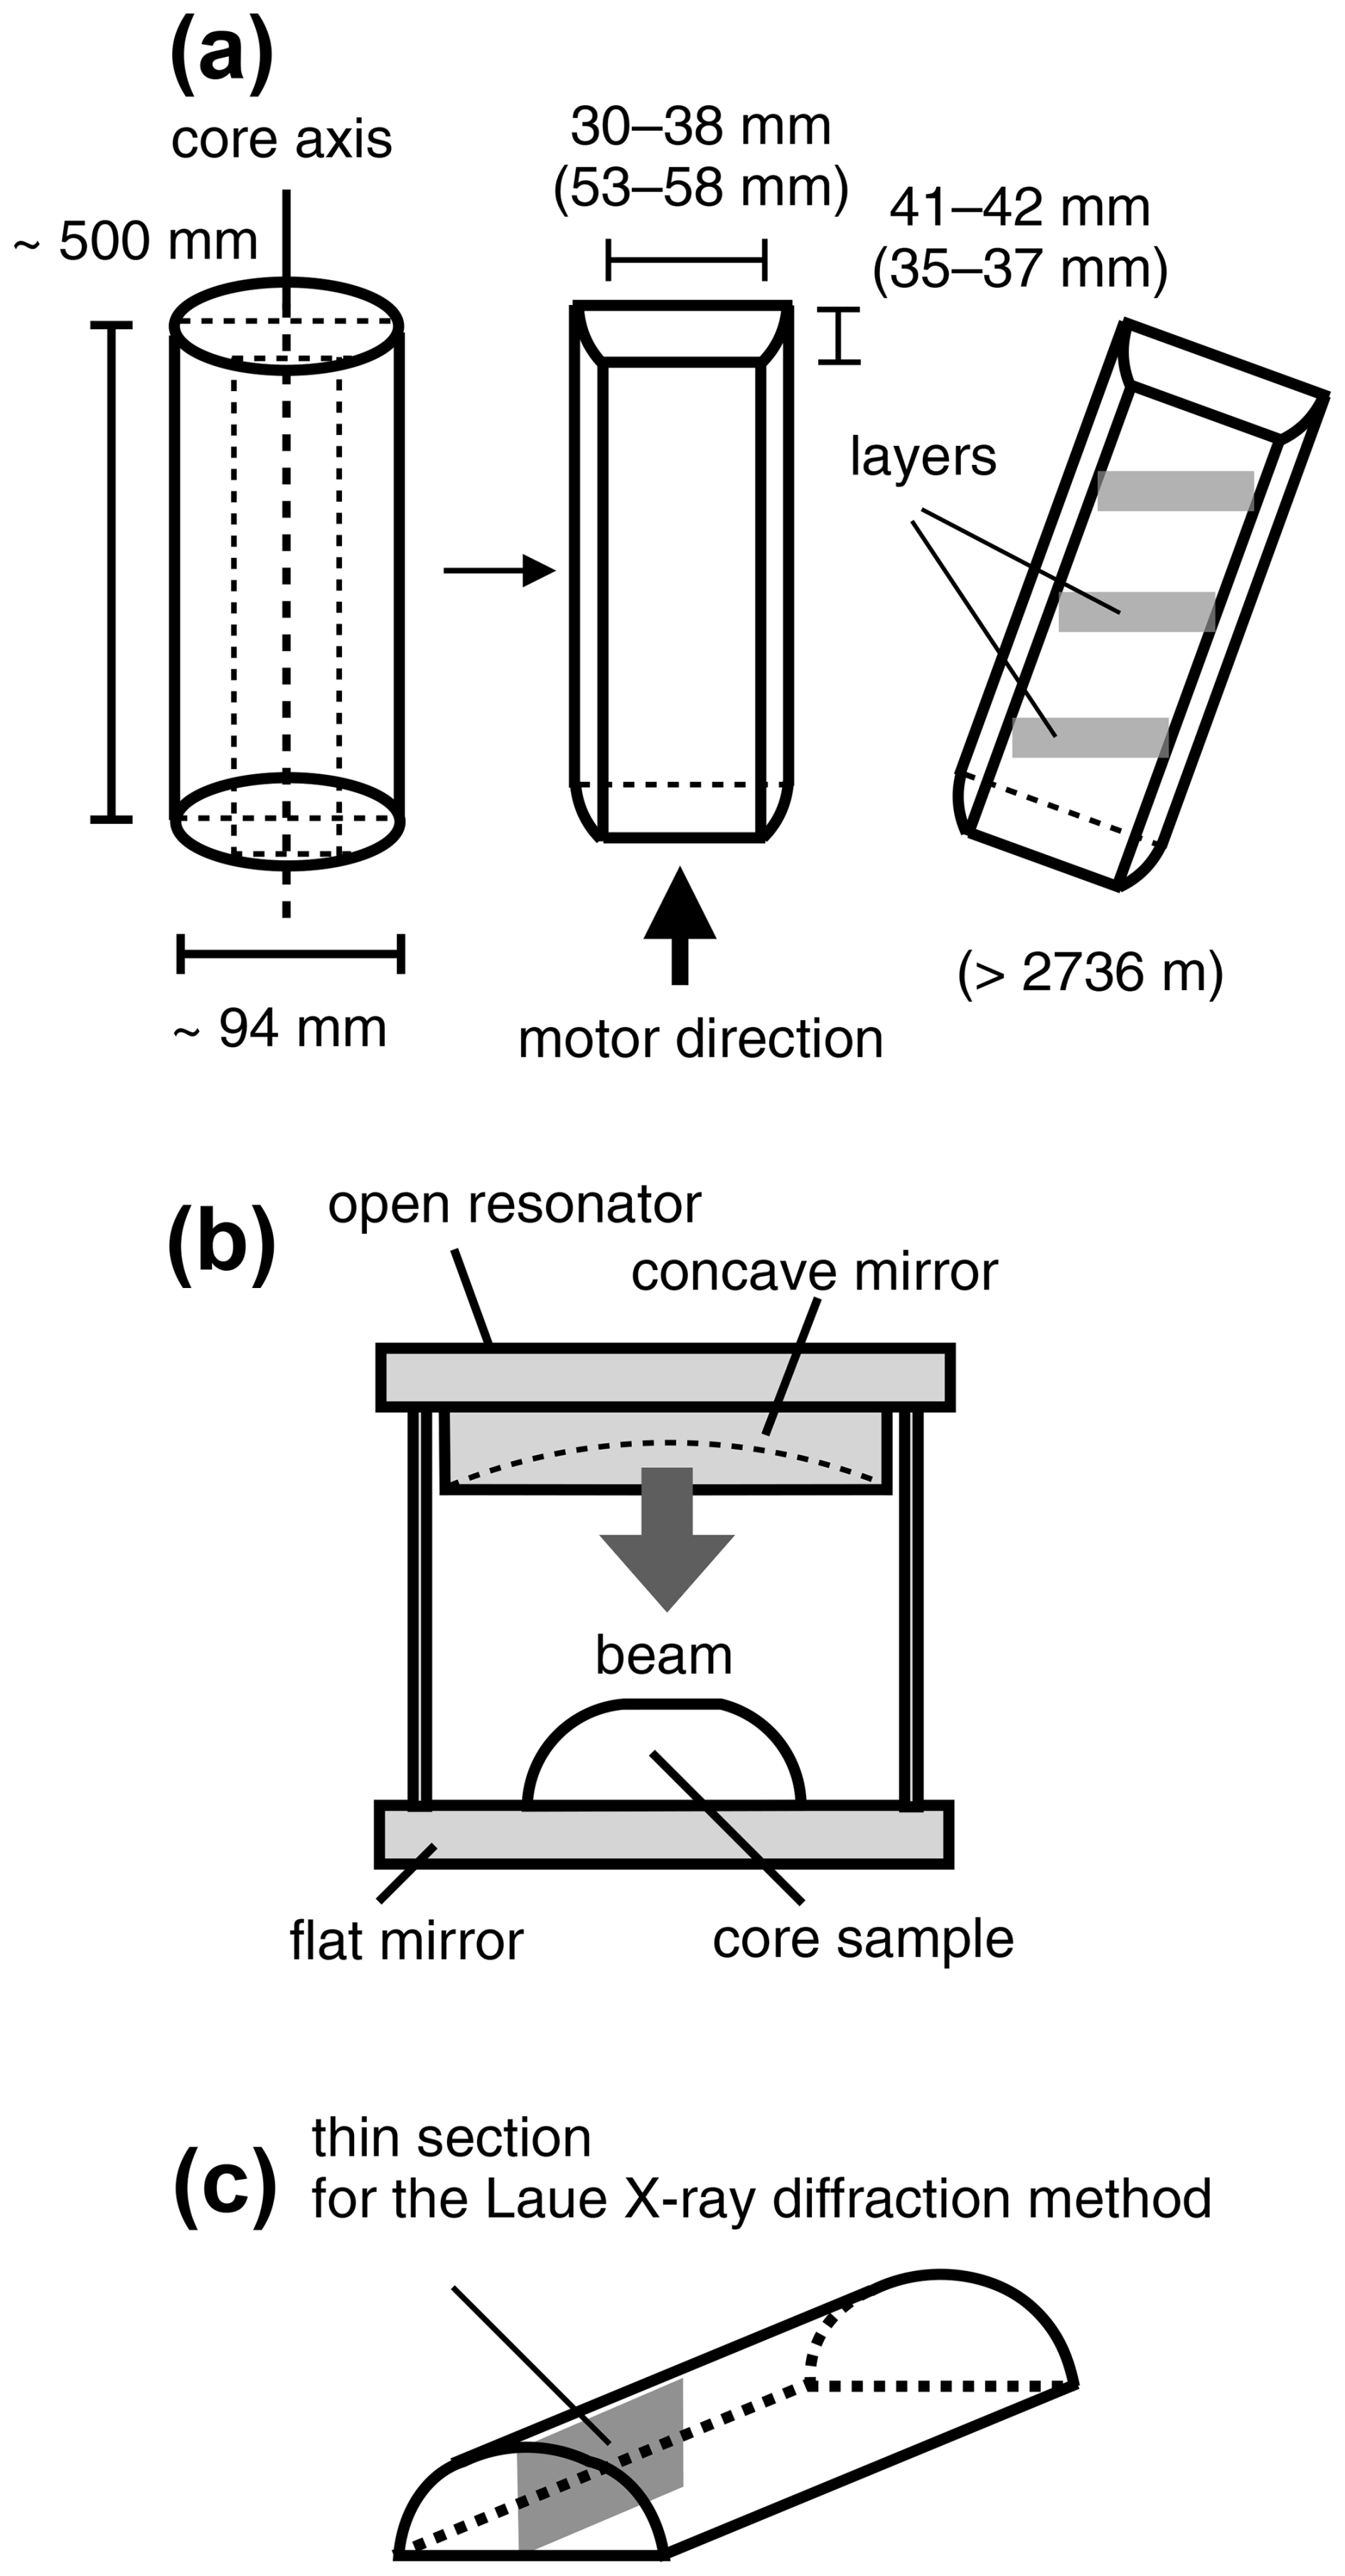
Figure 2Diagrams of the (a) core cutting geometry and scanning direction, (b) the analytical set-up as viewed from the front, and (c) the location of a thin section assessed using the Laue X-ray diffraction method.
In addition to increases in the layer inclination, the axis of the c-axis cluster also exhibited an increased inclination such that this axis deviated from the vertical (hereinafter, referred to as the angle of inclination) in the same direction as the normal to the maximum layer slope. The relative orientation between each layer and the c-axis cluster was assessed by investigating the angle of inclination of the layer near the thin sections used for the Laue X-ray diffraction method. These data confirmed that the horizontal direction for the c-axis cluster and the normal axis of each layer were within approximately the same vertical plane throughout the lowermost 20 % of the DF ice core. Additionally, the horizontal orientation of the c-axis cluster varied with depth due to the rotation of the ice cores. In the case that both the angle of inclination and horizontal orientation of the c-axis cluster varied with depth, only the non-principal components of the permittivity tensor were determined within the ice using the DTM. As the electromagnetic wave used in the DTM method has a transverse electric field, if the surface of the actual plate-shaped sample does not align with the principal axes of the crystal tensor, only the components in the misaligned orientation will be obtained. This misaligned orientation is referred to as non-principal. Geometrical corrections to translate from the measured non-principal components to the principal components were applied using both the angle of inclination and horizontal orientation of the c-axis cluster as derived from c-axis fabric data acquired using a thin-section method. The procedures used to perform these corrections are detailed in Sect. S2. The non-principal components of the dielectric anisotropy (Δε′) were also adjusted to align with the principal components (Δε). It should also be noted that the DTM is a useful means of finding the Δε values of girdle-type ice fabrics. We can refer to the basic principles summarized in Sect. S1.2.
2.3 Characterizations by Laue X-ray diffraction, microstructural observations and automatic fabric analyser
The Laue X-ray diffraction method was applied to thin sections measuring 100 mm×45 mm (in the vertical and horizontal directions, respectively) and with thicknesses of less than 0.5 mm. This technique can determine the orientations of all axes of each crystal grain with an accuracy on the order of 0.5° (Miyamoto et al., 2011). A total of 42 depths within the lowermost 20 % were selected for analysis, and the Laue patterns were analysed after obtaining all of the Laue figures. Here, the data for each thin section are expressed as the distribution of c axes and a axes on a Schmidt net diagram. The median inclinations of the c axes with respect to the axis of the c-axis cluster were also calculated. The median inclination was defined as one-half of the apex angle of the cone in which one-half of the measured c axes were included from the centre axis of the c-axis cluster.
Additionally, microstructure observations were carried out using both the G50 instrument and optical microscopy to investigate the manner in which microstructural evolution affected the development of the c-axis fabric and to assess fluctuations in the same thin section. These analyses were performed at several preselected depths. Thin sections were prepared from the vertical plane of the ice cores, measuring 90 mm in the depth direction and 50 mm in the horizontal direction and with thicknesses of 0.5 mm. Images of the c-axis fabric were obtained using the G50 automatic fabric analyser to investigate the relationship between the morphology and c-axis orientation of each grain. The grain numbers included in the Gaussian beam or thin section are provided in Table S3.
2.4 Grain size and layer inclination measurements
The grain sizes at the DF site were ascertained in this work based on visual observations of faint differences in light reflectivity between grains and visible grain boundaries. While freshly cut surfaces did not exhibit these features, the ice cores in storage developed these reflectivity variations over time as sublimation progressed. The average surface area of each grain was determined using three circular gauges with diameters of 10, 20 and 40 mm and by counting the number of grains on the core surface within the circle of the gauge. The number of crystal grains within each circle typically ranged from several to 20, with an estimated error as high as 20 % of the crystal quantity. These examinations were performed at 1.5 m intervals to a depth of 2967.5 m. Below this depth, the crystals were much larger and it became difficult to define the grain sizes. Changes in the angles of inclination of visible features (such as cloudy bands or tephra layers) relative to the horizontal were also investigated using a protractor. This process is explained in detail in Sect. S1.3. It should also be noted that this method did not take into account core rotation resulting from core breaks. The present work provides detailed data supplementing those in a preliminary report (DFICPM, 2017).
3.1 Depth-dependent variations in measured Δε′, corrected Δε and standard deviation values
The Δε′ data are presented in Fig. 3, while examples showing the continuous variation in Δε′ along a core segment with a length of 0.5 m are provided in Sect. S3 in the Supplement. Here, the symbols and error bars indicate the mean values and the standard deviations (SDs) determined at 0.5 m intervals along the core sample, while the dots represent raw data. Black and red symbols indicate data obtained without and with inclined measurements, respectively. Data acquired without and with the horizontal samples inclined within the resonator are in agreement over the depth range of 2630–2730 m for which both measurements were performed. This outcome confirms that horizontal rotation of the samples in the open resonator did not affect the experimental relative permittivity values. Note that, overall, the Δε′ values exhibit a decrease with increasing depth and the data show more scatter at greater depths. Below 2900 m, the Δε′ values largely fluctuated.
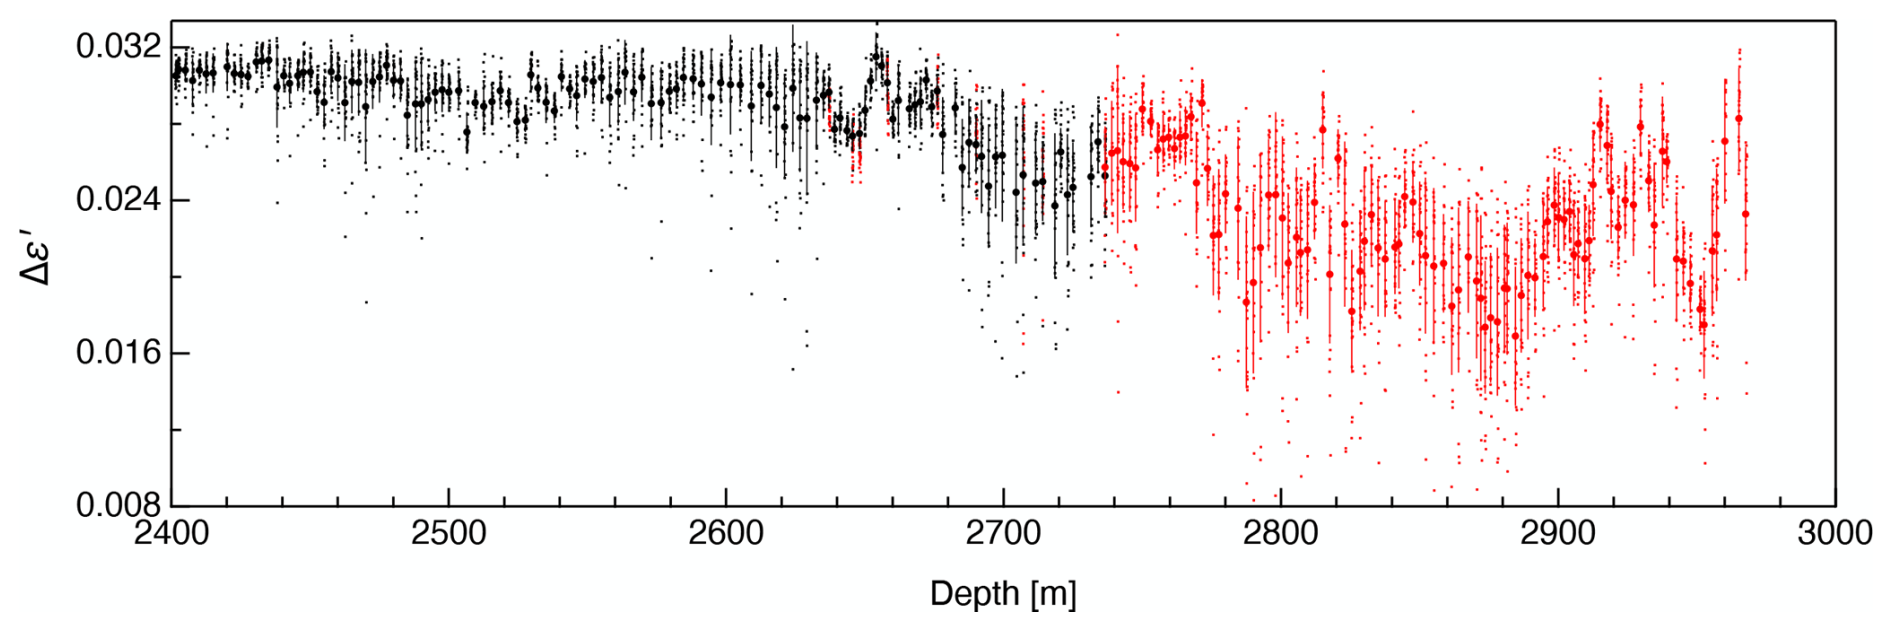
Figure 3The Δε′ data generated in this work. Dots represent raw data acquired at 0.02 m intervals. Symbols and error bars indicate the mean values and SDs for each 0.5 m interval. Black and red indicate data obtained without and with rotation of the samples in the open resonator, respectively (see Fig. 2).
3.2 The c- and a-axis orientations determined using the Laue X-ray diffraction method
The c- and a-axis distribution data obtained from the Laue X-ray diffraction are given in Fig. 4. The c-axis fabric was found to generally exhibit a significant single-pole cluster, the strength of which fluctuated with increasing depth. Because each grain in the hexagonal crystal lattice had three equivalent a axes orthogonal to the c axis, the distribution of the a axes formed a girdle plane orthogonal to the c-axis cluster at each depth. Figure 4m–q display data from the deepest five depths, all of which were within the bottom 2 % of the ice sheet. In these figure panels, the red and blue numerical markers indicate the distributions of the c axis and a axis, respectively, at each depth. As a consequence of grain growth near the bed of the ice sheet, no more than six crystal grains were found in a thin section, and the centre of the clusters could not be determined with this very limited number of grains. With the exception of these five depths, both the angle of inclination and the horizontal orientation of the c-axis cluster could be ascertained based on analysis of the c-axis fabric, as shown by View 1 to View 3. Both of these factors were subsequently used to correct Δε′ values to Δε data, and the procedure used for these corrections is detailed in Sect. S2. The median inclination of the c-axis cluster values was also calculated using c-axis fabric data acquired from thin sections. Both the angle of inclination from the vertical and median inclination values for the c-axis cluster are presented in Fig. 5f. The angle of inclination of the c-axis cluster was found to increase monotonically at greater depths down to 2967 m.
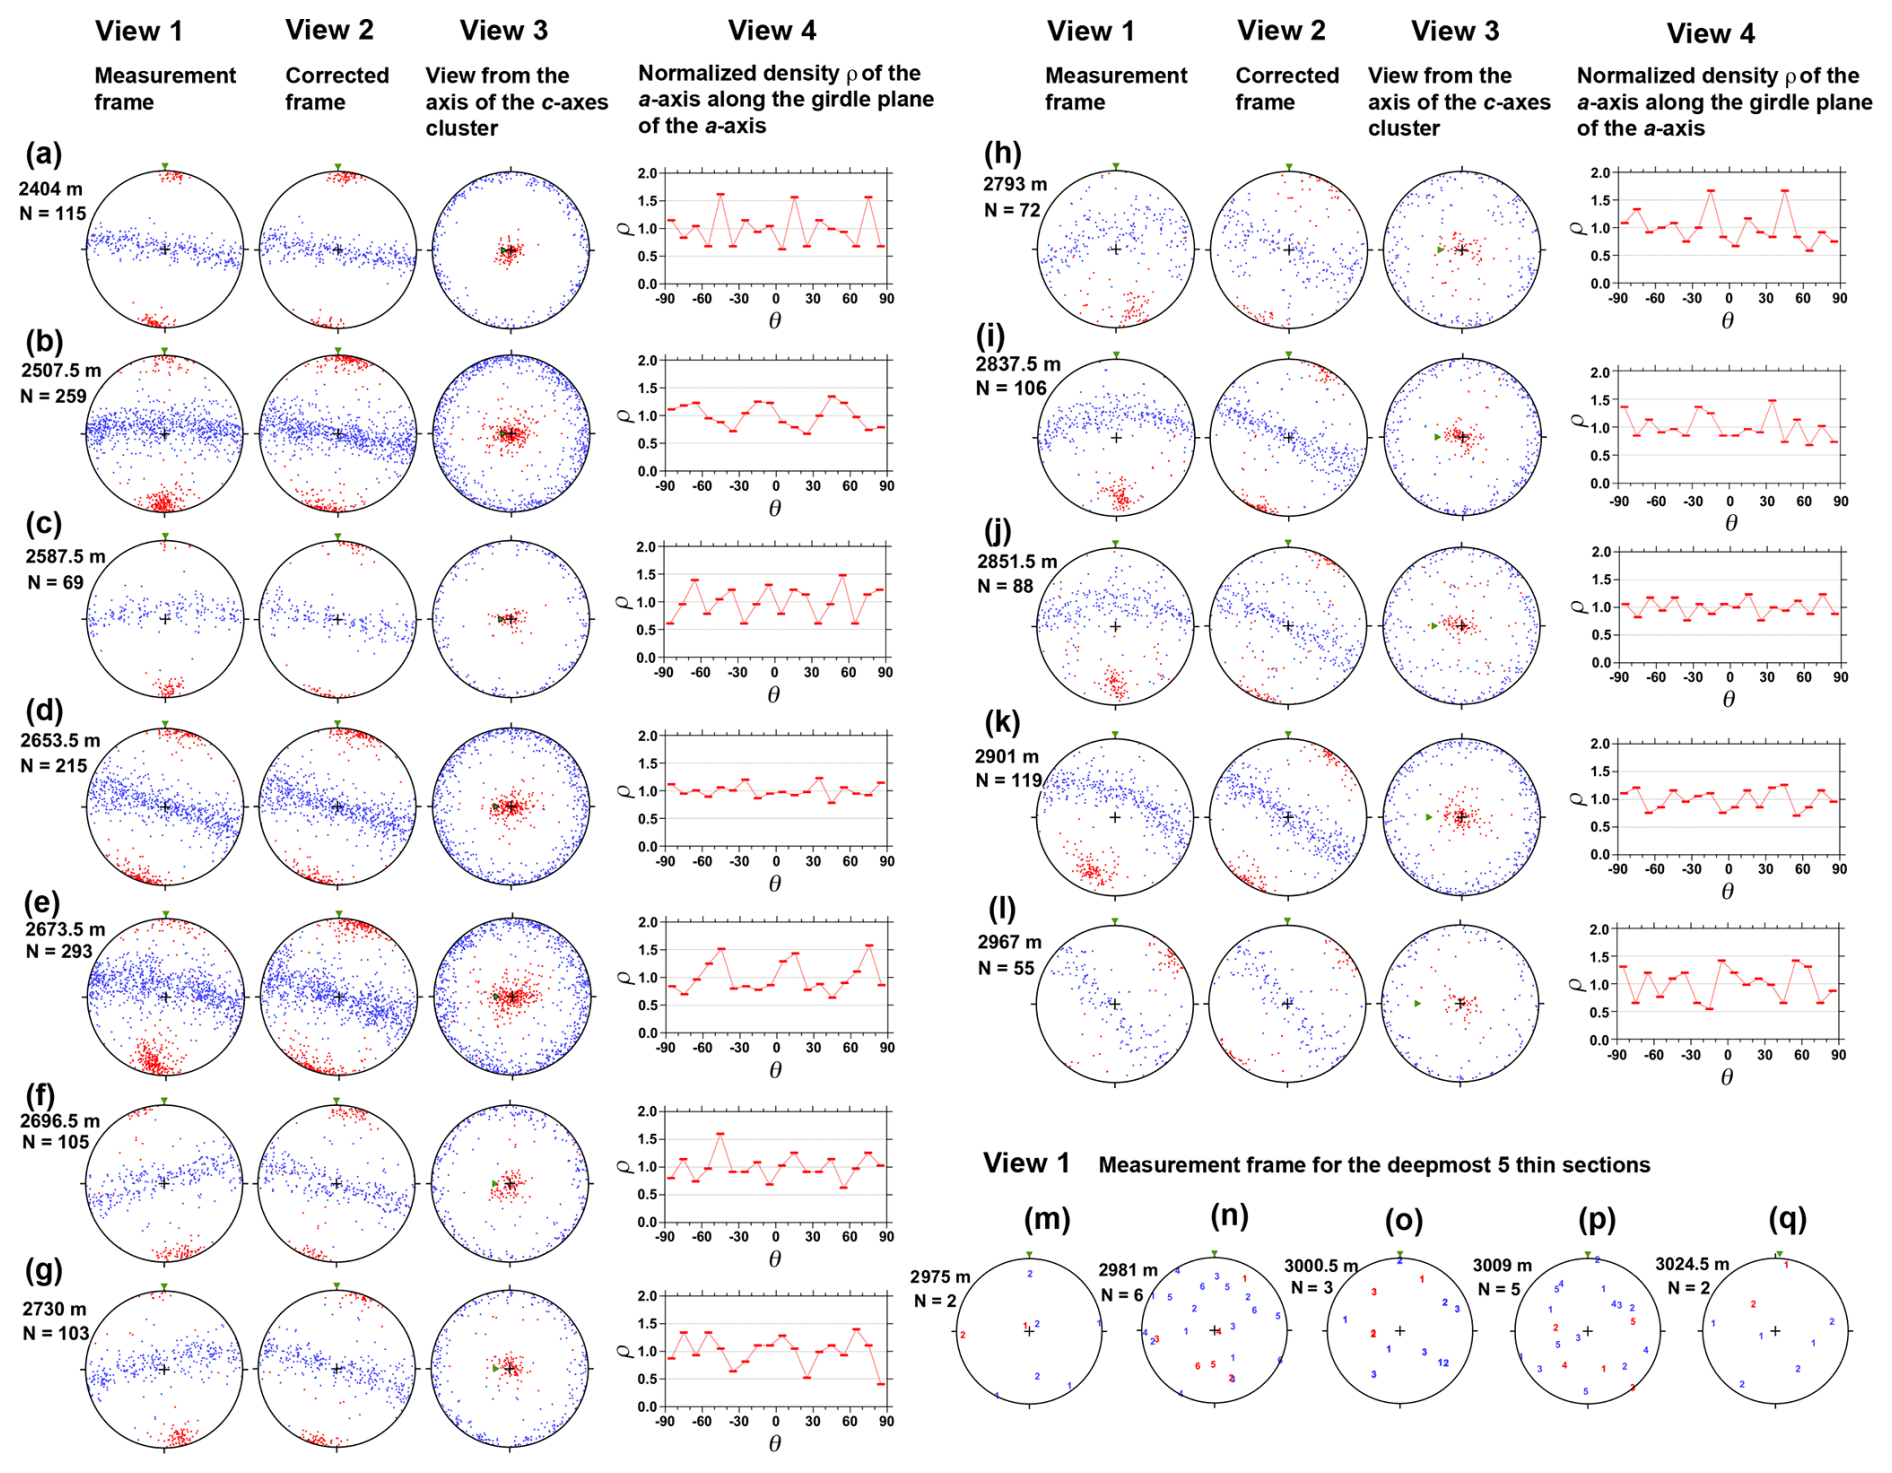
Figure 4The c-axis and a-axis distribution data obtained from the Laue X-ray diffraction analyses using 17 depths out of a total of 42. Panels (a) to (l) present data for the 12 shallower depths over the range of 2400 and 2967 m in the form of three equal-area Schmidt net diagrams (e.g. Langway, 1958). These diagrams summarize the projected c-axis and a-axis distributions as indicated by red and blue symbols/markers, respectively. For these 12 depths, the leftmost diagrams (View 1) show projections from the measurement frame (refer to Fig. S2b in the Supplement), while the second series of diagrams (View 2) is a projection from the corrected frame (see Fig. S2b'). The third series of diagrams (View 3) is a projection from the centre of the c-axis cluster. The green triangle in each diagram indicates the vertical orientation in the ice sheet, which approximately aligns with the core axis (though the borehole inclined 3–6° from the vertical). The fourth column contains plots of the normalized density, ρ, of the a axis along the girdle plane of the a axis against θ (in degrees), which is the angle from the top of the figure in View 3. Panels (m) to (q) show projections from the measurement frame for the deepest five depths, ranging from 2975 to 3024.5 m. Because of grain growth near the bed of the ice sheet, each thin section contained less than six grains. Rather than dots, numerical markers are used to indicate the orientation of each grain.
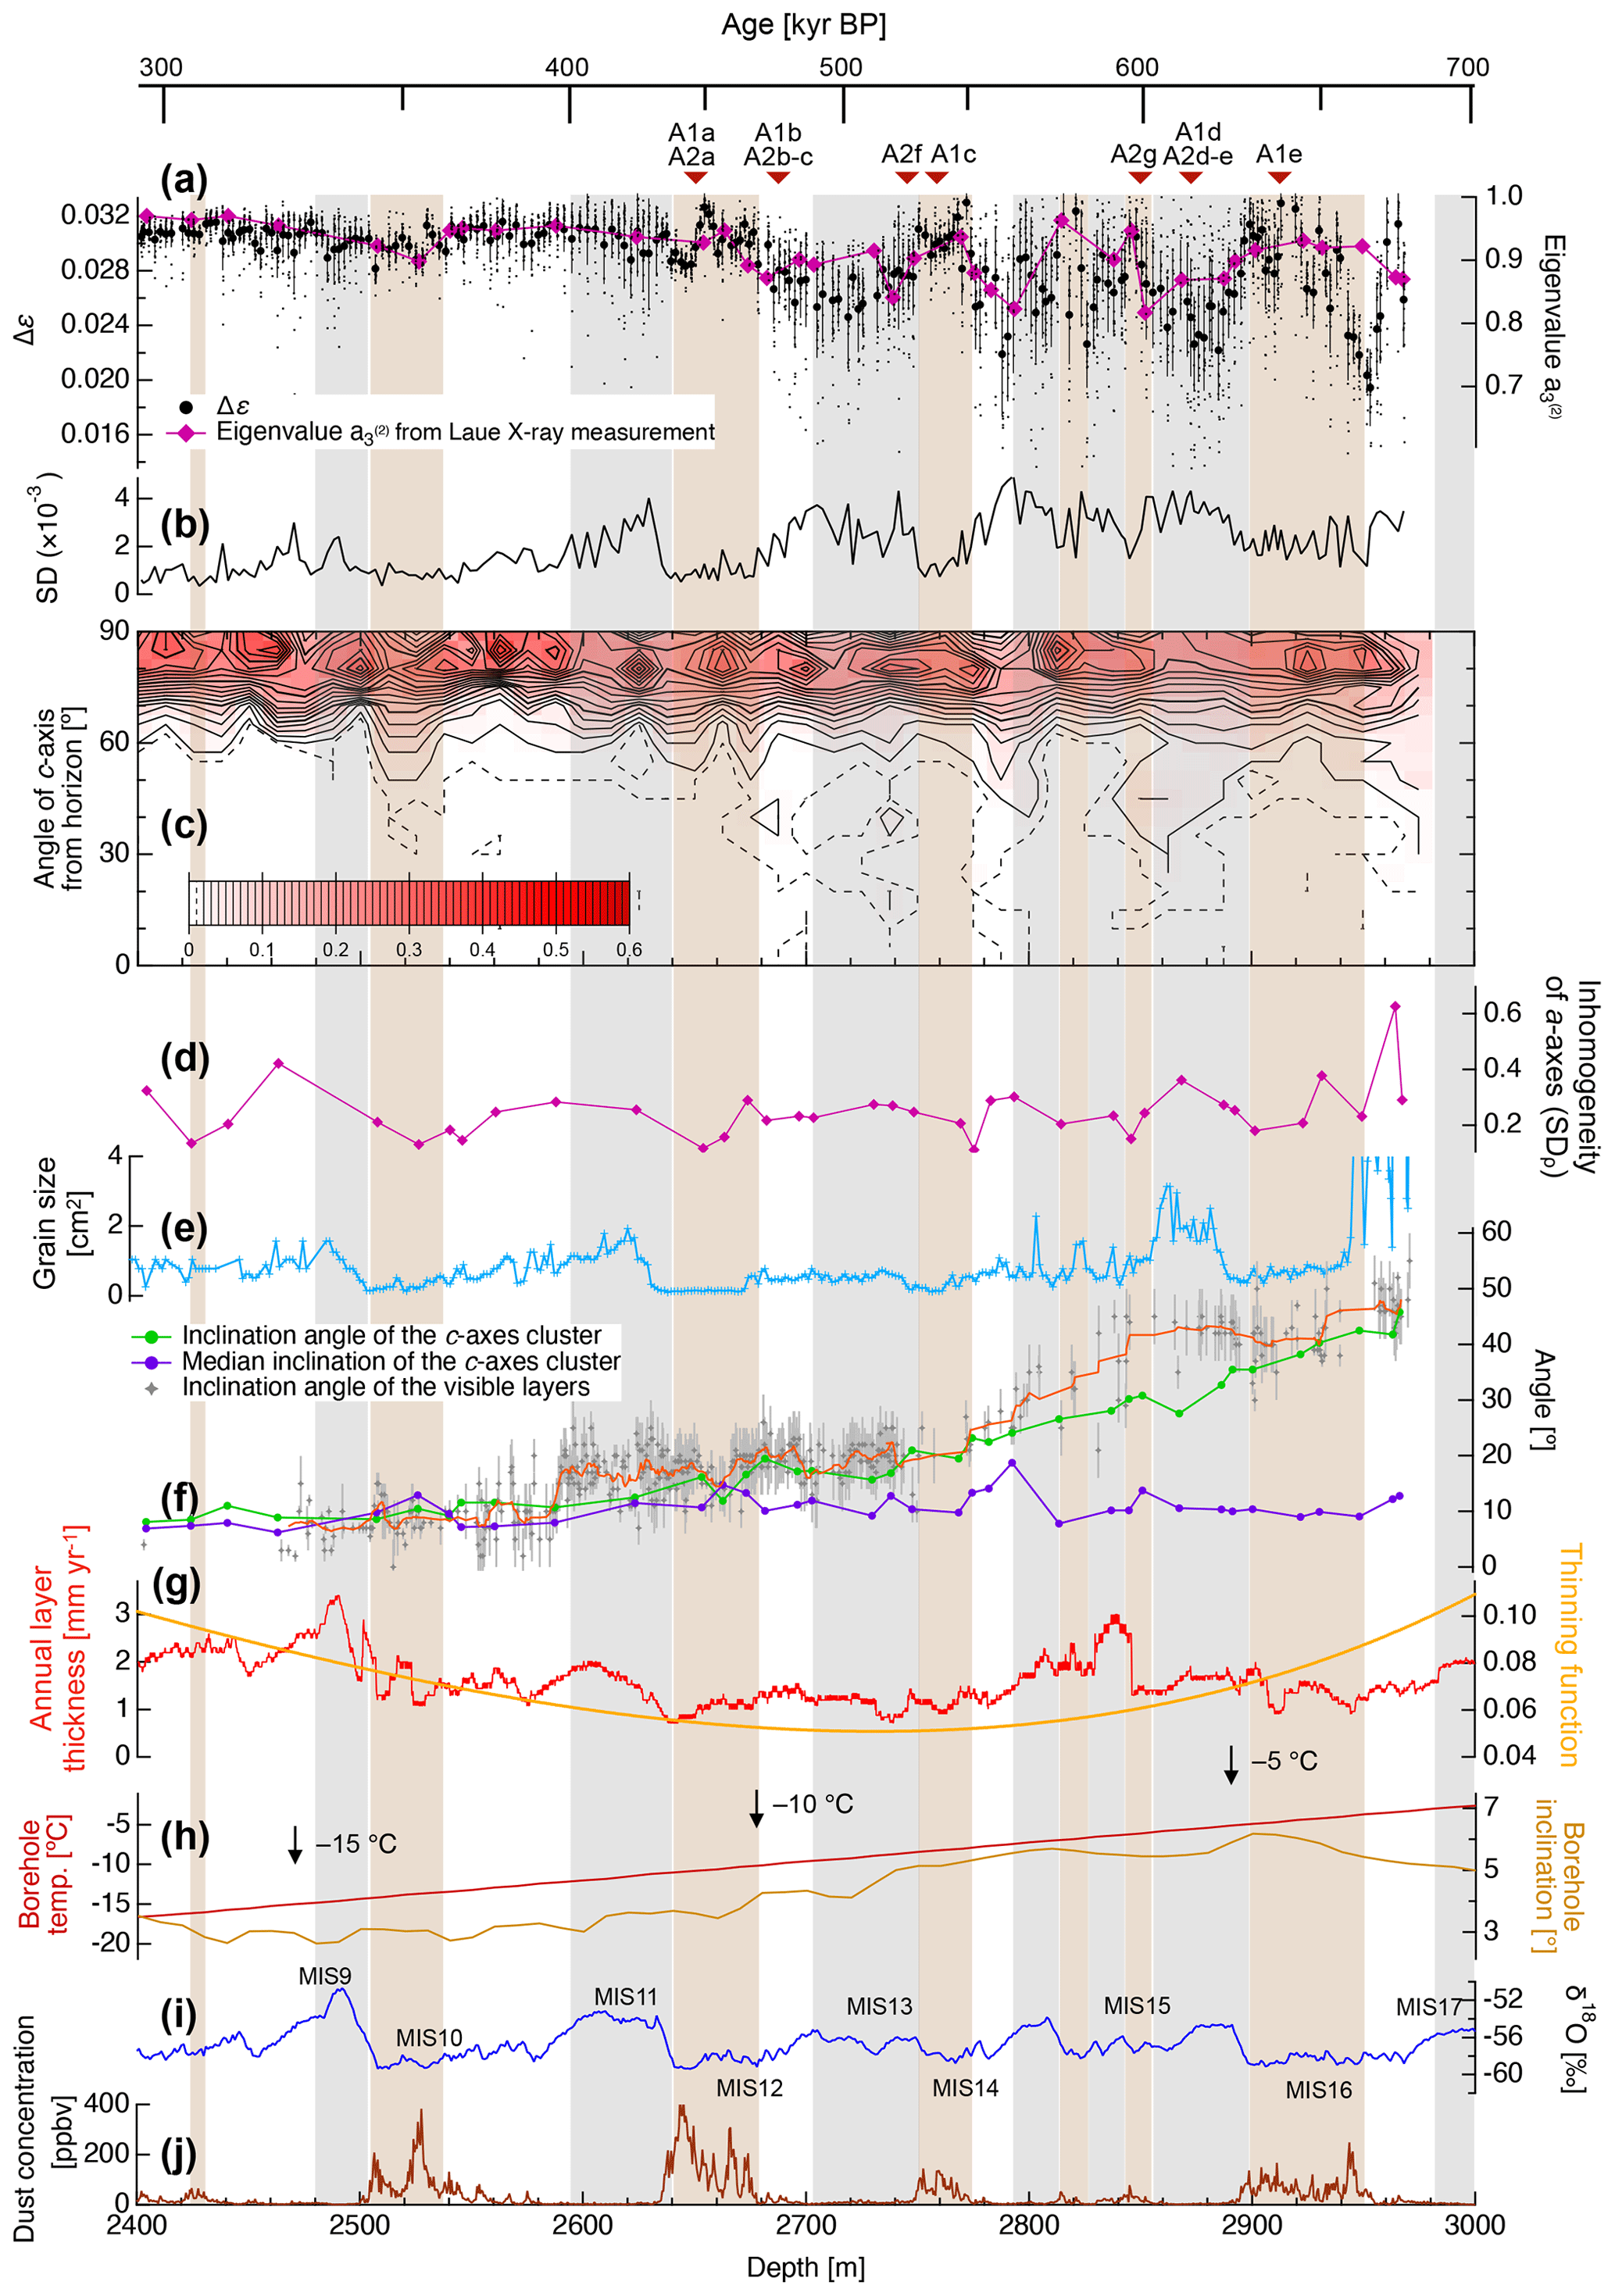
Figure 5A detailed comparison of Δε values with various ice core data. (a) Δε (mean and raw data generated using the DTM) and eigenvalues (from the Laue X-ray diffraction method). The potential uncertainty in the eigenvalues based on the total number of grains sampled is discussed in Sect. S1.4 in the Supplement. (b) SD values. (c) The distribution of c-axis angles relative to a plane orthogonal to the c-axis cluster as generated using data obtained from the Laue X-ray diffraction method. The probability of the presence of c axes in a given region is shown by the contour lines. (d) The inhomogeneity of the a axes as demonstrated by the SD of the a-axis density, ρ (SDρ). (e) Grain size data. (f) The angles of inclination of the c-axis cluster and the layers determined by visual observations together with median inclinations. The orange line was generated by smoothing of the angle of layers at 10 measuring points. (g) Data showing annual variations in the layer thickness and thinning function (DFICPM, 2017). (h) Borehole temperature and inclination data (Motoyama et al., 2020). (i) δ18O data (DFICPM, 2017). (j) Concentrations of dust particles (DFICPM, 2017). Grey and brown shading indicate interglacial periods and depths with higher concentrations of impurities (i.e. impurity-rich layers), respectively. The depths at which microstructures were observed are indicated in the upper part of the figure.
The a-axis fabric generally exhibited pronounced girdle-type clustering on each plane. Similar to the c-axis cluster data, the strength of this girdle clustering effect varied with increasing depth. Because each grain had three equivalent a axes orthogonal to the c axis, the distribution of the a axes in a girdle plane typically displayed maxima at 60° intervals. The depth profiles in View 4 indicate that the normalized density, ρ, of the a axis along the girdle plane of the a axis exhibits a variable relationship with θ. In some cases, there are significant variations at 60° intervals, as can be seen in Fig. 4b, e and g.
The c-axis distribution of each thin section and the a-axis inhomogeneity are also presented in Fig. 5c and d. Crystal grains with a c-axis orientation in the range of 30–60° were found at depths below 2600 m, with the exception of the impurity-rich layer indicated by brown shading. Here, the term impurity-rich means that the ice contains either insoluble particles (like dust) and/or soluble impurities (such as dissolved ionic species). The a-axis inhomogeneity was defined as the SD of the a-axis density ρ (hereinafter, SDρ), as shown in View 4 in Fig. 4. Here, larger values correspond to more anisotropic a-axis distributions. The data demonstrate relatively small and large extents of inhomogeneity in the impurity-rich and impurity-poor layers, respectively, and show that the SDρ of the a-axis inhomogeneity undergoes large fluctuations associated with transitions between glacial and interglacial periods. It is also very important to note that the SDρ data appear correlated with the grain size (Fig. 5e).
3.3 Depth-dependent variations in corrected Δε and SD values and eigenvalues
In this work, Δε′ values were corrected to Δε data using both the angle of inclination and the horizontal orientation of the c-axis cluster as estimated from the Laue X-ray diffraction method. The correction procedure is described in Sect. S2. Figure 5a plots the corrected Δε values and eigenvalues obtained using the Laue X-ray diffraction process. As was also the case in Fig. 3, the symbols and bars here indicate the mean values and the SDs determined at 0.5 m intervals along the core sample. Assuming a single-pole fabric without horizontal anisotropy, the relationship between the Δε and eigenvalue data can be expressed as , where Δεs is the dielectric anisotropy of a single crystal. The Δε values (Fig. 5a) reached a maximum of approximately 0.031 at depths of 2430 and 2654 m and then proceeded to exhibit significant fluctuation. The evident decrease in Δε values and increase in the SDs are a direct consequence of the scatter in the individual Δε measurements (represented by the dots in Fig. 5a). In the case that this is pronounced, the mean Δε value for a 0.5 m segment becomes smaller and the SD becomes larger. At depths greater than approximately 2900 m, the Δε values exhibit greater fluctuations over distances on the order of 10 m. It should also be noted that the Δε for each ice core specimen shows large negative spikes in conjunction with large SDs, as demonstrated by the dots in the panel and the typical profile presented in Fig. S9 in the Supplement.
3.4 Grain sizes, layer inclinations and microstructures
The grain size and angle of inclination data for the visible layers are presented in Fig. 5e and f, respectively. The grain sizes associated with interglacial and glacial periods were found to be significantly larger and smaller, respectively, with this difference becoming more pronounced at greater depths. It is also apparent that the Δε, the SD values for the Δε data and the grain sizes were approximately synchronous, implying the presence of a common underlying factor. The grain sizes exhibited no overall increase trend with increasing depth. The grain sizes at depths between 2900 and 2950 m remained small despite temperatures higher than −5 °C in this region. However, at depths greater than 2960 m (equivalent to the deepest ∼2 % of the core), the grain sizes were extremely large, often reaching sizes in excess of 300 cm2. The sizes can be seen to have fluctuated, and there is a clear distinction between the very small grains in the impurity-rich layers and the larger grains in the impurity-poor layers. The grain size data acquired below 2950 m are shown in Fig. 6.
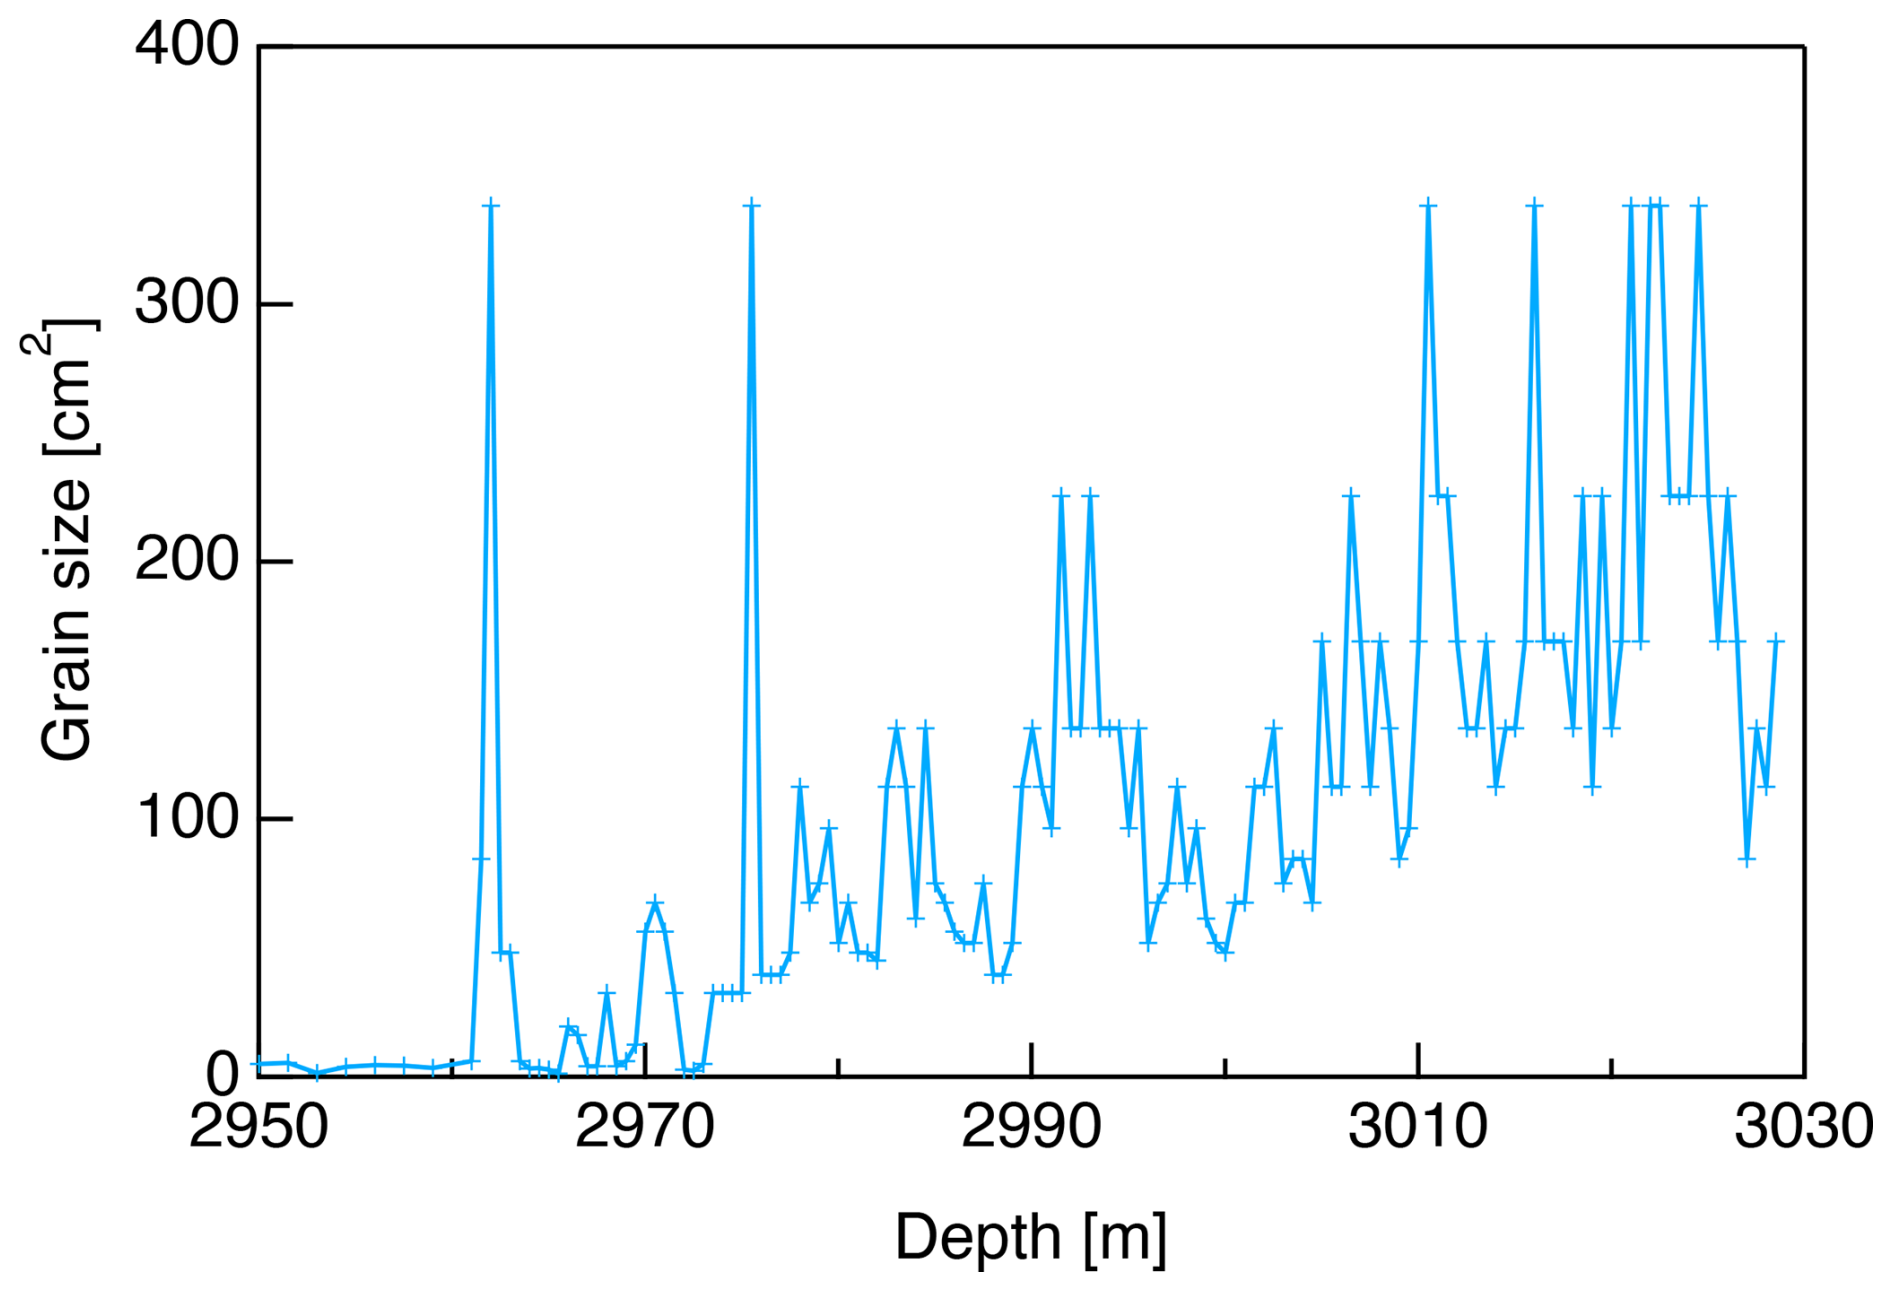
Figure 6Grain size data acquired below 2950 m. Note that the scale of the vertical axis is significantly different from that in Fig. 5e.
The inclination angle of the visual layers (see orange line in Fig. 5f) shows stepwise changes at 2580 and 2770 m, being 10° at depths less than 2580 m, 20° at 2770 m and reaching 45° at 3000 m. The present data demonstrated that the angles of inclination of the c-axis cluster and of the visual layers deviated over a wide range of depths below approximately 2580 m (Fig. 5f). This deviation was most pronounced at depths between 2800 and 2900 m.
Results and discussions of microstructures are given in Appendix A. Microstructural observations demonstrated the different manner of dynamic recrystallization and the different crystal morphology between the impurity-rich and impurity-poor layers (see Appendix A1, Appendix A2, and Fig. A1). Evidence of migration recrystallization, such as bulged grain boundaries and interlocking grains, as well as potentially nucleated grains were found in impurity-poor layers (see Appendix A3 and Fig. A2).
4.1 Development of crystal orientation fabric and layered structures in the deep sections: common and unique features of the site
The relationships between Δε values and normalized eigenvalues, and grain sizes in the DF and EPICA Dome C (hereinafter EDC) ice cores were examined (Fig. 7). These two sites are similar in terms of glaciological conditions, including surface temperature, annual mean surface mass balance and ice thickness (EPICA Community Members, 2004; DFICPM, 2017). In addition, the dust flux profiles of the DF and EDC ice cores are very similar (DFICPM, 2017). The general trends exhibited by cluster strength and grain size were found to be close to equivalent in both ice cores. Surprisingly, the c-axis cluster strength in the DF ice core was almost the same as that in the EDC ice core, even though the layer structures in the DF were largely inclined. Hence, layer inclination appears not to affect cluster strength. Durand et al. (2009) pointed out similar depth-dependent developments in c-axis clustering in deep sections of the GRIP ice core in Greenland (Thorsteinsson et al., 1997) and the EDC core in Antarctica. The equivalency among these three sites across both hemispheres implies that certain physical mechanisms are driving this similar development of c-axis clustering. The authors propose that the ambient temperature within these ice sheets could have produced this effect through mechanisms such as dislocation creep and recrystallization. At a depth of approximately 2400 m, the thickness of the ice was close to 10 % of the original ice equivalent thickness at the time of deposition (see Fig. 5g), with an eigenvalue, , of approximately 0.93. A highly clustered texture is unlikely to form in the case of zero or minimal shear stress as a means of compression or shear, such that dynamic recrystallization occurs as an accommodation process. This state of saturation of the c-axis cluster and the common temperature range may be more effective triggers for nucleation and recrystallization. The deepest 10 %–20 % of the polar ice sheets is typically characterized by ready deformation in response to horizontal shear because of the presence of high temperatures and a highly clustered c-axis fabric. At these depths, dynamic recrystallization plays a critical role, particularly in impurity-poor layers, in the recovery of various c-axis orientations capable of promoting deformation based on dislocation creep.
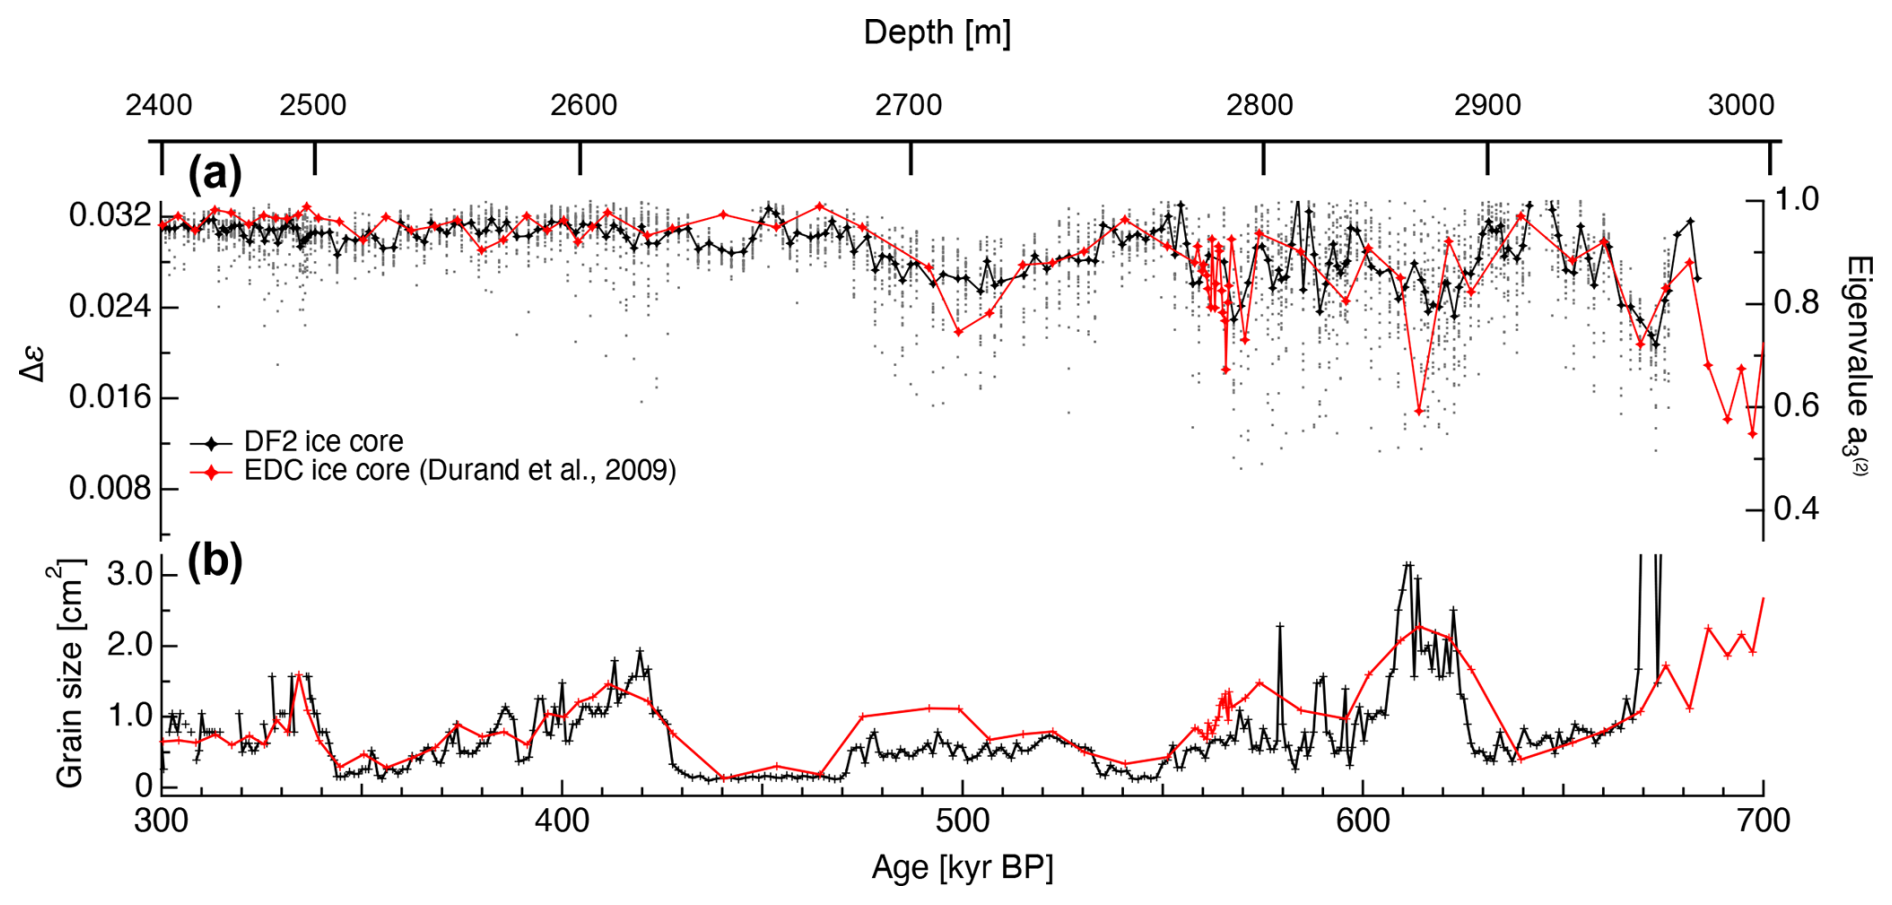
Figure 7A comparison of the c-axis fabric and grain size data obtained from the DF core and the EDC core, applying the AICC2012 age scale (Bazin et al., 2013). (a) The Δε presented as raw data (dots) and as mean values for 0.5 m segments (black symbols for DF data) or for each thin section (red symbols for EDC data). The right-hand axis provides a scale for normalized eigenvalues. (b) Grain sizes in the DF and EDC cores. The EDC data are from Durand et al. (2009).
A unique feature of the DF ice core is the inclined layered structures. The coring site is situated on a bank very close to a subglacial trench (Fig. 1c), with both the depth difference and distance between the two being approximately 100 m. This geometry corresponds to the maximum angle of inclination of the c-axis cluster of approximately 45° and the angle of inclination of the visually identifiable layers of approximately 45° near the base of the ice sheet (Fig. 5f). This deeper trench may act as a pathway for the flow of subglacial water, while the deeper bed can accumulate meltwater (e.g. Pattyn, 2010; Fujita et al., 2012). Thus, the authors suggest that a simple shear strain component is directed towards the subglacial trench. The rheology of polycrystalline ice with a single-pole fabric is similar to that of single crystal ice, in that both will readily deform in response to simple shear stress. In the case of DF, because of the friction force between ice and inclined bedrock, simple shear system would rotate the entire system including the internal layers and the c-axis cluster together. In principle, simple shear is a superposition of pure shear and the rigid-body rotation of the system, and layer inclination is a result of the latter rotation. The c axes are also included within the system's rigid-body rotation. However, normal components of the strain (both compression in the near-vertical and extension near the horizontal plane) cause the rotation of the c-axis cluster alone toward the vertical by intracrystalline slip at the same time. In this way, the total amount of inclination becomes larger for the layers than for the c-axis cluster. Thus, the mismatch between the angles implies that simple shear was the primary mechanism within this depth range. Considering the consistency of the eigenvalues between the DF and the EDC ice cores (Fig. 7), the rigid-body rotation appears not to affect cluster strength. The nature of deep sections in the DF ice core is similar to that of the EPICA Dronning Maud Land (hereinafter EDML) ice core (Weikusat et al., 2017), which is located in a divide region where horizontal flow occurs. In the deepest sections of the EDML ice core, strong shear stress parallel to the bedrock is predominant. In contrast, the DF ice is located within a dome region. Even in the case that vertical compression is predominant in shallow sections, shear stress may be the primary mechanism in deeper sections due to the bedrock inclination.
4.2 Large-scale development in the crystal orientation fabric and grain sizes: variations during the glacial and interglacial periods
A clear advantage of DTM is that data with a high sampling frequency, high spatial resolution and high continuity allowed for the evaluation of c-axis cluster fluctuations in comparison with various ice core data. Saruya et al. (2022a) investigated the factors affecting the c-axis fabric at depths above 2400 m by assessing correlations between Δε and various ionic impurities and dust concentrations. They found that Δε exhibited a positive correlation with the concentration of Cl− ions but an inverse correlation with the number of dust particles. In contrast to depths above 2400 m, the relationship between Δε and Cl− ions was unclear below 2400 m. This work compared Δε with grain size, δ18O and dust particle concentration (Fig. 5a, e, i and j). It is well known that glacial ice includes many soluble impurities as well as dust particles (i.e. impurity-rich ice). Referring to the δ18O profile, it is apparent that the mean Δε values decreased (caused by the large scatter of data points) during interglacial periods at depths below 2640 m. These decreases became more pronounced as the scatter of the raw data became more significant at greater depths. The SDs were smaller in samples associated with glacial periods and larger during interglacial periods (Fig. 5b). High concentrations of impurities had an apparent effect on the Δε values, maintaining consistently high Δε below 2600 m (Fig. 5a). Small grain sizes were also present (Fig. 5e). Overall, the grain sizes and the c-axis fabric were found to be interdependent and strongly correlated with the presence of impurities.
Above 2400 m, the grain size grew steadily (but with a partial decrease during the two glacial periods) (Azuma et al., 1999, 2000). However, below 2400 m, there was no overall increase in grain size. During interglacial periods, the grain size gradually increased with depth, but it decreased sharply during glacial periods that were associated with higher impurity concentrations. At the lower glacial ice boundary, the grain size again became smaller, indicating that grain size growth was interrupted during glacial periods. This pattern has also been reported to occur in the EDC core (Durand et al., 2009). The reason that grain growth in deeper ice is interrupted during glacial periods remains unclear, although this effect may be due to nucleation or migration recrystallization. Figures 5c and A2 show signs of nucleation and migration recrystallization (e.g. the presence of crystal grains having a c-axis orientation in the range of 30–60° and bulging (cuspidate) grain boundaries), both of which can reduce the mean grain size, in interglacial ice specimens. These phenomena may suppress normal grain growth and lead to smaller grain sizes. Furthermore, extremely large grains exceeding 10 cm in radius (∼300 cm2) were observed below 2960 m (Fig. 6). Grains of this size have not been found in the EDC core to date (see Fig. 7). Interestingly, small grains (less than 1 cm2) were maintained at a depth of approximately 2900 m (MIS16), despite the high temperatures at that depth that were close to the melting point of ice (−5 °C). Although the concentration of dust particles was not as high in this region (less than 100 ppbv), the grain boundary pinning effect caused by dust particles still remained effective – even at high temperatures.
Significant changes in the cluster strength and the distributions of c-axis angles were found below the impurity-rich layer at depths between 2640 and 2680 m. The fluctuations in Δε values increased significantly, and crystal grains with a c-axis orientation in the range of 30–60° appeared. The reason for these changes remains uncertain, but one possible explanation is the activation of migration recrystallization. Migration recrystallization is thought to occur at temperatures higher than −10 °C (e.g. Duval and Castelnau, 1995; Montagnat et al., 2009). The ambient temperature at this layer is approximately −10 °C. The authors propose that the activation of migration recrystallization caused these changes and that the dusty impurities that influence the grain boundary mobility are responsible for the degree of this process.
4.3 Impacts of dust particles and dynamic recrystallization on the crystal orientation fabric and grain sizes
The behaviour of dynamic recrystallization highly depends on the temperature and impurities (e.g. Humphreys and Hatherly, 2004; Cuffey and Paterson, 2010). It should also be noted that the relationship between cluster strength and the concentration of dusty impurities changes at approximately 2640 m. Impurity-rich layers maintained a high degree of clustering, whereas layers with fewer impurities showed relaxation. According to a case study concerning the NEEM ice core by Eichler et al. (2017) and a review by Stoll et al. (2021b), dust particles are located not only at grain boundaries but also in grain interiors and at triple junctions. It is well known that dust particles restrict grain growth and result in smaller grain sizes (e.g. Alley and Woods, 1996). This trend was observed in the present study. The scatter plots of the Δε values, grain sizes and concentration of dust particles are given in Fig. 8. The grain sizes decreased as the concentration of dust particles increased (Fig. 8b). However, the role of dust particles in ice deformation via dislocation creep is not well understood. Dust particles can produce dislocation or may act as sink of dislocations similar to grain boundaries. Saruya et al. (2022a) suggested two possible actions of particles: (i) restricted deformation due to the inhibition of dislocation by dust particles and/or (ii) the promotion of diffusion creep that does not cause c-axis rotation. Diffusion creep is known to be promoted by smaller grain sizes. Which of these effects is more dominant is not currently known, although either one could restrict c-axis clustering. The present work found that the degree of c-axis clustering in impurity-rich layers containing dust below 2640 m was stronger than that in the surrounding layers. Below 2640 m, the Δε values were found to increase as the concentration of dust particles increased (Fig. 8a). This trend cannot be explained by the above two possibilities. Additionally, the consistently smaller grain sizes in the impurity-rich layers indicate that grain boundary migration was also restricted in such ice. This confirms that the movement of dislocations as line defects and of grain boundaries as planar defects within the crystal lattice was greatly affected by the presence of dust particles that act as obstacles.
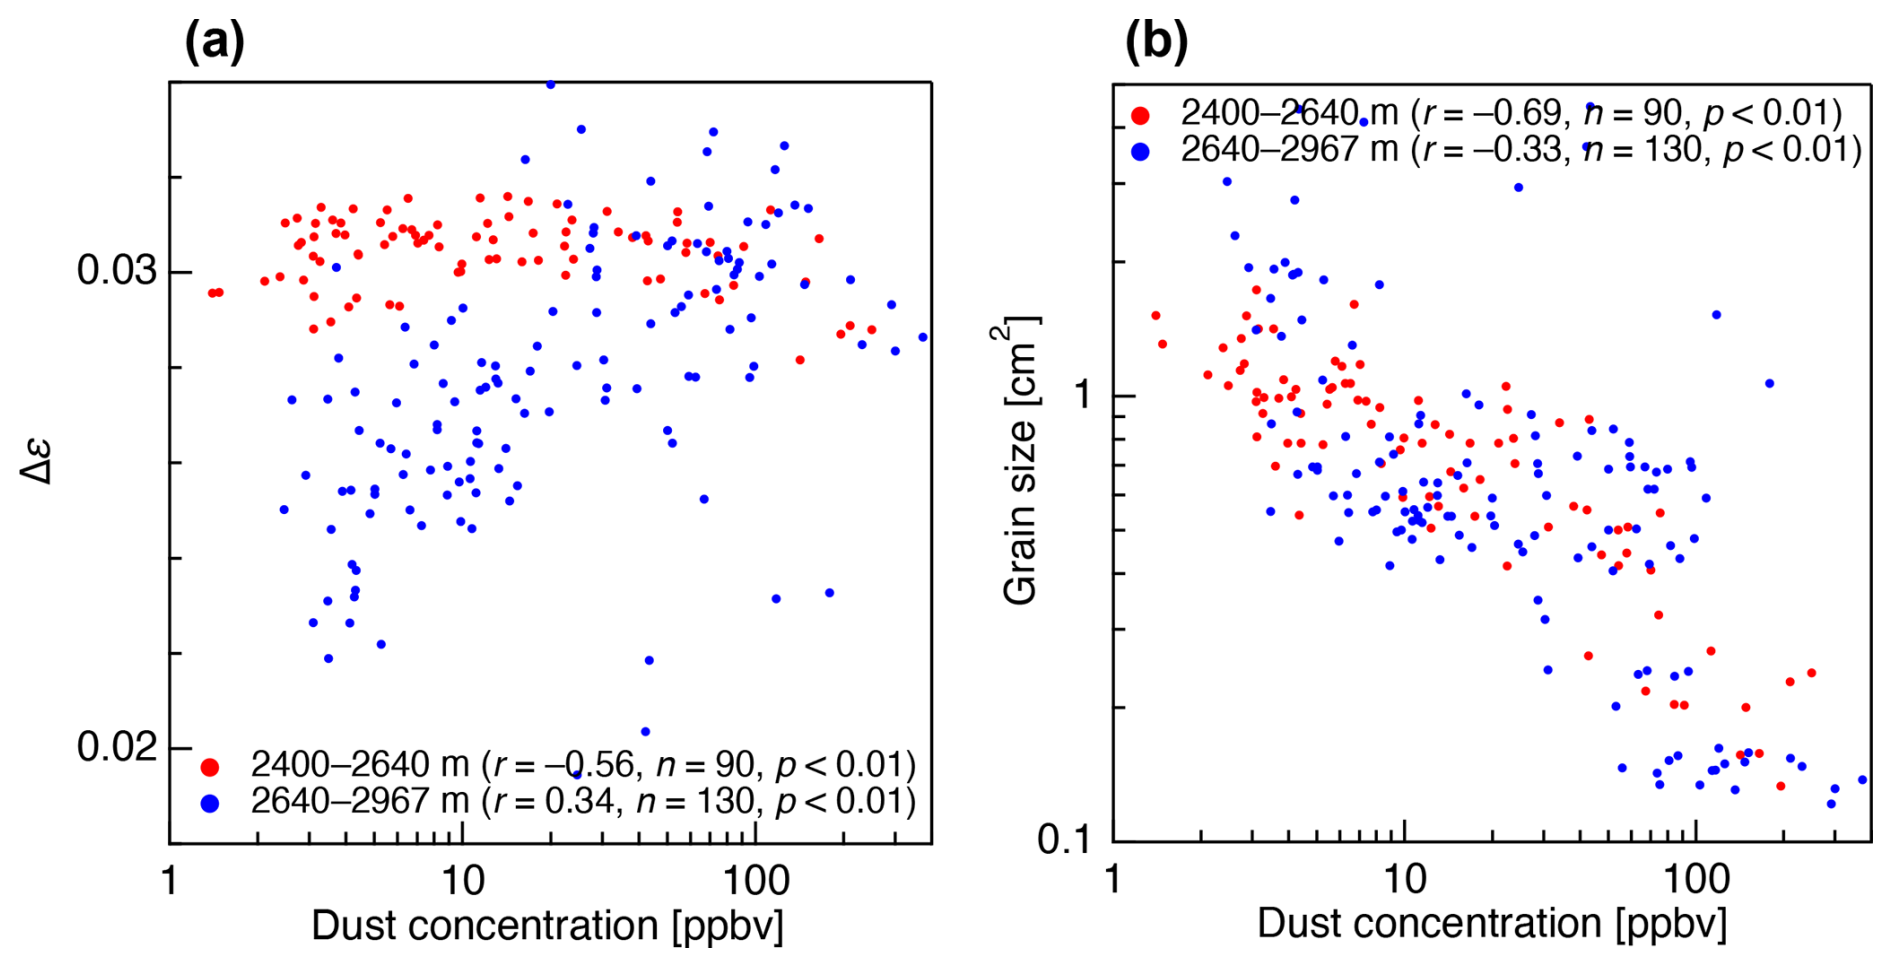
Figure 8Scatter plot of (a) the Δε values and dust concentration and (b) grain sizes and dust concentration. Note that, in these panels, grain sizes and dust concentration are shown using logarithmic scales. In each panel, red and blue markers correspond to the data from 2400 to 2640 m and from 2640 to 2967 m depths, respectively. The correlation coefficient (r), sample number (n) and p value (p) are given with the legend.
The c-axis fabric contains information concerning the deformational history of the ice as well as grain growth and recrystallization (e.g. Cuffey and Paterson, 2010; Faria et al., 2014a, b). Ultimately, all of these factors are sensitive to the deposition of insoluble impurities that limit grain boundary migration through Zener pinning mechanisms and also impede dislocation movement (Alley and Woods, 1996; Durand et al., 2006). The distribution of the c axes shown in Fig. 5c indicates that crystal grains with a c-axis orientation in the range of 30–60° appeared at depths below 2600 m. New grains are thought to have been formed with an orientation that promoted basal glide (e.g. Alley, 1992; Humphreys and Hatherly, 2004; Cuffey and Paterson, 2010), meaning approximately 45° from the compressional axis. Additionally, crystal grains with c-axis orientations in the range of 30–60° were more frequent in the impurity-poor zones, in which the grain size was larger and the Δε values lower. The authors propose that these grains with a c-axis orientation of 30–60° correspond to nucleated grains in the deeper part of the ice and could have grown while eliminating older grains by migration recrystallization. These ice crystals would be expected to develop c-axis orientations that favoured dislocation-creep-based deformation. The formation of such grains as a result of nucleation is consistent with the observations of the corresponding grains (see Appendix A3 and Fig. A2).
Concerning the a-axis organization, in the case that the degree of inhomogeneity of the a axis within the girdle was expressed as SDρ, these values were generally larger in impurity-poor layers and smaller in impurity-rich layers (Fig. 5d). The SDρ values and grain size were approximately synchronous (Fig. 5e). During dislocation creep, if the basal plane is the primary slip plane (i.e. the easy-glide plane of hexagonal ice), it is unlikely that a-axis organization will occur geometrically on this basis. As dislocation creep and a-axis organization do not seem to be interdependent, we can exclude this possibility. The organization of the a-axis structure among the crystal grains can occur as a result of interactions at the boundaries between adjacent grains. Therefore, the authors speculate that dynamic recrystallization processes, particularly migration recrystallization associated with nucleation, play a critical role.
The authors propose that grain nucleation and migration recrystallization lead to significant changes in the crystal orientation fabric. The decrease in Δε values and less clustered c-axis fabric in impurity-poor layers can be explained by the growth of grains with different c-axis orientations. Conversely, such grains were much smaller and limited in volume in the impurity-rich layers. Grain coarsening by migration recrystallization does not appear to occur because insoluble impurities restrict grain boundary migration (e.g. Durand et al., 2006; Stoll et al., 2021b) and, thus, limit the growth of nucleated grains. Therefore, the change in the c-axis fabric (meaning a decrease in Δε values) caused by nucleation and migration recrystallization should be significant only in impurity-poor layers. On this basis, dynamic recrystallization would be expected to greatly affect the c-axis fabric development. Even in the case that grain nucleation occurs in both impurity-rich and impurity-poor ice, the contribution of this process to changes in the c-axis fabric would depend on the surrounding conditions. Hence, this effect may not be immediately apparent in terms of the volume-weighted mean Δε values obtained using the DTM. However, the growth of these nucleated grains, which occurs primarily in impurity-poor ice, and the subsequent strain-induced migration recrystallization could significantly affect the Δε values because of the growth of grains with different c-axis orientations. The influence of migration recrystallization on the crystal orientation fabric at the deep sections in ice sheets has also been mentioned in the GRIP and EDC ice cores (Thorsteinsson et al., 1997; De La Chapelle et al., 1998; Durand et al., 2009), but the specific processes and contributions (such as differences in recrystallization activity between impurity-rich and impurity-poor layers, appearance of crystal grains with a c-axis orientation that was significantly offset from the surrounding grains, the mechanisms behind the relaxation, and large fluctuations in c-axis clustering observed in the interglacial periods) are clarified in this work.
4.4 Small-scale development of crystal orientation fabric and grain sizes: fluctuations within impurity-rich and impurity-poor layers
Close-up profiles and scatter plots for the Δε values, grain sizes and concentration of dust particles at depths between 2600 and 2820 m are given in Fig. 9. The Δε values exhibit a negative correlation with the dust particle concentration in impurity-rich layers ( at depths between 2635 and 2676 m) but a positive correlation in impurity-poor layers (r=0.47 at depths between 2678 and 2748 m) (Fig. 9d). A similar negative correlation has also been observed at depths above 2400 m (Saruya et al., 2022a), suggesting that the variation in Δε values within impurity-rich layers originated at shallow depths and was preserved until deep sections. In contrast, variations in Δε values within impurity-poor layers appear to develop at greater depths due to migration recrystallization. The authors propose that the lower concentration of dust particles enhances migration recrystallization, leading to smaller Δε values. This suggests that, at greater depths, the deformation history in the impurity-rich layers is preserved, whereas that in the impurity-poor layers is updated (i.e. lost) by the active migration recrystallization. Additionally, as shown by a positive correlation in impurity-poor layers, even small numbers of dust particles and small variations in their concentration can significantly influence the crystal orientation fabric.
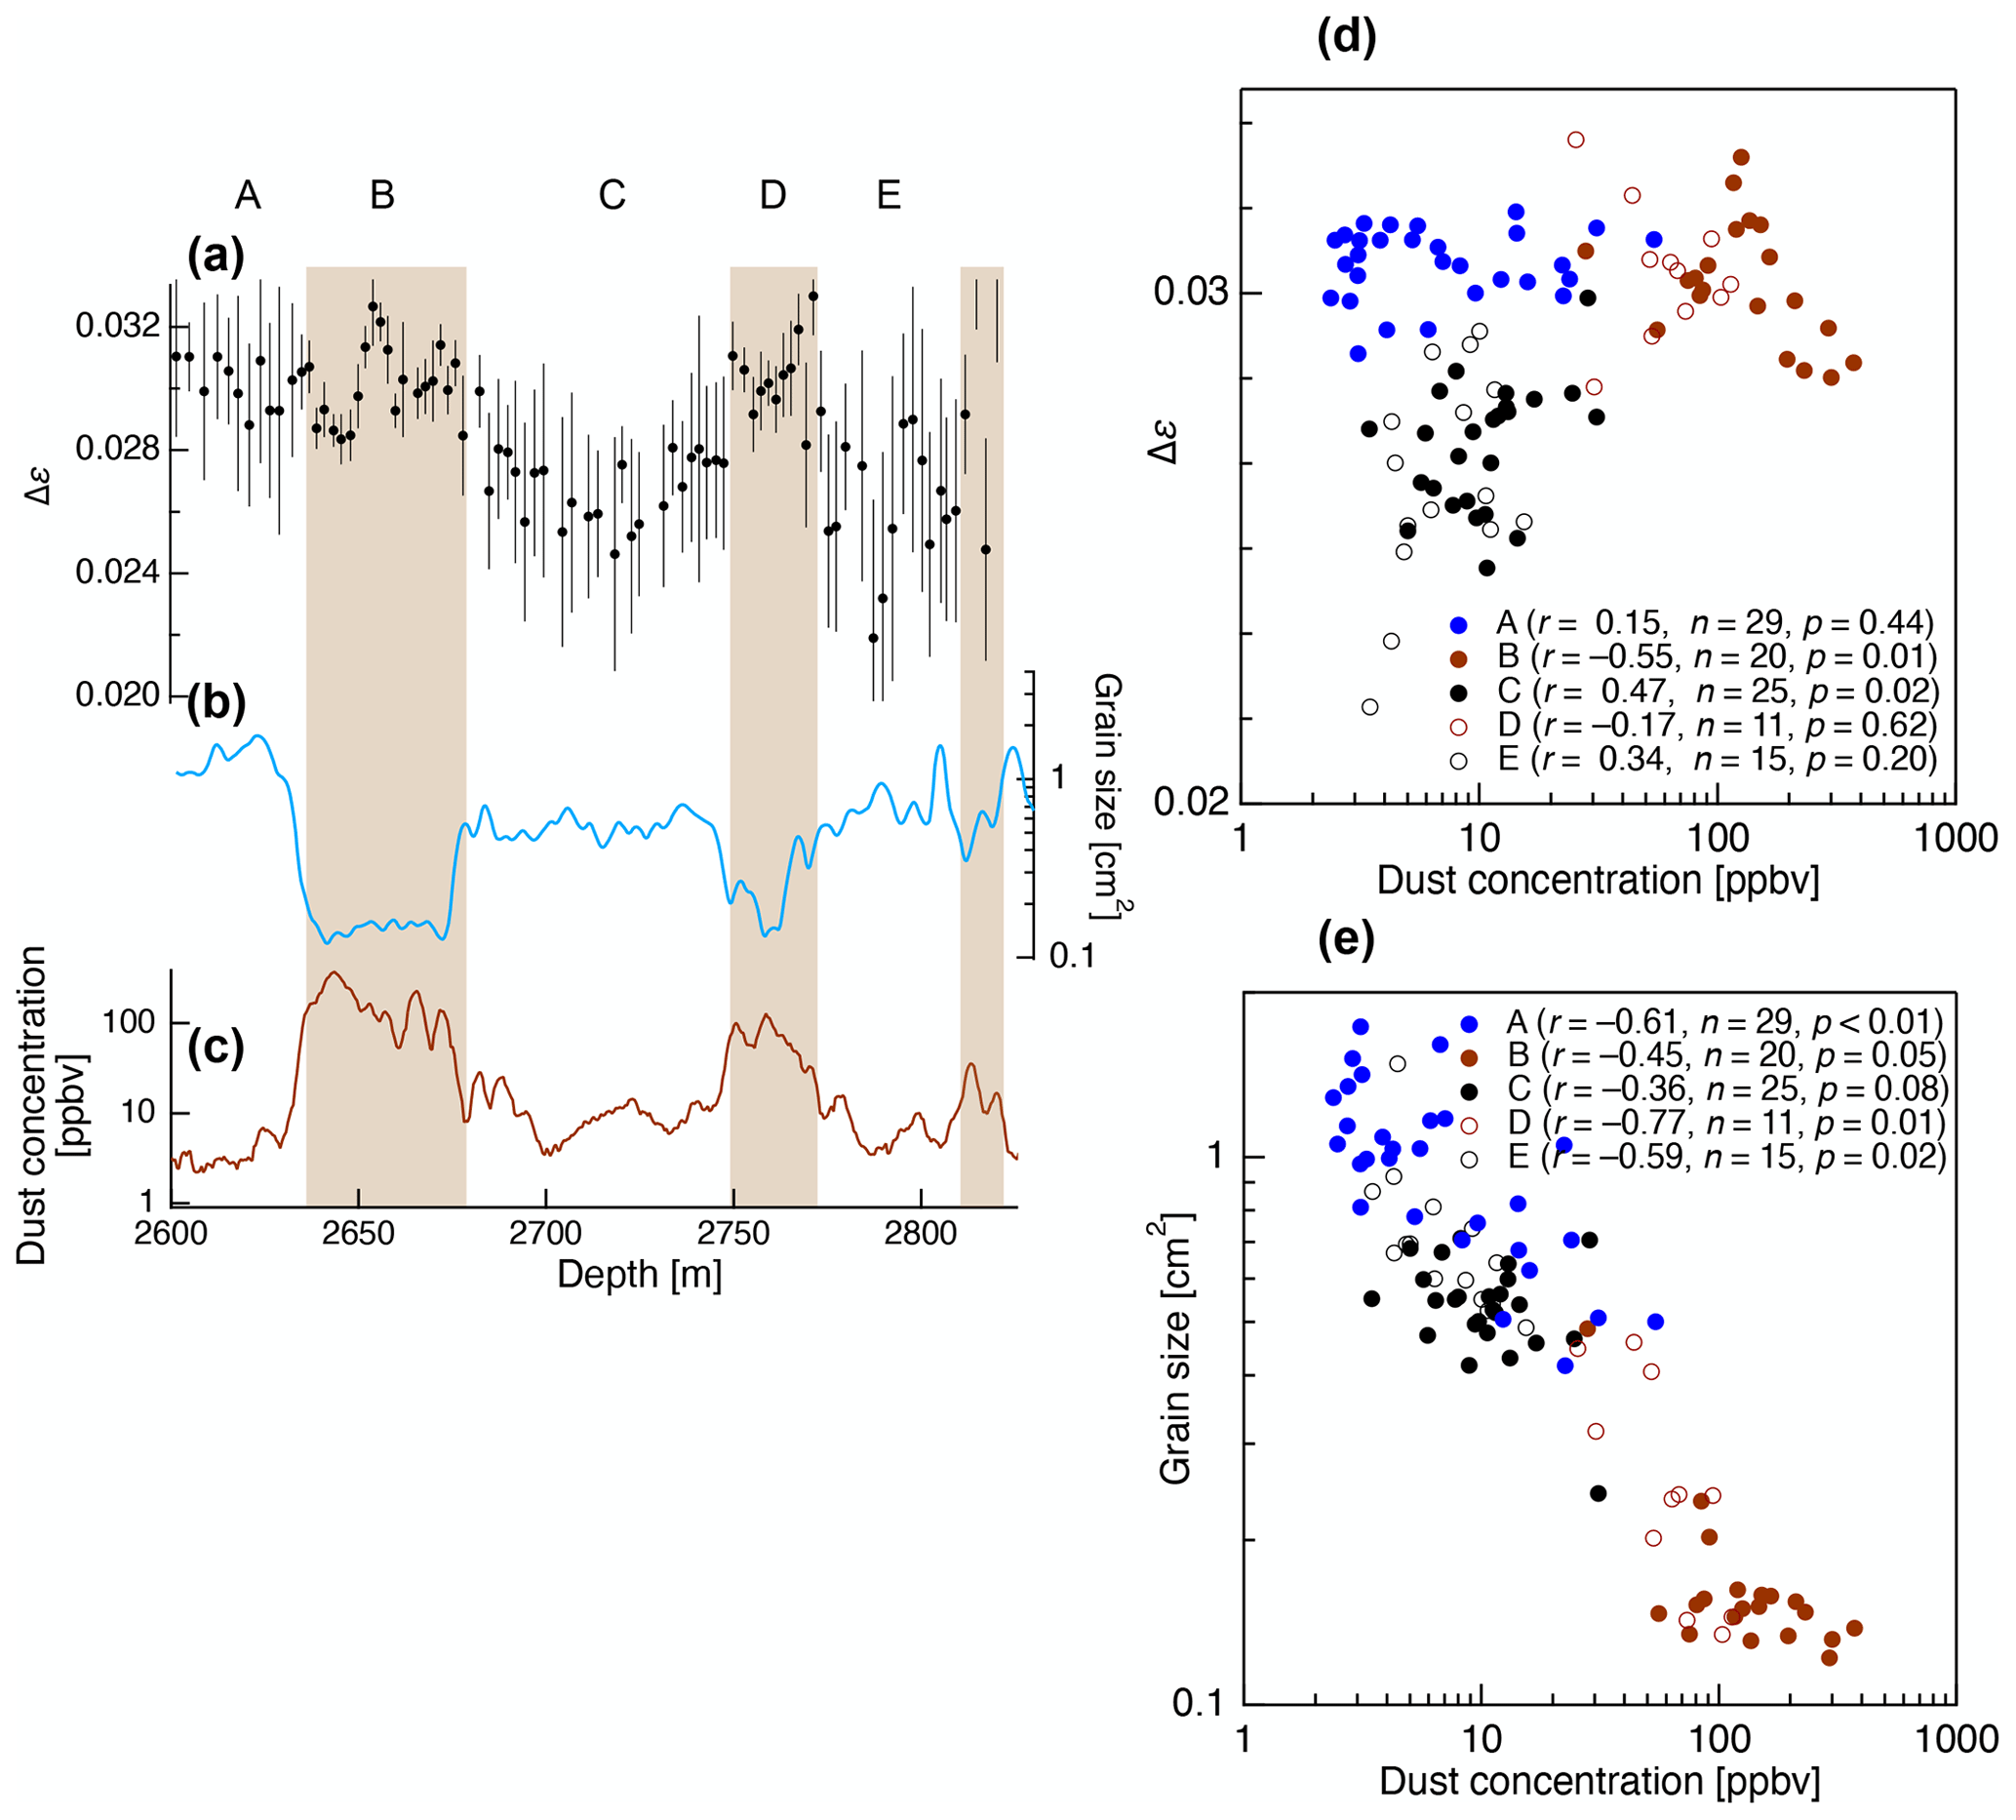
Figure 9Detailed comparison of the Δε values, grain sizes and dust concentration at depths between 2600 and 2820 m. Panels (a) to (c) present close-up profiles. Note that, in these panels, grain sizes and dust concentration are shown using logarithmic scales. Grain sizes and dust concentration profiles are smoothed over 2.5 m (grain size data were smoothed after interpolating to generate a 0.5 m interval data). Brown shading (zones B and D) indicates impurity-rich layers. The boundary concentration of dust particles between impurity-rich and impurity-poor layers was approximately 30 ppbv. (d) Scatter plot of the Δε values and dust concentration. (e) Scatter plot of the grain sizes and dust concentration. The correlation coefficient (r), sample number (n) and p value (p) are given with the legend in panels (d) and (e). A to E correspond to the depth zones given in the left panel.
Another feature of the impurity-rich layers was consistently small grain sizes (see depths between 2635 and 2676 m; Fig. 9b), an effect otherwise referred to as steady-state grain size (e.g. Steinbach et al., 2017). This effect is thought to occur if normal grain growth counteracts rotation recrystallization, regardless of the initial grain size (Jacka and Li, 1994). The authors propose that the steady grain sizes in the impurity-rich layers appeared at greater depths. At shallower depths, the grain sizes would have been inversely correlated with the dust concentration.
With the aim of obtaining a better understanding of the layer structures and deformation regimes in the deep sections of polar ice sheets, this work investigated the lowermost 20 % of the DF ice core using innovative analytical methods. Based on the Laue X-ray diffraction method, detailed information was obtained concerning the c and a axes of individual crystal grains, while microstructural observations were used to assess migration recrystallization and potentially nucleated grains. The DTM, applied to acquire c-axis fabric data with a high sampling frequency, high spatial resolution and high continuity, revealed large and small variations in the c-axis cluster strength and the controlling factors of these variations. Combining the data from the DTM and the Laue X-ray diffraction method allowed the crystal orientation fabric layering to be elucidated. The primary strain configurations in the ice were found to transition from vertical compression to a combination of vertical compression and simple shear. Insoluble particles such as dust were determined to affect the fabric evolution by shifting from promoting the slower formation of c-axis clustering to inhibiting relaxation of the c axis. The activity of dynamic recrystallization was also determined to increase from less active to more active states. The primary conclusions obtained from this work are as follows:
- (i)
Development of c-axis clustering and layered structures. The clustering strength of the single-pole c-axis fabric reached a maximum between 2400 and 2640 m. The fluctuations in cluster strength increased substantially below this depth. Up to a depth of 2700 m, the angles of inclination of the c-axis cluster and visible layers were approximately consistent but deviated from the vertical. The system rotated as a rigid body as a result of simple shear strain, while the c-axis cluster alone rotated backward because of the compression components of the simple shear applied to the ice. The primary role of shear stress in the deep sections was similar to the effects observed in the EDML ice core (Weikusat et al., 2017).
- (ii)
The similarity between the DF and EDC ice cores. The general trends exhibited by the c-axis cluster strength and grain sizes in the present work were approximately the same as those seen in the EDC ice core (Durand et al., 2009). These similarities may be attributed to equivalent impurity concentration profiles (which, in turn, are associated with climate change) and temperature profiles. Hence, it appears that rigid-body rotation does not affect cluster strength.
- (iii)
The preferred a-axis fabric. The a-axis fabric exhibited a preferred orientation within the plane of the a-axis girdle on the spatial scale of the thin sections used for the Laue measurements. This organization of the preferred a-axis fabric was enhanced in impurity-poor ice.
- (iv)
Roles of nucleation and migration recrystallization. Evidence of migration recrystallization, such as bulged grain boundaries and interlocking grains, as well as potentially nucleated grains were found in impurity-poor layers. These microstructures were unique to deeper sections. It appears that nucleation and migration recrystallization lead to the c-axis relaxation and a-axis organization observed in this work.
- (v)
Contrast between impurity-rich and impurity-poor layers. The relationship between cluster strength and the concentration of dusty impurities was found to change at approximately 2640 m. Below this depth, layers with higher concentrations of impurities were found to maintain stronger c-axis clustering and smaller grain sizes. In contrast, impurity-poor layers exhibited the relaxation of c-axis clustering and increased crystal sizes due to nucleation and migration recrystallization. These effects modified both the c-axis and a-axis fabric of such layers.
- (vi)
Grain sizes in the deepest sections. Small grain sizes were maintained between 2900 and 2950 m. Grain boundary pinning by insoluble impurities remained significant – even at high temperatures close to the melting point of ice. However, the grain sizes became extremely large below 2960 m. In the high-temperature environment near the bedrock, small variations in the concentration of impurities greatly affected the microstructure.
A1 Microstructural features in glacial and interglacial periods
The present study provides limited but significant examples of noteworthy microstructures, as shown in Figs. A1 and A2. In Fig. A1, five examples are provided that include impurity-rich ice (panel a: 2648 m, ∼270 ppbv dust concentration; panel c: 2759 m, ∼137 ppbv), impurity-poor ice (panel b: 2685 m, ∼10 ppbv; panel d: 2872 m, ∼3 ppbv) and impurity-rich deep ice (panel e: 2907.5 m, ∼80 ppbv). Images are presented of thin sections viewed through crossed polaroids along with the c-axis fabric data for each grain obtained using the G50 instrument and microscopy images. The thin black lines in the microscopy images indicate grain boundaries. Such boundaries when on the reverse side of a thin section appear as thinner lines. Illustrations of the front and reverse side grain boundaries and the sub-grain boundaries are provided in Fig. S3 in Sect. S1.5 in the Supplement. Panels (a) and (c) show numerous small grains with c-axis orientations that are obviously offset from the vertical direction (see the c-axis fabric image). These grains are sparsely distributed and typically have sizes on the order of a millimetre or less. Flattened (or two-dimensionally elongated) grains with a noticeable slant are also evident. These features were present at impurity-rich depths but absent at impurity-poor depths. In the case of panels (b) and (d), much coarser grains are apparent with a c-axis orientation distinctly offset from the vertical direction. Compared with the results for the impurity-rich layers, these coarser grains occupy much larger areas in the image, having diameters of several millimetres. In the case of the two deepest samples (panels d and e), it is evident that the crystal grain boundaries often appear as straight lines with few sub-grain boundaries. Panel (e) shows an impurity-rich layer, in which the crystal grains are coarser relative to those in panels (a) and (c). Furthermore some characteristics of the impurity-rich layers in panels (a) and (c) are less pronounced in panel (e).
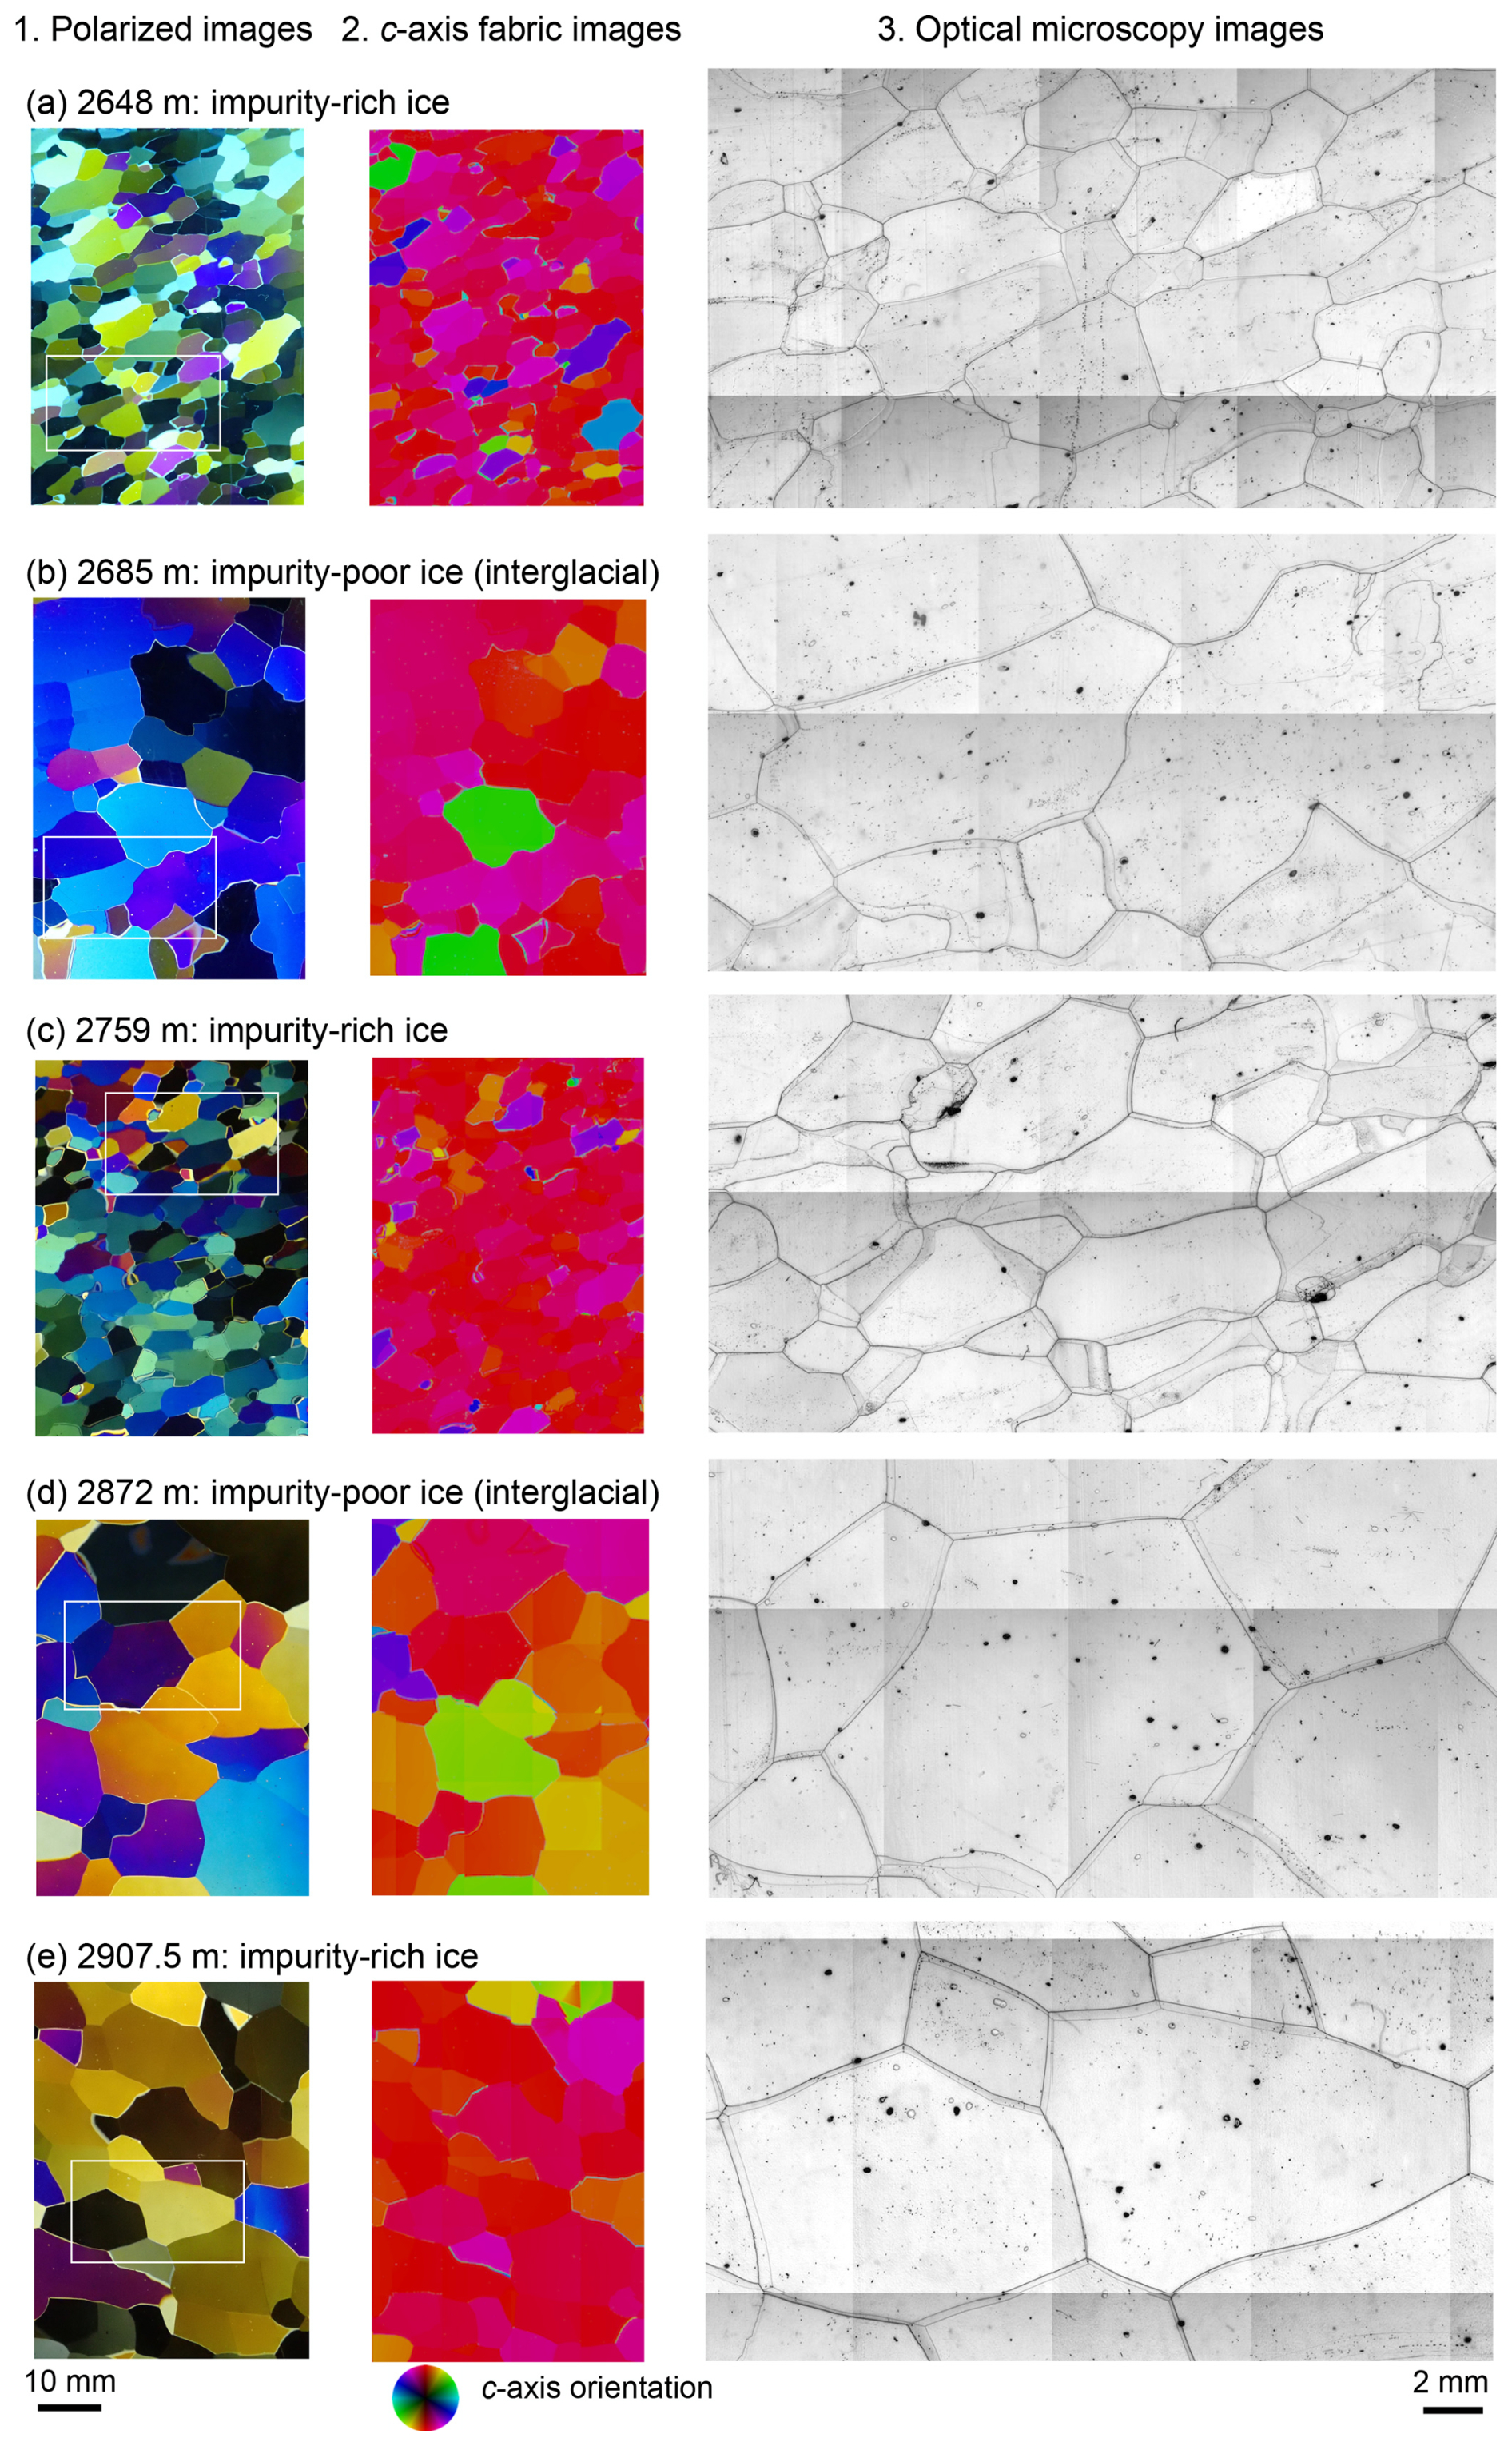
Figure A1Microstructure images of typical specimens from five depths. The depths and ice type for each specimen are specified in the figure. For each depth, an image of a thin section viewed through crossed polaroids (left), a c-axis fabric image (centre) and optical microscopy images (right) are presented. In the optical microscopy images, the thin black lines indicate grain boundaries, while grain boundaries on the reverse side of the sample are visible as thinner lines. The white rectangles in the leftmost column indicate the locations from which the microscopy images shown in the right column were obtained. A legend concerning the colour coding of the c-axis orientation data in the images in the central column is provided at the base of the figure. The colour of each grain indicates the orientation of the c-axis, with red showing a vertical orientation.
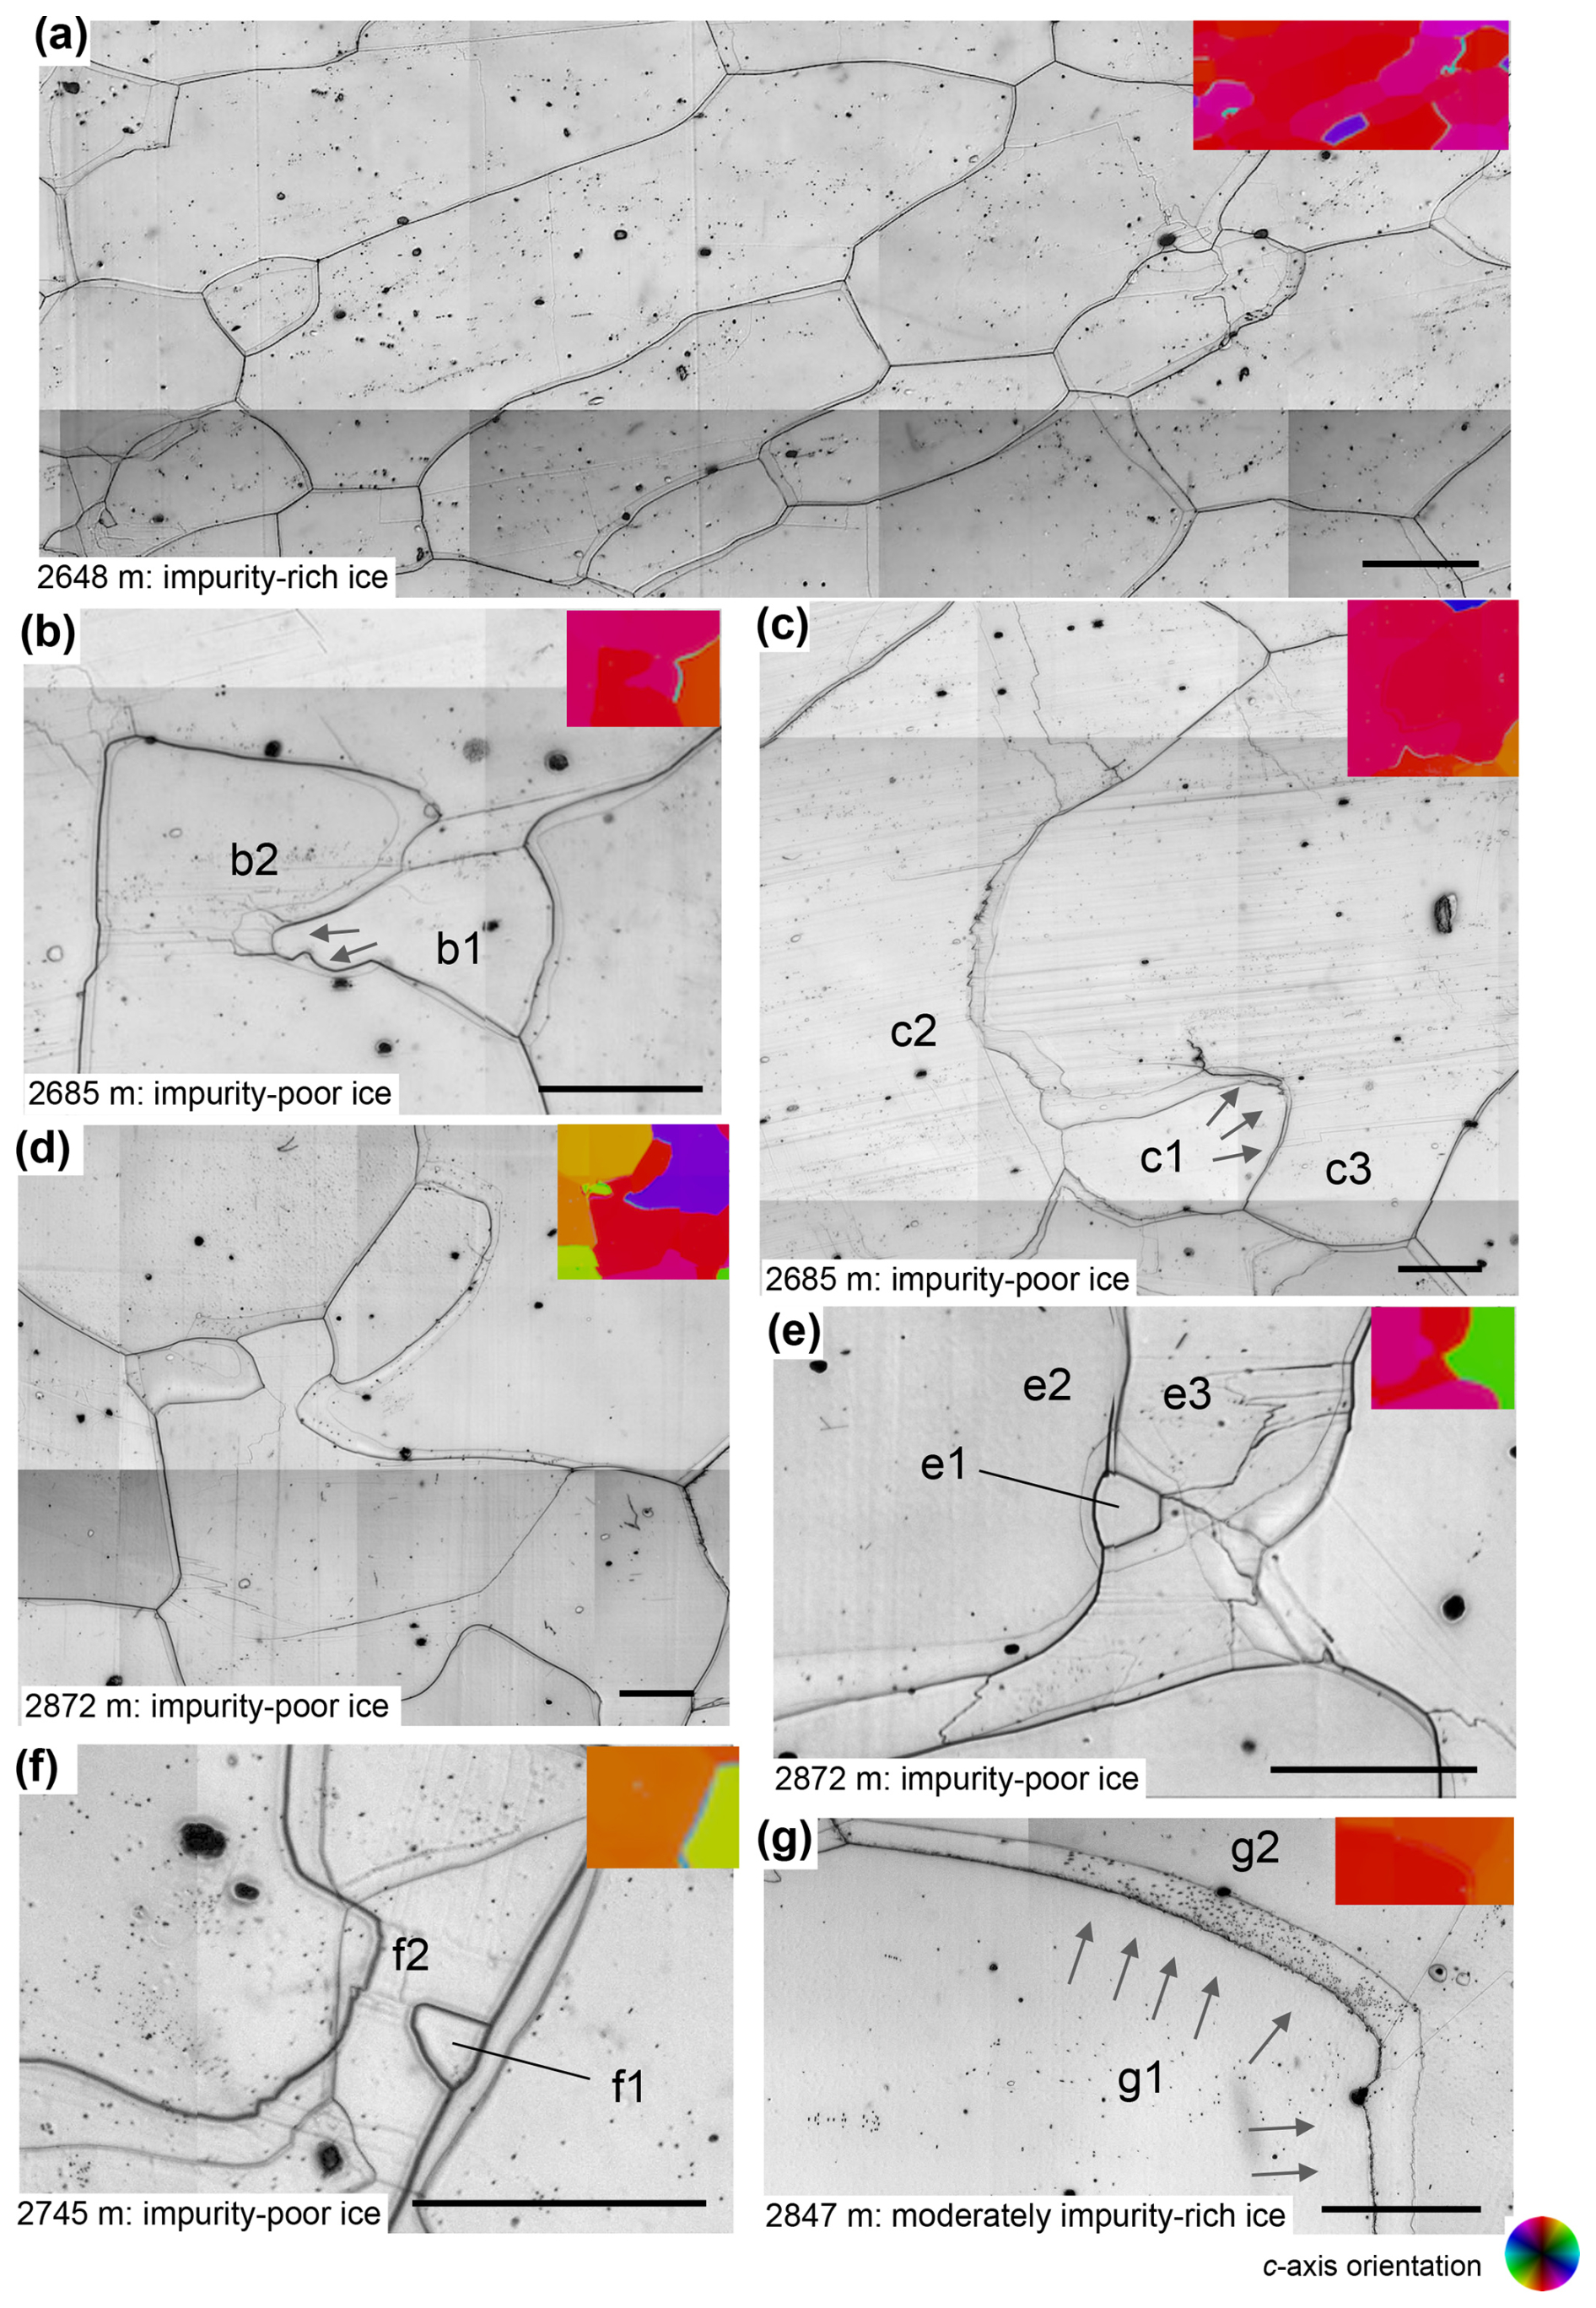
Figure A2Images of microstructures in specimens from five depths showing grain elongation and migration recrystallization. The depths are indicated in each panel and also summarized at the top of Fig. 5. All images were acquired from vertical thin sections. The solid black lines indicate grain boundaries, while grain boundaries on the reverse side of each section are visible as thin lines. The arrows indicate convex grain boundaries. Colour coding of the c-axis fabric image in each panel indicates the c-axis orientation of each grain, and the accompanying legend is displayed in the bottom-right corner. Grains shown in red and green/blue have the c axis oriented vertically and horizontally, respectively. (a) Flattened (or elongated in two dimensions) and slanting grains observed in the impurity-rich layer. (b, c) Typical results from a depth of 2685 m. (b) The small grain (b1) with bulging (cuspidate) grain boundaries. (c) The lower grain (c1) with bulging (cuspidate) grain boundaries. (d) An example of interlocking grains in a sample from a depth of 2872 m. Grains with various c-axis orientations are intricately interwoven. (e, f) Possible examples of grain nucleation in samples from depths of 2872 and 2745 m. The small grains (e1 and f1) exhibit a lack of internal structures, such as slip bands and sub-grain boundaries, while the adjacent grains display many slip bands and sub-grain boundaries. (g) The segregation of dust particles along the front of a grain boundary in a sample from a depth of 2847 m. Scale bars represent 2 mm.
The Δε values were affected by the volume fraction of grains with a c-axis orientation that was significantly offset from the surrounding grains. In this regard, the coarser grains also had a greater effect compared with the more sparsely distributed smaller grains. Because the Δε values represented volume-weighted averages within the microwave beam, these values were decreased to a greater extent in the case that more and/or larger grains with c-axis orientations distinctly offset from the surrounding grains were present.
A2 Microstructures in the impurity-rich layer: grain elongation
Remarkably, the crystal grains in the impurity-rich layers were often flattened, and the major axes of these grains were inclined away from the horizontal. These features were not identified in the surrounding impurity-poor (interglacial) layers. An example of the slanting and flattened grains is shown in Fig. A2a. To better assess this grain flattening, the aspect ratios based on the long and short axes of a two-dimensional fitted ellipse were analysed using the ImageJ software package. These aspect ratios were found to differ significantly between the impurity-rich and impurity-poor layers, with values in the ranges of 1.9–2.0 and 1.5–1.7, respectively. More detailed data are provided in Table S4 in Sect. S1.5 in the Supplement.
A similar two-dimensional feature, known as the “brick-wall pattern”, has been reported to occur in layers with high concentrations of impurities from the Antarctic EDML ice core (Faria et al., 2009), but this phenomenon has not yet been observed in the Antarctic EDC ice core. Kuiper et al. (2020) found fine-grained bands with flattened (or elongated in two dimensions) grains having an aspect ratio of 2 in the Greenland NEEM ice core. This aspect ratio was as large as the maximum value observed in the DF core specimens. Weikusat et al. (2017) suggested that shear deformation was responsible for the flattened or elongated grains identified in the EDML core, while Faria et al. (2009) proposed that deformation due to microscopic grain boundary sliding via microshear generated the brick-wall pattern. According to these prior studies, grain boundary sliding is likely promoted by a combination of smaller grain sizes, the presence of moderate stress and higher temperatures. Smaller grain sizes often occur in the presence of high concentrations of impurities, and these conditions are typically found in impurity-rich layers in the deeper sections of ice sheets (Faria et al., 2009). Grain elongation becomes less pronounced in deeper sections, as shown in Fig. A1e, which provides data for a sample from a depth of 2907.5 m. The authors suggest that the flattened features were maintained but were reduced by recovery and recrystallization processes occurring at high temperatures close to the melting point of ice. The extent of flattening could be determined by the temperature of the ice (and thus the depth) and by the impurity concentration.
A3 Migration recrystallization and grain nucleation
In dynamic recrystallization processes, rotation recrystallization has a minimal effect on the c-axis fabric but reduces both the grain size and aspect ratio. In contrast, migration recrystallization can significantly modify the c-axis fabric (e.g. De La Chapelle et al., 1998; Cuffey and Paterson, 2010). In the case that several neighbouring grains contain different amounts of stored strain energy, the grain boundary will migrate towards the higher-energy grain (e.g. Faria et al., 2014b). During this strain-induced migration recrystallization, grain boundaries sometimes become irregular and form interlocking patterns (Duval and Castelnau, 1995; Faria et al., 2014b). Figure A2b and c show a specimen from a depth of 2685 m with features presumably resulting from strain-induced migration recrystallization. In panel (b), the large grain in the upper-left corner (b1) exhibits a convex grain boundary with the adjacent grain (b2), whereas the lower grain (c1) in panel (c) has a convex grain boundary with the adjacent grain (c3). The presence of numerous sub-grain boundaries implies a region of high strain that is heterogeneously dispersed (Faria et al., 2014b; Stoll et al., 2021a). Interlocking grains are evident in Fig. A2d, which presents images for a sample from a depth of 2872 m. Here, grains with various c-axis orientations are intricately interwoven (see the c-axis fabric image). It should also be noted that these features were found in impurity-poor layers.
Grain nucleation in ice is thought to occur at triple junctions and at grain boundaries or similar regions characterized by a high concentration of dislocation walls and sub-grain boundaries (Faria et al., 2014b). The authors note that it is very challenging to identify a grain immediately following nucleation, as this requires a series of observations over time. The grain may grow immediately after nucleation in natural ice samples and so observation can be difficult. Although there have been several studies investigating grain nucleation in artificially deformed ice (e.g. Montagnat et al., 2015; Chauve et al., 2017), there have been few reports of this process in natural ice samples. Faria et al. (2014b) suggested that a nucleated grain will not exhibit internal structures but will bulge toward a region rich in dislocation walls and sub-grain boundaries. Examples of grains with such features are shown in Fig. A2e and f. Here, small grains with no internal structures (e1 and f1) can be seen to be situated at grain boundaries. These grains have c-axis orientations close to those of the adjacent grains (e2 and f2) (see the c-axis fabric images in panels e and f). Considering the morphological features of the small grains, these grains may have been nucleated at some point during the deformational history of the ice within the sheet.
Dust particle segregation was found to be associated with grain boundary migration (Fig. A2g). Note that, in this figure, the thin lines adjacent to the grain boundary represent the reverse side of the grain boundary and indicate that dust particles were segregated along the planes of the crystal grains. Grain boundary migration in the deeper parts of the ice core likely promoted the redistribution of soluble impurities and dust particles.
Physical and layered property data are available from the NIPR ADS data repository (https://doi.org/10.17592/001.2025040101, Saruya et al., 2025).
The supplement related to this article is available online at https://doi.org/10.5194/tc-19-2365-2025-supplement.
Author contributions are listed herein using the CrediT system (Ghan et al., 2016) to provide greater clarity concerning these contributions. TS: conceptualization, methodology, validation, formal analysis, investigation, data curation, visualization and writing – original draft. AM: conceptualization, methodology, validation, formal analysis, investigation, data curation, visualization, and writing – review and editing. SF: conceptualization, methodology, validation, formal analysis, investigation, supervision, project administration, funding acquisition and writing – original draft. TK: investigation and writing – review and editing. MI: investigation. KGA, MH, AH, YI, HO, WS and ST: writing – review and editing.
The contact author has declared that none of the authors has any competing interests.
Publisher's note: Copernicus Publications remains neutral with regard to jurisdictional claims made in the text, published maps, institutional affiliations, or any other geographical representation in this paper. While Copernicus Publications makes every effort to include appropriate place names, the final responsibility lies with the authors.
This article is part of the special issue “Ice core science at the three poles (CP/TC inter-journal SI)”. It is not associated with a conference.
The authors thank the handling editor, Mathieu Casado; the handling co-editor-in-chief, Nanna Bjørnholt Karlsson; and Maurine Montagnat, David Prior and two anonymous reviewers for helpful comments and suggestions. The authors are grateful to all of the Dome Fuji Deep Ice Core Project members, who contributed to obtaining the ice core samples, either through logistics, drilling or core processing. Primary logistics support was provided by the Japanese Antarctic Research Expedition (JARE), managed by the Ministry of Education, Culture, Sports, Science and Technology (MEXT). This work was supported by the JSPS KAKENHI programme (grant nos. 18H05294 and 24H00760).
This research has been supported by the Japan Society for the Promotion of Science (grant nos. 18H05294 and 24H00760).
This paper was edited by Mathieu Casado and reviewed by Maurine Montagnat, David Prior, and two anonymous referees.
Alley, R. B.: Flow law hypotheses for ice sheet modelling, J. Glaciol., 38, 245–256, https://doi.org/10.3189/S0022143000003658, 1992.
Alley, R. B. and Woods, G. A.: Impurity influence on normal grain growth in the GISP2 ice core, Greenland, J. Glaciol., 42, 255–260, https://doi.org/10.3189/S0022143000004111, 1996.
Azuma, N., Wang, Y., Mori, K., Narita, H., Hondoh, T., Shoji, H., and Watanabe, O.: Textures and fabrics in the Dome F (Antarctica) ice core, Ann. Glaciol., 29, 163–168, https://doi.org/10.3189/172756499781821148, 1999.
Azuma, N., Wang, Y., Yoshida, Y., Narita, H., Hondoh, T., Shoji, H., and Watanabe, O.: Crystallographic analysis of the Dome Fuji ice core, in: Physics of Ice Core Records, edited by: Hondoh, T., Hokkaido University Press, Sapporo, 45–61, ISBN 978-4-8329-0282-4, 2000.
Bamber, J. L., Gomez-Dans, J. L., and Griggs, J. A.: Antarctic 1 km Digital Elevation Model (DEM) from combined ERS-1 radar and ICESat Laser satellite altimetry, in: National Snow and Ice Data Center, Digital media, Boulder, Colorado, USA, https://doi.org/10.5067/H0FQ1KL9NEKM, 2009.
Bazin, L., Landais, A., Lemieux-Dudon, B., Toyé Mahamadou Kele, H., Veres, D., Parrenin, F., Martinerie, P., Ritz, C., Capron, E., Lipenkov, V., Loutre, M.-F., Raynaud, D., Vinther, B., Svensson, A., Rasmussen, S. O., Severi, M., Blunier, T., Leuenberger, M., Fischer, H., Masson-Delmotte, V., Chappellaz, J., and Wolff, E.: An optimized multi-proxy, multi-site Antarctic ice and gas orbital chronology (AICC2012): 120–800 ka, Clim. Past, 9, 1715–1731, https://doi.org/10.5194/cp-9-1715-2013, 2013.
Chauve, T., Montagnat, M., Barou, F., Hidas, K., Tommasi, A., and Mainprice, D.: Investigation of nucleation processes during dynamic recrystallization of ice using cryo-EBSD, Philos. T. Roy. Soc. A, 375, 20150345, https://doi.org/10.1098/rsta.2015.0345, 2017.
Cuffey, K. M. and Paterson, W. S. B.: The Physics of Glaciers, 4th edn., Elsevier, Amsterdam, ISBN 9780123694614, 2010.
Cullen, A. L.: Infrared and Millimeter Waves, in Millimeter-Wave Open-Resonator Techniques, edited by: Button, K. J., Academic Press, New York, 233–280, ISBN 9780124312982, 1983.
De La Chapelle, S., Castelnau, O., Lipenkov, V., and Duval, P.: Dynamic recrystallization and texture development ice as revealed by the study of deep ice cores Antarctica and Greenland, J. Geophys. Res., 103, 5091–5105, https://doi.org/10.1029/97JB02621, 1998.
Dome Fuji Ice Core Project Members: State dependence of climatic instability over the past 720 000 years from Antarctic ice cores and climate modeling, Sci. Adv., 3, e1600446, https://doi.org/10.1126/sciadv.1600446, 2017.
Durand, G., Weiss, J., Lipenkov, V., Barnola, J., Krinner, G., Parrenin, F., Delmonte, B., Ritz, C., Duval, P., and Röthlisberger, R.: Effect of impurities on grain growth in cold ice sheets, J. Geophys. Res., 111, F01015, https://doi.org/10.1029/2005JF000320, 2006.
Durand, G., Gillet-Chaulet, F., Svensson, A., Gagliardini, O., Kipfstuhl, S., Meyssonnier, J., Parrenin, F., Duval, P., and Dahl-Jensen, D.: Change in ice rheology during climate variations – implications for ice flow modelling and dating of the EPICA Dome C core, Clim. Past, 3, 155–167, https://doi.org/10.5194/cp-3-155-2007, 2007.
Durand, G., Svensson, A., Persson, A., Gagliardini, O., Gillet-Chaulet, F., Sjolte, J., Montagnat, M., and Dahl-Jensen, D.: Evolution of the texture along the EPICA Dome C ice core, in: Physics of Ice Core Records II, edited by: Hondoh, T., Hokkaido University Press, Sapporo, 91–105, http://hdl.handle.net/2115/45436 (last access: 26 June 2025), 2009.
Duval, P. and Castelnau, O.: Dynamic recrystallization of ice in polar ice sheets, J. Phys. III, 5, 197–205, https://doi.org/10.1051/jp4:1995317, 1995.
Duval, P., Ashby, M. F., and Anderman, I.: Rate-controlling pro- cesses in the creep of polycrystalline ice, J. Phys. Chem., 87, 4066–4074, https://doi.org/10.1021/j100244a014, 1983.
Eichler, J., Kleitz, I., Bayer-Giraldi, M., Jansen, D., Kipfstuhl, S., Shigeyama, W., Weikusat, C., and Weikusat, I.: Location and distribution of micro-inclusions in the EDML and NEEM ice cores using optical microscopy and in situ Raman spectroscopy, The Cryosphere, 11, 1075–1090, https://doi.org/10.5194/tc-11-1075-2017, 2017.
Eisen, O., Steinhage, D., Karlsson, N. B., Binder, T., and Helm, V.: Ice thickness of Dome Fuji region, Antarctica, recorded with the AWI airborne radar system: line 20172048, PANGAEA, https://doi.org/10.1594/PANGAEA.920649, 2020.
EPICA Community Members: Eight glacial cycles from an Antarctic ice core, Nature, 429, 623–628, https://doi.org/10.1038/nature02599, 2004.
Faria, S. H., Kipfstuhl, S., Azuma, N., Freitag, J., Weikusat, I., Murshed, M. M., and Kuhs, W. F.: The Multiscale Structure of Antarctica Part I: Inland Ice, in: Physics of Ice Core Records II, edited by: Hondoh, T., Hokkaido University Press, Sapporo, 39–59, https://eprints.lib.hokudai.ac.jp/dspace/handle/2115/45430 (last access: 26 June 2025), 2009.
Faria, S. H., Weikusat, I., and Azuma, N.: The microstructure of polar ice. Part I: Highlights from ice core research, J. Struct. Geol., 61, 2–20, https://doi.org/10.1016/j.jsg.2013.09.010, 2014a.
Faria, S. H., Weikusat, I., and Azuma, N.: The microstructure of polar ice. Part II: State of the art, J. Struct. Geol., 61, 21–49, https://doi.org/10.1016/j.jsg.2013.11.003, 2014b.
Fujita, S., Maeno, H., and Matsuoka, K.: Radio-wave depolarization and scattering within ice sheets: a matrix-based model to link radar and ice-core measurements and its application, J. Glaciol., 52, 407–424, https://doi.org/10.3189/172756506781828548, 2006.
Fujita, S., Okuyama, J., Hori, A., and Hondoh, T.: Metamorphism of stratified firn at Dome Fuji, Antarctica: A mechanism for local insolation modulation of gas transport conditions during bubble close off, J. Geophys. Res., 114, F03023, https://doi.org/10.1029/2008JF001143, 2009.
Fujita, S., Holmlund, P., Andersson, I., Brown, I., Enomoto, H., Fujii, Y., Fujita, K., Fukui, K., Furukawa, T., Hansson, M., Hara, K., Hoshina, Y., Igarashi, M., Iizuka, Y., Imura, S., Ingvander, S., Karlin, T., Motoyama, H., Nakazawa, F., Oerter, H., Sjöberg, L. E., Sugiyama, S., Surdyk, S., Ström, J., Uemura, R., and Wilhelms, F.: Spatial and temporal variability of snow accumulation rate on the East Antarctic ice divide between Dome Fuji and EPICA DML, The Cryosphere, 5, 1057–1081, https://doi.org/10.5194/tc-5-1057-2011, 2011.
Fujita, S., Holmlund, P., Matsuoka, K., Enomoto, H., Fukui, K., Nakazawa, F., Sugiyama, S., and Surdyk, S.: Radar diagnosis of the subglacial conditions in Dronning Maud Land, East Antarctica, The Cryosphere, 6, 1203–1219, https://doi.org/10.5194/tc-6-1203-2012, 2012.
Fujita, S., Hirabayashi, M., Goto-Azuma, K., Dallmayr, R., Satow, K., Zheng, J., and Dahl-Jensen, D.: Densification of layered firn of the ice sheet at NEEM, Greenland, J. Glaciol., 60, 905–921, https://doi.org/10.3189/2014JoG14J006, 2014.
Fujita, S., Goto-Azuma, K., Hirabayashi, M., Hori, A., Iizuka, Y., Motizuki, Y., Motoyama H., and Takahashi, K.: Densification of layered firn in the ice sheet at Dome Fuji, Antarctica, J. Glaciol., 62, 103–123, https://doi.org/10.1017/jog.2016.16, 2016.
Ghan, S., Crawford, J., Langematz, U., Leung, R., Li, Z., Russell, L., Steiner, A., and Zhang, C.: Author contributions can be clarified, J. Geophys. Res., 121, 8155–8155, https://doi.org/10.1002/2016JD025417, 2016.
Hargreaves, N. D.: The radio-frequency birefringence of polar ice, J. Glaciol., 21, 301–313, https://doi.org/10.3189/S0022143000033499, 1978.
Humphreys, F. and Hatherly, M.: Recrystallization and Related Annealing Phenomena, 2nd edn., Elsevier, https://doi.org/10.1016/B978-0-08-044164-1.X5000-2, 2004.
Inoue, R., Fujita, S., Kawamura, K., Oyabu, I., Nakazawa, F., Motoyama, H., and Aoki, T.: Spatial distribution of vertical density and microstructure profiles in near-surface firn around Dome Fuji, Antarctica, The Cryosphere, 18, 425–449, https://doi.org/10.5194/tc-18-425-2024, 2024.
Jacka, T. and Li, J.: The steady-state crystal size of deforming ice, Ann. Glaciol., 20, 13–18, https://doi.org/10.3189/1994AoG20-1-13-18, 1994.
Jones, R. G.: Precise dielectric measurements at 35 GHz using an open microwave resonator, P. IEEE, 123, 285–290, https://doi.org/10.1049/piee.1976.0067, 1976a.
Jones, R. G.: The measurement of dielectric anisotropy using a microwave open resonator, J. Phys. D Appl. Phys., 9, 819–827, https://doi.org/10.1088/0022-3727/9/5/015, 1976b.
Kipfstuhl, S., Faria, S. H., Azuma, N., Freitag, J., Hamann, I., Kaufmann, P., Miller, H., Weiler, K., and Wilhelms, F.: Evidence of dynamic recrystallization in polar firn, J. Geophys. Res., 114, B05204, https://doi.org/10.1029/2008JB005583, 2009.
Komiyama, B., Kiyokawa, M., and Matsui, T.: Open resonator for precision dielectric measurements in the 100 GHz band, IEEE T. Microw. Theory, 30, 1792–1796, https://doi.org/10.1109/22.88556, 1991.
Kuiper, E.-J. N., Weikusat, I., de Bresser, J. H. P., Jansen, D., Pennock, G. M., and Drury, M. R.: Using a composite flow law to model deformation in the NEEM deep ice core, Greenland – Part 1: The role of grain size and grain size distribution on deformation of the upper 2207 m, The Cryosphere, 14, 2429–2448, https://doi.org/10.5194/tc-14-2429-2020, 2020.
Langway Jr., C. C.: Ice fabrics and the universal stage (SIPRE Technical Report 62), Snow, Ice and Permafrost Research Establishment, U.S. Army Corps of Engineers, 1958.
Matsuoka, T., Mae, S., Fukazawa, H., Fujita, S., and Watanabe, O.: Microwave dielectric properties of the ice core from Dome Fuji, Antarctica, Geophys. Res. Lett., 25, 1573–1576, https://doi.org/10.1029/98GL01225, 1998.
Miyamoto, A., Weikusat, I., and Hondoh, T.: Complete determination of ice crystal orientation using Laue X-ray diffraction method, J. Glaciol., 57, 103–110, https://doi.org/10.3189/002214311795306754, 2011.
Montagnat, M., Durand, G., and Duval, P.: Recrystallization processes in granular ice, in: Physics of Ice Core Records II, edited by: Hondoh, T., Hokkaido University Press, Sapporo, 81–90, https://eprints.lib.hokudai.ac.jp/dspace/handle/2115/45435 (last access: 26 June 2025), 2009.
Montagnat, M., Buiron, D., Arnaud, L., Broquet, A., Schlitz, P., Jacob, R., and Kipfstuhl, S.: Measurements and numerical simulation of fabric evolution along the Talos Dome ice core, Antarctica, Earth Planet. Sc. Lett., 357–358, 168–178, https://doi.org/10.1016/j.epsl.2012.09.025, 2012.
Montagnat, M., Azuma, N., Dahl-Jensen, D., Eichler, J., Fujita, S., Gillet-Chaulet, F., Kipfstuhl, S., Samyn, D., Svensson, A., and Weikusat, I.: Fabric along the NEEM ice core, Greenland, and its comparison with GRIP and NGRIP ice cores, The Cryosphere, 8, 1129–1138, https://doi.org/10.5194/tc-8-1129-2014, 2014.
Montagnat, M., Chauve, T., Barou, F., Tommasi, A., Beausir, B., and Fressengeas, C.: Analysis of Dynamic Recrystallization of Ice from EBSD Orientation Mapping, Front. Earth Sci., 3, 81, https://doi.org/10.3389/feart.2015.00081, 2015.
Motoyama, H., Takahashi, A., Tanaka, Y., Shinbori, K., Miyahara, M., Yoshimoto, T., Fujii, Y., Furusaki, A., Azuma, N., and Ozawa, Y.: Deep ice core drilling to a depth of 3035.22 m at Dome Fuji, Antarctica in 2001–07, Ann. Glaciol., 62, 212–222, https://doi.org/10.1017/aog.2020.84, 2020.
Ohno, H., Iizuka, Y., Hori, A., Miyamoto, A., Hirabayashi, M., Miyake, T., Kuramoto, T., Fujita, S., Segawa, T., Uemura, R., Sakurai, T., Suzuki, T., and Motoyama, H.: Physicochemical properties of bottom ice from Dome Fuji, inland East Antarctica, J. Geophys. Res., 121, 1230–1250, https://doi.org/10.1002/2015JF003777, 2016.
Oyabu, I., Kawamura, K., Fujita, S., Inoue, R., Motoyama, H., Fukui, K., Hirabayashi, M., Hoshina, Y., Kurita, N., Nakazawa, F., Ohno, H., Sugiura, K., Suzuki, T., Tsutaki, S., Abe-Ouchi, A., Niwano, M., Parrenin, F., Saito, F., and Yoshimori, M.: Temporal variations of surface mass balance over the last 5000 years around Dome Fuji, Dronning Maud Land, East Antarctica, Clim. Past, 19, 293–321, https://doi.org/10.5194/cp-19-293-2023, 2023.
Parrenin, F., Fujita, S., Abe-Ouchi, A., Kawamura, K., Masson-Delmotte, V., Motoyama, H., Saito, F., Severi, M., Stenni, B., Uemura, R., and Wolff, E. W.: Climate dependent contrast in surface mass balance in East Antarctica over the past 216 ka, J. Glaciol., 236, 1037–1048, https://doi.org/10.1017/jog.2016.85, 2016, 2016.
Pattyn, F.: Antarctic subglacial conditions inferred from a hybrid ice sheet/ice stream model, Earth Planet. Sc. Lett., 295, 451–461, https://doi.org/10.1016/j.epsl.2010.04.025, 2010.
Petrenko, V. F. and Whitworth, R. W.: Physics of Ice, Oxford University Press, Oxford, ISBN 9780198518952, 1999.
Poirier, J.-P.: Creep of Crystals. Cambridge Earth Science Series xiv. Cambridge University Press. ISBN 0 521 26177, Geol. Mag., 122, 579–580, https://doi.org/10.1017/S0016756800035664, 1985.
Saruya, T., Fujita, S., Iizuka, Y., Miyamoto, A., Ohno, H., Hori, A., Shigeyama, W., Hirabayashi, M., and Goto-Azuma, K.: Development of crystal orientation fabric in the Dome Fuji ice core in East Antarctica: implications for the deformation regime in ice sheets, The Cryosphere, 16, 2985–3003, https://doi.org/10.5194/tc-16-2985-2022, 2022a.
Saruya, T., Fujita, S., and Inoue, R.: Dielectric anisotropy as indicator of crystal orientation fabric in Dome Fuji ice core: method and initial results, J. Glaciol., 68, 65–76, https://doi.org/10.1017/jog.2021.73, 2022b.
Saruya, T., Miyamoto, A., and Fujita, S.: Physical and layered properties in the deep sections of the Dome Fuji ice core, 1.00, Arctic and Antarctic Data archive System (ADS) [data set], Japan, https://doi.org/10.17592/001.2025040101, 2025.
Steinbach, F., Kuiper, E.-J. N., Eichler, J., Bons, P. D., Drury, M. R., Griera, A., Pennock, G. M., and Weikusat, I.: The Relevance of Grain Dissection for Grain Size Reduction in Polar Ice: Insights from Numerical Models and Ice Core Microstructure Analysis, Front. Earth Sci., 5, https://doi.org/10.3389/feart.2017.00066, 2017.
Stoll, N., Eichler, J., Hörhold, M., Erhardt, T., Jensen, C., and Weikusat, I.: Microstructure, micro-inclusions, and mineralogy along the EGRIP ice core – Part 1: Localisation of inclusions and deformation patterns, The Cryosphere, 15, 5717–5737, https://doi.org/10.5194/tc-15-5717-2021, 2021a.
Stoll, N., Eichler, J., Hörhold, M., Shigeyama, W., and Weikusat, I.: A Review of the Microstructural Location of Impurities in Polar Ice and Their Impacts on Deformation, Front. Earth Sci., 8, 615613, https://doi.org/10.3389/feart.2020.615613, 2021b.
Thorsteinsson, T., Kipfstuhl, J., and Miller, H.: Textures and fabrics in the GRIP ice core, J. Geophys. Res., 102, 26583–26599, https://doi.org/10.1029/97JC00161, 1997.
Tsutaki, S., Fujita, S., Kawamura, K., Abe-Ouchi, A., Fukui, K., Motoyama, H., Hoshina, Y., Nakazawa, F., Obase, T., Ohno, H., Oyabu, I., Saito, F., Sugiura, K., and Suzuki, T.: High-resolution subglacial topography around Dome Fuji, Antarctica, based on ground-based radar surveys over 30 years, The Cryosphere, 16, 2967–2983, https://doi.org/10.5194/tc-16-2967-2022, 2022.
Weikusat, I., Kipfstuhl, S., Faria, S. H., Azuma, N., and Miyamoto, A.: Subgrain boundaries and related microstructural features in EDML (Antarctica) deep ice core, J. Glaciol., 55, 461–472, https://doi.org/10.3189/002214309788816614, 2009.
Weikusat, I., Jansen, D., Binder, T., Eichler, J., Faria, S. H., Wilhelms, F., Kipfstuhl, S., Sheldon, S., Miller, H., Dahl-Jensen, D., and Kleiner, T.: Physical analysis of an Antarctic ice core – towards an integration of micro- and macrodynamics of polar ice, Philos. T. Roy. Soc. A, 375, 20150347, https://doi.org/10.1098/rsta.2015.0347, 2017.
Yamanouchi, T., Hirasawa, N., Hayashi, M., Takahashi, S., and Kaneto, S.: Meteorological characteristics of Antarctic inland station, Dome Fuji, Mem. Natl. Inst. Polar Res., Spec. Issue, 57, 94–104, 2003.