the Creative Commons Attribution 4.0 License.
the Creative Commons Attribution 4.0 License.
 | 27 Jun 2025
Brief communication: Not as dirty as they look, flawed airborne and satellite snow spectra
Dar A. Roberts
David R. Thompson
Philip G. Brodrick
Brenton A. Wilder
Niklas Bohn
Christopher J. Crawford
Nimrod Carmon
Carrie M. Vuyovich
Jeff Dozier
Key to the success of spaceborne missions is understanding snowmelt in our warming climate, as this has implications for nearly 2 billion people. An obstacle is that surface reflectance products over snow show an erroneous hook with decreases in the visible wavelengths, causing per-band and broadband reflectance errors of up to 33 % and 11 %, respectively. This hook is sometimes mistaken for soot or dust but can result from three artifacts: (1) background reflectance that is too dark, (2) an assumption of level terrain, or (3) differences in optical constants of ice. Sensor calibration and directional effects may also contribute. Solutions are being implemented.
- Article
(950 KB) - Full-text XML
- BibTeX
- EndNote


Current and future hyperspectral missions, such as the Earth Surface Mineral Dust Source Investigation (EMIT), Precursore Iperspettrale della Missione Applicativa (PRISMA), or Surface Biology and Geology (SBG), offer improved spectral resolution and fidelity, yet surface reflectance products lag sensor advances. Of the terms in the energy balance, snowmelt is most sensitive to albedo. Because of snow's importance as a water resource, it is among the “most important” objectives for future NASA missions, requiring measurement and modeling accurately enough to close the surface radiation balance to within 10 % of the absorption (National Academies of Science, Engineering and Medicine, 2018). The prevalent erroneous hook, where (in the decreasing case) the surface reflectance sharply decreases with decreasing visible wavelength (e.g., brighter at 600 nm than at 400 nm), compromises this most important objective. The decreasing hook is easily mistaken for the presence of light-absorbing particles (LAPs) such as soot or dust. This paper shows examples of the hook, analyzes the causes, and offers solutions that are being implemented. The objective is to document the cause of these common hooking errors so that they can be prevented, thereby allowing scientific goals to be met for current and future missions.
Standard surface reflectance products are rife with hooking errors. Figure 1a shows modeled spectra for clean snow. Figure 1b shows modeled spectra for dirty snow, which include a legitimate hook in the visible wavelengths. Figure 1c shows the problematic hook, likely due to an atmospheric correction error (Sect. 3.1), in a surface reflectance retrieval from PRISMA compared to an in situ spectrometer measurement.
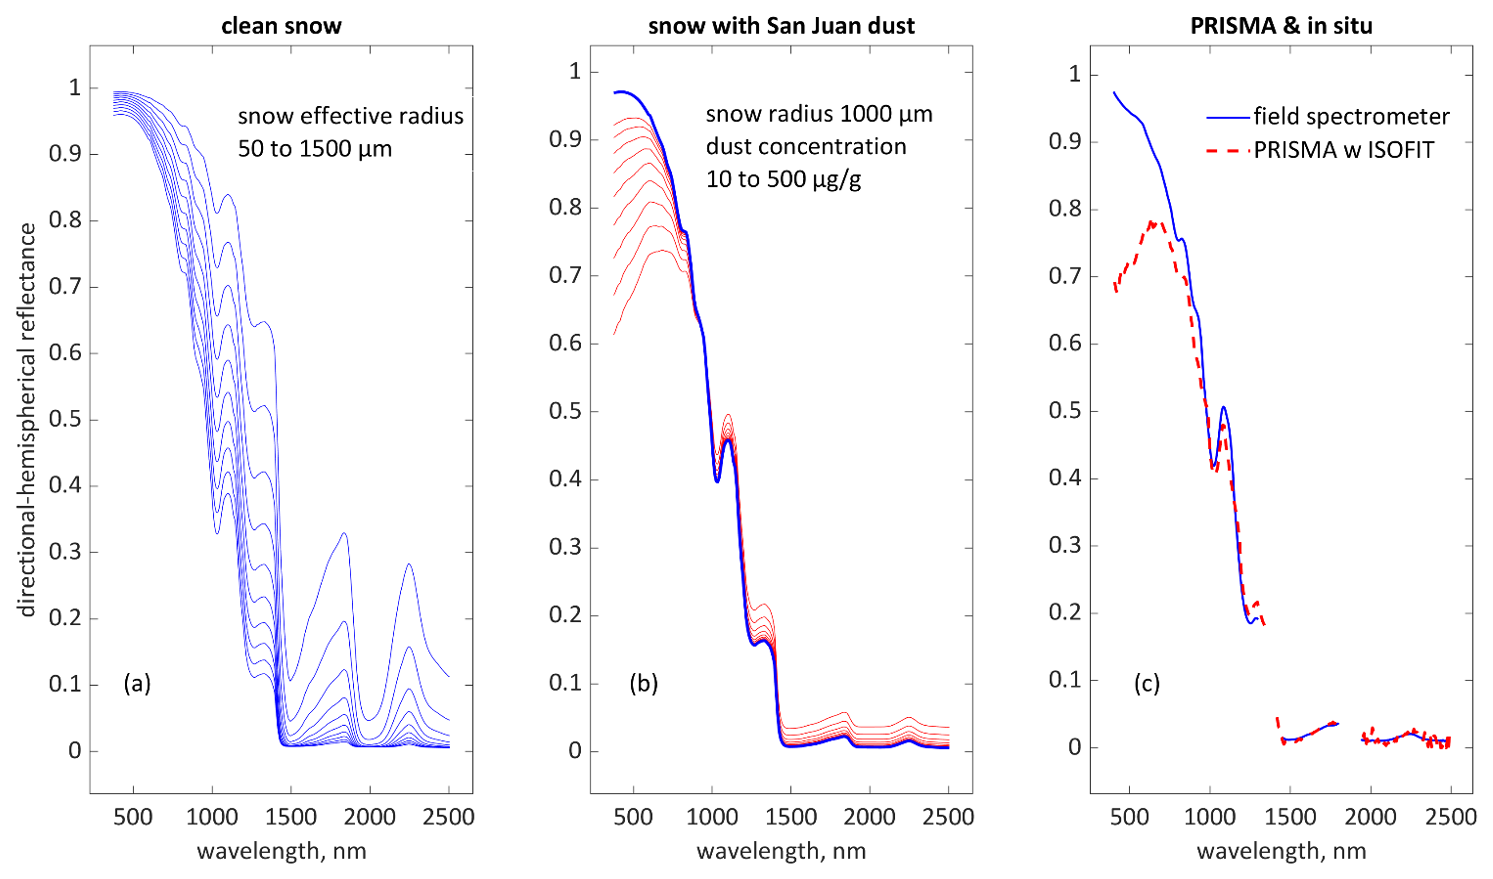
Figure 1(a) Spectra for clean snow modeled with SNICAR-ADv4 (Whicker et al., 2022); (b) modeled spectra for snow with San Juan dust (Skiles et al., 2017) of radii 1.25–2.5 µm; (c) field spectrometer measurements of snow compared to PRISMA surface reflectance (Townsend et al., 2023).
Surface reflectance products also show erroneous hooking in AVIRIS-NG (Green et al., 2023), EMIT (Green, 2022), and Landsat 8 (Crawford et al., 2023) (Fig. 2a–c). The measured and modeled spectra in Figs. 1a–c and 2a–c are from level and fully snow-covered areas, i.e., no vegetation within the pixel or in adjacent pixels and an optically thick snowpack. For the measured spectra (Figs. 1c and 2a–c), nearby snow observations or the field spectrometer measurements show no visible albedo degradation, indicative of clean snow, resulting in a 2 % (Fig. 2a), 8 % (Fig. 2b), and 11 % (Fig. 1c) broadband albedo error. Per-band errors are up to 33 % in the shortest wavelength, well in excess of the 10 % goal (National Academies of Science, Engineering and Medicine, 2018). The poor fits in Fig. 2a and b show that the hooking does not match any type of observed or modeled snow. Yet the hooking could easily be mistaken for impurities, e.g., in an approach where the LAP concentration is estimated from differences between modeled clean and observed snow spectra in the visible wavelengths.
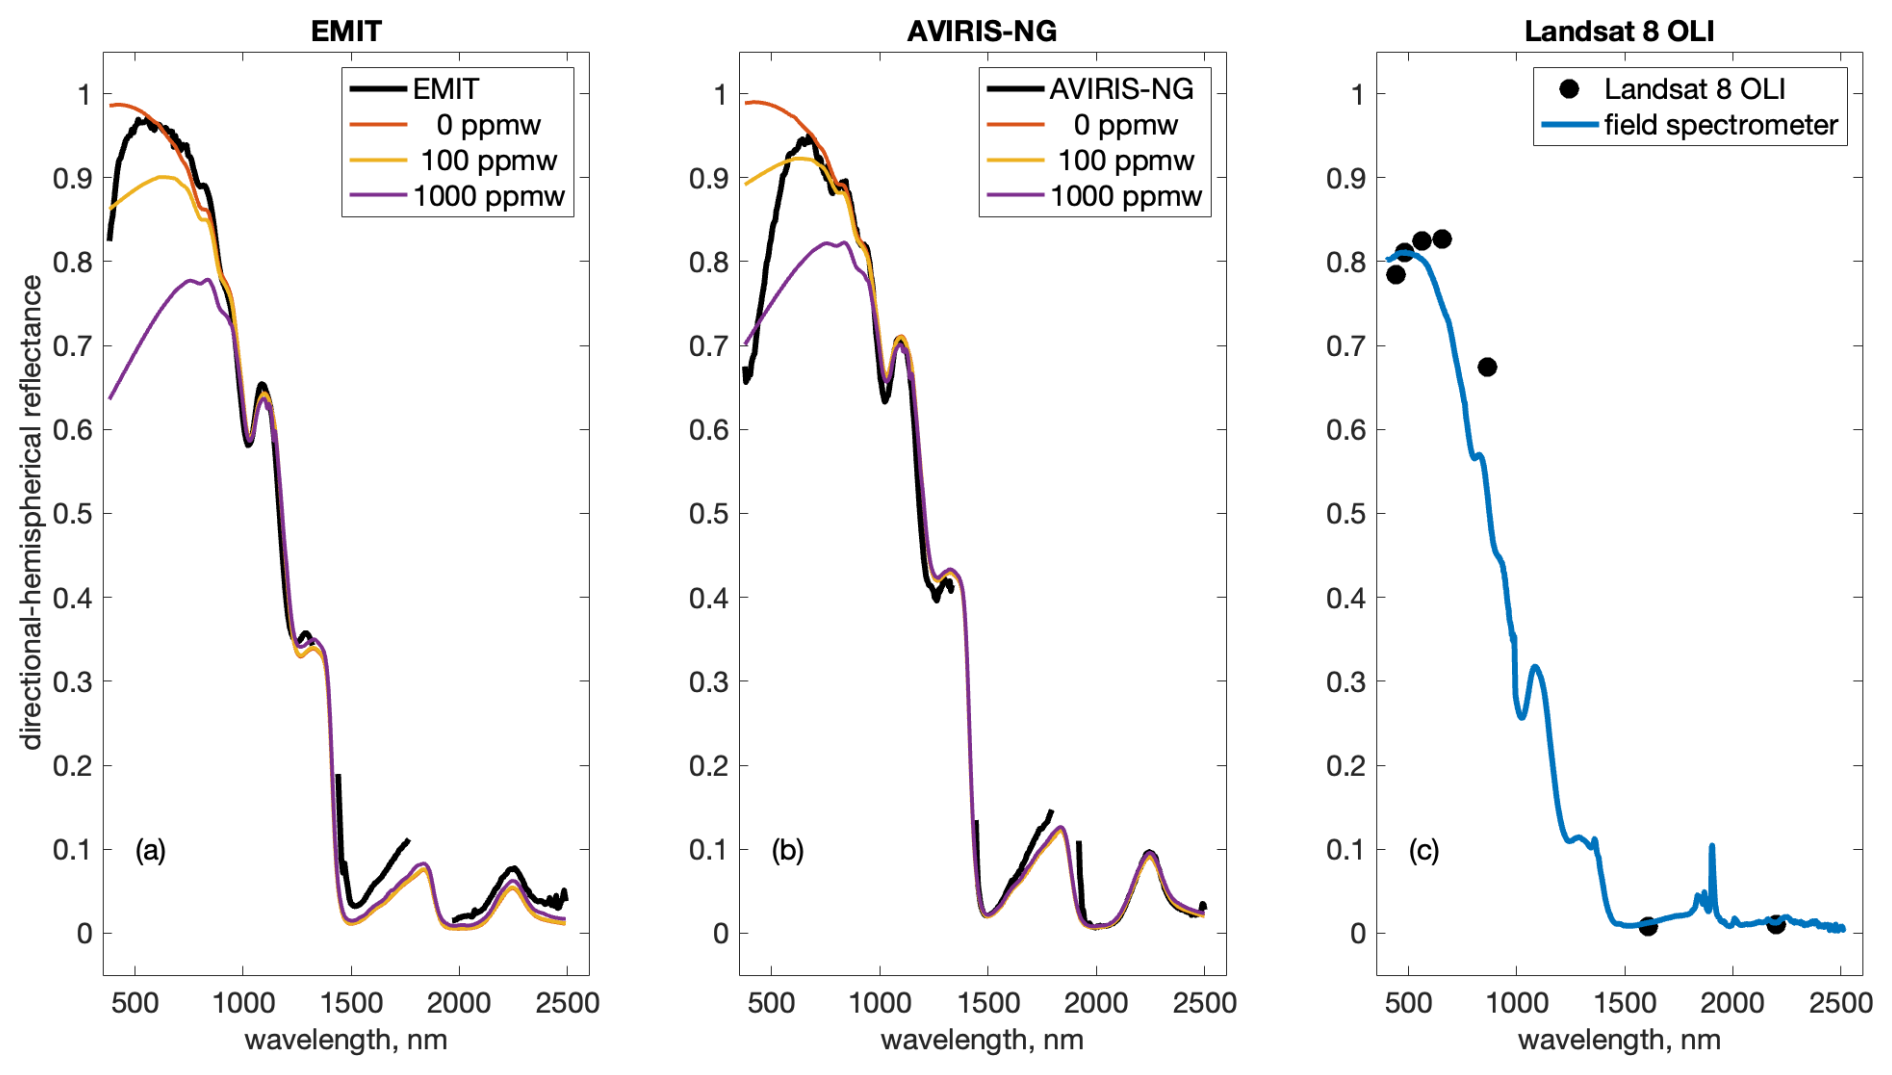
Figure 2Erroneous hooking spectra from flat, level, and fully snow-covered areas for EMIT (a), AVIRIS-NG (b), and Landsat 8 OLI (c). For EMIT and AVIRIS-NG, the colored lines show modeled snow fit to measured grain sizes, 245 µm (a) and 125 µm (b), with modeled San Juan dust from 0 to 1000 ppmw (parts per million by weight). For Landsat 8 OLI (c), the blue line shows measurements from a field spectrometer.
Often, the hook can be diagnosed visually, without modeling. For example, fine-grained but dirty snow is suspicious. This improbable, although commonly seen, combination in surface reflectance products shows as hooking in the visible spectrum combined with indicators of fine-grained snow at wavelengths beyond 1000 nm (Fig. 2a, b). Likewise, a peak close to 1.0 in any wavelength in the presence of dust or soot is unlikely.
The bihemispherical spectral reflectance of snow, commonly called spectral albedo, at a wavelength Rλ is expressed as follows:
where Dλ is the reflected radiation and Iλ is the combined direct and diffuse irradiance. Non-Lambertian behavior of snow has been known for over 70 years (Middleton and Mungall, 1952); however, bidirectional reflectance distribution models struggle over rough surfaces, such as ablation hollows, as the viewing geometry causes shadowing (Bair et al., 2022). Thus, because of the unknown lighting geometry over rough surfaces, albedo is used here to model the hooking. This albedo can be adjusted for atmospheric effects to estimate the reflectance at the Earth's surface, with the adjustment involving approximations for both the numerator and denominator in Eq. (1). Instead, a simpler approach is taken in which the denominator can be rewritten, omitting the λ for readability, as follows:
where μs is the cosine of the illumination angle on a slope, and Idirect and Idiffuse are the respective direct and diffuse irradiance that depend on atmospheric properties δ that include aerosol, water vapor concentration, optical thickness, target altitude, air temperature, terrain configuration, and many others. Additionally, Idiffuse depends on the spectral reflectance rb of the areas adjacent to the target, caused by atmospheric scattering of reflected radiation. The numerator in Eq. (1) contains all of the terms of the denominator; the terms for the target direct and diffuse reflectance, Rdirect and Rdiffuse; and snow properties γ (grain radius and LAP concentration):
3.1 Hook caused by atmospheric correction algorithm
Widely used atmospheric radiative transfer codes – e.g., MODTRAN, 6S, SMARTS, and libRadtran – allow for a variety of background reflectance rb options, from constant values to user-defined spectra to spectral libraries, or even spectral mixtures. Concentrating on the background reflectance, the spectral reflectance in a snow-covered region can be modeled as follows:
where the numerator is calculated with Eq. (3), the denominator is the sum of the direct and diffuse irradiances, and rb, snow is the spectral background reflectance in the area around the snow-covered pixel of interest. Parameterizations differ widely, but for operational products, instead of using the rb, snow spectra, which varies with wavelength (Fig. 1), a constant rb value similar to Earth's planetary albedo, 0.25–0.30, is typically used. The decreasing hook error can be simulated by recognizing that the background reflectance rb is too dark in snow-covered terrain. To model the decreasing hook with Eq. (4), an is used in the numerator, while rb, snow is used in the denominator, signifying that the downwelling radiation is correctly modeled, whereas the upwelling radiation is incorrectly modeled:
To simulate an increasing hook, the error is inverted, with the downwelling radiation incorrectly modeled but the upwelling radiation correctly modeled:
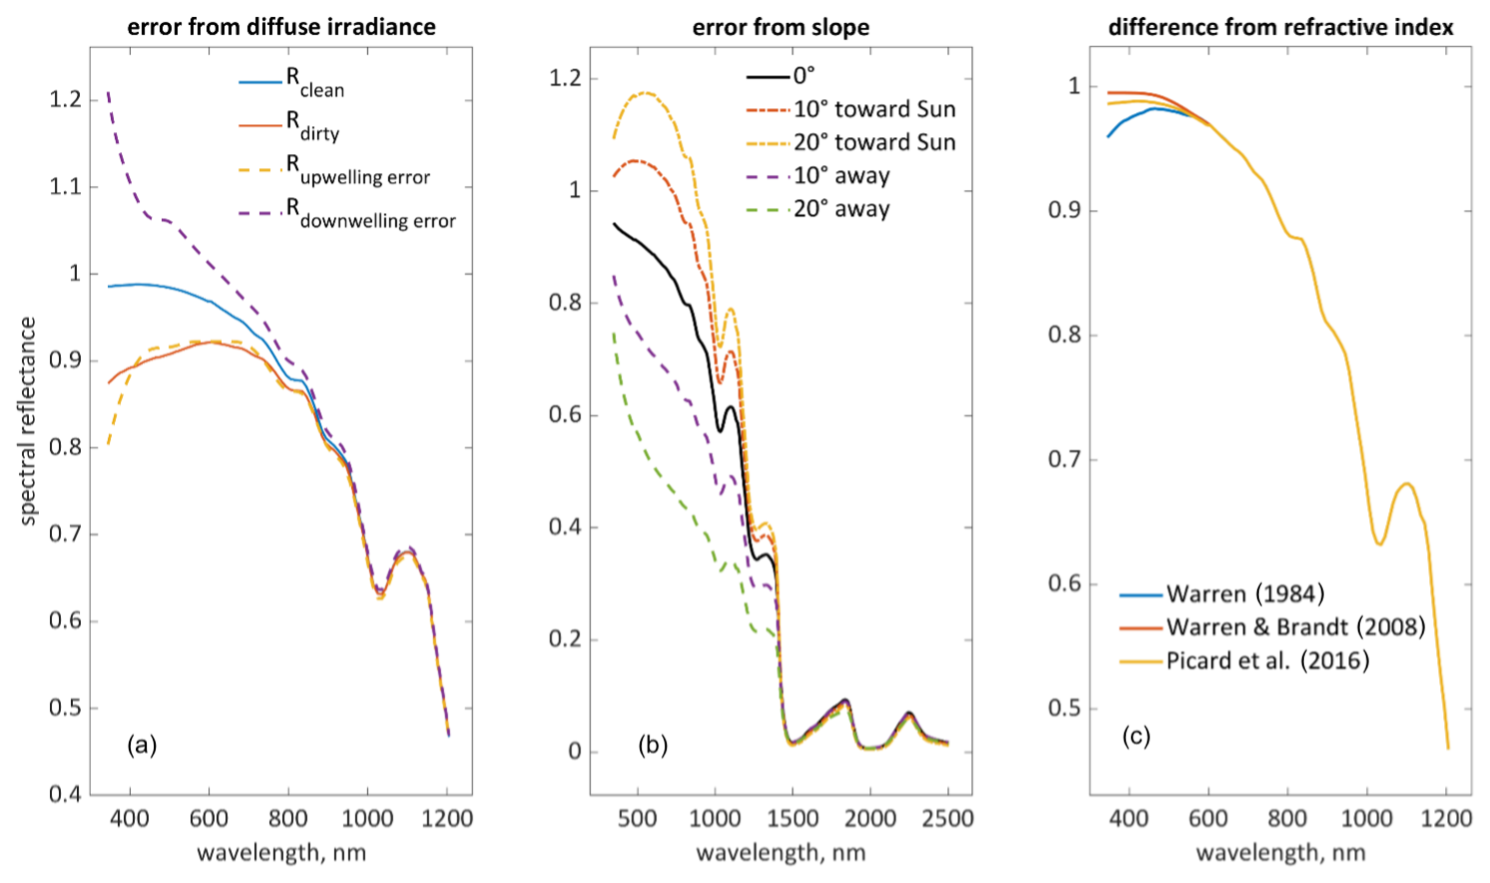
Figure 3Hooking in the modeled albedo of 200 µm snow, μ0=0.6. (a) Upwelling and downwelling atmospheric correction errors: upwelling and downwelling errors are for clean snow; dirty snow includes 100 ppmw of San Juan dust of radius 1.25–2.5 µm. (b) Spectral shape changes due to lack of terrain correction, with downwelling direct/diffuse radiation errors when not adjusted for slope angles 0 (no error) to 20°. (c) Differences due to optical properties of ice.
3.2 Hook caused by assuming flat topography
Likewise, because diffuse irradiance is weighted toward the blue end of the solar spectrum, errors in the modeled spectral shape will occur when topography is assumed to be flat. This type of error can be modeled assuming a slope that faces either toward or away from the Sun, where the numerator in Eq. (1) is modeled correctly as the slope angle changes, but the denominator uses direct irradiance for a level surface. With μ0, the illumination cosine on a level surface, the apparent terrain reflectance is as follows:
For modest slopes, less than about 30°, facing open terrain, the terrain view factor can be ignored (Dozier, 2022, Eq. 2).
3.3 Hook caused by the refractive index of ice at short wavelengths
A third (minor and unrelated to the first two) cause of the hooking depends on values of the imaginary part of the complex refractive index of ice, i.e., the absorption coefficient. Ice is exceptionally transparent in the wavelengths below the 500 nm range, and there is disagreement in the literature with respect to its optical properties in this range (Warren, 1984; Warren and Brandt, 2008; Picard et al., 2016). Specifically, In any case, the hooking effects due to variations in the absorption coefficient are small compared to the atmospheric and terrain correction errors.
Figure 3 summarizes hooking causes, which were modeled using SNICAR-ADv4, SMARTS version 2.9.9, and Eqs. (4)–(7). The same results come from Mie theory and two-stream radiative transfer (Bair et al., 2021) instead of SNICAR.
In summary, the hooking in clean and fully covered snow pixels is caused by (1) assumed background reflectance that is too dark, (2) lack of terrain correction, and (3) differences in optical constants. Picard et al. (2020) and Bohn et al. (2024) have previously documented the errors in measuring snow reflectance over sloping terrain, but the other two causes of hooking in the spectra have not previously been documented. We also suggest that this erroneous hooking could occur over brighter exposed glacier ice, e.g., clean névé. Two additional causes of hooking that are suspected (but have not been confirmed through modeling) are sensor calibration and directional effects. For sensor calibration, the blue wavelength range is often challenging to calibrate, because laboratory sources are much dimmer in those wavelengths relative to the solar profile (Helmlinger et al., 2016). Any out-of-band response will result in excessive blue signal during calibration, causing an inaccurate estimate of calibration coefficients and a resulting overestimate of instrument sensitivity. Snow, because of its brightness, often lies near the upper end of airborne and spaceborne spectrometers' dynamic range, making it susceptible to saturation and associated nonlinear effects. This error, which could cause increasing or decreasing hooking, is particularly difficult to model given often unpublished calibration data.
Directional effects for angular new snow may cause an increasing hook, seen in measured spectra (e.g., Painter and Dozier, 2004), especially in the forward direction (away from the Sun), towards the limb (high viewing zenith angle), and when the Sun is low in the sky (high solar zenith angle). However, in the region of optimal remote sensing, i.e., low solar zenith and viewing angles, hooking effects from anisotropic snow reflectance are minimal.
To address the three modeled causes, the following measures are recommended: (1) use an atmospheric correction with an appropriate background reflectance; (2) correct for terrain illumination angle, but be aware of error propagation in slope and aspect (Dozier et al., 2022); and (3) use updated optical constants for ice (Picard et al., 2016) when performing inversions to solve for snow-covered area, grain size, and the LAP concentration. For standard surface reflectance products, measures 1 and 2 need to be addressed in processing workflows or perhaps through on-demand products. For example, in the EMIT processing chain, appropriate background assumptions are used and terrain-corrected reflectances are now supported (Carmon et al., 2022).
All of the code used is available on GitHub: SPIReS is available at https://github.com/edwardbair/SPIRES/ (last access: 13 June 2025); SNICAR-ADv4 is available at https://github.com/chloewhicker/SNICAR-ADv4 (last access: 13 June 2025).
PRISMA data can be accessed from http://www.prisma-i.it/index.php/en/ (Agenzia Spaziale Italiana, 2023). EMIT data can be accessed from https://earth.jpl.nasa.gov/emit/data/data-portal (Green, 2022). AVIRIS-NG data can be accessed from https://avirisng.jpl.nasa.gov/dataportal/ (Green et al., 2023). Landsat 8 data can be accessed from https://earthexplorer.usgs.gov/ (EROS, 2020).
Author contributions are outlined according to CRediT. EHB performed all 14 contributor roles. JD contributed to writing (original draft – review and editing) and software (code for analyzing topography). DAR contributed to the investigation and methodology. DRT contributed to the investigation, methodology, and writing (original draft – review and editing). PGB contributed to the investigation and methodology. BAW contributed to the investigation (field measurements for Fig. 1) and methodology. NB contributed to the investigation and writing (original draft – review and editing). CJC contributed to conceptualization, methodology, and editing. NC contributed to the investigation and methodology. CMV contributed to writing (review and editing) and project administration.
At least one of the (co-)authors is a member of the editorial board of The Cryosphere. The peer-review process was guided by an independent editor, and the authors also have no other competing interests to declare.
Any use of trade, firm, or product names is for descriptive purposes only and does not imply endorsement by the US Government.
Publisher’s note: Copernicus Publications remains neutral with regard to jurisdictional claims made in the text, published maps, institutional affiliations, or any other geographical representation in this paper. While Copernicus Publications makes every effort to include appropriate place names, the final responsibility lies with the authors.
The authors thank Chris Derken for editing the manuscript and Chris Donahue and an anonymous referee for their reviews.
This research was supported by the Broad Agency Announcement program and the Cold Regions Research and Engineering Laboratory (ERDC-CRREL) under contract no. W913E523C0002 and by the National Aeronautics and Space Administration (grant nos. 80NSSC20K1722, 80NSSC20K1349, 80NSSC21K0620, and 80NSSC24K0824). The research was carried out at the Jet Propulsion Laboratory, California Institute of Technology, under a contract with the National Aeronautics and Space Administration (grant no. 80NM0018D0004). Brenton Wilder was supported by the NASA FINESST program (grant no. 21-EARTH21-0249). This research was also supported by the U.S. Geological Survey National Land Imaging Program's Sustainable Land Imaging Phase 2 imaging spectroscopy research and development project (USGS project no. GX22ED00TYG).
This paper was edited by Chris Derksen and reviewed by Christopher Donahue and one anonymous referee.
Agenzia Spaziale Italiana: PRISMA Level 1 Data [data set], https://prisma.asi.it (last access: September 2022), 2023.
Bair, E. H., Stillinger, T., and Dozier, J.: Snow Property Inversion from Remote Sensing (SPIReS): A generalized multispectral unmixing approach with examples from MODIS and Landsat 8 OLI, IEEE Trans. Geosci. Remote Sens., 59, 7270–7284, https://doi.org/10.1109/TGRS.2020.3040328, 2021.
Bair, E. H., Dozier, J., Stern, C., LeWinter, A., Rittger, K., Savagian, A., Stillinger, T., and Davis, R. E.: Divergence of apparent and intrinsic snow albedo over a season at a sub-alpine site with implications for remote sensing, The Cryosphere, 16, 1765–1778, https://doi.org/10.5194/tc-16-1765-2022, 2022.
Bohn, N., Bair, E. H., Brodrick, P. G., Carmon, N., Green, R. O., Painter, T. H., and Thompson, D. R.: The Pitfalls of Ignoring Topography in Snow Retrievals: A Case Study with EMIT, SSRN, https://doi.org/10.2139/ssrn.4671920, 2024.
Carmon, N., Berk, A., Bohn, N., Brodrick, P. G., Kalashnikova, O., Nguyen, H., Thompson, D. R., and Turmon, M.: Unified topographic and atmospheric correction for remote imaging spectroscopy, Front. Remote Sens., 3, 916155, https://doi.org/10.3389/frsen.2022.916155, 2022.
Crawford, C. J., Roy, D. P., Arab, S., Barnes, C., Vermote, E., Hulley, G., Gerace, A., Choate, M., Engebretson, C., Micijevic, E., Schmidt, G., Anderson, C., Anderson, M., Bouchard, M., Cook, B., Dittmeier, R., Howard, D., Jenkerson, C., Kim, M., Kleyians, T., Maiersperger, T., Mueller, C., Neigh, C., Owen, L., Page, B., Pahlevan, N., Rengarajan, R., Roger, J.-C., Sayler, K., Scaramuzza, P., Skakun, S., Yan, L., Zhang, H. K., Zhu, Z., and Zahn, S.: The 50-year Landsat collection 2 archive, Sci. Remote Sens., 8, 100103, https://doi.org/10.1016/j.srs.2023.100103, 2023.
Dozier, J.: Revisiting topographic horizons in the era of big data and parallel computing, IEEE Geosci. Remote Sens. Lett., 19, 8024605, https://doi.org/10.1109/LGRS.2021.3125278, 2022.
Dozier, J., Bair, E. H., Baskaran, L., Brodrick, P. G., Carmon, N., Kokaly, R. F., Miller, C. E., Miner, K. R., Painter, T. H., and Thompson, D. R.: Error and uncertainty degrade topographic corrections of remotely sensed data, J. Geophys. Res.-Biogeo., 127, e2022JG007147, https://doi.org/10.1029/2022JG007147, 2022.
EROS (Earth Resources Observation and Science Center): Landsat 8-9 Operational Land Imager/Thermal Infrared Sensor Level-2, Collection 2, U.S. Geological Survey [data set], https://doi.org/10.5066/P9OGBGM6, 2020.
Green, R. O.: EMIT L2A 60 m estimated surface reflectance and uncertainty and masks (V001), NASA EOSDIS Land Processes Distributed Active Archive Center [data set], https://doi.org/10.5067/EMIT/EMITL2ARFL.001, 2022.
Green, R.: EMIT L2A Estimated Surface Reflectance and Uncertainty and Masks 60 m V001, NASA Land Processes Distributed Active Archive Center [data set], https://doi.org/10.5067/EMIT/EMITL2ARFL.001, 2022.
Green, R. O., Brodrick, P. G., Chapman, J. W., Eastwood, M., Geier, S., Helmlinger, M., Lundeen, S. R., Olson-Duvall, W., Pavlick, R., Rios, L. M., Thompson, D. R., and Thorpe, A. K.: AVIRIS-NG L2 surface reflectance, facility instrument collection (V1), ORNL Distributed Active Archive Center [data set], https://doi.org/10.3334/ORNLDAAC/2110, 2023.
Helmlinger, M., Eastwood, M., Green, R., and Thompson, D. R.: Solar-similar near-infra-red suppressed “Blue” calibration source, 2016 IEEE Aerospace Conference, 5–12 March 2016, Big Sky, MT, USA, 1–11, https://doi.org/10.1109/AERO.2016.7500714, 2016.
Middleton, W. E. K. and Mungall, A. G.: The luminous directional reflectance of snow, J. Opt. Soc. Am., 42, 572–579, https://doi.org/10.1364/JOSA.42.000572, 1952.
National Academies of Sciences, Engineering, and Medicine: Thriving on Our Changing Planet: A Decadal Strategy for Earth Observation from Space, National Academies Press, Washington, DC, 716 pp., https://doi.org/10.17226/24938, 2018.
Painter, T. H. and Dozier, J.: Measurements of the hemispherical-directional reflectance of snow at fine spectral and angular resolution, J. Geophys. Res., 109, D18115, https://doi.org/10.1029/2003JD004458, 2004.
Picard, G., Libois, Q., and Arnaud, L.: Refinement of the ice absorption spectrum in the visible using radiance profile measurements in Antarctic snow, The Cryosphere, 10, 2655–2672, https://doi.org/10.5194/tc-10-2655-2016, 2016.
Picard, G., Dumont, M., Lamare, M., Tuzet, F., Larue, F., Pirazzini, R., and Arnaud, L.: Spectral albedo measurements over snow-covered slopes: theory and slope effect corrections, The Cryosphere, 14, 1497–1517, https://doi.org/10.5194/tc-14-1497-2020, 2020.
Skiles, S. M., Painter, T., and Okin, G. S.: A method to retrieve the spectral complex refractive index and single scattering optical properties of dust deposited in mountain snow, J. Glaciol., 63, 133–147, https://doi.org/10.1017/jog.2016.126, 2017.
Townsend, P., Gierach, M. M., Ade, C., Chlus, A. M., Hua, H., Kwoun, O., Lucas, M. J., Malarout, N., Moroni, D. F., Neely, S., Olson-Duvall, W., Pon, J. K., Shah, S., and Yu, D.: SISTER: PRISMA L2A corrected surface reflectance 30 m (V001), ORNL Distributed Active Archive Center [data set], https://doi.org/10.3334/ORNLDAAC/2164, 2023.
Warren, S. G.: Optical constants of ice from the ultraviolet to the microwave, Appl. Optics, 23, 1206–1225, https://doi.org/10.1364/AO.23.001206, 1984.
Warren, S. G. and Brandt, R. E.: Optical constants of ice from the ultraviolet to the microwave: A revised compilation, J. Geophys. Res.-Atmos., 113, D14220, https://doi.org/10.1029/2007JD009744, 2008.
Whicker, C. A., Flanner, M. G., Dang, C., Zender, C. S., Cook, J. M., and Gardner, A. S.: SNICAR-ADv4: a physically based radiative transfer model to represent the spectral albedo of glacier ice, The Cryosphere, 16, 1197–1220, https://doi.org/10.5194/tc-16-1197-2022, 2022.