the Creative Commons Attribution 4.0 License.
the Creative Commons Attribution 4.0 License.
 | 19 May 2025
How do extreme ENSO events affect Antarctic surface mass balance?
Jessica M. A. Macha
Andrew N. Mackintosh
Felicity S. McCormack
Benjamin J. Henley
Helen V. McGregor
Christiaan T. van Dalum
Ariaan Purich
Extreme El Niño–Southern Oscillation (ENSO) events have far-reaching impacts globally, yet their impacts on Antarctica are poorly understood. In particular, how extreme ENSO events influence Antarctica's mass balance remains uncertain, with few studies considering how extreme events could differ from moderate events. Here, we examine the impacts of past extreme El Niño and strong La Niña events over the period 1979–2018 on the surface mass balance (SMB) of Antarctica using a reanalysis-forced regional climate model. We find that Antarctic surface mass balance does not vary significantly during most of the simulated extreme events. Based on only three (five) events in the observational period, regional anomalies differ during the extreme El Niño (La Niña) events considered and cannot be generalised. Enderby Land is an exception: significant increases in surface mass balance – approximately 32 % of the regional annual average – occur during all extreme El Niño events considered. Furthermore, for the 2015/16 El Niño, surface mass balance changes across Antarctic catchments extend beyond the 5th and 95th probability distributions for September–November (SON) averages for the full 1979 to 2018 period (much further inland than during other extreme El Niño events), suggesting these changes are not consistent with background conditions. Our results suggest that future extreme ENSO events may continue to cause significant impacts on Antarctic surface mass balance. However, the magnitude and polarity of the potential impacts cannot be inferred from the limited information available on extremes contained in 4 decades of historical data. Further investigations using ice core data and large ensemble model simulations are needed to better understand the drivers of the spatial and temporal variability in this system.
- Article
(7316 KB) - Full-text XML
-
Supplement
(3238 KB) - BibTeX
- EndNote


The El Niño–Southern Oscillation (ENSO) is a key driver of Antarctic surface climate (Fox-Kemper, et al., 2021). ENSO influences Antarctic climate via an atmospheric teleconnection, whereby Rossby wave trains propagate from the tropical Pacific to the poles (Turner, 2004; Ciasto et al., 2015). The Rossby wave train changes the large-scale atmospheric circulation in the southern polar latitudes, shifting the strength, position, and spatial extent of the Amundsen Sea Low (ASL), with impacts on Antarctic surface climate (Turner et al., 2013; Raphael et al., 2016; Clem et al., 2017). ENSO is therefore an important influence on variability in Antarctic surface mass balance (SMB) (e.g. Goodwin et al., 2016), via impacts on polar atmospheric circulation (e.g. Renwick and Revell, 1999), atmospheric temperature (e.g. Steig et al., 2009), and snowfall patterns (e.g. Cullather et al., 1996; Guo et al., 2004). These impacts are important because the balance between snowfall-driven SMB gain and ocean-driven basal melting determine the Antarctic Ice Sheet (AIS) contribution to sea-level rise (Meredith et al., 2019; Huguenin et al., 2024).
Previous studies exploring ENSO-driven Antarctic impacts have considered both moderate and extreme ENSO events together in analyses (e.g. Welhouse et al., 2016; Clem et al., 2018; Paolo et al., 2018; King et al., 2023; King and Christoffersen, 2024; Macha et al., 2024) but have typically not considered how the impacts of extreme ENSO events differ from moderate-strength events (Cai et al., 2015a; Santoso et al., 2017; Paolo et al., 2018). Extreme ENSO events, defined here as when the sea surface temperature (SST) anomaly of the central tropical Pacific Niño-3.4 region (5° N–5° S, 170–120° W; Trenberth, 1997) exceeds ± 2 °C, are associated with devastating global impacts (Cai et al., 2014, 2015b): the 1997/98 El Niño event claimed over 20 000 human lives worldwide (Changnon, 1999; Sponberg, 1999); the 1998/99 strong La Niña event flooded 50 % of Bangladesh's land area (Ninno and Dorosh, 2001; Mirza et al., 2001) and displaced over 20 million people (Jonkman, 2005).
Studies focusing on the influence of extreme ENSO events on the AIS mass balance are limited (Boening et al., 2012; Paolo et al., 2018; Bodart and Bingham, 2019). This is partly because only a small number of extreme events have been observed in the satellite era, limiting the ability to produce a statistically robust “baseline” of present-day Antarctic impacts associated with these rare events. Paolo et al. (2018) show that intense El Niño events are associated with net ice shelf mass loss in the Amundsen/Bellingshausen sector, but do not consider other parts of the ice sheet. Bodart and Bingham (2019) considered the impacts of the 2015/16 extreme El Niño event and found that it was associated with an unprecedented mass gain in the Antarctic Peninsula within the GRACE observational period (2002 to 2017). Low-lying coastal East Antarctica experienced a brief period of reduced net mass loss during this event, associated with enhanced precipitation (Bodart and Bingham, 2019). However, impacts from the 2015/16 El Niño event have not been compared to those from other extreme El Niño events in Antarctica; therefore the Antarctic SMB response during this event may not be typical. Furthermore, the ENSO “flavour” was different for the 2015/16 El Niño event, which began as a central Pacific (CP) event, compared to the extreme El Niño events of 1982/83 and 1997/98, which were eastern Pacific (EP) events (L'Heureux et al., 2017; Santoso et al., 2017; Lieber et al., 2024; Macha et al., 2024). La Niña events are associated with strong Antarctic mass balance responses in the Amundsen sector, including reduced Antarctic shelf melting (Huguenin et al., 2024), less snowfall (Sasgen et al., 2010), and reduced ice shelf height (Paolo et al., 2018). However, these studies do not isolate the influence of strong La Niña events on continent-wide Antarctic SMB.
This study investigates the impact of historical extreme ENSO events on Antarctic SMB. We use the Regional Atmospheric Climate Model version 2.3p3 (RACMO2.3p3), assessing the temperature, snowfall, and SMB anomalies associated with three extreme El Niño events (1982/83, 1997/98, 2015/16) and the five strongest La Niña events (1988/89, 1998/99, 1999/2000, 2007/08, and 2010/11) from 1979–2018. We consider both regional and continental scales, focusing on each major catchment of the AIS. Overall, we aim to answer the following questions: do Antarctic SMB anomalies during extreme ENSO events follow a similar pattern? Where do these impacts occur? And, more generally, do these extreme ENSO events also result in extreme Antarctic SMB changes?
2.1 Data
We analyse seasonal averages of atmospheric variables across Antarctica (regions and catchments defined in Fig. 1), calculated over December–February (DJF), March–May (MAM), June–August (JJA), and September–November (SON). All anomalies are calculated relative to the 1979–2018 mean (unless otherwise specified). All fields are linearly detrended prior to analysis.
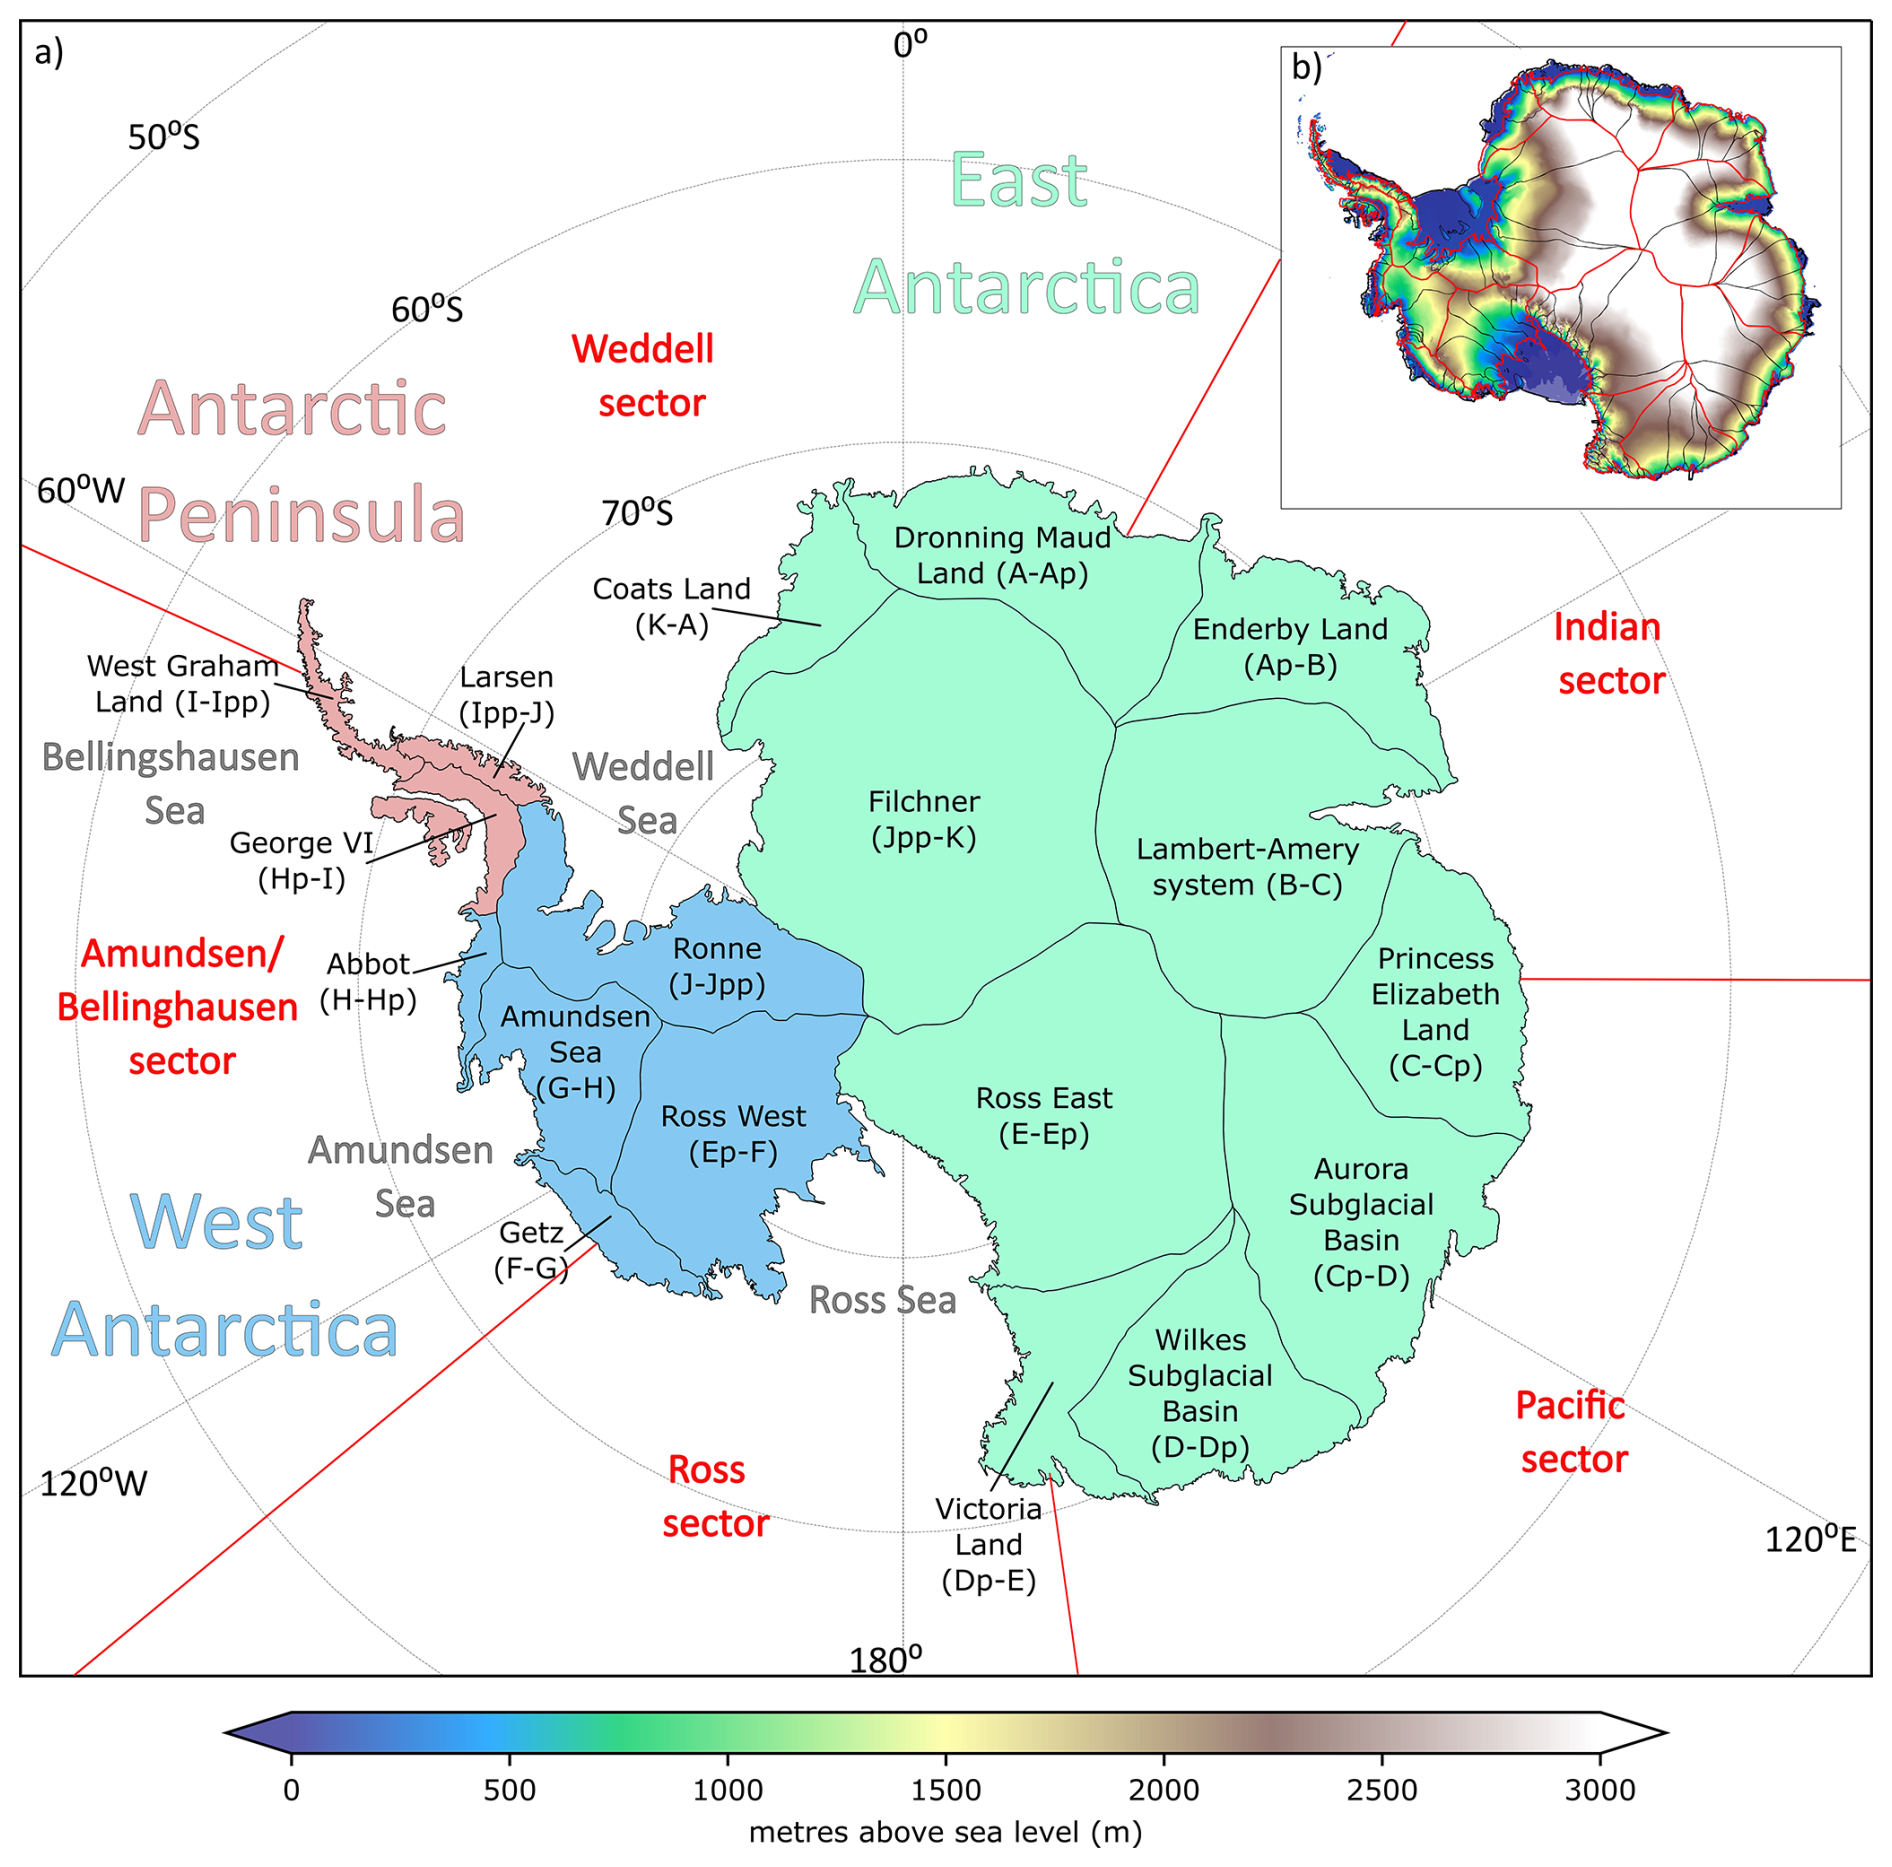
Figure 1The AIS (a) showing sub-regions and catchment names used in this study, as defined by Rignot et al. (2011) and Rignot et al. (2019). The Rignot et al. (2011) catchment naming system, based on lettered regional catchments, is included in brackets. The Antarctic Peninsula (pink), East Antarctica (green), and West Antarctica (blue) are highlighted. The Weddell, Amundsen/Bellingshausen, Ross, Indian, and Pacific sectors are shown in red. (b) Inset Antarctic map of Antarctic surface elevation (contours; metres above sea level) from Liu et al. (2001), with individual catchments (red lines) and catchment sub-regions (black lines) from Rignot et al. (2011) and Rignot et al. (2019).
2.1.1 Regional climate model RACMO2.3p3
We assess Antarctic climate variability using 27 km resolution output from the polar version of the Regional Atmospheric Climate Model version 2.3p3 (RACMO2.3p3) simulated over the period 1979–2018 (van Dalum et al., 2021, 2022). RACMO is more appropriate than the atmospheric reanalysis of the European Centre for Medium-Range Weather Forecasts (ERA5) for addressing SMB impacts due to its adaptation to the polar regions, including consideration of the orographic effects and post-depositional processes and an updated surface mass balance scheme that includes a firn module (van Dalum et al., 2022). We include a more detailed discussion on the polar developments in RACMO2.3p3, and justification for its use over ERA5, in Sect. S1 in the Supplement. RACMO has extensively been used to analyse Antarctica's surface climate, and previous studies have shown it is accurate and reliable for understanding AIS atmosphere conditions (Van Wessem et al., 2014; Lenaerts et al., 2018; van Wessem et al., 2018; van Dalum et al., 2022; Saunderson et al., 2024; Macha et al., 2024). RACMO2.3p3 is forced at the boundaries by 3-hourly output from ERA5 (Hersbach et al., 2020) and initialised using a snowpack from a previous model run, meaning that the SMB output for the full time period from 1979–1984 can be utilised (van Dalum et al., 2021). Macha et al. (2024) also affirm this, showing that, although 1979–1984 is considered a spin-up period in RACMO2.3p3, there is a limited impact of excluding this period on the statistical robustness of analyses. We therefore include this period in our analyses. Further detail on RACMO2.3p3 can be found in Sect. S1.
2.1.2 Reanalysis data
To link the teleconnections of extreme ENSO events to their impacts in Antarctica, we use mean sea-level pressure (SLP) from the global ERA5 outputs (Hersbach et al., 2020) across the mid-latitudes to polar latitudes (the RACMO2.3p3 simulation only extends across the polar latitudes). ERA5 atmospheric variables provide insight into the wider circulation anomalies outside the RACMO Antarctic domain and into the atmospheric circulation boundaries driving RACMO2.3p3 (Hersbach et al., 2020). ERA5 outputs are provided at 0.25° resolution, and we utilise the outputs for the entire region south of 45° S latitude (Hersbach et al., 2020). We calculate seasonal anomalies by removing the mean over the period 1979–2018, to enable direct comparison with the RACMO2.3p3 variables.
2.1.3 Niño-3.4, NCP, and NEP El Niño–Southern Oscillation indices
ENSO events are defined according to the location and magnitude of peak SST anomalies in the tropical Pacific (Trenberth, 1997; Ashok et al., 2007; Kug et al., 2009). In this study, we use three ENSO indices – namely Niño-3.4, NCP, and NEP – to account for diversity in the location of peak SST anomalies and hence the “flavour” of ENSO events.
Niño-3.4 SST anomalies are calculated from the average equatorial SST across the tropical Pacific from 5° N–5° S and 170–120° W according to Trenberth (1997) and are available at https://climatedataguide.ucar.edu/climate-data/nino-sst-indices-nino-12-3-34-4-oni-and-tni (last access: 3 May 2024). Here, SST anomalies are sourced from the National Oceanic and Atmospheric Administration (NOAA) (Rayner, 2003), based on the Hadley Centre Sea Ice and Sea Surface Temperature (HadISST) dataset. We use the Trenberth (1997) definition of extreme El Niño and La Niña events, namely when the SST anomaly of the central tropical Pacific Niño-3.4 region exceeds ± 2 °C for 6 months or more.
Extreme ENSO events are classified as CP- or EP-type events according to Macha et al. (2024) and Ren and Jin (2011) for NCP and NEP indices, respectively (see Sect. S2). Ren and Jin (2011) NCP indices are also used to identify non-extreme CP-type events in the time period, and we use these for comparative purposes in our analysis (see Sect. 2.1.4).
2.1.4 Defining extreme ENSO events
Over 1979–2018, three extreme El Niño events occurred: 1982/83, 1997/98, and 2015/16. The 1982/83 and 1997/98 events are classified as EP El Niño events (Fig. 2c) and are the strongest EP El Niño events on record (L'Heureux et al., 2017; Santoso et al., 2017). By contrast, the 2015/16 extreme El Niño event was classified as a CP-type El Niño event, but, as the event matured, warming in the eastern Pacific became stronger than in the central Pacific, making the event difficult to classify (Santoso et al., 2017; Xue and Kumar, 2017). The 2015/16 extreme El Niño event did not yield SST anomalies in the EP region that were as high as during the 1982/82 and 1997/98 events; however, it was associated with the largest SST anomaly in the Niño-3.4 region (L'Heureux et al., 2017; Santoso et al., 2017; Xue and Kumar, 2017). In this study, we consider each of these three events separately. Non-extreme CP El Niño events (see Sect. 2.1.3) are also included in our analysis to provide a comparison to extreme El Niño events, building off of Macha et al. (2024), who found that CP-type El Niño events result in widespread SMB increases in West Antarctica. Moderate and strong El Niño events are also included in our analysis to allow comparison with El Niño events of lower magnitude. Moderate events are defined as events with an SST anomaly between 1 and 1.5 °C for 6 months or more, whilst strong events are events with an SST anomaly between 1.5 and 2 °C for 6 months or more (Trenberth, 1997).
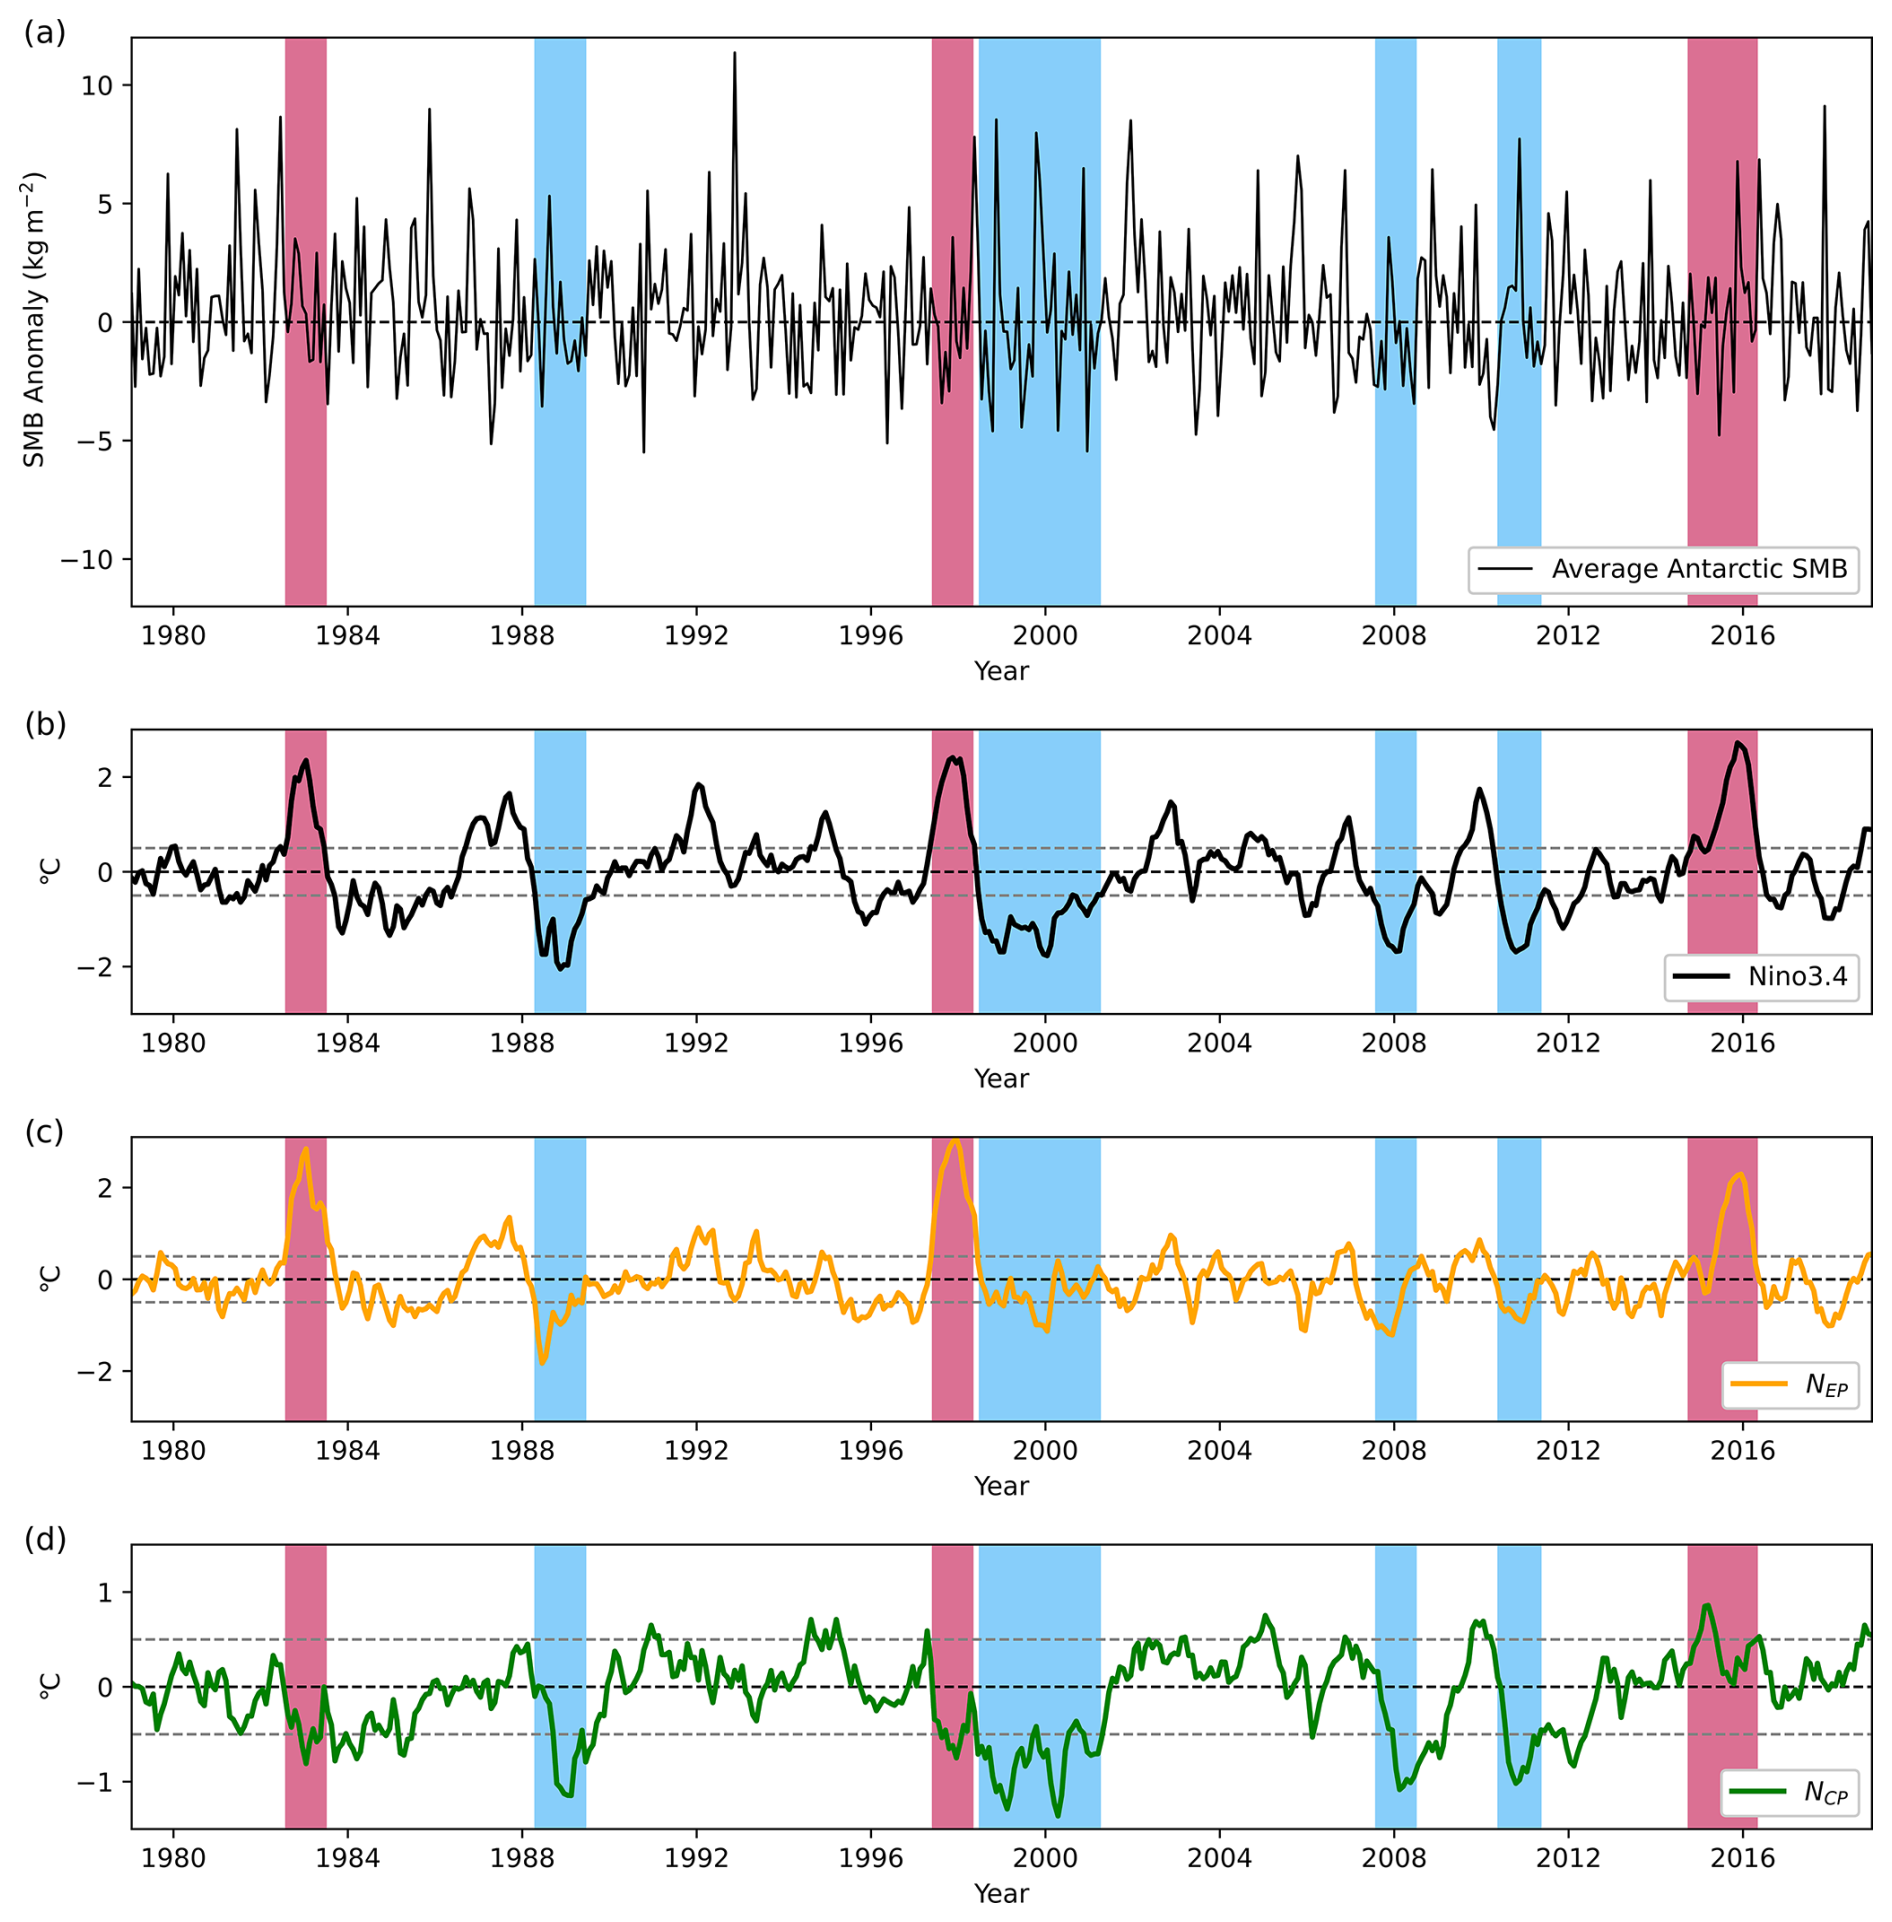
Figure 2Time series of anomalies in (a) the total SMB for the AIS (black; from RACMO2.3p3; van Dalum et al., 2021), (b) the Niño-3.4 SST (from NOAA; Rayner, 2003), (c) the CP El Niño index (NCP; yellow), and (d) the EP El Niño index (NEP; green) (Ren and Jin, 2011). Extreme El Niño events (pink) and strong La Niña events (blue) are highlighted across all time series.
No extreme La Niña events with an SST anomaly < −2 °C occur between 1979–2018 (Fig. 2), as La Niña events are associated with smaller-amplitude SST anomalies than El Niño events (Capotondi et al., 2015; Lieber et al., 2024). Therefore, in this study, we define strong La Niña events as occurring when the 3-month average Niño-3.4 SST anomalies are < −1.5 °C for 6 months or more from 1979–2018. Between 1979–2018, five strong La Niña events occurred: 1988/89, 1998/99, 1999/2000, 2007/08, and 2010/11. Strong La Niña events typically occur the year following a strong El Niño event (Takahashi et al., 2011), and the 1998/99 and 1999/2000 events are sequential, following the extreme 1997/98 El Niño event (Fig. 2).
2.1.5 SON seasonal focus
El Niño SST anomalies generally initiate between March and June and develop in JJA and SON, reaching their peak in DJF, whilst peak La Niña SST anomalies generally occur in SON (Webster, 1982; Ambrizzi et al., 1995; Trenberth, 1997). In this study, we focus on ENSO in SON (of the year when the ENSO event develops), when the ENSO–Antarctic teleconnection is strongest (Webster, 1982; Ambrizzi et al., 1995; Lee et al., 2009) due to a strong subtropical jet enabling Rossby waves to propagate from the tropics to the poles (Renwick and Revell, 1999; Turner, 2004; Yiu and Maycock, 2020). By contrast, the ENSO–Antarctic teleconnection is weakest during DJF, so, whilst extreme El Niño events typically peak during DJF, we do not include periods beyond SON in our main analysis (Webster, 1982; Renwick and Revell, 1999). For these reasons, all analyses included in the main text are undertaken on SON, and the analyses of other seasons and annual results are included in the Supplement (Supplement Figs. S3–S5, S11, and S14 and Sect. S5).
2.2 Analyses
2.2.1 Defining and aggregating Antarctic regions
We analyse the RACMO2.3p3 SMB fields from the 18 individual catchments used in (IMBIE) Antarctic mass balance assessments (Fig. 1; Rignot et al., 2011), to consider regional SMB changes. The total SMB is aggregated by catchment to allow comparison between catchments.
2.2.2 Cumulative SMB anomalies
Seasonal cumulative regional SMB anomalies are calculated across all grid cells within a given catchment, and over all months within the season, allowing the total monthly scale SMB extremes to be included (Webster, 1982; Ambrizzi et al., 1995; Lee et al., 2009). Cumulative annual SMB anomalies are the summed 12-month regional SMB anomalies, allowing the contribution of ENSO events relative to the yearly SMB budget to be explored.
2.2.3 Statistical analyses
We undertake analysis of the SON Rossby wave propagation from the tropics to the poles for each extreme El Niño and strong La Niña event examined to illustrate the tropical–polar teleconnection (Figs. S1 and S2). We test whether there is a consistent response during all extreme El Niño events or strong La Niña events by comparing individual extreme-event results with the composite of the extreme El Niño events or strong La Niña events. If each event is associated with similar behaviour, there should be a consistent response across both the composite and each individual event – and vice versa if there are differences between the composite and each individual event. We undertake analysis on the SON composites of all extreme El Niño and strong La Niña events regarding SLP, 2 m air temperature, precipitation, and SMB anomalies. We also compare SLP, 2 m air temperature, precipitation, and SMB anomalies for each individual extreme El Niño event and strong La Niña event. Composite anomalies during extreme ENSO events and during each individual El Niño and La Niña event are tested for statistical significance against the climatological baseline conditions, which incorporate all climate variability; therefore, the changes presented are not the result of ENSO alone. Statistical significance is tested using a Student's t test or a two-sided Kolmogorov–Smirnov (K–S) test at the 5 % confidence level, as indicated in figure captions.
We first assess the probability distribution of cumulative SON SMB anomalies for each catchment and year, delineating extreme ENSO events from other events. We also define extreme SMB changes as occurring when anomalies exceed the 5th or 95th percentile and identify outliers in each region's cumulative SON SMB anomaly dataset (see Sect. S3 for outlier methodology). We also assess the cumulative SON SMB anomalies for each moderate or strong El Niño event for each Antarctic catchment, allowing the SMB responses during non-extreme El Niño events to be compared to those during extreme El Niño events (Fig. S15).
We assess whether SMB anomalies during extreme ENSO events deviate from baseline conditions by comparing probability distributions, as follows. Firstly, we determine a “baseline” probability distribution by calculating the 90th and 95th percentiles for each catchment's SON SMB anomalies over the full period from 1979–2018. Secondly, we calculate the probability distribution of SMB anomalies for each catchment during extreme El Niño events, CP El Niño events, and strong La Niña events. Thirdly, we compare the probability distribution of SMB anomalies during these extreme events with the “baseline” probability distributions previously calculated, testing differences in distributions for statistical significance. Finally, we compare results for extreme and moderate ENSO events, to place our findings in the context of ENSO variability, and compare SON results with annual results to place our findings in the context of the annual surface mass budget.
The statistical significance of differences in distributions is tested using Monte Carlo sampling (1000 simulations) with a two-sided Kolmogorov–Smirnov (K–S) test at the 5 % confidence level (see Tables S1–S4; Hammersley and Handscomb, 1964; Smirnov, 1948). We test the following:
-
if SMB anomalies during each (i) extreme El Niño event, (ii) CP El Niño event, and (iii) La Niña event are statistically different from baseline conditions (Tables S1 and S3); and
-
if SMB anomaly distributions between each extreme ENSO event are statistically distinguishable from one another (Tables S2 and S4).
All results presented in the main figures are statistically significant, unless otherwise indicated by stippling for non-significant results. Auto-correlation is not accounted for in the analysis, as the seasonally averaged lag-one auto-correlation values for 2 m temperature, precipitation, and SMB variables are below 0.15 (for each variable's corresponding units) and are therefore not significant (Mudelsee, 2010).
3.1 Spatial maps of Antarctic surface climate responses to extreme/strong ENSO events
3.1.1 Extreme El Niño events
We first consider the composite extreme El Niño behaviour by averaging the individual extreme El Niño events of 1982/83, 1997/98, and 2015/16. Extreme El Niño events are on average associated with a positive SLP anomaly in the Amundsen/Bellingshausen sector, a negative SLP anomaly in the Ross Sea, and a negative SLP anomaly in the Weddell Sea (Fig. 3a). This results in a “dipole” in temperature anomalies across West Antarctica, with positive temperature anomalies across the Amundsen/Bellingshausen and Ross sectors and negative temperature anomalies across the Weddell Sea (Fig. 3b). A weak positive pressure anomaly also occurs over Enderby Land (Fig. 3a).
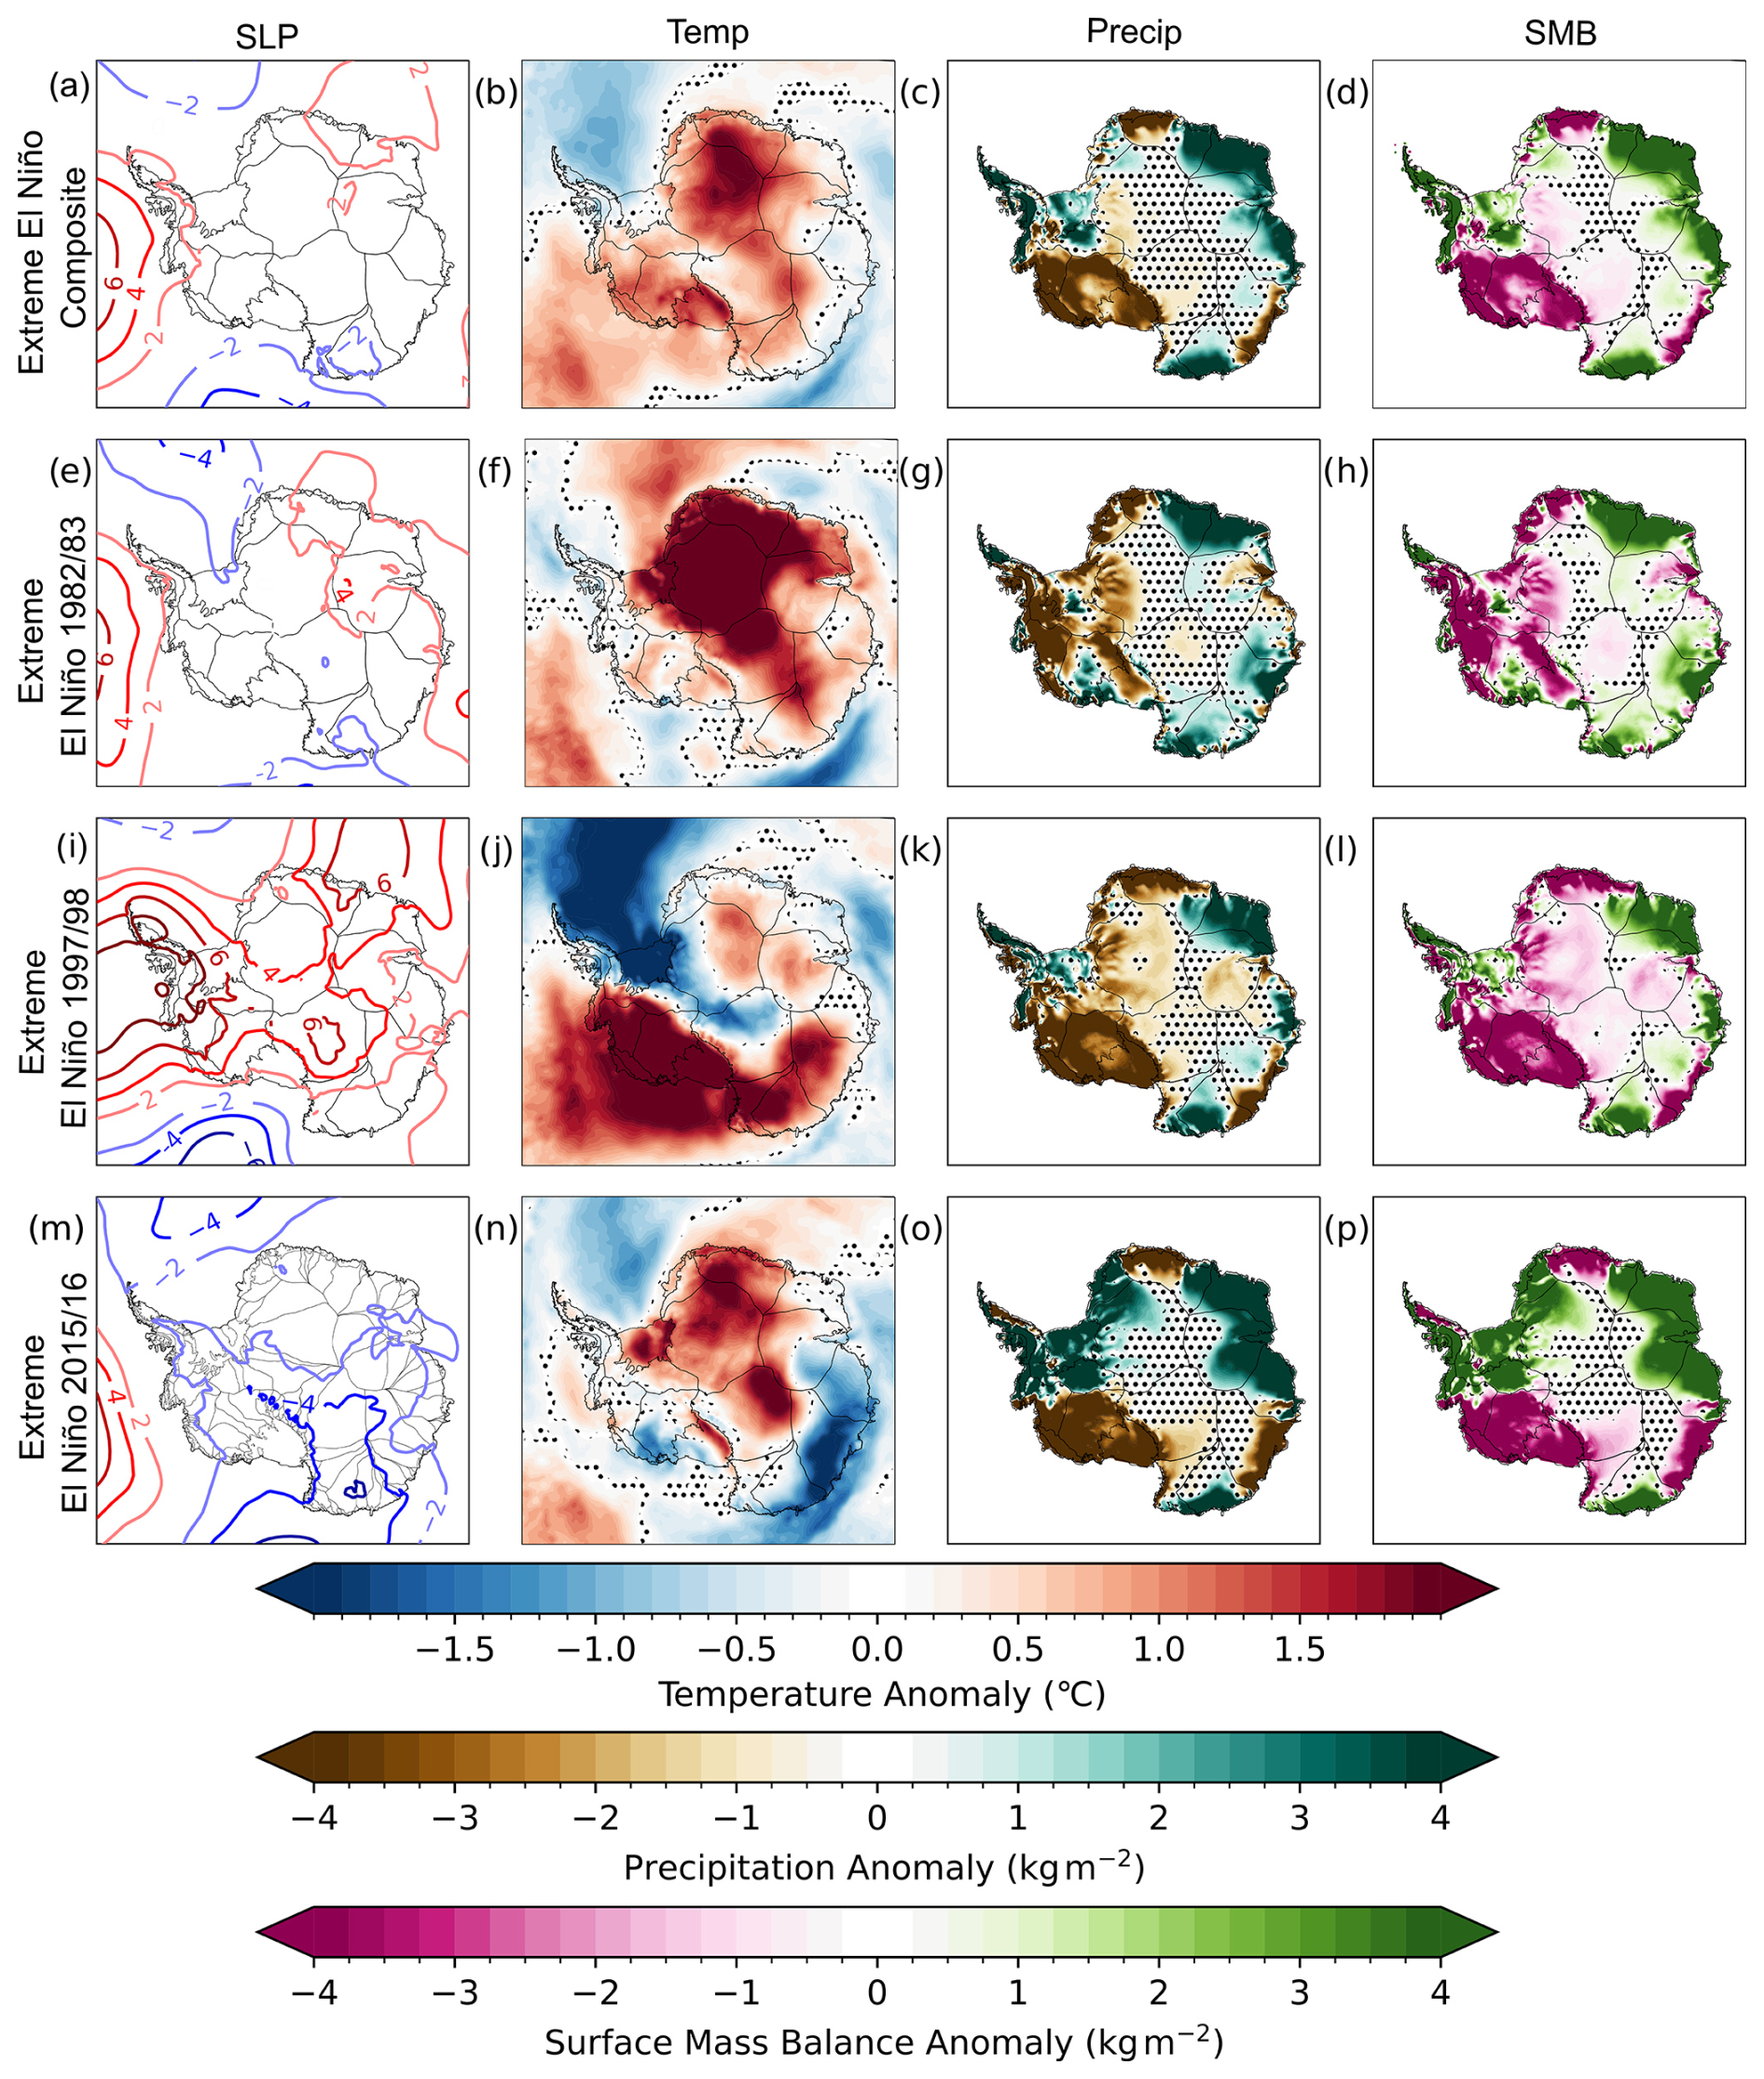
Figure 3SON Antarctic surface climate changes during extreme El Niño events. SON composite (a–d) and SON average (e–p) sea-level pressure (SLP; coloured contours at 2 hPa increments; from ERA5; first column), Antarctic 2 m atmospheric temperature (Temp; from RACMO2.3p3; second column), precipitation (Precip; from RACMO2.3p3; third column), and SMB (from RACMO2.3p3; fourth column) during extreme El Niño events in (a–d) 1982/83 (e–h), 1997/98 (i–l), and 2015/16 (m–p). Fields are linearly detrended prior to analysis (see Methods). Changes in variables during the SON of each individual extreme El Niño event year and the composite of these events are tested for statistical significance against climatological baseline conditions (which incorporate all climate variability) using a two-tailed Student's t test. Non-statistically significant results are shown with stippling at the 5 % confidence level.
We next consider whether the composite extreme El Niño behaviour is consistent across all the individual events. During all three extreme El Niño events, we see a positive SLP anomaly in the Amundsen/Bellingshausen sector and negative SLP anomalies in both the Ross and Weddell sectors (Fig. 3e, i, and m), which are also identified in the composite (Fig. 3a). However, in East Antarctica, we see differing SLP patterns (Fig. 3e, i, and m). During the 1982/83 event, the positive SLP anomaly in the Amundsen/Bellingshausen sector is shifted northwards, with the negative SLP anomaly in the Weddell sector occurring further over the continent than the composite (Fig. 3e). In the 1997/98 El Niño event, a positive SLP anomaly occurs in the Amundsen/Bellingshausen sector that is of much greater magnitude than during other El Niño events, being as large as 8 hPa near the George VI catchment (Fig. 3i). This SLP extends far into the interior of the continent and across both East and West Antarctica, in contrast to the other extreme El Niño events (Fig. 3i). During the 2015/16 event, West Antarctic SLP anomalies are similar to the composite, but a negative SLP anomaly extends from the Wilkes Subglacial Basin across the Pacific sector (Fig. 3m). We note that, during both the 1982/83 and 1997/98 events, positive SLP anomalies occur over Enderby Land, which are associated with increased onshore moisture flux from the ocean to the continent (Fig. 3e and i). A similar positive SLP anomaly occurs in the composite (Fig. 3a). During 1997/98, this SLP over Enderby Land is of much greater magnitude than during other El Niño events and is part of the SLP anomaly that extends across the entire continent (Fig. 3i). However, during the 2015/16 event, there is no corresponding positive SLP anomaly over Enderby Land (Fig. 3m). The SLP composite for extreme El Niño events is therefore limited, missing regional signals that are only identified when each individual event is compared (Fig. 3).
These SLP circulation features result in similar positive temperature anomalies during the 1982/83 and 2015/16 El Niño events across the Weddell and Indian sectors, with positive anomalies extending inland across the Filchner catchment and into the Ross East catchment (Fig. 3f and n). Negative temperature anomalies are also similar, occurring in the Pacific Ocean during both events, but, during the 1982/83 event, this anomaly is constrained off the Antarctic coast, whilst, during the 2015/16 event, the negative temperature anomaly extends over the Pacific sector of East Antarctica across the Wilkes Subglacial Basin and Aurora Subglacial Basin (Fig. 3f and n). During the 1997/98 event, these circulation changes result in positive temperature anomalies in the Amundsen/Bellingshausen sectors and in a negative anomaly extending into the Weddell sector and inland East Antarctica (Fig. 3j). The temperature anomalies identified in the composite are therefore not a clear representation of the temperature anomalies identified during each individual extreme event (Fig. 3).
Precipitation and SMB anomalies are concentrated predominantly along the coast and across West Antarctica during El Niño events (Fig. 3). Positive precipitation and SMB anomalies in the Indian sector during each El Niño event are consistent with the composite pattern; however, other regions do not have consistent responses during different El Niño events (Fig. 3g, h, k, l, o, and p). Precipitation and SMB anomalies in the Weddell sector and parts of the Ross sector contrast with those of the composite pattern during the 1982/83 event, with negative anomalies across much of the Weddell sector and positive anomalies across parts of the Ross sector (Fig. 3g and h). During the 1997/98 event, precipitation and SMB anomalies are generally consistent with the extreme El Niño composite pattern across the continent, except that weak negative anomalies extend further inland in the Filchner catchment (Fig. 3c, d, k, and l). During the 2015/16 event, large positive precipitation and SMB anomalies in the Weddell sector and across the Peninsula are in stark contrast to the composite and other El Niño events (Fig. 3o and p). Whilst precipitation and SMB anomalies in the Weddell sector differ to the composite during both the 1982/83 and 2015/16 events, these responses differ to one another with negative precipitation and SMB anomalies during the 1982/83 event and widespread large positive anomalies during the 2015/16 event (Fig. 3g, h, o, and p). Precipitation and SMB anomalies in the Antarctic Peninsula, Weddell sector, Aurora Subglacial Basin, Princess Elizabeth Land, and Lambert–Amery System catchments vary considerably between individual extreme El Niño events, with extreme El Niño events being associated with both negative and positive anomalies in these regions (Fig. 3g, h, k, l, o, and p). This highlights the lack of a consistent mass balance response to extreme El Niño events across Antarctica (Fig. 3).
Changes in SLP, temperature, precipitation, and SMB across Antarctica are not consistent between the 1982/83, 1997/98, and 2015/16 events, with regional differences in the magnitude and sign of anomalies (Fig. 3e–p). The composite of extreme El Niño events also appears to miss key regional differences between events; however, this may be related to the small number of events in the analysis period (Fig. 3a–d). Given this limitation, in this study we compare extreme El Niño events on a case-by-case basis to ensure that differences between events are adequately accounted for.
3.1.2 Strong La Niña events
Strong La Niña events induce a range of surface climate changes, with no clear pattern in common between the SLP, temperature, precipitation, and SMB anomalies of strong La Niña events (Fig. 4). The composite of the five strong La Niña events shows a negative SLP anomaly in the Amundsen/Bellingshausen sector, indicating a strengthened ASL, resulting in negative temperature anomalies in the Ross sector and positive temperature anomalies in the Weddell sector (Fig. 4a and b). This strengthened ASL is also seen in four of the five strong La Niña events, with no strengthened ASL being evident during the 2007/08 event – unusual for a La Niña event (Fig. 4e, i, m, q, r, and u). However, the magnitude and extent of this negative SLP anomaly and the resultant temperature anomalies vary between events (Fig. 4f, j, n, and v). During the 1988/89 event, a positive SLP system extends across the continent, and positive anomalies extend across the Peninsula, Weddell, and Ross sectors (Fig. 4e and f). In contrast, during the 1998/99 event, negative SLP anomalies occur in the Amundsen/Bellingshausen sector and over the Enderby Land catchment, whilst negative temperature anomalies extend across West and East Antarctica except over the Aurora Subglacial Basin (Fig. 4i and j). Furthermore, during the 1999/2000 and 2010/11 events, negative SLP systems extend across the continent, and positive temperature anomalies extend by varying amounts across the Antarctic Peninsula (Fig. 4m, n, u, and v). In East Antarctica, there is no clear pattern between temperature anomalies during strong La Niña events (Fig. 4f, j, n, r, and v).
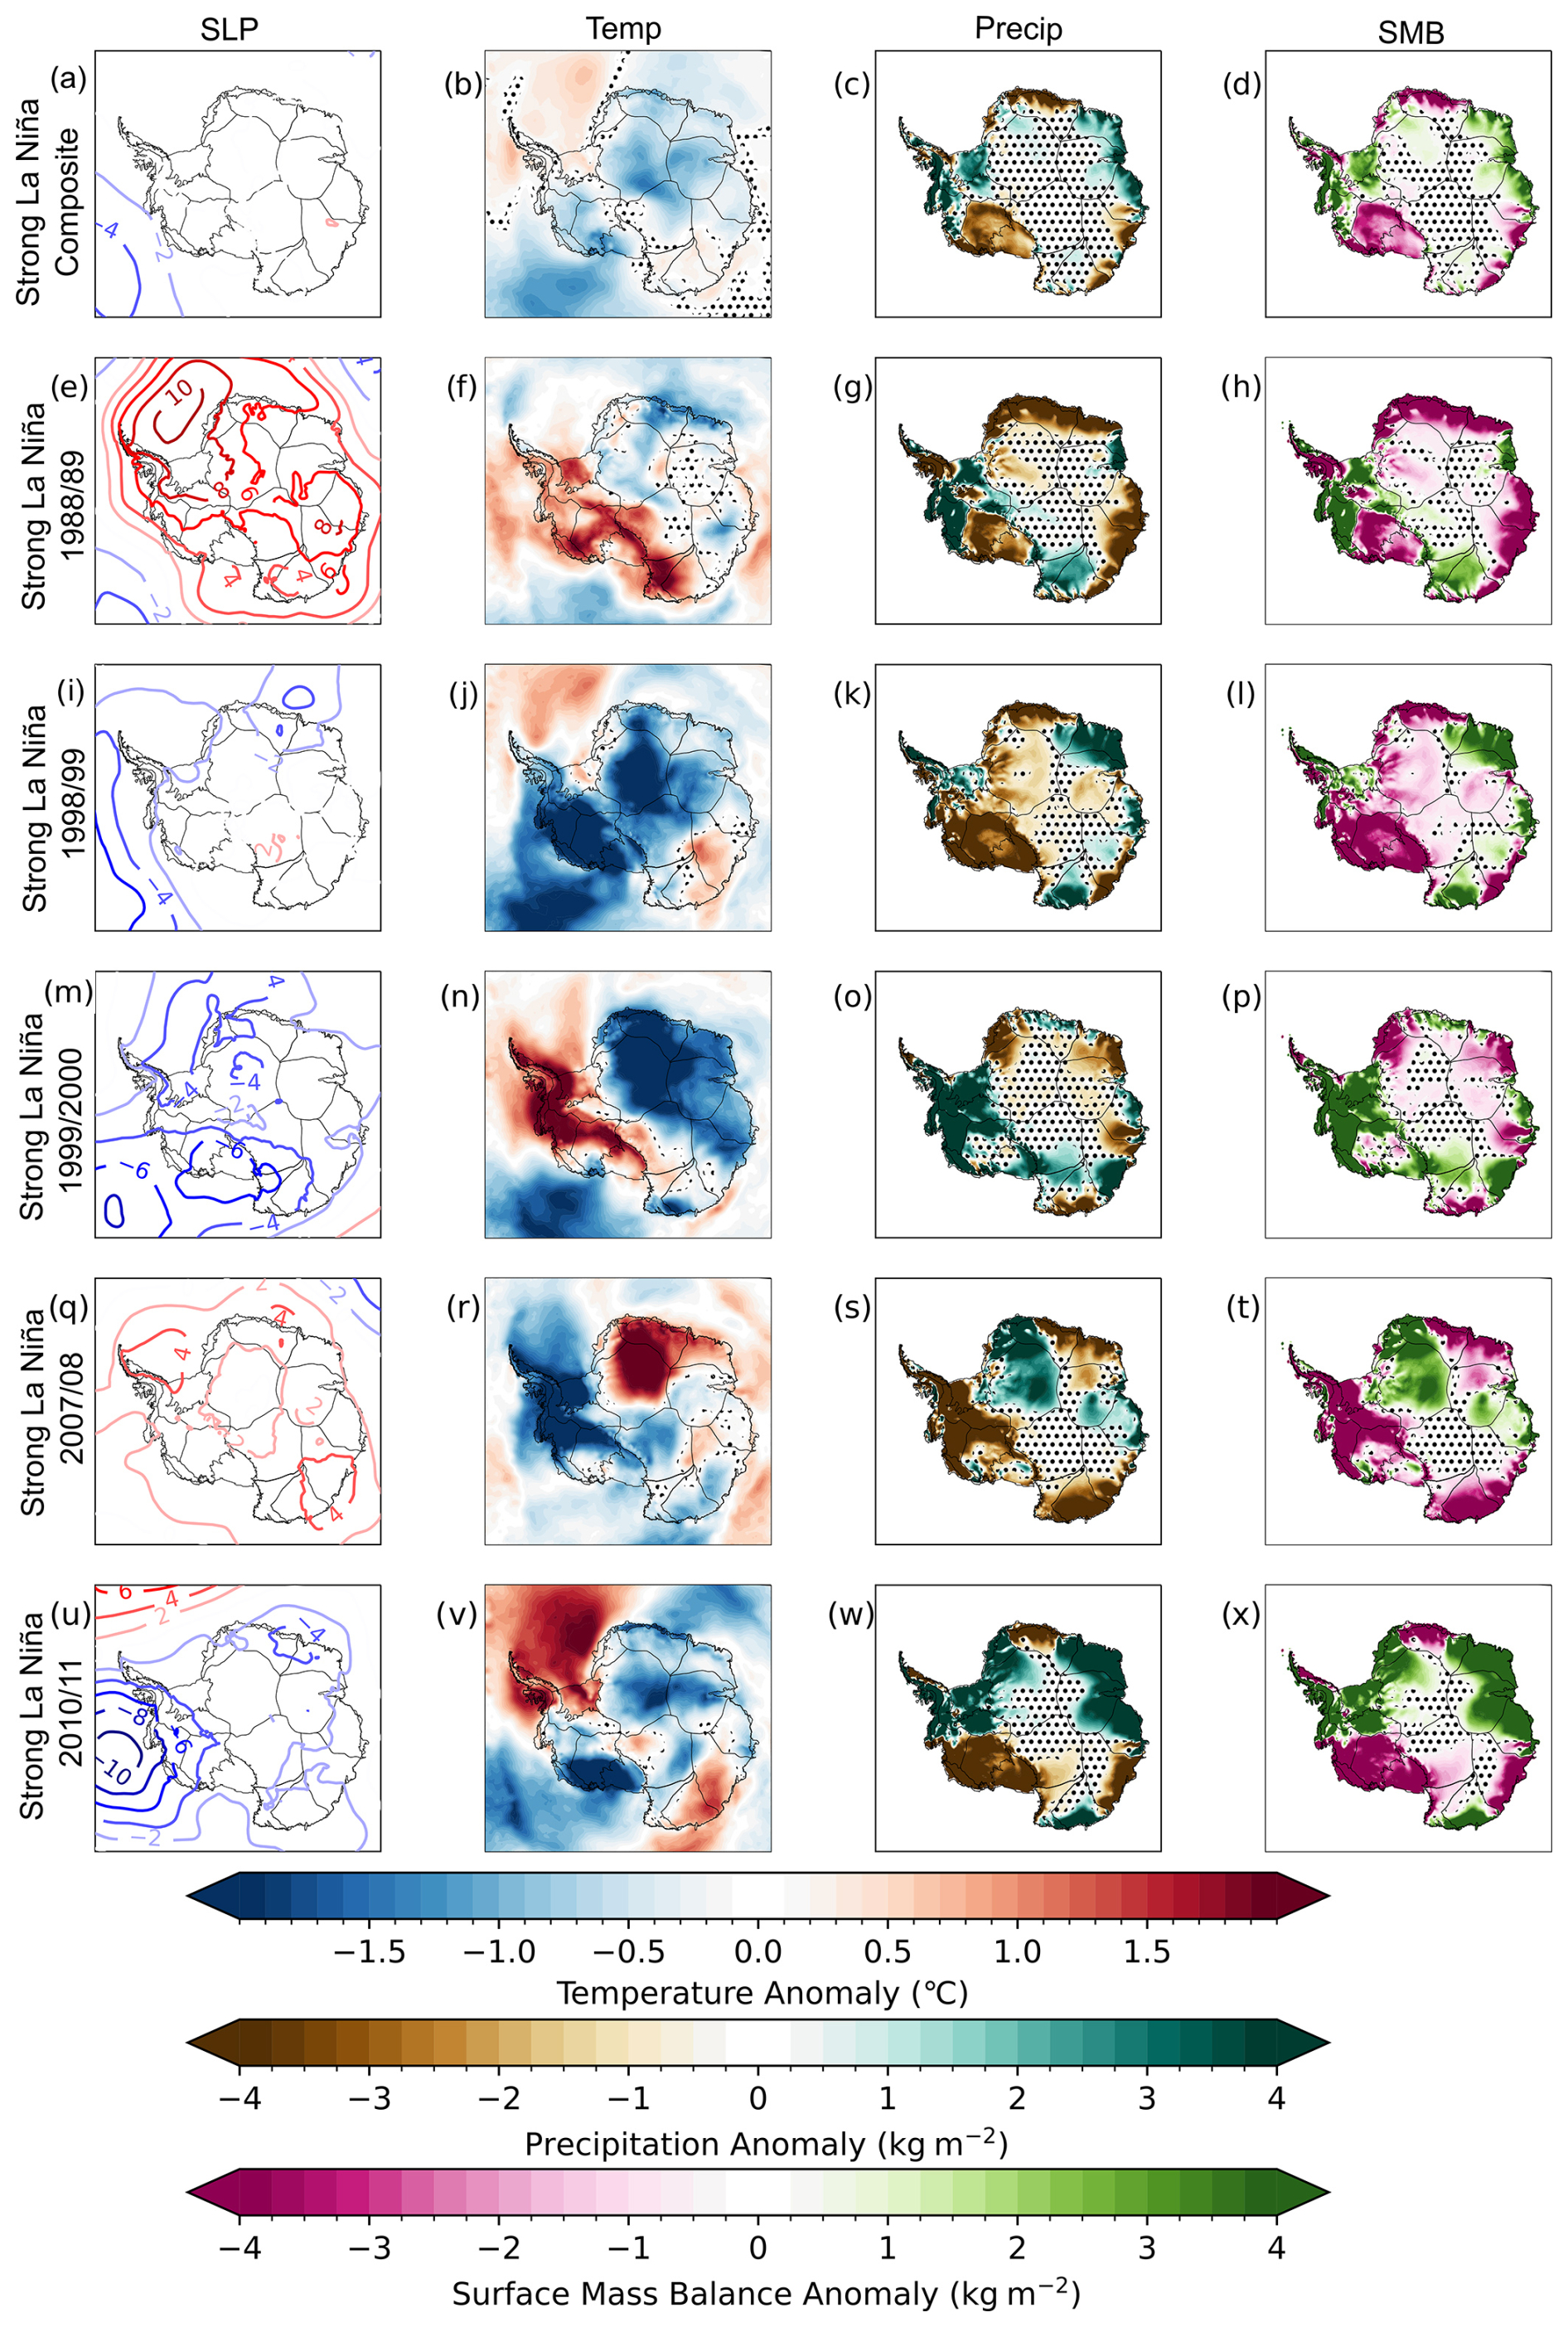
Figure 4SON Antarctic surface climate changes during strong La Niña events. SON composite (a–d) and SON average (e–x) sea-level pressure (SLP; coloured contours at 2 hPa increments; from ERA5; first column), Antarctic 2 m atmospheric temperature (Temp; from RACMO2.3p3; second column), precipitation (Precip; from RACMO2.3p3; third column), and SMB (from RACMO2.3p3; fourth column) during strong La Niña events in (a–d) 1988/89 (e–h), 1998/99 (i–l), 1999/2000 (m–p), 2007/08 (q–t), and 2010/11 (u–x). Fields are linearly detrended prior to analysis (see Methods). Changes in variables during the SON of each individual strong La Niña event year and the composite of these events are tested for statistical significance against climatological baseline conditions (which incorporate all climate variability) using a two-tailed Student's t test. Non-statistically significant results are shown with stippling at the 5 % confidence level.
Regional precipitation and SMB anomalies also vary considerably between the events, with numerous regions experiencing negative and positive anomalies during different strong La Niña events (Fig. 4g, h, k, l, o, p, s, t, w, and x). Whilst precipitation and SMB anomalies are concentrated predominantly along the coast and across West Antarctica during strong La Niña events (Fig. 4), during the 2007/08 event, positive temperature anomalies extend into the Filchner catchment and Pacific sector of East Antarctica, causing positive precipitation and SMB anomalies inland in the Filchner catchment compared with the composite (Fig. 4c, d, s, and t). This highlights the lack of consistent mass balance response to La Niña events across Antarctica (Fig. 4).
There are few similarities between surface climate anomalies, including SLP, surface temperature, precipitation, and SMB during strong La Niña events (Fig. 4e–x). The composite of strong La Niña events also appears to miss regional differences in the sign and magnitude of climate anomalies during individual events (Fig. 4a–d). As for the El Niño composites, this may be due to statistical limitations associated with the small number of events considered. When conducting extreme ENSO event analysis in this study, each event and its impacts are assessed, to ensure key differences between events or impacts are not overlooked.
3.2 Magnitude of catchment-scale surface mass balance changes during extreme/strong ENSO events
We next consider whether SMB responses at the catchment scale are distinct from background and average conditions, i.e. outside the 5th or 95th percentiles of all SON SMB changes during the 1979–2018 period. We find that there are no consistent responses between extreme El Niño events (comparing red triangles in Fig. 5) or strong La Niña events (comparing blue triangles in Fig. 5), except in Enderby Land, East Antarctica (Fig. 5). Here, the three extreme El Niño events all have cumulative SON SMB anomalies at approximately 8000 kg m−2 (Fig. 5). In fact, the largest positive regional cumulative SMB anomalies in Enderby Land between 1979 and 2018 (other than in 2009, which our analysis identified as an outlier) occur during these extreme El Niño events (Fig. 5). During La Niña events, we do not see evidence of a consistent SMB response in Enderby Land, with only the 1988/89 La Niña event SON SMB anomaly exceeding the 5th percentile at < −5000 kg m−2 (Fig. 5).
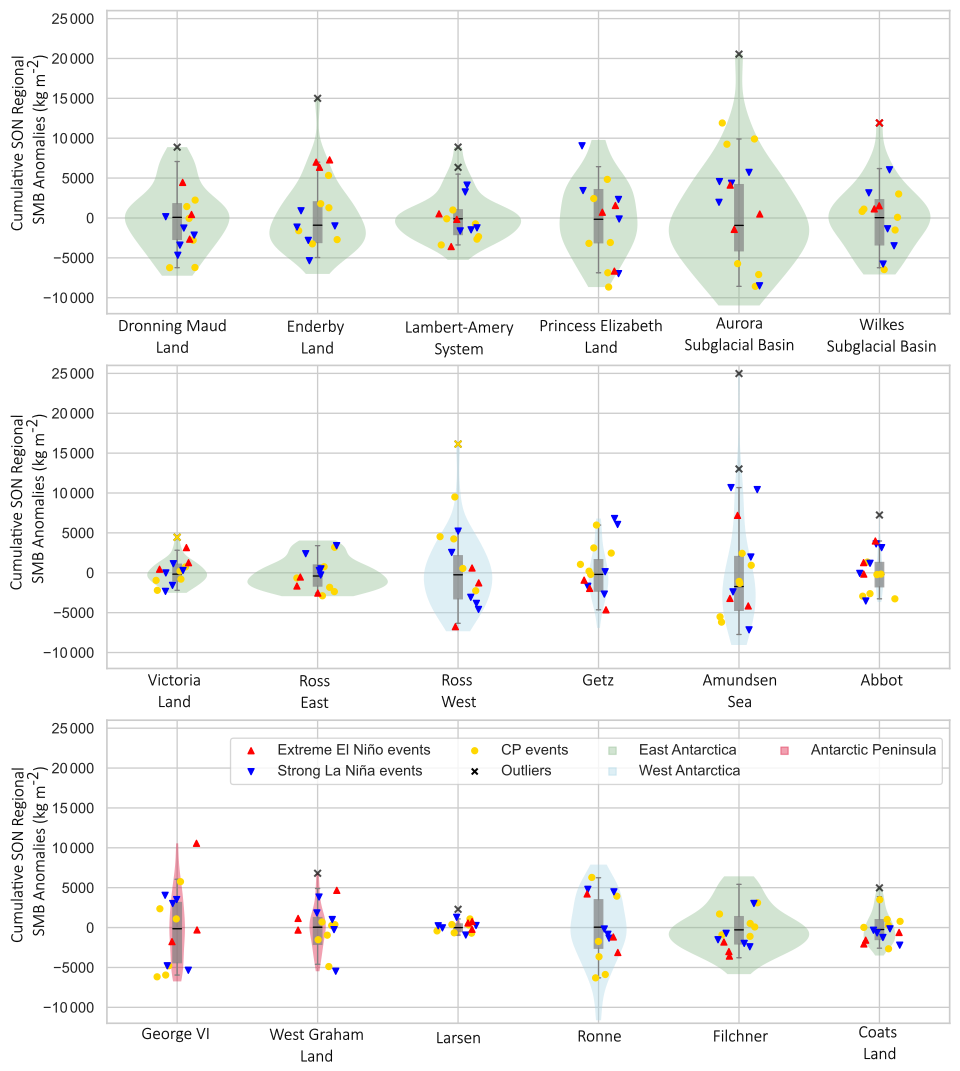
Figure 5Relationship between extreme ENSO events and regional Antarctic surface mass balance anomalies in SON. Density curves of regional cumulative SON SMB anomalies for each Antarctic Ice Sheet regional catchment (a–j). Violin plots are scaled (x axis of violin plots) by the regional catchment size, meaning each violin width is proportional to the size of each catchment. Box plots show the interquartile range, with medians (black lines) and whiskers (5th and 95th percentiles). Catchments are ordered according to Rignot et al. (2011), starting at Dronning Maud Land and working clockwise around the Antarctic coastline. East Antarctic (light green), West Antarctic (light blue), and Antarctic Peninsula (pink) catchments; outliers (crosses; see Supplement); extreme El Niño events (red); strong La Niña events (blue); and central Pacific El Niño events (yellow) are highlighted. Scatter plots of regional cumulative SON SMB anomalies plotted against the Niño-3.4 index for all catchment regions are included in the Supplement (Fig. S6).
In all other catchments, the magnitudes of the SMB anomalies during extreme/strong ENSO events are not consistently extreme, but, in numerous catchments, a single extreme/strong ENSO event is associated with an extreme SMB response (Fig. 5). In the Wilkes Subglacial Basin and George VI catchment, the 2015/16 extreme El Niño event is associated with the largest positive cumulative SMB anomalies, at approximately 12 500 and 11 000 kg m−2, respectively (Fig. 5). However, the other two extreme El Niño events are associated with SMB anomalies within interquartile ranges (between 2500 and −3000 kg m−2 and 3000 and −4500 kg m−2, respectively) (Fig. 5). In Princess Elizabeth Land, the 2007/08 La Niña event is associated with the largest positive cumulative SMB anomaly in the region for the 1979–2018 period at 9000 kg m−2, but other strong La Niña events SMB anomalies are within the region's interquartile range (Fig. 5). In the Getz and Amundsen Sea catchments, SMB anomalies during the 1998/99 and 1999/2000 strong La Niña events are the largest positive cumulative SMB anomalies in the time period around the 95th percentile at approximately 6000 and 11 000 kg m−2, respectively (Fig. 5).
As explained in Sect. 2.1.3, we compare extreme El Niño events to non-extreme CP El Niño events, as Macha et al. (2024) show that CP El Niño events are associated with larger SMB responses than EP events. In the Aurora Subglacial Basin, significant SMB changes do not occur in any extreme El Niño event (anomalies are within the interquartile range, between −4500 and 4500 kg m−2), but three CP El Niño events are associated with large positive anomalies around the 95th percentile, between 9000 and 12 000 kg m−2 (Fig. 5). In the Getz catchment, two strong La Niña events (1998/99 and 1999/2000) are associated with positive SMB anomalies outside the 95th percentile; however, the other strong La Niña events are associated with SMB anomalies within the region's interquartile range (Fig. 5). In the Ross West region, two CP El Niño events (1991/92 and 2002/03) are associated with approximately 10 000 and 16 000 kg m−2, respectively, with all other SMB anomalies being < 6000 kg m−2 (Fig. 5). For other catchments, responses vary by event, with no consistent or significant SMB changes (Fig. 5).
We also consider whether moderate and strong El Niño events are associated with more consistent SMB responses. However, as for our analysis of extreme El Niño events, moderate and strong El Niño events do not cause significant and consistent regional SMB changes (Fig. S15). Interestingly, in Enderby Land (the sole catchment with a consistent positive SMB response to extreme El Niño events), we identify that the 1991/1992 strong El Niño event is associated with a positive SMB anomaly of 15 000 kg m−2, which is identified as an outlier in the region's density curves from Fig. 5 (Fig. S15).
Whilst this paper focuses primarily on SON, we also include DJF, MAM, and JJA results in Figs. S1–S3. An analysis of all seasons shows that SMB responses during extreme ENSO events are generally inconsistent, with individual events often exhibiting responses of opposing sign or of differing magnitudes during all seasons (Figs. 5 and S3–S5).
During DJF, we identify large positive cumulative SMB anomalies in Dronning Maud Land (2010/11), Enderby Land (1988/89), the Lambert–Amery System (1999/2000) and Princess Elizabeth Land (2007/08; Fig. S1). However, there is no consistent response during La Niña events (Fig. S1).
During both MAM and JJA, we find that there are no consistent responses between extreme El Niño events (comparing red triangles), strong La Niña events (comparing blue triangles), or CP El Niño events (comparing yellow circles; Figs. S4 and S5). During MAM, this is unsurprising because ENSO activity during these months tends to be insignificant (Trenberth, 1997). During JJA, positive SMB anomalies during different CP El Niño events are identified as outliers in Enderby Land and the Lambert–Amery System (Fig. S5). However, other CP El Niño events are associated with a range of SMB responses in these regions, reinforcing that this is not a consistent response (Fig. S5).
At the catchment scale, we find that SMB responses vary greatly between individual extreme ENSO events and that there are no consistent SMB responses between the three extreme El Niño events considered, except in Enderby Land, East Antarctica, where SMB anomalies are consistently positive (Fig. 5).
3.3 Statistical significance of SMB anomalies during extreme/strong ENSO events
Finally, we consider whether strong/extreme ENSO events are significantly different from moderate ENSO events in terms of SON SMB anomalies. Figures 6–8 show that there is no clear pattern indicating that strong/extreme ENSO events result in extreme SON SMB anomalies. That is, significant SON SMB responses to individual extreme El Niño events are evidenced in numerous individual catchments (Fig. 6). However, these changes are not consistent between events, with the “centres of action” for increased SMB occurring in different catchments during each El Niño event in the record (Fig. 6). Enderby Land is an exception, with statistically significant SON SMB increases occurring during all three extreme El Niño events (Fig. 6a). Enderby Land's average anomaly during these events is equivalent to approximately 32 % of the region's annual average SMB (Fig. 6a).
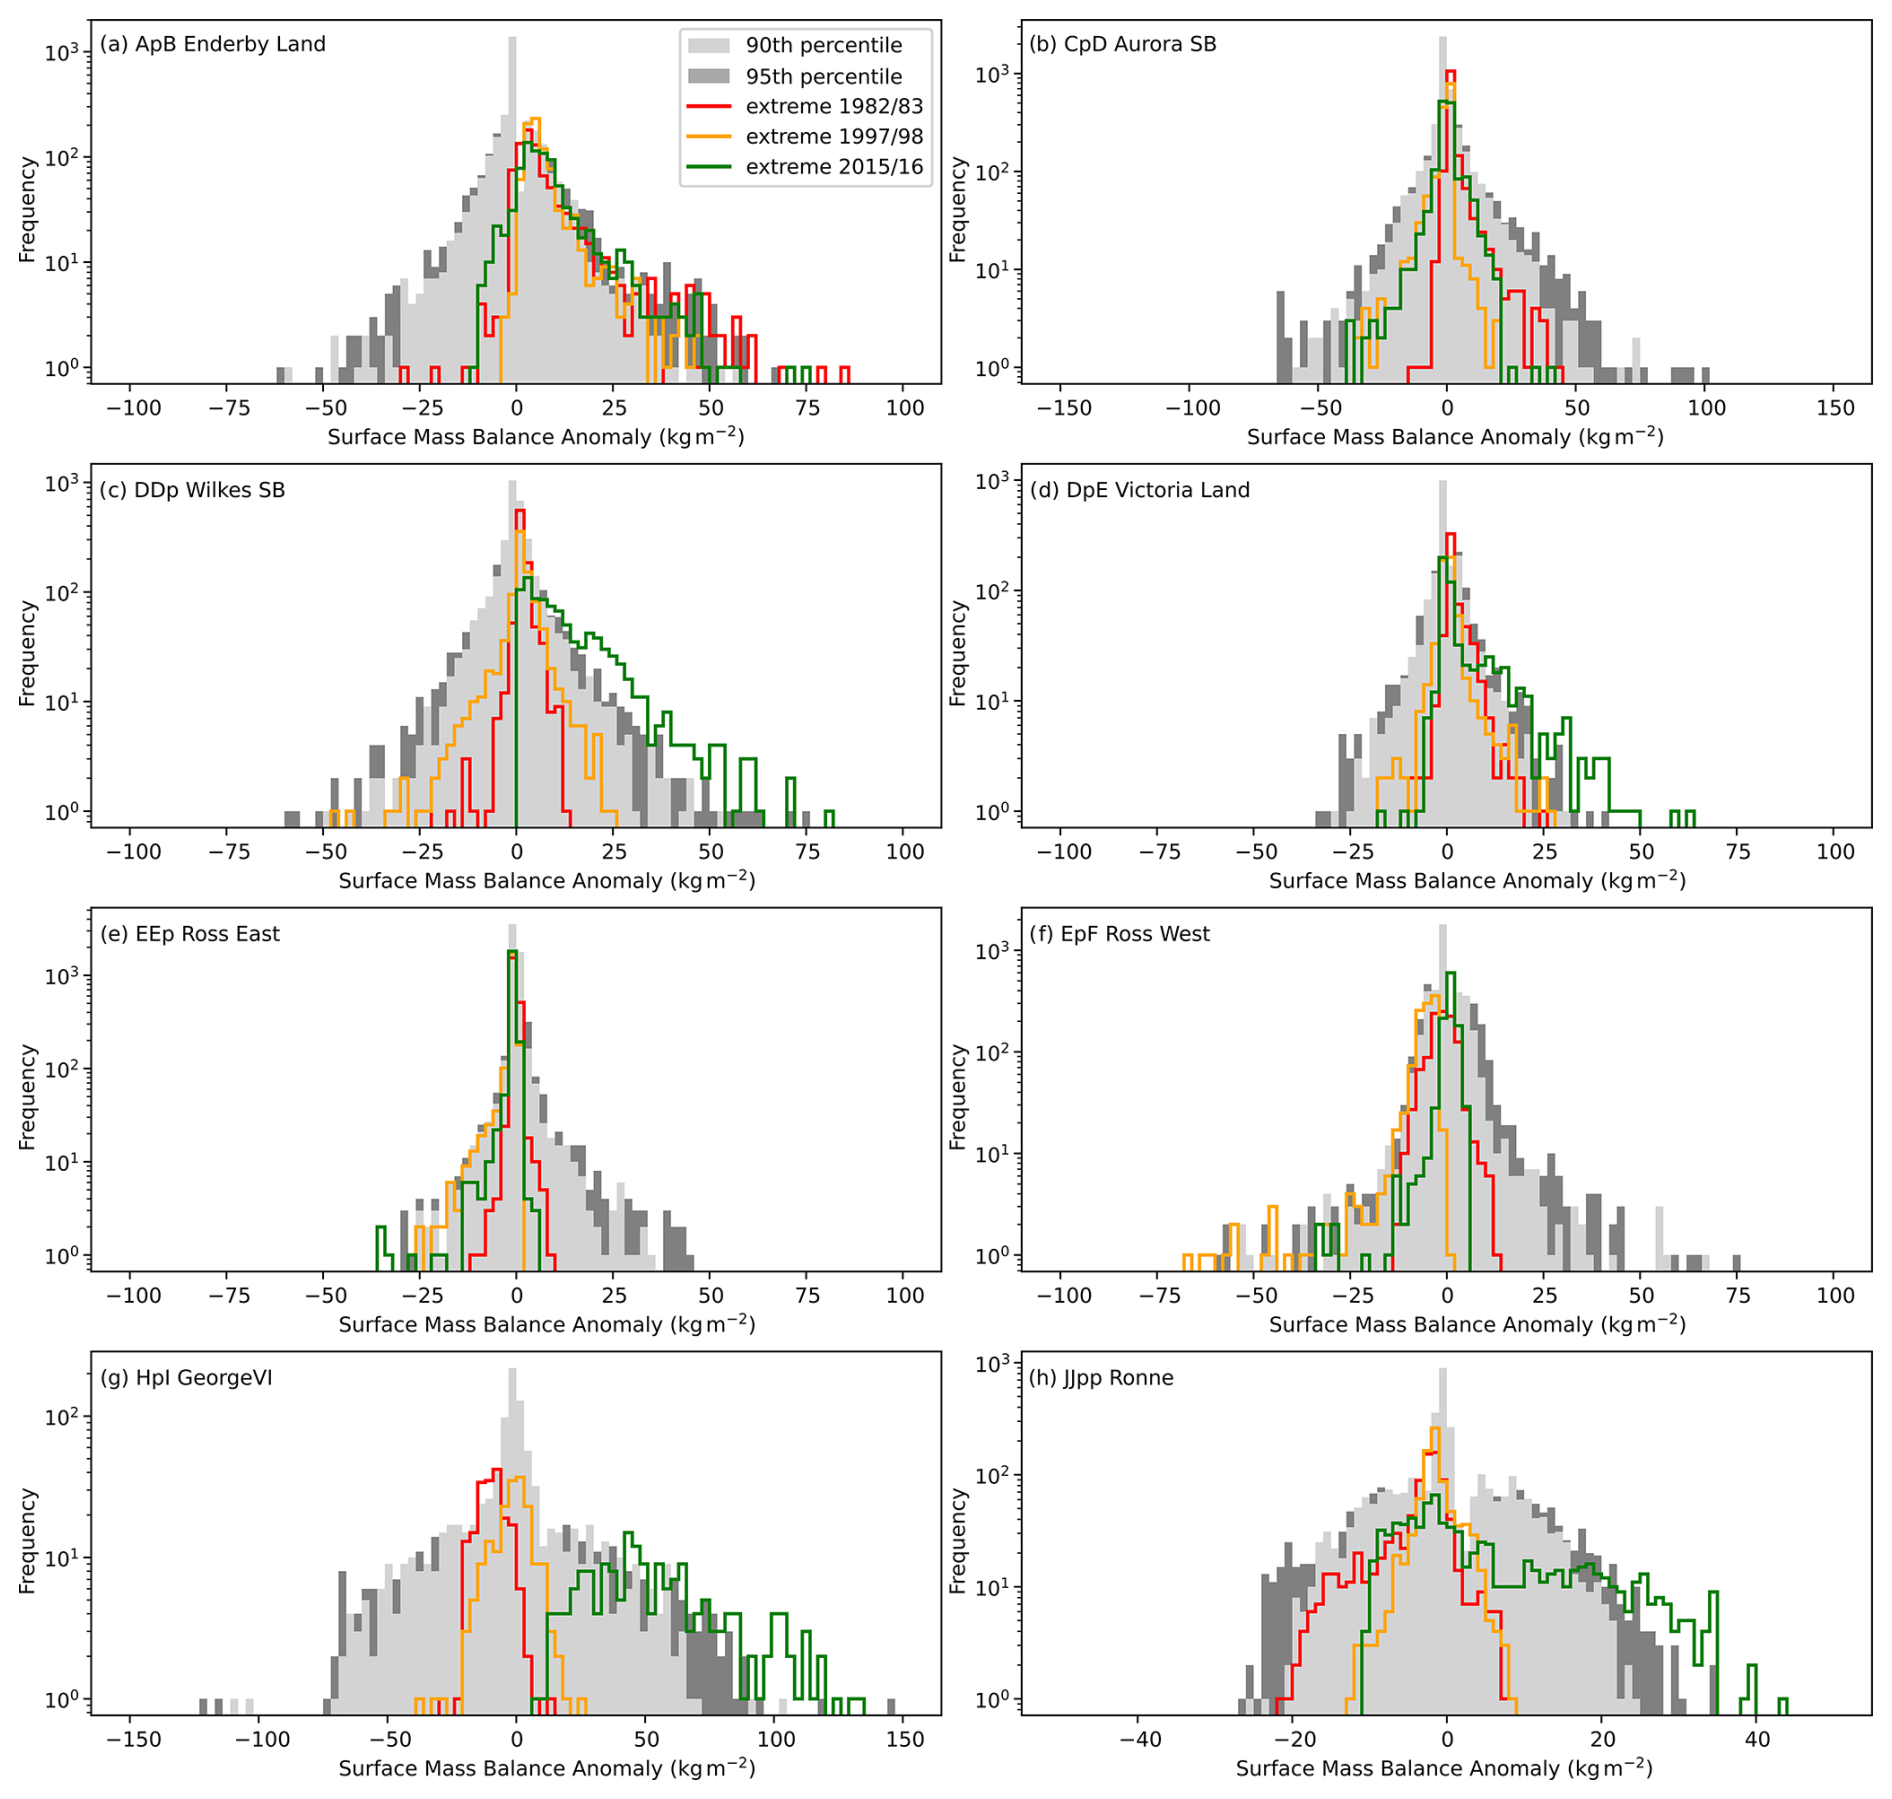
Figure 6Comparing probability distributions of regional Antarctic surface mass balance anomalies during extreme El Niño events. Probability distributions of SON SMB anomalies in Antarctic catchments with significant changes in SON during extreme El Niño events (1982/83 (red), 1997/98 (yellow), and 2015/16 (green)) and regional 90th- (light-grey shading) and 95th-percentile (dark-grey shading) regional SMB anomalies for SON for the 1979–2018 period. Only statistically significant regional results are shown at the 5 % confidence level using a two-sided Kolmogorov–Smirnov (K–S) test and Monte Carlo sampling (see Methods). Full results and two-sided Kolmogorov–Smirnov (K–S) tests are included in the Supplement (Figs. S8 and S9).
During the 2015/16 El Niño event, significant SMB changes are widespread across Antarctica: in the Enderby Land, Wilkes Subglacial Basin, Victoria Land, Ross East, George VI, and Ronne catchments (Fig. 6a, c–e, g, and h). The 2015/16 SMB probability distribution is shifted positively in all these catchments, except for in the Ross East catchment, where the SMB probability distribution is shifted negatively (Fig. 6a, c–e, g, and h). During the other two extreme El Niño events studied, significant SMB changes only occur in the Enderby Land (1982/83 and 1997/98; both probability distributions are shifted positively; Fig. 6a) and Ross West catchments (1997/98; probability distribution is shifted negatively; Fig. 6f). In all other catchments, SMB changes during extreme El Niño events are not significant (Figs. 6b and S9).
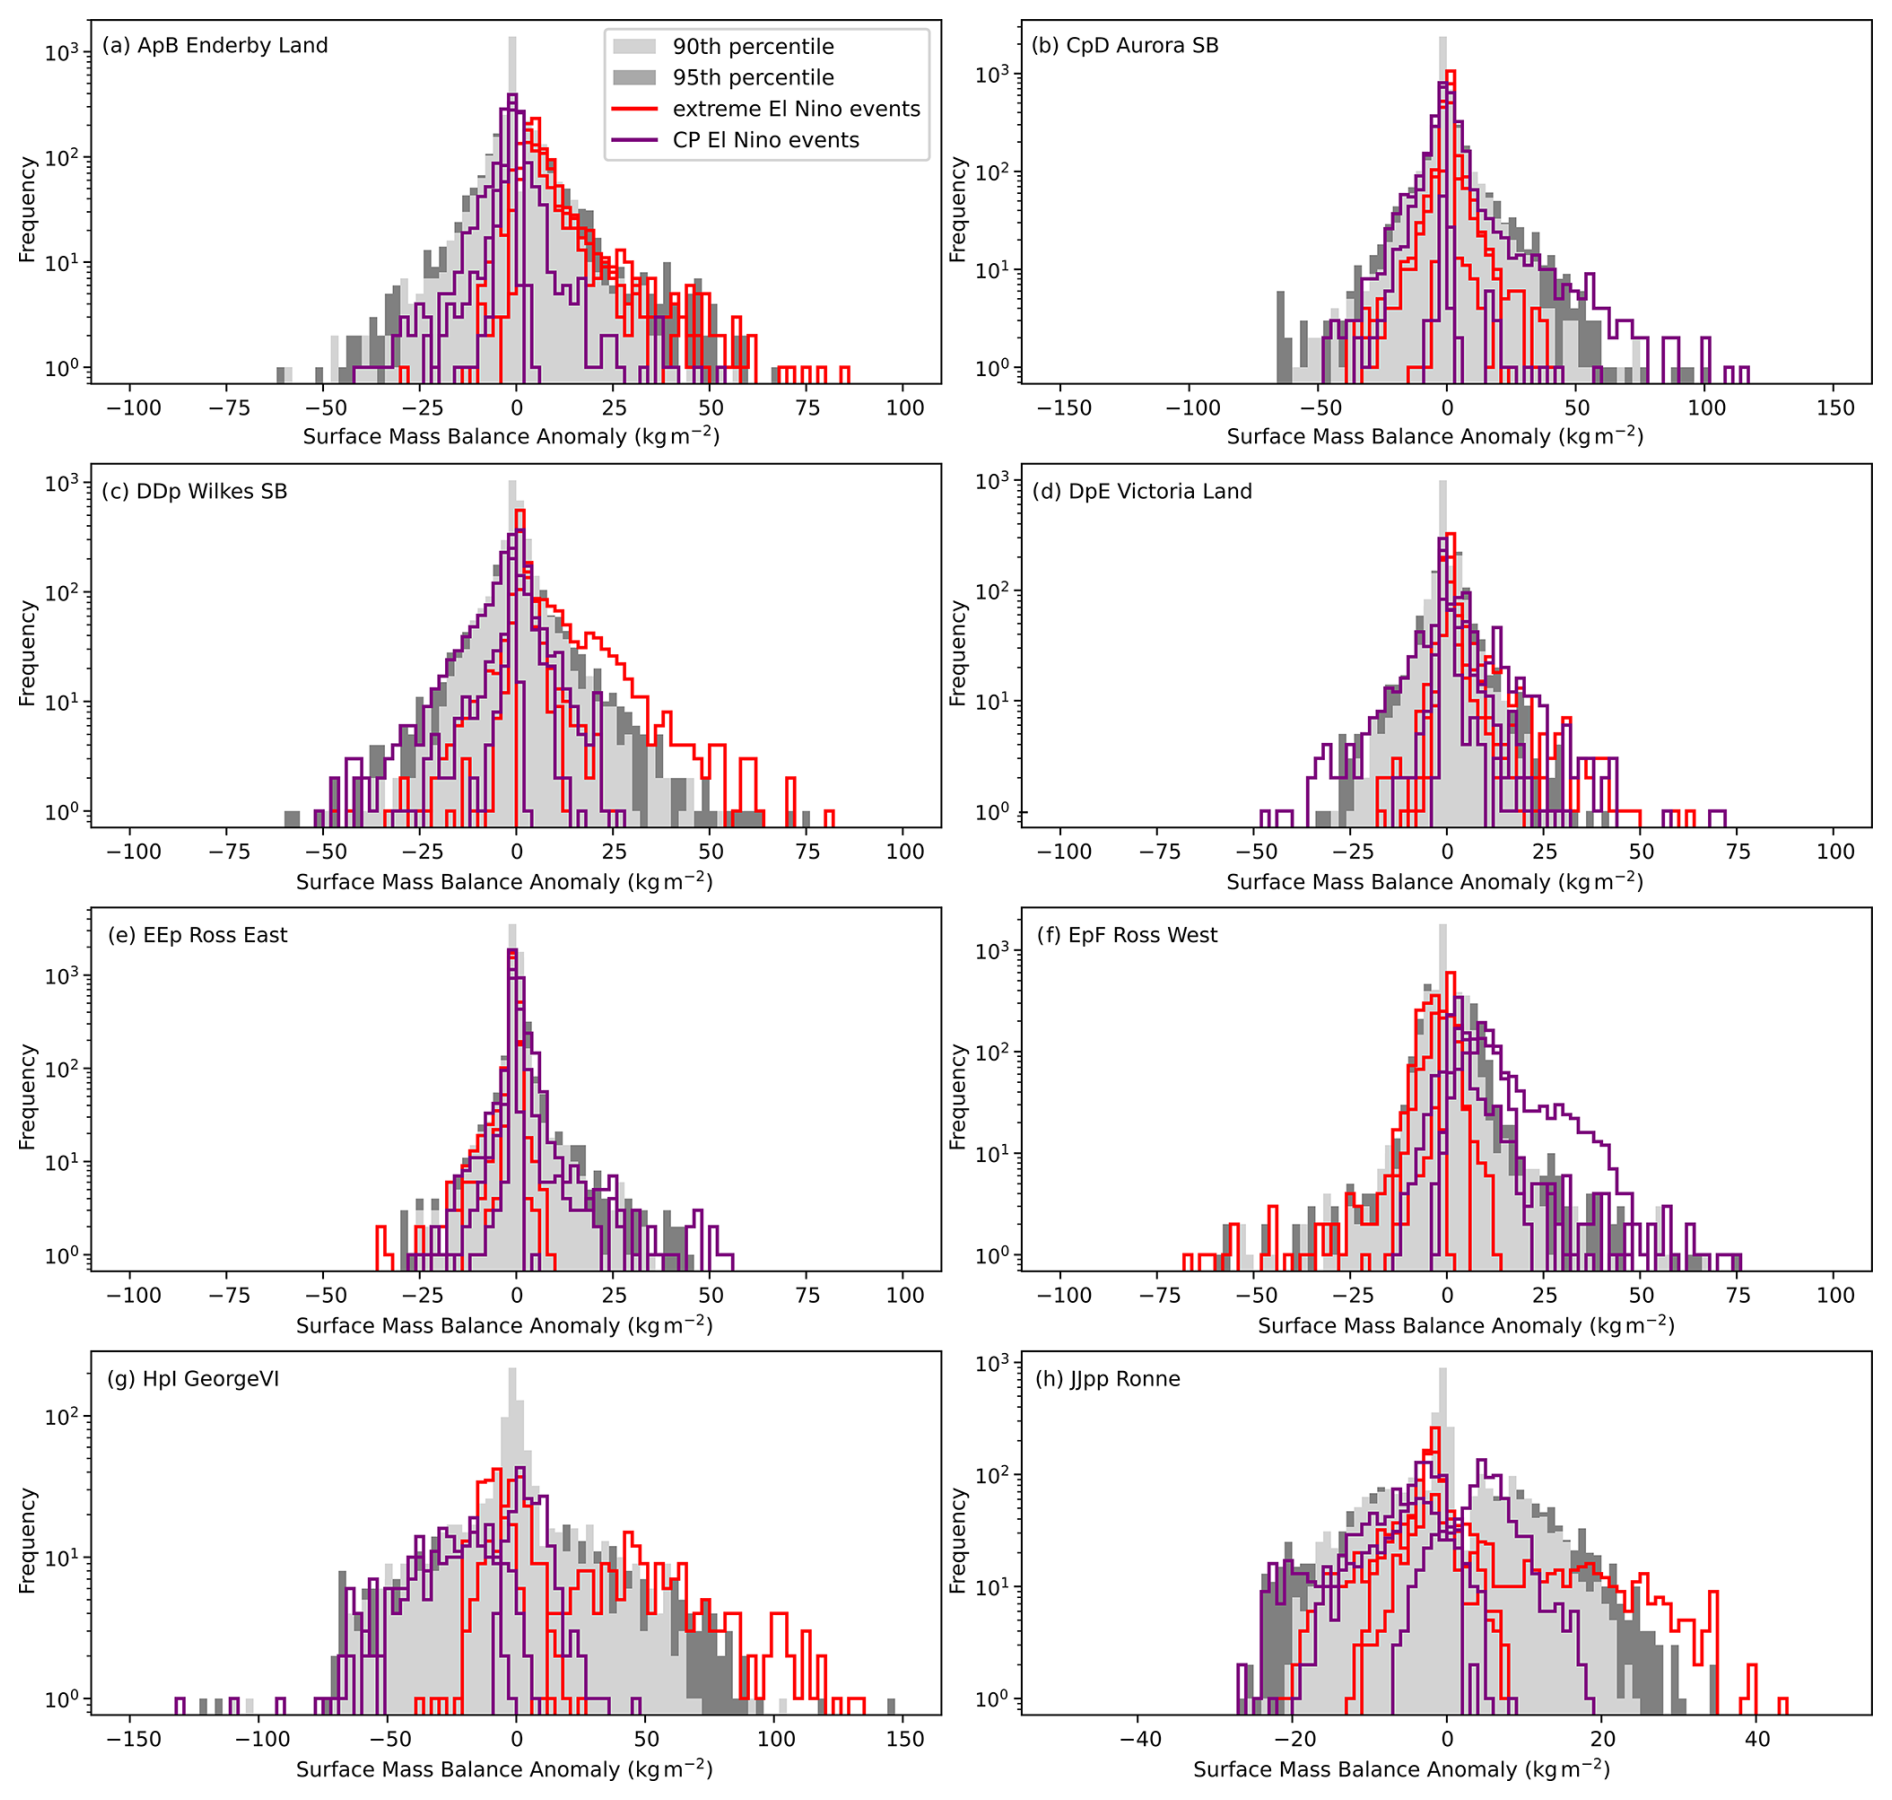
Figure 7Comparing probability distributions of regional Antarctic surface mass balance anomalies during extreme El Niño events and CP El Niño events. Probability distributions of SMB anomalies in Antarctic catchments with significant changes in SON for extreme El Niño events (red lines) and CP events (purple lines) and regional 90th- (light-grey shading) and 95th-percentile (dark-grey shading) SMB anomalies for SON for the 1979–2018 period. Only statistically significant regional results are shown at the 5 % confidence level using a two-sided Kolmogorov–Smirnov (K–S) test and Monte Carlo sampling (see Methods). Two-sided Kolmogorov–Smirnov (K–S) test results are included in the Supplement. Only regions with significant SMB changes are shown in the main text; SMB histograms for all other catchments are included in the Supplement (Fig. S9).
Significant SON SMB responses during CP El Niño are localised (in < 5 grid cells; Fig. 7). In the Aurora Subglacial Basin, Victoria Land, Ross East, and Ross West catchments, a shift in the SMB probability distribution during a CP El Niño event (2002/03 or 2009/10 dependent upon catchment) is larger than the SMB response during the 1982/83, 1997/98, and 2015/16 events (Figs. 7b, d–f and S9). Most other catchments do not show significant results during CP El Niño events (Fig. 7a, c, g, and h). Regional results with each extreme El Niño event and CP El Niño event distinguished are included in Fig. S9. Extreme El Niño and CP El Niño results are also significant when compared with the SMB anomaly distribution of moderate El Niño events in most catchments (Fig. S10). This highlights that the SMB changes we identify during extreme or CP El Niño events are not necessarily statistically significantly different to those of moderate El Niño events (Figs. 6, 7, and S3–S5).
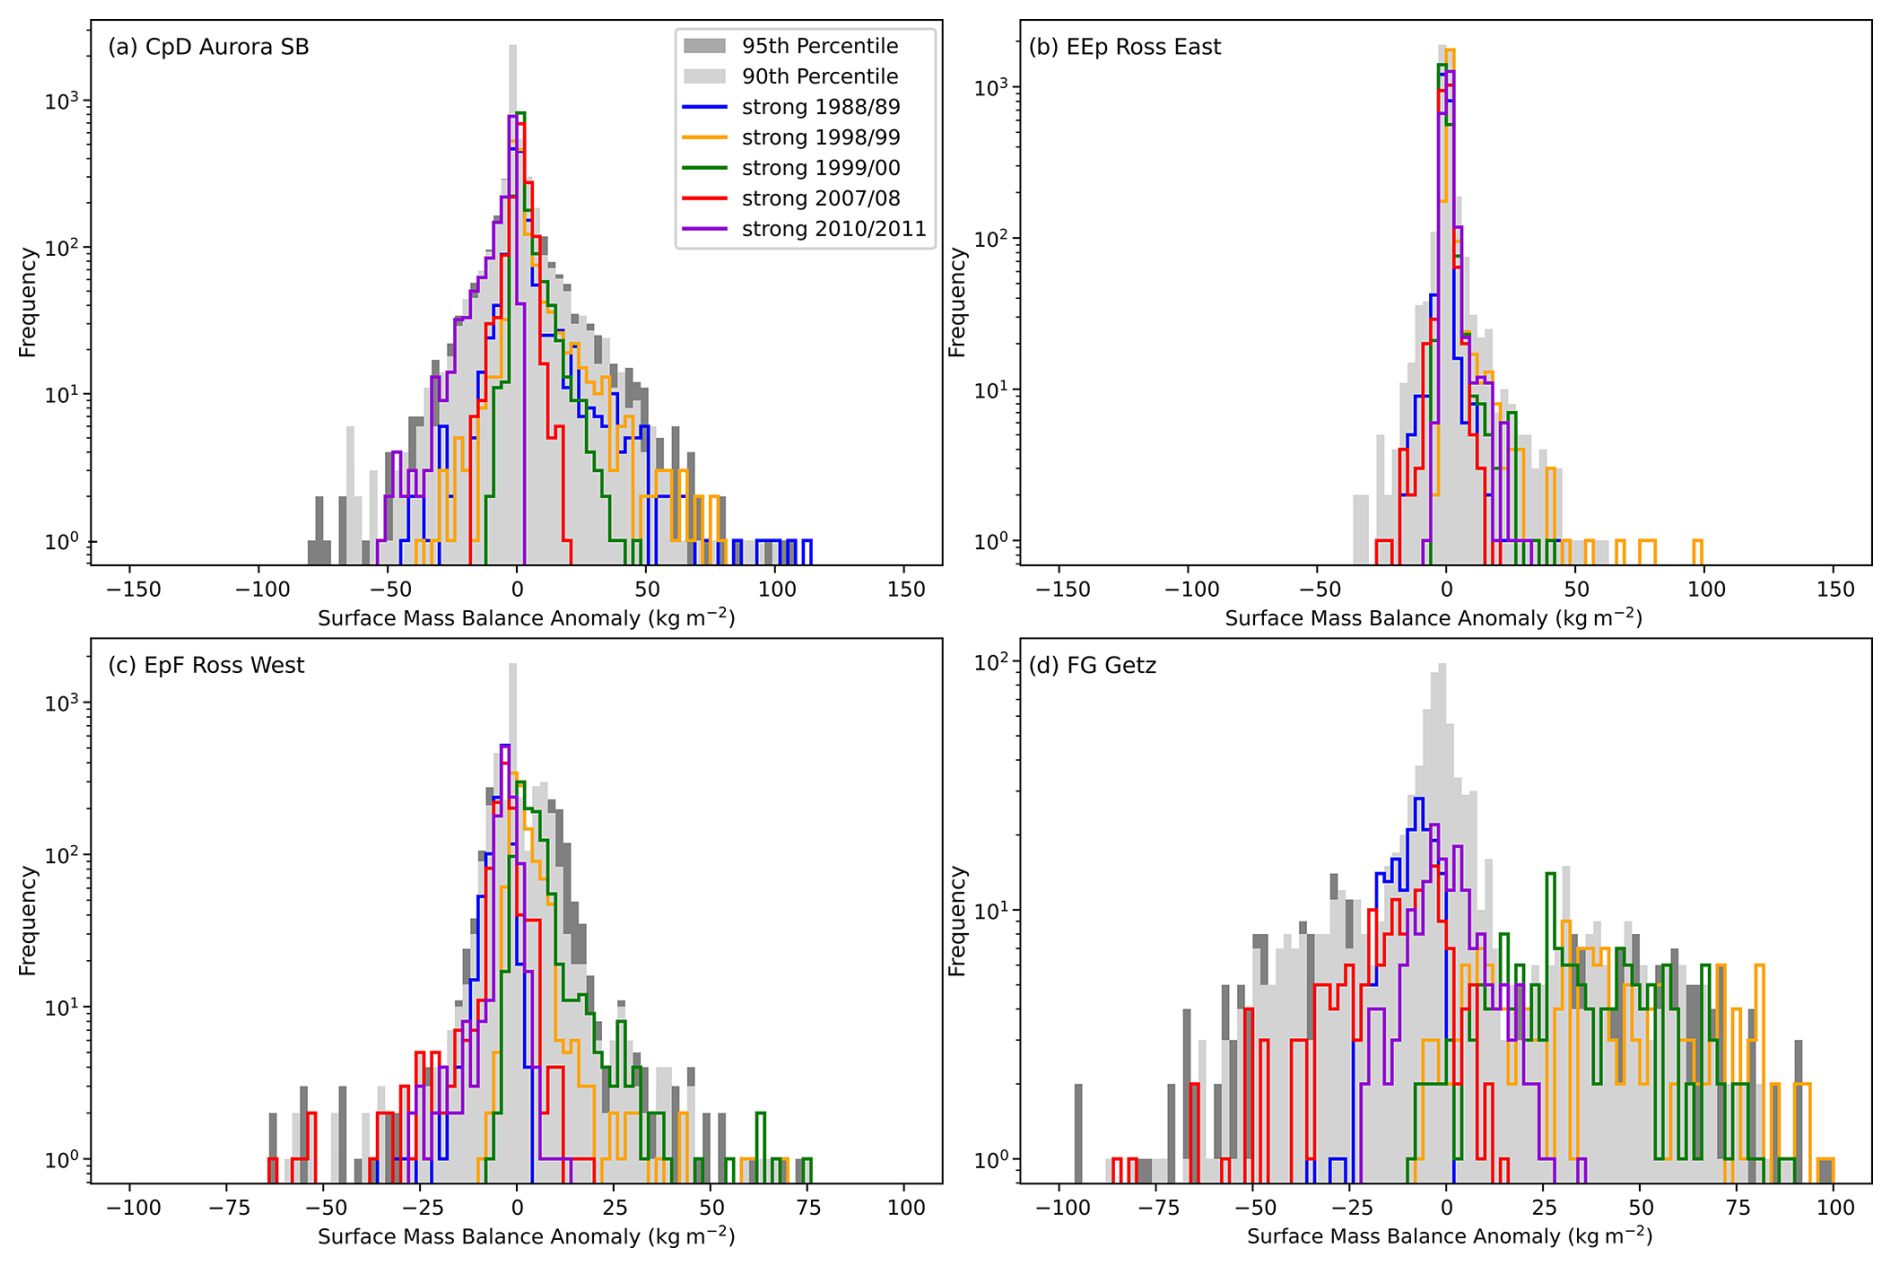
Figure 8Comparing probability distributions of regional Antarctic surface mass balance anomalies during strong La Niña events. Probability distributions of SMB anomalies in Antarctic catchments with significant changes in SON for strong La Niña events in 1988/89 (blue), 1998/99 (yellow), 1999/2000 (green), 2007/08 (red), and 2010/11 (purple), along with regional 90th- (light-grey shading) and 95th-percentile (dark-grey shading) SMB anomalies for SON for the 1979–2018 period. Only statistically significant regional results are shown at the 5 % confidence level using a two-sided Kolmogorov–Smirnov (K–S) test and Monte-Carlo sampling (see Methods). Two-sided Kolmogorov–Smirnov (K–S) test results are included in the Supplement. Only regions with significant SMB changes are shown in the main text; SMB histograms for all other catchments are included in the Supplement (Fig. S12).
Few Antarctic catchments exhibit significant SMB anomalies during strong La Niña events (Figs. 8 and S12). Similar SMB changes occur during moderate and strong La Niña events (Fig. S13). Significant SMB changes during strong La Niña events only extend beyond the moderate La Niña SMB anomaly distribution in the Wilkes Subglacial Basin, Victoria Land, and Ross East catchments (Fig. S13). This highlights that the mass balance changes during strong La Niña events across almost all of Antarctica are not extreme when compared to those of moderate La Niña events (Figs. 6, 7, and S3–S5).
Annual SMB anomalies during extreme El Niño events are less significant than their SON equivalent (Fig. S11). Annual SMB anomalies during strong La Niña events are similar to those in SON (Fig. S14). This highlights that the contribution of extreme/strong ENSO events relative to the yearly SMB budget is not necessarily extreme or significant in many Antarctic catchments.
In summary, most SMB responses during the three extreme El Niño events identified are not significantly different from background and average conditions (Figs. 6 and 7). However, SMB responses during the 2015/16 El Niño event are statistically different from both background conditions and moderate ENSO event SMB changes in numerous catchments in East Antarctica and West Antarctica and on the Peninsula (Figs. 6 and 7). Conversely, during strong La Niña events, we do not see evidence of a consistent and significant SMB response (Fig. 8).
Here, we have considered Antarctic SMB anomalies during extreme ENSO events in the historical record to determine if extreme ENSO events are associated with extreme SMB changes in Antarctica. We find that the 2015/16 extreme El Niño event was associated with more widespread and significant SMB changes than other extreme ENSO events. This is consistent with previously noted impacts on Antarctica (Bodart and Bingham, 2019) and the fact that 2015/16 is the most extreme El Niño event over the past 40 years (Bell et al., 2015).
However, beyond the 2015/16 event and Enderby Land, our results show that extreme changes in Antarctic climate and SMB do not occur during extreme ENSO events. That is, we identify differences in the spatial patterns and magnitude of event-to-event responses. Whilst regional changes in SLP, temperature, precipitation, and SMB occur during extreme ENSO events, these changes often differ between events, and anomalies during these events are not statistically different from “baseline” conditions or moderate ENSO events. Rossby wave analysis of each extreme ENSO event also shows differences between events (Figs. S1 and S2 and Sect. S4). However, we do not include in-depth analysis of the difference between each extreme ENSO event development. This is because other work has previously compared extreme ENSO events in greater depth, including ENSO formation and development, and event diversity and intensity (Cai et al., 2014; L'Heureux et al., 2017; Santoso et al., 2017; Xue and Kumar, 2017). Enderby Land is an exception and exhibits a consistent response to the three extreme El Niño events in Antarctica in SON; all other catchments do not. These findings are supported by the considerable variability in ENSO, with differing teleconnections between events (Ciasto et al., 2015; Yuan et al., 2018; Yiu and Maycock, 2020).
4.1 Extreme ENSO events and moderate ENSO events
In many Antarctic catchments, the SMB response differs greatly between the ENSO events that we examined. We find that the magnitude and spatial patterns of these differences are so great that these changes are not consistent between events and the composite is not representative. The addition of strong and moderate El Niño events to our analysis, although increasing the number of events analysed, does not result in a more consistent ENSO signal in SMB. All Antarctic catchments exhibit inconsistent and differing SMB responses between moderate, strong, and extreme El Niño events. Moderate and strong La Niña events are also associated with a range of inconsistent SMB responses during these events. However, when extreme El Niño event SMB changes are compared to SMB changes during moderate El Niño events, SMB responses are significantly different from one another in the Enderby Land, Wilkes Subglacial Basin, Victoria Land, Ross East, Ross West, Getz, Amundsen Sea, Abbott, George VI, and Ronne catchments. However, these results are not consistent across all three extreme El Niño events studied (other than in Enderby Land). Santoso et al. (2017) and Srinivas et al. (2024) suggest that such findings relate to the non-linear nature of extreme ENSO events, driven by the convective response to extreme tropical Pacific SST anomalies and resultant Rossby wave propagation.
Conversely, numerous other catchments exhibit similar SMB responses when extreme and moderate El Niño event SMB changes are compared. That is, the SMB changes during extreme ENSO events do not differ from those during moderate events in the Dronning Maud Land, Lambert–Amery System, Princess Elizabeth Land, Aurora Subglacial Basin, West Graham Land, Larsen, Filchner, and Coats catchments. Analysis of moderate and strong El Niño events also identifies that regional SMB changes in Antarctica are indistinguishable during moderate, strong, and extreme El Niño events, except in Enderby Land. These findings support studies that have considered moderate and extreme ENSO event impacts together in analyses (e.g. Clem et al., 2018; Paolo et al., 2018; King et al., 2023), which suggests that the Antarctic response is not sensitive to the magnitude of ENSO events.
Smaller Antarctic SMB changes occur during strong La Niña events than during extreme El Niño events. This may be partially explained by the smaller amplitude and weaker Antarctic teleconnection of La Niña events when compared to El Niño events, which means these events are often also associated with smaller Antarctic impacts (Capotondi et al., 2015; Srinivas et al., 2024). Understanding the differences in the teleconnection dynamics between El Niño and La Niña events is an important area of research, but investigating the remote mechanisms of influence is beyond the scope of this study.
4.2 Extreme El Niño impacts in Enderby Land
Our findings support previous work showing that snowfall increases in Enderby Land during El Niño events (Reijmer and Broeke, 2003; Schlosser et al., 2008; Simon et al., 2024). We identify an SLP system and anomalous atmospheric circulation over the Indian sector of East Antarctica during each extreme El Niño event (Fig. 3e, f, i, j, m, and n). This circulation change causes warm onshore winds to extend into the Indian sector of Antarctica during these events, bringing moisture-laden air over the region, resulting in increased precipitation and SMB. Enderby Land is associated with SMB increases during each extreme El Niño event, despite differences in SLP and temperature anomalies between extreme El Niño events. This is because Enderby Land is located within the “centre of action” of an Indian sector circulation system (Schlosser et al., 2008; Marshall and Thompson, 2016; Marshall et al., 2017) that brings moist, warm air onshore (Schlosser et al., 2008; Marshall and Thompson, 2016; Marshall et al., 2017). Differences in SLP and temperature are associated with this atmospheric circulation system migrating east, west, or poleward during each El Niño event (Fig. 3).
During the 1982/83 event, a positive SLP anomaly extends from the Lambert–Amery System to Dronning Maud Land (Fig. 3e). This SLP anomaly shows a weakening of the low-pressure system in the Pacific sector, resulting in moisture-laden warm air extending across the whole Enderby Land catchment, causing precipitation and SMB increases (Fig. 3e–h). During the 1997/98 event, a stronger positive SLP anomaly extends over eastern Dronning Maud Land and across Enderby Land, and the SLP system further weakens along the Antarctic coastline relative to the 1982/83 event, resulting in an influx of moist air over the west of Enderby Land that drives precipitation and SMB increases in this region (Fig. 3i–l). Finally, during the 2015/16 event, a negative SLP anomaly extends across the Pacific sector of East Antarctica, inland and into the Lambert–Amery System, reaching the interior and eastern Enderby Land. This results from a strengthening and coastward shift in the low-pressure circulation system in the Indian sector (Marshall et al., 2017), causing extensive precipitation across the Lambert–Amery System and the entire catchment of Enderby Land (Fig. 3m–p). Therefore, each extreme El Niño event is associated with similar SMB responses, despite differences in the SLP responses (Fig. 3).
During the 1997/98 event, we find that a large positive SLP anomaly extends across the Indian sector, over Enderby Land and the eastern edge of the Dronning Maud Land catchment (Fig. 3m). This results in onshore moisture-laden winds over the region and subsequent precipitation (Fig. 3m–o), causing SMB increases across the entire Enderby Land catchment (extending inland) and the eastern edge of the Dronning Maud Land catchment (Fig. 3p). Our results agree with Boening et al. (2012), who showed an SLP anomaly caused blocking over the Dronning Maud Land and Enderby Land catchments during the 1997/98 event, which enabled storm tracks to extend to Dome Fuji (inland Enderby Land) and brought sustained snow accumulation to the region.
During the 1998/99 and 2010/11 strong La Niña events, we also identify negative SLP anomalies and associated increases in precipitation and SMB over Enderby Land (Fig. 4i and u). Boening et al. (2012) show that SLP anomalies occur over the Enderby Land catchment during the 2010/11 strong La Niña event, resulting in sustained precipitation along the Indian sector of the East Antarctic coastline. Our findings support Boening et al. (2012) and highlight that similar SLP systems and blocking processes could occur in the Ross and Amundsen/Bellingshausen sectors, depending upon the ASL location, and in the Weddell and Pacific sectors, where SLP anomalies are identified during La Niña events in our analysis.
These findings also highlight that El Niño and La Niña event impacts are not always reciprocal (Capotondi et al., 2015; Lieber et al., 2024). Therefore, if this teleconnection were to persist under future climate change, we expect that more frequent and intense ENSO extremes (no matter the polarity) will result in snow accumulation increases in Enderby Land.
Snow accumulation in inland Enderby Land is partially driven by short-term, high-magnitude precipitation events, which extend inland a few times each year (Reijmer and Broeke, 2003; Schlosser et al., 2008, 2010; Simon et al., 2024). These events develop due to the large-scale circulation, which facilitates the development of atmospheric rivers that funnel warm, moist air across the southern mid-latitudes to Antarctica, resulting in high, sustained precipitation (Turner et al., 2019; Wille et al., 2021, 2024). The sheer volume of snowfall during extreme Antarctic precipitation events can, in a matter of days, offset regional melting (Davison et al., 2023; Wille et al., 2024). Local and regional variability in circulation can therefore play an important role in SMB. Future research should consider the interactions between teleconnection dynamics and atmospheric river development, determining if ENSO events facilitate such extensive snowfall.
4.3 The 2015/16 El Niño event
The 2015/16 El Niño event was associated with significant SMB changes across Antarctica, consistent with previous research focusing only on this event (Bodart and Bingham, 2019). Our findings further show that the 2015/16 event stands out relative to previous events and that it is associated with more widespread and significant Antarctic SMB changes than during other extreme ENSO events. One reason for this may be because the 2015/16 extreme El Niño event displayed CP-type characteristics (Santoso et al., 2017; L'Heureux et al., 2017), which typically enhance snow accumulation in Antarctica compared with EP El Niño events (Macha et al., 2024).
In the Wilkes Subglacial Basin, the 2015/16 extreme El Niño was associated with SON SMB anomalies approximately 25 % larger than during any other year from 1979–2018. The 2015/16 event was the most extreme El Niño event during the past 40 years, with a larger SST anomaly magnitude than the 1982/83 and 1997/98 events (Santoso et al., 2017; L'Heureux et al., 2017). This magnitude difference was partially attributed to the 2015/16 event being initiated from a warmer tropical Pacific background state than the 1982/83 and 1997/98 events (Santoso et al., 2017), resulting in the higher magnitude and more widespread anomalies in Antarctica.
We find no apparent anthropogenic trend in the magnitude of the extremes in our analyses (Fig. S7). Some studies have suggested that the larger-magnitude SST anomaly of the 2015/16 El Niño event could indicate a change in ENSO behaviour due to climate change (e.g. Xue and Kumar, 2017; Cai et al., 2015b). Furthermore, a previous study (Medley and Thomas, 2019) could not rule out an anthropogenic driver of recent regional increases in snow accumulation. Attributing whether there is an anthropogenic signal in these extreme ENSO events and SMB anomalies is beyond the scope of this study and requires centennial-scale datasets to fully characterise ENSO variability (Stevenson et al., 2010).
4.4 Other drivers and future outlook for SMB
This study focuses on extreme ENSO events; however, we have not considered other patterns of climate variability that influence Antarctic climate on interannual, decadal, and interdecadal timescales (Fox-Kemper, et al., 2021). One such mode of climate variability is the Southern Annular Mode (SAM), which is known to influence the Antarctic climate and interact with ENSO (Fogt and Marshall, 2020; Medley and Thomas, 2019). For example, during the 1982/83 and 1997/98 extreme El Niño events, the SAM was in a negative phase, with weaker circumpolar westerly winds around Antarctica (Marshall, 2003), but, during the 2015/16 El Niño event, the SAM was in a very strong positive phase, leading to stronger and poleward-shifted westerly winds (Marshall, 2003; Vera and Osman, 2018; Bodart and Bingham, 2019; Noone et al., 1999; Reijmer and Broeke, 2003; Schlosser et al., 2008, 2010). These differing circumpolar wind anomaly patterns, alongside ENSO-driven anomalous atmospheric circulation, could explain some of the differences in precipitation and SMB anomalies we identify during the 1982/83, 1997/98, and 2015/16 events (Reijmer and Broeke, 2003; Schlosser et al., 2010; Fogt and Marshall, 2020). A recent study (King et al., 2023) shows that the SAM explains up to 24 % of Antarctic ice-mass trends since 2002, highlighting that the SAM almost certainly exerts an influence on our results and on extreme El Niño and strong La Niña events. Interestingly, the combination of an extreme El Niño event and positive-phase SAM in 2015/16 was unusual (Fogt et al., 2011; Fogt and Marshall, 2020), and this 2015/16 El Niño event was also substantially warmer than previous extreme El Niño events, resulting in unusual regional impacts in southern South America and on the Antarctic Peninsula (Vera and Osman, 2018). Here, we find the positive precipitation and SMB anomalies do extend further inland during the 2015/16 event than during the other two extreme El Niño events. This is somewhat unexpected, given that other studies suggest increased poleward moisture transport during negative-phase SAM, as weakened westerly winds enable the advection of synoptic systems over the continent, bringing precipitation (Schlosser et al., 2010; Fogt et al., 2011), and, in the austral spring of 2015, there was a positive SAM. Whether these anomalies may have been influenced by the warmer temperatures in 2015/16 – as a warmer atmosphere can hold more moisture and thus could be expected to transport it further inland – should be investigated.
Our analysis of Antarctic surface mass balance during extreme ENSO events is limited by the length of the datasets available. In this study, we utilise the full 40-year (1979–2018) temporal extent of RACMO2.3p3 (van Dalum et al., 2021). However, only a handful of extreme ENSO events occur in this period (three El Niños and five La Niñas). This period also includes both natural climate variability and anthropogenic forced change, which we are unable to separate due to the limited time series length of this analysis (Meredith et al., 2019; Fox-Kemper, et al., 2021). Adequately characterising the statistics of ENSO requires a record on the order of 1–2 centuries (Wittenberg, 2009; Stevenson et al., 2010), and this is not currently available. Future work utilising palaeoclimate reconstructions and climate model large ensemble simulations would increase the sample size and may reduce sampling bias (Wittenberg, 2009; Stevenson et al., 2010). Despite these limitations, our examination of SMB responses during the satellite era provides useful and preliminary insights into the impact of extreme ENSO events on Antarctica.
Projections of future ENSO characteristics remain uncertain, including how the teleconnection between the tropics and the poles could change under future climate change (Fox-Kemper, et al., 2021; Freund et al., 2024). Some CMIP6 model outputs suggest that extreme ENSO events may become more frequent in the future (Cai et al., 2023; Lieber et al., 2024). It is important to understand how Antarctica will respond in a future climate that is warmer and experiences greater extremes (Meredith et al., 2019). Our results show that extreme ENSO events do not result in large SMB changes across Antarctica. Whilst we do identify consistent and significant SMB changes in Enderby Land, this is the result of atmospheric circulation changes specific to this region. Therefore, whether increases in extreme ENSO events in the future could lead to significant impacts on Antarctica's surface climate is dependent upon how the teleconnection to Antarctica changes (McGregor et al., 2022; Cai et al., 2023). If future El Niño events were to resemble the 2015/16 El Niño event, the resulting increased accumulation could offset some of the ocean-driven melting in Antarctica, reducing mass loss (Huguenin et al., 2024).
We use reanalysis-forced regional climate model output alongside reanalysis data to quantify the impact of the largest ENSO events of the late 20th and early 21st centuries on Antarctica's surface mass balance. Based on our analysis, the Antarctic SMB response to ENSO events does not seem to be sensitive to the magnitude of ENSO events, except in Enderby Land and during the 2015/16 event. We show a consistent and significant increase in SMB over Enderby Land during all extreme El Niño events over the satellite record. The annual average anomaly during the largest events (1982/83, 1997/98, and 2015/16) is equivalent to approximately 32 % of the annual average surface mass balance in Enderby Land. In all other Antarctic catchments during all three extreme El Niño events over the satellite record, the surface mass balance changes differ between individual events. The 2015/16 extreme El Niño event stands out and is associated with widespread and significant surface mass balance changes. Hence, our results suggest that extreme ENSO events have not had an extreme impact on Antarctic surface mass balance for most catchments over the satellite era.
All datasets are freely available. Regional Atmospheric Climate Model version 2.3p3 output 2 m atmospheric temperature, precipitation, and surface mass balance are available in van Dalum et al. (2021) (https://doi.org/10.26180/27092830.v1) and online at https://doi.org/10.5281/zenodo.7639053 (van Dalum et al., 2021). The Python code used to undertake this analysis can be accessed online at https://doi.org/10.26180/27092830.v1 (Macha, 2025). ERA5 reanalysis data including mean sea-level pressure are available in Hersbach et al. (2020). Catchment basins are available in Rignot et al. (2011). SST anomalies to calculate the El Niño indices Niño-3.4, Niño-3, and Niño-4 are available in Rayner (2003).
The supplement related to this article is available online at https://doi.org/10.5194/tc-19-1915-2025-supplement.
JMAM conceived the concept of the study, performed the analysis, and wrote the paper. All other authors provided guidance at each stage and were included in discussions, with each author contributing to the editorial review of the paper.
At least one of the (co-)authors is a member of the editorial board of The Cryosphere. The peer-review process was guided by an independent editor, and the authors also have no other competing interests to declare.
Publisher's note: Copernicus Publications remains neutral with regard to jurisdictional claims made in the text, published maps, institutional affiliations, or any other geographical representation in this paper. While Copernicus Publications makes every effort to include appropriate place names, the final responsibility lies with the authors.
We would like to thank the editor and reviewers for their time and insightful comments, which have helped strengthen the paper.
Jessica M. A. Macha, Andrew N. Mackintosh, Felicity S. McCormack, Ariaan Purich, Helen V. McGregor, and Benjamin J. Henley were supported by the Australian Research Council Special Research Initiative for Securing Antarctica's Environmental Future (grant no. SR200100005). Jessica M. A. Macha was supported by the Monash Graduate Scholarship (MGS) and the Monash International Tuition Scholarship (MITS). Felicity S. McCormack was supported by an Australian Research Council Discovery Early Career Research Award (grant no. DE210101433). Christiaan T. van Dalum was supported under EU Horizon 2020 (PROTECT grant no. 869304).
This paper was edited by Masashi Niwano and reviewed by Christoph Kittel and one anonymous referee.
Ambrizzi, T., Hoskins, B. J., and Hsu, H.-H.: Rossby Wave Propagation and Teleconnection Patterns in the Austral Winter, J. Atmos. Sci., 52, 3661–3672, https://doi.org/10.1175/1520-0469(1995)052<3661:RWPATP>2.0.CO;2, 1995. a, b, c
Ashok, K., Nakamura, H., and Yamagata, T.: Impacts of ENSO and Indian Ocean Dipole Events on the Southern Hemisphere Storm-Track Activity during Austral Winter, J. Climate, 20, 3147–3163, https://doi.org/10.1175/JCLI4155.1, 2007. a
Bell, G., Halpert, M., and L’Heureux., M.: The Tropics, [in 'State of the Climate in 2015'], edited by: Diamond, H. and Schreck, C., Bull. Am. Meteorol. Soc., 97, S173–S226, https://doi.org/10.1175/2016BAMSStateoftheClimate.1, 2015. a
Bodart, J. and Bingham, R.: The Impact of the Extreme 2015–2016 El Niño on the Mass Balance of the Antarctic Ice Sheet, Geophys. Res. Lett., 46, 13862–13871, https://doi.org/10.1029/2019GL084466, 2019. a, b, c, d, e, f
Boening, C., Lebsock, M., Landerer, F., and Stephens, G.: Snowfall-driven Mass Change on the East Antarctic Ice Sheet, Geophys. Res. Lett., 39, 2012GL053316, https://doi.org/10.1029/2012GL053316, 2012. a, b, c, d
Cai, W., Borlace, S., Lengaigne, M., Van Rensch, P., Collins, M., Vecchi, G., Timmermann, A., Santoso, A., McPhaden, M. J., Wu, L., England, M. H., Wang, G., Guilyardi, E., and Jin, F.-F.: Increasing Frequency of Extreme El Niño Events Due to Greenhouse Warming, Nat. Clim. Change, 4, 111–116, https://doi.org/10.1038/nclimate2100, 2014. a, b
Cai, W., Santoso, A., Wang, G., Yeh, S.-W., An, S.-I., Cobb, K. M., Collins, M., Guilyardi, E., Jin, F.-F., Kug, J.-S., Lengaigne, M., McPhaden, M. J., Takahashi, K., Timmermann, A., Vecchi, G., Watanabe, M., and Wu, L.: ENSO and Greenhouse Warming, Nat. Clim. Change, 5, 849–859, https://doi.org/10.1038/nclimate2743, 2015a. a
Cai, W., Wang, G., Santoso, A., McPhaden, M. J., Wu, L., Jin, F.-F., Timmermann, A., Collins, M., Vecchi, G., Lengaigne, M., England, M. H., Dommenget, D., Takahashi, K., and Guilyardi, E.: Increased Frequency of Extreme La Niña Events under Greenhouse Warming, Nat. Clim. Change, 5, 132–137, https://doi.org/10.1038/nclimate2492, 2015b. a, b
Cai, W., Ng, B., Geng, T., Jia, F., Wu, L., Wang, G., Liu, Y., Gan, B., Yang, K., Santoso, A., Lin, X., Li, Z., Liu, Y., Yang, Y., Jin, F.-F., Collins, M., and McPhaden, M. J.: Anthropogenic Impacts on Twentieth-Century ENSO Variability Changes, Nature Reviews Earth & Environment, 4, 407–418, https://doi.org/10.1038/s43017-023-00427-8, 2023. a, b
Capotondi, A., Wittenberg, A. T., Newman, M., Di Lorenzo, E., Yu, J.-Y., Braconnot, P., Cole, J., Dewitte, B., Giese, B., Guilyardi, E., Jin, F.-F., Karnauskas, K., Kirtman, B., Lee, T., Schneider, N., Xue, Y., and Yeh, S.-W.: Understanding ENSO Diversity, B. Am. Meteorol. Soc., 96, 921–938, https://doi.org/10.1175/BAMS-D-13-00117.1, 2015. a, b, c
Changnon, S. A.: Impacts of 1997–98 El Niño Generated Weather in the United States, B. Am. Meteorol. Soc., 80, 1819–1827, https://doi.org/10.1175/1520-0477(1999)080<1819:IOENOG>2.0.CO;2, 1999. a
Ciasto, L. M., Simpkins, G. R., and England, M. H.: Teleconnections between Tropical Pacific SST Anomalies and Extratropical Southern Hemisphere Climate, J. Climate, 28, 56–65, https://doi.org/10.1175/JCLI-D-14-00438.1, 2015. a, b
Clem, K. R., Renwick, J. A., and McGregor, J.: Large-Scale Forcing of the Amundsen Sea Low and Its Influence on Sea Ice and West Antarctic Temperature, J. Climate, 30, 8405–8424, https://doi.org/10.1175/JCLI-D-16-0891.1, 2017. a
Clem, K. R., Renwick, J. A., and McGregor, J.: Autumn Cooling of Western East Antarctica Linked to the Tropical Pacific: ENSO and East Antarctic Climate, J. Geophys. Res.-Atmos., 123, 89–107, https://doi.org/10.1002/2017JD027435, 2018. a, b
Cullather, R. I., Bromwich, D. H., and Van Woert, M. L.: Interannual Variations in Antarctic Precipitation Related to El Niño-Southern Oscillation, J. Geophys. Res.-Atmos., 101, 19109–19118, https://doi.org/10.1029/96JD01769, 1996. a
Davison, B. J., Hogg, A. E., Rigby, R., Veldhuijsen, S., Van Wessem, J. M., Van Den Broeke, M. R., Holland, P. R., Selley, H. L., and Dutrieux, P.: Sea Level Rise from West Antarctic Mass Loss Significantly Modified by Large Snowfall Anomalies, Nat. Commun., 14, 1479, https://doi.org/10.1038/s41467-023-36990-3, 2023. a
Fogt, R. L. and Marshall, G. J.: The Southern Annular Mode: Variability, Trends, and Climate Impacts across the Southern Hemisphere, WIREs Clim. Change, 11, e652, https://doi.org/10.1002/wcc.652, 2020. a, b, c
Fogt, R. L., Bromwich, D. H., and Hines, K. M.: Understanding the SAM Influence on the South Pacific ENSO Teleconnection, Clim. Dynam., 36, 1555–1576, https://doi.org/10.1007/s00382-010-0905-0, 2011. a, b
Fox-Kemper, B., Hewitt, H. T., Xiao, C., Aðalgeirsdóttir, G., Drijfhout, S. S., Edwards, T. L., Golledge, N. R., Hemer, M., Kopp, R. E., Krinner, G., Mix, A., Notz, D., Nowicki, S., Nurhati, I. S., Ruiz, L., Sallée, J.-B., Slangen, A. B. A., and Yu, Y.: Ocean, Cryosphere and Sea Level Change, in: Climate Change 2021: The Physical Science Basis. Contribution of Working Group I to the Sixth Assessment Report of the Intergovernmental Panel on Climate Change, edited by: Masson-Delmotte, V., Zhai, P., Pirani, A., Connors, S. L., Péan, C., Berger, S., Caud, N., Chen, Y., Goldfarb, L., Gomis, M. I., Huang, M., Leitzell, K., Lonnoy, E., Matthews, J. B. R., Maycock, T. K., Waterfield, T., Yelekçi, O., Yu, R., and Zhou, B., Cambridge University Press, Cambridge, United Kingdom and New York, NY, USA, 1211–1362, https://doi.org/10.1017/9781009157896.011, 2021. a, b, c, d
Freund, M. B., Brown, J. R., Marshall, A. G., Tozer, C. R., Henley, B. J., Risbey, J. S., Ramesh, N., Lieber, R., and Sharmila, S.: Interannual ENSO Diversity, Transitions, and Projected Changes in Observations and Climate Models, Environ. Res. Lett., 19, 114005, https://doi.org/10.1088/1748-9326/ad78db, 2024. a
Goodwin, B. P., Mosley-Thompson, E., Wilson, A. B., Porter, S. E., and Sierra-Hernandez, M. R.: Accumulation Variability in the Antarctic Peninsula: The Role of Large-Scale Atmospheric Oscillations and Their Interactions, J. Climate, 29, 2579–2596, https://doi.org/10.1175/JCLI-D-15-0354.1, 2016. a
Guo, Z., Bromwich, D., and Hines, K.: Modeled Antarctic Precipitation. Part II: ENSO Modulation over West Antarctica., J. Climate, 17, 448–465, https://doi.org/10.1175/1520-0442(2004)017<0448:MAPPIE>2.0.CO;2, 2004. a
Hammersley, J. M. and Handscomb, D. C.: Monte Carlo Methods, Springer Netherlands, Dordrecht, https://doi.org/10.1007/978-94-009-5819-7, 1964. a
Hersbach, H., Bell, B., Berrisford, P., Hirahara, S., Horányi, A., Muñoz-Sabater, J., Nicolas, J., Peubey, C., Radu, R., Schepers, D., Simmons, A., Soci, C., Abdalla, S., Abellan, X., Balsamo, G., Bechtold, P., Biavati, G., Bidlot, J., Bonavita, M., Chiara, G., Dahlgren, P., Dee, D., Diamantakis, M., Dragani, R., Flemming, J., Forbes, R., Fuentes, M., Geer, A., Haimberger, L., Healy, S., Hogan, R. J., Hólm, E., Janisková, M., Keeley, S., Laloyaux, P., Lopez, P., Lupu, C., Radnoti, G., Rosnay, P., Rozum, I., Vamborg, F., Villaume, S., and Thépaut, J.-N.: The ERA5 Global Reanalysis, Q. J. Roy. Meteor. Soc., 146, 1999–2049, https://doi.org/10.1002/qj.3803, 2020. a, b, c, d, e
Huguenin, M. F., Holmes, R. M., Spence, P., and England, M. H.: Subsurface Warming of the West Antarctic Continental Shelf Linked to El Niño-Southern Oscillation, Geophys. Res. Lett., 51, e2023GL104518, https://doi.org/10.1029/2023GL104518, 2024. a, b, c
Jonkman, S. N.: Global Perspectives on Loss of Human Life Caused by Floods, Nat. Hazards, 34, 151–175, https://doi.org/10.1007/s11069-004-8891-3, 2005. a
King, M. A. and Christoffersen, P.: Major Modes of Climate Variability Dominate Nonlinear Antarctic Ice-Sheet Elevation Changes 2002–2020, Geophys. Res. Lett., 51, e2024GL108844, https://doi.org/10.1029/2024GL108844, 2024. a
King, M. A., Lyu, K., and Zhang, X.: Climate Variability a Key Driver of Recent Antarctic Ice-Mass Change, Nat. Geosci., 16, 1128–1135, https://doi.org/10.1038/s41561-023-01317-w, 2023. a, b, c
Kug, J.-S., Jin, F.-F., and An, S.-I.: Two Types of El Niño Events: Cold Tongue El Niño and Warm Pool El Niño, J. Climate, 22, 1499–1515, https://doi.org/10.1175/2008JCLI2624.1, 2009. a
Lee, S.-K., Wang, C., and Mapes, B. E.: A Simple Atmospheric Model of the Local and Teleconnection Responses to Tropical Heating Anomalies, J. Climate, 22, 272–284, https://doi.org/10.1175/2008JCLI2303.1, 2009. a, b
Lenaerts, J. T. M., Ligtenberg, S. R. M., Medley, B., Van de Berg, W. J., Konrad, H., Nicolas, J. P., Van Wessem, J. M., Trusel, L. D., Mulvaney, R., Tuckwell, R. J., Hogg, A. E., and Thomas, E. R.: Climate and Surface Mass Balance of Coastal West Antarctica Resolved by Regional Climate Modelling, Ann. Glaciol., 59, 29–41, https://doi.org/10.1017/aog.2017.42, 2018. a
L'Heureux, M. L., Takahashi, K., Watkins, A. B., Barnston, A. G., Becker, E. J., Di Liberto, T. E., Gamble, F., Gottschalck, J., Halpert, M. S., Huang, B., Mosquera-Vásquez, K., and Wittenberg, A. T.: Observing and Predicting the 2015/16 El Niño, B. Am. Meteorol. Soc., 98, 1363–1382, https://doi.org/10.1175/BAMS-D-16-0009.1, 2017. a, b, c, d, e, f
Lieber, R., Brown, J., King, A., and Freund, M.: Historical and Future Asymmetry of ENSO Teleconnections with Extremes, J. Climate, https://doi.org/10.1175/JCLI-D-23-0619.1, 2024. a, b, c, d
Liu, H., Jezek, K., Li, B., and Zhao, Z.: Radarsat Antarctic Mapping Project Digital Elevation Model, Version 2, Boulder, Colorado USA, NASA National Snow and Ice Data Center [data set], https://doi.org/10.5067/8JKNEW6BFRVD, 2001. a
Macha, J.: ENSO Extremes Python code used in Macha et al. (2024), The Cryosphere, Monash University [code and software], https://doi.org/10.26180/27092830.v1, 2025. a
Macha, J. M. A., Mackintosh, A. N., McCormack, F. S., Henley, B. J., McGregor, H. V., Van Dalum, C. T., and Purich, A.: Distinct Central and Eastern Pacific El Niño Influence on Antarctic Surface Mass Balance, Geophys. Res. Lett., 51, e2024GL109423, https://doi.org/10.1029/2024GL109423, 2024. a, b, c, d, e, f, g, h
Marshall, G. J.: Trends in the Southern Annular Mode from Observations and Reanalyses, J. Climate, 16, 4134–4143, https://doi.org/10.1175/1520-0442(2003)016<4134:TITSAM>2.0.CO;2, 2003. a, b
Marshall, G. J. and Thompson, D. W. J.: The Signatures of Large-scale Patterns of Atmospheric Variability in Antarctic Surface Temperatures, J. Geophys. Res.-Atmos., 121, 3276–3289, https://doi.org/10.1002/2015JD024665, 2016. a, b
Marshall, G. J., Thompson, D. W. J., and Broeke, M. R.: The Signature of Southern Hemisphere Atmospheric Circulation Patterns in Antarctic Precipitation, Geophys. Res. Lett., 44, 11580–11589, https://doi.org/10.1002/2017GL075998, 2017. a, b, c
McGregor, S., Cassou, C., Kosaka, Y., and Phillips, A. S.: Projected ENSO Teleconnection Changes in CMIP6, Geophys. Res. Lett., 49, L097511, https://doi.org/10.1029/2021GL097511, 2022. a
Medley, B. and Thomas, E. R.: Increased Snowfall over the Antarctic Ice Sheet Mitigated Twentieth-Century Sea-Level Rise, Nat. Clim. Change, 9, 34–39, https://doi.org/10.1038/s41558-018-0356-x, 2019. a, b
Meredith, M., Sommerkorn, M., Cassotta, S., Derksen, C., Ekaykin, A., Hollowed, A., Kofinas, G., Mackintosh, A., Melbourne-Thomas, J., Muelbert, M., Ottersen, G., Pritchard, H., and Schuur, E. A. G.: Polar Regions. in: IPCC Special Report on the Ocean and Cryosphere in a Changing Climate, edited by: Pörtner, H.-O., Roberts, D. C., Masson-Delmotte, V., Zhai, P., Tignor, M., Poloczanska, E., Mintenbeck, K., Alegría, A., Nicolai, M., Okem, A., Petzold, J., Rama, B., and Weyer, N. M., Cambridge University Press, Cambridge, UK and New York, NY, USA, 203–320, https://doi.org/10.1017/9781009157964.005, 2019. a, b, c
Mirza, M. M. Q., Warrick, R. A., Ericksen, N. J., and Kenny, G. J.: Are Floods Getting Worse in the Ganges, Brahmaputra and Meghna Basins?, Environ. Hazards-UK, 3, 37–48, https://doi.org/10.3763/ehaz.2001.0305, 2001. a
Mudelsee, M.: Climate Time Series Analysis: Classical Statistical and Bootstrap Methods, no. v.42 in Atmospheric and Oceanographic Sciences Library, Springer, Dordrecht; New York, 9783319044507, 2010. a
Ninno, C. D. and Dorosh, P. A.: Averting a Food Crisis: Private Imports and Public Targeted Distribution in Bangladesh after the 1998 Flood, Agr. Econ., 25, 337–346, https://doi.org/10.1111/j.1574-0862.2001.tb00213.x, 2001. a
Noone, D., Turner, J., and Mulvaney, R.: Atmospheric Signals and Characteristics of Accumulation in Dronning Maud Land, Antarctica, J. Geophys. Res.-Atmos., 104, 19191–19211, https://doi.org/10.1029/1999JD900376, 1999. a
Paolo, F. S., Padman, L., Fricker, H. A., Adusumilli, S., Howard, S., and Siegfried, M. R.: Response of Pacific-sector Antarctic Ice Shelves to the El Niño/Southern Oscillation, Nat. Geosci., 11, 121–126, https://doi.org/10.1038/s41561-017-0033-0, 2018. a, b, c, d, e, f
Raphael, M. N., Marshall, G. J., Turner, J., Fogt, R. L., Schneider, D., Dixon, D. A., Hosking, J. S., Jones, J. M., and Hobbs, W. R.: The Amundsen Sea Low: Variability, Change, and Impact on Antarctic Climate, B. Am. Meteorol. Soc., 97, 111–121, https://doi.org/10.1175/BAMS-D-14-00018.1, 2016. a
Rayner, N. A.: Global Analyses of Sea Surface Temperature, Sea Ice, and Night Marine Air Temperature since the Late Nineteenth Century, J. Geophys. Res., 108, 4407, https://doi.org/10.1029/2002JD002670, 2003. a, b, c
Reijmer, C. H. and Broeke, M. R. V. D.: Temporal and Spatial Variability of the Surface Mass Balance in Dronning Maud Land, Antarctica, as Derived from Automatic Weather Stations, J. Glaciol., 49, 512–520, https://doi.org/10.3189/172756503781830494, 2003. a, b, c, d
Ren, H.-L. and Jin, F.-F.: Niño Indices for Two Types of ENSO, Geophys. Res. Lett., 38, L04704, https://doi.org/10.1029/2010GL046031, 2011. a, b, c
Renwick, J. A. and Revell, M. J.: Blocking over the South Pacific and Rossby Wave Propagation, Mon. Weather Rev., 127, 2233–2247, https://doi.org/10.1175/1520-0493(1999)127<2233:BOTSPA>2.0.CO;2, 1999. a, b, c
Rignot, E., Mouginot, J., and Scheuchl, B.: Ice Flow of the Antarctic Ice Sheet, Science, 333, 1427–1430, https://doi.org/10.1126/science.1208336, 2011. a, b, c, d, e, f
Rignot, E., Mouginot, J., Scheuchl, B., Van Den Broeke, M., Van Wessem, M. J., and Morlighem, M.: Four Decades of Antarctic Ice Sheet Mass Balance from 1979–2017, P. Natl. Acad. Sci. USA, 116, 1095–1103, https://doi.org/10.1073/pnas.1812883116, 2019. a, b
Santoso, A., Mcphaden, M. J., and Cai, W.: The Defining Characteristics of ENSO Extremes and the Strong 2015/2016 El Niño, Rev. Geophys., 55, 1079–1129, https://doi.org/10.1002/2017RG000560, 2017. a, b, c, d, e, f, g, h, i, j
Sasgen, I., Dobslaw, H., Martinec, Z., and Thomas, M.: Satellite Gravimetry Observation of Antarctic Snow Accumulation Related to ENSO, Earth Pl. Sc. Lett., 299, 352–358, https://doi.org/10.1016/j.epsl.2010.09.015, 2010. a
Saunderson, D., Mackintosh, A. N., McCormack, F. S., Jones, R. S., and Van Dalum, C. T.: How Does the Southern Annular Mode Control Surface Melt in East Antarctica?, Geophys. Res. Lett., 51, e2023GL105475, https://doi.org/10.1029/2023GL105475, 2024. a
Schlosser, E., Duda, M. G., Powers, J. G., and Manning, K. W.: Precipitation Regime of Dronning Maud Land, Antarctica, Derived from Antarctic Mesoscale Prediction System (AMPS) Archive Data, J. Geophys. Res.-Atmos., 113, 2008JD009968, https://doi.org/10.1029/2008JD009968, 2008. a, b, c, d, e
Schlosser, E., Powers, J. G., Duda, M. G., Manning, K. W., Reijmer, C. H., and Van Den Broeke, M. R.: An Extreme Precipitation Event in Dronning Maud Land, Antarctica: A Case Study with the Antarctic Mesoscale Prediction System: Antarctic Precipitation Case Study, Polar Res., 29, 330–344, https://doi.org/10.1111/j.1751-8369.2010.00164.x, 2010. a, b, c, d
Simon, S., Turner, J., Thamban, M., Wille, J. D., and Deb, P.: Spatiotemporal Variability of Extreme Precipitation Events and Associated Atmospheric Processes Over Dronning Maud Land, East Antarctica, J. Geophys. Res.-Atmos., 129, e2023JD038993, https://doi.org/10.1029/2023JD038993, 2024. a, b
Smirnov, N.: Table for Estimating the Goodness of Fit of Empirical Distributions, Ann. Math. Stat., 19, 279–281, https://doi.org/10.1214/aoms/1177730256, 1948. a
Sponberg, K.: Compendium of Climate Variability. Office of Global Programs, NOAA, Silver Spring, MD, 1999. a
Srinivas, G., Vialard, J., Liu, F., Voldoire, A., Izumo, T., Guilyardi, E., and Lengaigne, M.: Dominant Contribution of Atmospheric Nonlinearities to ENSO Asymmetry and Extreme El Niño Events, Sci. Rep., 14, 8122, https://doi.org/10.1038/s41598-024-58803-3, 2024. a, b
Steig, E. J., Schneider, D. P., Rutherford, S. D., Mann, M. E., Comiso, J. C., and Shindell, D. T.: Warming of the Antarctic Ice-Sheet Surface since the 1957 International Geophysical Year, Nature, 457, 459–462, https://doi.org/10.1038/nature07669, 2009. a
Stevenson, S., Fox-Kemper, B., Jochum, M., Rajagopalan, B., and Yeager, S. G.: ENSO Model Validation Using Wavelet Probability Analysis, J. Climate, 23, 5540–5547, https://doi.org/10.1175/2010JCLI3609.1, 2010. a, b, c
Takahashi, K., Montecinos, A., Goubanova, K., and Dewitte, B.: ENSO Regimes: Reinterpreting the Canonical and Modoki El Niño, Geophys. Res. Lett., 38, L10704, https://doi.org/10.1029/2011GL047364, 2011. a
Trenberth, K. E.: The Definition of El Niño, B. Am. Meteorol. Soc., 78, 2771–2777, https://doi.org/10.1175/1520-0477(1997)078<2771:TDOENO>2.0.CO;2, 1997. a, b, c, d, e, f, g
Turner, J.: The El Niño-southern Oscillation and Antarctica: ENSO and the Antarctic, Int. J. Climatol., 24, 1–31, https://doi.org/10.1002/joc.965, 2004. a, b
Turner, J., Phillips, T., Hosking, J. S., Marshall, G. J., and Orr, A.: The Amundsen Sea Low: The Amundsen Sea Low, Int. J. Climatol., 33, 1818–1829, https://doi.org/10.1002/joc.3558, 2013. a
Turner, J., Phillips, T., Thamban, M., Rahaman, W., Marshall, G. J., Wille, J. D., Favier, V., Winton, V. H. L., Thomas, E., Wang, Z., Van Den Broeke, M., Hosking, J. S., and Lachlan-Cope, T.: The Dominant Role of Extreme Precipitation Events in Antarctic Snowfall Variability, Geophys. Res. Lett., 46, 3502–3511, https://doi.org/10.1029/2018GL081517, 2019. a
van Dalum, C., van de Berg, W. J., and van den Broeke, M.: RACMO2.3p3 Monthly SMB, SEB and T2m Data for Antarctica (1979–2018), Zenodo [data set], https://doi.org/10.5281/ZENODO.5512076, 2021. a, b, c, d, e, f
van Dalum, C. T., van de Berg, W. J., and van den Broeke, M. R.: Sensitivity of Antarctic surface climate to a new spectral snow albedo and radiative transfer scheme in RACMO2.3p3, The Cryosphere, 16, 1071–1089, https://doi.org/10.5194/tc-16-1071-2022, 2022. a, b, c
Van Wessem, J., Reijmer, C., Morlighem, M., Mouginot, J., Rignot, E., Medley, B., Joughin, I., Wouters, B., Depoorter, M., Bamber, J., Lenaerts, J., Van De Berg, W., Van Den Broeke, M., and Van Meijgaard, E.: Improved Representation of East Antarctic Surface Mass Balance in a Regional Atmospheric Climate Model, J. Glaciol., 60, 761–770, https://doi.org/10.3189/2014JoG14J051, 2014. a
van Wessem, J. M., van de Berg, W. J., Noël, B. P. Y., van Meijgaard, E., Amory, C., Birnbaum, G., Jakobs, C. L., Krüger, K., Lenaerts, J. T. M., Lhermitte, S., Ligtenberg, S. R. M., Medley, B., Reijmer, C. H., van Tricht, K., Trusel, L. D., van Ulft, L. H., Wouters, B., Wuite, J., and van den Broeke, M. R.: Modelling the climate and surface mass balance of polar ice sheets using RACMO2 – Part 2: Antarctica (1979–2016), The Cryosphere, 12, 1479–1498, https://doi.org/10.5194/tc-12-1479-2018, 2018. a
Vera, C. S. and Osman, M.: Activity of the Southern Annular Mode during 2015–2016 El Niño Event and Its Impact on Southern Hemisphere Climate Anomalies, Int. J. Climatol., 38, https://doi.org/10.1002/joc.5419, 2018. a, b
Webster, P. J.: Seasonality in the Local and Remote Atmospheric Response to Sea Surface Temperature Anomalies, J. Atmos. Sci., 39, 41–52, https://doi.org/10.1175/1520-0469(1982)039<0041:SITLAR>2.0.CO;2, 1982. a, b, c, d
Welhouse, L. J., Lazzara, M. A., Keller, L. M., Tripoli, G. J., and Hitchman, M. H.: Composite Analysis of the Effects of ENSO Events on Antarctica, J. Climate, 29, 1797–1808, https://doi.org/10.1175/JCLI-D-15-0108.1, 2016. a
Wille, J. D., Favier, V., Gorodetskaya, I. V., Agosta, C., Kittel, C., Beeman, J. C., Jourdain, N. C., Lenaerts, J. T. M., and Codron, F.: Antarctic Atmospheric River Climatology and Precipitation Impacts, J. Geophys. Res.-Atmos., 126, https://doi.org/10.1029/2020JD033788, 2021. a
Wille, J. D., Alexander, S. P., Amory, C., Baiman, R., Barthélemy, L., Bergstrom, D. M., Berne, A., Binder, H., Blanchet, J., Bozkurt, D., Bracegirdle, T. J., Casado, M., Choi, T., Clem, K. R., Codron, F., Datta, R., Battista, S. D., Favier, V., Francis, D., Fraser, A. D., Fourré, E., Garreaud, R. D., Genthon, C., Gorodetskaya, I. V., González-Herrero, S., Heinrich, V. J., Hubert, G., Joos, H., Kim, S.-J., King, J. C., Kittel, C., Landais, A., Lazzara, M., Leonard, G. H., Lieser, J. L., Maclennan, M., Mikolajczyk, D., Neff, P., Ollivier, I., Picard, G., Pohl, B., Ralph, F. M., Rowe, P., Schlosser, E., Shields, C. A., Smith, I. J., Sprenger, M., Trusel, L., Udy, D., Vance, T., Vignon, E., Walker, C., Wever, N., and Zou, X.: The Extraordinary March 2022 East Antarctica “Heat” Wave. Part II: Impacts on the Antarctic Ice Sheet, J. Climate, 37, 779–799, https://doi.org/10.1175/JCLI-D-23-0176.1, 2024. a, b
Wittenberg, A. T.: Are Historical Records Sufficient to Constrain ENSO Simulations?, Geophys. Res. Lett., 36, L12702, https://doi.org/10.1029/2009GL038710, 2009. a, b
Xue, Y. and Kumar, A.: Evolution of the 2015/16 El Niño and Historical Perspective since 1979, Sci. China Earth Sci., 60, 1572–1588, https://doi.org/10.1007/s11430-016-0106-9, 2017. a, b, c, d
Yiu, Y. Y. S. and Maycock, A. C.: The Linearity of the El Niño Teleconnection to the Amundsen Sea Region, Q. J. Roy. Meteor. Soc., 146, 1169–1183, https://doi.org/10.1002/qj.3731, 2020. a, b
Yuan, X., Kaplan, M. R., and Cane, M. A.: The Interconnected Global Climate System – A Review of Tropical–Polar Teleconnections, J. Climate, 31, 5765–5792, https://doi.org/10.1175/JCLI-D-16-0637.1, 2018. a