the Creative Commons Attribution 4.0 License.
the Creative Commons Attribution 4.0 License.
 | 19 May 2025
An unseasonal atmospheric river drives anomalous summer snow accumulation on glaciers of the subtropical Andes
Sebastián Cisternas
Maximiliano Viale
Pablo Paredes
Deniz Bozkurt
Nicolás García-Lee
Climate change is associated with changes in the frequency and intensity of extreme weather events. Extreme weather is impacting the mass balance of Andean glaciers, a phenomenon that requires further detailed investigation. Among these extreme events, atmospheric rivers (ARs) play a significant role, potentially leading to either accumulation or melting events on glaciers. To assess the impact of ARs on Andean glaciers, we analysed an unseasonal event that occurred at the end of January 2021 – marked by extreme snowfall in the highlands and heavy rainfall, landslides and flash floods in the lowlands – during the typically dry austral summer period. Satellite imagery and meteorological observations in the glaciated Maipo River basin and its Olivares River sub-basin (33° S) enabled the characterisation of this event and its basin-scale impacts. Moreover, a glacier mass balance model allows us to quantify the effects of the AR on the Olivares Alfa Glacier (4284 to 4988 m a.s.l.) in the context of the preceding 6 hydrological years. The large water vapour transport by the AR led to substantial snow accumulation on the Maipo River glaciers, resulting in a post-event snow line observed at 2463 m a.s.l. In the Olivares River sub-basin, the 0 °C isotherm dropped from typical summertime altitudes of 4000–4500 m a.s.l. to 3250 m a.s.l. during the event, below the frontal zone of all glaciers in this sub-basin. The mass balance model for the Olivares Alfa Glacier during the dry 2020–2021 hydrological year showed a trend toward negative values at the beginning of the ablation season, aligned with previous years and the prevailing severe drought conditions. However, the AR snowfall event, combined with cooler conditions and other small accumulation events during the remainder of the ablation season compared to previous years, offset this trend and brought the mass balance closer to equilibrium. This demonstrates that an unseasonal snow accumulation event can significantly counteract the broader seasonal trends affecting subtropical Andean glaciers. Our study sheds light on the impacts of extreme and unseasonal snow accumulation events on glacier mass balance in the high Andes, particularly those associated with ARs, a synoptic feature projected to become more common in a warming climate.
- Article
(8752 KB) - Full-text XML
-
Supplement
(1804 KB) - BibTeX
- EndNote


Glaciers, with their high sensitivity to climatic variations, stand as crucial indicators of climate change in regions spanning from tropical to polar areas. Central to their behaviour is the mass balance, a critical metric capturing the net gain or loss of ice and snow over specific periods. The mass balance, in turn, is profoundly influenced by the prevailing atmospheric conditions. Over the last 2 decades, observations in the Andes have shown a marked tendency toward glacier mass loss, largely attributed to increases in air temperature and/or decreases in precipitation (Braun et al., 2019; Dussaillant et al., 2019). Embedded in this overall negative mass balance trend is a large interannual variability in atmospheric conditions and, hence, in the annual mass balance of glaciers.
In the subtropical Andes, between 32 and 36° S in Chile and Argentina, the atmospheric interannual variability is mainly modulated by global-scale atmospheric–oceanic circulation patterns such as the El Niño–Southern Oscillation (ENSO), the Southern Annular Mode (SAM) and the Interdecadal Pacific Oscillation (IPO) (Garreaud et al., 2009). For instance, the warm ENSO phases (El Niño) are usually associated with positive anomalies in snowfall in this region, while cold ENSO phases (La Niña) can result in below-average snow accumulation (Masiokas et al., 2020). Besides global-scale phenomena, extreme synoptic-scale events, such as intense heatwaves or precipitation events, can strongly modulate annual mass changes in Andean glaciers (González-Reyes et al., 2023; Poveda et al., 2020). To our knowledge, the impact of individual extreme events on the annual mass balance of Andean glaciers has not been assessed yet despite their increasing magnitude and frequency with climate change (Poveda et al., 2020).
While significant advances have been made in understanding extreme temperature and precipitation events in the subtropical Andes and their associated synoptic conditions (Bozkurt et al., 2016; Viale et al., 2018; Feron et al., 2019; Jacques-Coper et al., 2016, 2021; Demortier et al., 2021; Valenzuela et al. 2022; González-Reyes et al., 2023; Garreaud et al., 2024), their influence on glacier mass balances remains largely unexplored. One pertinent subject of inquiry relates to the occurrence of atmospheric rivers (ARs) leading to intense precipitation events in the subtropical Andes (Viale et al., 2018). ARs are narrow, elongated corridors of intense water vapour transport, often situated ahead of ocean cold fronts which primarily make landfall and discharge their vapour as precipitation on the western coasts of the mid-latitude continents (Guan and Waliser, 2019). The most intense ARs typically lead to extremely heavy orographic precipitation on mountainous western coasts and, hence, to severe hydrometeorological hazards (Ralph et al., 2006; Leung and Qian, 2009; Neiman et al., 2011; Payne et al., 2020).
In the subtropical Andes, ARs constitute the main source of water, particularly during the winter season (Viale et al., 2018; Saavedra et al., 2020). Indeed, Saavedra et al. (2020) quantified that AR events account for about 50 % of the total annual snow accumulation and that these are 2.5 times more intense as snowfall events compared to non-AR snowfall events. However, their effects on mid-latitude glaciers are complex and can be opposing as they can bring about both significant snowfall accumulation and extreme ice melting and/or snowmelt (Guan et al., 2010; Little et al., 2019; Kropač et al., 2021).
The role of ARs in shaping glacier mass balances is complex and contingent upon multiple factors, including synoptic conditions, seasonal time occurrences of the AR events, and the altitudinal and latitudinal location of the glaciers. Little et al. (2019) showed that the days with the most intense ablation and largest accumulation rates at Brewster Glacier in the southern Alps of New Zealand (44° S, elevation range of 1700–2400 m a.s.l.) coincide with ARs that transport exceptionally high levels of water vapour, depending on their associated thermal conditions. ARs can lead to glacier melting and snowmelt through several mechanisms, including large-scale sensible heat transport (e.g. Bozkurt et al., 2022; Wille et al., 2022), rain-on-snow events (through rain heat flux increases), and an increase in cloud cover and downward longwave radiation over mountains (Chen et al., 2019; Zou et al., 2021; Kropač et al., 2021; Wille et al., 2022). Conversely, when favourable conditions exist, such as the glaciers being located above the 0 °C isotherm, ARs can trigger substantial snow accumulation events.
This dual role of ARs in driving both high accumulation and high melting events is not limited to mid-latitudes. AR events similarly exert a two-fold influence in polar latitudes, such as Antarctica and Greenland. These events can contribute to increased snowfall accumulation on the vast ice sheets, potentially mitigating their mass loss (Mattingly et al., 2018; Wille et al., 2021; Adusumilli et al., 2021; Maclennan et al., 2022). Conversely, ARs have been implicated in driving episodes of extreme warm temperatures, intense surface melting and liquid precipitation events in West Antarctica, the Antarctic Peninsula and Greenland, particularly along the coastal zones, causing concerns about ice sheet stability (Wille et al., 2019, 2022; Xu et al., 2021; Box et al., 2022; Mattingly et al., 2023). Furthermore, ARs can initiate post-event feedback mechanisms on glacier surfaces, for example, notably contributing to glacier albedo changes (e.g. Box et al., 2022). Analysing and quantifying these processes are essential for understanding glacier responses to extreme weather events.
Beyond the scientific realm, understanding the impact and role of ARs on the Andean cryosphere holds profound societal significance. In the subtropical Andes, glaciers constitute natural water reservoirs, storing vast amounts of freshwater as ice, which gradually feeds rivers, supplying water for agriculture, drinking and hydropower generation for over 10 million people (Ayala et al., 2020; Crespo et al., 2020). Therefore, ARs can influence glacier mass balance, impacting the timing and magnitude of freshwater release for managing this vital resource. Furthermore, ARs can lead to extreme events such as floods and landslides triggered by rain-on-snow events (e.g. Guan et al., 2016; Dolant et al., 2017; Somos-Valenzuela et al., 2020; Rutllant et al., 2023), with devastating consequences for communities, infrastructure and economies. Assessing these AR impacts contributes to a deeper understanding of glacier hazards triggered by extreme weather events (e.g. Carey et al., 2012) and can help to enhance the long-term sustainability and resilience of regions reliant on glacier meltwater in the subtropical Andes.
In the subtropics, ARs are much more frequent in winter, while precipitation and AR frequency are almost absent in the summertime (dry season) over the western slopes of the subtropical Andes and the central Chilean lowlands (Viale and Garreaud, 2014; Viale et al., 2018). Despite these overall characteristics, episodes of intense precipitation can occasionally occur in summer (Poveda et al., 2020). In late January 2021, the subtropical Andes of Chile and Argentina experienced a major and unusual precipitation event (over 100 mm in central–southern Chile) triggered by an unseasonal and zonal-oriented AR. The storm's first phase (28–29 January) occurred with a winter-like frontal system and its associated AR but in a relatively warm, summertime environment, while, during the second phase (30–31 January), the AR quickly dissipated, leaving residual moisture and forming a cut-off low that fuelled intense convection, rain, lightning and hail, leading to significant societal disruptions and economic losses (Valenzuela et al., 2022). This extraordinary AR-related event represents a rare climatic anomaly, with the storm's accumulated precipitation being close to the range of an extreme event, even for winter, i.e. 40 mm d−1 (Garreaud, 2013). Historical records document similar storms to have occurred only two to three times in the past century (Valenzuela et al., 2022). This AR serves as the focal point of our study as we assess its influence on the annual mass balance of the Olivares Alfa Glacier.
In this work, our objective is to evaluate the role of this extraordinary dry-season precipitation event, triggered by an AR, over the glaciers of the Maipo River basin, especially over the Olivares Alfa Glacier located in the Andes at 33° S (Fig. 1). First, we describe the extraordinary nature of the event and the unusually large precipitation rate for summertime in the Andes at this latitude. We assess whether accumulation or melting during this event predominantly influenced the annual mass balance. Secondly, we analyse the drivers behind the glacier's mass balance response to the AR event by quantifying the surface energy balance. Thirdly, we quantify how a single extreme unseasonal precipitation event can alter the mass balance trend for this particular year and in the context of 7 hydrological years. Finally, we discuss the implications of this event, particularly in the context of the ENSO variability mode, a large-scale glacier mass balance forcing in this region. To accomplish these research objectives, we use remote sensing, radiosonde data, reanalysis data and available meteorological observations located in the glacierised high Olivares River sub-basin (Fig. 1). These meteorological data were also used as input for a physically based modelling, which allowed us to quantify the impact of this AR-related precipitation on the annual mass balance of the Olivares Alfa Glacier. To our knowledge, this study represents the first comprehensive examination of AR impacts on glacier mass balance in the Andean region.
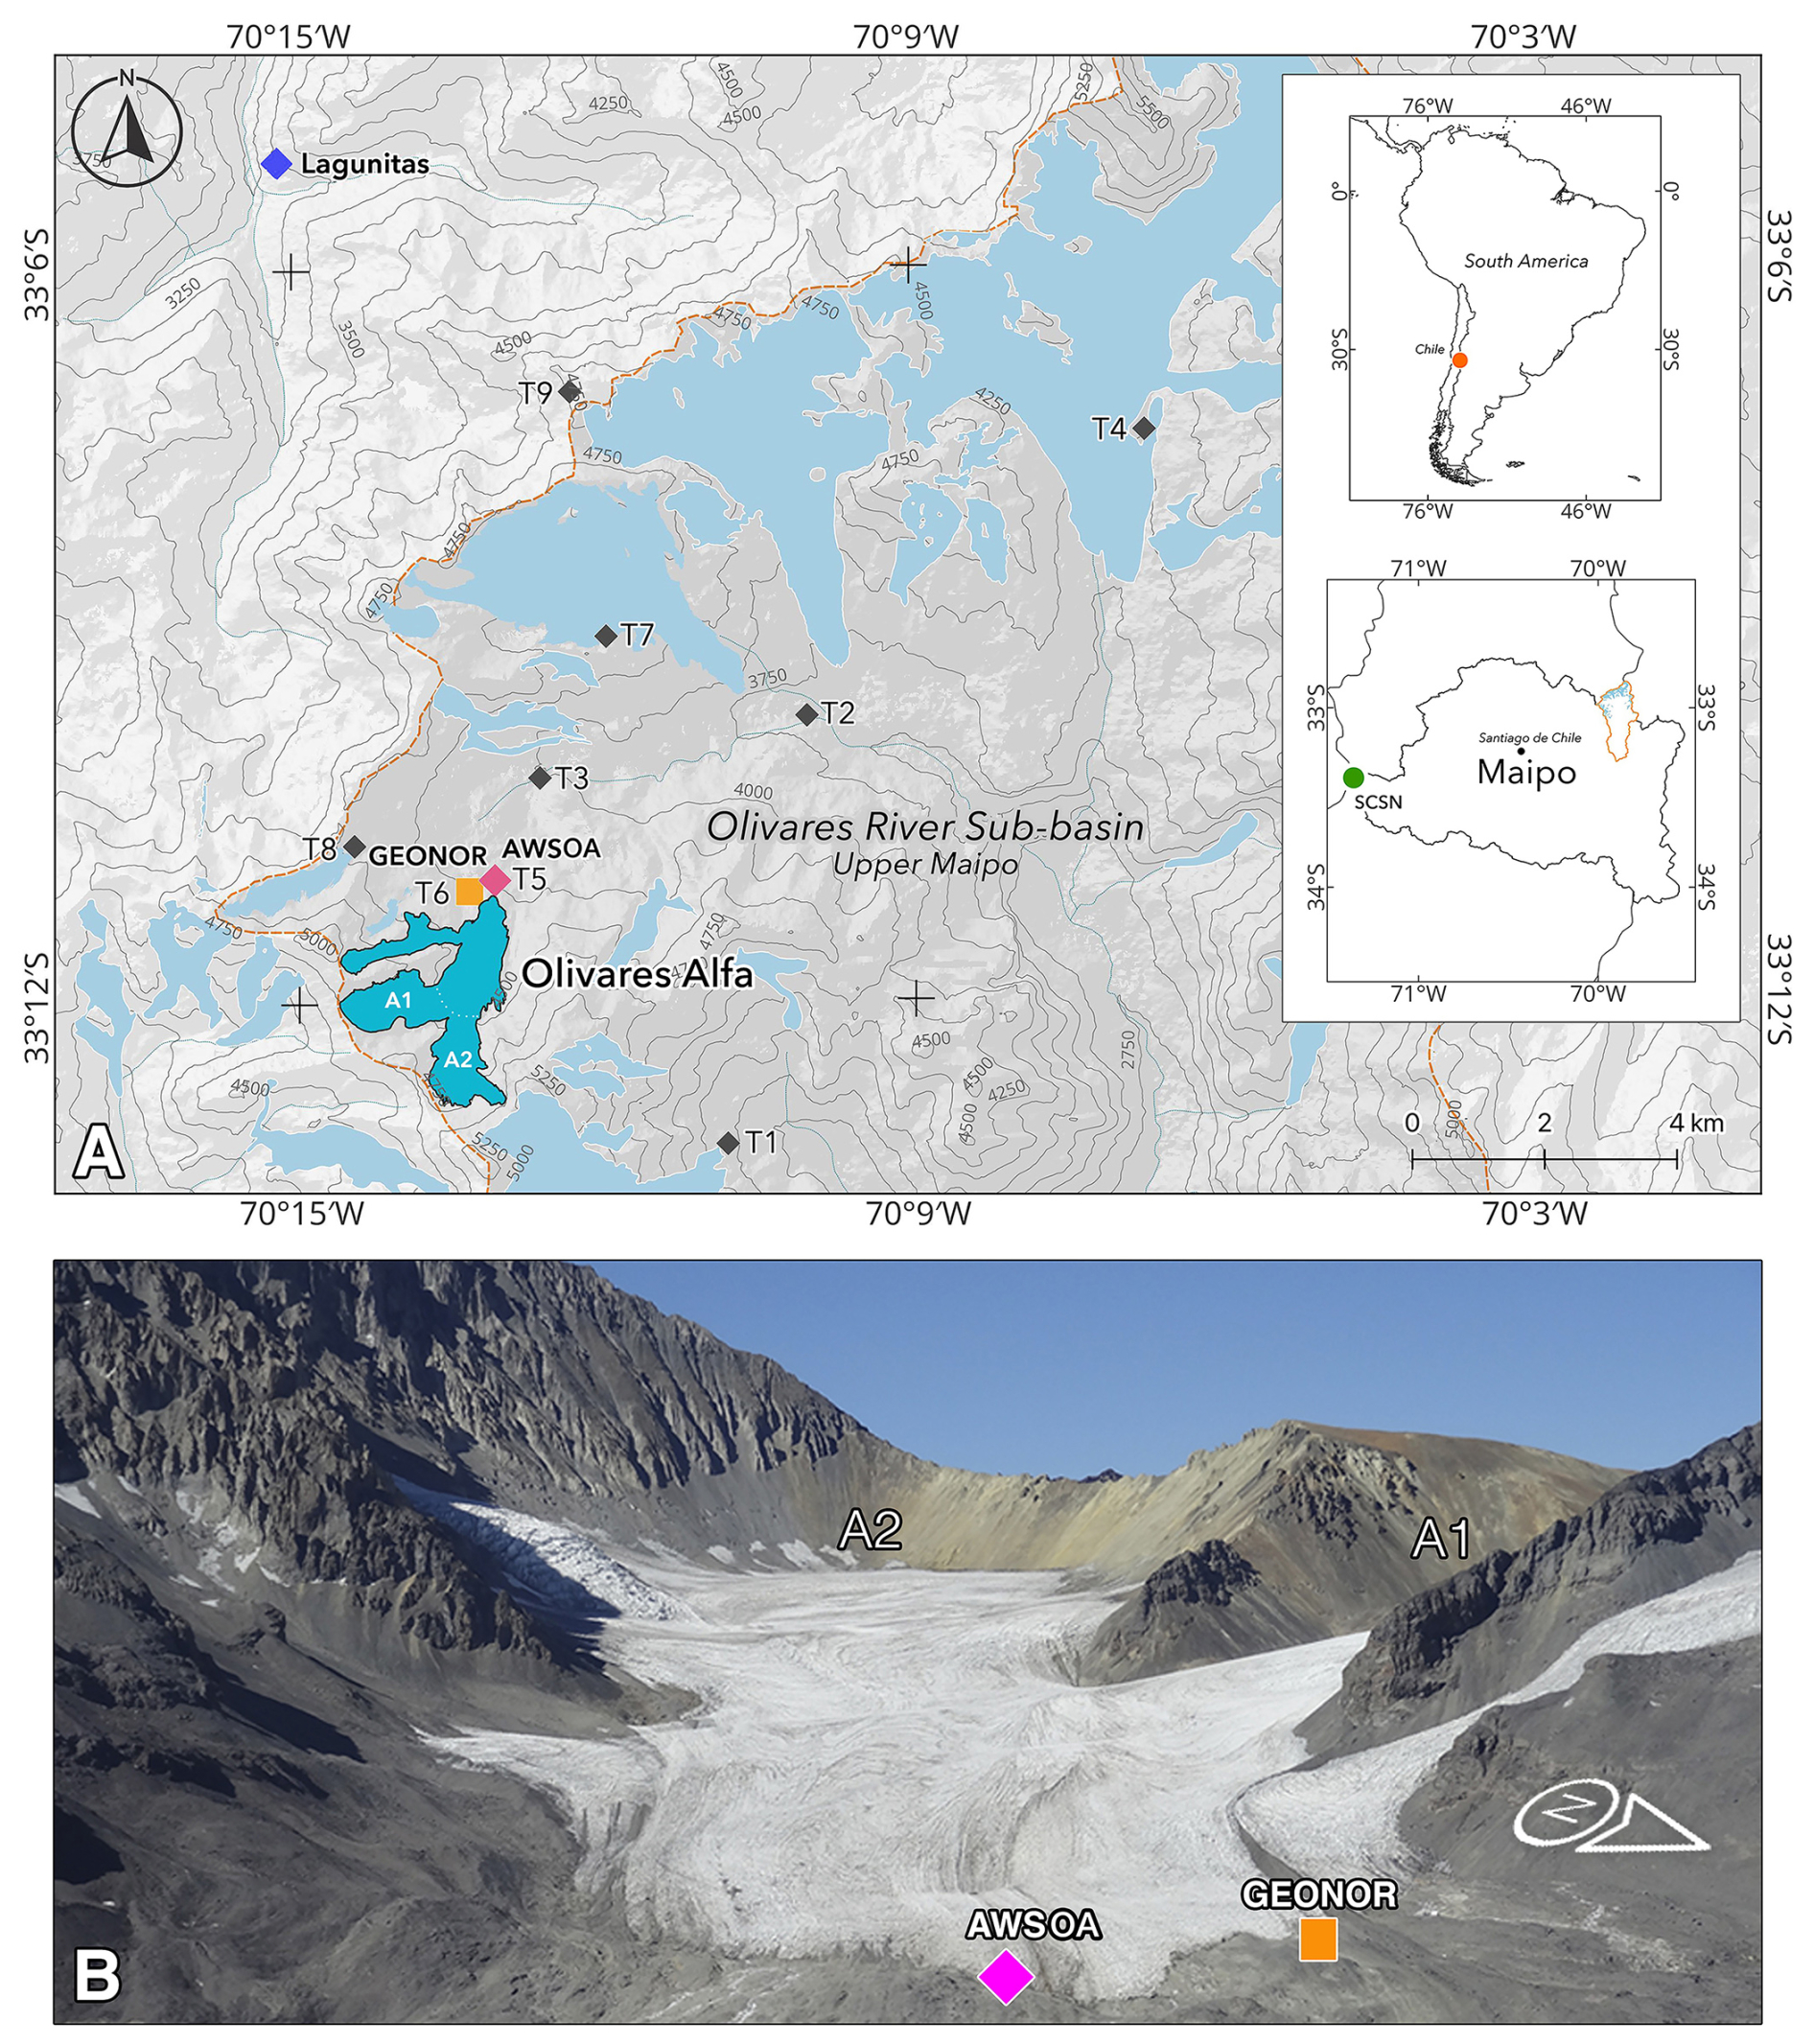
Figure 1(a) Glaciers (light-blue colour) of the Olivares River sub-basin and the location of the automatic weather station (AWSOA, magenta colour) and pluviometer (GEONOR, orange colour) close to Olivares Alfa Glacier (in dark blue). T1 to T9 mark the locations of the air temperature sensors (T5 is the AWSOA), and A1 and A2 are the two cirques that form the accumulation zone of the Olivares Alfa glacier. The purple diamond at the top left indicates the location of Lagunitas weather station, and the green diamond is the location of a camera over Paloma Norte Glacier. The upper inset provides the regional context of the Maipo River basin in South America, and the bottom inset highlights the Maipo Basin (black line) and the Olivares River sub-basin (orange line). SCSN (Santo Domingo) corresponds to the site from which radiosondes are launched. Contour lines are derived from the AW3D30 digital elevation model (DEM). Panel (b) shows a photograph taken on 5 February 2015 by Claudio Bravo, with a detailed view of the Olivares Alfa Glacier.
We conducted our assessment at two different river basin scales: first, for the Maipo River basin and, second, for its Olivares River sub-basin (Fig. 1). The Maipo River is the main water source for Santiago, Chile's densely populated capital, supporting its residents, agriculture and industry. Of the total of the Maipo River basin water, around 60 % is used in the agriculture sector, and 35 % is used for drinking and sanitation (Alvarez-Garreton et al., 2024). The basin contains around 1000 ice bodies comprising a total glacier area of 388 km2 (Barcaza et al., 2017), while the sub-basin hosts a glacierised area of 70 km2 centred around 33°10′ S and 70°10′ W. Within the Olivares River sub-basin lies the highest glaciers in the Maipo River basin, ranging from 3500 to 5800 m a.s.l. (Ayala et al., 2020), whose ice masses experienced the largest ice loss compared to glaciers in other Maipo River sub-basins between 2000 and 2013 (Farías-Barahona et al., 2020).
The Olivares River sub-basin is home to several glaciers, including Olivares Alfa, Olivares Beta, Olivares Gamma and Juncal Sur (Fig. 1). These glaciers exhibit clear signs of thinning and retreat (Farías-Barahona et al., 2020; Malmros et al., 2016). Additionally, they have shown a trend towards surface darkening since the 1980s (Shaw et al., 2021; Barandun et al., 2022). Glacier simulations, detailed in the next section, focused on the Olivares Alfa Glacier (Fig. 1), a mountain glacier with an accumulation zone divided in two cirques, both primarily oriented towards the northeast, and with a mean elevation of 4574 m a.s.l. According to Shaw et al. (2021), the estimated area of this glacier as of March 2020 is 3.2 km2. Satellite images and aerial photographs reveal that the Olivares Alfa was formerly part of a continuous glacier that extended over most of the western headwater of the sub-basin. Malmros et al. (2016) quantified a significant glacier area loss of 63 % between 1955 and 2013, indicating a gradual fragmentation of the ice mass over the years.
3.1 Catalogue of atmospheric-river events and extraordinary total summer precipitation for one event
To contextualise the extraordinary occurrence of the summer 2021 AR, we use ERA5 reanalysis data (Hersbach et al., 2020) to catalogue the ARs in summer and to demonstrate the climatological low frequency of this synoptic feature. Further, we analysed how the precipitation total during this event was also extraordinary for summertime in the Andes at this latitude.
For the first part, we identified AR conditions on the Pacific coastal grid points of the ERA5 reanalysis data (Hersbach et al., 2020) in central Chile (30–35° S) over the 1941–2023 period (83 years). AR conditions are classified into five categories according to the scale proposed by Ralph et al. (2019). The scale combines the maximum moisture transport integrated over the vertical column of the atmosphere, i.e. the integrated vapour transport (IVT), with the duration of the AR conditions, determined as the period during which IVT remains consistently greater than 250 kg m−1 s−1. Category 1 is primarily associated with beneficial precipitation-related impacts, while category 3 can be a balance between beneficial and hazardous impacts, and category 5 is primarily related to hazardous impacts. For further details on the AR scale, see Ralph et al. (2019). In our study, we retain AR events if at least category-1 conditions occurred at two or more of the coastal grid points between 30 and 35° S. AR conditions in central Chile typically affect multiple grid points within this latitude range. Therefore, the onset and demise of each AR event is established by the start and end times of the overlapping AR conditions across all relevant coastal grid points. For further analyses, we use two variables to measure AR event intensity: the maximum AR category reached during the event and the maximum instantaneous IVT value among all grid points with AR conditions. We focused on evaluating the summer AR events over the available 83-year period (Table S1 in the Supplement). Further, we analysed the impact of past ARs on the simulated glacier mass balance in each hydrological year between 2014–2015 to 2020–2021 across all the seasons. This AR catalogue is shown in Table S2.
To remark on the extraordinary precipitation during summer in the Andes, we used available data from the Lagunitas weather station (33.08° S, 70.25° W; see Fig. 1) for the period 1959–2023. We defined a precipitation event as being when the daily precipitation rate is equal to or larger than 2 mm for 1 or more consecutive days. Although this station is located at a lower elevation (2765 m a.s.l.), it provides one of the longest precipitation records in this region of the Andes, allowing us to place the summer 2021 event in the context of an observed precipitation climatology.
3.2 Basin-scale analysis
Firstly, at the Maipo River basin scale (Fig. 1a), we aim to estimate if glaciers were subject to accumulation and/or melting. For this, we utilised the MODIS daily snow cover product (Terra MOD10A1 and Aqua MYD10A1, V0006, 500 m resolution) (Hall et al., 2006) to derive the snow line altitude in the Maipo River basin. The snow line altitude was calculated using the method developed by Krajčí et al. (2014) over the period from April 2001 to March 2021. The MODIS snow product is known to be susceptible to cloud cover, limiting its accuracy in areas with frequent cloud coverage. However, the approach proposed by Krajčí et al. (2014) overcomes this limitation by offering improved tolerance of clouds. By allowing a higher cloud cover threshold (90 % in our case), this method can still provide reliable snow cover information, even in cloud-prone regions. This enhanced cloud tolerance results in better accuracy compared to other snow detection methods, such as those by Parajka et al. (2010) and Da Ronco and De Michele (2014), which perform less effectively under heavy cloud cover. This approach enables us to assess the exceptional nature of the AR event at a regional scale and in the context of the past 20 years.
Secondly, we estimated the altitude of the 0 °C isotherm or freezing level to assess the glacier area experiencing melting by using radiosonde and in situ data. The radiosonde data registered by the Santo Domingo station (33.63° S, 71.65° W; Fig. 1a) were obtained from the NOAA Integrated Global Radiosonde Archive (IGRA) database (Durre et al., 2018). We utilised air temperature data from an automatic weather station near the front of the Olivares Alfa Glacier (AWSOA; 4220 m a.s.l; 33°10′ S, 70°13′ W; Fig. 1), as well as multiple air temperature sensors located at different altitudes in the Olivares River sub-basin (3606, 3663, 4004, 4020, 4240, 4288, 4453, 4466 and 4772 m a.s.l.; T1 to T9 in Fig. 1a) to estimate the freezing level. The freezing level was estimated using a linear regression of the hourly air temperature records at different altitudes. To ensure accuracy and reliability, we compared the 0 °C isotherm estimated from the Santo Domingo radiosonde data with the one derived from the air temperature sensors in the sub-basin.
The estimated snow line altitude and freezing level enable us to estimate the glacier area experiencing melt and/or accumulation before, during and after the precipitation event in the Maipo River basin and the Olivares River sub-basin. The estimated snow line and freezing level were then compared with the hypsometry of the basin's glaciers, derived from glacier outlines from the year 2021 and the AW3D30 digital elevation model (DEM) data from the Japan Aerospace Exploration Agency.
3.3 Glacier-scale analysis
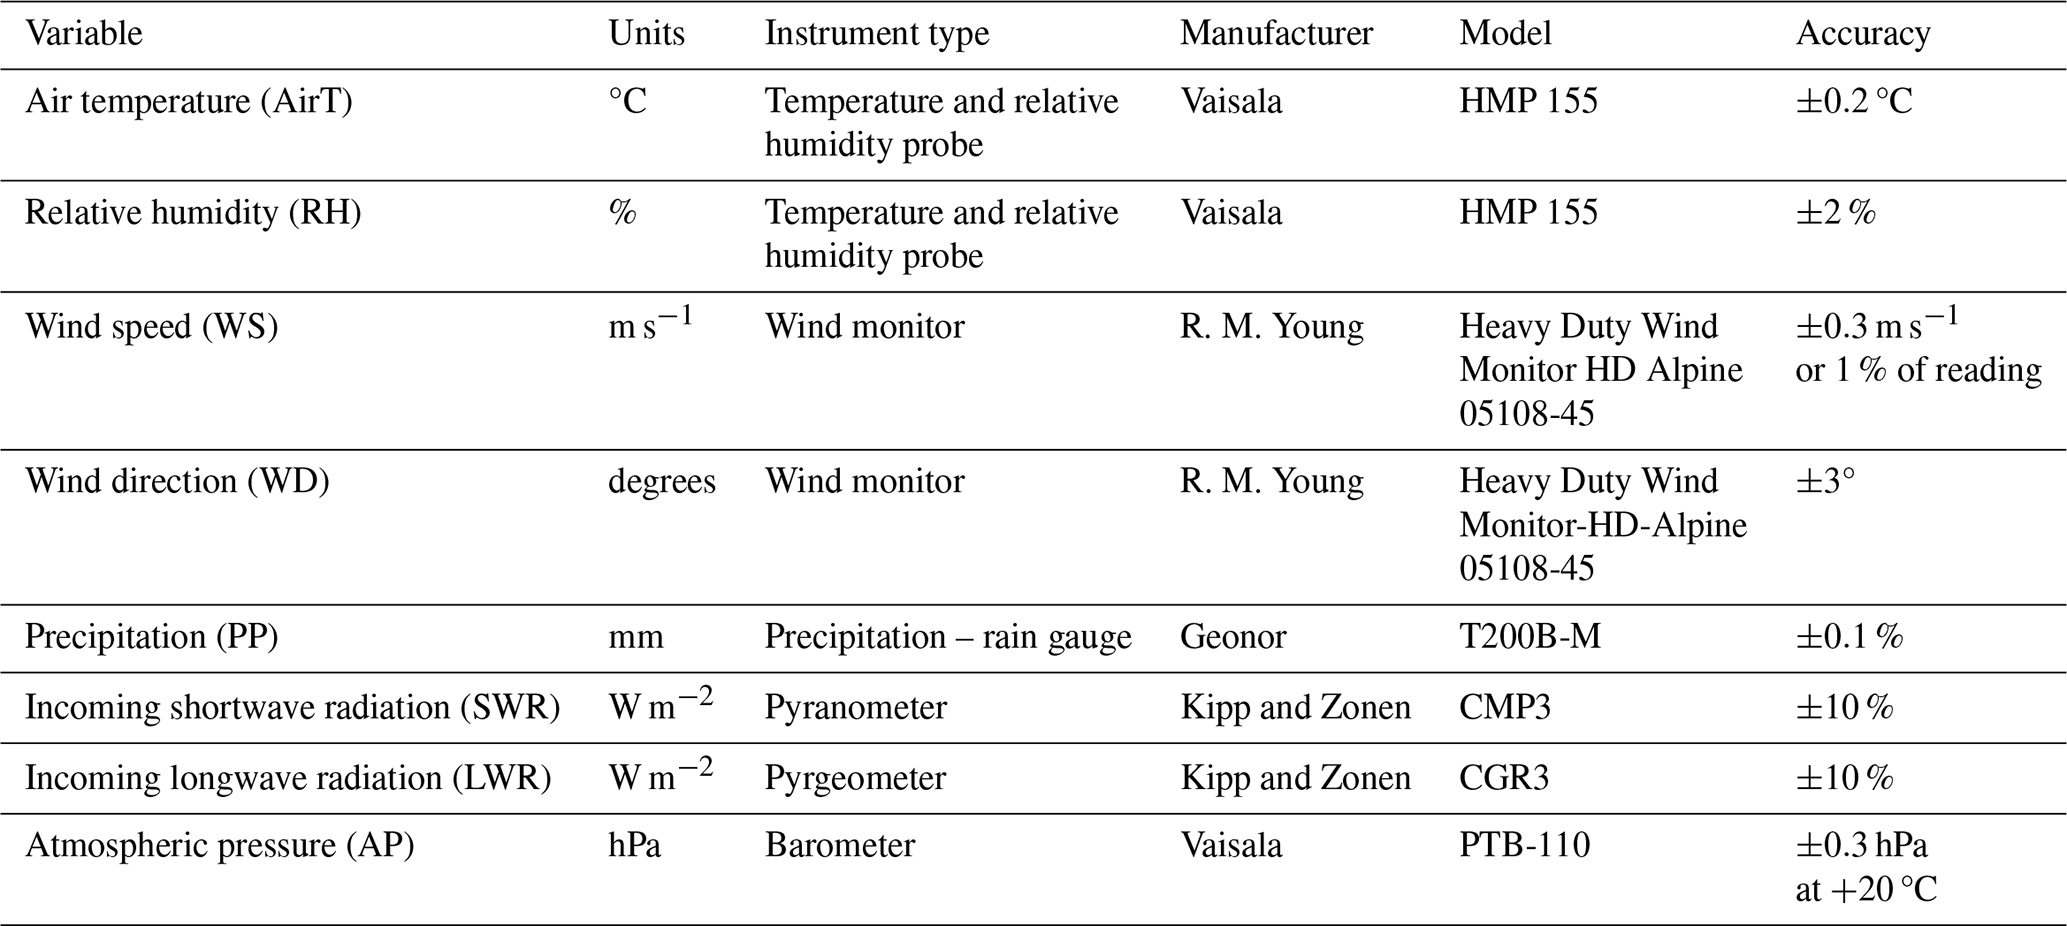
To assess the impact of the precipitation event on the glacier mass balance, we utilised the coupled snowpack and ice surface energy and mass balance model COSIPY (v1.3), developed by Sauter et al. (2020). This model employs state-of-the-art equations and parameterisations to estimate energy and mass balance. Input data for the model were collected from two sources near the Olivares Alfa Glacier: the AWSOA and the precipitation sensor GEONOR T200B-M (see Table 1 for sensor details and Fig. 1 for locations). These observations include air temperature, air relative humidity, wind speed, atmospheric pressure, precipitation, and incoming shortwave and longwave radiation (Table 1, Fig. S1). The model flexibility allows for spatial distribution of the meteorological variables over the glacier surface. We define a spatial resolution of 100 m and a 1 h time step. To distribute the air temperature, we used the AW3D30 DEM and an empirical lapse rate of 8.4 °C km−1, derived from the air temperature sensors installed in the sub-basin (Fig. 1; see Sect. 3.2). Direct longwave radiation measurements became available starting in September 2016. Therefore, data derived from ERA5 reanalysis were utilised after undergoing bias correction with the aid of direct observations (Lopes et al., 2022; Fig. S1g) to cover the complete period from April 2014 to March 2021. Consequently, we simulated the total mass balance of 7 hydrological years.
Furthermore, glacier outlines were obtained from medium- and high-resolution imagery for the modelling period of 2013–2014 to 2020–2021 (see Table S3), along with the AW3D30 DEM. Due to the scarcity of detailed and consistent snow depth observations on the glacier surface at the beginning of each hydrological year (i.e. April in the subtropical Andes), we re-initialised the model with a snow-free initial condition for each simulation year.
The analysed model outputs include glacier total mass balance (in m w.e.) and surface energy fluxes, such as turbulent fluxes and net short and longwave radiation (in W m−2). These model outputs were analysed to assess the impact of the event on the energy balance and on the glacier's annual mass balance. In addition, a comparison of the annual mass balance series was made with that of previous hydrological years. Total mass balance was assessed rather than surface mass balance to incorporate feedback and changes in internal mass balance, melt and refreezing processes (Sauter et al., 2020). To further evaluate the impact of this unseasonal precipitation event, we also estimated the 2020–2021 hydrological year's mass balance under a hypothetical scenario without the AR's influence, removing the accumulation attributed to the summer 2021 AR. To complete the last 2 months of the 2020–2021 hydrological year, the mass balance time series from previous similar years (i.e. those years with negative mass balances until the end of January: 2017–2018, 2014–2015 and 2019–2020) were decomposed to extract the trend for each year (Box et al., 2015). Then, the 2020–2021 mass balance series was detrended, and the average, maximum and minimum trends derived from previous years were applied to the analysed hydrological year to allow us to establish hypotheses regarding a scenario range without the occurrence of the AR.
Table 1Sensors of the automatic weather station located near the front of Olivares Alfa Glacier (AWSOA) at 33°10′ S and 70°13′ W and 4220 m a.s.l.
4.1 Unseasonal and zonal atmospheric-river event and extraordinary accumulated precipitation
The climatological analysis of the AR conditions (Fig. 2a) using ERA5 reanalysis data reveals the low frequency of summer AR events in central Chile. Between 1941 and 2023, only 19 weak AR events occurred during the summer season (DJF) (see Table S1 in the Supplement), corresponding to AR categories 1 or 2 based on Ralph et al. (2019). This frequency roughly translates to one AR event every four summers. In contrast, the total AR events during all seasons reached 687, highlighting the dominance of AR activity outside of the summertime in central Chile.
The AR event of January 2021, however, stands out due to its extreme characteristics, making landfall in central Chile during the middle of the austral summer. According to the long precipitation time series at the nearby Lagunitas weather station (see Fig. 1a for location), total precipitation of 95 mm was recorded, marking it as the second largest summertime precipitation event since 1959, with a return period of 30 years or more (Fig. 2b). Valenzuela et al. (2022) also showed the extreme values of this precipitation event in highland and lowland stations (see their Fig. 7). Three of the top four summertime precipitation events at Lagunitas station since 1959 were caused by unseasonal ARs (Fig. 2b). These ARs were among the largest transporters of cross-barrier water vapour flux to the Andes (Fig. 2a), indicating the key role of orographic lifting in enhancing precipitation intensity in the Andes.
The synoptic characteristics of the 2021 event are shown in Fig. 3a. Sea level pressure and IVT at 12:00 UTC on 29 January 2021 show the AR's zonal orientation, which was nearly perpendicular to the Andes. Such alignment is crucial for efficiently lifting moist air over the mountains, leading to intense precipitation (Garreaud et al., 2024). According to the ERA5-based AR summertime catalogue, the AR of January 2021 was the most zonal-oriented of the 19 summertime AR events in the last 83 years (Fig. 3b). Additionally, the third most zonally oriented AR was the AR of 1965, which is the number one precipitation event in this 83-year period (Figs. 3b and 2b), denoting the high importance of the AR orientation in augmenting orographic effects on precipitation. The summer 2021 AR was classified as category 1 along the coastal grid points between 34.5 and 39° S during its peak (Fig. 3b).
The storm's cumulative precipitation over 120 h (00:00 UTC on 27 January to 00:00 UTC on 1 February) is shown in Fig. 3b. Precipitation totals exceeded 100 mm in some regions of the central Andes, with widespread impacts across both mountain and lowland areas. The orographic interaction with the AR's zonal vapour transport (Fig. 3a) highlights the significant enhancement of precipitation due to the Andes' barrier effect.
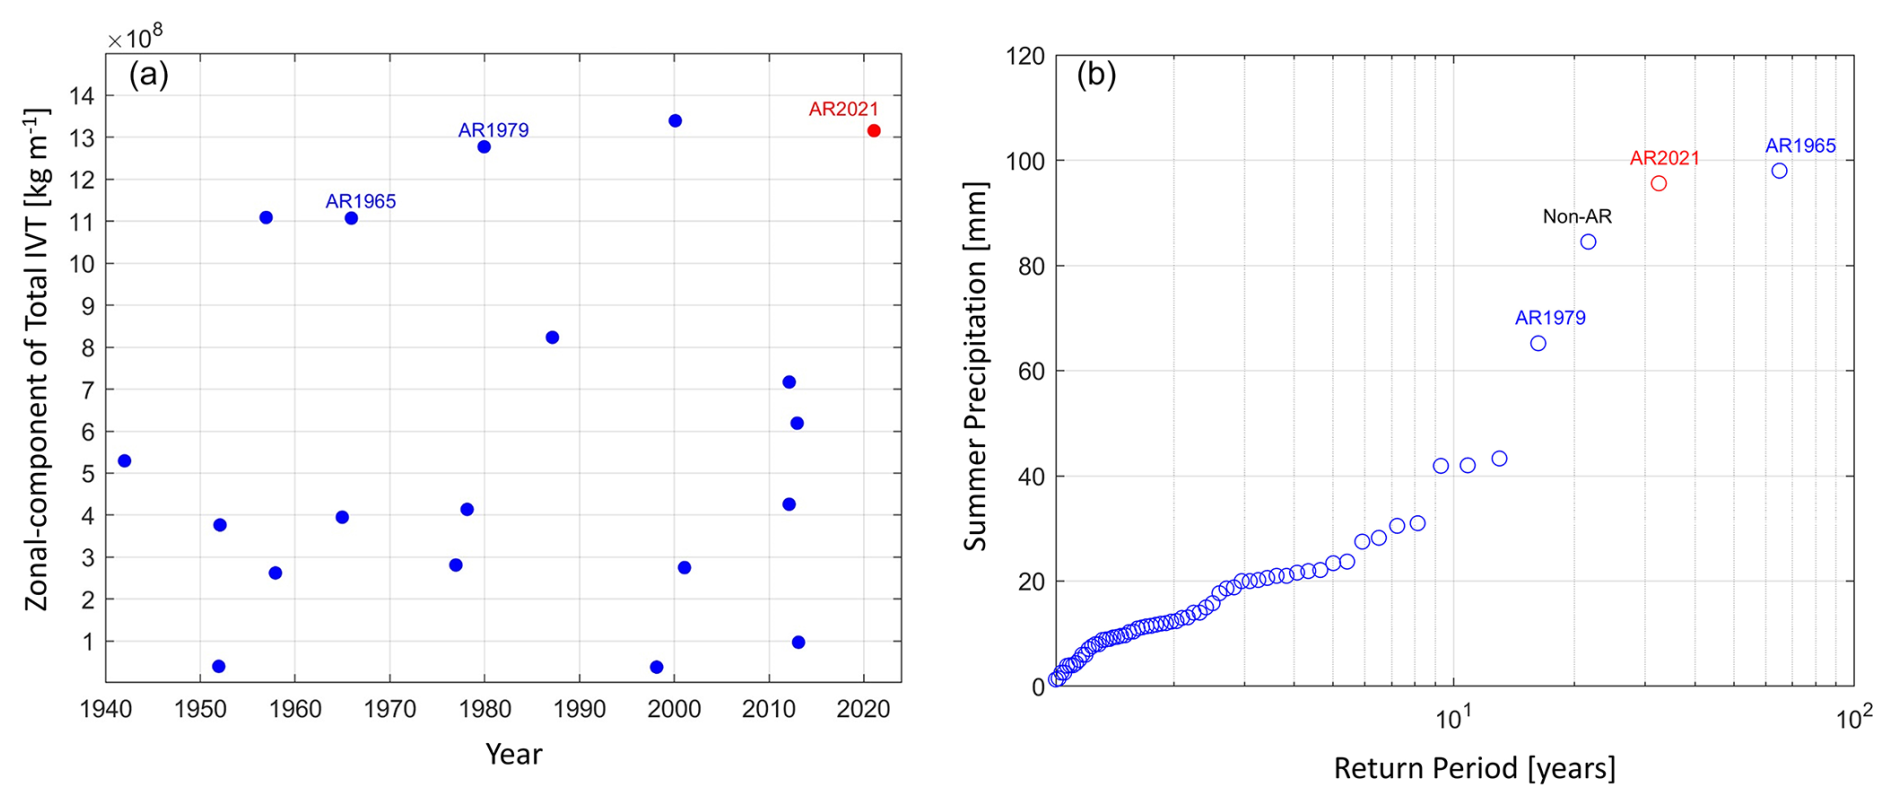
Figure 2(a) Cross-barrier (zonal component) of the total integrated vapour transport during the 19 summertime (DJF) AR events that occurred over the 1941–2023 period (83 years). (b) Return period of DJF precipitation events (mm) at Lagunitas station (2765 m a.s.l.; see Fig. 1 for location). Highlighted are the top four events, including the AR of this study (AR2021).
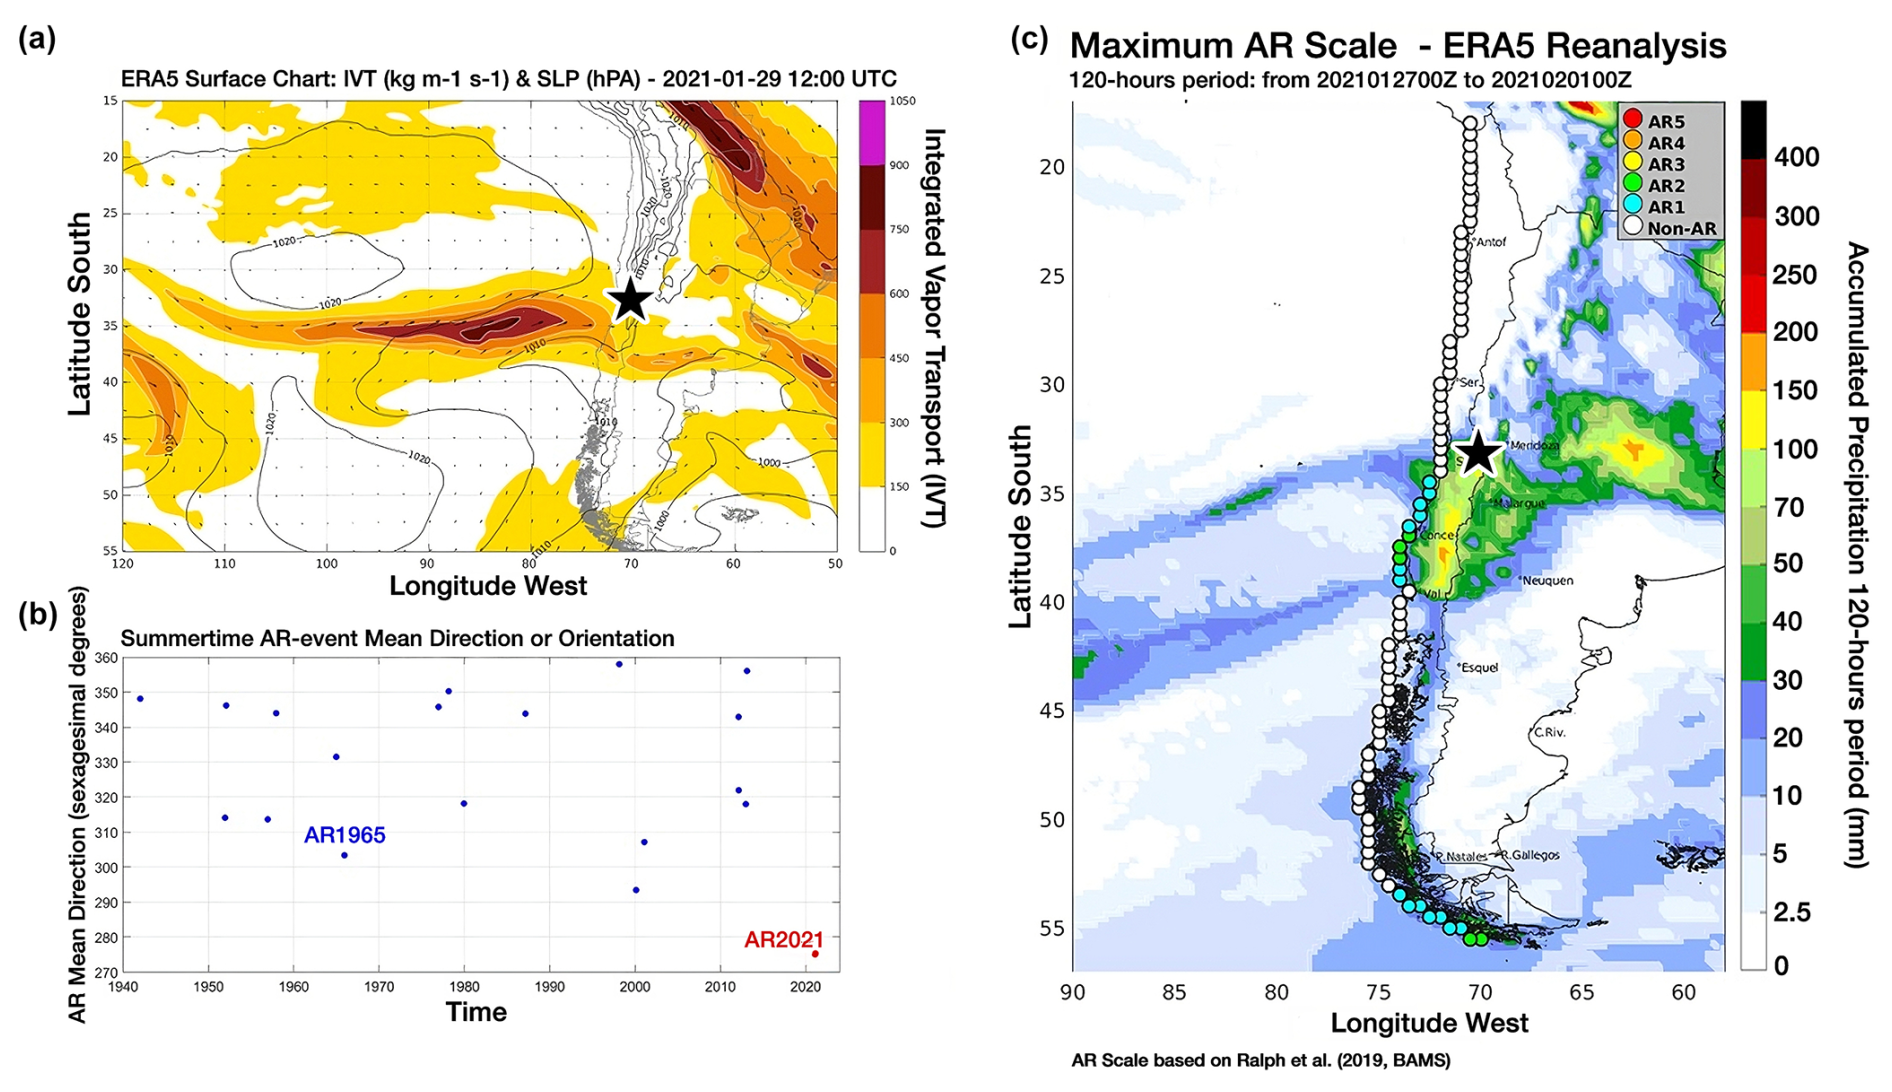
Figure 3ERA5 reanalysis shows the unseasonal AR that made landfall in central Chile. (a) Surface chart with the sea level pressure (SLP, lines, in hPa) and the integrated vapour transport (IVT, shaded, in kg m−1 s−1) at 12:00 TC on 29 January 2021. (b) Mean event direction during the 19 AR DJF events that occurred over the 1941–2023 period (83 years). Direction expressed in sexagesimal degrees, being 360° from north to south and 270° from west to east. (c) Storm total precipitation accumulated from 00:00 UTC on 27 January to 00:00 UTC on 1 February 2021 (shaded, in mm). The colour-coded circles on the Pacific coast show the AR scale (Ralph et al., 2019) reached by the AR. The black star indicates the location of the Olivares River basin.
4.2 Snow line altitude in the Maipo River basin estimated from MODIS satellite data
In the Maipo River basin, the snow line altitude from MODIS data was estimated to be around 4700 m a.s.l. before the summer 2021 AR event (Fig. 4). This altitude is over the 75th percentile of the distribution of the snow line for the January and February months between 2001 and 2021, where the snow line typically ranges between 3900 and 4500 m a.s.l., with higher glacier sections usually being snow-covered during these months. On the day prior to the event, the snow line was 4693 m a.s.l., and the mean of the 10 d prior to the event was 4654 m a.s.l. During the event, the snow line altitude sharply decreased, reaching a minimum altitude of 2463 m a.s.l., which is lower than the 0 °C isotherm minimum (∼ 3250 m a.s.l.; see next section). Immediate post-event measurements placed this value among the lowest January and February snow line altitudes observed from MODIS SNOW for the period of 2001 to 2021 (Fig. 4). The average summer snow line altitude for this period was 4250 m a.s.l. After the event, the snow line altitude gradually increased, reaching an altitude similar to that of January 2021 (∼ 4200–4400 m a.s.l., with 4493 m a.s.l. as the maximum value) but did not return to its pre-event altitude by the end of the hydrological year.
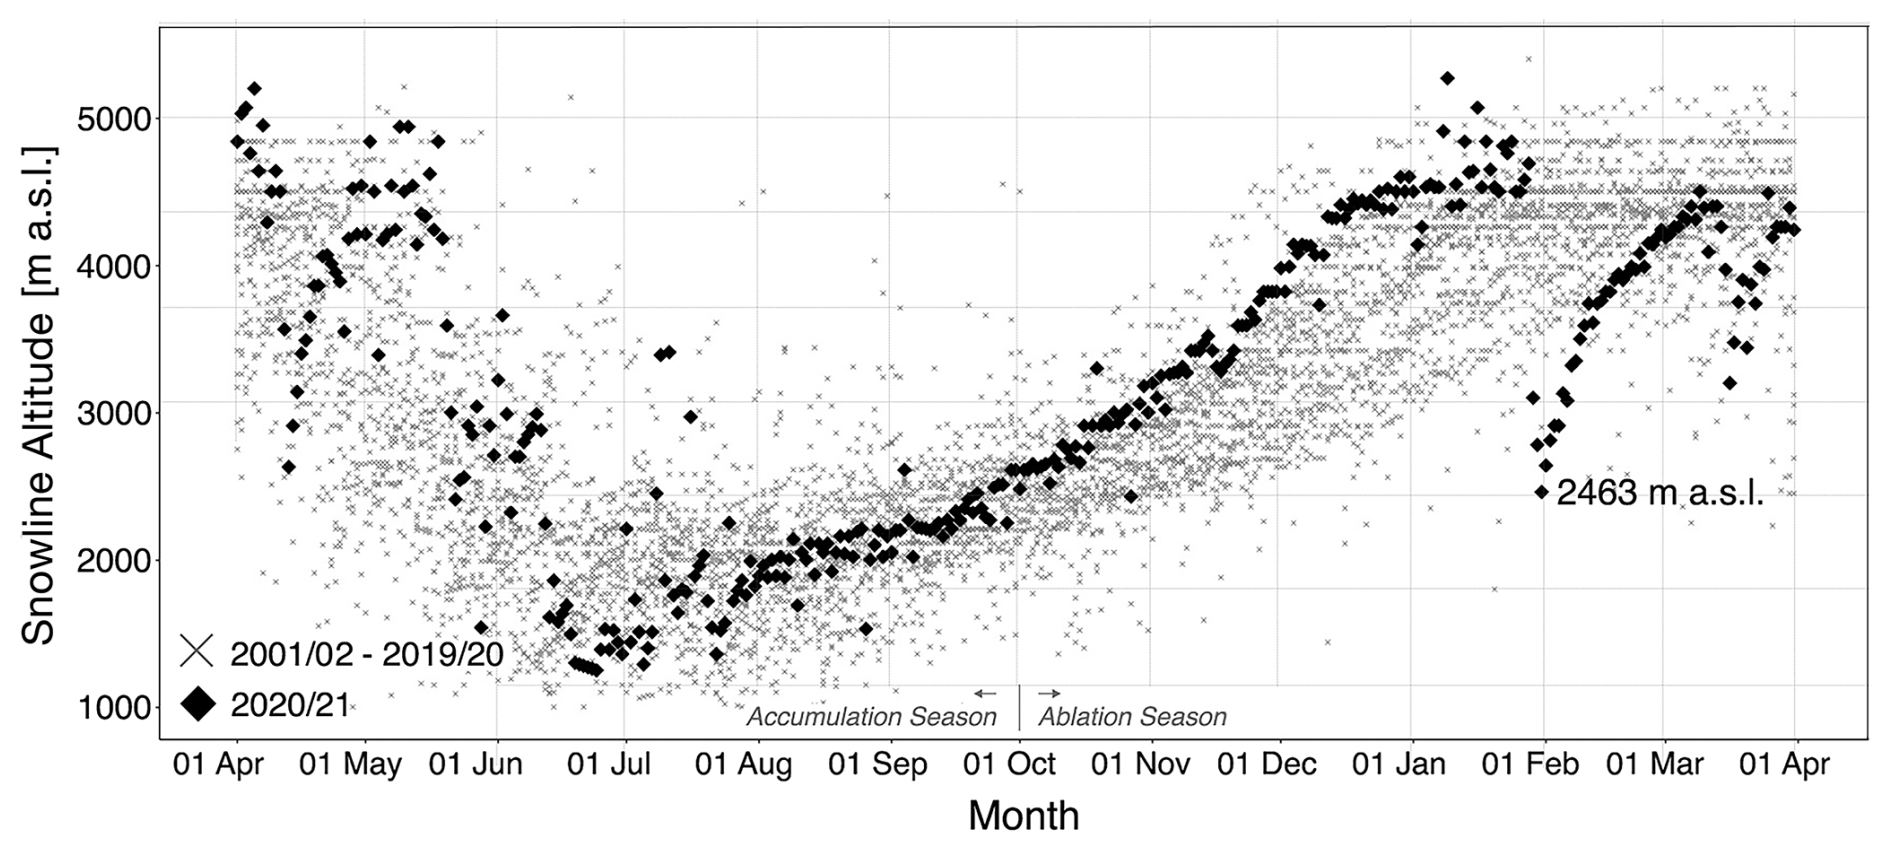
Figure 4Snow line time series at the Maipo River basin for the hydrological years between 2001 and 2019 (grey crosses) and 2020–2021 (black diamonds). The lower snow line altitude reached during the event is indicated (2463 m a.s.l.).
4.3 The 0 °C isotherm altitude at the Olivares River sub-basin
In the days before the event (25 to 28 January), the 0 °C isotherm altitude was estimated to be between 4000 and 4500 m a.s.l., with a marked diurnal cycle (Fig. 5). The 0 °C isotherm altitude estimations from the in situ air temperature sensors and radiosonde data were practically the same. At the onset of the event (i.e. 29 January), the 0 °C isotherm decreased to around 3700–3900 m a.s.l., and the next day, it decreased further to 3250 m a.s.l. This last value corresponds to the minimum altitude of the 0 °C isotherm during the event and coincides with the maximum precipitation rate recorded by the GEONOR sensor (Fig. 5). Around this time, all glacier areas in the Olivares River sub-basin were accumulating snow during the first half of the 30 January. A rapid increase in the 0 °C isotherm altitude occurred after midday on 30 January, resulting in positive temperatures at the glaciers' lowest elevations, particularly in the frontal sections of the Olivares Gama and Juncal Sur glaciers, which extend to around 3800 m a.s.l. On 31 January, the 0° isotherm decreased to similar altitudes to those estimated on the previous day, oscillating between 3300–3500 m a.s.l., coinciding with the event's second highest precipitation rate. Consequently, the total glacier area of the basin experienced negative air temperatures. On the days after 1 February, no precipitation was recorded, and the 0 °C isotherm oscillated between 3500 to 3800 m a.s.l. until 3 February, when it quickly rose to pre-event levels. During the post-event days (after 1 February), the radiosonde-derived 0 °C isotherm was lower than the 0 °C isotherm estimate from in situ temperature sensors. Offline trajectory analysis indicates that the discrepancy could be related to the radiosonde trajectory as it travelled towards the Andes on 29 and 30 January but northwest over the Pacific Ocean on 2 February (see Fig. S2). We hypothesise that this difference in trajectories determines the discrepancy.
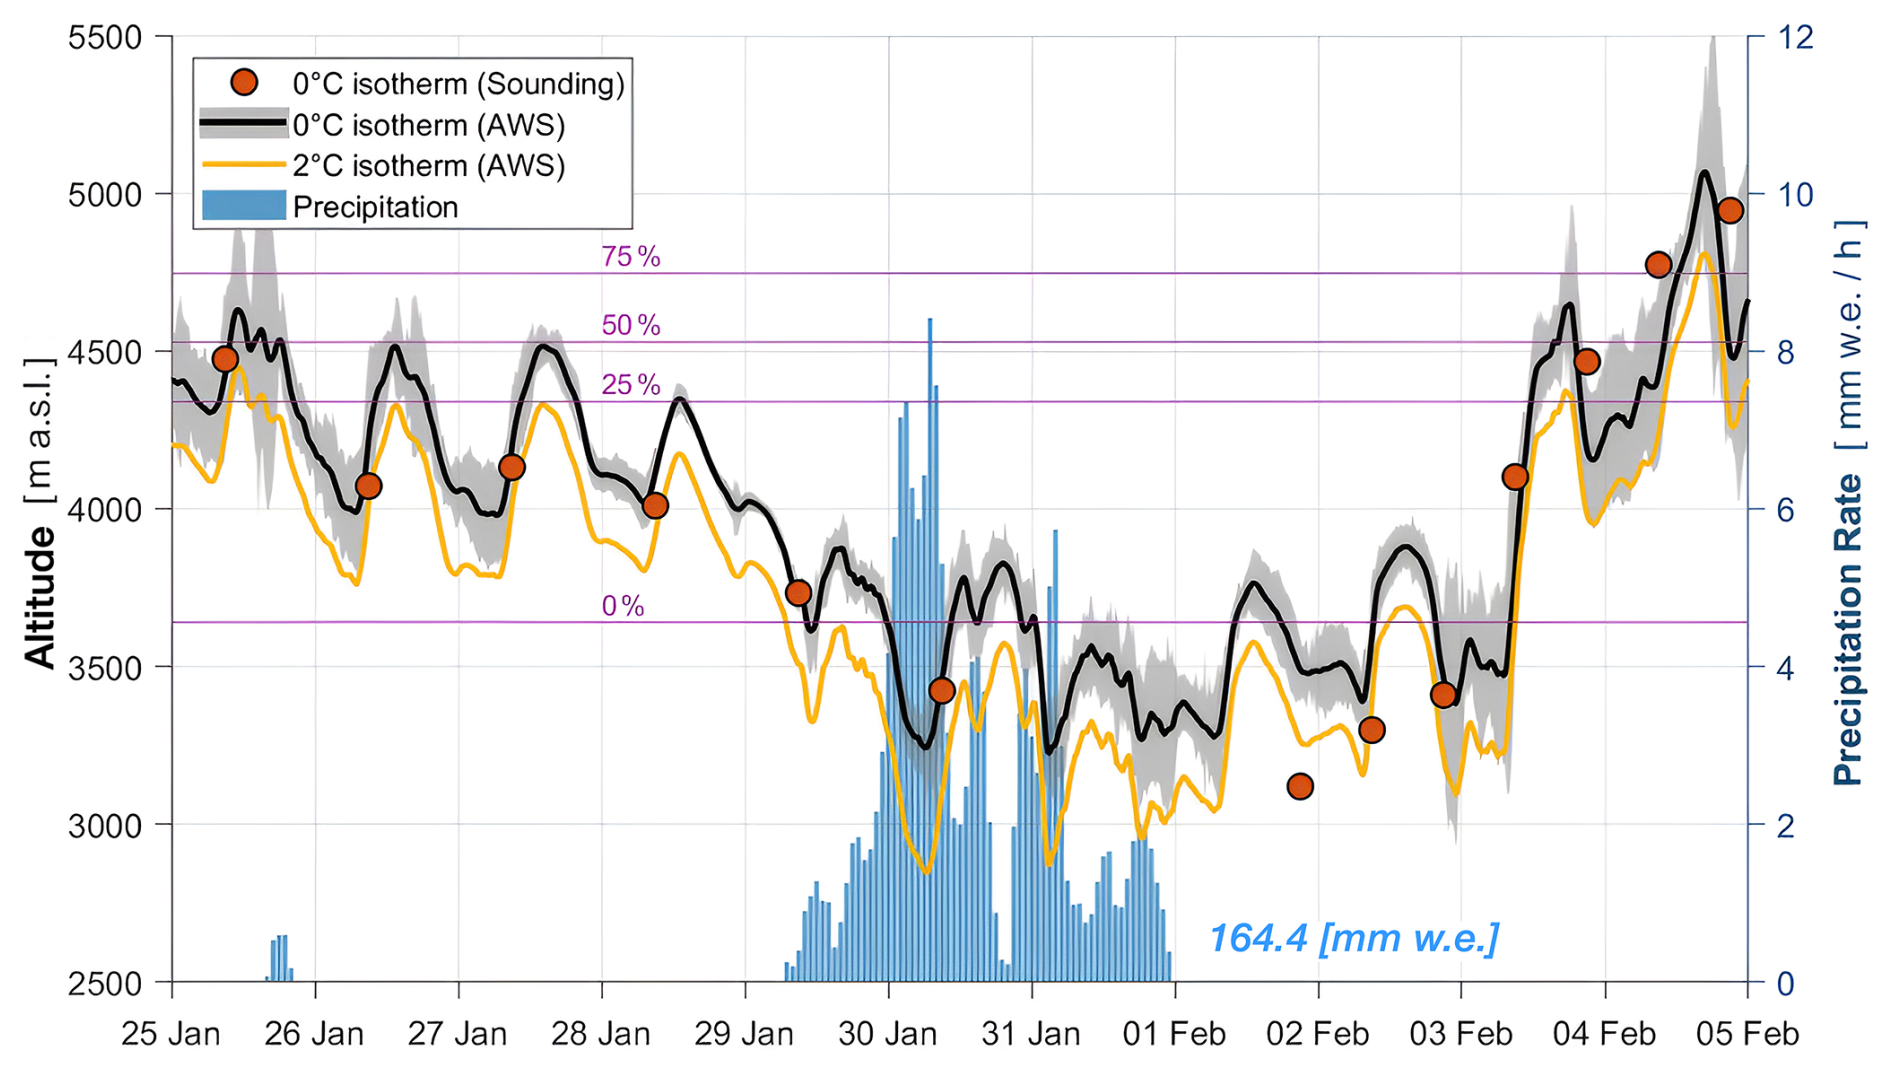
Figure 5Time series of the 0 °C isotherm (left axis) around the event. The black line corresponds to the calculated values using several air temperature sensors installed in the basin (Fig. 1). Red circles correspond to the 0 °C isotherm obtained from the Santo Domingo radio sounding. Bars indicate the hourly precipitation rate (right axis) recorded by the GEONOR T200B-M. Percentages correspond to the glacier area hypsometry of the Olivares River sub-basin. As a reference, the 2 °C isotherm is also shown with a yellow line.
4.4 Surface energy flux changes during the event at the Olivares Alfa Glacier surface
DJF averaged modelled fluxes from 2014 to 2021, as shown in Table 2, indicate that the main source of energy on the glacier surface is the net shortwave radiation (mean of 120 W m−2), and the main energy loss is from the net longwave radiation (−53 W m−2). Latent heat fluxes are predominantly negative (mean of −39 W m−2), indicating that the glacier surface sublimates during the ablation season. Conversely, sensible heat flux is positive (mean of 18 W m−2), reflecting a lower glacier surface temperature compared to the surrounding air temperature. Ground heat fluxes vary between positive and negative values the during nighttime and daytime, respectively (Fig. 6). The long-term available melt energy typically reaches a mean value of 54 W m−2 at this time of the year, with the maximum being around 150 W m−2, for instance, as estimated just before the AR event (Fig. 6).
During the summer 2021 AR event, these typical summertime values changed (Fig. 6, Table 2). There was a notable decrease in both the net shortwave and longwave radiation on 29 and 30 January, coinciding with the maximum precipitation rate and AR moisture transport (Figs. 2a and 5). The event's mean net shortwave and longwave radiation values during the event were 22 and −17 W m−2, respectively. Continuous cloud cover during the storm reduced the variability in net longwave radiation, which turned positive for a short period. Turbulent fluxes tended to decrease as well. Latent heat flux dropped (i.e. became less negative) due to added atmospheric water vapour by the AR and the decrease in the melting rate on the glacier surface, diminishing the humidity gradient between the surface and air. Similarly, sensible heat flux decreased because of the reduced air temperature during the storm and the persistent cloud cover, lessening the temperature gradient between the surface and air. On 30 and 31 January, negative values of sensible heat flux were estimated, indicating that the glacier surface was warmer than the surrounding air. Melt energy was available again 3 d after the event.
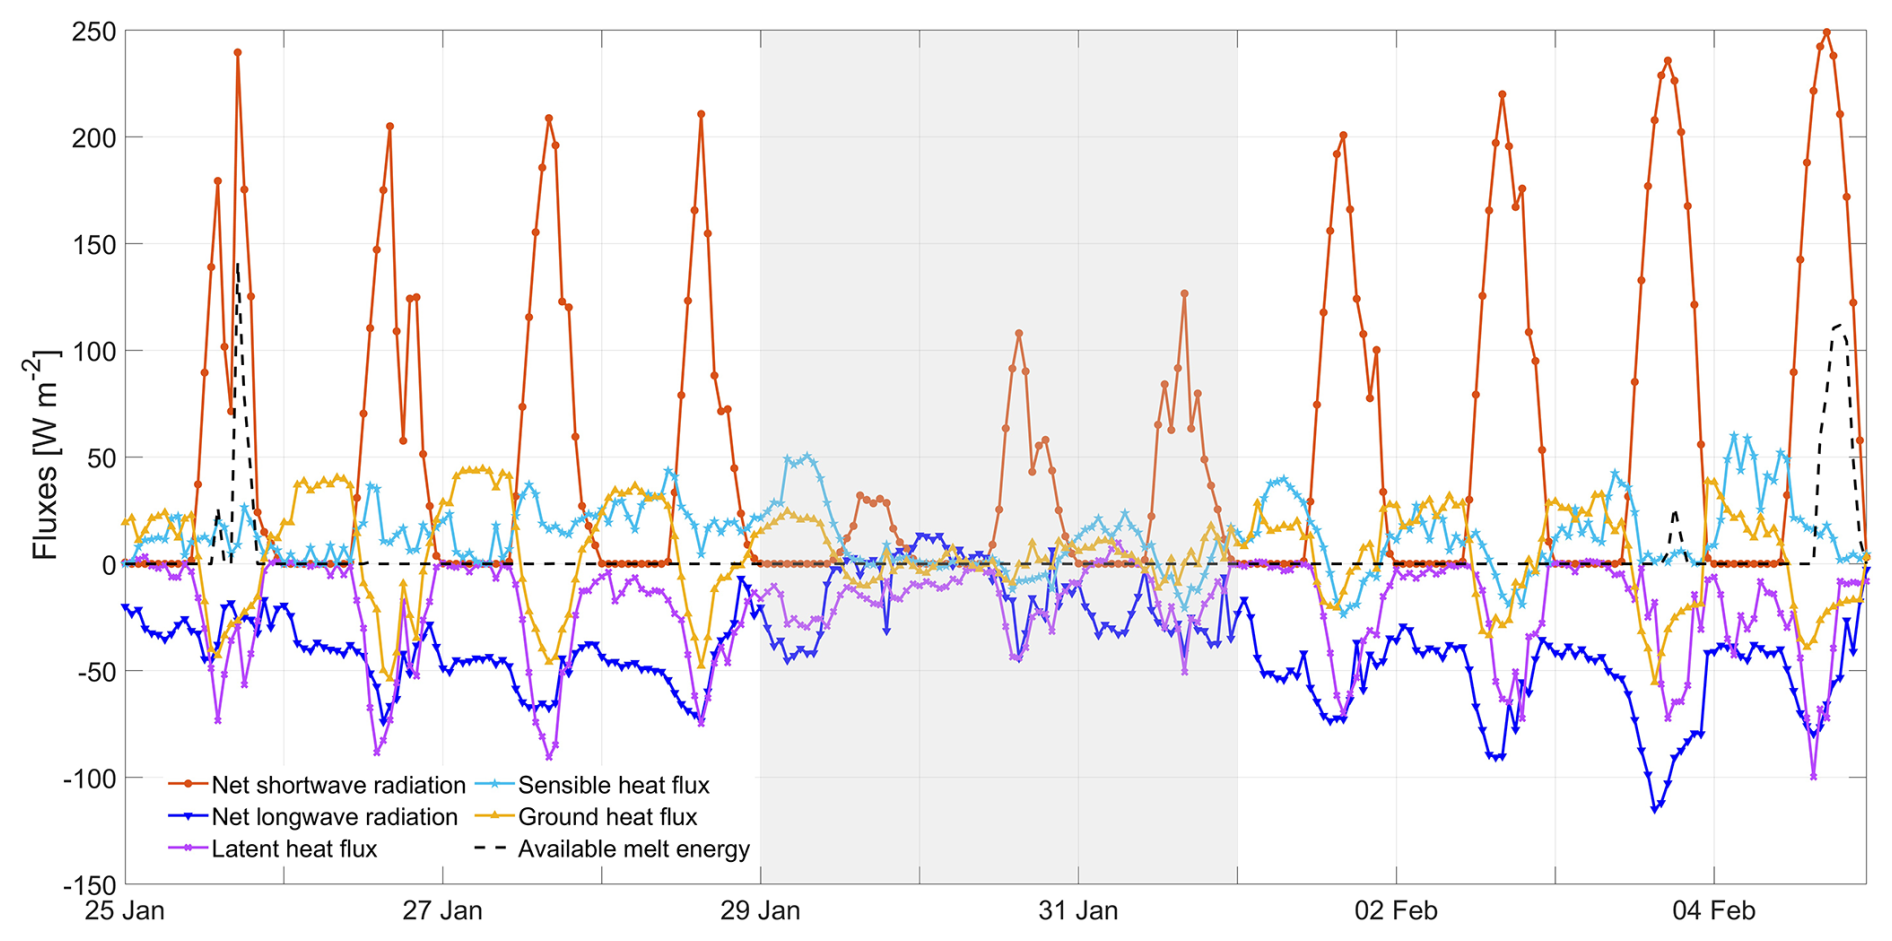
Figure 6Glacier energy balance surface fluxes estimated by COSIPY model forced with the Olivares Alfa AWS (Fig. 1). The grey area corresponds to the dates of the AR event (Valenzuela et al., 2022).
4.5 Simulation of the Olivares Alfa Glacier mass balance
The simulated mass balances of the Olivares Alfa Glacier for the hydrological years (April–March) between 2014–2015 and 2020–2021 are shown in Fig. 7; 3 of all 7 years finished with a negative mass balance (Fig. 7a), with the mass balance of the 2019–2020 year being the most negative (−3.2 m w.e.). A total of 3 years finished with near-neutral mass balances (including the 2020–2021 year), and only the mass balance in 2016–2017 finished being clearly positive at 0.25 m w.e., with the mean of the 7-year period being −0.8 m w.e. Typically, ablation in April is larger than accumulation (Fig. 7c), occasionally interrupted by snow accumulation events depending on the hydrological year (Fig. 7b). The 2015–2016 year shows that the ablation ceased due to temperature drops, stabilising at around −0.5 m w.e. before the first accumulation event in July. Accumulation in the hydrological year of 2016–2017 was mostly due to a significant event in April.
The hydrological year of 2020–2021 shows a period of accumulation concentrated mainly during June (see Fig. 7b). Before this month, no important accumulation events were observed at the start of the hydrological year (April–May), which was dominated by ablation. After July, no important accumulation events were observed, keeping the mass balance close to equilibrium. In this hydrological year, the ablation started in September 2020, earlier than expected, albeit gradually. No accumulation events were observed in the ablation season until the summer 2021 AR event. In spring and part of the summer, the mass balance experienced a gradual decrease, showing strong ablation primarily due to melting (Fig. 7c). This tendency was abruptly interrupted by the summer 2021 AR event. Compared to previous years and due to the AR event, the mass balance of this hydrological year was near equilibrium, as with the 2015–2016 and the 2018–2019 hydrological years. The spatial distribution of the mass balance is shown in Fig. S3. As expected, a spatial gradient in the mass balance is evident, with a consistently larger mass loss in the frontal zone during all the years. The mass balance in 2014–2015 and 2019–2020 experienced the most significant surface mass loss.
We performed a hypothetical experiment in the mass balance simulation during the 2020–2021 hydrological year, assuming the AR event did not occur (Fig. 8). In this hypothetical scenario, the mass balance would have ranged between −2.4 and −0.6 m w.e. (mean of −1.5 m w.e.) instead of the near-zero value observed, underscoring the significant impact of this singular accumulation event in the ablation season on the annual mass balance.
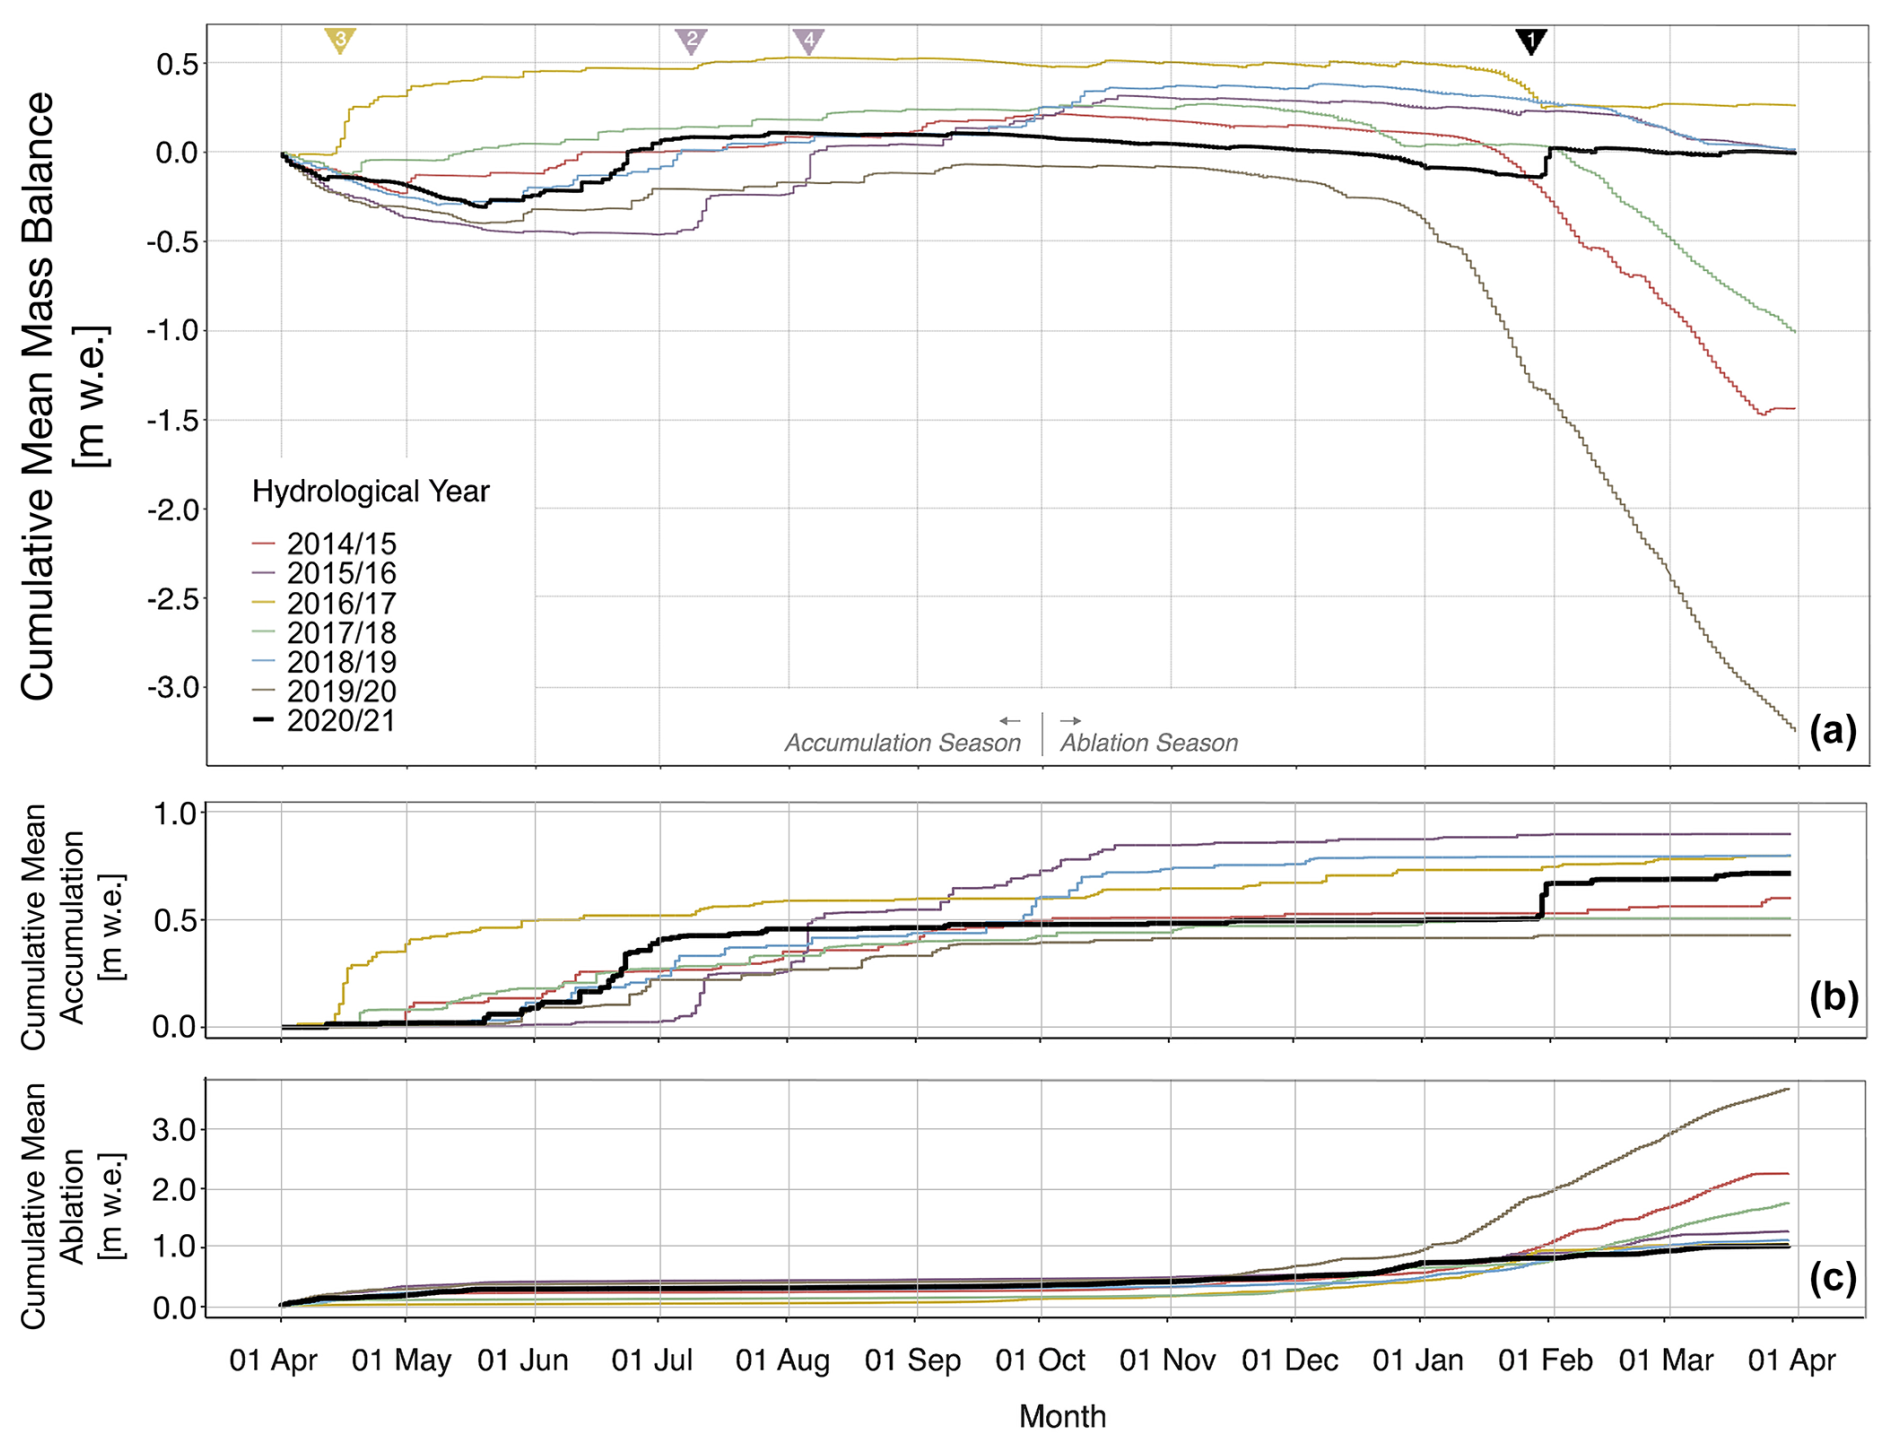
Figure 7(a) Cumulative spatial mean mass balance, (b) cumulative spatial mean accumulation and (c) cumulative spatial mean ablation of the Olivares Alfa Glacier for 7 hydrological years (from 2014–2015 to 2020–2021). Triangles at the top are the AR events mentioned in the text with their respective categories. Note that the vertical-axis scales are different.
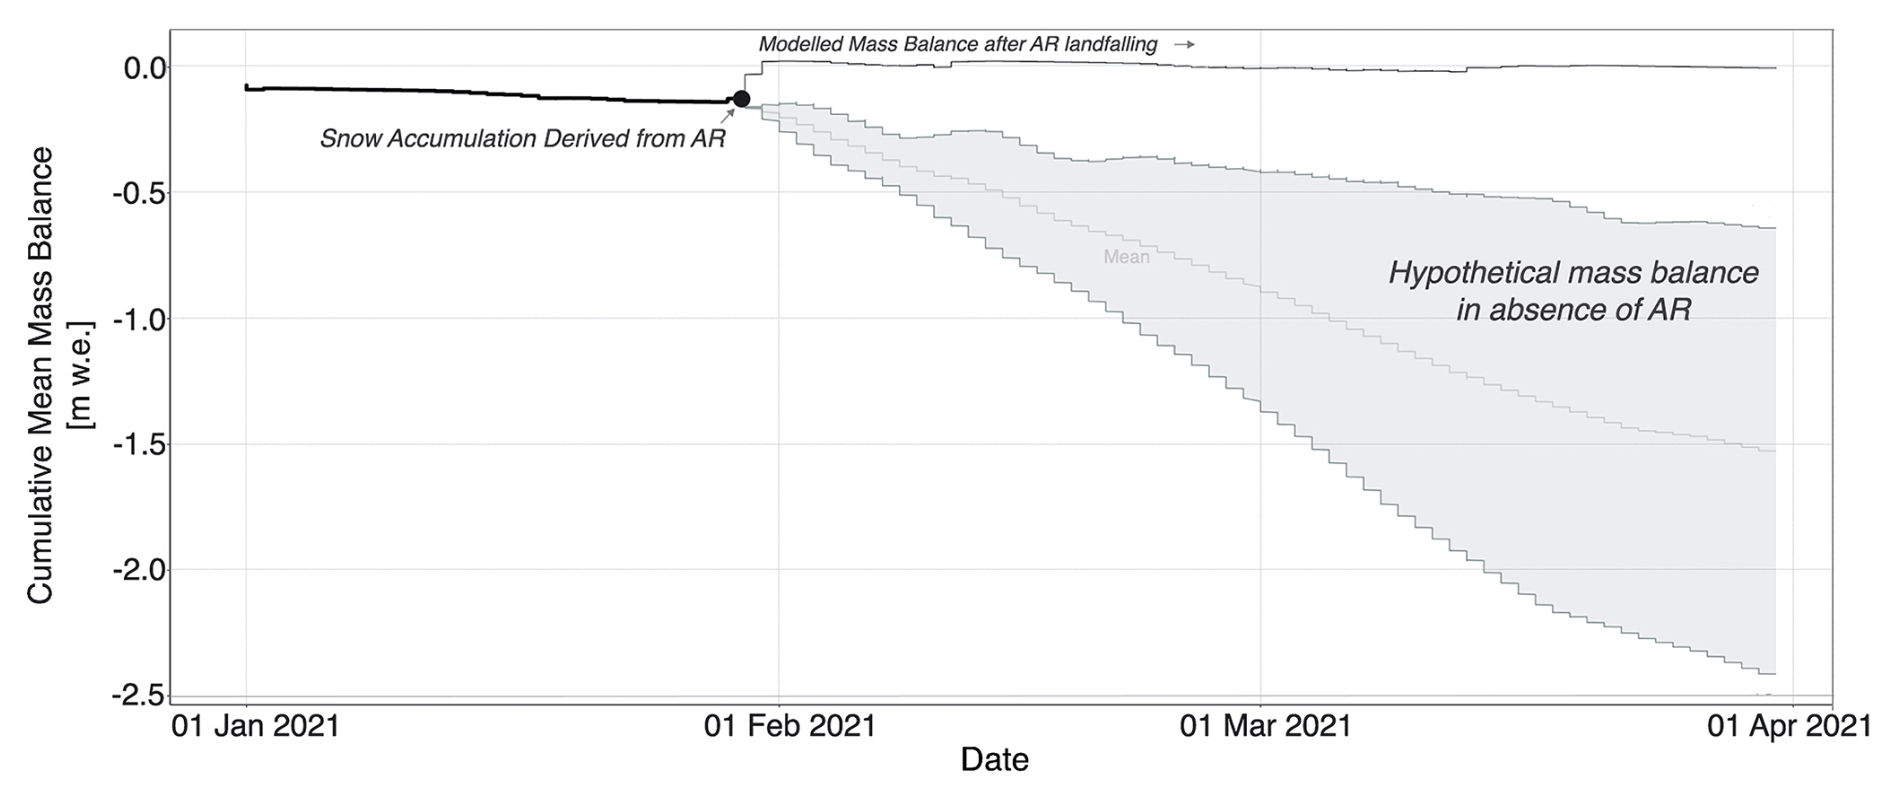
Figure 8Hypothetical glacier mass balance scenarios for the 2020–2021 hydrological year without occurrence of the summer 2021 AR event. The graph shows a zoom for the period of January to March 2021. The uncertainty range corresponds to the maximum and minimum values.
5.1 Modelling approach: uncertainties and comparison with previous studies
The modelling approach incorporates several parameterisations and assumptions which may introduce uncertainty into the outputs of the model. For instance, using a constant lapse rate for air temperature is not realistic. This rate is spatially and temporally dependent on meteorological conditions (e.g. Bravo et al., 2019a). Snow albedo is highly parameterised following the snow age approach (Sauter et al., 2020; Oerlemans and Knap, 1998), while ice albedo is assumed to be spatially constant when snowpack thickness is 0 m. In consequence, the ice albedo parameterisation neglected ice spatial heterogeneity in a glacier where deposition of light-absorbing impurities from different sources has been detected (Barandun et al., 2022), contributing to a darkening trend of the glacier surface albedo (Shaw et al., 2021). Moreover, small spatial heterogeneity is not captured by the model as the glacier model runs at a 100 m grid size. Indeed, the presence of penitentes – spiky structures of compacted old snow and ice found on central Chilean glaciers (Lliboutry, 1954) – has been noted in the Olivares River sub-basin glaciers. A pre-event picture of Paloma Norte Glacier (Fig. S4; see Fig. 1 for location) shows the existence of penitentes. This glacier feature significantly affects energy balance fluxes by altering net shortwave and longwave radiation compared to a flat surface (Corripio and Purves, 2005). Further, despite the context of mega-drought in Chile (Garreaud et al., 2019), with almost all the years showing below-average precipitation (see Fig. S5 for Lagunitas), the assumption of no snow at the start of each hydrological year could lead to an underestimation of the mass balance since snow could persist from one year to the next.
Despite these complexities, the model's primary focus is to evaluate the relative impact of AR events on the mass balance and not to precisely replicate the exact conditions of the Olivares Alfa Glacier. Thus, the model maintains consistent parameters across each hydrological year to evaluate the general surface energy fluxes and mass balances of the glacier. Although no direct measurements of energy balance fluxes for Olivares Alfa Glacier exist, similar modelling and observational analyses have been conducted on nearby glaciers, such as the Juncal Norte in the Aconcagua River Basin, as well as on the Bello and the San Francisco in the Maipo River basin (Ayala et al., 2017; Schaefer et al., 2020), all of them focusing on summer months. When comparing summertime mean values for different glaciers (Table 2), a consensus exists that net shortwave radiation and sensible heat fluxes function as sources of energy, whereas net longwave radiation and latent heat fluxes act as energy sinks.
Table 2Comparison of energy balance fluxes estimated in summertime in this work (Olivares Alfa Glacier) and by previous studies for nearby glaciers of central Chile.
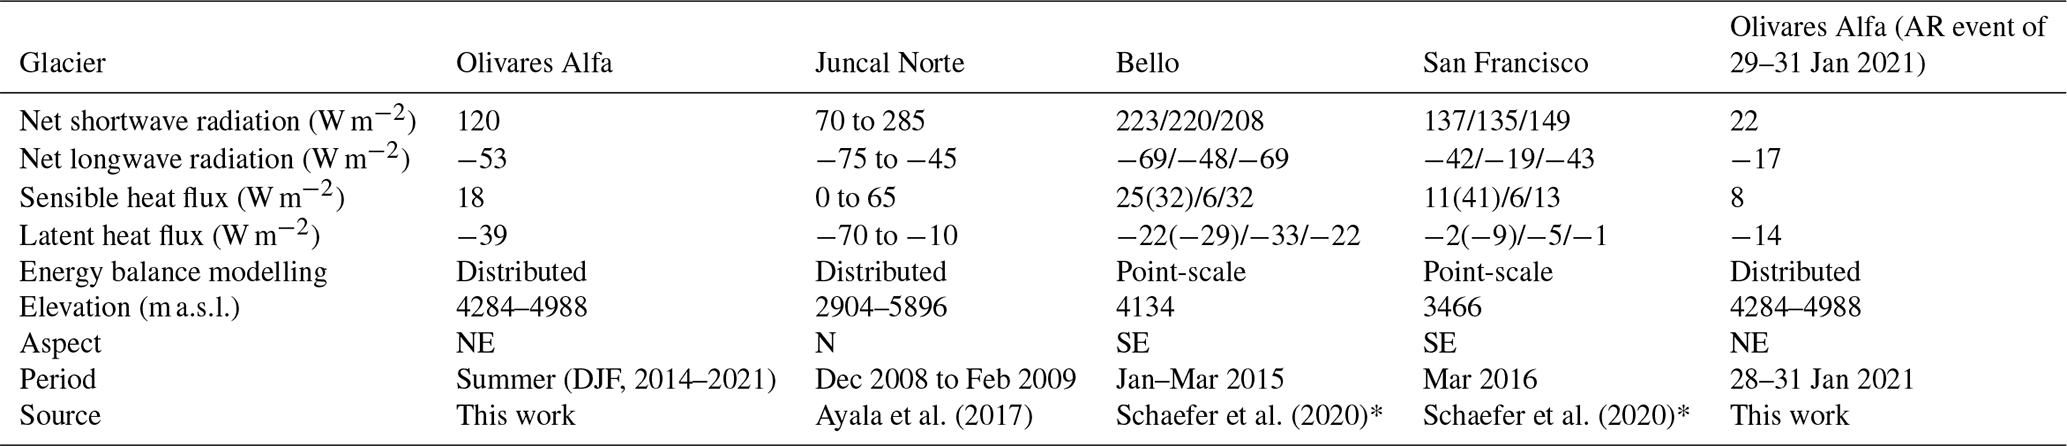
* Schaefer et al.(2020) estimated the energy fluxes using three different approaches.
Radiative and turbulent fluxes in Olivares Alfa align with those from previous studies (Table 2) despite the inherent differences due to distributed versus point-scale modelling, such as varying periods, elevation and aspect. The Juncal Norte and Olivares Alfa glaciers share a similar northward aspect, contrasting with the predominantly southeast-facing San Francisco and Bello glaciers. Characteristics of valley topography and shadow cast effect also contribute to flux spatial variations.
Regarding mass balance, geodetic estimations for Olivares Alfa Glacier over the last 20 years are negative, ranging from −0.5 to −1.2 m w.e., with variations depending on the period (Farías-Barahona et al., 2020; Hugonnet et al., 2021). Estimation by Hugonnet et al. (2021) shows that the mean mass loss in Olivares Alfa reached −1.2 m w.e. for the period of 2015–2019, which is slightly higher than our estimates of −0.9 m w.e. for the same period. Our 7-year model average was −0.8 m w.e., comparable to the −0.9 m w.e. (2000–2013) and −0.8 m w.e. (2000–2019) estimates by Farías-Barahona et al. (2020) and Hugonnet et al. (2021), respectively.
The nearby glacier Echaurren Norte (0.2 km2), monitored annually with the glaciological method by the Chilean Water Directorate (DGA) and reported to the World Glacier Monitoring Service (WGMS, 2023), showed a negative mass balance with a mean of −1.9 m w.e. during the same period as that of this study. This difference is likely due to its elevation range (3650–3880 m a.s.l.). Its interannual variability magnitude is 1.1 compared to 1.3 m w.e. for Olivares Alfa. Despite slight discrepancies of 0.1 to 0.3 m w.e. compared to geodetic balances, our modelling result is deemed to be effective in capturing the atmospheric condition responses and interannual variability for Olivares Alfa Glacier.
5.2 A glacier accumulation event rather than a glacier-melting event
Despite the AR event in January 2021 being a warm mid-latitude frontal storm (Valenzuela et al. 2022) and despite there being some documentation of ARs with glacier melt events in mid-latitude regions (e.g. Little et al., 2019; Kropač et al., 2021; Box et al., 2022), the summer 2021 AR event in the central Andes of Chile predominantly caused snow accumulation on the glaciers in the Maipo River basin glaciers.
Several factors explain this impact. At the synoptic scale, although humidity by itself is not a factor to determine whether an event is accumulation or melt, the significant moisture transport determines the magnitude of, in this case, the accumulation on the glacier surface and its imprint in the mass balance for 2020–2021 (Fig. 7). Additionally, the long duration of the event contributed significantly to the remarkably larger accumulation over the glaciers in summer compared to previous years. By comparison, AR events in winter can exhibit much higher IVT values, reaching up to 1056 kg m−1 s−1, like the AR category-4 event in early August 2015 (Table S2), which is also reflected in the accumulated mass balance (Fig. 7).
A primary factor to determine snow accumulation is the freezing level. At the Maipo River basin, the post-event snow line altitude was below the elevation of the frontal zones of the lower glaciers, which, according to Ayala et al. (2020), are around 2600–2700 m a.s.l. However, although snow accumulation was predominant, we cannot rule out that melt and rain occurred in some glaciers during the event, especially on the lower glaciers in the Maipo River basin.
Glaciers in the Olivares River sub-basin are located above 3500–3600 m a.s.l. (Fig. 1), and the freezing level during the precipitation event descended to 3200 m a.s.l. Precipitation at the beginning of the event occurred with the 0 °C isotherm at around 3600–3800 m a.s.l., suggesting positive temperatures at lower glacier sections and probably sleet-type precipitation. However, as a result, the post-event snow line altitude was around 2500 m a.s.l. This indicates that snow accumulation began at temperatures above freezing. Such disparity aligns with the variability of the rain–snow temperature threshold noted in other studies (e.g. Jennings et al., 2018). Indeed, differences of about 280 m between the snow line and the 0 °C isotherm are observed during storms in the Andes at 30° S (Schauwecker et al., 2022), which can extend up to ∼500 m during high-rate precipitation events. The high precipitation rate during the event occurred with the lower 0 °C isotherm, calculated to be 3250 m a.s.l., while the snow line after the event was estimated to be 2460 m a.s.l., indicating a 790 m difference. Furthermore, the 2 °C isotherm, commonly used to define the rain–snow partitioning (e.g. Koppes et al., 2011), reached a minimum altitude of 2800 m a.s.l. (Fig. 5), still above the detected snow line. Minder et al. (2011) presents an experiment to understand the difference between the 0 °C isotherm and the snow line, discussing three physical processes driving this behaviour. An important conclusion is that this difference increases with increasing temperatures. Considering the fact that zonally oriented ARs are relatively warmer storms, the difference found in our work could be attributed to this condition compared to the more recurrent winter cold fronts.
Over the Olivares Alfa Glacier, summer snow accumulation is not unusual. To illustrate this, Fig. 9 shows the hourly precipitation and its corresponding temperatures recorded in January and February between 2014 and 2021 by the GEONOR and the AWSOA (Fig. 1). Overall, hourly events larger than 1–2 mm h−1 occur with negative temperatures or with temperatures of up to 2 °C, meaning that snow and sleet prevail. Events with temperatures greater than 2 °C are less frequent and weak, usually in the 0.1 to 1 mm h−1 range. These warm rain events may come from weak high-mountain convective cells, typical of the summertime in the western slope of the Andes (Viale and Garreaud, 2014). Consequently, the AR impact is related to the snow accumulation, as shown in Fig. 9. Additionally, the impact of the AR resulted in no available melt energy during and almost 3 d after the event. During the summertime, the availability of melt energy is typical in subtropical Andean glaciers, even at the elevation of Olivares Alfa Glacier (Table 2). The reduction in the temperature and humidity gradients between the atmosphere and the glacier surface reduces the magnitude of the turbulent fluxes. Furthermore, cloud cover decreases net shortwave radiation, while net longwave radiation remains a net sink, only briefly becoming an energy source (Fig. 6). However, these conditions cannot be generalised for all the Maipo glaciers.
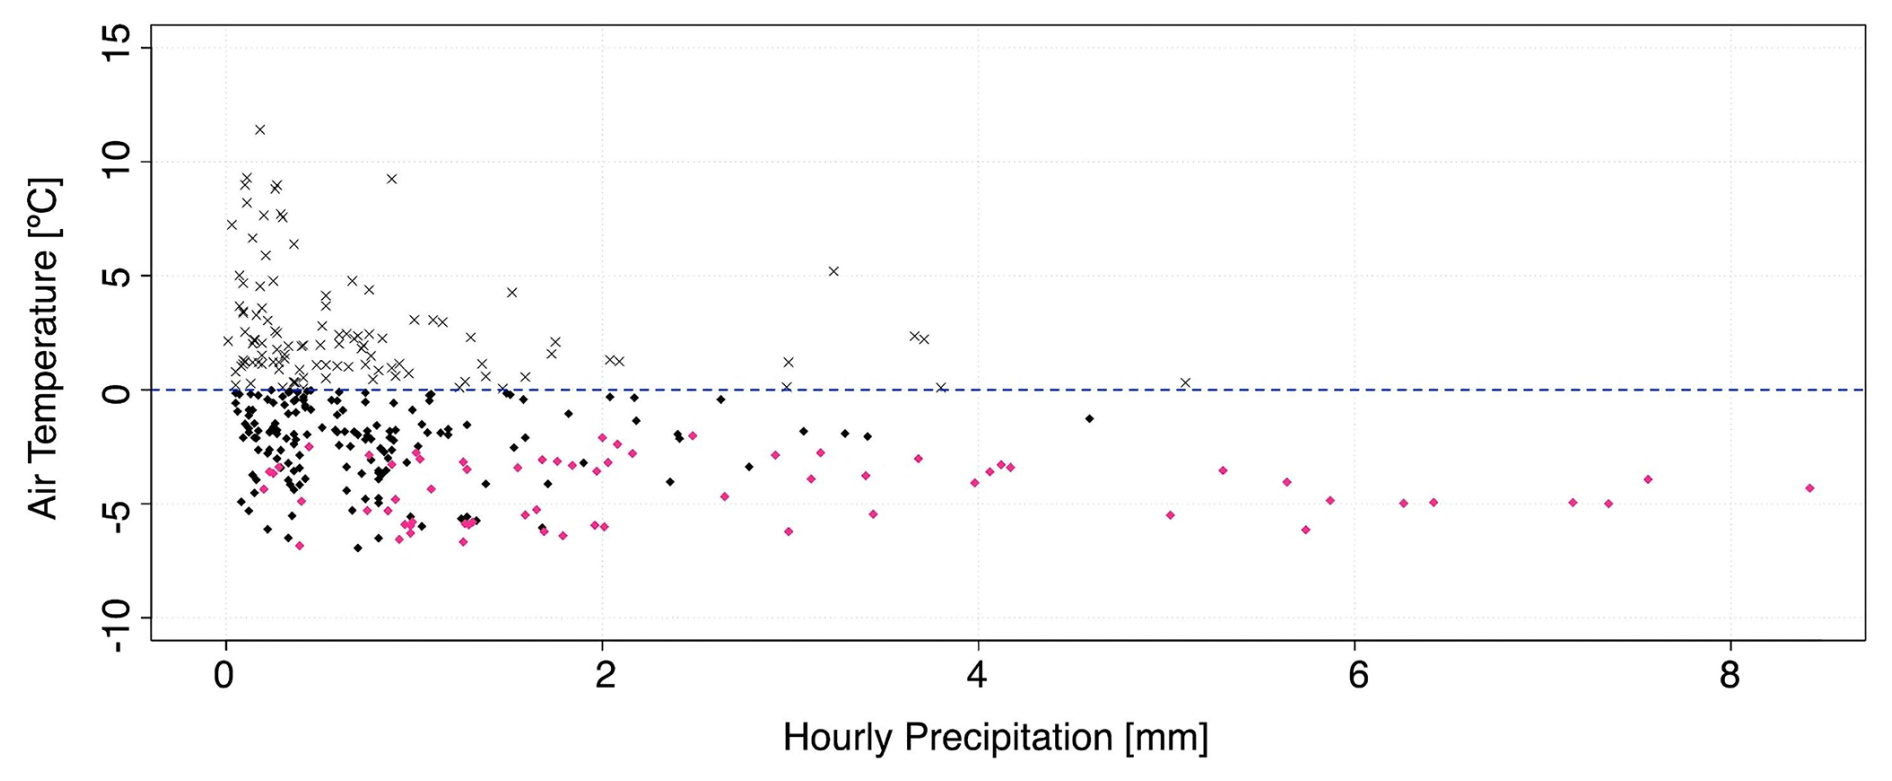
Figure 9Scatterplot of the precipitation events recorded by the GEONOR sensor and of the air temperature recorded by the AWSOA. Hourly data correspond to January and February for the years 2014 to 2021. Crosses show precipitation events with positive air temperatures, and diamonds show precipitation events with negative air temperatures. Pink diamonds are the precipitation rates during the event at the end of January 2021.
Conversely, Brewster Glacier in the southern Alps of New Zealand experienced increased turbulent heat fluxes from the atmosphere to the glacier during a summer AR event (6 February 2011; Kropač et al., 2021), increasing the energy available for melt. The main environmental differences between the glaciers in the southern Alps and those in the subtropical Andes are related to the geographic and climatic conditions. Olivares Alfa is a high-elevation glacier with a relatively dry atmosphere, while Brewster Glacier is located at a lower elevation in a maritime environment. Both glaciers naturally experienced reduced net shortwave radiation during the summertime AR events due to cloud cover. However, while cloud cover, precipitation type and air temperature during the summer AR event contribute as energy sources through the flux of incoming longwave radiation at the Brewster Glacier, they represent an energy sink at the Olivares Alfa Glacier. For the latent heat flux, the AR event's moisture input increased the humidity gradient at Brewster Glacier, enhancing latent heat flux, whereas, at Olivares Alfa Glacier, the atmosphere's humidity neared surface conditions, reducing the gradient. Sensible heat flux increased at Brewster Glacier due to higher atmospheric temperatures compared to the glacier surface, contrasting to the decreased flux at Olivares Alfa Glacier, where air temperature approached surface temperatures, reducing the energy available for melting. The conditions at Brewster Glacier during AR events may align closely with those observed in glaciers situated in Patagonian environments (Brown, 2020), highlighting the varied impacts of AR events based on geographic and climatic settings.
5.3 Seasonal conditions vs. one extreme event
A regional signature of this particular AR event can be determined for all glaciers in the Maipo River basin. The mass balance record of Echaurren Norte Glacier (WGMS, 2023) shows that 2020–2021 was the second least negative (−0.7 m w.e.) hydrological year since 2010, only surpassed by the 2016–2017 hydrological year (−0.4 m w.e.). It is generally accepted that glacier mass balance in the subtropical Andes is influenced by the interannual variability of the snow accumulation (Masiokas et al., 2016), which is often linked to ENSO conditions, with El Niño conditions typically bringing about higher amounts of snow accumulation (Cortés and Margulis, 2017). This suggests a correlation between El Niño conditions and positive glacier mass balance, as observed at Echaurren Norte Glacier (Farías-Barahona et al., 2019). Furthermore, AR frequency is anticipated to rise during the El Niño phases (Saavedra et al., 2020; Campos and Rondanelli, 2023). The 2020–2021 year, however, was dominated by La Niña, notably during the summer when the AR event occurred. These conditions and our findings give insights into how an extraordinary and unseasonal snow accumulation event can significantly impact the glacier mass balance, extending beyond the usual impacts of large-scale drivers like ENSO.
As we showed, the mass balance of Olivares Alfa Glacier in 2020–2021 was near equilibrium. Without the AR event, the mass balance would have been more negative, potentially rivalling or surpassing the second most negative mass balance recorded in 2014–2015. This is likely to be the case according to our statistical scenarios (Fig. 8) but is also supported by the higher spring snow line altitude over the past 20 years (Fig. 4) and the below-average winter–spring precipitation (April to December) as recorded by the Lagunitas meteorological station (Fig. S5). However, the 2020–2021 mass balance was comparable to that of 2015–2016 and 2018–2019, the 2 years with the highest winter accumulation during the 7 years analysed in the Olivares River sub-basin. In particular, the 2015–2016 year experienced two major winter AR events under El Niño conditions, one in mid-July and another between 5 and 9 August (category 4).
The 2016–2017 hydrological year had the most positive mass balance, characterised by an important accumulation event in April 2016, which, indeed, was an AR category-3 event (Fig. 7, Table S2). After several accumulation events of lower magnitude in winter and spring 2016, the mass balance stabilised at about 0.5 m w.e. until ablation started in January 2017. Early in the year, El Niño conditions favoured AR events (Saavedra et al., 2020; Campos and Rondanelli, 2023), but the latter part of the year shifted to neutral and La Niña conditions. Contrarily to typical expectations, the 2016–2017 positive mass balance was during predominant La Niña conditions, significantly impacted by a single autumn AR event, illustrating how ENSO and AR events jointly influenced the 2016–2017 annual mass balance.
It is important to remark that the impact is not solely from the event itself. Two small accumulation events in February and March (Fig. 7b), combined with relatively low air temperature during these months (Fig. S6), reduced the ablation rates towards the end of the hydrological year (Fig. 7c).
In this study, we investigated the impact of an unseasonal atmospheric river (AR) and its associated unusual summertime orographic precipitation on the mass balance of the Olivares Alfa Glacier in the Maipo River basin. This summer AR transported a large amount of water vapour from lower latitudes, impacting central Chile at the end of January 2021 and producing an extraordinary and unseasonal orographic precipitation event in the subtropical Andes (Valenzuela et al., 2022).
By utilising remote sensing, meteorological in situ observations and glacier modelling, we thoroughly assessed the impacts of this AR-driven precipitation event. A lower-than-normal 0 °C isotherm and a snow line below the glacier's elevation range were detected during and after the event, indicating predominant snow accumulation across the glaciers of the Olivares River sub-basin and, potentially, the entirety of the Maipo River basin's glaciers.
Modelling of the Olivares Alfa Glacier shows that the high unseasonal snow accumulation had a significant role in altering the annual mass balance. This glacier mass accumulation event abruptly interrupted the ongoing summertime melting trend for the rest of the ablation season. Surface energy balance analysis shows that melting energy was absent during the event, mainly due to the reduction in the typical source of energy in the summer, i.e. net shortwave radiation and sensible heat flux (Table 2). Although energy sinks, such as net longwave radiation and latent heat flux, saw a reduction in their magnitude, they did not offset the decrease in energy sources.
As a consequence, the 2020–2021 annual balance was near equilibrium (∼0 m w.e.) despite the high spring snow line and the below-normal winter precipitation typical of La Niña conditions. Further, a decrease in the ablation rate and the occurrence of small snow accumulation events in the period between after the event and until the end of the hydrological year contribute to the near equilibrium. In the context of 7 simulated hydrological years (from 2014–2015 to 2020–2021), the annual mass balance of the 2020–2021 year resembled those seen in previous El Niño years, underscoring how an extraordinary accumulation event can offset expected responses to large-scale climatic drivers like ENSO.
At a global scale, ARs are projected to become more frequent in a warming climate (Nellikkattil et al., 2023) and more intense in terms of their precipitation rate (Wang et al., 2023). Furthermore, Li and Ding (2024) found a poleward shift in the occurrence of ARs during the boreal winter between 1979 and 2022, increasing the occurrence south of 50° S and decreasing the occurrence north of 30° S. Given the impact of unseasonal snow accumulation tied to ARs, such as the January 2021 event, on glacier mass balance, we anticipate a growing influence of such events on Andean glaciers south of 30° S, particularly when they occur out of season. Moreover, in addition to causing unseasonal snow accumulations, ARs have the potential to trigger significant melting events. The occurrence of unseasonal extreme precipitation events, whether they lead to accumulation or melting, will introduce new challenges into our way of analysing glacier mass balance data, necessitating enhanced in situ campaigns, more comprehensive mass balance observations and expanded modelling efforts to better understand the spatiotemporal variability and impacts of such extreme events on glacier dynamics.
ERA5 data are available via the Copernicus Climate Data Store (https://doi.org/10.24381/cds.adbb2d47, Hersbach et al., 2023), radiosonde data are available via Integrated Global Radiosonde Archive (IGRA), Version 2 (https://doi.org/10.7289/V5X63K0Q, Durre et al., 2016) and MODIS daily snow cover data are available via the National Snow and Ice Data Center (https://n5eil01u.ecs.nsidc.org/MOST/MOD10_L2.061/) (Hall et al., 2006). The code for the COSIPY model (version 1.4) is available at https://github.com/cryotools/cosipy (Sauter et al., 2020; last access: 10 December 2024). Automatic weather station data and snowline time series data are available from the corresponding author upon request.
The supplement related to this article is available online at https://doi.org/10.5194/tc-19-1897-2025-supplement.
CB, SC and MV designed the outline of this study. PP prepared the weather station data and calculated 0 °C isotherm. NGL prepared the ERA5 data. SC ran the model and calculated snow line. MV catalogued the historic atmospheric river events. CB, SC, MV, PP and NGL contributed with the figures. CB and SC analysed the data and wrote the paper. DB and MV provided guidance on the interpretation of the results interpretation. MV, NGL and DB reviewed and edited the paper. All the authors contributed to the final paper.
The contact author has declared that none of the authors has any competing interests.
Publisher’s note: Copernicus Publications remains neutral with regard to jurisdictional claims made in the text, published maps, institutional affiliations, or any other geographical representation in this paper. While Copernicus Publications makes every effort to include appropriate place names, the final responsibility lies with the authors.
We acknowledge the providers of the data used in this work: the Copernicus Climate Change Service (C3S) Climate Data Store provided the ERA5 reanalysis data, the Integrated Global Radiosonde Archive (IGRA) Version 2 provided the radiosonde data, and the National Snow and Ice Data Center provided the MODIS daily snow cover product. We thank the team at Centro de Estudios Científicos (CECs), who installed, downloaded the data, and carried out the maintenance of the AWS and GEONOR between 2013 and 2021. Claudio Bravo and Deniz Bozkurt acknowledge the support of project no. ANID-CLIMAT-AMSUD230025. Maximiliano Viale is supported by FONCYT grant no. 2020-1722. Deniz Bozkurt received support from grant nos. ANID-FONDAP-1523A0002 and COPAS COASTAL ANID FB210021. We are grateful to the editor, Emily Collier, and to Alvaro Ayala and one anonymous reviewer for their detailed revisions and their constructive comments and suggestions.
This research has been supported by the Agencia Nacional de Investigación y Desarrollo (FONDECYT Iniciación grant no. 11240379).
This paper was edited by Emily Collier and reviewed by Álvaro Ayala and one anonymous referee.
Adusumilli, S., Fish, M. A., Fricker, H. A., and Medley, B.: Atmospheric river precipitation contributed to rapid increases in surface height of the West Antarctic Ice Sheet in 2019, Geophys. Res. Lett., 48, e2020GL091076, https://doi.org/10.1029/2020GL091076, 2021.
Alvarez-Garreton, C., Boisier, J. P., Garreaud, R., González, J., Rondanelli, R., Gayó, E., and Zambrano-Bigiarini, M.: HESS Opinions: The unsustainable use of groundwater conceals a “Day Zero”, Hydrol. Earth Syst. Sci., 28, 1605–1616, https://doi.org/10.5194/hess-28-1605-2024, 2024.
Ayala, A., Pellicciotti, F., Peleg, N., and Burlando, P.: Melt and surface sublimation across a glacier in a dry environment: distributed energy-balance modelling of Juncal Norte Glacier, Chile, J. Glaciol., 63, 803–822, https://doi.org/10.1017/jog.2017.46, 2017.
Ayala, Á., Farías-Barahona, D., Huss, M., Pellicciotti, F., McPhee, J., and Farinotti, D.: Glacier runoff variations since 1955 in the Maipo River basin, in the semiarid Andes of central Chile, The Cryosphere, 14, 2005–2027, https://doi.org/10.5194/tc-14-2005-2020, 2020.
Barandun, M., Bravo, C., Grobety, B., Jenk, T., Fang, L., Naegeli, K., Rivera, A., Cisternas, S., Münster, T., and Schwikowski, M.: Anthropogenic influence on surface changes at the Olivares Glaciers; Central Chile, Sci. Total. Environ., 833, 155068, https://doi.org/10.1016/j.scitotenv.2022.155068, 2022.
Barcaza, G., Nussbaumer, S., Tapia, G., Valdés, J., García, J., Videla, Y., Albornoz, A., and Arias, V.: Glacier inventory and recent glacier variations in the Andes of Chile, South America, Ann. Glaciol., 58, 1–15, https://doi.org/10.1017/aog.2017.28, 2017.
Box, G. E. P., Jenkins, G. M., Reinsel, G. C., and Ljung. G. M.: Time Series Analysis: Forecasting and Control (5th Ed.), Wiley, United States, 720 pp., ISBN 978-1-118-67502-1, 2015
Box, J. E., Wehrlé, A., van As, D., Fausto, R. S., Kjeldsen, K. K., Dachahuer, A., Ahlstrøm, A. P., and Picard, G.: Greenland Ice Sheet rainfall, heat and albedo feedback impacts from the mid-August 2021 Atmospheric River, Geophys. Res. Lett., 49, e2021GL097356, https://doi.org/10.1029/2021GL097356, 2022.
Bozkurt, D., Rondanelli, R., Garreaud, R., and Arriagada, A.: Impact of warmer eastern tropical Pacific SST on the March 2015 Atacama floods, Mon. Weather. Rev., 144, 4441–4460, https://doi.org/10.1175/MWR-D-16-0041.1, 2016.
Bozkurt, D., Marín, J., and Barrett, B.: Temperature and moisture transport during atmospheric blocking patterns around the Antarctic Peninsula, Weather Clim. Extrem., 38, 100506, https://doi.org/10.1016/j.wace.2022.100506, 2022.
Braun, M. H., Malz, P., Sommer, C., Farias-Barahona, D., Sauter, T., Casassa, G., Soruco, A., Skvarca, P., and Seehaus, T.: Constraining glacier elevation and mass changes in South America, Nat. Clim. Change., 9, 130–136, https://doi.org/10.1038/s41558-018-0375-7, 2019.
Bravo, C., Quincey, D. J., Ross, A. N., Rivera, A., Brock, B., and Silva, A.: Air temperature characteristics, distribution, and impact on modeled ablation for the South Patagonia Icefield, J. Geophys. Res-Atmos., 124, 907–925, https://doi.org/10.1029/2018JD028857, 2019a.
Brown, S. S.: The impact of subtropical atmospheric rivers on Patagonian glaciers, M.Sc. thesis, Faculty of Science and Engineering, Macquarie University, 95 pp., https://doi.org/10.25949/20541267.v1, 2020.
Campos, D. and Rondanelli, R.: ENSO-related precipitation variability in Central Chile: The role of large scale moisture transport, J. Geophys. Res.-Atmos., 128, e2023JD038671, https://doi.org/10.1029/2023JD038671, 2023.
Carey, M., Huggel, C., Bury, J., Portocarrero, C., and Haeberli, W.: An integrated socio-environmental framework for glacier hazard management and climate change adaptation: lessons from Lake 513, Cordillera Blanca, Perú, Clim. Change, 112, 733–767, https://doi.org/10.1007/s10584-011-0249-8, 2012.
Chen, X., Leung, L.R., Wigmosta, M., and Richmond, M.: Impact of atmospheric rivers on surface hydrological processes in western U.S. watersheds, J. Geophys. Res-Atmos., 124, 8896–8916, https://doi.org10.1029/2019JD030468, 2019.
Crespo, S.A., Lavergne, C., Fernandoy, F., Muñoz, A. A., Cara, L., and Olfos-Vargas, S.: Where does the Chilean Aconcagua river come from? Use of natural tracers for water genesis characterization in glacial and periglacial Environments, Water, 12, 2630, https://doi.org/10.3390/w12092630, 2020.
Corripio, J. G. and Purves, R. S.: Surface energy balance of high-altitude glaciers in the Central Andes: The effect of snow penitentes, in: Climate and Hydrology in Mountain Areas, edited by: de Jong, C., Collins, D., and Ranzi, R., Wiley, London, 15–27 pp., https://doi.org/10.1002/0470858249.ch3, 2005.
Cortés, G. and Margulis, S.: Impacts of El Niño and La Niña on interannual snow accumulation in the Andes: Results from a high-resolution 31year reanalysis, Geophys. Res. Lett., 44, 6859–6867, https://doi.org/10.1002/2017GL073826, 2017.
Da Ronco, P. and De Michele, C.: Cloud obstruction and snow cover in Alpine areas from MODIS products, Hydrol. Earth Syst. Sci., 18, 4579–4600, https://doi.org/10.5194/hess-18-4579-2014, 2014.
Demortier, A., Bozkurt, D., and Jacques-Coper, M.: Identifying key driving mechanisms of heat waves in central Chile, Clim. Dynam., 57, 2415–2432, https://doi.org/10.1007/s00382-021-05810-z, 2021.
Dolant, C., Langlois, A., Brucker, L., Royer, A., Roy, A., and Montpetit, B.: Meteorological inventory of rain-on-snow events in the Canadian Arctic Archipelago and satellite detection assessment using passive microwave data, Phys. Geograph., 39, 428–444, https://doi.org/10.1080/02723646.2017.1400339, 2017.
Durre, I., Yin, X., Vose, R. S., Applequist, S., Arnfield, J., Korzeniewski, B., and Hundermark, B.: Integrated Global Radiosonde Archive (IGRA), Version 2. [indicate subset used], NOAA National Centers for Environmental Information [data set], https://doi.org/10.7289/V5X63K0Q, 2016.
Durre, I., Yin, X., Vose, R. S., Applequist, S., and Arnfield, J.: Enhancing the data coverage in the Integrated Global Radiosonde Archive, J. Atmos. Ocean Tech., 35, 1753–1770, https://doi.org/10.1175/JTECH-D-17-0223.1, 2018.
Dussaillant, I., Berthier, E., Brun, F., Masiokas, M., Hugonnet, R., Favier, V., Rabatel, A., Pitte, P., and Ruiz, L.: Two decades of glacier mass loss along the Andes, Nat. Geosci., 12, 802–808, https://doi.org/10.1038/s41561-019-0432-5, 2019.
Farías-Barahona, D., Vivero, S., Casassa, G., Schaefer, M., Burger, F., Seehaus, T., Iribarren-Anacona, P., Escobar, F., and Braun, M. H.: Geodetic mass balances and area changes of Echaurren Norte Glacier (Central Andes, Chile) between 1955 and 2015, Remote Sens., 11, 260, https://doi.org/10.3390/rs11030260, 2019.
Farías-Barahona, D., Ayala, Á., Bravo, C., Vivero, S., Seehaus, T., Vijay, S., Schaefer, M., Buglio, F., Casassa, G., and Braun, M. H.: 60 Years of Glacier Elevation and Mass Changes in the Maipo River Basin, Central Andes of Chile, Remote Sens., 12, 1658–1658, https://doi.org/10.3390/rs12101658, 2020.
Feron, S., Cordero, R., Damiani, A., Llanillo, P.J., Jorquera, J., Sepulveda, E., Asencio, V., Laroze, D., Labbe, F., Carrasco, J., and Torres, G.: Observations and Projections of Heat Waves in South America, Sci. Rep., 9, 8173, https://doi.org/10.1038/s41598-019-44614-4, 2019.
Garreaud, R.: Warm winter storms in Central Chile, J. Hydrometeorol., 14, 1515–1534, https://doi.org/10.1175/JHM-D-12-0135.1, 2013.
Garreaud, R., Vuille, M., Compagnucci, R., and Marengo, J.: Present-day South American climate, Palaeogeogr. Palaeocl., 281, 180–195, https://doi.org/10.1016/j.palaeo.2007.10.032, 2009.
Garreaud, R. D., Boisier, J. P., Rondanelli, R., Montecinos, A., Sepúlveda, H. H., and Veloso-Aguila, D.: The Central Chile Mega Drought (2010–2018): A climate dynamics perspective, Int. J. Climatol., 40, 421–439, https://doi.org/10.1002/joc.6219, 2019.
Garreaud, R., Jacques-Coper, M., Marín, J. C., and Narváez, D. A.: Atmospheric rivers in South-Central Chile: Zonal and tilted events, Atmosphere, 15, 406, https://doi.org/10.3390/atmos15040406, 2024.
González-Reyes, Á., Jacques-Coper, M., Bravo, C., Rojas, M., and Garreaud, R.: Evolution of heatwaves in Chile since 1980, Weather Clim. Extrem., 41, 100588, https://doi.org/10.1016/j.wace.2023.100588, 2023.
Guan, B. and Waliser, D. E.: Tracking atmospheric rivers globally: Spatial distributions and temporal evolution of life cycle characteristics, J. Geophys. Res.-Atmos., 124, 12523–12552, https://doi.org/10.1029/2019JD031205, 2019.
Guan, B., Molotch, N. P., Waliser, D. E., Fetzer, E. J., and Neiman, P. J.: Extreme snowfall events linked to atmospheric rivers and surface air temperature via satellite measurements, Geophys. Res. Lett., 37, L20401. https://doi.org/10.1029/2010GL044696, 2010.
Guan, B., Waliser, D. E., Ralph, F. M., Fetzer, E. J. and Neiman, P. J.: Hydrometeorological characteristics of rain-on-snow events associated with atmospheric rivers, Geophys. Res. Lett., 43, 2964–2973, https://doi.org/10.1002/2016GL067978, 2016.
Hall, D. K., Riggs, G. A., and Salomonson, V. V.: MODIS snow and sea ice products, in: Earth Science Satellite Remote Sensing, Springer, 154–181, https://doi.org/10.1007/978-3-540-37293-6_9, 2006 (data available at: https://n5eil01u.ecs.nsidc.org/MOST/MOD10_L2.061/, last access: 5 June 2024).
Hersbach, H., Bell, B., Berrisford, P., Hirahara, S., Horányi, A., Muñoz-Sabater, J., Nicolas, J., Peubey, C., Radu, R., Schepers, D., Simmons,A., Soci, C., Abdalla, S., Abellan, X., Balsamo, G., Bechtold, P., Biavati, G., Bidlot, J., Bonavita, M., De Chiara, G., Dahlgren, P., Dee,D., Diamantakis, M., Dragani, R., Flemming, J., Forbes, R., Fuentes, M., Geer, A., Haimberger, L., Healy, S., Hogan, R. J., Hólm, E.,Janisková, M., Keeley, S., Laloyaux, P., Lopez, P., Lupu, C., Radnoti, G., de Rosnay, P., Rozum, I., Vamborg, F., Villaume, S., and Thépaut,J.-N.: The ERA5 global reanalysis, Q. J. Roy. Meteor. Soc., 146, 19992049, https://doi.org/10.1002/qj.3803, 2020.
Hersbach, H., Bell, B., Berrisford, P., Biavati, G., Horányi, A., Muñoz Sabater, J., Nicolas, J., Peubey, C., Radu, R., Rozum, I., Schepers, D., Simmons, A., Soci, C., Dee, D., and Thépaut, J.-N.: ERA5 hourly data on single levels from 1940 to present, Copernicus Climate Change Service (C3S) Climate Data Store (CDS) [data set], https://doi.org/10.24381/cds.adbb2d47, 2023.
Hugonnet, R., McNabb, R., Berthier, E. Menounos, B., Nuth, C., Girod, L., Farinotti, D., Huss, M., Dussaillant, I., Brun, F., and Kääb, A.: Accelerated global glacier mass loss in the early twenty-first century, Nature, 592, 726–73, https://doi.org/10.1038/s41586-021-03436-z, 2021.
Li, Z. and Ding, Q.: A global poleward shift of atmospheric rivers, Sci. Adv., 10, eadq0604, https://doi.org/10.1126/sciadv.adq0604, 2024.
Jacques-Coper, M., Brönnimann, S., Martius, O., Vera, C., and Cerne, B.: Summer heat waves in southeastern Patagonia: an analysis of the intraseasonal timescale, Int. J. Climatol., 36, 1359–1374, https://doi.org/10.1002/joc.4430, 2016.
Jacques-Coper, M., Veloso-Águilam D., Segura, C., and Valencia, A.: Intraseasonal teleconnections leading to heat waves in central Chile, Int. J. Climatol., 41, 4712–4731, https://doi.org/10.1002/joc.7096, 2021.
Jennings, K. S., Winchell, T. S., Livneh, B., and Molotch, N.: Spatial variation of the rain–snow temperature threshold across the Northern Hemisphere, Nat. Commun., 9, 1148, https://doi.org/10.1038/s41467-018-03629-7, 2018.
Koppes, M., Conway, H., Rasmussen, L. A., and Chernos, M.: Deriving mass balance and calving variations from reanalysis data and sparse observations, Glaciar San Rafael, northern Patagonia, 1950–2005, The Cryosphere, 5, 791–808, https://doi.org/10.5194/tc-5-791-2011, 2011.
Krajčí, P., Holko, L., Perdigão, R. A. P., and Parajka, J.: Estimation of regional snowline elevation (RSLE) from MODIS images for seasonally snow covered mountain basins, J. Hydrol., 519, 1769–1778, https://doi.org/10.1016/j.jhydrol.2014.08.064, 2014.
Kropač, E., Mölg, T., Cullen, N. J., Collier, E., Pickler, C., and Turton, J. V.: A detailed, multi-scale assessment of an atmospheric river event and its impact on extreme glacier melt in the Southern Alps of New Zealand, J. Geophys. Res.-Atmos.,126, e2020JD034217, https://doi.org/10.1029/2020JD034217, 2021.
Leung, L. R. and Qian, Y.: Atmospheric rivers induced heavy precipitation and flooding in the western US simulated by the WRF regional climate model, Geophys. Res. Lett., 36, L03820, https://doi.org/10.1029/2008GL036445, 2009.
Little, K., Kingston, D. G., Cullen, N. J., and Gibson, P. B.: The role of atmospheric Rivers for extreme ablation and snowfall events in the Southern Alps of New Zealand, Geophys. Res. Lett., 46, 2761–2771, https://doi.org/10.1029/2018GL081669, 2019.
Lliboutry, L.: The origin of penitents, J. Glaciol., 2, 331–338, https://doi.org/10.3189/S0022143000025181, 1954.
Lopes, F. M., Dutra, E., and Trigo, I. F.: Integrating reanalysis and satellite cloud information to estimate surface downward long-wave radiation, Remote. Sens, 14, 1704, https://doi.org/10.3390/rs14071704, 2022.
Maclennan, M. L., Lenaerts, J. T., Shields, C., and Wille, J. D.: Contribution of atmospheric rivers to Antarctic precipitation, Geophys. Res. Lett., 49, e2022GL100585, https://doi.org/10.1029/2022GL100585, 2022.
Malmros, J. K., Mernild, S. H., Wilson, R., Yde, J. C., and Fensholt, R.: Glacier area changes in the central Chilean and Argentinean Andes 1955–2013/14, J. Glaciol., 62, 391–401, https://doi.org/10.1017/jog.2016.43, 2016.
Masiokas, M. H., Christie, D. A., Le Quesne, C., Pitte, P., Ruiz, L., Villalba, R., Luckman, B. H., Berthier, E., Nussbaumer, S. U., González-Reyes, Á., McPhee, J., and Barcaza, G.: Reconstructing the annual mass balance of the Echaurren Norte glacier (Central Andes, 33.5 °S) using local and regional hydroclimatic data, The Cryosphere, 10, 927–940, https://doi.org/10.5194/tc-10-927-2016, 2016.
Masiokas, M. H., Rabatel, A., Rivera, A., Ruiz, L., Pitte, P., Ceballos, J. L., Barcaza, G., Soruco, A., Bown, F., Berthier, E., Dussaillant, I., and MacDonell, S.: A Review of the current state and recent changes of the Andean cryosphere, Front. Earth Sci., 8, 99, https://doi.org/10.3389/feart.2020.00099, 2020.
Mattingly, K. S., Motem, T. L., and Fettweis, X.: Atmospheric river impacts on Greenland Ice Sheet surface mass balance, J. Geophys. Res.-Atmos., 123, 8538–8560, https://doi.org/10.1029/2018JD028714, 2018.
Mattingly, K. S., Turton, J. V., Wille, J. D., Noël, B., Fettweis, X., Rennermalm, A. K., and Mote, T.: Increasing extreme melt in northeast Greenland linked to foehn winds and atmospheric rivers, Nat. Commu., 14, 1743, https://doi.org/10.1038/s41467-023-37434-8, 2023.
Minder, J. R., Durran, D. R., and Roe, G. H.: Mesoscale controls on the mountainside snow line, J. Atmos. Sci., 68, 2107–2127, https://doi.org/10.1175/JAS-D-10-05006.1, 2011.
Neiman, P. J., Schick, L. J., Ralph, F. M., Hughes, M., and Wick, G. A.: Flooding in western Washington: The connection to atmospheric rivers, J. Hydrometerol., 12, 1337–1358, https://doi.org/10.1175/2011JHM1358.1, 2011.
Nellikkattil, A. B., Lee, J. Y., Guan, B., Timmermann, A., Lee, S. S., Chu, J. E., and Lemmon, D.: Increased amplitude of atmospheric rivers and associated extreme precipitation in ultra-high-resolution greenhouse warming simulations, Commun. Earth Environ., 4, 313, https://doi.org/10.1038/s43247-023-00963-7, 2023.
Oerlemans, J. and Knap, W. H.: A one-year record of global radiation and albedo from the ablation zone of the Morteratschgletscher, Switzerland, J. Glaciol., 44, 231–238, https://doi.org/10.3189/S0022143000002574, 1998.
Parajka, J., Dadson, S., Lafon, T., and Essery, R.: Evaluation of snow cover and depth simulated by a land surface model using detailed regional snow observations from Austria, J. Geophys. Res.-Atmos., 115, D24117, https://doi.org/10.1029/2010JD014086, 2010.
Payne, A. E., Demory, M., Leung, L. R., Ramos, A. M., Shields, C. A., Rutz, J. J. and Ralph, F. M.: Responses and impacts of atmospheric rivers to climate change, Nat. Rev. Earth Environ., 1, 143–157, https://doi.org/10.1038/s43017-020-0030-5, 2020.
Poveda, G., Espinoza, J. C., Zuluaga, M. D., Solman, S. A., Garreaud, R., and van Oevelen, P. J.: High Impact Weather Events in the Andes, Front. Earth Sci., 8, 162, https://doi.org/10.3389/feart.2020.00162, 2020.
Ralph, F. M., Neiman, P. J., Wick, G. A., Gutman, S. I., Dettinger, M. D., Cayan, D. R., and White, A. B.: Flooding on California's Russian river: Role of atmospheric rivers, Geophys. Res. Lett., 33, L13801, https://doi.org/10.1029/2006GL026689, 2006.
Ralph, F. M., Rutz, J. J., Cordeira, J. M., Dettinger, M., Anderson, M., Reynolds, D., Schick, L. I., and Smallcomb, C.: A scale to characterize the strength and impacts of atmospheric rivers, B. Am. Meteorol. Soc., 100, 269–290, https://doi.org/10.1175/Bams-D-18-0023.1, 2019.
Rutllant, J. A., Matus, F., Rudloff, V., and Rondanelli, R.: The role of atmospheric rivers in rainfall-induced landslides: A study from the Elqui valley, J. Arid Environ., 216, 105016, https://doi.org/10.1016/j.jaridenv.2023.105016, 2023.
Saavedra, F., Cortés, G., Viale, M., Margulis, S., and McPhee, J.: Atmospheric rivers contribution to the snow accumulation over the Southern Andes (26.5°S–37.5°S), Front. Earth Sci., 8, 1–11, https://doi.org/10.3389/feart.2020.00261, 2020.
Schaefer, M., Fonseca-Gallardo, D., Farías-Barahona, D., and Casassa, G.: Surface energy fluxes on Chilean glaciers: measurements and models, The Cryosphere, 14, 2545–2565, https://doi.org/10.5194/tc-14-2545-2020, 2020.
Sauter, T., Arndt, A., and Schneider, C.: COSIPY v1.3 – an open-source coupled snowpack and ice surface energy and mass balance model, Geosci. Model Dev., 13, 5645–5662, https://doi.org/10.5194/gmd-13-5645-2020, 2020 (data available at: https://github.com/cryotools/cosipy, last access: 10 December 2024).
Schauwecker, S., Palma, G., MacDonell, S., Ayala, Á., and Viale, M.: The Snowline and 0 °C Isotherm Altitudes During Precipitation Events in the Dry Subtropical Chilean Andes as Seen by Citizen Science, Surface Stations, and ERA5 Reanalysis Data, Front. Earth Sci., 10, 1–19, https://doi.org/10.3389/feart.2022.875795, 2022.
Shaw, T. E., Ulloa, G., Farías-Barahona, D., Fernandez, R., Lattus, J. M., and McPhee, J.: Glacier albedo reduction and drought effects in the extratropical Andes, 1986–2020, J. Glaciol., 67, 158169, https://doi.org/10.1017/jog.2020.102, 2021.
Somos-Valenzuela, M. A., Oyarzún-Ulloa, J. E., Fustos-Toribio, I. J., Garrido-Urzua, N., and Chen, N.: The mudflow disaster at Villa Santa Lucía in Chilean Patagonia: understandings and insights derived from numerical simulation and postevent field surveys, Nat. Hazards Earth Syst. Sci., 20, 2319–2333, https://doi.org/10.5194/nhess-20-2319-2020, 2020.
Valenzuela, R., Garreaud, R., Vergara, I., Campos, D., Viale, M., and Rondanelli, R.: An extraordinary dry season precipitation event in the subtropical Andes: Drivers, impacts and predictability, Weather Clim. Extrem., 37, 100472, https://doi.org/10.1016/j.wace.2022.100472, 2022.
Viale, M. and Garreaud, R. D.: Summer precipitation events over the western slopes of the subtropical Andes, Mon. Weather Rev., 142, 1074–1092, https://doi.org/10.1175/MWR-D-13-00259.1, 2014.
Viale, M., Valenzuela, R., Garreaud, R., and Ralph, F.: Impacts of atmospheric rivers on precipitation in Southern South America, J. Hydrometeorol., 19, 1671–1687, https://doi.org/10.1175/JHM-D-18-0006.1, 2018.
Wang, S., Ma, X., Zhou, S., Wu, L., Wang, H., Tang, Z., Xu, G., Jing, Z., Chen, Z., and Gan, B.: Extreme atmospheric rivers in a warming climate, Nat. Commun., 14, 3219, https://doi.org/10.1038/s41467-023-38980-x, 2023.
WGMS: Global Glacier Change Bulletin No. 5 (2020–2021), edited by: Zemp, M., Gärtner-Roer, I., Nussbaumer, S. U., Welty, E. Z., Dussaillant, I., and Bannwart, J., ISC(WDS)/IUGG(IACS)/UNEP/UNESCO/WMO, World Glacier Monitoring Service, Zurich, Switzerland, 134 pp., publication based on database version: https://doi.org/10.5904/wgms-fog-2023-09, 2023.
Wille, J. D., Favier, V., Dufour, A., Gorodetskaya, I. V., Turner, J., Agosta, C., and Codron, F.: West Antarctic surface melt triggered by atmospheric rivers, Nat. Geosci, 12, 911–916, https://doi.org/10.1038/s41561-019-0460-1, 2019.
Wille, J. D., Favier, V., Gorodetskaya, I. V., Agosta, C., Kittel, C., Beeman, J. C., Jourdain, N. C., Lenaerts, J. T. M., and Codron, F.: Antarctic atmospheric river climatology and precipitation impacts, J. Geophys. Res.-Atmos., 126, e2020JD033788, https://doi.org/10.1029/2020JD033788, 2021.
Wille, J. D., Favier, V., Jourdain, N. C., Kittel, C., Turton, J. V., Agosta, C., Gorodetskaya, I. V., Picard, G., Codron, F., Santos, C. L. D., Amory, C., Fettweis, X., Blanchet, J., Jomelli, V., and Berchet, A.: Intense atmospheric rivers can weaken ice shelf stability at the Antarctic Peninsula, Commun. Earth Environ., 3, 90, https://doi.org/10.1038/s43247-022-00422-9, 2022.
Xu, M., Yu, L., Liang, K., Vihma, T., Bozkurt, D., Hu, X., and Yang, Q.: Dominant role of vertical air flows in the unprecedented warming on the Antarctic Peninsula in February 2020, Commun. Earth Environ., 2, 133, https://doi.org/10.1038/s43247-021-00203-w, 2021.
Zou, X., Bromwich, D. H., Montenegro, A., Wang, S. H., and Bai, L.: Major surface melting over the Ross Ice Shelf Part II: Surface energy balance, Q. J. Roy. Meteor. Soc., 147, 2895–2916, https://doi.org/10.1002/qj.4105, 2021.