the Creative Commons Attribution 4.0 License.
the Creative Commons Attribution 4.0 License.
Spectral characteristics of seismic ambient vibrations reveal changes in the subglacial environment of Glacier de la Plaine Morte, Switzerland
Janneke van Ginkel
Fabian Walter
Fabian Lindner
Miroslav Hallo
Matthias Huss
Donat Fäh
Glaciers exhibit complex hydraulic and dynamic behaviour that needs to be studied to enhance our understanding of cryospheric changes. To address this, we apply a range of passive seismic analysis techniques to continuous data from a temporary seismic array deployed on Glacier de la Plaine Morte, Switzerland. First, we assess the reliability of ambient noise horizontal-to-vertical spectral ratio (HVSR) measurements and demonstrate that the variations in HVSR curves are predominantly attributed to changing nearby noise conditions influenced by hydraulic, drainage-related tremors, moulin resonances, and anthropogenic sources. We find that short time series (e.g. hours-long) may lead to biases in the interpretation of the HVSR curve. Hence, we perform an analysis of the local noise source variations related to glacier dynamic behaviour in order to distinguish between source and medium changes reflected in the HVSR measurements. In 130 d long time series of measurements we are able to detect a spatio-temporal trend and find that an HVSR trough emerges following the sudden drainage of an ice-marginal lake. This HVSR trough is indicative of a low-seismic-velocity layer at the ice–bed interface. Seismic velocity changes derived by interferometry support our findings of a velocity drop in the glacier after the drainage. Subsequently, inversion and forward modelling of the empirical dispersion and ellipticity curves reveal a probable thickness of this low-velocity layer of 10–30 m and a change in shear-wave velocity up to 40 %. This layer has a local extent covering an estimated 4.5 % to 27 % of the glacier, as indicated by the spatial variations in the HVSR trough throughout the array and an independent water volume estimate. Our findings suggest that the changing seismic velocities are a manifestation of temporal subglacial water storage in response to the sudden injection of lake water. Our results highlight the value of long time series of HVSR measurements which show variations in the peak and trough structure that reflect hydrological changes in the subglacial environment.
- Article
(14502 KB) - Full-text XML
- BibTeX
- EndNote
On the Earth, climate fluctuations are expected to cause significant impacts on glaciers (Kraaijenbrink et al., 2017) and the potential for natural hazards (Ding et al., 2021). The behaviour of ice masses is significantly influenced by geological, thermodynamic, and hydraulic processes occurring at the basal interface. Nevertheless, the hardly accessible nature of the ice–bedrock interface makes mapping of its heterogeneity a challenge. Ground-penetrating radar (King et al., 2016) and active seismic techniques (Eisen et al., 2010; Luthra et al., 2016) are commonly used for an investigation of physical properties of the subsurface glacier mass. These methods are not suited for repeated surveys within significant timescales capturing hydraulic changes over weeks to months. Moreover, the extent to which these methods retrieve spatio-temporal basal properties that affect ice flow is debated (Kyrke-Smith et al., 2017).
An alternative way to monitor glacial conditions with high spatio-temporal resolution and relatively low-cost acquisition is by analysing sustained ambient seismic vibrations (Podolskiy and Walter, 2016; Aster and Winberry, 2017). Studies have shown that the seismic power measured on glaciers can serve as a proxy for subglacial discharge (Bartholomaus et al., 2015) and the hydraulic conditions in the subglacial conduits (Gimbert et al., 2016). Furthermore, the glaciohydraulic tremors can also be used to map the water pathways beneath glaciers in space and time (Nanni et al., 2021). In addition to that, seismic interferometry can monitor subglacial properties such as ice anisotropy and bedrock material by probing subsurface seismic velocities and changes thereof (Sergeant et al., 2020). Zhan (2019) was able to extract transient velocity changes over 12 years related to the surging cycle of Bering Glacier (Alaska), which he attributes to the transition of an efficient channelized to an inefficient distributed drainage system (and vice versa).
In earthquake seismology, the horizontal-to-vertical spectral ratio (HVSR) analysis of ambient vibrations (i.e. seismic noise) is a widely applied technique that is used to determine a site's resonance frequency (f0), as well as its peak amplitude (Nakamura, 1989; Nogoshi and Igarashi, 1971). The HVSR provides information on subsurface properties like shear-wave (S-wave) velocities, layer thickness, and site response to incident seismic waves (i.e. Bard, 1999; Albarello and Lunedei, 2013; Molnar et al., 2018; van Ginkel et al., 2022). HVSR measurements are purely passive and thus non-invasive for the environment and only require a single station deployment. The HVSR is obtained by calculating the ratio between the Fourier amplitude spectra of the horizontal and vertical components of a seismic recording (Nakamura, 1989; Bonnefoy-Claudet et al., 2006). HVSRs are typically calculated over a range of frequencies, giving rise to an “HVSR curve” with a characteristic peak–trough structure. The ambient vibration diffuse wavefield has a significant contribution of Rayleigh waves, which are dispersive seismic surface waves with elliptical particle motion that depends on the subsurface structure (Fäh et al., 2001). Small contributions of Love and body waves may include the wavefield and contribute to the peaks in the HVSR curve by amplifying horizontal ground motion (Bonnefoy-Claudet et al., 2006).
In cryoseismology, the HVSR curves have been used to invert for velocity profiles of the ice or firn (Lévêque et al., 2010; Chaput et al., 2022), to obtain bedrock topography (Yan et al., 2018), and to identify the presence of basal sediments (Picotti et al., 2017). These studies present HVSR curve computations for short time periods (1–12 h). However, seismic resonances within the soft ice layer and resulting HVSRs are expected to vary with changes in subglacial conditions on diurnal and seasonal timescales. Seismic wave velocities decrease in the presence of drained basal sediments (Picotti et al., 2017), water, or air (Wittlinger and Farra, 2015; Llorens et al., 2020; Guillemot et al., 2024), making them dependent on the geological setting as well as spatial and temporal variations in hydraulic conditions. Köhler and Weidle (2019) found that seasonality in HVSR is related to the variability in the active permafrost layer. At the same time, pitfalls in HVSR measurements exist in permafrost monitoring as they are influenced by changing noise conditions in addition to freeze–thaw variations within the soil. Consequently, given varying thermal and hydraulic conditions in cryospheric processes, short-period recordings of ambient seismic vibrations can lead to biases in HVSR curves.
Here we apply the HVSR method to seismic records of Glacier de la Plaine Morte, Europe's largest plateau glacier in Switzerland's Bernese Alps (Huss et al., 2013). Variations in the peak–trough structure of the HVSR curve reflect hydraulic changes beneath the ice surface, and we support this finding with additional noise-based seismic analysis. We interpret these changes in terms of temporary water storage as a response to the subglacial drainage of a nearby ice-marginal lake. Our results underline the value of passive seismic noise measurement and the HVSR method to monitor hydrological changes in the glacier in the subglacial environment. Here, we define the subglacial environment as the area near the ice–bed interface, which can encompass fractures and voids in the glacier sole as well as the top layer of the bedrock or sediments.
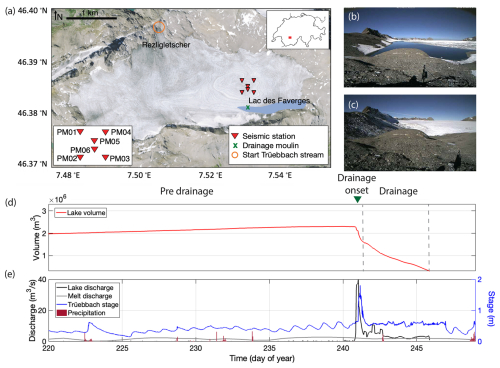
Figure 1(a) Orthophoto of Glacier de la Plaine Morte (source: Federal Office of Topography Swisstopo) with the A0 array (stations PM01–PM06, red triangles), the lake (Lac des Faverges) in blue, the drainage moulin (green cross), and the Rezligletscher tongue from which the Trüebbach stream starts (orange circle). The inset in the top-right corner shows the glacier's location within Switzerland. (b) Time-lapse camera image of Lac des Faverges taken on 27 August 2016 (day 240) at 07:00 LT (local time) just before the drainage (source: Geopraevent, personal communication, 2023). (c) Time-lapse camera image of Lac des Faverges taken on 6 October 2016 at 08:00 LT, 1 month after the drainage (source Geopraevent). (d) Lac des Faverges volume curve and the dashed grey lines include the drainage period for which the lake volume and discharge is computed. The pre-drainage and drainage periods are marked, as well as the onset of the drainage (green triangle). (e) Lac des Faverges discharge curve (black), modelled mean daily melt-induced discharge (grey), Trüebbach stage (blue), and precipitation measured at Adelboden (red bars, relative values).
Glacier de la Plaine Morte (Fig. 1) is the largest plateau glacier in the European Alps and is located along the border of Switzerland's cantons of Bern and Valais. Ice flow is limited, and minor crevasses are mostly observed on the outlet glacier Rezligletscher (Huss et al., 2013). From the 5 km wide plateau, the Rezligletscher tongue flows northwards feeding the Trüebbach stream, which produces several proglacial waterfalls towards the northwest (outside of Fig. 1). A lake, named Lac des Faverges, formed during the melt season at the southeastern margin of Glacier de la Plaine Morte (Fig. 1b). Since 2011, outbursts of Lac des Faverges have caused floods in the Simme Valley (Huss et al., 2013). In 2012, a detailed monitoring of lake-level variations, as well as proglacial discharge level, was initiated for early-warning purposes by the municipality of Lenk and the engineering company Geopraevent (Fig. 1d and e). The relation of water level to lake volume was inferred from digital elevation models acquired after each lake drainage. High-resolution lake-level records during the drainage allow us to determine the lake discharge dynamics during the drainage events. In addition, there exist daily surface melt estimates based on long-term, seasonal, in situ mass balance measurements at a network of sites, extrapolated and temporally downscaled with a distributed accumulation and melt model (Huss et al., 2021; Glacier Monitoring Switzerland, 2023).
In 2016, Lac des Faverges' drainage initiated through a moulin at the lake margin (green cross in Fig. 1) feeding the subglacial drainage system towards the glacier tongue (Lindner et al., 2020). The drainage began on 27 August 2016 (day of year 240) in the evening, lasted approximately 6 consecutive days, and amounted to a volume of 2×10⁶ m3 of water (Fig. 1d). In the first 6 h of the drainage, the water escaped rapidly with a discharge of 40 m3 s−1 (Fig. 1e). After the discharge peak, the lake level dropped to the elevation of the moulin inlet, and the connection between the moulin and the lake was disrupted. Subsequently, the lake established a new link with the moulin through a supraglacial channel, but this slowed down the drainage process. The drainage of the lake finished in the night from day 246 to 247.
Multiple seismic arrays were deployed on Glacier de la Plaine Morte during the summer of 2016 (see Lindner et al., 2019, 2020, for deployment and instrument details). In this study, we use the Lennartz 1 Hz shallow borehole array (PM01–PM06), located 250 m north of Lac des Faverges, deployed from late April (day 120) to early September (day 250) 2016. At the end of July (day 212), a sixth borehole sensor was added to the array (PM06; Fig. 1). We process the three-component seismic data within the frequency range of 0.5–10 Hz, with a focus on extracting the fundamental seismic resonance frequency of the ice mass using HVSR curves. Over the 4-month recording period, we distinguish a pre-drainage phase (day 120–240) and drainage phase (day 240–248), which is subsequently divided into smaller phases (Fig. 2), depending on the power spectral characteristics and knowledge of the subglacial processes from Lindner et al. (2019, 2020). We observe glacial hydraulic tremors already from day 237 onwards until the start of the drainage (day 240), when pressure is building up and fractures and conduits are formed. These are pre-drainage precursor hydraulic tremors that formed subglacial features like fractures and voids that enable the drainage later on. According to Bartholomaus et al. (2015) and Gimbert et al. (2016), seismic tremors in the frequency range of 1–10 Hz are linked to the turbulent water flow and sediment transport within subglacial conduits. In the spectrogram, anthropogenic seismic signals are present at approximately 3–4 Hz and are characterized by a diurnal pattern (power maxima from 06:00 to 18:00 LT) on weekdays (Fig. 2b).
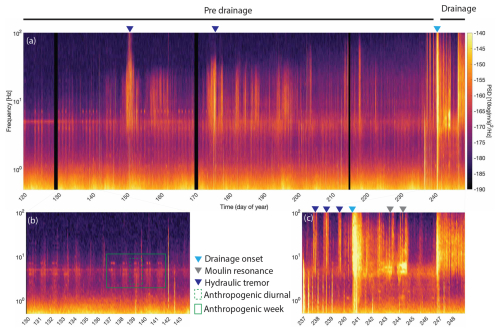
Figure 2(a) Spectrogram of station PM02 for the entire recording period. The pre-and post-drainage periods are highlighted, and the triangles indicate some high-power events like the drainage onset (green), moulin resonance (grey), and hydraulic tremor (blue). (b) Zoom of the pre-drainage period showing anthropogenic noise. (c) Zoom of the drainage period and preceding hydraulic tremor.
We compute hourly-averaged power spectra (PSDs) for the vertical and horizontal components at all stations in the Glacier de la Plaine Morte array for days 120–248 following the methodology described in Van Ginkel et al. (2020) to derive the spectral ratios. Ambient noise records of 1 h long time windows with 75 % overlap (Peterson, 1993) are used to calculate PSDs for each component within each time window. The PSDs are then averaged over an hour, and the horizontal-to-vertical spectral ratio (HVSR) is computed using Eq. (2) from Van Ginkel et al. (2020). We included all data in the analysis, without removing transients, as the aim of the study is to evaluate the sensitivity of HVSR to spatio-temporal variations in both noise sources and medium properties. As demonstrated by Preiswerk et al. (2019) through polarization analysis, the seismic wavefield in Glacier de la Plaine Morte behaves as in a 1D medium with no detected 2D or 3D resonances. Hence, Glacier de la Plaine Morte serves as an ideal location for evaluating the potential of the HVSR method.
To characterize the ambient seismic wavefield contributing to the HVSR curves, we employ matched-field processing (MFP; Appendix A) on the Glacier de la Plaine Morte array. The MFP back azimuth within the 3–5 Hz range is selected for presentation in the subsequent sections. This frequency range is chosen because it encompasses frequencies where surface waves become sensitive to deeper velocity structures, making it suitable for probing the basal interface at a depth of approximately 130–160 m (Grab et al., 2021).
3.1 HVSR curves for the pre-drainage period
3.1.1 Resonance frequencies and ice thickness
Between mid-May (day 120) and the end of August (day 237), the HVSR curves generally maintain a uniform shape. However, during brief episodes of hydraulic tremors, such as on days 151–154, the HVSR curves are disrupted, preventing the formation of any resonance peaks. For this period, all hourly curves within this period are stacked and represented as a probability density function (PDF). From approximately 3100 curves per site, we compute the median HVSR curves (Fig. 3a–f). The stacked HVSR curves at each of the six borehole sites exhibit comparable characteristics: the fundamental resonance frequency (f0) is around 3.0 Hz (with a ±0.5 Hz variability between the stations), and the corresponding HVSR amplitude (A0) is around 1.4 (±0.2; Table 1). During the pre-drainage period, HVSR amplitudes (A0) vary by approximately 20 % (within the 5 % probability) and show a similar pattern to the power spectral variations (about 8.5 %; Fig. 2), which are attributed to anthropogenic noise with characteristic diurnal and weekly patterns. This argues against meltwater or weather conditions being the primary control on noise variations (Appendix B).
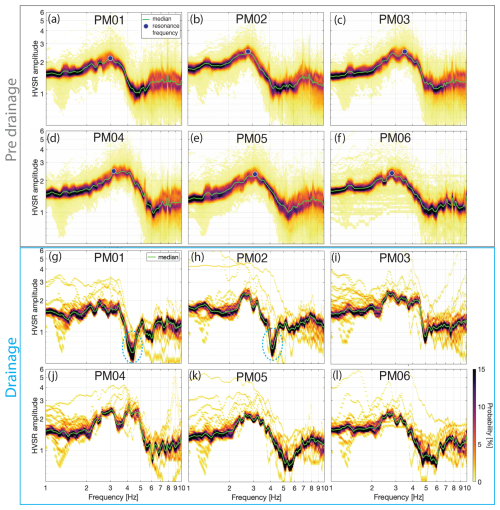
Figure 3(a–f) Probability density functions from the hourly HVSR curves stacked for days 120–237 (pre-drainage period, in grey box) for the stations PM01–PM05 and for days 212–237 for PM06. The green line depicts the median curve and the blue circle the resonance frequency. (g–l) Same as (a–f) but for drainage days 245–246 in the blue box. The dashed blue circles highlight the trough in PM01 and PM02.
Table 1HVSR fundamental resonance frequency (f0) and peak amplitude (A0) from the pre-drainage period, derived from Fig. 3. The ice thickness measured by ground-penetrating radar (h-GPR) comes from Grab et al. (2021), and the thickness, h-f0, is computed according to Eq. (1).
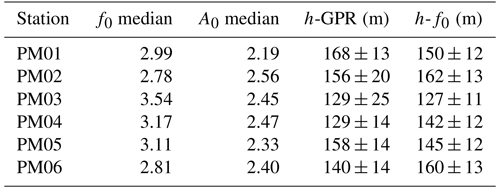
Next, we can assume that a frequency of the HVSR peak is close to the predominant resonance frequency of body waves (e.g., Bonilla et al., 1997); then based on the relationship between f0, S-wave velocity (Vs), and the thickness (h), we can estimate the thickness of the glacier below the stations using (Tsai, 1970)
For Vs of ice we use the values of 1800±150 m s−1 (Podolskiy and Walter, 2016), yielding a range of thickness estimations for the ice. Helicopter-borne ground-penetrating radar (GPR) measured the ice thickness of Glacier de la Plaine Morte (Langhammer et al., 2019). Spatial extrapolation of the ice thickness and uncertainties (Grab et al., 2021) is used for comparison with the thickness obtained with Eq. (1) (Table 1). The highest resonance frequencies correspond to the two shallowest GPR estimates. Both GPR and f0-inferred thicknesses for all six stations fall within the associated uncertainties. Variations in thickness among stations within the array likely correspond to local ice thickness variations and glacier thinning towards the east.
3.1.2 Dominant noise sources
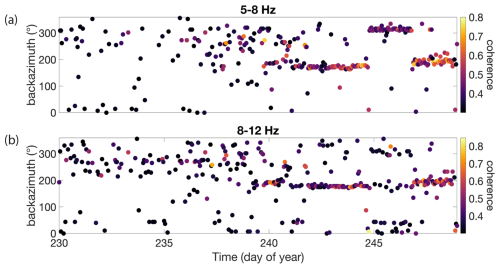
Figure 4 depicts the temporal variations in HVSR curves from station PM02 for 97 consecutive days. Generally, HVSR curves up to day 237 demonstrate a stable resonance frequency over time. Exceptions occur during periods of high tremor amplitudes, where nearby noise sources contaminate the HVSR curves (e.g., day 150 in Fig. 4). It is important to note that these tremor events, associated with hydrofracturing (Lindner et al., 2020), can persist for hours to days, diminishing the significance of HVSR curves. In Fig. 4b, the back azimuth for every hour from day 140 to day 237 for the 2.5–5 Hz band is presented. The relatively low maximum coherence of 0.4–0.5 suggests uncertainty in maximum coherence picks (Fig. A1a and b in Appendix A). Nevertheless, two main noise source back azimuths are identifiable: from day 140 to 182, the dominant noise source exhibits a back azimuth of around 150°, attributed to anthropogenic noise from roads, industrial facilities, and cities like Sierre and Sion in the Rhône valley to the southeast. From day 182 onwards, the dominant noise source shifts northwestward, towards one of the proglacial waterfalls near the glacier terminus as the melt season progresses. Despite the variability in dominant noise sources, the HVSR curve remains stable during this period.
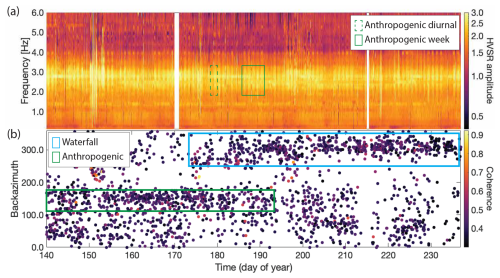
Figure 4(a) Time series of the hourly HVSR curves for days 140–237. The peak amplitudes (around 2.9 Hz) exhibit a diurnal pattern (dashed green box) present on weekdays (solid green box). (b) Back azimuth per hour for days 140–237. The cluster around 150° (green box) has an anthropogenic source, and the cluster around 300° (blue box) reflects the proglacial waterfalls of the Trüebbach stream (Fig. 1).
3.2 HVSR curves and noise sources for the drainage period
From day 237 to 248, the seismic power (Fig. 2) exhibits high variations related to the lake drainage. The HVSR time series from station PM02 (Fig. 5a) is compared against the back azimuth (Fig. 5b) of the dominant noise source and includes these phases related to drainage.
-
Pre-drainage tremor (days 237–240). The strong hydraulic tremor (Fig. 2c) results in the disturbance of the HVSR over the entire frequency band of 0.5–10 Hz. As Lindner et al. (2020) state, most glaciohydraulic tremors are generated by subglacial water flow, by ice quake bursts, or in moulins. The MFP back azimuth results point in the direction of the lake and drainage moulin (at approx. 180°).
-
Onset of the lake drainage (day 240 at 16:00 LT). Nearby noise source (drainage moulin) interrupts the HVSR curve over the entire frequency band lasting for 8 h.
-
Ongoing drainage and moulin resonance (days 241–244). Ongoing hydraulic tremors cause HVSR disturbances. Moulin resonances occur in the band of 1.5–4 Hz and generate multiple peaks in the HVSR. This is an example of the effect of a nearby source on the HVSR curves.
-
HVSR trough (days 242–246). The HVSR curve exhibits a similar peak frequency compared to the pre-drainage phase. Remarkable is the trough that appears at around 4.4 Hz (Fig. 3g–l and this is visible in Fig. 5a as the dark purple band) and is most pronounced in PM01 and PM02. This trough is also visible at days 242 and 243 during reduced tremor activity. During these periods of trough appearance, the dominant noise back azimuth points towards the proglacial waterfalls in the northwest, with a high signal coherence of up to 0.8. At the beginning of day 242, a trough at lower frequencies appears. However, the high-amplitude plateau spanning the fundamental resonance frequency indicates a disturbance of the HVSR, making the interpretation of this trough unreliable.
-
Days 247–248. Strong tremor and seismic power disturb the HVSR over the entire frequency band. The dominant noise back azimuths of 180–200° point towards the area of the lake drainage.
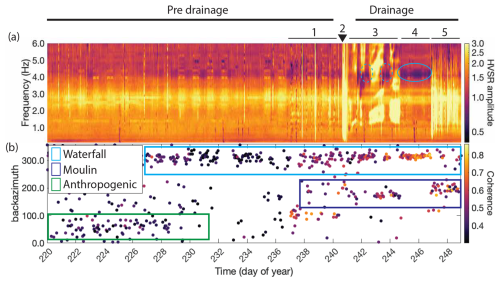
Figure 5(a) 2D time series of all the hourly HVSR curves for station PM02 for days 237–248. The numbers correspond to the numbered list in this section and indicate the different phases related to drainage. The dashed blue circles highlight the trough. (b) Back azimuth per hour for the dominant noise source. The green box depicts the cluster for the anthropogenic noise source, the dark blue for moulin, and the light blue for the waterfall noise source.
Based on these observations of the HVSR curve characteristics, we define the appearance of the trough as a primary temporal change most likely related to the glacier's seismic velocity structure. Other changes in HVSR curves coincide with variations in noise source locations and are thus difficult to interpret. In the next sections we present additional seismic analyses to argue that the trough is related to a change in medium properties rather than a varying dominant noise source.
As additional means of characterizing subglacial changes, we employ seismic interferometry. We follow the standard approach to recover virtual seismic surface waves from station-pair cross-correlations of noise records (Bensen et al., 2007) and apply it to the phenomenon of glacial lake drainage (Behm et al., 2020). This may elucidate a varying fracture state and/or water saturation as seismic velocity changes (Zhan, 2019). In temperate glacier applications, the measurement of small seismic velocity changes is challenging as meltwater-induced noise sources are typically non-stationary and the scattering of seismic waves is limited (Walter et al., 2015; Preiswerk and Walter, 2018; Sergeant et al., 2020). Here, we make use of the noise source around a back azimuth of 315°, which is stable for several consecutive days and which we identify as a proglacial waterfall (Fig. 5b). As this source lies approximately on the axis connecting stations PM01 and PM03, it falls within their stationary-phase zone (Snieder, 2004). The direct wave travelling between the two stations can thus be extracted by cross-correlating the recordings of the waterfall noise (Wapenaar et al., 2010; Brenguier et al., 2019, 2020; Mordret et al., 2020).
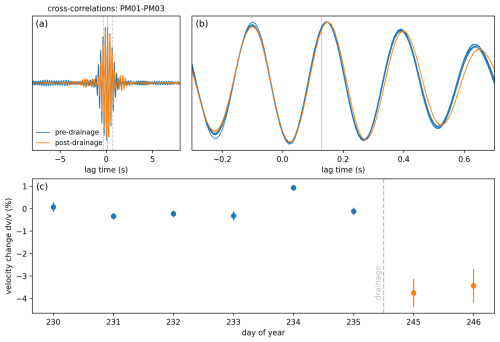
Figure 6(a) Bandpass-filtered (3.5–4.5 Hz) daily cross-correlations between PM01 and PM03 for pre-drainage days 230–235 (blue) and drainage days 245–246 (orange). The solid vertical line indicates the estimated travel time for the direct wave, and the dashed vertical lines show the zoom window for (b). (b) Zoom of (a). (c) Velocity change relative to the pre-drainage period. The vertical bars indicate 1 standard deviation of the calculation (see text for details).
To this end, we calculate daily stacks of cross-correlations obtained from consecutive 900 s windows of days 230–235 (pre-drainage) and 245–246 (drainage), as these days show a stable waterfall noise (Fig. 5b). For day 246, we discard the last 3 h, since other noise sources become active during that time window. Prior to calculating the cross-correlations, the raw recordings are bandpass-filtered and subsequently clipped at 3 times the standard deviation as well as spectrally whitened.
The resulting cross-correlations reside in a narrow frequency band around 4 Hz (Fig. 6a and b). As expected, for all considered days, a clear direct wave propagating from PM01 to PM03 emerges, which carries maximum amplitudes near the estimated travel time t, obtained by dividing the inter-station distance by a Rayleigh wave velocity of 2800 m s−1 (see Sect. 5). Due to the short inter-station distance, this direct wave converges towards the auto-correlation but is slightly shifted to positive lag times, whereas the response at negative lag times is absent because of the one-sided illumination. However, individual phases exhibit a different travel time between pre- and post-drainage cross-correlations. This is visible by slightly shifted waveforms (Fig. 6b), and we interpret this shift (or delay) as a change in seismic velocity.
We systematically investigate this observation by directly calculating travel time delays between the considered days and a reference cross-correlation formed by stacking the 6 pre-drainage days. For this purpose, we rely on the wavelet cross-spectrum technique (Mao et al., 2019), which yields dt values as a function of lag time and frequency. To obtain high-quality results, we keep only those dt values associated with a minimum cross-coherence of 0.95 and a minimum cross-spectrum amplitude of 0.9 of its maximum value in the frequency range of 3–5 Hz, which focuses on the region near the estimated travel time. From the remaining dt values, we determine the median and the standard deviation and transform these values to velocity changes using the relation . As we are considering the direct wave (and not scattered waves), we do not apply a linear regression to obtain velocity changes but instead rely on the statistical analysis as detailed above.
For the pre-drainage period, values scatter around zero with a maximum deviation of 0.9 % relative to the reference, as shown in Fig. 6c. By contrast, results for the 2 drainage days show velocity drops between 3 % and 4 % (albeit with a somewhat higher standard deviation compared to the pre-drainage days), indicative of a medium change. For a detailed depth investigation of the velocity drop, a frequency-dependent velocity change would be required, which cannot be obtained due to a less favourable source distribution at higher frequencies (Appendix A). However, compared to a Rayleigh wave travelling within ice (velocity of around 1800 m s−1; Podolskiy and Walter, 2016), the significantly higher wave speed at above 4 Hz, for which the interferometry results are representative, indicates that the extracted direct wave samples the glacier bed.
Next, we use Rayleigh wave ellipticity together with velocity dispersion curves to determine differences in the glacier's S-wave velocity structure between day of year 230 representing pre-drainage conditions and day of year 245 representing drainage conditions. Dispersion curves (Fig. 7a) are obtained using high-resolution beamforming (Appendix A) of the vertical component signals. The dispersion curve reveals a saddle and reduced phase velocities for frequencies below 5 Hz during the drainage period. The uncertainties of the dispersion curve below 5 Hz for the drainage period are lower than the velocities for the pre-drainage (Fig. A3); hence we believe these lower velocities are reliable. The ellipticity curves (Fig. 7b) are computed using the RayDec tool developed by Hobiger et al. (2009). RayDec extracts Rayleigh wave ellipticity from the ambient noise measurements based on the random decrement technique. The shape of the ellipticity curves is similar to the HVSR curves, but the absolute ellipticity values are smaller than the HVSR measurements, which may include additional signal content from other seismic waves such as Love and/or body waves. During the drainage the ellipticity curve exhibits a pronounced trough at about 4.4 Hz, which is a feature not present in the pre-drainage ellipticity data.
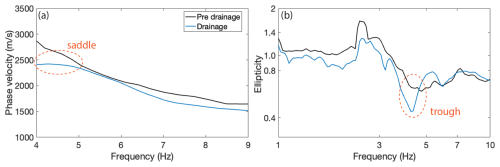
Figure 7(a) Dispersion curves for the pre-drainage day (black) and the drainage day (blue); the dashed orange circle indicates the saddle in the drainage dispersion curve. (b) Ellipticity curves for the pre-drainage day (black) and the drainage day (blue); the dashed orange circle indicates the trough in the drainage ellipticity curve.
5.1 Inverse modelling
We perform joint ellipticity and dispersion inverse modelling in the probabilistic framework that includes uncertainties, and we supplement it with subsequent forward modelling. We use the ellipticity and dispersion curves presented in Fig. 7 and apply the inversion algorithm from Hallo et al. (2021) that produces the complete posterior probability density function (posterior PDF) of velocity model parameters. The main advantages are the automatically optimized number of layers of the 1D velocity model and solution uncertainty. The main outputs of this inversion approach are posterior marginal PDFs of Vs, while the P-wave velocities are only supplementary and constrained by an a priory range of the Poisson ratio. Nevertheless, the Poisson ratio is only indicative due to low sensitivity in inversion with limited dispersion curves. These inversion runs include additional site-specific constraints, like the depth of the bedrock (max 250 m), range of seismic velocities (Vs 200–3500 m s−1, Vp 800–7000 m s−1), densities (917 kg m−3), and the range of the Poisson ratio (0.2–0.49; Turcotte and Schubert, 2002). The misfit is quantified using the variance reduction (VR; Eq. 8 in Hallo et al., 2021) between synthetic and observed dispersion and ellipticity curves, weighted by reciprocal errors (see error bars in Fig. 8). The VR value of 100 % means a perfect fit, a VR value of 0 % means fit on the edge of the data error bars, and negative values mean that synthetic predictions are out of the range of observed data errors. The VR captures the fitting of the synthetic predictions for the entire frequency range of the data used as input for the inversion.
We first perform the inversion using the dispersion and ellipticity curves from day 230 (pre-drainage period). In this case, the synthetic curves fit the measured data well (Fig. 8c and d). Posterior marginal PDFs of Vs (Fig. 8a) are sharp in the uppermost 130 m (i.e. the zone of precisely inferred model parameters). In the upper 20 m there is a continuous velocity gradient without any distinctive strong interface that can be interpreted as the near-surface ice layer subject to weathering and fractures (Lindner et al., 2019; Cook et al., 2016). From 20–130 m depth there is a continuous layer of ice with expected S-wave velocities of around 1800 m s−1. Between a depth of 130–160 m, there is an interface representing the ice–bed transition. The resolution in the probability of Vs below 200 m is low, as the network is too small to provide dispersion measurements for frequencies sensitive to depths within the bedrock (Fig. 8, grey area). The Poisson ratio range is limited to 0.4 to adhere to the ice properties. This inversion run comprises a larger frequency band for the ellipticity curve compared to the following runs in order to include the shallower part in the velocity model.
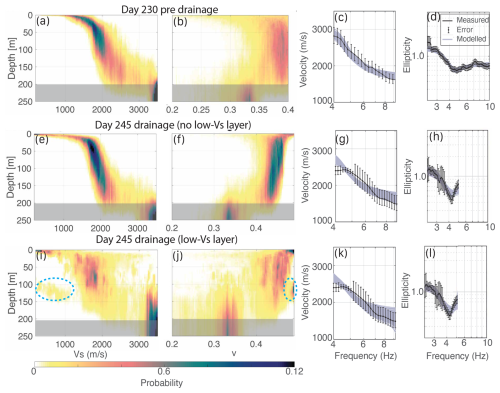
Figure 8Inversion results for (a) the pre-drainage period (day 230) a shear-wave velocity profile Vs, (b) approximate value of Poisson ratio v, (c) measured dispersion curve and uncertainty (black line) and modelled dispersion (grey lines), and (d) measured ellipticity curve and uncertainty (black line) and modelled ellipticity (grey lines). (e–h) Inversion results for the drainage (day 245) that did not include a low-velocity layer. (i–l) Inversion results for the drainage including a low-velocity layer in the inversion. The blue circle depicts the possible low-velocity layer. The inversion results behind the grey shaded region below 200 m (a, b, e, f, i, and j) are poorly constrained as a result of lacking dispersion measurements below 3 Hz.
For day 245 (during the drainage period), two inversions are performed using the same dispersion and ellipticity curves (Fig. 7, blue curves). The ellipticity curves are truncated at 5.2 Hz to focus the model fit on the low-frequency range. The first inversion (Fig. 8e and f) has the constraint that no low-velocity layer is allowed in the velocity model. This PDF Vs profile is similar to the day 230 profile with an ice–bedrock interface between 130–160 m. However, this inversion run cannot find a velocity model that explains the observed phase velocity dispersion between 4 and 5 Hz (Fig. 8g); the fitted velocities are too high. The fit of the ellipticity curve has discrepancies for the trough at 4.4 Hz, as only a weak trough could be produced (Fig. 8h). For this inversion test without low-velocity zones, the maximum likelihood and maximum a posteriori models have fits of VR = 41 % and VR = 27 %, respectively. This inversion run without a low-velocity layer uses the dispersion and ellipticity curves from the drainage period as input data. These curves contain a saddle and a trough (Fig. 7). In this case, the synthetic curves attempt to replicate the input curves while identifying the optimal velocity model. By intentionally prohibiting a low-velocity layer in this inversion, we aim to demonstrate that this option does not fit the data as well as the following inversion run.
The second inversion run with the dispersion and ellipticity curves of day 245 allows for a low-velocity layer at the ice–bedrock interface. The resulting Vs profile (Fig. 8i) shows a shift to lower S-wave velocities at approximately 120 m, which is missing in the pre-drainage profile. In particular, in the PDF Vs profile, the upper structure up to 120 m displays a correct S-wave velocity of ice (approximately 1800 m s−1). Between 120–150 m depth, a cluster of probable low Vs values of 750–1000 m s−1 appears (Fig. 8i, blue circle). At the same depth interval, the Poisson ratio (ν) increases to the value of liquid water (0.49) (Fig. 8j, blue circle). For this run, the fit for the ellipticity and the trough is satisfactory, but the dispersion curve fit fails to reproduce the saddle point in the lower frequencies (Fig. 8k and l). For this inversion test allowing low-velocity zones, the maximum likelihood and maximum a posteriori models have fits of VR = 75 % and VR = 69 %, respectively.
5.2 Forward modelling
Due to the minor differences in model fitting during the inversion runs for the drainage and the low probability of the low-velocity layer, we further explore dispersion and ellipticity using a forward modelling approach. The forward modelling is constrained by the S-wave velocity, depth, and thickness of the low-velocity layer as inferred from the inversion model. For the forward modelling of the ellipticity and dispersion curves, we use the Geopsy software package with the modules “gpell” and “gpdc” (Wathelet et al., 2020). This software computes dispersion and ellipticity curves for the fundamental mode of Rayleigh waves in a user-defined layered medium.
The forward model for the pre-drainage scenario consists of a single ice layer over a half-space model, and the drainage scenario consists of two-layer ice over a half-space model, with a low-velocity layer inserted between the ice and bedrock. The low-velocity-layer thickness ranges from 10 to 30 m, and the S-wave velocities vary between 750 and 1000 m s−1, as derived from the inversion (Fig. 8i). P-wave velocities are held constant. We compare the model output to the measured dispersion and ellipticity curves (Fig. 9). The pre-drainage modelled ellipticity produces a mild trough around 6 Hz. The subsurface models that include a low-velocity layer accurately reproduce the sharp trough around 4.4 Hz in the ellipticity curve, with increased thickness of the low-velocity layer shifting the trough to lower frequencies. However, the model's fit to the measured dispersion curve is less satisfactory, particularly with a notable misfit at lower frequencies and around the saddle feature. Based on the forward model results, the low-velocity zone is probably a 10–30 m thick layer with an S-wave velocity of around 1000 m s−1.
5.3 Preferred subsurface model
Our inverse and forward modelling tests suggest that a low-velocity zone in the basal part of the ice is the most plausible explanation for the observed saddle in the dispersion curve and the ellipticity trough in the seismic data. Notably, the sharp ellipticity trough around 4.4 Hz, evident in the low-velocity-layer model but absent in the pre-drainage model, strongly supports the low-velocity-layer scenario as the preferred interpretation for the drainage process. The forward modelling provides a valuable complement to the weak inversion results, helping to further constrain the properties of the low-velocity layer. The low-velocity zone is probably a 10–30 m thick layer with an S-wave velocity of around 1000 m s−1. Hence, there is a drop of around 40 % in S-wave velocity compared to the initial values of 1800 m s−1.
Revealing the basal low-velocity zone through the inversion process remains challenging. The limited low-frequency data in the dispersion curve, resulting from the current array set-up, restrict the inversion capabilities. Consequently, the probability of the low-velocity layer carries significant uncertainty (Fig. 8i). Although the model including the low-velocity layer (VR = 75 % and VR = 69 %) demonstrates a qualitatively better fit than the model without it (VR = 41 % and VR = 27 %), we cannot determine the statistical significance of the VR values. The inversion results suggest that the synthetic dispersion and ellipticity curves fit the input data better when a low-Vs layer is included, and a 1D structure without a low-velocity layer is a poor approximation of the seismic velocity model. The low-velocity layer, particularly highlighted by forward modelling, helps to explain the observed trough in the ellipticity curve, although the saddle in the dispersion curve was not accurately captured.
The misfit between the inverse and forward-modelled dispersion curves may come from limitations in fully capturing the complex wavefield in the models. For instance, basal features can act as waveguides, potentially influenced by a hypothetical water-saturated layer. An alternative explanation for the seismic velocity drop involves a sediment layer between the ice and bedrock that becomes water pressurized, a phenomenon identified in Antarctica (Picotti et al., 2017; Guerin et al., 2021). The area around Glacier de la Plaine Morte exposed by rapid glacier retreat during recent years almost exclusively consists of a layer of poorly consolidated sediments (Huss et al., 2013). A more complex model with for example pressurized sediments or non-uniform ice velocities might improve the fit for the lower frequencies of the dispersion curves. In our study, we refrained from modelling the presence of a thin sediment layer due to insufficient additional information on the thickness and properties of the sediment or ice. The inferred thickness of the low-velocity layer exceeds possible sedimentary layer dimensions. Instead, we suggest that water is temporarily stored in voids and fractures at the base of the ice.
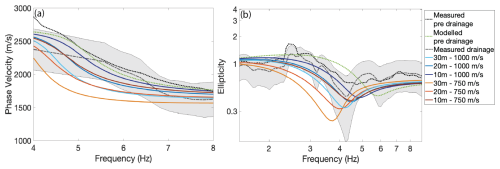
Figure 9(a) Measured and modelled dispersion curves for the pre-drainage period (dotted black and green lines), measured dispersion curve (dashed grey line) with uncertainty (shaded grey area) with the modelled dispersion curves (red and blue lines) for several thickness (10–30 m) and velocity values (750–1000 m s−1) for the low-Vs layer. (b) Same as for (a) but for the measured and modelled ellipticity curves.
Based on the observations from the seismic analyses for the pre-drainage and drainage periods, water is stored in fractures and other void spaces near the base of the ice and results in a reduction in the seismic velocity. In the next sections we discuss how such a transient seismic velocity decrease can be explained in relation to changes in the subglacial environment, building upon insights from Lindner et al. (2020).
6.1 HVSR trough related to medium changes
In our study, we inferred that the HVSR trough adjacent to the fundamental resonance peak (Fig. 3g and h) reflects a change in subglacial seismic properties. Equivalent to our findings, in earthquake site-response studies, a trough in the HVSR is related to low-velocity layers at depth (Di Giacomo et al., 2005; Panzera et al., 2015, 2019). Hobiger et al. (2021) discuss the presence of trapped surface waves in the low-velocity layer. This resonance influences the vertical component of motion and de-amplification of the horizontal components. Antunes et al. (2022) observed that VHSR peaks (the inverse of HVSR troughs) offer insights into seismic energy anomalies caused by fluids in reservoirs, as the wavefield predominantly exhibits polarization in the vertical direction. Guillemot et al. (2024) conducted a study using VHSR measurements on Tête Rousse Glacier in France. They identified subglacial water-filled cavities through the presence of VHSR peaks, a result of diminished basal impedance associated with higher water content.
At Glacier de la Plaine Morte, the trough implies a vertical amplification at around 4.4 Hz. The resonance mode analysis (Appendix C) validates the existence of a vertical resonance around 4.4 Hz for PM01 and PM02 occurring concurrently with the development of the HVSR trough at these same stations. This implies that the low-velocity layer is spatially constrained or at least spatially varying. Additional evidence for velocity inversions at depth is in a plateau of the dispersion curve, as observed in Fig. 7a (Maraschini and Foti, 2010; Chieppa et al., 2020). The HVSR trough appears to form as early as day 229 (Fig. 4a); this may suggest that meltwater, or some early leakage from the lake, begins to reach the subglacial environment. However, the early trough is less clear like after the lake drainage event at days 245 and 246.
The above results are in line with the velocity decrease in the drainage period observed with seismic interferometry. Similar to the HVSR approach, we focused on days with a stable dominant noise source which lies in the stationary-phase zone of the analysed station pair. In this situation, a slight back azimuth change in the source (10°), which is not evident in the beamforming results, is unable to produce the observed velocity drop of 3 %–4 %. As a reference, Zhan (2019) performed noise interferometry across Bering Glacier and revealed a 1 %–2 % seismic velocity reduction. The low-velocity layer can be explained by water storage in basal hydrofractures caused by the drainage, which is expected to drop the seismic velocity of Rayleigh waves. However, the velocity change obtained with interferometry is a bulk measurement representing the entire ice column. Therefore we cannot make quantitative statements on the velocity drop near the base.
6.2 The subglacial environment
Glacier de la Plaine Morte is a fully temperate glacier and thus similar to Alpine glaciers previously studied with passive seismology (Walter et al., 2008; Nanni et al., 2020). For Glacier de la Plaine Morte, variations in hydraulic conditions may be the result of varying macroscopic water inclusions, specifically by varying volumes of basal crevasses, void spaces, or the filling state thereof. The occurrence of basal fracture and void spaces contributes to a decrease in bulk velocity, consequently resulting in a reduction in shear-wave velocity (Biot, 1962). Cracks at the surface of Glacier de la Plaine Morte can lower the Rayleigh wave velocity by up to 8 % (Lindner et al., 2019). Further observations of anisotropy in glacial ice caused by crystal fabric orientation result in a 3 %–5 % decrease in shear-wave velocity (Picotti et al., 2015; Smith et al., 2017). At Rhône Glacier, another temperate Swiss glacier, Gajek et al. (2021) found diurnal variations in shear-wave anisotropy of up to 3 %, which they explain by the presence of macroscopic meltwater inclusions. The findings presented by Harper et al. (2010) reveal that the subglacial hydraulic system may extend up to 40 m into the overlying ice mass, with hydraulically connected crevasses occupying 0.3 %. To provide a comparison, all fractures (both connected and unconnected) make up 0.46 % of Worthington Glacier, Alaska (Harper and Humphrey, 1995), while all voids, channels, and cracks combined account for 1.3 % of Storglaciären, Sweden (Pohjola, 1994). These numbers for void space and seismic velocity are derived from scenarios involving meltwater-filled fractures. Based on our inverted velocity profiles (Sect. 5), a shear-wave velocity decrease of 40 % is estimated. In the case of Glacier de la Plaine Morte, the occurrence of multi-day pre-drainage hydraulic tremors suggests the establishment of an extensive fracture network (Lindner et al., 2020). Consequently, the quantity of water-filled fractures is likely significantly higher than the numbers presented above, as well as the seismic velocity drop. At Gornergletscher in Switzerland, a similar ice-marginal lake used to drain annually, releasing a water volume comparable to that of Lac des Faverges (Huss et al., 2007). Here, the water was stored subglacial and a void ratio ranging from 0.1 %–10 % was estimated.
6.2.1 Hydraulic parameters
We produced seismic-based evidence for water storage near the base of the ice, and in this section we show where this water originated. For this, we present a comparison of the discharge rate of Lac des Faverges and the stage of the Trüebbach stream (Fig. 1d and e). We include the daily melt-induced discharge of the entire glacier. The daily melt–discharge curve is offset by 3 d from the Trüebbach stage. To align stage fluctuations for stage–discharge calculations, the melt curve is shifted 3 d forward. Additionally, the Trüebbach stage peak, delayed by 3.5 h after the lake discharge peak (Fig. 1e), represents the expected travel time for the subareal part of the draining water between the Rezligletscher tongue and the gauge station. Consequently, the lake discharge curve is shifted 3.5 h forward for comparison. The total glacier discharge is then computed by summing the lake discharge and surface melt.
Figure 10 presents the comparison between the Trüebbach stage and the total discharge. The red curves represent the stage–discharge relation (Herschy, 1998) and 95 % confidence bounds for the pre-drainage period. Here, the stage increases with the discharge. Most meltwater drains northward along the subglacial interface towards the Trüebbach stream. However, a notable portion of surface melt infiltrates the karstic system connected to the Rhône Valley via subsurface conduits mainly in the southwestern part of the glacier (Finger et al., 2013). This results in a low stage–discharge correlation coefficient (R2=0.28). With the onset of the drainage, the discharge rapidly increases initially, followed by an increase in stage. This trend follows the slope of the extrapolated fitting curve of the pre-drainage period (dashed red curve in Fig. 10). However, we acknowledge that the data are below the fit. After the main discharge peak, the orange (from day 241) to black (end of day 245) data points form a cluster where the discharge remains high, while the stage does not surpass the highest values of the pre-drainage stage levels. Over about 3 d, the discharge more than doubles with respect to pre-drainage conditions, whereas the fit of the stage–discharge relation shows no trend in stage. This suggests a significant temporal water storage. As discussed previously, we suggest the drainage water is mainly stored in fractures and voids in the basal part of the ice. However, during and after the temporal storage, some of the water might infiltrate into the karstic system, where also parts of the meltwater are flowing through (Finger et al., 2013).
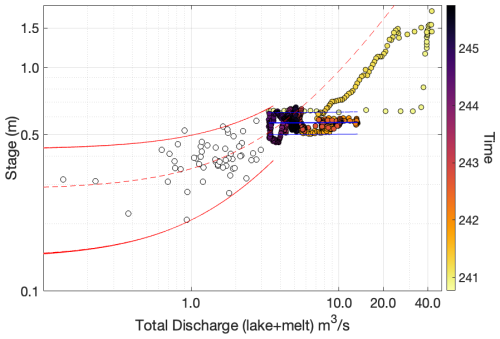
Figure 10Total discharge from the lake and meltwater plotted against the stage of the Trüebbach. The white data points represent the days before the start of the drainage, the colour-coded data points follow the days from the onset of the drainage until day 246. The dashed red line is the linear fitting function (R2=0.28) with the 95 % confidence bounds (solid thin red lines), fitted for the pre-drainage data points. The drainage data points (except the main drainage peak (yellow dots) are fitted in blue.
6.2.2 Water storage extent
To obtain an estimation of the aerial extent of the stored water, we assume a low-velocity layer 10–30 m thick (Sect. 5), and a void space of 5 %–10 %. The elevated presence of water-filled fractures implies that the fracture and void volume is likely to be on the high side of the void space numbers provided by Huss et al. (2007). For the discharge volume estimation, the peak discharge volume (Fig. 1e) is excluded, since this water drained directly in the Trüebbach stream. Short glacier surface uplift (Lindner et al., 2020; Fig. 2b) implies subglacial water flow for this period. From the lake volume curve, we compute that approximately 106 m3 water drained from midday 241 up to the end of day 245 into the subglacial environment (Fig. 1d). The total volume of ice filled with water is obtained by dividing the drained water volume by the void space percentage. Given the low-velocity-layer thickness, we can then determine the areal extent of the water-filled void spaces. This results in 0.33–2.0 km2 of fractures and voids filled with water. For comparison, the seismic array covers an area of 0.06 km2 and the entire glacier is 7.3 km2 in 2016.
Given the assumption that nearly all the water following the primary drainage peak was temporarily stored in basal fractures and voids, the impact on the entire glacier area is estimated to range from 4.5 % to 27 %. This value is subject to significant variability due to uncertainties in fracture volume, and this estimate serves as an upper limit, as the entire 106 m3 of water may not be stored simultaneously. The troughs in the HVSRs are primarily observed at stations PM01 and PM02 (Fig. 3) in the western segment of the array. As depicted in Fig. 9 by Lindner et al. (2020), a channelized subglacial drainage system emerges to the south and west of the seismic array and supports the observations that the low-velocity layer has only a local extent.
6.3 Implications for HVSR measurement on ice
The HVSR time-series observations on Glacier de la Plaine Morte confirm the general recommendations and known issues of the stability of the HVSR method (Chatelain et al., 2008; Köhler and Weidle, 2019), especially with regards to the impact of varying noise sources. Nevertheless, based on the temporal evolution of the HVSR curves, we are able to identify a medium change at the base of the glacier. Hence, we outline a series of considerations for applying HVSR to a glacier:
-
The HVSR technique is valued for its simplicity as a single-station approach, and computing HVSR curves is straightforward. For ice thickness estimations relying on resonance frequency, a single-station measurement can be adequate, following the approach outlined in points 2 and 3.
-
Power spectra over the full recording period, covering a wide frequency range, can be used to identify events like glaciohydraulic tremors, water flow, or moulin resonances. With this transient events in the glacier, the HVSR curves exhibit hourly variations that could introduce bias in thickness or velocity estimations. In scenarios with a nearby seismic noise source, the overall HVSR amplitude tends to rise, accompanied by the appearance of broad HVSR amplitude peaks. In cases of a high event rate, a multiple-day to weeks-long recording period is recommended.
-
When the seismic record length is adequate, hourly-computed HVSR curves can be stacked and presented as probability density functions (refer to Fig. 3) to achieve a stable estimation of f0. Additionally, one can present the HVSR as time series to examine the variations in curve characteristics over time.
-
A comprehensive understanding of spatio-temporal variations and medium changes on such a dynamic subsurface requires an array of multiple seismic stations. An array facilitates additional passive seismic analyses, including beamforming, seismic interferometry, resonance mode analysis, and phase velocity dispersion, thereby providing valuable insights for site characterization.
-
With an array available, a beamforming analysis allows for acquiring noise source location and phase velocities. The analysis should cover multiple frequency bins, including the one targeting the basal interface. Precise noise source localization is pivotal for distinguishing whether variations in HVSR curves result from a source effect or alterations in the medium. (Sub-)glacial processes might produce seismic waves with a frequency content that could resemble f0.
In this study, we analysed 4 months of continuous seismic records on Glacier de la Plaine Morte with the HVSR technique to capture spatio-temporal variations at the basal interface. We aim to assess the reliability of the technique in such a dynamic environment. Subglacial processes change the medium properties for propagating seismic waves, but simultaneously, the source of the seismic ambient noise field varies. HVSR changes primarily originate from fluctuations in nearby noise conditions influenced by hydraulic tremors, drainage-related events, moulin resonances, and anthropogenic sources. Despite these source-related influences, a discernible spatio-temporal trend in HVSR curves reflects material changes within and/or beneath the ice. An HVSR trough emerges after the subglacial drainage of Lac des Faverges, an ice-marginal lake. Seismic velocity changes of 3 %–4 % inferred from interferometry indicate a velocity drop at the ice–bedrock interface. Inversion and forward modelling of Rayleigh wave ellipticity and dispersion curves further refine the dimensions of this low-velocity zone. A low-velocity-layer thickness of 10–30 m is estimated and a seismic velocity drop of up to 40 %. Based on the seismic analysis and discharge anomalies appearing after the drainage, we suggest that the basal low-velocity layer can be explained by subglacial water storage in newly formed fractures after drainage. This layer has a local extent, reflected in the spatial variations in the HVSR trough throughout the array, and covers an estimated 4.5 %–27 % of the glacier area. Our results thus demonstrate that the HVSR technique can be used as an indicator of a spatio-temporal medium change at the ice–bedrock interface.
We suggest that a deeper understanding of the seismic noise field and the response of HVSR to a dynamic and changing subsurface is needed to make a reliable characterization of the medium using the HVSR seismic method on a glacier. In addition, stacking or filtering multiple days- to weeks-long time series of hourly HVSR data is necessary to smooth transient events and changes in noise sources, ensuring a reliable fundamental resonance frequency. Relying solely on a few hours of measurements could result in a significantly biased HVSR curve. The single-station HVSR methodology has demonstrated its potential on glaciers. The next logical step could involve its application in remote and less noisy regions, such as the Antarctic or Arctic ice sheets. Subsequently, a study focusing on temporal variations in the HVSR over multiple seasons could be pursued.
Matched-field processing (MFP) is an array-processing technique that is based on phase delay measurements. Complementary to the traditional plane wave beamforming, MFP has the advantage that it can also include non-planar waves from nearby noise sources. MFP identifies the location of a source by a cross-correlation of the observed data with replicas of expected signals computed for various trial source positions. Maximum correlation corresponds to the most likely source location. For further methodology details we refer to Corciulo et al. (2012) and Chmiel et al. (2016). Lindner et al. (2020) used the MFP technique to obtain the source locations of the hydraulic tremor at frequencies around 12 Hz. In this study, we used the planar wave assumption to perform a grid search over back azimuth and phase velocity from the ambient vibrations, and Fig. A1 displays a few examples of the maximum coherence locations. The back azimuths of the dominant noise source are computed for every hour. For the 4-month recording period, back azimuths are computed in three frequency bands: 3–5, 5–8, and 8–12 Hz (Figs. 5 and A2). The minimum frequency regarding the array resolution is 3 Hz (Poggi and Fäh, 2010). We found that for this array configuration, a minimum bandwidth of 2 Hz is required to obtain a stable MFP result.

Figure A1(a–d) MFP back azimuth and phase velocity for 1 h of data for respectively days 163, 231, 240, and 246 for the frequency band 2.5–5 Hz. The blue cross identifies the maximum coherence.
Dispersion curves as presented in Fig. 7 are obtained using high-resolution beamforming, the methodology developed by Poggi and Fäh (2010) applying the Capon algorithm. The picked mean dispersion curves of probability density functions (Fig. A3) are smoothed, resulting in the dispersion curves of Fig. 7a. We focus on the fundamental Rayleigh wave mode, which dominates the wavefield.
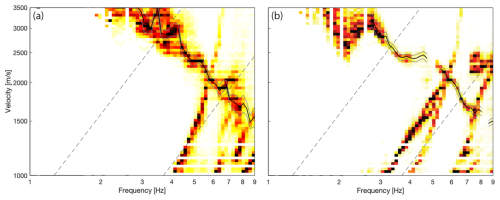
Figure A3Probability density distribution for the dispersion curves obtained by high-resolution beamforming (Poggi and Fäh, 2010). The dashed lines are the array resolution limits, the black line comprises the mean curve, and the grey lines are the uncertainties for the dispersion curve of pre-drainage day 230 (a) and drainage day 245 (b). The steeply inclined stripes at higher frequencies are aliasing effects.
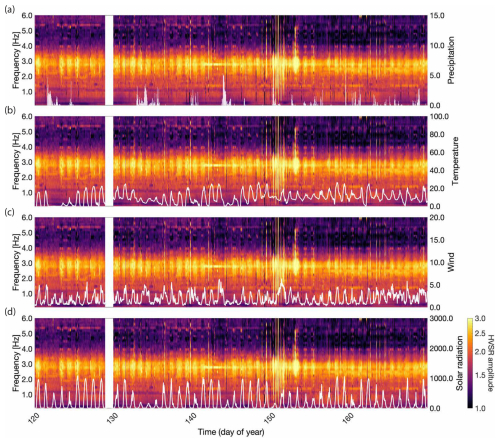
Meteorological data are provided by MeteoSwiss weather stations at Montana (1495 , at 8 km from the glacier) and at Adelboden (1320 , 13 km). We use continuous measurements with a 10 min sampling rate of air temperature, wind speed, solar radiation, and precipitation. The HVSR is juxtaposed with meteorological parameters to explore potential correlations, particularly investigating whether the external cause of the diurnal peak amplitude pattern can be identified (refer to Fig. B1). While temperature exhibits a diurnal trend, the intensity of peak amplitude shows no direct correlation with the fluctuations in peak temperature. Additionally, precipitation, wind, and solar radiation do not exert any discernible influence on the HVSR curves.
We employ normal mode analysis of ambient vibrations to retrieve physical parameters that characterize a structure and to monitor the structure over time. In this analysis we use the frequency domain decomposition (FDD) technique by Brincker et al. (2001), applied to rock slopes including higher vibration modes (see Sect. 3 of Häusler et al., 2019). The FDD output consists of singular values (SVs) and corresponding singular vectors from the singular-value decomposition of the cross-power spectral densities of all seismic input traces. The SVs can be understood as the auto-spectral densities of the modal coordinates, which peak at fundamental and higher-mode resonance frequencies of the structure. The corresponding singular vectors are interpreted as the 3D mode shapes of the structure. The FDD technique is sensitive to varying noise sources, as it assumes uniformly distributed sources with a near-white source spectrum.
In this study we performed the mode analysis for 2 h of the three-component seismic data applied on 4 d: the pre-drainage (day 231), drainage event (day 240), moulin resonances (day 242), and the day with the trough in the HVSR (day 245). The noisy bandwidths are included for days 240 and 242, and this nearby moulin noise source disturbs the signal significantly with the result that resonance modes are not identifiable (Fig. C1b and c). Days 231 and 245 (Fig. C1a and d) have the same dominant noise source (one of the proglacial waterfalls; Fig. 5b); hence we can make a comparison of the pre-and drainage mode analysis. Day 231 displays a fundamental mode (f0) at approx. 3 Hz and a weak second mode (f1) at approx. 4.4 Hz. At day 245, we observe a similar fundamental resonance f0, but the second mode (4.4 Hz) is much more pronounced than at day 231. For f1, the vertical singular vector is dominating, while for the f0, the horizontal singular vectors are strongest.

Figure C1Singular values with picked resonance frequencies (f0 and f1) for the (a) pre-drainage, (b) drainage onset, (c) moulin resonance, and (d) drainage period.
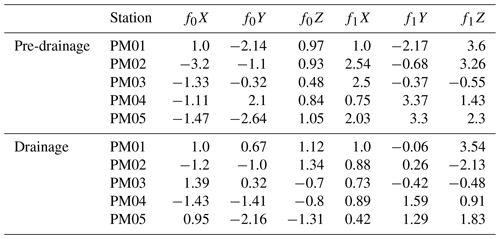
Table C1 displays the singular vector values. In the resonance mode analysis, particular attention is given to the f1Z component (associated with drainage, found in the last column) for PM01 and PM02. Notably, these values are significantly higher than the corresponding horizontal vectors. This distinction between the components is more pronounced here compared to the other stations and the pre-drainage period.
Table C1Singular vector values for the pre-drainage and drainage resonance mode analysis. f0 is the fundamental resonance mode; f1 the second mode; and the mode shape vector of the three components. Since the stations are not geographically oriented, we cannot put coordinates to the X,Y vectors and should be considered relative values. Z is the mode shape of the vertical component.
The seismic data used for this research are available in the data portal of the Swiss Seismological Service (Swiss Seismological Service, 1985) at ETH Zurich (http://networks.seismo.ethz.ch/networks/4d/, last access: April 2023) https://doi.org/10.12686/SED/NETWORKS/4D.
JvG initiated the research idea, performed the HVSR analysis, performed the inversion and forward modelling, and wrote the manuscript. FW advised on this project and wrote the manuscript. FL performed the seismic interferometry and wrote the manuscript. MiH advised on the inverse and forward modelling and wrote the manuscript. MaH provided lake and melt–discharge data, advised on the glaciology of Glacier de la Plaine Morte, and edited the manuscript. DF advised on the HVSR analysis and edited the manuscript.
The contact author has declared that none of the authors has any competing interests.
Publisher's note: Copernicus Publications remains neutral with regard to jurisdictional claims made in the text, published maps, institutional affiliations, or any other geographical representation in this paper. While Copernicus Publications makes every effort to include appropriate place names, the final responsibility lies with the authors.
The authors thank their home institutions and all people involved in the monitoring systems used in this research. Special thanks go to Mauro Häusler for his contributions to the resonance mode analysis. We acknowledge Malgorzata Chmiel for advising on the MFP analysis and the discussions on the scope of the research. Geopraevent Ltd. (https://www.geopraevent.ch/, last access: January 2023) and Lenk municipality (https://lenk-simmental.ch, last access: January 2023) provided the Trüebbach stage and Lac des Faverges time-lapse images. The author acknowledges that ChatGPT (OpenAI, GPT-3; http://openai.com, last access: December 2024) was used for partially improving the English in an earlier version of this paper. The suggestions and feedback of the editor, Kristin Poinar, and of the two reviewers (Andreas Köhler and Florent Gimbert) are valued and highly improved the manuscript.
Janneke van Ginkel is funded with an ETH Zürich Postdoctoral Fellowship. Fabian Lindner received support through the German Research Foundation (grant no. LI3721/2-1). Miroslav Hallo is supported by the Japan Society for the Promotion of Science Fellowship P23070 and Grant-in-Aid 23KF0149.
This paper was edited by Kristin Poinar and reviewed by Andreas Köhler and Florent Gimbert.
Albarello, D. and Lunedei, E.: Combining horizontal ambient vibration components for H/V spectral ratio estimates, Geophys. J. Int., 194, 936–951, https://doi.org/10.1093/gji/ggt130, 2013. a
Antunes, V., Planes, T., Obermann, A., Panzera, F., D'Amico, S., Mazzini, A., Sciarra, A., Ricci, T., and Lupi, M.: Insights into the dynamics of the Nirano Mud Volcano through seismic characterization of drumbeat signals and V/H analysis, J. Volcanol. Geoth. Res., 431, 107619, https://doi.org/10.1016/j.jvolgeores.2022.107619, 2022. a
Aster, R. C. and Winberry, J. P.: Glacial seismology, Rep. Prog. Phys., 80, 126801, https://doi.org/10.1088/1361-6633/aa8473, 2017. a
Bard, P.-Y.: Microtremor measurements: a tool for site effect estimation, in: Proceedings the Effects of Surface Geology on Seismic Motion, 3, 1251–1279, 1999. a
Bartholomaus, T. C., Amundson, J. M., Walter, J. I., O'Neel, S., West, M. E., and Larsen, C. F.: Subglacial discharge at tidewater glaciers revealed by seismic tremor, Geophys. Res. Lett., 42, 6391–6398, https://doi.org/10.1002/2015GL064590, 2015. a, b
Behm, M., Walter, J. I., Binder, D., Cheng, F., Citterio, M., Kulessa, B., Langley, K., Limpach, P., Mertl, S., Schöner, W., Tamstorf, M., and Weyss, G.: Seismic characterization of a rapidly-rising jökulhlaup cycle at the AP Olsen Ice Cap, NE-Greenland, J. Glaciol., 66, 329–347, https://doi.org/10.1017/jog.2020.9, 2020. a
Bensen, G. D., Ritzwoller, M. H., Barmin, M. P., Levshin, A. L., Lin, F., Moschetti, M. P., Shapiro, N. M., and Yang, Y.: Processing seismic ambient noise data to obtain reliable broad-band surface wave dispersion measurements, Geophys. J. Int., 169, 1239–1260, https://doi.org/10.1111/j.1365-246X.2007.03374.x, 2007. a
Biot, M. A.: Mechanics of Deformation and Acoustic Propagation in Porous Media, J. Appl. Phys., 33, 1482–1498, 1962. a
Bonilla, L. F., Steidl, J. H., Lindley, G. T., Tumarkin, A. G., and Archuleta, R. J.: Site amplification in the San Fernando Valley, California: variability of site-effect estimation using the S wave, coda, and H/V methods, B. Seismol. Soc. Am., 87, 710–730, https://doi.org/10.1785/BSSA0870030710, 1997. a
Bonnefoy-Claudet, S., Cotton, F., and Bard, P.-Y.: The nature of noise wavefield and its applications for site effects studies: a literature review, Earth-Sci. Rev., 79, 205–227, https://doi.org/10.1016/j.earscirev.2006.07.004, 2006. a, b
Brenguier, F., Boué, P., Ben-Zion, Y., Vernon, F., Johnson, C., Mordret, A., Coutant, O., Share, P.-E., Beaucé, E., Hollis, D., and Lecocq, T.: Train traffic as a powerful noise source for monitoring active faults with seismic interferometry, Geophys. Res. Lett., 46, 9529–9536, https://doi.org/10.1029/2019GL083438, 2019. a
Brenguier, F., Courbis, R., Mordret, A., Campman, X., Boué, P., Chmiel, M., Takano, T., Lecocq, T., Van der Veen, W., Postif, S., and Hollis, D.: Noise-based ballistic wave passive seismic monitoring. Part 1: body waves, Geophys. J. Int., 221, 683–691, https://doi.org/10.1093/gji/ggz440, 2020. a
Brincker, R., Zhang, L., and Andersen, P.: Modal identification of output-only systems using frequency domain decomposition, Smart Mater. Struct., 10, 441, https://doi.org/10.1088/0964-1726/10/3/303, 2001. a
Chaput, J., Aster, R., Karplus, M., and Nakata, N.: Ambient high-frequency seismic surface waves in the firn column of central west Antarctica, J. Glaciol., 68, 785–798, https://doi.org/10.1017/jog.2021.135, 2022. a
Chatelain, J. L., Guillier, B., Cara, F., Duval, A. M., Atakan, K., Bard, P. Y., and Wp02 Sesame Team: Evaluation of the influence of experimental conditions on H/V results from ambient noise recordings, B. Earthq. Eng., 6, 33–74, https://doi.org/10.1007/s10518-007-9040-7, 2008. a
Chieppa, D., Hobiger, M., Bergamo, P., and Fäh, D.: Ambient vibration analysis on large scale arrays when lateral variations occur in the subsurface: a study case in Switzerland, Pure Appl. Geophys., 177, 4247–4269, https://doi.org/10.1007/s00024-020-02516-x, 2020. a
Chmiel, M., Roux, P., and Bardainne, T.: Extraction of phase and group velocities from ambient surface noise in a patch-array configuration, Geophysics, 81, KS231–KS240, https://doi.org/10.1190/geo2016-0027.1, 2016. a
Cook, J. M., Hodson, A. J., and Irvine-Fynn, T. D.: Supraglacial weathering crust dynamics inferred from cryoconite hole hydrology, Hydrol. Process., 30, 433–446, https://doi.org/10.1002/hyp.10602, 2016. a
Corciulo, M., Roux, P., Campillo, M., Dubucq, D., and Kuperman, W. A.: Multiscale matched-field processing for noise-source localization in exploration geophysics, Geophysics, 77, KS33–KS41, https://doi.org/10.1190/geo2011-0438.1, 2012. a
Di Giacomo, D., Gallipoli, M. R., Mucciarelli, M., Parolai, S., and Richwalski, S. M.: Analysis and modeling of HVSR in the presence of a velocity inversion: the case of Venosa, Italy, B. Seismol. Soc. Am., 95, 2364–2372, https://doi.org/10.1785/0120040242, 2005. a
Ding, Y., Mu, C., Wu, T., Hu, G., Zou, D., Wang, D., Li, W., and Wu, X.: Increasing cryospheric hazards in a warming climate, Earth-Sci. Rev., 213, 103500, https://doi.org/10.1016/j.earscirev.2020.103500, 2021. a
Eisen, O., Hofstede, C., Miller, H., Kristoffersen, Y., Blenkner, R., Lambrecht, A., and Mayer, C.: A new approach for exploring ice sheets and sub-ice geology, EOS T. Am. Geophys. Un., 91, 429–430, 2010. a
Fäh, D., Kind, F., and Giardini, D.: A theoretical investigation of average H/V ratios, Geophys. J. Int., 145, 535–549, https://doi.org/10.1046/j.0956-540x.2001.01406.x, 2001. a
Finger, D., Hugentobler, A., Huss, M., Voinesco, A., Wernli, H., Fischer, D., Weber, E., Jeannin, P.-Y., Kauzlaric, M., Wirz, A., Vennemann, T., Hüsler, F., Schädler, B., and Weingartner, R.: Identification of glacial meltwater runoff in a karstic environment and its implication for present and future water availability, Hydrol. Earth Syst. Sci., 17, 3261–3277, https://doi.org/10.5194/hess-17-3261-2013, 2013. a, b
Gajek, W., Gräff, D., Hellmann, S., Rempel, A. W., and Walter, F.: Diurnal expansion and contraction of englacial fracture networks revealed by seismic shear wave splitting, Communications Earth and Environment, 2, 209, https://doi.org/10.1038/s43247-021-00279-4, 2021. a
Gimbert, F., Tsai, V. C., Amundson, J. M., Bartholomaus, T. C., and Walter, J. I.: Subseasonal changes observed in subglacial channel pressure, size, and sediment transport, Geophys. Res. Lett., 43, 3786–3794, https://doi.org/10.1002/2016GL068337, 2016. a, b
Glacier Monitoring Switzerland: Swiss Glacier Mass Balance, release 2023, [data set], https://doi.org/10.18750/massbalance.2023.r2023, 2023. a
Grab, M., Mattea, E., Bauder, A., Huss, M., Rabenstein, L., Hodel, E., Linsbauer, A., Langhammer, L., Schmid, L., Church, G., Hellmann, S.,Délèze, K., Schaer, P., Lathion, P., Farinotti, D., and Maurer, H.: Ice thickness distribution of all Swiss glaciers based on extended ground-penetrating radar data and glaciological modeling, J. Glaciol., 67, 1074–1092, https://doi.org/10.1017/jog.2021.55, 2021. a, b, c
Guerin, G., Mordret, A., Rivet, D., Lipovsky, B. P., and Minchew, B. M.: Frictional origin of slip events of the Whillans Ice Stream, Antarctica, Geophys. Res. Lett., 48, e2021GL092950, https://doi.org/10.1029/2021GL092950, 2021. a
Guillemot, A., Bontemps, N., Larose, E., Teodor, D., Faller, S., Baillet, L., Garambois, S., Thibert, E., Gagliardini, O., and Vincent, C.: Investigating subglacial water-filled cavities by spectral analysis of ambient seismic noise: results on the polythermal Tête-Rousse Glacier (Mont Blanc, France), Geophys. Res. Lett., 51, e2023GL105038, https://doi.org/10.1029/2023GL105038, 2024. a, b
Hallo, M., Imperatori, W., Panzera, F., and Fäh, D.: Joint multizonal transdimensional Bayesian inversion of surface wave dispersion and ellipticity curves for local near-surface imaging, Geophys. J. Int., 226, 627–659, https://doi.org/10.1093/gji/ggab116, 2021. a, b
Harper, J. T. and Humphrey, N. F.: Borehole video analysis of a temperate glacier'englacial and subglacial structure: implications for glacier flow models, Geology, 23, 901–904, 1995. a
Harper, J. T., Bradford, J. H., Humphrey, N. F., and Meierbachtol, T. W.: Vertical extension of the subglacial drainage system into basal crevasses, Nature, 467, 579–582, https://doi.org/10.1038/nature09398, 2010. a
Häusler, M., Michel, C., Burjánek, J., and Fäh, D.: Fracture network imaging on rock slope instabilities using resonance mode analysis, Geophys. Res. Lett., 46, 6497–6506, https://doi.org/10.1029/2019GL083201, 2019. a
Herschy, R. W.: Stage-discharge relation, in: Encyclopedia of Hydrology and Lakes. Encyclopedia of Earth Science, Springer, Dordrecht, https://doi.org/10.1007/1-4020-4497-6_212, 1998. a
Hobiger, M., Bard, P.-Y., Cornou, C., and Le Bihan, N.: Single station determination of Rayleigh wave ellipticity by using the random decrement technique (RayDec), Geophys. Res. Lett., 36, L14303, https://doi.org/10.1029/2009GL038863, 2009. a
Hobiger, M., Hallo, M., Schmelzbach, C., Stähler, S. C., Fäh, D., Giardini, D., Golombek, M., Clinton, J., Dahmen, N., Zenhäusern, G., Knapmeyer-Endrun, B., Carrasco, S., Charalambous, C., Hurst, K., Kedar, S., and Banerdt, W. B.: The shallow structure of Mars at the InSight landing site from inversion of ambient vibrations, Nat. Commun., 12, 6756, https://doi.org/10.1038/s41467-021-26957-7, 2021. a
Huss, M., Bauder, A., Werder, M., Funk, M., and Hock, R.: Glacier-dammed lake outburst events of Gornersee, Switzerland, J. Glaciol., 53, 189–200, https://doi.org/10.3189/172756507782202784, 2007. a, b
Huss, M., Voinesco, A., and Hoelzle, M.: Implications of climate change on Glacier de la Plaine Morte, Switzerland, Geogr. Helv., 68, 227–237, https://doi.org/10.5194/gh-68-227-2013, 2013. a, b, c, d
Huss, M., Bauder, A., Linsbauer, A., Gabbi, J., Kappenberger, G., Steinegger, U., and Farinotti, D.: More than a century of direct glacier mass-balance observations on Claridenfirn, Switzerland, J. Glaciol., 67, 697–713, https://doi.org/10.1017/jog.2021.22, 2021. a
King, E. C., Pritchard, H. D., and Smith, A. M.: Subglacial landforms beneath Rutford Ice Stream, Antarctica: detailed bed topography from ice-penetrating radar, Earth Syst. Sci. Data, 8, 151–158, https://doi.org/10.5194/essd-8-151-2016, 2016. a
Köhler, A. and Weidle, C.: Potentials and pitfalls of permafrost active layer monitoring using the HVSR method: a case study in Svalbard, Earth Surf. Dynam., 7, 1–16, https://doi.org/10.5194/esurf-7-1-2019, 2019. a, b
Kraaijenbrink, P. D., Bierkens, M. F., Lutz, A. F., and Immerzeel, W.: Impact of a global temperature rise of 1.5 degrees Celsius on Asia's glaciers, Nature, 549, 257–260, https://doi.org/10.1038/nature23878, 2017. a
Kyrke-Smith, T. M., Gudmundsson, G. H., and Farrell, P. E.: Can seismic observations of bed conditions on ice streams help constrain parameters in ice flow models?, J. Geophys. Res.-Earth, 122, 2269–2282, https://doi.org/10.1002/2017JF004373, 2017. a
Langhammer, L., Grab, M., Bauder, A., and Maurer, H.: Glacier thickness estimations of alpine glaciers using data and modeling constraints, The Cryosphere, 13, 2189–2202, https://doi.org/10.5194/tc-13-2189-2019, 2019. a
Lévêque, J.-J., Maggi, A., and Souriau, A.: Seismological constraints on ice properties at Dome C, Antarctica, from horizontal to vertical spectral ratios, Antarct. Sci., 22, 572–579, https://doi.org/10.1017/S0954102010000325, 2010. a
Lindner, F., Laske, G., Walter, F., and Doran, A. K.: Crevasse-induced Rayleigh-wave azimuthal anisotropy on Glacier de la Plaine Morte, Switzerland, Ann. Glaciol., 60, 96–111, https://doi.org/10.1017/aog.2018.25, 2019. a, b, c, d
Lindner, F., Walter, F., Laske, G., and Gimbert, F.: Glaciohydraulic seismic tremors on an Alpine glacier, The Cryosphere, 14, 287–308, https://doi.org/10.5194/tc-14-287-2020, 2020. a, b, c, d, e, f, g, h, i, j
Llorens, M.-G., Griera, A., Bons, P. D., Gomez-Rivas, E., Weikusat, I., Prior, D. J., Kerch, J., and Lebensohn, R. A.: Seismic anisotropy of temperate ice in polar ice sheets, J. Geophys. Res.-Earth, 125, e2020JF005714, https://doi.org/10.1029/2020JF005714, 2020. a
Luthra, T., Anandakrishnan, S., Winberry, J. P., Alley, R. B., and Holschuh, N.: Basal characteristics of the main sticky spot on the ice plain of Whillans Ice Stream, Antarctica, Earth Planet. Sc. Lett., 440, 12–19, https://doi.org/10.1016/j.epsl.2016.01.035, 2016. a
Mao, S., Mordret, A., Campillo, M., Fang, H., and van der Hilst, R. D.: On the measurement of seismic traveltime changes in the time–frequency domain with wavelet cross-spectrum analysis, Geophys. J. Int., 221, 550–568, https://doi.org/10.1093/gji/ggz495, 2019. a
Maraschini, M. and Foti, S.: A Monte Carlo multimodal inversion of surface waves, Geophys. J. Int., 182, 1557–1566, https://doi.org/10.1111/j.1365-246X.2010.04703.x, 2010. a
Molnar, S., Cassidy, J., Castellaro, S., Cornou, C., Crow, H., Hunter, J., Matsushima, S., Sánchez-Sesma, F., and Yong, A.: Application of microtremor horizontal-to-vertical spectral ratio (MHVSR) analysis for site characterization: state of the art, Surv. Geophys., 39, 613–631, https://doi.org/10.1007/s10712-018-9464-4, 2018. a
Mordret, A., Courbis, R., Brenguier, F., Chmiel, M., Garambois, S., Mao, S., Boué, P., Campman, X., Lecocq, T., Van der Veen, W., and Hollis, D.: Noise-based ballistic wave passive seismic monitoring – Part 2: surface waves, Geophys. J. Int., 221, 692–705, https://doi.org/10.1093/gji/ggaa016, 2020. a
Nakamura, Y.: A method for dynamic characteristics estimation of subsurface using microtremor on the ground surface, Railway Technical Research Institute, Quarterly Reports, 30, 1989. a, b
Nanni, U., Gimbert, F., Vincent, C., Gräff, D., Walter, F., Piard, L., and Moreau, L.: Quantification of seasonal and diurnal dynamics of subglacial channels using seismic observations on an Alpine glacier, The Cryosphere, 14, 1475–1496, https://doi.org/10.5194/tc-14-1475-2020, 2020. a
Nanni, U., Gimbert, F., Roux, P., and Lecointre, A.: Observing the subglacial hydrology network and its dynamics with a dense seismic array, P. Natl. Acad. Sci. USA, 118, e2023757118, https://doi.org/10.1073/pnas.2023757118, 2021. a
Nogoshi, M. and Igarashi, T.: On the amplitude characteristics of microtremor, Part II, Journal of the Seismological Society of Japan, 24, 26–40, 1971 (in Japanese). a
Panzera, F., Lombardo, G., Monaco, C., and Di Stefano, A.: Seismic site effects observed on sediments and basaltic lavas outcropping in a test site of Catania, Italy, Nat. Hazards, 79, 1–27, https://doi.org/10.1007/s11069-015-1822-7, 2015. a
Panzera, F., Romagnoli, G., Tortorici, G., D'Amico, S., Rizza, M., and Catalano, S.: Integrated use of ambient vibrations and geological methods for seismic microzonation, J. Appl. Geophys., 170, 103820, https://doi.org/10.1016/j.jappgeo.2019.103820, 2019. a
Peterson, J.: Observations and modeling of seismic background noise, vol. 93, US Geological Survey, Reston, VA, USA, No. 93-322, https://doi.org/10.3133/ofr93322, 1993. a
Picotti, S., Vuan, A., Carcione, J. M., Horgan, H. J., and Anandakrishnan, S.: Anisotropy and crystalline fabric of Whillans Ice Stream (West Antarctica) inferred from multicomponent seismic data, J. Geophys. Res.-Sol. Ea., 120, 4237–4262, https://doi.org/10.1002/2014JB011591, 2015. a
Picotti, S., Francese, R., Giorgi, M., Pettenati, F., and Carcione, J. M.: Estimation of glacier thicknesses and basal properties using the horizontal-to-vertical component spectral ratio (HVSR) technique from passive seismic data, J. Glaciol., 63, 229–248, https://doi.org/10.1017/jog.2016.135, 2017. a, b, c
Podolskiy, E. A. and Walter, F.: Cryoseismology, Rev. Geophys., 54, 708–758, https://doi.org/10.1002/2016RG000526, 2016. a, b, c
Poggi, V. and Fäh, D.: Estimating Rayleigh wave particle motion from three-component array analysis of ambient vibrations, Geophys. J. Int., 180, 251–267, https://doi.org/10.1111/j.1365-246X.2009.04402.x, 2010. a, b, c
Pohjola, V. A.: TV-video observations of englacial voids in Storglaciären, Sweden, J. Glaciol., 40, 231–240, 1994. a
Preiswerk, L. E. and Walter, F.: High-frequency (>2 Hz) ambient seismic noise on high-melt glaciers: Green's function estimation and source characterization, J. Geophys. Res.-Earth, 123, 1667–1681, https://doi.org/10.1029/2017JF004498, 2018. a
Preiswerk, L. E., Michel, C., Walter, F., and Fäh, D.: Effects of geometry on the seismic wavefield of Alpine glaciers, Ann. Glaciol., 60, 112–124, https://doi.org/10.1017/aog.2018.27, 2019. a
Sergeant, A., Chmiel, M., Lindner, F., Walter, F., Roux, P., Chaput, J., Gimbert, F., and Mordret, A.: On the Green's function emergence from interferometry of seismic wave fields generated in high-melt glaciers: implications for passive imaging and monitoring, The Cryosphere, 14, 1139–1171, https://doi.org/10.5194/tc-14-1139-2020, 2020. a, b
Smith, E. C., Baird, A. F., Kendall, J. M., Martín, C., White, R. S., Brisbourne, A. M., and Smith, A. M.: Ice fabric in an Antarctic ice stream interpreted from seismic anisotropy, Geophys. Res. Lett., 44, 3710–3718, https://doi.org/10.1002/2016GL072093, 2017. a
Snieder, R.: Extracting the Green's function from the correlation of coda waves: a derivation based on stationary phase, Phys. Rev. E, 69, 046610, https://doi.org/10.1103/PhysRevE.69.046610, 2004. a
Tsai, N.: A note on the steady-state response of an elastic half-space, B. Seismol. Soc. Am., 60, 795–808, 1970. a
Turcotte, D. L. and Schubert, G.: Geodynamics, Cambridge University Press, ISBN 9780511807442, https://doi.org/10.1017/CBO9780511807442, 2002. a
van Ginkel, J., Ruigrok, E., and Herber, R.: Using horizontal-to-vertical spectral ratios to construct shear-wave velocity profiles, Solid Earth, 11, 2015–2030, https://doi.org/10.5194/se-11-2015-2020, 2020. a, b
van Ginkel, J., Ruigrok, E., Stafleu, J., and Herber, R.: Development of a seismic site-response zonation map for the Netherlands, Nat. Hazards Earth Syst. Sci., 22, 41–63, https://doi.org/10.5194/nhess-22-41-2022, 2022. a
Walter, F., Deichmann, N., and Funk, M.: Basal icequakes during changing subglacial water pressures beneath Gornergletscher, Switzerland, J. Glaciol., 54, 511–521, https://doi.org/10.3189/002214308785837110, 2008. a
Walter, F., Roux, P., Roeoesli, C., Lecointre, A., Kilb, D., and Roux, P.-F.: Using glacier seismicity for phase velocity measurements and Green's function retrieval, Geophys. J. Int., 201, 1722–1737, https://doi.org/10.1093/gji/ggv069, 2015. a
Wapenaar, K., Draganov, D., Snieder, R., Campman, X., and Verdel, A.: Tutorial on seismic interferometry: Part 1 – Basic principles and applications, Geophysics, 75, 75A195–75A209, https://doi.org/10.1190/1.3457445, 2010. a
Wathelet, M., Chatelain, J.-L., Cornou, C., Giulio, G. D., Guillier, B., Ohrnberger, M., and Savvaidis, A.: Geopsy: a user-friendly open-source tool set for ambient vibration processing, Seismol. Res. Lett., 91, 1878–1889, https://doi.org/10.1785/0220190360, 2020. a
Wittlinger, G. and Farra, V.: Evidence of unfrozen liquids and seismic anisotropy at the base of the polar ice sheets, Polar Sci., 9, 66–79, https://doi.org/10.1016/j.polar.2014.07.006, 2015. a
Yan, P., Li, Z., Li, F., Yang, Y., Hao, W., and Bao, F.: Antarctic ice sheet thickness estimation using the horizontal-to-vertical spectral ratio method with single-station seismic ambient noise, The Cryosphere, 12, 795–810, https://doi.org/10.5194/tc-12-795-2018, 2018. a
Zhan, Z.: Seismic Noise Interferometry Reveals Transverse Drainage Configuration Beneath the Surging Bering Glacier, Geophys. Res. Lett., 46, 4747–4756, https://doi.org/10.1029/2019GL082411, 2019. a, b, c
Swiss Seismological Service (SED): Temporary deployments in Switzerland associated with glacier monitoring, ETH Zurich [data set] https://doi.org/10.12686/SED/NETWORKS/4D, 1985. a
- Abstract
- Introduction
- Setting and data
- HVSR analysis
- Seismic interferometry
- Ice–bedrock velocity model
- Discussion
- Conclusions
- Appendix A: MFP and dispersion curves
- Appendix B: HVSR profile and meteorological parameters
- Appendix C: Resonance mode analysis
- Data availability
- Author contributions
- Competing interests
- Disclaimer
- Acknowledgements
- Financial support
- Review statement
- References


