the Creative Commons Attribution 4.0 License.
the Creative Commons Attribution 4.0 License.
 | 26 Mar 2025
Inland migration of near-surface crevasses in the Amundsen Sea Sector, West Antarctica
Andrew O. Hoffman
Knut Christianson
Ching-Yao Lai
Ian Joughin
Nicholas Holschuh
Elizabeth Case
Jonathan Kingslake
Since distributed satellite observations of elevation change and velocity became available in the 1990s, Thwaites, Pine Island, Haynes, Pope and Kohler glaciers, located in Antarctica's Amundsen Sea Sector, have thinned and accelerated in response to ocean-induced melting and grounding-line retreat. We develop a crevasse image segmentation algorithm to identify and map surface crevasses on the grounded portions of these glaciers between 2015 and 2022 using Sentinel-1A satellite synthetic aperture radar (SAR) imagery. We also advance a geometric model for firn tensile strength dependent on porosity and the tensile strength of ice. On Pine Island and Thwaites glaciers, which have both accelerated since 2015, crevassing has expanded tens of kilometers upstream of the 2015 extent. From the crevasse time series, we find that crevassing is strongly linked to principal surface stresses and consistent with von Mises fracture theory predictions. Our geometric model, analysis of SAR and optical imagery, and ice-penetrating radar data suggest that these crevasses are near-surface features restricted to the firn. The porosity dependence of the near-surface tensile strength of the ice sheet may explain discrepancies between the tensile strength inferred from remotely sensed surface crevasse observations and tensile strength measured in laboratory experiments, which often focus on ice (rather than firn) fracture. The near-surface nature of these features suggests that the expansion of crevasses inland has a limited direct impact on glacier mechanics.
- Article
(13967 KB) - Full-text XML
-
Supplement
(104232 KB) - BibTeX
- EndNote


Crevasses, common to almost all glaciers, are the result of macroscopic material failure due to the progressive accumulation of micro-cracks and voids in glacier ice (Schulson et al., 1989; Vaughan, 1993; Veen, 1999; Colgan et al., 2016). These cracks and inclusions can affect glacier mechanics by promoting iceberg calving (Berg and Bassis, 2022), changing the bulk density and viscosity of glaciers (Meier et al., 1994), and efficiently routing water to the englacial and subglacial hydrology systems (Chudley et al., 2021). Despite the connection to englacial stress and water storage and the implications for ice-sheet mass balance, the physical properties of ice that control the mechanics of fracture remain poorly constrained across the Greenland and Antarctic ice sheets (e.g., Bassis and Walker, 2012; Ultee and Bassis, 2016; Alley et al., 2023). As a result, ice fracture has been suggested as one of the larger sources of uncertainty in projections of future ice-sheet mass loss in the next century (Alley et al., 2023). Despite new observations of ice-shelf crevasses and ice-shelf crevasse density change (Izeboud and Lhermitte, 2023; Surawy-Stepney et al., 2023a, b), no study has yet produced a comprehensive time series of crevasse area change on grounded ice or assessed the potential impact or connection of surface crevasses in these regions on theoretical fracture-based retreat instabilities (i.e., DeConto and Pollard, 2016).
Crevasses typically form near the floating margins of ice sheets where horizontal strain rates are high (Lai et al., 2020). Here, simple empirical relationships between iceberg calving rate and horizontal ice divergence suggest a strong relationship between tensile strain rates and full-thickness crevasse penetration (Alley et al., 2008). These observations agree with laboratory experiments that measure the strain response of ice under different applied tensile stresses to determine the critical tensile strength, the critical tensile stress beyond which ice fractures.
In laboratory experiments, the tensile strength of ice depends strongly on ice temperature. For temperatures common in Earth's ice sheets, ice fails when effective stresses exceed a threshold between 1 and 3 MPa (Haynes, 1979). Similar experiments conducted on loose snow to understand the failure behavior of avalanche slabs have found that snow crystal lattices fail under significantly lower stresses (as low as ∼10 kPa; McClung, 1978). Tensile strengths inferred from satellite observations of strain rates where crevasses have been manually identified lie between these experimental results on ice and snow, typically between 100–200 kPa (Vaughan, 1993). Together, these satellite and laboratory observations suggest a complicated and multivariate relationship between tensile strength and independent variables, such as density, temperature and grain size. Understanding the material strength of ice and its dependencies is important to accurately simulate fracture behavior that may change with the englacial stresses of the ice sheet as terminus conditions evolve under future climate forcing.
When surface meltwater fills surface crevasses, the additional hydrostatic pressure of the water can cause the crevasses to penetrate deeper through a process known as hydrofracture (Nye and Perutz, 1957; Banwell et al., 2013). Over the last 3 decades, surface melting has intensified in both Antarctica and Greenland, with longer melt seasons extending further poleward (Cook and Vaughan, 2010). Some models predict that warming will increase meltwater-driven hydrofracture in the Amundsen Sea Embayment (ASE) leading to ice-shelf breakup (via the hydrofracture mechanism) and the formation of ice cliffs that collapse when the newly unbuttressed ice cliff exceeds a critical height. Together, these two processes promote rapid grounding-line retreat, termed the marine ice-cliff instability (MICI) hypothesis (DeConto and Pollard, 2016). The MICI hypothesis predicts that, if progressive failure exposes increasingly taller terminus cliffs, this could initiate runaway collapse. Because the ice sheet in the ASE sits on a glacier bed that deepens into the interior, terminal retreat by fracture could promote taller cliffs and runaway retreat (DeConto and Pollard, 2016). Follow-on work has shown that the elastic response of the ice cliff (Clerc et al., 2019) and the effects of melange buttressing (Schlemm et al., 2022) impact the rate of retreat, likely preventing unstable MICI retreat altogether (Needell and Holschuh, 2023). Reduced model experiments (Clerc et al., 2019) and three-dimensional discrete-particle modeling have also shown that the mechanics of the MICI depend critically on the tensile strength of ice (Crawford et al., 2021), estimates of which, as noted above, disagree significantly between satellite observations and laboratory experiments. To date, observed changes in surface crevasse appearance remain disconnected from an assessment of ASE glacier vulnerability and predictions of outlet glacier response.
In this paper, we seek to use the presence and extent of crevassing in the ASE, understood through the lens of fracture mechanics, to estimate the material strength of ice in regions where we observe fracture. In the process, we reexamine how to interpret these features. Specifically, we use the extent and depth of these features to speculate whether they are a useful proxy for damaged ice, as has been interpreted in previous studies (i.e., Surawy-Stepney et al., 2023a).
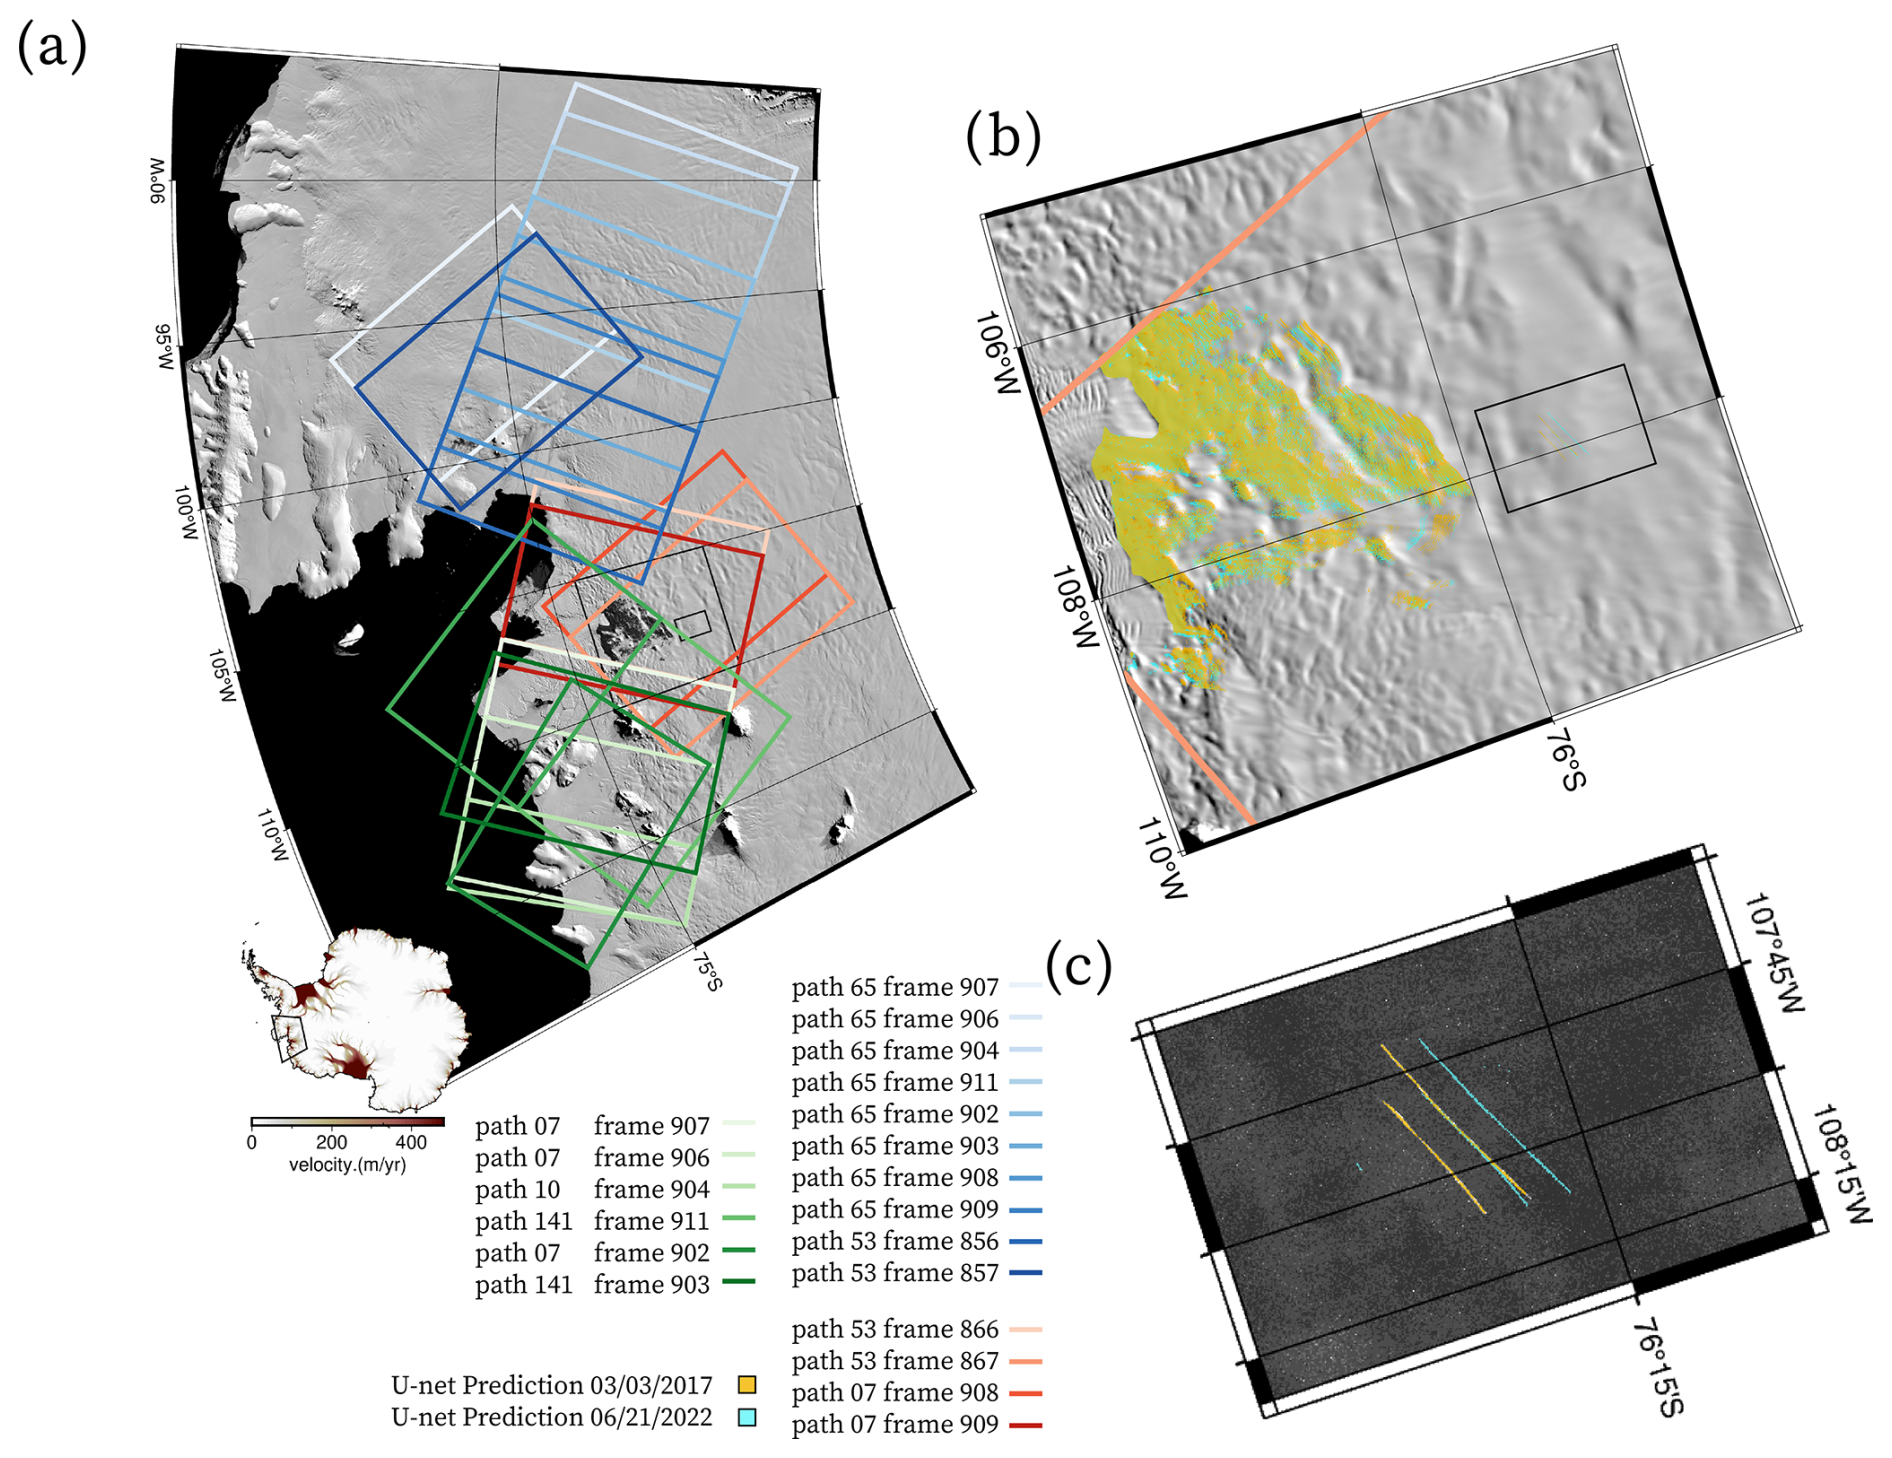
Figure 1(a) Overview of Sentinel-1A scenes of Amundsen Sea glaciers used to create inland crevasse area time series for the grounded regions of Pine Island (blue), Thwaites (blue, orange), and glaciers feeding the Dotson and Crosson ice shelves (green and red). Black boxes mark areas of paneled images in (b) and (c). (b) An example of the map of crevasses predicted by the U-net from March 2017 (cyan) and June 2022 (orange). Note that the density of crevasses appears to be concentrated on the stoss side of ridges that are captured in the background MODIS image (Haran et al., 2018). The neural network also skillfully detects (c) isolated crevasse features in low-strain environments.
To map crevasse locations and determine rates of crevasse area change, we extend deep learning neural network frameworks (i.e., Ronneberger et al., 2015; Akeret et al., 2017; Lai et al., 2020) to satellite synthetic aperture radar (SAR) imagery collected by the Sentinel-1 constellation from 2015–2022. Our results provide an alternative model framework to other published deep learning approaches (Surawy-Stepney et al., 2023a, b). Using WorldView optical imagery and ultra-wideband ultra-high-frequency radar data, we verify the features we identify with our neural network and construct a time series of crevasse location and area change from 2015–2022 across the ASE. We use this time series of crevasse locations with surface velocity data to test a phenomenological relationship between surface stress and crevasse formation: namely that crevasses are present when the surface stresses exceed the material tensile strength (Nye, 1959; Vaughan, 1993; Grinsted et al., 2024, and citations therein). We then adapt a simple geometric model for the tensile strength of polar firn to aid the interpretation of our observations (Jelitto and Schneider, 2018). Together, our observations and modeling suggest that the presence of surface crevasses in the Amundsen Sea is restricted to the near-surface porous firn layer, which has a tensile strength that is substantially lower than the tensile strength of non-porous ice measured in laboratory experiments. We finish by exploring the implications of near-surface crevassing for marine ice-sheet vulnerability and estimates of mass balance in the ASE.
Our investigation comprises four steps. First, we preprocess SAR images and use manually identified crevasse datasets to train the neural network. We then apply the network to a set of Sentinel-1A images that includes all crevassed areas in the ASE. We then use surface crevasses visible in contemporaneous optical imagery and ice-penetrating radar data to independently verify the segmentation algorithm and constrain the depth of the crevasse features. Finally, we use crevasse locations with satellite observations of surface strain rates to develop a relationship between the effective stress of the ice-sheet surface and the opening of surface crevasses.
2.1 Sentinel SAR imagery processing and analysis
2.1.1 Imagery selection and processing
Crevasses can be difficult to detect in optical imagery due to snow bridges. Near-surface crevasses covered by snow bridges can, however, be mapped remotely using active microwave synthetic aperture radar (Marsh et al., 2021). Compared to optical imagery, SAR imagery is advantageous because it can provide regular observations through clouds, image features during the polar night, and penetrate through snow and firn (∼10 m for C-band SAR in polar firn; Rignot et al., 2001). In this study, we use synthetic aperture radar data collected as part of the European Space Agency's Sentinel-1 missions.
Sentinel-1A and Sentinel-1B Level-1 Ground Range Detected SAR, interferometric, wide-swath, high-resolution, amplitude images (∼5 m × 20 m native resolution, HH polarization) were selected from 2015 to 2022 using the Alaska Satellite Facility Vertex search tool (ASF DAAC, 2014–2022). Images were chosen geographically to capture areas that contained the approximate inland crevasse extent between 2015 and 2022. We processed imagery for the entire Sentinel subset, but our time-series analysis focuses on 2016 to 2022 due to changes in scene geometry during the satellite commissioning stage and a melt event in 2015 that substantially affected radiometric backscatter amplitude (Ghiz et al., 2021). For geometric consistency, solely Sentinel-1A frames were used (see Fig. 1). Sentinel SAR data are available with a repeat time of 12 d; shifts in the acquisition plan can, however, result in less frequent acquisitions for an individual frame. Images with HH polarization were selected because they appear to have the advantage of higher backscatter amplitude than VV polarization, which reduces random noise in preprocessed images (Marsh et al., 2021). Images in both ascending and descending orbits were used to assess possible differences in detectability based on satellite image look angle and crevasse orientation.
Image processing was conducted using the European Space Agency (ESA) Sentinel Application Platform (SNAP) toolbox (SNAP, 2022). First, orbit state vectors in the gridded product metadata were updated using precise orbit files supplied by the ESA Global Navigation Satellite System Hub. Several radiometric processing steps were then applied, including removal of antenna thermal noise, border noise removal which masks null pixels introduced in the creation of the ground-range-detected products, speckle filtering and radiometric calibration to a backscatter coefficient using look-up tables that apply a range-dependent gain including an absolute calibration constant. We applied an ellipsoid correction geolocation-grid operator to convert each image to an orthorectified polar stereographic projection (EPSG:3031) using Sentinel ground-control tie points. Orthorectified images were then resampled to 25 m resolution using a nearest-neighbor interpolation to preserve sharp features. Following radiometric calibration and orthorectification, backscatter coefficients (0 to 1) were converted to unsigned 8-bit integers (0 to 255) and exported as GeoTIFF files (Fig. S1 in the Supplement).
2.1.2 Neural network architecture
Preprocessed Sentinel images were then used to train a U-net image segmentation algorithm (Ronneberger et al., 2015; Akeret et al., 2017; Lai et al., 2020, Fig. S2). The U-net architecture extends the conventional convolutional neural network (CNN) framework by adding expansive operations (upsampling layers) to the contracting operations (downsampling layers) to identify and localize features in an image. The downsampling path followed by the upsampling path resembles a “U” shape and gives the network its name.
2.1.3 Neural network training
Training data consist of pairs of images and binary classifications for crevassed and crevasse-free regions. Training data were generated using image masking software written for this purpose as part of this study. The masks were generated by first using a backscatter reflection coefficient threshold to define an initial binary classification – brighter reflections are often associated with crevasses. This binary classification was then refined by manually selecting crevasses that were too dim to be identified by the threshold and deselecting false-positive features. The image training dataset includes images from only grounded ice areas of ASE glaciers because we found basal crevasses can complicate feature segmentation over ice shelves. These training scenes span the entire time series to capture seasonal and interannual changes in the surface reflectivity potentially induced by melting and snow metamorphism. The training dataset was augmented by rotating and flipping each image and ground truth mask to produce over 1000 training images from binary classifications of 144 images.
We train the network using these refined binary classification images of crevasses. We implement the U-net segmentation algorithm using the Python package TensorFlow (Abadi et al., 2015) with training data from Thwaites, Pine Island, Haynes, Pope and Kohler glaciers. The size of raw Sentinel-1A images ( pixels; >500 MB) is too large to segment at the native image resolution. We, therefore, divide each image into 500×500 pixel patches and run the U-net algorithm on each patch individually using a sliding window with an offset equal to the output layer image (460 pixels in both dimensions). We tested a variety of optimizers and found the Adam optimizer maximized the area under the curve (AUC) of the receiver operating characteristic (ROC) that we used as the evaluation metric for model selection. The AUC metric measures the ability of a binary classifier to distinguish between classes and is used as a summary statistic of the ROC curve. The output of the U-net model is a 460×460 pixel image of the likelihood (ranging from 0 to 1) that a pixel contains part of a fracture. We then used the F1 score, which assesses the predictive skill of a model by elaborating on its class-wise performance to choose a threshold for binary classification (model prediction probability greater than 0.8 maximized the F1 score). Given the resampled image resolution is 25 m × 25 m, this method can only capture features that are greater than or equal to 1 pixel in size.
2.1.4 Neural network application
We apply the trained network on more than 300 Sentinel-1A SAR images from 20 scenes (Fig. 1a) that were selected for their comprehensive spatial and temporal coverage of lower Thwaites Glacier; Pine Island Glacier; and Haynes, Smith, Pope and Kohler glaciers that feed the Dotson and Crosson ice shelves. Each scene is divided into 500 × 500 pixel patches using the same division scheme implemented for the training data. These images were then combined by merging the images using the maximum value of the pixels within the shared windows. Because translational equivariance is not preserved in CNNs, clipping schemes are necessary to accurately stitch patches of the segmented image back together. We evaluate a variety of padding schemes and find that padding each segmented layer by 20 pixels reduces the error most in the final image relative to hand-drawn masks.
In agreement with the findings of Marsh et al. (2021), crevasses manifest differently in Sentinel imagery as a function of satellite look angle, the slope of the surface and crevasse orientation relative to the satellite track (Fig. 3). In descending scenes over Thwaites and Pine Island glaciers, the left column in Fig. 3, crevasses that fracture along the grid north–south axis appear highly reflective, while in the ascending scenes (the middle column of Fig. 3), crevasses that are oriented in the grid east–west direction return the most energy. Segmented crevasse features from single scenes are still meaningful when compared to scenes from the same path and frame, but analysis of a single frame may systematically miss features that are not visible because of the crevasse orientation relative to the sensor look angle. This complicates efforts to compare the segmented crevasses with surface strain rates. To mitigate bias introduced by the effects of satellite look angle, we combine ascending and descending scenes shot within 30 d of one another and create merged predictions that capture multiple look angles. Image merging was done using the maximum of the union of predictions from individual paths and frames.
2.1.5 Validating the network and image filtering
The network was applied to the complete time series and used to calculate the area of the crevassed ice-sheet surface using a 3-month rolling median filter and a threshold of 10 km2 to define outliers to be excluded from the time series. These outliers typically overestimated crevasse area, likely due to surface melting or surface temperature anomalies that temporarily increase the surface backscatter (Joughin et al., 2016). Because C-band SAR imagery penetrates up to several meters into the subsurface (Rignot et al., 2001), it is difficult to determine whether the crevasse void starts at or below the surface from SAR imagery alone.
To better determine the connection of the features we identify in SAR imagery to the surface appearance and subsurface geometry of crevasses, we use complementary high-resolution optical imagery (WorldView) and ice-penetrating radar data collected as part of Operation IceBridge (OIB) and the International Thwaites Glacier Collaboration (ITGC) aerogeophysical surveys (Fig. 4). WorldView high-resolution optical imagery does not penetrate into the subsurface and thus presents an unambiguous image of the crevasse surface geometry. The geometry of crevasses in the subsurface was interpreted using ice-penetrating radar data (i.e., Nath and Vaughan, 2003; Williams et al., 2014). Interpretations of crevasse geometry in ice-penetrating radar data are complicated by the dependence of the return on the orientation of the radar profile relative to the geometry of the crevasse and the generally complex shape of the crevasse itself. The ultra-high-frequency ultra-wideband (600–900 MHz) radar system flown as part of OIB and ITGC surveys is able to image englacial structures through a kilometer of ice with a vertical (Rayleigh) resolution that captures changes in conductivity due to density contrasts in the near surface on the scale of less than 1 m. The four-element antennas transmit a 400 W pulse into the surface that is then recorded using a 12-bit analog-to-digital converter (Karidi, 2018). The trace spacing for this instrument is large compared to the trace spacing of ground-based impulse radar surveys that have historically been used to map subsurface crevasses, but a trace posting of 2.7 m should be sufficient to map crevasses.
2.2 Stress analysis from velocity data
Crevasse occurrence can be related to surface velocity and strain rates using the constitutive relations for snow and ice and assuming that crevasses form if surface stresses exceed a failure criterion. The most common formulation for fracture nucleation and tensile failure is the von Mises (octahedral) failure criterion. This criterion assumes that the material can only support an octahedral shear stress that is less than the tensile strength of ice (σt) and can be formulated as (Vaughan, 1993)
where σe can be interpreted as the effective stress and σ1surf and σ2surf are the principal surface stresses parallel to the ice surface. Because the top boundary of an ice sheet or glacier is a free surface, normal stress and traction are zero at this boundary, and thus one of the three principal stresses must be normal to the surface and have a magnitude equal to zero (Vaughan, 1993; Veen, 1999). The other two principal stresses are parallel to the surface. We combine our new crevasse location time series with satellite SAR observations of ice velocity from the same satellite constellation (Sentinel-1A and Sentinel-1B) to compare crevasse locations with those consistent with the von Mises failure criterion.
Following previous work (Nye, 1959; Bindschadler et al., 1996; Veen, 1999; Alley et al., 2018), we first calculate the principal surface stresses from the ice-velocity time series (see Sect. S2). We then extracted the surface stresses at crevasse locations identified by the CNN from quarterly velocity measurements between 2015 and 2022. Then, following Vaughan (1993), we used quarterly principal surface stresses at the location of crevasses to construct failure envelopes and estimate the tensile strength associated with crevasse formation (see Sect. S2).
2.3 A simple geometric model for the fracture properties of firn
Physical models that unify the observations and behavior of near-surface fracture with fracture propagation deeper in the ice column are important to accurately represent the effects of damage on the effective viscosity of the ice sheet from the assimilation of the growing observations of crevasse position and crevasse area change (Surawy-Stepney et al., 2023a, b). Models that describe the effects of porosity on fracture toughness and tensile strength were first developed for metals, ceramics, polymer foams and sponges (Ashby and Medalist, 1983; Maiti et al., 1984; Gibson and Ashby, 1999). Though the fracture toughness of freshwater ice decreases with increasing porosity (Rist et al., 1999, 2002), this relationship remains disconnected from simulated ice-sheet mechanics, which do not typically represent firn processes. Here, we advance a simple geometric model for the tensile strength of firn to better understand the apparent disagreement between controlled laboratory experiments of ice fracture and remote-sensing observations of near-surface crevasse location and strain used to derive tensile strengths from satellite observations.
Here we build on the work of, e.g., Jelitto and Schneider (2018), who establish a geometric framework for modeling fracture properties in ceramics and metals. We use the same geometric arguments to advance a simple conceptual model for firn pore space and develop a description for the tensile strength of densifying firn (σf) from the tensile strength of ice (σI) and firn porosity (P). We start by assuming a closed idealized lattice of firn with wall thickness (t) and unit cell width (w), illustrated in Fig. 2. Within this lattice, we can define the dimensionless ratio of pore space to wall thickness , where . The porosity can be related to the volumetric fraction of the firn lattice divided by the volume of the characteristic unit cell (w3) and described in terms of the dimensionless ratio of pore space as
As in Jelitto and Schneider (2018), we assume the tensile strength of the lattice is reduced by a factor that is proportional to the reduced crack-face surface area (Fig. 2b) relative to a completely closed lattice (i.e., a lattice representing pure ice). The crack face is a two-dimensional feature of the lattice that represents the face bisecting the lattice volume that maximizes the area of void space. From the geometry illustrated in Fig. 2, the tensile strength of firn as a function of the dimensionless ratio of pore space can be described by
The idealized relationship between the dimensionless pore space fraction and tensile strength holds in the absence of pore connections where the density of the firn is very near the density of ice at the depths exceeding the bubble close-off depth, where firn air trapped in pores can no longer exchange with surrounding voids. To account for pore space connections within the lattice at lower densities where grains have not yet sintered, we define the relative fraction of pore connections (X), which we also assume is proportional to the reduced strength across the crack face, as
Solving for the dimensionless ratio of the pore space as a function of porosity from Eq. (3), we find
and thus
Finally, we must determine the relationship between the relative fraction of pore space connections and firn porosity, i.e., X=f(P). We assume that the disconnections can be related to porosity by , and the tensile strength can be formulated from the geometry of the crack face as
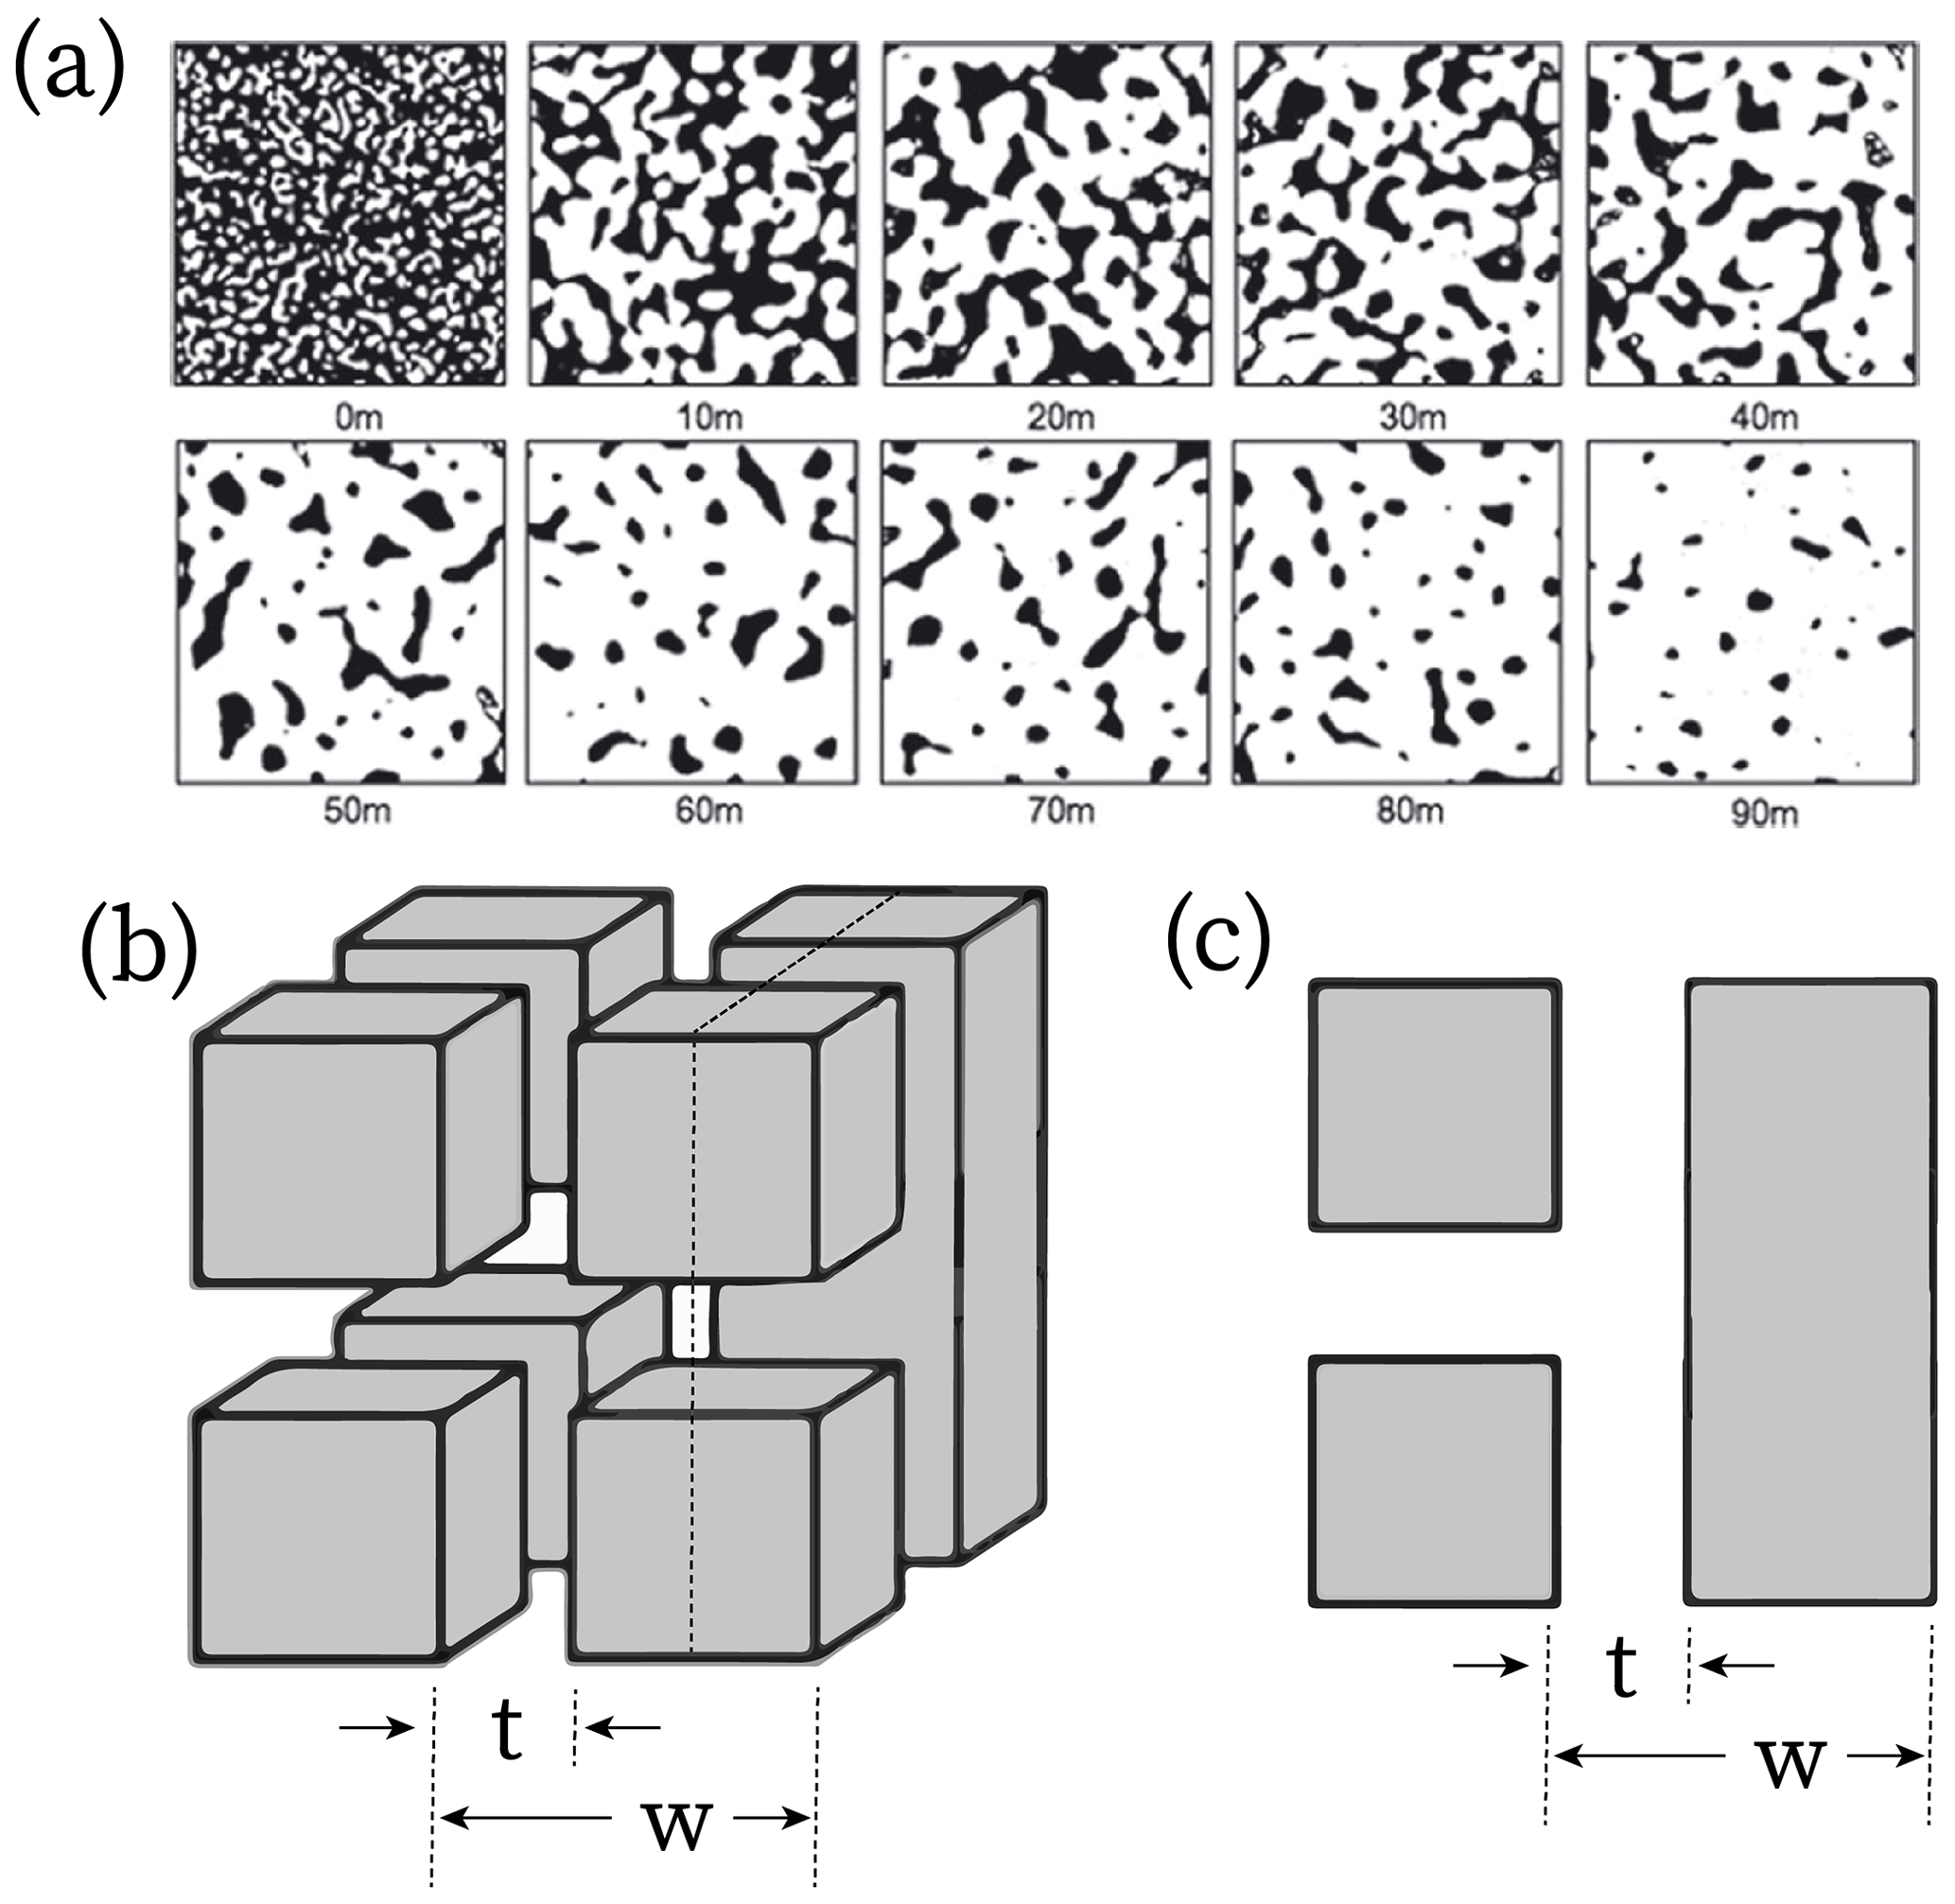
Figure 2Micro-CT scan of firn structure revealing the effect of compressed pore space (black) within the firn unit cell (a) shown with the conceptual geometric model of the firn (b) and the crack face used to derive the relationship between tensile strength and porosity (c). The scan was first presented by Lomonaco et al. (2011) using firn cores collected from Summit, Greenland.
Our presentation of results begins by examining individual crevasses and confirming their presence in independent optical imagery and radar datasets. We then discuss changes in crevasse patterns across the ASE in the context of other glaciological and oceanographic changes observed over the last 10 years, as well as the relationship between porosity and tensile strength of firn.
3.1 Verifying crevasse feature extent and constraining vertical depth with optical and ice-penetrating radar imagery
A comparison of crevasse detections from the SAR data with high-resolution optical imagery and ice-penetrating radar data strongly supports our interpretation that the detected features are crevasses. These datasets interpreted together also reveal that crevasses detected with SAR data are commonly buried so that there is little or no surface expression in optical imagery. Optical imagery and ground-penetrating imagery also reveal that the pixel resolution of crevassing in SAR imagery resampled to 25 m2 is not directly related to the size of the detected crevasses. Since the radar imagery is sensitive to reflections off crevasse sidewalls, a pixel may be very bright if it images a reflection from a sidewall in a favorable geometry even though the crevasse itself is much smaller than the area represented by the pixel (Marsh et al., 2021). Narrow-width crevasses with sidewalls orthogonal to the incident radar wave may appear as bright reflections even if the crevasse width is small. Using the data presented here, we cannot clearly relate the crevasses in SAR imagery directly to their true geometric size, and we therefore restrict interpretations of crevasse appearance to changes in crevassed area in the same Sentinel-1A image scene.
3.1.1 Crevasse appearance in optical imagery
Near the inland onset of crevassing (Fig. 4b), WorldView imagery often directly captures clear crevasses or surface features indicative of crevassing (Fig. 4b), such as regular “swells” likely associated with snow bridges (Figs. S3, S4). These features are consistent with features that are also imaged in SAR imagery and ice-penetrating radar data (see Sect. 3.1.2). In some areas downstream of crevasse onsets, there is extensive crevassing indicated in SAR imagery, but there is no surface expression or ambiguous expression of the crevasses in contemporaneous, co-located WorldView images (i.e., Figs. 4b, S5c). This suggests that these crevasses are subsurface features – crevasses that have either been buried by accumulation following formation or initially formed below the surface. Examination of spatially coincident ice-penetrating radar profiles confirms that these are subsurface features (Fig. 4e; see Sect. 3.1.2). This indicates that SAR imagery reveals subsurface crevasses reliably, including occasional near-surface crevasses (<10 m depth).
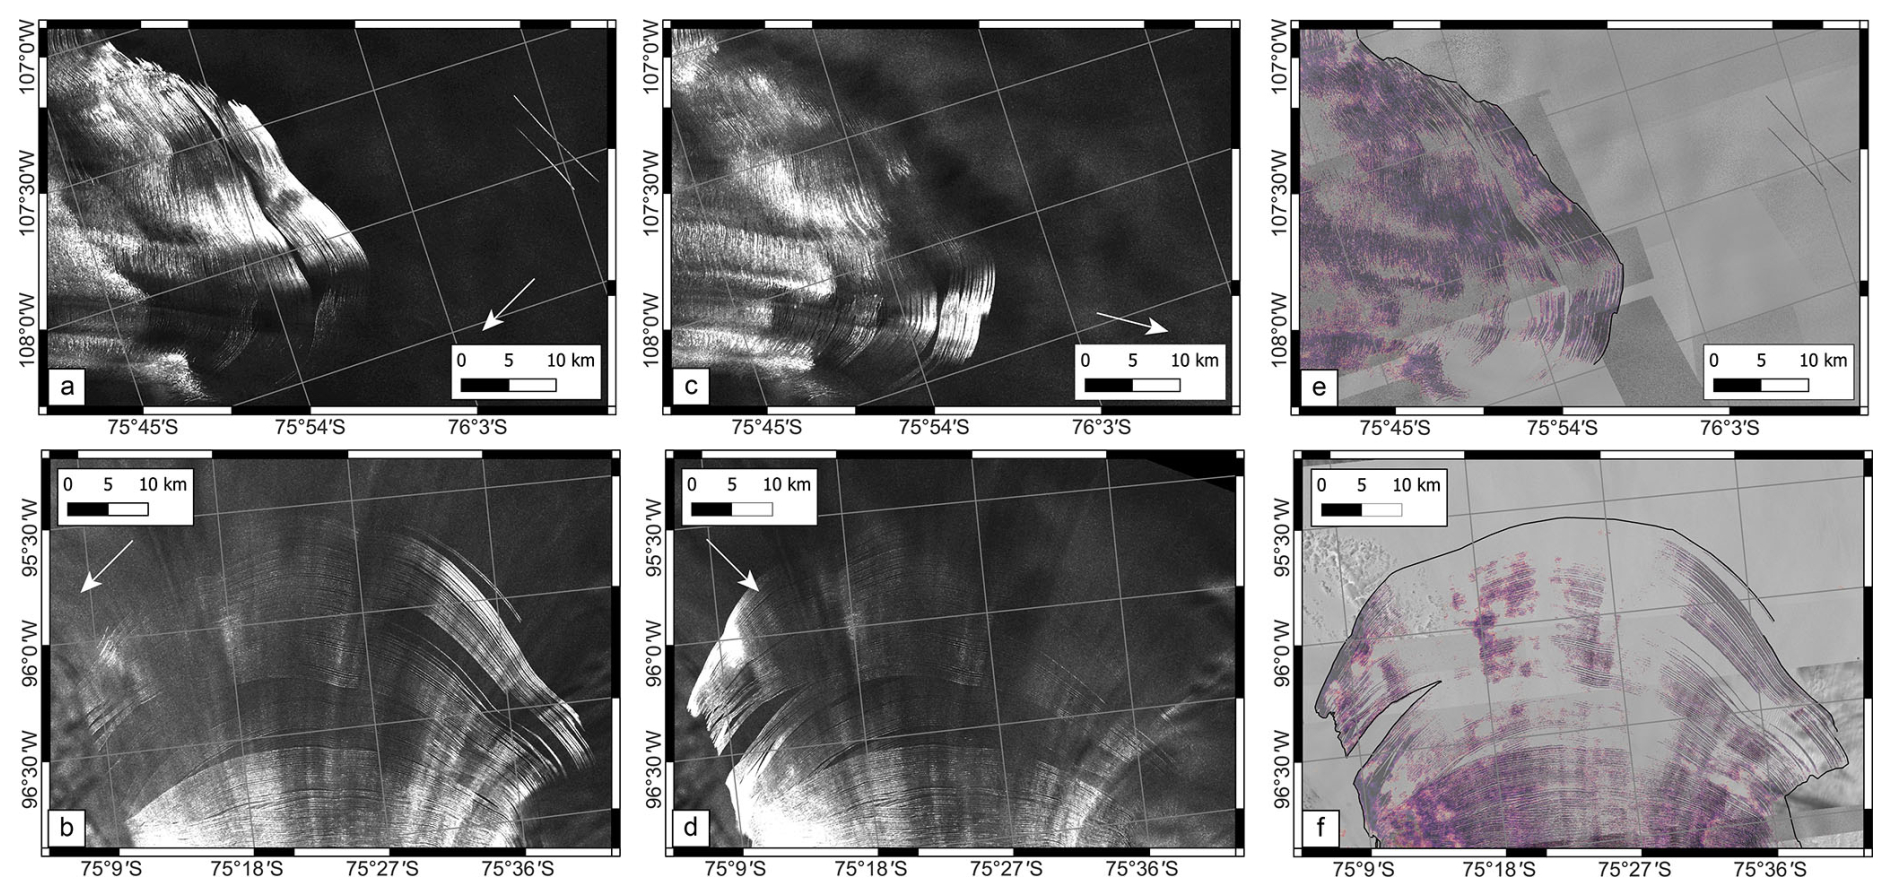
Figure 3Crevasse appearance in ascending (a, b) and descending (c, d) orbits of Sentinel-1A satellite imagery for interior regions of Thwaites and Pine Island glaciers. Arrows indicate satellite look direction. Also shown is a mosaic of WorldView images (e, f) for the same coverage of Thwaites Glacier and Pine Island Glacier, revealing that many of the crevasses that are readily visible in Sentinel imagery are buried beneath snow bridges that obscure the features in panchromatic optical imagery.
3.1.2 Crevasse appearance in ice-penetrating radar
There are several commonly observed features recorded in the ultra-wideband ultra-high-frequency ice-penetrating radar data that have conventionally been associated with crevasses (Nath and Vaughan, 2003; Williams et al., 2014). Where there is a clear firn–void-space contrast, we see bright reflections from the top of buried crevasses in ice-penetrating radar data (Fig. 5). These reflections appear as hyperbolic scatterers due to apparent diffraction where the snow bridges reconnect with the continuous firn. When the transmitter is above the crevasse, transmitted wave energy appears to be critically refracted along the crevasse wall so that little energy is reflected back to the receiver. This results in an apparent low-amplitude “shadow” beneath the crevasse void space in the radargram. In the case of basal crevasses observed over the floating ice shelf, there are reflections from the top of the crevasse, where there is an ice–seawater interface. Schematics of the radar wave ray paths and examples of the resulting radargrams that illustrate these characteristic descriptions are shown in Figs. 4, 5 and S5–S7.
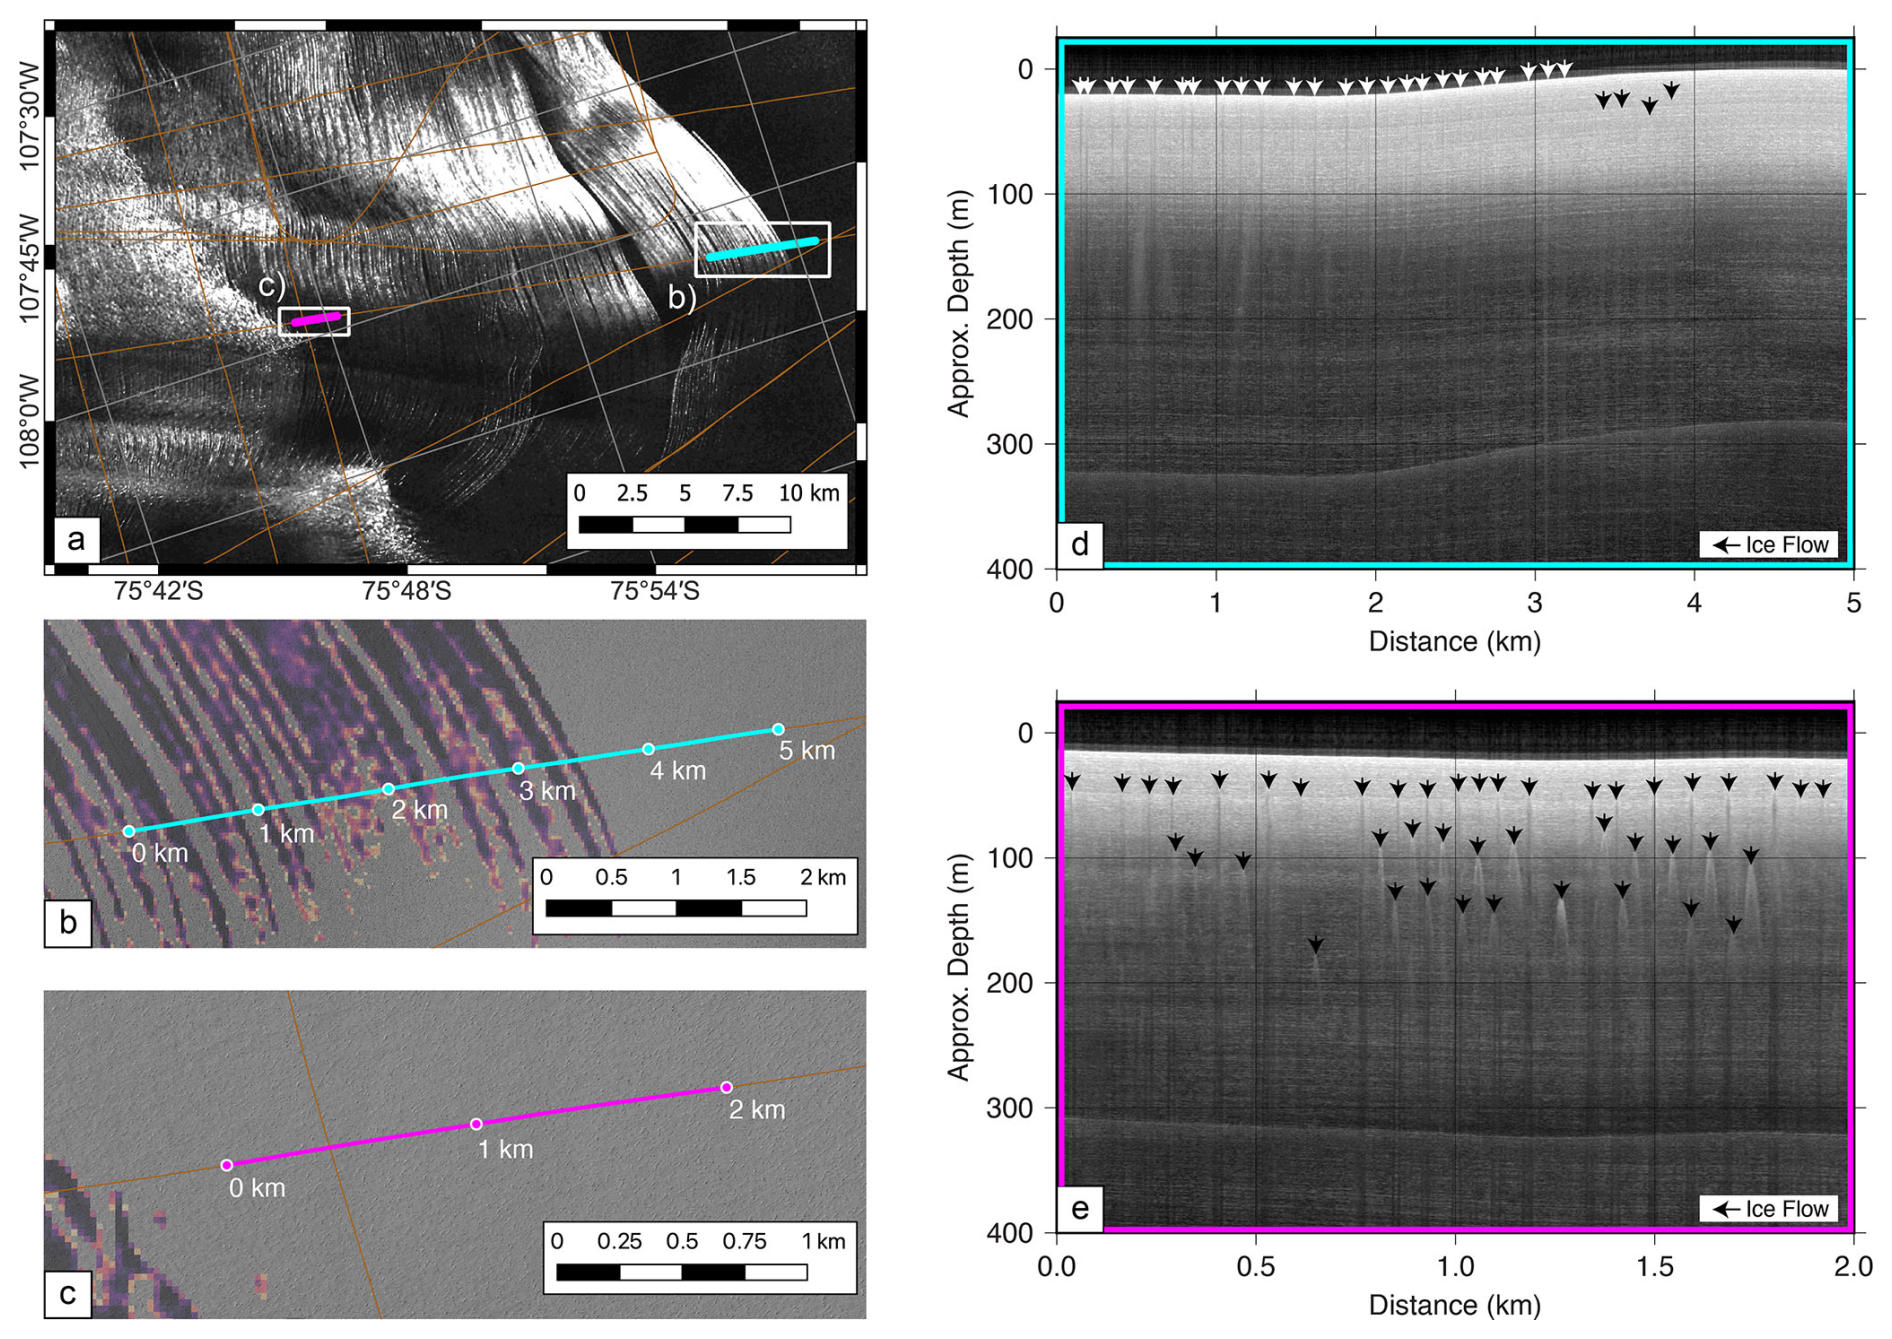
Figure 4(a) SAR backscatter intensity image with flight lines of ice-penetrating radar that cross the (b) onset of surface crevassing detected in U-net (red) with panchromatic optical imagery and (c) buried U-net-detected crevasses (red) downstream shown with panchromatic optical imagery. Buried crevasses are visible in near-surface radar profiles (d, e). Panels (d) and (e) correspond to radar profiles along flight lines shown in (b) and (c), respectively. White arrows indicate crevasses that are expressed at the surface, while black arrows indicate subsurface crevasses with hyperbolic diffractors. The vertical position of the black arrows indicates the depth at which crevasses first appear in radar data relative to the surface. The strong reflection at ∼300 m is the surface multiple.
The agreement between crevasses identified in SAR imagery and crevasses visible in the ice-penetrating radar and high-resolution visible imagery gives high confidence that the near-surface crevasses we detect in SAR imagery are robustly identified by the neural network. Observations of the three-dimensional structure revealed in the SAR and ice-penetrating radar data have ramifications for the interpretation of ice tensile strength and the influence of crevassing on ice-sheet structure, which is discussed later in Sect. 3.2 and 3.3. We next evaluate changes in the crevasse area recorded in the SAR imagery time series and their implications for understanding the material properties and fracture mechanics of firn and ice.
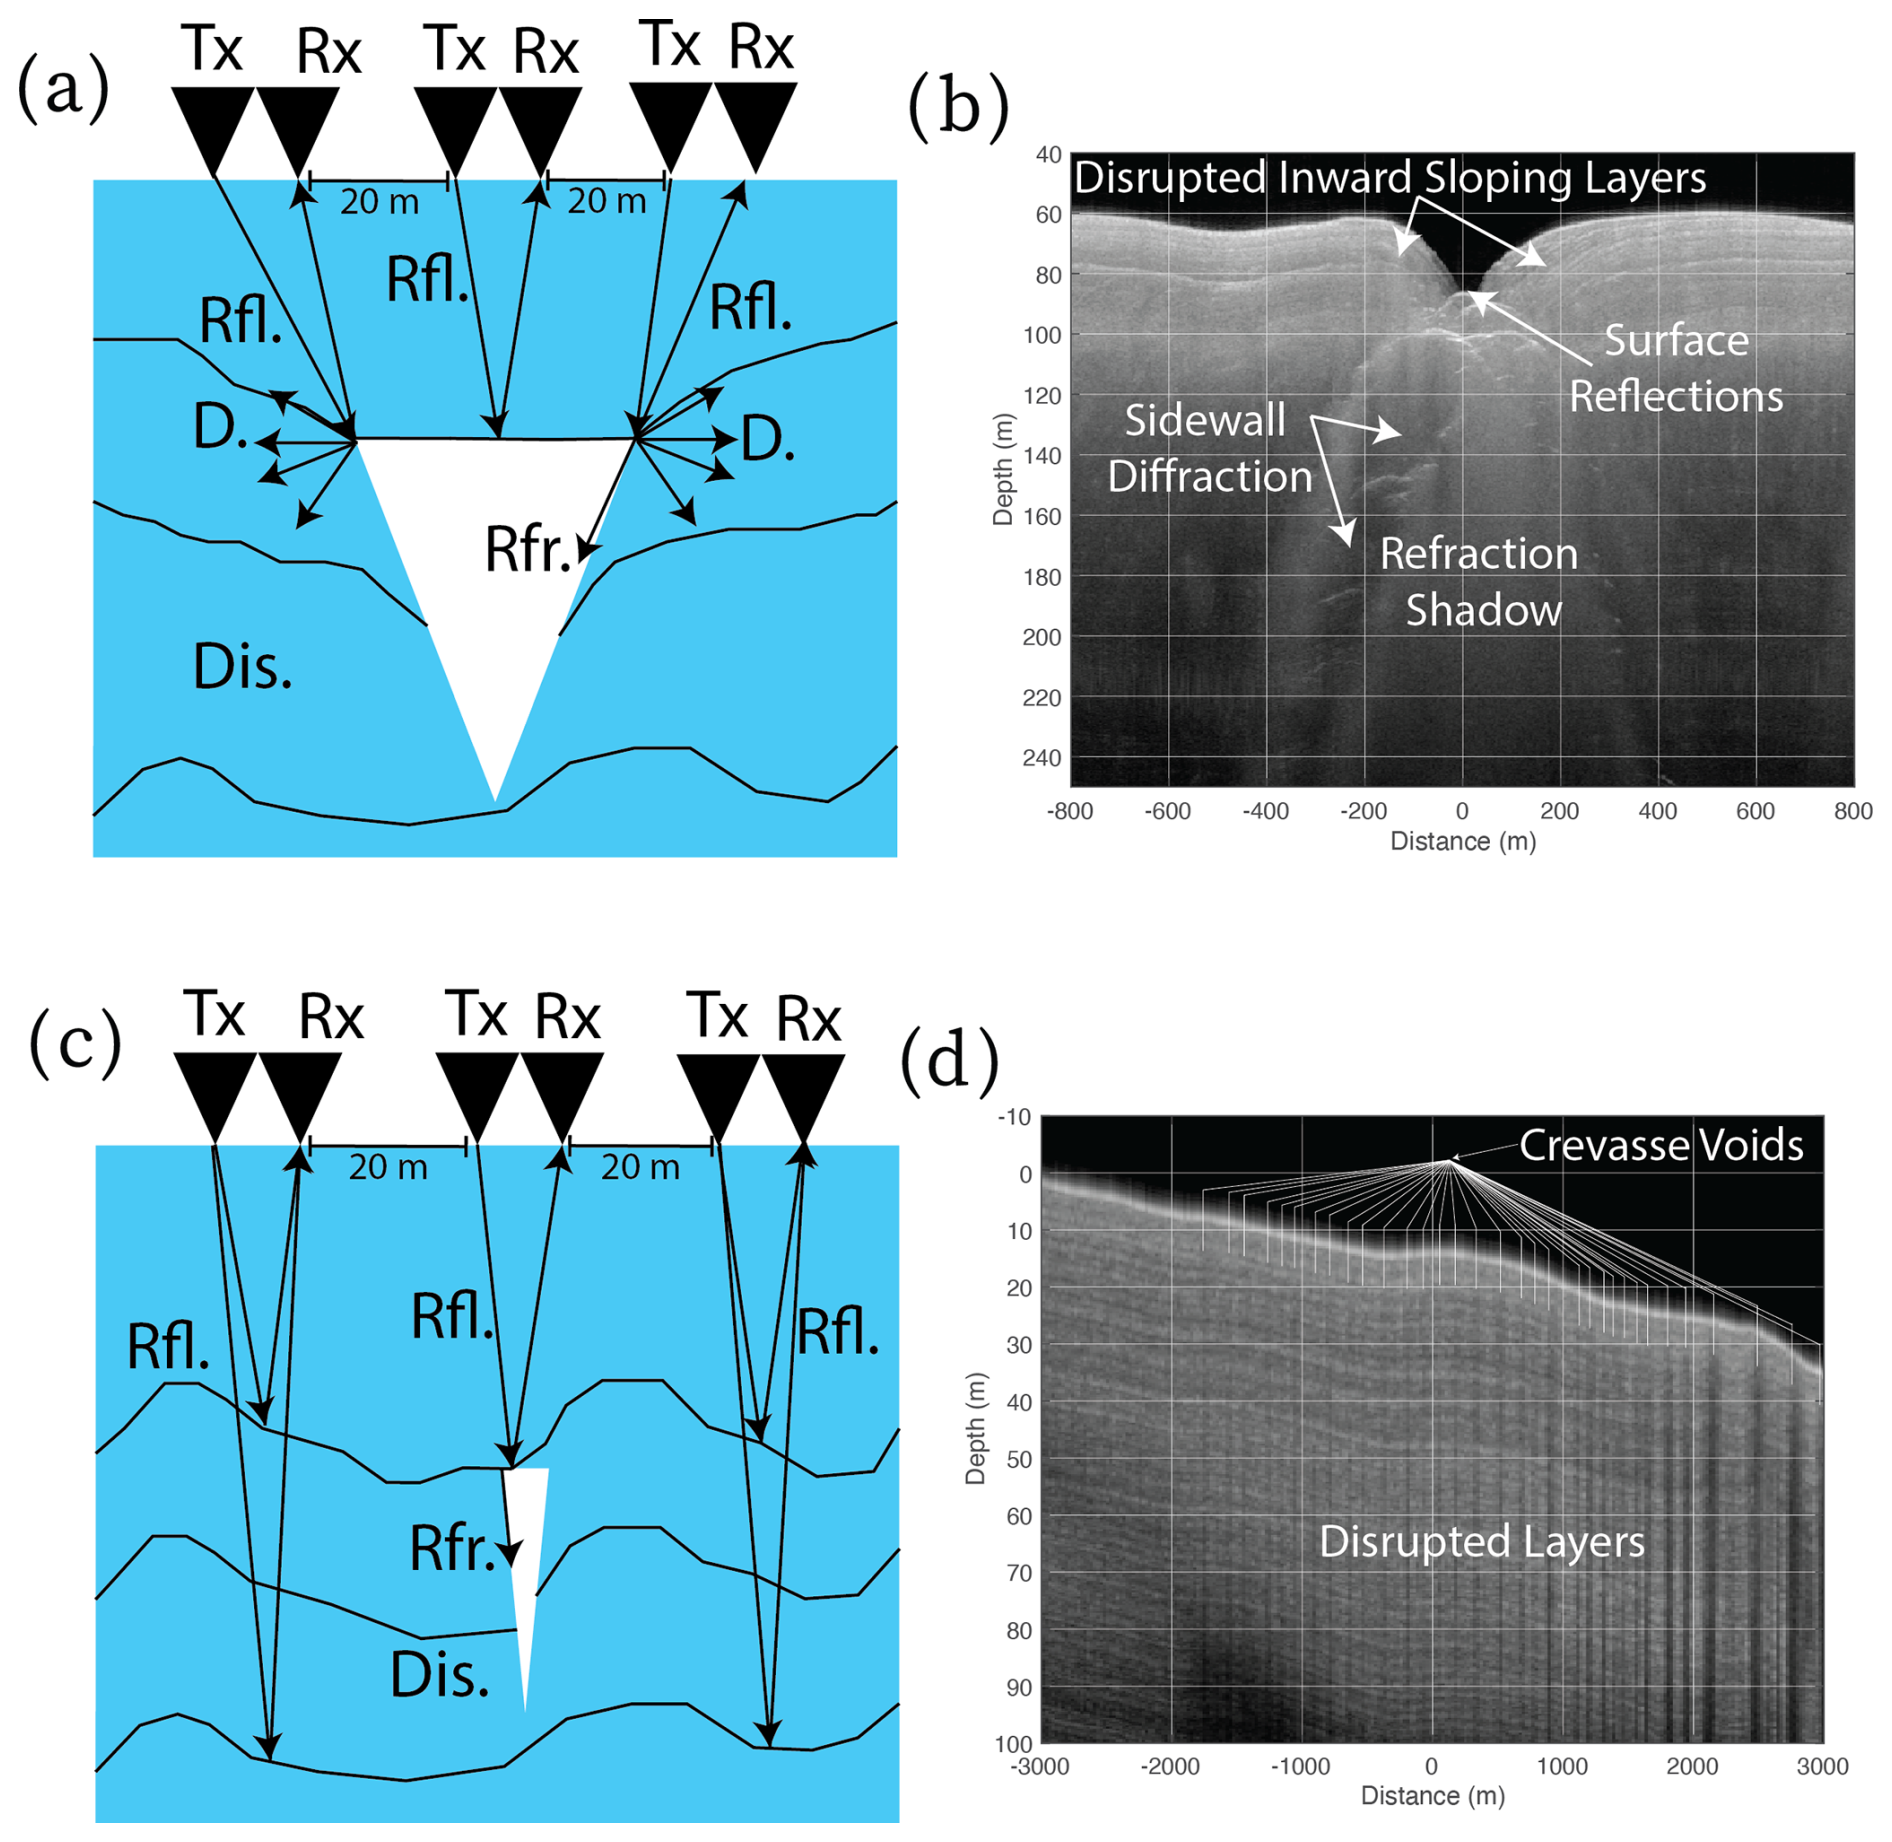
Figure 5Transmit and receive paths for different crevasse geometries. The transmitter (Tx) and receiver (Rx) are shown with illustrations of the transmit wave path. Features shown in radargrams are labeled on the wave paths: hyperbolic reflections from the crevasse top (Rfl.), refraction along the crevasse wall (Rfr.), hyperbolic sidewall diffraction (D) and discontinuous subglacial layering (Dis). Also shown are (a, b) the reflections we attribute to narrow crevasses we observe in the interior near surface and (c, d) larger near-surface crevasses that have opened on the ice shelf.
3.2 Crevasse expansion in the Amundsen Sea Embayment
Results from the algorithm applied to the SAR image time series are summarized in Figs. 6 and 7. We identify three qualitative changes in crevasse area and spatial density that together result in an overall increase in the damaged surface area of the Amundsen Sea Embayment:
-
the advection of crevasses from upstream into undamaged areas downstream (Fig. 6; orange arrow in image from 9 June 2019);
-
new crevasse appearances that overprint preexisting fractures that have been advected from upstream, these changes being discernible in the spatial density of crevasses and the patterns of crevasse orientations (Fig. 6; purple arrow in image from 9 June 2019);
-
crevasse initiation in previously uncrevassed areas farther inland than any previously observed crevasse (Fig. 6; blue arrow in image from 9 June 2019).
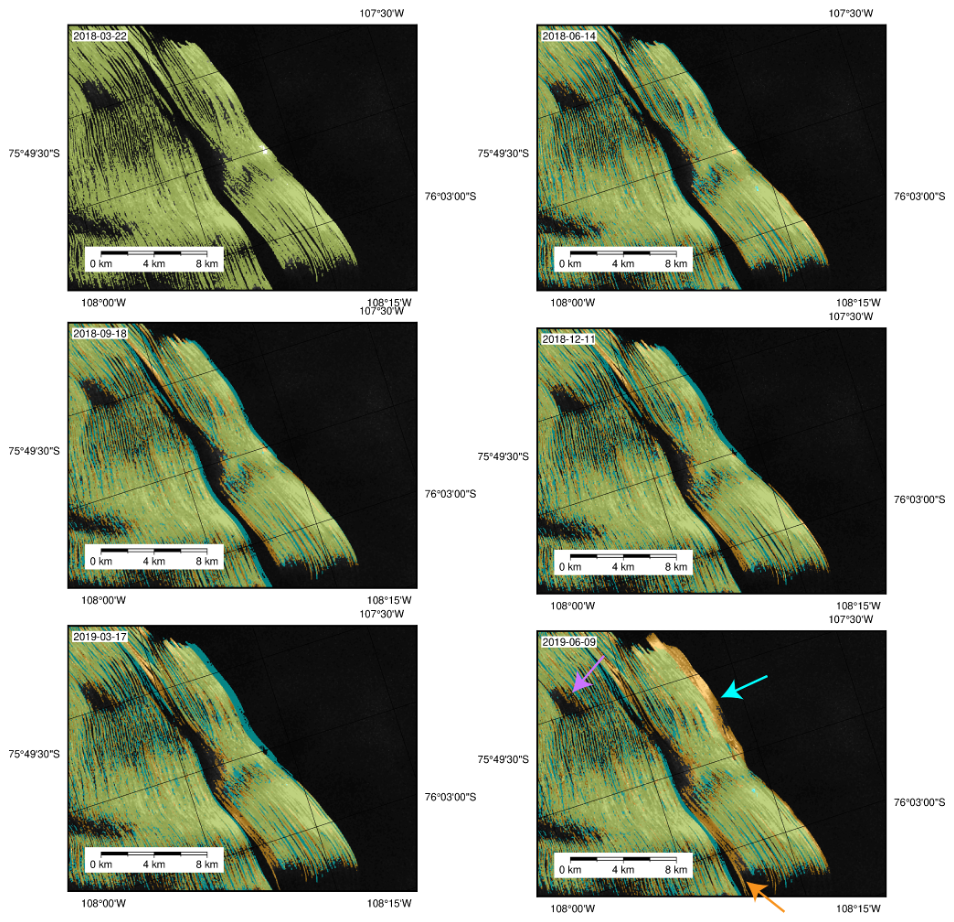
Figure 6SAR time series of inland crevasse advection and nucleation between 2018–2019 in the upper reaches of the crevassed trunk of Thwaites Glacier. The U-net crevasse position of a scene shot in March 2018 (cyan) overlain with subsequent crevasse positions (orange). The crevasse position images are transparent so that where the locations overlap the image appears green. Arrows highlight different mechanisms of crevasse area change: blue, crevasse initiation in previously uncrevassed areas; orange, advection into previously uncrevassed areas; and purple, new crevassing in areas with preexisting fractures.
The broad-scale crevassing patterns differ between the major glacier systems we examine in this study and are correlated with changes in ice velocity and effective stress expressed in the glacier surface velocities (Figs. 7, S9). From 2017–2022, Pine Island Glacier sped up, accelerating from the grounding zone (∼500 m yr−1) to the deep interior. As the glacier accelerated, likely due to changes in the buttressing capacity of the ice shelf due to a large iceberg calving event in 2017, the crevassed area increased (Fig. 7b; Joughin et al., 2021). The crevassed area then increased more slowly from 2018 to 2020, remaining almost constant. This stagnation in the crevassed area was followed by a second rapid increase in crevassed area from 2020–2021, which is contemporaneous with another major calving event. Thwaites Glacier also accelerated between 2017–2022, speeding up by 400 m yr−1 near the grounding zone (Benn et al., 2022). This speedup has been attributed to the development of full-depth fractures near a prominent pinning point on the Thwaites Eastern Ice Shelf (Benn et al., 2022) and also coincides with enhanced sub-ice-shelf melting in the ASE (Davis et al., 2023). During this time period, the crevassed area of Thwaites Glacier increased by 10 % and expanded inland of the glacier grounding line; crevassed area density also increased in previously crevassed regions. The glaciers that feed Dotson and Crosson ice shelves did not systematically speed up during this time period, and crevasse areas here remained steady except for a subtle increase in crevassed area in 2017. These observations indicate that the expansion of crevasses is likely due to increases in surface stresses associated with higher surface strain rates.
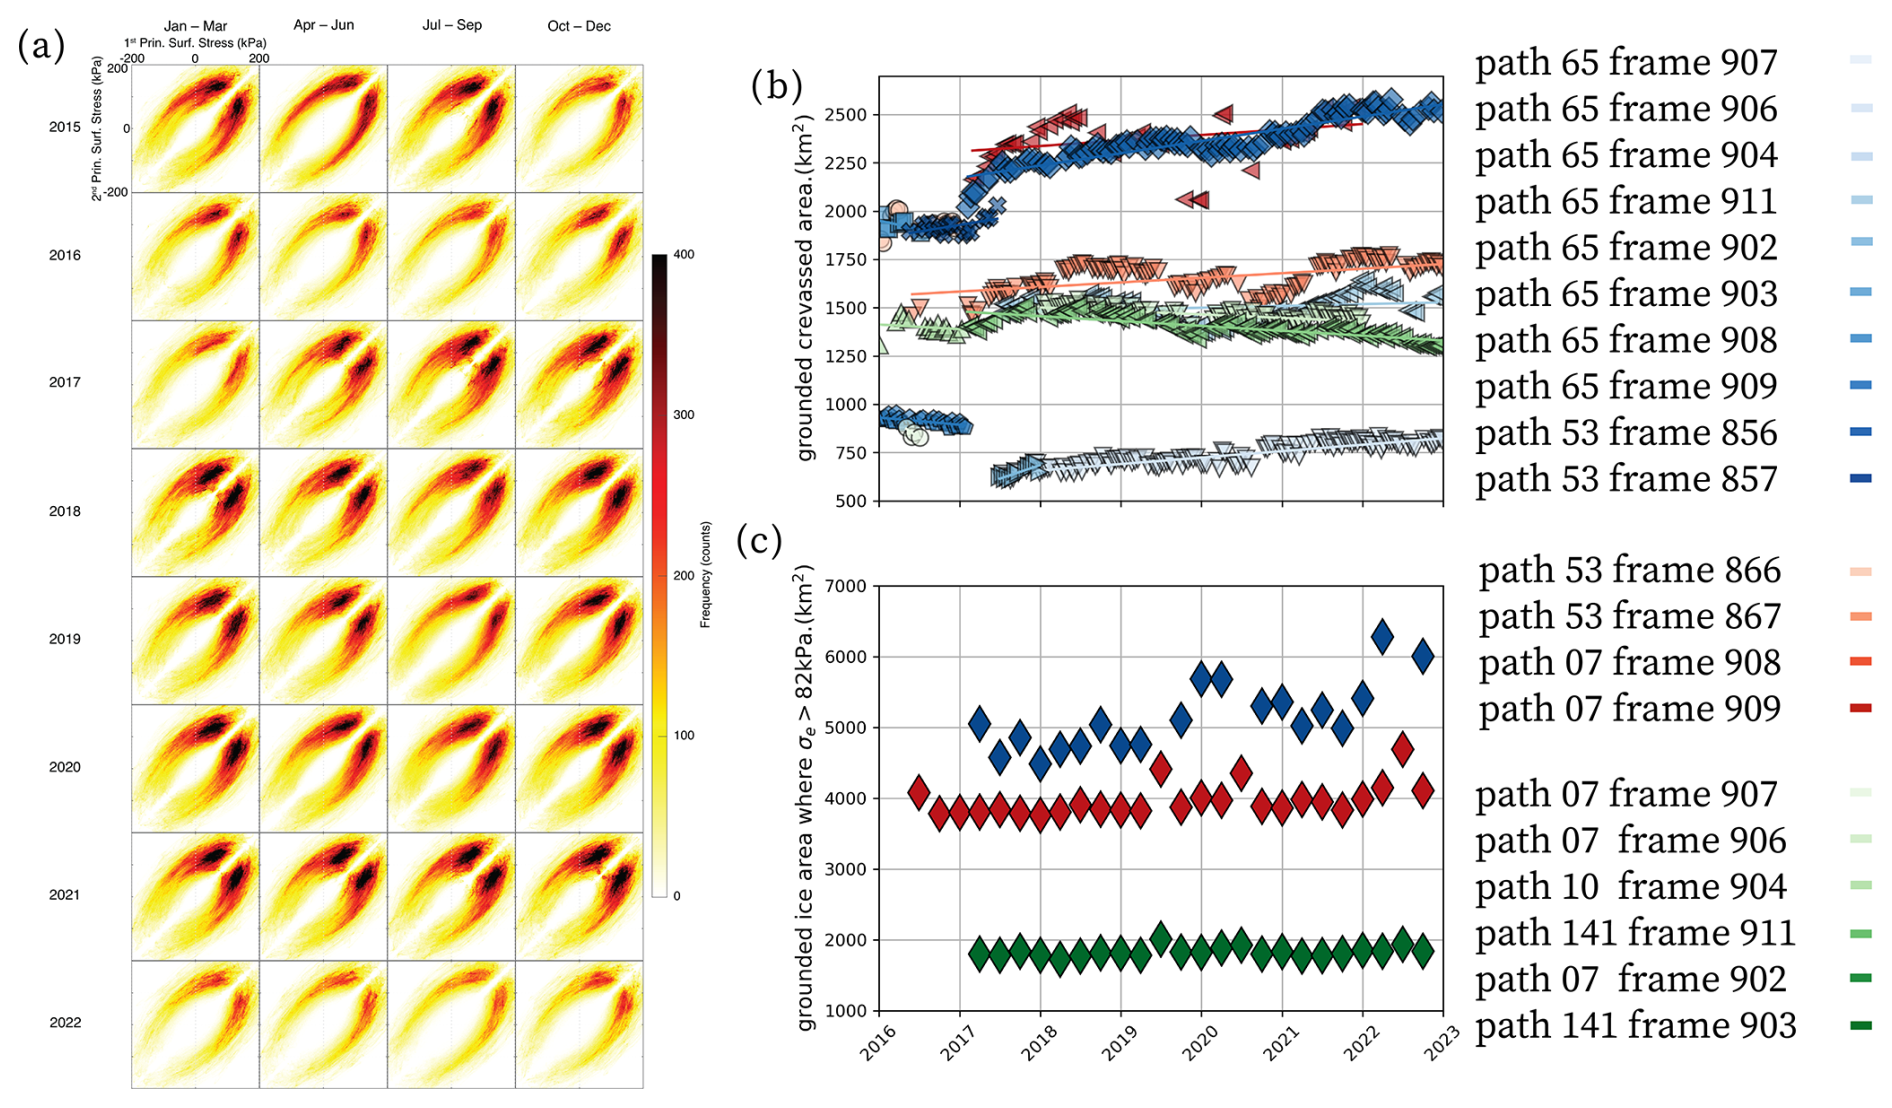
Figure 7(a) Principal surface stress failure envelopes of Thwaites Glacier crevasse time series from 2015–2022, following Vaughan (1993). (b) Crevassed area for the grounded regions of Pine Island (blues), Thwaites (reds), and the glaciers feeding Dotson and Crosson ice shelves (greens), with (c) the area where the effective stress (calculated using the surface membrane stresses) exceeds 200 kPa.
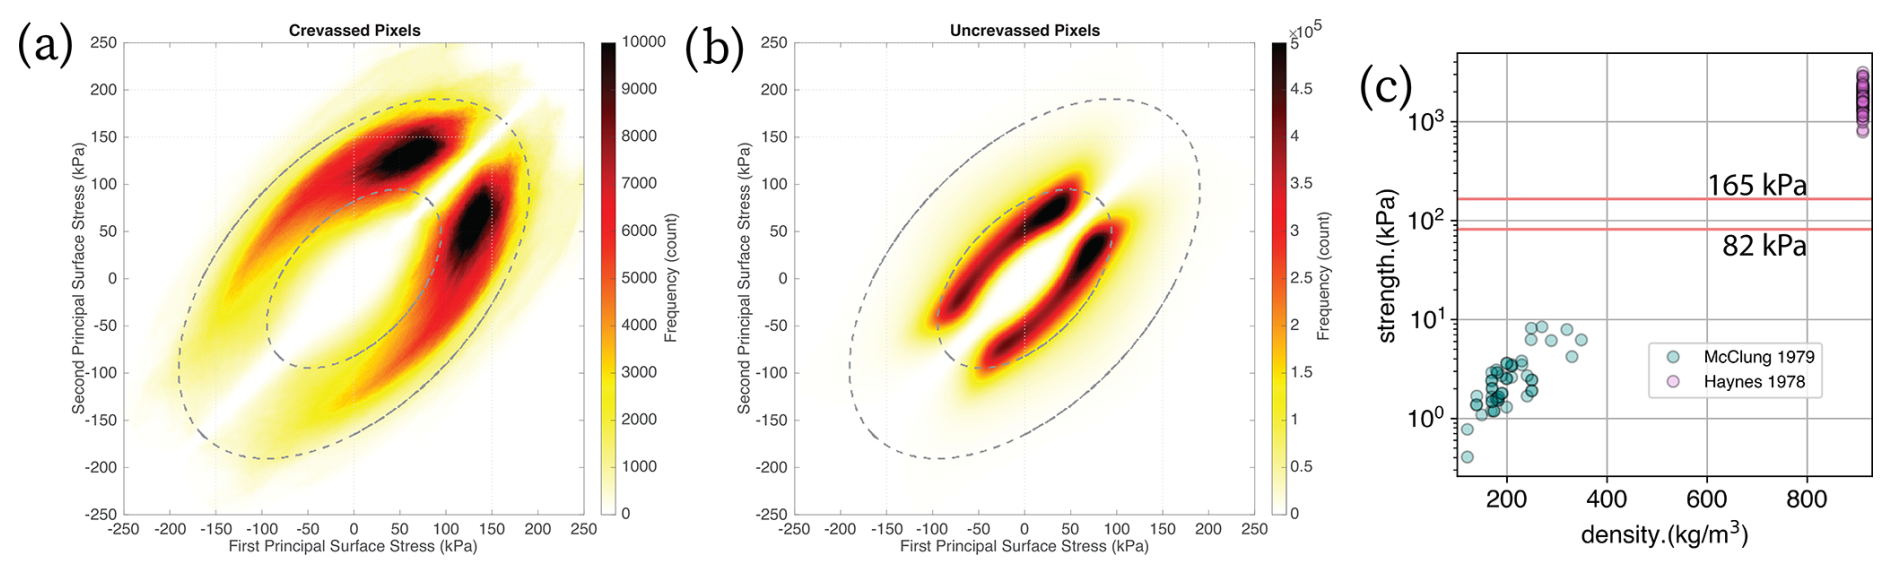
Figure 8Principal surface stress failure envelopes observed on Thwaites Glacier are shown for (a) crevassed and (b) uncrevassed regions of the glacier identified with U-net. These ellipses bound the tensile strength of the surface (dotted lines). Also shown are the (c) experimental tensile strengths inferred from laboratory experiments conducted on snow and ice. The tensile strengths inferred from the surface observations in this study (dotted lines in panels a and b) are also shown (red lines).
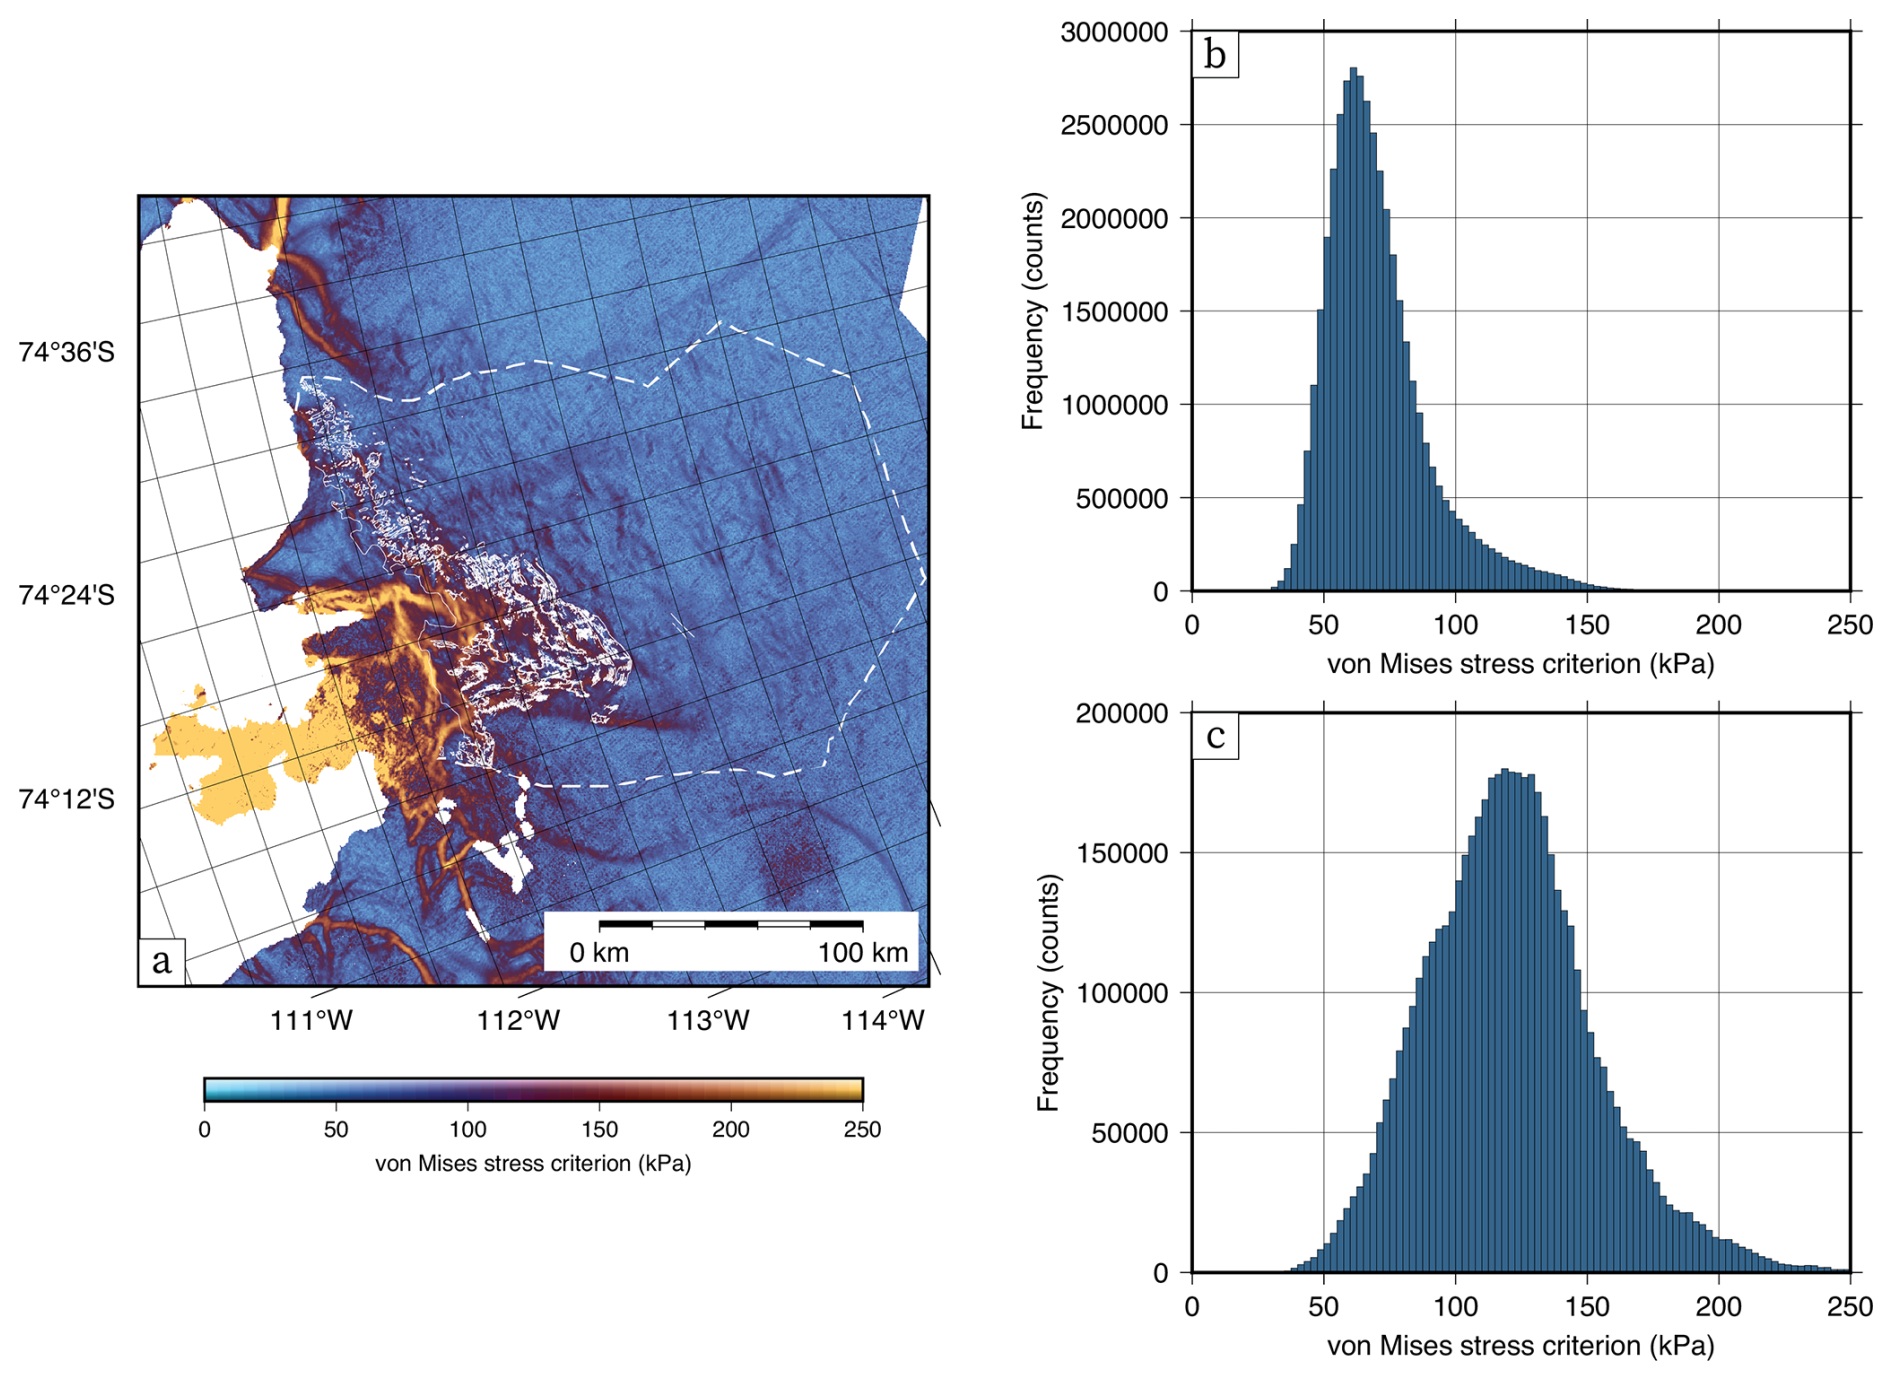
Figure 9(a) Von Mises stresses shown with crevasse area (threshold outlined where crevasse probability exceeds 0.8) for Thwaites Glacier. Also shown are (b) the histograms of von Mises stresses for uncrevassed regions and (c) crevassed areas for the area outlined in the hashed white line.
3.3 Failure envelopes and a data-driven tensile strength model of near-surface fractures
Following Vaughan (1993), maps of surface stress and fracture location were used to create failure surfaces (principal surface stress plots) for each quarterly velocity product. These failure envelopes do not change substantially over time (Fig. 7a). This elliptic relationship between principal surface stresses and brittle failure matches the predictions of the von Mises failure criterion (Vaughan, 1993). Comparing surface stress values between crevassed and uncrevassed ice suggests that the tensile strength of the near surface is bounded from below (Fig. 8). For Thwaites Glacier (other glaciers in the ASE have similar results; see Figs. S8, S9), 90 % of crevassed pixels occur for critical von Mises stresses of 82 kPa or greater, and 80 % of crevassed pixels are for equivalent stress criteria of 82 to 165 kPa (10 % of crevassed pixels for von Mises stresses greater than 165 kPa). The apparent upper limit of the von Mises stress in stress envelopes (Figs. 7, 8) and histograms of von Mises stress (Figs. 9, S8) reflects the class imbalance of high-stress pixels. These estimates of the tensile strength of the ice sheet near the surface agree with limits cited elsewhere in the remote-sensing literature but disagree with failure limits determined from laboratory measurements conducted on pure ice (∼1800 kPa; Haynes, 1979).
3.4 Geometric model
Our geometric model for the tensile strength of firn suggests that porous snow is much easier to fracture than ice. Figure 10 shows a comparison of the tensile strength model fit with tensile strengths determined from snow experiments and experiments on ice conducted over a range of ice temperatures and grain sizes (McClung, 1978; Haynes, 1979). While this is only one possible functional relationship between porosity and strength, the model shows encouraging agreement with lab experiments and suggests that the near-surface fractures we observe in the Amundsen Sea are consistent with the fracture mechanics of polar firn.
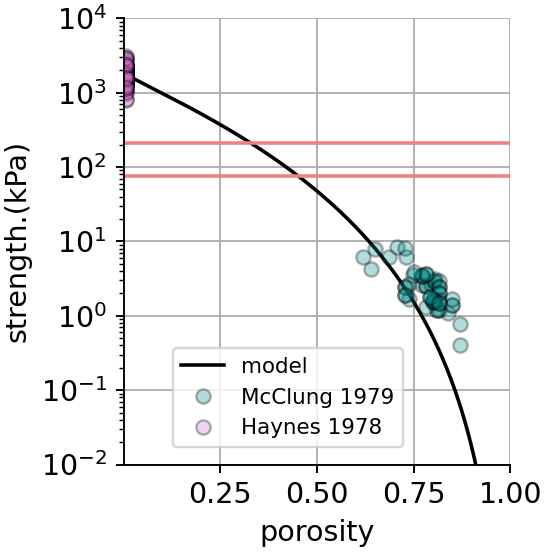
Figure 10Model fit for tensile strength of ice and firn as a function of porosity. Data used to fit the model are shown from studies on ice (Haynes, 1979) and porous snow (McClung, 1978). The best-fit model would suggest an exponent n=3.6 and tensile strength σI=1800 kPa. The range of tensile strengths measured in laboratory experiments for solid ice (i.e., Haynes, 1979) demonstrates the dependence of fracture on temperature and physical properties of crystal grains.
4.1 Drivers of inland crevasse expansion
Inland migration of crevasses appears to be linked to ongoing acceleration and inland effective stress changes in response to mass loss near the grounding zone. Pine Island; Thwaites; and the neighboring Haynes, Pope and Kohler glaciers in the ASE are losing mass at a greater rate than any other glaciated region in Antarctica (Shepherd et al., 2019; Rignot et al., 2019). Currently, submarine melt appears to pace mass loss and ASE glacier retreat (Jacobs et al., 1996; Jenkins et al., 2010, 2018), but changes in the buttressing capacity of ASE glacier ice shelves due to calving have also been linked to ephemeral inland acceleration (Joughin et al., 2021), and loss of ice-shelf buttressing has been hypothesized to be a major driver of retreat in a future warmer climate (DeConto and Pollard, 2016; Alley et al., 2023). Glaciers in the ASE accelerate to balance changes in driving stress; however, the strength and roughness of the bed are not uniform, and thus some areas of Thwaites and Pine Island in particular have steepened, while other areas have become more flat. The heterogeneous pattern of thinning we observe across Thwaites reveals the complexity of this relationship (“Video supplement”; Hoffman et al., 2020) and agrees with patterns we see in the effective stress field.
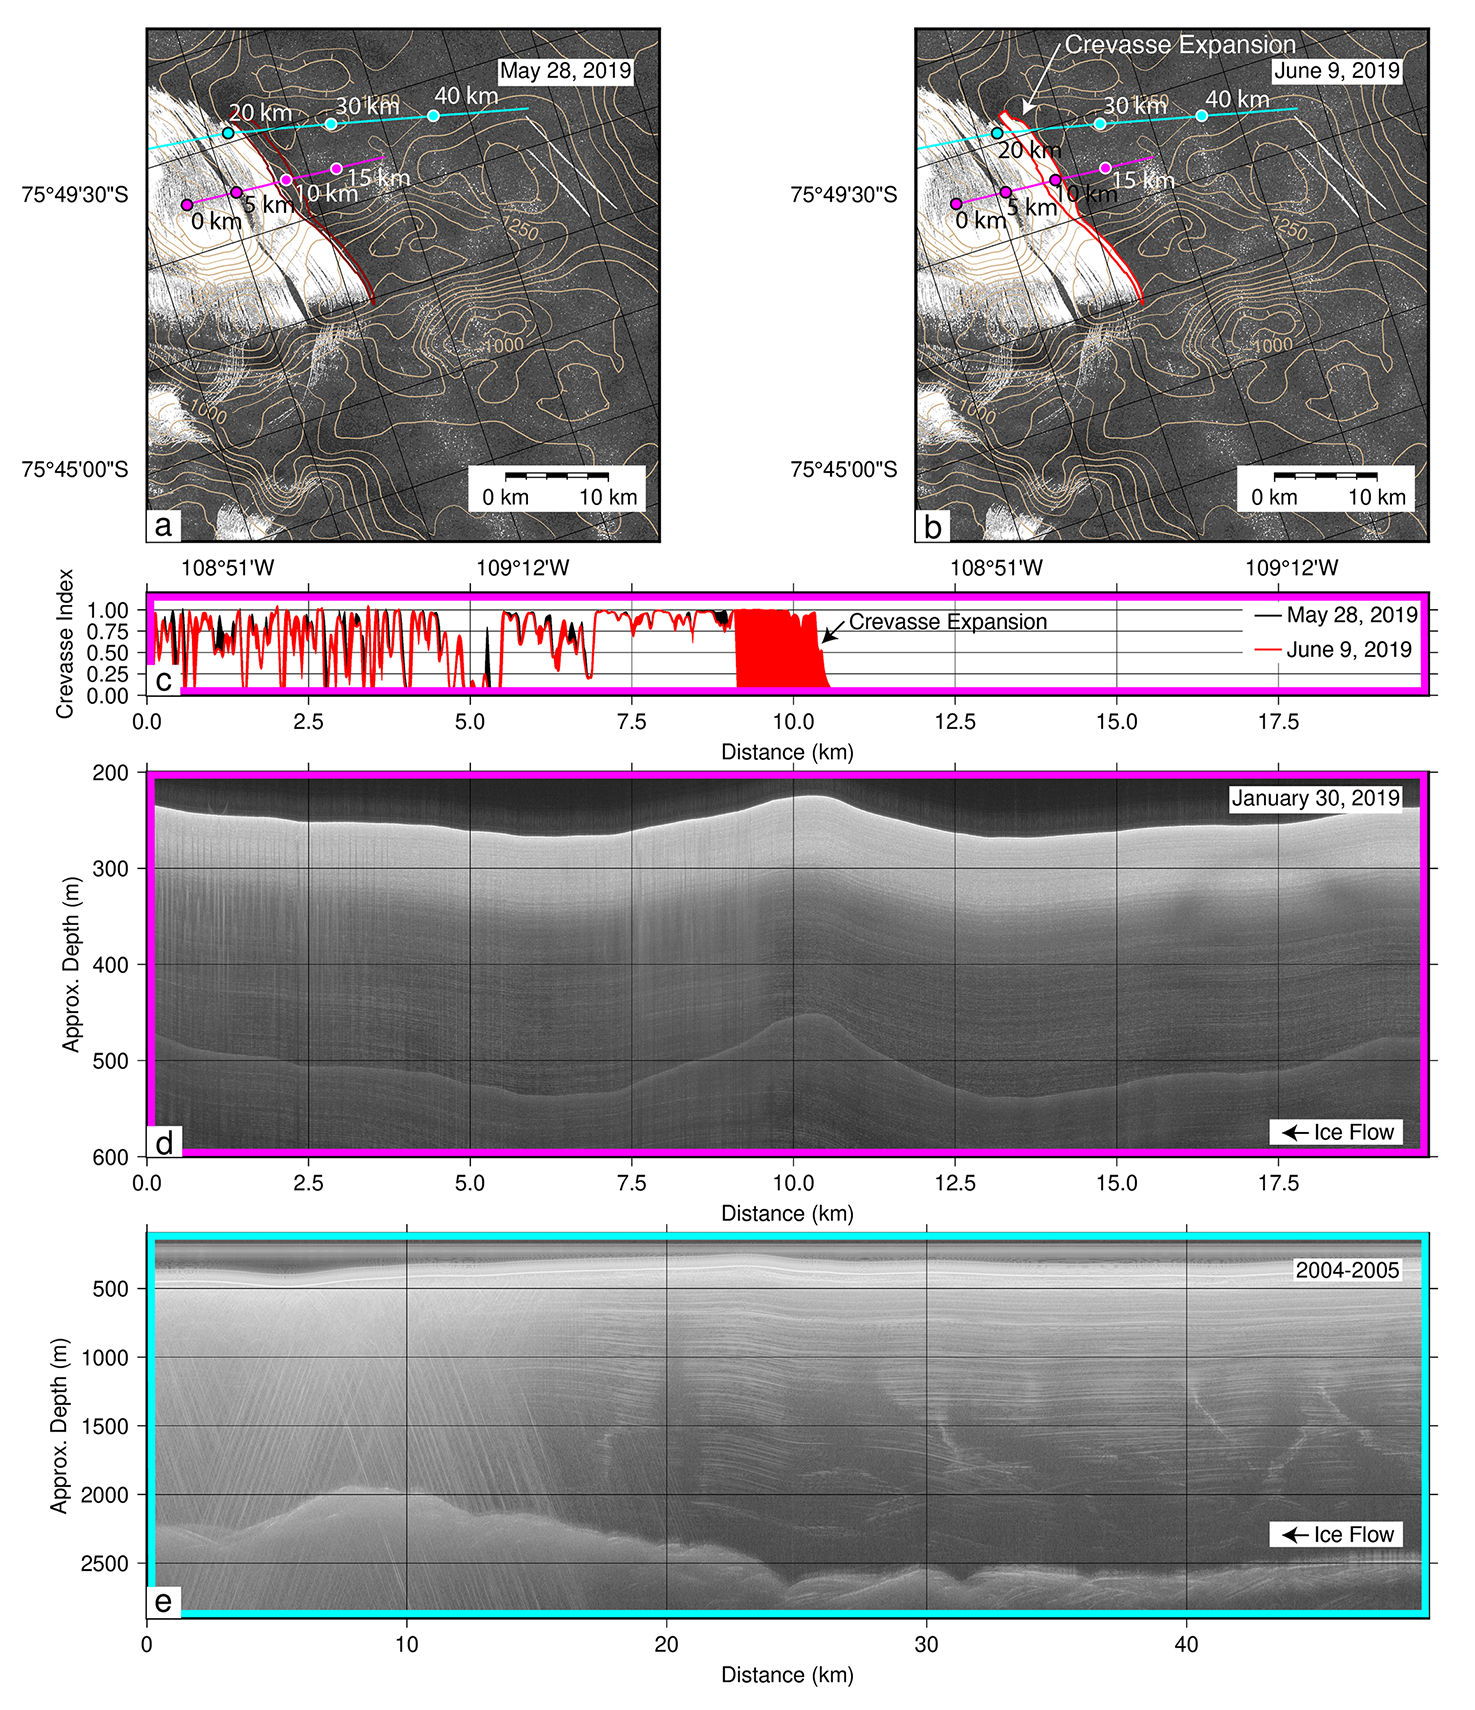
Figure 11Crevasse observed in Sentinel-1A SAR imagery on 28 May 2019 (a) and 9 June 2019 (b), highlighting a major crevassing event. The crevasse probability index from this study and the accumulation radar data collected by the International Thwaites Glacier Collaboration airborne geophysics campaign (magenta profile in the top panels) are also plotted (c). Also included (e) is a profile of ice-penetrating radar data collected as part of the Aerogeophysical Survey of the Amundsen Sea Embayment, Antarctica (AGASEA), project (cyan profile in the top panels). Contours in the top panels are bed elevation from BedMachine Antarctica.
This also appears to explain why crevasses jump inland, sometimes skipping several kilometers of uncrevassed area to initiate upstream in regions where the surface stresses are higher. In these areas, surface slopes are steep often on the lee side of local surface elevation highs associated with large-scale ridges in subglacial topography and locally enhanced basal resistance (Fig. 11; Hoffman et al., 2022). In this way, surface crevasses appear to be connected to glacier sliding as the relationship between basal shear stress and glacier sliding velocity mediates inland stress transmission.
4.2 Depiction of crevasses in ice-penetrating radar data
Joint inspection of co-located SAR-detected crevasses and ice-penetrating radar profiles revealed that crevasses identified in the SAR imagery are also expressed in ice-penetrating radar data. Because ice-penetrating radar data image the depth of englacial structures, these data can add context to the crevasses we identify in satellite SAR imagery. In the discussion that follows, we begin by describing the manifestation of crevasses in the ice-penetrating radar data. We then consider the implications of the features we image for crevasse geometry and depth.
Most crevasses we observe in the survey are imaged either as voids that start at the surface or as bright hyperbolic reflectors in the near surface (<100 m depth) with voids beneath the hyperbolas that interrupt layering at depth (Figs. 5c, S3, S4). Occasionally, we observe hyperbolic reflections deeper in the column – sometimes 100–150 m below the surface. These depths are below the observed firn–ice transition measured from ASE firn cores (Gow et al., 2004). These features could be crevasses we image off-nadir that appear deeper in radar profiles than they are in reality. They could also reflect larger flaws in the ice (>4 m) that have been shown using linear elastic fracture mechanics to reduce the tensile strength of ice (i.e., 59 kPa; Lai et al., 2020). For all profiles, the radar systems do not image hyperbolic reflectors deeper than ∼200 m except where basal crevasses on ice shelves are also present. Voids and hyperbolic reflectors often begin below intact near-surface layering. Features we identify as buried crevasses only appear downstream of onset zones in areas where the surface expression of crevasses is muted in SAR and optical imagery (i.e., Fig. 4c). Except for several very wide crevasses on the ice shelf, englacial layering in the vicinity of the crevasses does not noticeably slope into the crevasse.
The bright reflectors we observe buried beneath the surface are consistent with hyperbolic scatterers due to apparent diffraction where snow bridges reconnect with the continuous firn. Beneath these hyperbolic scatterers, very little energy is returned to the receiver. Similarly, where crevasses penetrate to the surface in optical and SAR imagery, ice-penetrating radar data show a significant decrease in energy reflected back to the receiver. This low-energy void appears to be caused by the steep angle of crevasse side walls that facilitate the refraction of energy along the wall away from the radar receiver. This results in a low-energy void beneath the top of the crevasse to depths below the bed reflector in neighboring traces to the noise floor of the receiver. The voids clearly cannot be interpreted as a proxy for crevasse depth, but their appearance does change though with the width of the crevasse feature. Near crevasse onset zones where crevasses occur at the surface, sidewall hyperbolic reflections, if present, are very weak. Further downstream, where crevasses are wider (Figs. S7–S8), all features discussed above are more notable (i.e., Fig. 5c compared to Fig. 5e). For these larger crevasses, we also observe internal layers dipping towards the crevasse, which we do not see in the vicinity of narrower crevasses we image upstream.
Crevasse depths remain extremely difficult to measure directly. With ground-based and airborne radar technology, it remains possible only to observe how the features affect local stratigraphy and flow expressed in nearby layer slopes. Because energy is critically refracted away from the receiver below the exposed surface crevasses (or the initial firn air reflection of buried crevasses), we never image the base of the crevasses we identify in SAR imagery and ice-penetrating radar data. The lack of diffraction hyperbola from crevasse sidewalls and the width of the void space suggest that the near-surface expression of the features is small relative to the trace spacing of the radar system; however, narrow crevasses have still been observed to penetrate deep into the near surface (Lindner et al., 2019). The most compelling evidence that suggests the buried crevasses we image with radar do not penetrate below the firn is the absence of hyperbolic scatterers below depths of 200 m and the limited impact the surface features appear to have on nearby ice flow.
In areas of crevasse onset, where englacial stratigraphy below 200 m depth is present on either side of the void space, the stratigraphy remains continuous and layers do not dip into the low-energy void. This suggests that these crevasses minimally disrupt the flow, which tends to close large crevasses at depths where the overburden stress of the ice and firn exceeds the horizontal tensile stress of the ice column (∼100 m depth; van der Veen, 1998). We see this effect downstream where the expression of the crevasse void space and sidewall reflectors changes with increasing horizontal strain rates. After crevasses open, the confining overburden pressure of firn and ice above drives viscous flow into the void space. This can cause the draw-down of englacial layers on either side of the crevasse, which we use as a diagnostic tool to constrain the depth of crevasses (Figs. 5 and S9). Over the ice shelf, the width of the low-power return beneath apparent surface crevasses increases, and sidewall reflections of near-surface crevasses become visible at intermediate depths (Fig. 5). Near these wider crevasses, layers steepen, sloping into the apparent void at intermediate depths (∼40 m). This suggests that the features are large enough and extend deep enough that they can affect ice flow well below the surface. Over the ice shelf, we also image the tips of basal crevasses that extend upward 400–500 m from the ice-shelf base (Figs. S8, S9). Englacial layer slopes change above these basal crevasses, suggesting again that these much larger features affect flow in ways the interior surface crevasses do not. These basal crevasse features extend 3 times deeper into the ice shelf than the deepest hyperbolic diffractors associated with surface crevasses and reveal how near full-thickness crevasse features appear in the same radar data.
4.3 Firn tensile strength
In the top half of the ice column, where viscosity changes are small, we assume that the tensile stresses are nearly uniform. As a result, crevassing in this region can define a strength threshold and suggests that the densifying snow and firn are weaker than the solid ice below.
Below the near surface, where crevasses have opened, compressive overburden pressure acts to close open-air crevasses (Weertman, 1973; Smith, 1976, 1978; van der Veen, 1998). Our observations are consistent with crevasses closing below 200 m depth and suggest that compressive overburden stresses in combination with firn strengthening with density and depth arrest dry firn crevasse propagation.
In the literature, inconsistent attention to the strength of firn has led to reported disagreement between the fracture properties of ice derived from laboratory measurements and estimates from in situ and remote-sensing observations. Tensile strengths measured in laboratory experiments are significantly higher than those determined from remote-sensing observations. The values we observe (82 to 165 kPa) are within ranges reported from other satellite remote-sensing observations of crevassing in Antarctica (Vaughan, 1993) and Greenland (Grinsted et al., 2024). These ranges are consistent with our geometric model which predicts firn fracture where effective stresses exceed 82 kPa when the bulk average porosity is greater than 0.4. This suggests that the crevasses and associated tensile strengths determined from remote sensing of surface strain rates likely reflect near-surface fracture in firn, where the fracture toughness and tensile strength are reduced by the porosity of the firn (Smith et al., 1990; Fischer et al., 1995; Rist et al., 1999, 2002).
4.4 Implications of firn crevasses
Our observations of inland crevassed area expansion on Thwaites and Pine Island glaciers are consistent with a porosity-dependent fracture model that predicts firn fracture preceding crevasse penetration through ice. Our model suggests that surface stresses in the ASE open surface crevasses that penetrate through the porous firn. We estimate that the firn in the ASE has a tensile strength between 82 and 165 kPa consistent with a depth-averaged porosity between 0.25 and 0.5 (∼450–750 kg m−3 firn density). These crevasses would not be expected to penetrate deeper into the ice column where the denser ice has a higher tensile strength (Rist et al., 2002) and where the increased pressure with depth is predicted to close dry air crevasses (van der Veen, 1998). These results have implications for understanding the current impact of fractures on ice dynamics in the ASE and the vulnerability of the ice sheet to fracture-related collapse and ice-shelf weakening. They also carry implications for determining the mass balance of crevassed sectors of the ice sheet. We devote the remaining discussion to these two related topics and highlight some directions for future observational work.
4.4.1 MICI instability
Elliptic failure envelope analysis and porosity-dependent tensile strength modeling suggest that tensile strength estimates for ice that use values calculated from observations of surface fractures underestimate the bulk strength of the ice sheet (i.e., the tensile strength of solid ice is greater than 82–165 kPa).
Models of cliff calving that underpin the MICI hypothesis often treat the ice column as a homogeneous material (Parizek et al., 2019; Clerc et al., 2019), with calving thresholds that are sensitive to the prescribed material strength (i.e., DeConto and Pollard, 2016). Our work shows that the strength of the ice column is likely heterogeneous with depth, and observed surface crevassing would not occur without a porous (and therefore) near-surface firn layer. Remote-sensing estimates of tensile strength are more representative of surface properties and therefore should be treated as a lower limit on material strength, as they would yield unrealistically high rates of full-thickness fracture in MICI models.
4.4.2 Ice-shelf weakening
Surface crevasses have also been suggested to signal ice-shelf weakening (i.e., Lai et al., 2020; Alley et al., 2021; Zhao et al., 2022; Surawy-Stepney et al., 2023a), with several studies recently highlighting the potential impact of ice-shelf surface crevasses on ice flow (Lai et al., 2020; Zhao et al., 2022; Surawy-Stepney et al., 2023a). Our ice-penetrating radar observations of near-surface crevasses inland and across the grounding zone suggest that near-surface crevasses do not significantly change character as they advect onto the ice shelf and that many of these features are still confined to the near surface (Figs. S6, S7). The depth of these features may explain the weak relationship found by Gerli et al. (2024) between ice-shelf crevasses identified by Izeboud and Lhermitte (2023) and inferences of ice-shelf fluidity derived from contemporaneous surface velocity and ice thickness observations. Our results in connection with the findings of Gerli et al. (2024) suggest that surface crevasses expressed in satellite remote-sensing datasets (e.g., Lai et al., 2020; Zhao et al., 2022; Surawy-Stepney et al., 2023a; Izeboud and Lhermitte, 2023) only weakly affect the bulk viscosity of ice shelves. In contrast, some of the basal crevasse features we observe with radar penetrate through almost 75 % of the ice-shelf column (>600 m), 3 times the depth of the deepest features associated with buried surface fractures in radar data (Figs. S6, S7). These basal crevasse observations should be assimilated into ice-shelf models as these features have been observed to affect ice-shelf flow (i.e., Jeong et al., 2016).
4.4.3 Firn air content
Our observations of a near-surface crevasse opening in the firn also have implications for satellite remote-sensing observations used to calculate glacier mass loss. Firn depth and density estimates are required to convert altimetry-observed height changes to mass changes and remain a major source of uncertainty in mass balance studies (i.e., Morris and Wingham, 2015; Verjans et al., 2021). Firn depth and density estimates are also required to convert firn and ice column thickness and velocity observations to discharge fluxes across the ice-sheet grounding zone (Rignot et al., 2019). Both of these methods rely on accurate descriptions of the firn air content, which can change with horizontal strain rates.
Horizontal stresses can affect firn air content via three different mechanisms. Horizontal divergence can stretch the firn, effectively thinning the firn column as suggested by Horlings et al. (2021). Horizontal stresses can also enhance creep-driven densification (Oraschewski and Grinsted, 2022), and as we have shown in this study, horizontal stresses can fracture the firn, opening large volumes of void space in the near surface.
In grounded ice regions, elevation change observations of the ice-sheet surface can be corrected for changes in firn air content and glacial isostatic adjustment to estimate grounded ice-sheet mass change. Because this is a measurement of vertical height change, the effect of horizontal void space introduced by crevasses opening in the near surface affects the estimate of ice-sheet thinning or thickening below based on how the effects of horizontal divergence-induced layer thinning and creep-enhanced densification are parameterized in the treatment of firn air content. A correction that separates enhanced creep-driven firn densification (Oraschewski and Grinsted, 2022) and horizontal divergence-induced stretching (Horlings et al., 2021) from horizontal divergence associated with crevasse opening could account for the near-surface changes in firn densification. This effect would tend to decrease the enhanced densification rates calculated by Horlings et al. (2021) that assume all horizontal divergence in the near surface is accommodated by vertical densification.
Surface crevasses also affect estimates of ice flux across the grounding zone. Because this measurement is made with respect to a vertical gate at the grounding zone where the ice goes afloat, horizontal and vertical variations in firn air content affect calculations of discharge flux. In regions where the near-surface crevassed area observed with SAR imagery has increased and presently accounts for ∼10 %–40 % of the total surface area, such as lower Thwaites Glacier, the void space associated with open crevasses contributes substantially to the total firn air content. Assuming the depth of the void space is on average ∼20 m, the area occupied by crevasses may represent between 2–8 m of unaccounted air content in the near surface that would affect the discharge calculations of Thwaites Glacier made from horizontal velocity and surface thinning observations. These approach the uncertainty in bed topography measured with ice-penetrating radar crossover discrepancies in ice thickness (mean 8 m, rms 47 m; Holt et al., 2006) and can change over time with the stress state of ice near the grounding zone. Together, the firn air content (consistent with the horizontal strain in areas that remain uncrevassed) and the crevasse void space should both be included in flux-gate analyses of glacier systems.
4.4.4 Surface albedo
The appearance of surface crevasse features in panchromatic and SAR imagery also highlights how crevasses affect ice-sheet albedo. Incipient roughness associated with near-surface crevasses has previously been suggested as a driver of surface ablation feedbacks, which can cause small-scale roughness features to grow and eventually impact the morphology of the crevasse and surface water storage (Pfeffer and Bretherton, 1987; MacClune et al., 2003; Cathles et al., 2011, 2014). The growth of surface features in mountain glacier environments like sun cups and penitents (pointed ice or snow columns) has also been connected to solar absorption feedbacks initiated by preexisting surface roughness (Betterton, 2001). Previous studies have used radiative transfer models to understand how the shape of these features affects their evolution. These studies have shown that crevasses of reasonable geometries for latitudes consistent with Greenland outlet glaciers can increase the local absorption of shortwave radiation by >50 % (Warren, 2022). Fewer studies have explored this feedback for crevasse orientations and latitudes consistent with Antarctic outlet glaciers for present and warmer future climates. We leave this as a promising extension of the work presented here.
We present new observations of changes in the fracture behavior of the ice-sheet near surface of Thwaites Glacier and its neighbors in the Amundsen Sea Embayment. Our results indicate that changes in the crevassed area are consistent with increases in surface stresses in response to ongoing ocean-driven acceleration. Although our observations are consistent with observations of ice-sheet near-surface tensile strength (∼82–164 kPa) determined from remote sensing, these failure limits are lower than the failure limits predicted by laboratory experiments conducted on solid ice. We have shown that these inconsistencies can be resolved by accounting for the effects of firn porosity on near-surface tensile strength. Using this model, we showed that the increase in the crevassed area on Thwaites Glacier is consistent with the increase in the area where effective surface stresses exceed a critical tensile strength for the near-surface firn. We speculate that at present, because of the near-surface nature of these features, surface crevassed area change appears to be a symptom rather than a driver of acceleration and retreat in the ASE. The void space introduced by crevasses in the near surface may not have a large effect on full-thickness failure rates but likely does affect calculations of firn air content and surface albedo in rapidly accelerating and crevassed areas of the ice sheet. Finally, the ongoing collection of SAR images can also be processed rapidly enough using an automated framework (e.g., Izeboud and Lhermitte, 2023; Surawy-Stepney et al., 2023a, b; and our work) that makes live crevasse detection possible in areas where researchers are conducting fieldwork.
The fracture fields for Amundsen Sea glaciers are available at the NSIDC. For live maps of crevasse patterns in new locations, reach out to aoh2111@columbia.edu. The scripts for creating the figures and crevasse propagation rate data products shown in this study are available at https://doi.org/10.5281/zenodo.14994659 (Hoffman, 2025a). The masking software used to build the georeferenced masks is available at https://doi.org/10.5281/zenodo.14994657 (Hoffman, 2025b).
Videos of crevasse migration on Thwaites Glacier are available at https://doi.org/10.5446/62770 (Hoffman, 2023a) and https://doi.org/10.5446/62771 (Hoffman, 2023b).
The supplement related to this article is available online at https://doi.org/10.5194/tc-19-1353-2025-supplement.
The complete member list of the GHOST science team can be found at https://thwaitesglacier.org/projects/ghost.
AOH and KC theorized the study. AOH wrote the software to segment images and implemented the neural network crevasse detection method following the work of CYL. AOH, KC and NH interpreted the radargrams collected by Operation IceBridge. IJ processed and created the velocity time series used to calculate surface strain. AOH wrote the first draft of the manuscript. All authors contributed to the editing of the manuscript.
The contact author has declared that none of the authors has any competing interests.
Publisher's note: Copernicus Publications remains neutral with regard to jurisdictional claims made in the text, published maps, institutional affiliations, or any other geographical representation in this paper. While Copernicus Publications makes every effort to include appropriate place names, the final responsibility lies with the authors.
The work was supported by a NASA FINESST award (grant no. 80NSSC20K1627); the NASA Sea Level Change team (grant no. 80NSSC17K0698); and the Geophysical Habitat of Subglacial Thwaites (GHOST) project, a component of the International Thwaites Glacier Collaboration (ITGC) supported by the National Science Foundation and Natural Environment Research Council (grant no. NSF-NERC-OPP-1738934).
This research has been supported by the National Aeronautics and Space Administration (grant no. 80NSSC20K1627), the National Science Foundation (grant no. OPP-1738934), and the National Aeronautics and Space Administration (grant no. 80NSSC17K0698).
This paper was edited by Bert Wouters and reviewed by William Colgan and three anonymous referees.
Abadi, M., Agarwal, A., Barham, P., Brevdo, E., Chen, Z., Citro, C., Corrado, G. S., Davis, A., Dean, J., Devin, M., Ghemawat, S., Goodfellow, I., Harp, A., Irving, G., Isard, M., Jozefowicz, R., Jia, Y., Kaiser, L., Kudlur, M., Levenberg, N., Mané, D., Schuster, M., Monga, R., Moore, S., Murray, D., Olah, C., Shlens, J., Steiner, B., Sutskever, I., Talwar, K., Tucker, P., Vanhoucke, V., Vasudevan, V., Viégas, F., Vinyals, O., Warden, P., Wattenberg, M., Wicke, M., Yu, Y., and Zheng, X.: TensorFlow: Large-scale machine learning on heterogeneous systems, https://www.tensorflow.org/ (last access: June 2023), 2015. a
Akeret, J., Chang, C., Lucchi, A., and Refregier, A.: Radio frequency interference mitigation using deep convolutional neural networks, Astron. Comput., 18, 35–39, 2017. a, b
Alley, K. E., Scambos, T. A., Anderson, R. S., Rajaram, H., Pope, A., and Haran, T. M.: Continent-wide estimates of Antarctic strain rates from Landsat 8-derived velocity grids, J. Glaciol., 64, 321–332, https://doi.org/10.1017/jog.2018.23, 2018. a
Alley, K. E., Wild, C. T., Luckman, A., Scambos, T. A., Truffer, M., Pettit, E. C., Muto, A., Wallin, B., Klinger, M., Sutterley, T., Child, S. F., Hulen, C., Lenaerts, J. T. M., Maclennan, M., Keenan, E., and Dunmire, D.: Two decades of dynamic change and progressive destabilization on the Thwaites Eastern Ice Shelf, The Cryosphere, 15, 5187–5203, https://doi.org/10.5194/tc-15-5187-2021, 2021. a
Alley, R., Horgan, H., Joughin, I., Cuffey, K., Dupont, T., Parizek, B., Anandakrishnan, S., and Bassis, J.: A simple law for ice-shelf calving, Science, 322, 1344, https://doi.org/10.1126/science.1162543, 2008. a
Alley, R., Cuffey, K., Bassis, J., Alley, K., Wang, S., Parizek, B., Anandakrishnan, S., Christianson, K., and DeConto, R.: Iceberg Calving: Regimes and Transitions, Annu. Rev. Earth Planet. Sci., 51, 189–215, https://doi.org/10.1146/annurev-earth-032320-110916, 2023. a, b, c
ASF DAAC: Alaska Satellilte Facility Distributed Active Archive Center, contains modified Copernicus Sentinel data 2014–2022, 2014–2022. a
Ashby, M. F. and Medalist, R. M.: The mechanical properties of cellular solids, Metall. Trans. A, 14, 1755–1769, 1983. a
Banwell, A. F., MacAyeal, D. R., and Sergienko, O. V.: Breakup of the Larsen B Ice Shelf triggered by chain reaction drainage of supraglacial lakes, Geophys. Res. Lett., 40, 5872–5876, https://doi.org/10.1002/2013GL057694, 2013. a
Bassis, J. N. and Walker, C. C.: Upper and lower limits on the stability of calving glaciers from the yield strength envelope of ice, P. Roy. Soc. A, 468, 913–931, https://doi.org/10.1098/rspa.2011.0422, 2012. a
Benn, D. I., Luckman, A., Åström, J. A., Crawford, A. J., Cornford, S. L., Bevan, S. L., Zwinger, T., Gladstone, R., Alley, K., Pettit, E., and Bassis, J.: Rapid fragmentation of Thwaites Eastern Ice Shelf, The Cryosphere, 16, 2545–2564, https://doi.org/10.5194/tc-16-2545-2022, 2022. a, b
Berg, B. and Bassis, J.: Crevasse advection increases glacier calving, J. Glaciol., 68, 977–986, https://doi.org/10.1017/jog.2022.10, 2022. a
Betterton, M. D.: Theory of structure formation in snowfields motivated by penitentes, suncups, and dirt cones, Phys. Rev. E, 63, 056129, https://doi.org/10.1103/PhysRevE.63.056129, 2001. a
Bindschadler, R., Vornberger, P., Blankenship, D., Scambos, T., and Jacobel, R.: Surface velocity and mass balance of Ice Streams D and E, West Antarctica, J. Glaciol., 42, 461–475, https://doi.org/10.3189/s0022143000003452, 1996. a
Cathles, L. M., Abbot, D. S., Bassis, J. N., and MacAyeal, D. R.: Modeling surface-roughness/solar-ablation feedback: application to small-scale surface channels and crevasses of the Greenland ice sheet, Ann. Glaciol., 52, 99–108, https://doi.org/10.3189/172756411799096268, 2011. a
Cathles, L. M., Abbot, D. S., and MacAyeal, D. R.: Intra-surface radiative transfer limits the geographic extent of snow penitents on horizontal snowfields, J. Glaciol., 60, 147–154, https://doi.org/10.3189/2014JoG13J124, 2014. a
Chudley, T. R., Christoffersen, P., Doyle, S. H., Dowling, T. P. F., Law, R., Schoonman, C. M., Bougamont, M., and Hubbard, B.: Controls on Water Storage and Drainage in Crevasses on the Greenland Ice Sheet, J. Geophys. Res.-Earth Surf., 126, e2021JF006287, https://doi.org/10.1029/2021JF006287, 2021. a
Clerc, F., Minchew, B. M., and Behn, M. D.: Marine Ice Cliff Instability Mitigated by Slow Removal of Ice Shelves, Geophys. Res. Lett., 46, 12108–12116, https://doi.org/10.1029/2019GL084183, 2019. a, b, c
Colgan, W., Rajaram, H., Abdalati, W., McCutchan, C., Mottram, R., Moussavi, M. S., and Grigsby, S.: Glacier crevasses: Observations, models, and mass balance implications, Rev. Geophys., 54, 119–161, https://doi.org/10.1002/2015rg000504, 2016. a
Cook, A. J. and Vaughan, D. G.: Overview of areal changes of the ice shelves on the Antarctic Peninsula over the past 50 years, The Cryosphere, 4, 77–98, https://doi.org/10.5194/tc-4-77-2010, 2010. a
Crawford, A. J., Benn, D. I., Todd, J., Åström, J. A., Bassis, J. N., and Zwinger, T.: Marine ice-cliff instability modeling shows mixed-mode ice-cliff failure and yields calving rate parameterization, Nat. Commun., 12, 2701, https://doi.org/10.1038/s41467-021-23070-7, 2021. a
Davis, P. E. D., Nicholls, K. W., Holland, D. M., Schmidt, B. E., Washam, P., Riverman, K. L., Arthern, R. J., Vaňková, I., Eayrs, C., Smith, J. A., Anker, P. G. D., Mullen, A. D., Dichek, D., Lawrence, J. D., Meister, M. M., Clyne, E., Basinski-Ferris, A., Rignot, E., Queste, B. Y., Boehme, L., Heywood, K. J., Anandakrishnan, S., and Makinson, K.: Suppressed basal melting in the eastern Thwaites Glacier grounding zone, Nature, 614, 479–485, https://doi.org/10.1038/s41586-022-05586-0, 2023. a
DeConto, R. M. and Pollard, D.: Contribution of Antarctica to past and future sea-level rise, Nature, 531, 591–597, https://doi.org/10.1038/nature17145, 2016. a, b, c, d, e
Fischer, M. P., Alley, R. B., and Engelder, T.: Fracture toughness of ice and firn determined from the modified ring test, J. Glaciol., 41, 383–394, https://doi.org/10.3189/s0022143000016257, 1995. a
Gerli, C., Rosier, S., Gudmundsson, G. H., and Sun, S.: Weak relationship between remotely detected crevasses and inferred ice rheological parameters on Antarctic ice shelves, The Cryosphere, 18, 2677–2689, https://doi.org/10.5194/tc-18-2677-2024, 2024. a, b
Ghiz, M. L., Scott, R. C., Vogelmann, A. M., Lenaerts, J. T. M., Lazzara, M., and Lubin, D.: Energetics of surface melt in West Antarctica, The Cryosphere, 15, 3459–3494, https://doi.org/10.5194/tc-15-3459-2021, 2021. a
Gibson, L. J. and Ashby, M. F.: Cellular Solids, Structure and Property, 2nd edn., Cambridge Solid State Science Series, Cambridge University Press, Cambridge, United Kingdom, 1999. a
Gow, A. J., Meese, D. A., and Bialas, R. W.: Accumulation variability, density profiles and crystal growth trends in ITASE firn and ice cores from West Antarctica, Ann. Glaciol., 39, 101–109, https://doi.org/10.3189/172756404781814690, 2004. a
Grinsted, A., Rathmann, N. M., Mottram, R., Solgaard, A. M., Mathiesen, J., and Hvidberg, C. S.: Failure strength of glacier ice inferred from Greenland crevasses, The Cryosphere, 18, 1947–1957, https://doi.org/10.5194/tc-18-1947-2024, 2024. a, b
Haran, T., Klinger, M., Bohlander, J., Fahnestock, M., Painter, T., and Scambos, T.: MEaSUREs MODIS Mosaic of Antarctica 2013–2014 (MOA2014) Image Map, Version 1, Boulder, Colorado USA, NASA National Snow and Ice Data Center Distributed Active Archive Center [data set], https://doi.org/10.5067/RNF17BP824UM, 2018. a
Haynes, D. F.: Effect of Temperature on the Strength of Snow-Ice, J. Glaciol., 22, 321–329, https://doi.org/10.3189/S0022143000014301, 1979. a, b, c, d, e
Hoffman, A.: Grounded Ice Crevasse expansion near the grounded bight of Thwaites Glacier, TIB Video Portal [video], https://doi.org/10.5446/62770, 2023a. a
Hoffman, A.: Grounded-ice crevasse expansion near the interior subglacial lakes beneath Thwaites Glacier, TIB Video Portal [video], https://doi.org/10.5446/62771, 2023b. a
Hoffman, A.: hoffmaao/thwaites_crevasses: crevasse segmentation initial release (v0.0.0), Zenodo [code], https://doi.org/10.5281/zenodo.14994659, 2025a. a
Hoffman, A.: hoffmaao/EarthMasker: earth masker initial release (v0.0.0), Zenodo [code], https://doi.org/10.5281/zenodo.14994657, 2025b. a
Hoffman, A. O., Christianson, K., Shapero, D., Smith, B. E., and Joughin, I.: Brief communication: Heterogenous thinning and subglacial lake activity on Thwaites Glacier, West Antarctica, The Cryosphere, 14, 4603–4609, https://doi.org/10.5194/tc-14-4603-2020, 2020. a
Hoffman, A. O., Christianson, K., Holschuh, N., Case, E., Kingslake, J., and Arthern, R.: The Impact of Basal Roughness on Inland Thwaites Glacier Sliding, Geophys. Res. Lett., 49, e2021GL096564, https://doi.org/10.1029/2021gl096564, 2022. a
Holt, J. W., Blankenship, D. D., Morse, D. L., Young, D. A., Peters, M. E., Kempf, S. D., Richter, T. G., Vaughan, D. G., and Corr, H. F. J.: New boundary conditions for the West Antarctic Ice Sheet: Subglacial topography of the Thwaites and Smith glacier catchments, Geophys. Res. Lett., 33, L09501, https://doi.org/10.1029/2005GL025561, 2006. a
Horlings, A. N., Christianson, K., Holschuh, N., Stevens, C. M., and Waddington, E. D.: Effect of horizontal divergence on estimates of firn-air content, J. Glaciol., 67, 287–296, https://doi.org/10.1017/jog.2020.105, 2021. a, b, c
Izeboud, M. and Lhermitte, S.: Damage detection on antarctic ice shelves using the normalised radon transform, Remote Sens. Environ., 284, 113359, https://doi.org/10.1016/j.rse.2022.113359, 2023. a, b, c, d
Jacobs, S. S., Hellmer, H. H., and Jenkins, A.: Antarctic Ice Sheet melting in the southeast Pacific, Geophys. Res. Lett., 23, 957–960, https://doi.org/10.1029/96gl00723, 1996. a
Jelitto, H. and Schneider, G.: A geometric model for the fracture toughness of porous materials, Acta Mater., 151, 443–453, https://doi.org/10.1016/j.actamat.2018.03.018, 2018. a, b, c
Jenkins, A., Dutrieux, P., Jacobs, S. S., McPhail, S. D., Perrett, J. R., Webb, A. T., and White, D.: Observations beneath Pine Island Glacier in West Antarctica and implications for its retreat, Nat. Geosci., 3, 468–472, https://doi.org/10.1038/ngeo890, 2010. a
Jenkins, A., Shoosmith, D., Dutrieux, P., Jacobs, S., Kim, T. W., Lee, S. H., Ha, H. K., and Stammerjohn, S.: West Antarctic Ice Sheet retreat in the Amundsen Sea driven by decadal oceanic variability, Nat. Geosci., 11, 733–738, https://doi.org/10.1038/s41561-018-0207-4, 2018. a
Jeong, S., Howat, I. M., and Bassis, J. N.: Accelerated ice shelf rifting and retreat at Pine Island Glacier, West Antarctica, Geophys. Res. Lett., 43, 11720–11725, https://doi.org/10.1002/2016GL071360, 2016. a
Joughin, I., Smith, B. E., Howat, I. M., Moon, T., and Scambos, T. A.: A SAR record of early 21st century change in Greenland, J. Glaciol., 62, 62–71, https://doi.org/10.1017/jog.2016.10, 2016. a
Joughin, I., Shapero, D., Smith, B., Dutrieux, P., and Barham, M.: Ice-shelf retreat drives recent Pine Island Glacier speedup, Sci. Adv., 7, eabg3080, https://doi.org/10.1126/sciadv.abg3080, 2021. a, b
Karidi, K.: Improvements to the CReSIS HF-VHF Sounder and UHF Accumulation Radar, Master's thesis, Electrical Engineering and Computer Science, University of Kansas, 2018. a
Lai, C.-Y., Kingslake, J., Wearing, M. G., Chen, P.-H. C., Gentine, P., Li, H., Spergel, J. J., and van Wessem, J. M.: Vulnerability of Antarctica's ice shelves to meltwater-driven fracture, Nature, 584, 574–578, https://doi.org/10.1038/s41586-020-2627-8, 2020. a, b, c, d, e, f, g
Lindner, F., Laske, G., Walter, F., and Doran, A. K.: Crevasse-induced Rayleigh-wave azimuthal anisotropy on Glacier de la Plaine Morte, Switzerland, Ann. Glaciol., 60, 96–111, https://doi.org/10.1017/aog.2018.25, 2019. a
Lomonaco, R., Albert, M., and Baker, I.: Microstructural evolution of fine-grained layers through the firn column at Summit, Greenland, J. Glaciol., 57, 755–762, 2011. a
MacClune, K. L., Fountain, A. G., Kargel, J. S., and MacAyeal, D. R.: Glaciers of the McMurdo dry valleys: Terrestrial analog for Martian polar sublimation, J. Geophys. Res.-Planets, 108, E4, https://doi.org/10.1029/2002JE001878, 2003. a
Maiti, S. K., Ashby, M. F., and Gibson, L. J.: Fracture toughness of brittle cellular solids, Scripta Metallurgy, 18, 213–217, 1984. a
Marsh, O., Price, D., Courville, Z., and Floricioiu, D.: Crevasse and rift detection in Antarctica from TerraSAR-X satellite imagery, Cold Reg. Sci. Technol., 187, 103284, https://doi.org/10.1016/j.coldregions.2021.103284, 2021. a, b, c, d
McClung, D. M.: In-Situ Estimates of the Tensile Strength of Snow Utilizing Large Sample Sizes, CRREL Report 78-27, 1978. a, b, c
Meier, M., Lundstrom, S., Stone, D., Kamb, B., Engelhardt, H., Humphrey, N., Dunlap, W. W., Fahnestock, M., Krimmel, R. M., and Walters, R.: Mechanical and hydrologic basis for the rapid motion of a large tidewater glacier: 1. Observations, J. Geophys. Res.-Sol. Ea., 99, 15219–15229, https://doi.org/10.1029/94jb00237, 1994. a
Morris, E. M. and Wingham, D. J.: Uncertainty in mass-balance trends derived from altimetry: a case study along the EGIG line, central Greenland, J. Glaciol., 61, 345–356, https://doi.org/10.3189/2015JoG14J123, 2015. a
Nath, P. C. and Vaughan, D. G.: Subsurface crevasse formation in glaciers and ice sheets, J. Geophys. Res.-Sol. Ea., 108, ECV 7-1–ECV 7-12, https://doi.org/10.1029/2001JB000453, 2003. a, b
Needell, C. and Holschuh, N.: Evaluating the Retreat, Arrest, and Regrowth of Crane Glacier Against Marine Ice Cliff Process Models, Geophys. Res. Lett., 50, e2022GL102400, https://doi.org/10.1029/2022GL102400, 2023. a
Nye, J. F.: A Method of Determining the Strain-Rate Tensor at the Surface of a Glacier, J. Glaciol., 3, 409–419, https://doi.org/10.3189/s0022143000017093, 1959. a, b
Nye, J. F. and Perutz, M. F.: The distribution of stress and velocity in glaciers and ice-sheets, P. Roy. Soc. Lond. A, 239, 113–133, https://doi.org/10.1098/rspa.1957.0026, 1957. a
Oraschewski, F. M. and Grinsted, A.: Modeling enhanced firn densification due to strain softening, The Cryosphere, 16, 2683–2700, https://doi.org/10.5194/tc-16-2683-2022, 2022. a, b
Parizek, B. R., Christianson, K., Alley, R. B., Voytenko, D., Vaňková, I., Dixon, T. H., Walker, R. T., and Holland, D. M.: Ice-cliff failure via retrogressive slumping, Geology, 47, 449–452, https://doi.org/10.1130/G45880.1, 2019. a
Pfeffer, W. T. and Bretherton, C. S.: The effect of crevasses on the solar heating of a glacier surface, IAHS Publ., 170, 191–205, 1987. a
Rignot, E., Echelmeyer, K., and Krabill, W.: Penetration depth of interferometric synthetic‐aperture radar signals in snow and ice, Geophys. Res. Lett., 28, 3501–3504, https://doi.org/10.1029/2000gl012484, 2001. a, b
Rignot, E., Mouginot, J., Scheuchl, B., Broeke, M. V. D., Wessem, M. J. v., and Morlighem, M.: Four decades of Antarctic Ice Sheet mass balance from 1979–2017, P. Natl. Acad. Sci. USA, 116, 1095–1103, https://doi.org/10.1073/pnas.1812883116, 2019. a, b
Rist, M. A., Sammonds, P. R., Murrell, S. A. F., Meredith, P. G., Doake, C. S. M., Oerter, H., and Matsuki, K.: Experimental and theoretical fracture mechanics applied to Antarctic ice fracture and surface crevassing, J. Geophys. Res.-Sol. Ea., 104, 2973–2987, https://doi.org/10.1029/1998jb900026, 1999. a, b
Rist, M. A., Sammonds, P. R., Oerter, H., and Doake, C. S. M.: Fracture of Antarctic shelf ice, J. Geophys. Res.-Sol. Ea., 107, ECV 2-1–ECV 2-13, https://doi.org/10.1029/2000jb000058, 2002. a, b, c
Ronneberger, O., Fischer, P., and Brox, T.: Medical Image Computing and Computer-Assisted Intervention – MICCAI 2015, 18th International Conference, 5–9 October 2015, Munich, Germany, Proceedings, Part III, Lecture Notes in Computer Science, 234–241, https://doi.org/10.1007/978-3-319-24574-4_28, 2015. a, b
Schlemm, T., Feldmann, J., Winkelmann, R., and Levermann, A.: Stabilizing effect of mélange buttressing on the marine ice-cliff instability of the West Antarctic Ice Sheet, The Cryosphere, 16, 1979–1996, https://doi.org/10.5194/tc-16-1979-2022, 2022. a
Schulson, E. M., Baker, I., Robertson, C. D., Bolon, R. B., and Harnimon, R. J.: Fractography of ice, J. Mater. Sci. Lett., 8, 1193–1194, https://doi.org/10.1007/BF01730067, 1989. a
Shepherd, A., Gilbert, L., Muir, A. S., Konrad, H., McMillan, M., Slater, T., Briggs, K. H., Sundal, A. V., Hogg, A. E., and Engdahl, M. E.: Trends in Antarctic Ice Sheet Elevation and Mass, Geophys. Res. Lett., 46, 8174–8183, https://doi.org/10.1029/2019gl082182, 2019. a
Smith, R.: The application of fracture mechanics to the problem of crevasse penetration, J. Glaciol., 17, 223–228, 1976. a
Smith, R.: Iceberg cleaving and fracture mechanics-a preliminary survey, in: Iceberg Utilization, 176–190, Elsevier, 1978. a
Smith, T. R., Schulson, M. E., and Schulson, E. M.: The fracture toughness of porous ice with and without particles, in: Proceedings of the Ninth International Conference on Offshore Mechanics and Arctic Engineering, vol. 4 of Antarctic Research Series, 241–247, American Society of Mechanical Engineers, 1990. a
SNAP: SNAP – ESA Sentinel Application Platform, S1TBX, https://step.esa.int/ (last access: June 2023), 2022. a
Surawy-Stepney, T., Hogg, A. E., Cornford, S. L., and Davison, B. J.: Episodic dynamic change linked to damage on the Thwaites Glacier Ice Tongue, Nat. Geosci., 16, 37–43, https://doi.org/10.1038/s41561-022-01097-9, 2023a. a, b, c, d, e, f, g, h
Surawy-Stepney, T., Hogg, A. E., Cornford, S. L., and Hogg, D. C.: Mapping Antarctic crevasses and their evolution with deep learning applied to satellite radar imagery, The Cryosphere, 17, 4421–4445, https://doi.org/10.5194/tc-17-4421-2023, 2023b. a, b, c, d
Ultee, L. and Bassis, J.: The future is Nye: an extension of the perfect plastic approximation to tidewater glaciers, J. Glaciol., 62, 1143–1152, https://doi.org/10.1017/jog.2016.108, 2016. a
van der Veen, C.: Fracture mechanics approach to penetration of surface crevasses on glaciers, Cold Reg. Sci. Technol., 27, 31–47, https://doi.org/10.1016/S0165-232X(97)00022-0, 1998. a, b, c
Vaughan, D. G.: Relating the occurrence of crevasses to surface strain rates, J. Glaciol., 39, 255–266, https://doi.org/10.3189/s0022143000015926, 1993. a, b, c, d, e, f, g, h, i, j
Veen, C. J. v. d.: Crevasses on glaciers, Polar Geogr., 23, 213–245, https://doi.org/10.1080/10889379909377677, 1999. a, b, c
Verjans, V., Leeson, A. A., McMillan, M., Stevens, C. M., van Wessem, J. M., van de Berg, W. J., van den Broeke, M. R., Kittel, C., Amory, C., Fettweis, X., Hansen, N., Boberg, F., and Mottram, R.: Uncertainty in East Antarctic Firn Thickness Constrained Using a Model Ensemble Approach, Geophys. Res. Lett., 48, e2020GL092060, https://doi.org/10.1029/2020GL092060, 2021. a
Warren, S. G.: Snow spikes (penitentes) in the dry Andes, but not on Europa: a defense of Lliboutry's classic paper, Ann. Glaciol., 63, 62–66, https://doi.org/10.1017/aog.2023.12, 2022. a
Weertman, J.: Can a water-filled crevasse reach the bottom surface of a glacier?, in: Symposium on the Hydrology of Glaciers, 139–145, Union Géodésique et Géophysique Internationale, Association Internationale d’Hydrologie Scientifique, Commission de Neiges et Glaces, Cambridge, UK, 1973. a
Williams, R. M., Ray, L. E., Lever, J. H., and Burzynski, A. M.: Crevasse Detection in Ice Sheets Using Ground Penetrating Radar and Machine Learning, IEEE J. Sel. Top. Appl. Earth Obs., 7, 4836–4848, https://doi.org/10.1109/JSTARS.2014.2332872, 2014. a, b
Zhao, J., Liang, S., Li, X., Duan, Y., and Liang, L.: Detection of Surface Crevasses over Antarctic Ice Shelves Using SAR Imagery and Deep Learning Method, Remote Sens., 14, 487, https://doi.org/10.3390/rs14030487, 2022. a, b, c
- Abstract
- Introduction
- Data and methods: from satellite SAR images to maps of crevasse area change
- Results
- Discussion
- Conclusions
- Code and data availability
- Video supplement
- Team list
- Author contributions
- Competing interests
- Disclaimer
- Acknowledgements
- Financial support
- Review statement
- References
- Supplement