the Creative Commons Attribution 4.0 License.
the Creative Commons Attribution 4.0 License.
Modelling GNSS-observed seasonal velocity changes of the Ross Ice Shelf, Antarctica, using the Ice-sheet and Sea-level System Model (ISSM)
Francesca Baldacchino
Nicholas R. Golledge
Mathieu Morlighem
Huw Horgan
Alanna V. Alevropoulos-Borrill
Alena Malyarenko
Alexandra Gossart
Daniel P. Lowry
Laurine van Haastrecht
The flow speeds of floating ice shelves around the Antarctic Ice Sheet exhibit clear intra-annual variability. However, the drivers of this variability remain poorly understood. Here, we present three new velocity datasets from Global Navigation Satellite System (GNSS) stations on the Ross Ice Shelf collected between early 2020 and late 2021 and show that they have two distinct peaks observed in austral summer and austral winter. These measurements do not appear to be consistent with the yearly cycle of sea surface height, which has previously been identified as a possible driver. We investigate the potential role of basal melt variability in ice flow speed and use the Ross Ice Shelf as a test bed. First we identify the regions where changes in melt would have the largest influence on ice speed at our GNSS sites using automatic differentiation. We then apply idealized sinusoidal perturbations to modelled basal melt rates at these specific locations to identify what magnitude of variability is needed to match the GNSS-observed changes in ice speed. We show that, while very local perturbations in basal melt can have a significant impact on ice flow speed, the amplitude of the perturbation required to match observations is significantly higher than expected, which may indicate that these perturbations are not realistic. We suggest that a combination of external forcings and internal mechanics may be needed to reproduce the observed intra-annual velocity variation at all the GNSS sites.
- Article
(8171 KB) - Full-text XML
- BibTeX
- EndNote
The Antarctic Ice Sheet (AIS) contains the vast majority of Earth's freshwater and has the potential to raise global sea levels by 58 m (Mottram et al., 2019; Schlegel et al., 2018; Dirscherl et al., 2020). In recent decades, the AIS has been losing mass at an accelerating rate due to the warming of the atmosphere and ocean (Pattyn et al., 2018; Shepherd et al., 2012, 2018; Jenkins et al., 2018; Rignot et al., 2019; Lipscomb et al., 2021). Ocean-forced basal melting and calving drive the largest mass losses on the AIS (Pattyn et al., 2018; Rignot et al., 2019; Adusumilli et al., 2020; Joughin et al., 2014). Floating ice shelves, in particular, provide buttressing to grounded ice and are thus vital for controlling AIS mass loss (Schoof, 2007; Gudmundsson, 2013; Dinniman et al., 2016; Joughin et al., 2013; Pattyn and Durand, 2013). Recent observations have shown that some of these ice shelves show clear intra-annual variability in ice flow (e.g. Gwyther et al., 2018; Greene et al., 2018; Holland et al., 2019; Jenkins et al., 2018). While this flow variability is generally attributed to variability in external environmental forcings, the exact mechanism responsible for speed changes remains unclear. Gwyther et al. (2018), for example, found that there was high interannual variability in the Totten Ice Shelf surface elevation, velocity, and grounding line location due to variability in basal melting. Greene et al. (2018) found that seasonal velocity variations observed at Totten Ice Shelf are due to seasonal variations in landfast sea ice concentrations at the calving front. More recently, Mosbeux et al. (2023) attributed the variability in the flow speed of the Ross Ice Shelf to seasonal changes in sea surface height (SSH).
Here, we focus on the Ross Ice Shelf (RIS), which is Antarctica's largest ice shelf by area and which is approximately in balance (Moholdt et al., 2014; Rignot et al., 2013; Depoorter et al., 2013). The RIS has typical flow speeds of several hundred metres per year, with the active Siple Coast ice streams and Byrd Glacier displaying velocities of > 300 m a−1 (Fig. 1). Global Navigation Satellite System (GNSS) receivers can record near-continuously at high temporal resolution throughout the year and thus have the ability to measure seasonal variations in ice velocities (Brunt, 2008; King et al., 2011; Brunt and Macayeal, 2014). Typically, GNSS receivers are employed to measure ice velocities over 1–3 months in the austral summer and to highlight short-timescale processes such as tidal variability (e.g. Bindschadler et al., 2003). In this study, we present three new long-duration (12–24 months) GNSS datasets of intra-annual ice velocity variations on the RIS. We explore three new sites: the shear margin (Site 1), the calving front near the Ross Island pinning point (Site 2), and the Kamb Ice Stream (KIS) grounding zone (Site 4; Fig. 1). Additionally, the GNSS dataset previously reported in Klein et al. (2020) and Mosbeux et al. (2023) (referred to as DR10 in previous studies and as Site 3 here) is explored in this study.
Previous multi-season GNSS observations on the RIS have noted intra-annual (monthly to seasonal) velocity variations, with one distinct peak per year in the austral winter (Klein et al., 2020; Mosbeux et al., 2023). Two mechanisms have been proposed to explain this intra-annual variability. First, Klein et al. (2020) investigated the impact of a seasonal cycle of spatially varying basal melt rates on the RIS using ice sheet modelling. Klein et al. (2020) used monthly basal melt rates from the ocean model described by Tinto et al. (2019). This ocean model was developed using a repeated annual cycle of forcing for the period 2001–2002 and therefore does not account for known interannual variability in atmospheric, oceanic, and sea ice conditions in the Ross Sea (Klein et al., 2020). They found that their modelled seasonal flow variations from basal melting were much smaller than the GNSS-observed ones (Klein et al., 2020). Therefore, Klein et al. (2020) concluded that the GNSS-observed intra-annual velocity variations on the RIS are most likely not driven by seasonal basal melt rates and that some other seasonal forcing must be dominant. Mosbeux et al. (2023) used ice sheet modelling to investigate whether the seasonal variability of SSH would modify ice velocity through a combination of sea surface tilt and changing basal stresses in the grounding zone. Mosbeux et al. (2023) successfully reproduced the GNSS-observed intra-annual velocity variability at their GNSS sites when a sufficiently large cycle of SSH-induced basal shear stress change near the grounding line was parameterized in their ice sheet model. They found that, in order to capture the observed change in flow speed, they had to allow for the model grounding line to retreat significantly further upstream than what hydrostatic equilibrium would dictate, using a parameterization of viscoelastic processes (Mosbeux et al., 2023). More importantly, Mosbeux et al. (2023) modelled SSH-forced velocity variability with one distinct peak per year, in contrast to our GNSS observations, which all display two distinct peaks per year. This suggests that seasonal variability in SSH may not be the only forcing that explains the observed variability in velocities at our GNSS sites. To address this question, we turn again to the potential role of basal melt variability as it is known to be an important control on ice shelf dynamics.
The RIS basal melt rates are relatively low due to the cold dense water masses formed on the continental shelf blocking the sub-ice-shelf ocean cavity from warm Circumpolar Deep Water (CDW) intrusions (Moholdt et al., 2014; Stevens et al., 2020; Adusumilli et al., 2020). However, basal melt rates of the RIS vary spatially as they are driven by sub-surface inflows of cold High Salinity Shelf Water (HSSW) that reach the grounding zone and seasonal inflows of summer-warmed Antarctic Surface Water (AASW) at the calving front (Stewart et al., 2019; Stevens et al., 2020; Klein et al., 2020; Jendersie et al., 2018; Dinniman et al., 2016; Adusumilli et al., 2020). Recently, high basal melt rates were observed at the calving front near Ross Island due to the seasonal inflow of summer-warmed AASW from the adjacent Ross Sea polynya downwelling into the ice shelf cavity (Stewart et al., 2019; Malyarenko et al., 2019). Previous studies have suggested that RIS velocities may be modulated at seasonal to intra-annual timescales by basal melting at the calving front (Stewart et al., 2019; Tinto et al., 2019).
Here, we first map the sensitivity of ice flow speed at all available GNSS sites to basal melting to identify the regions of the RIS that are most sensitive to changes in basal melt. We then apply idealized sinusoidal perturbations to weekly MITgcm basal melt rates to identify what magnitude of variability is needed to match the GNSS-observed changes in ice speed. We conclude by discussing how realistic these perturbations are and whether basal melt variability could be the driver of the observed intra-annual changes in flow speed.
2.1 Global Navigation Satellite System locations
We first present results from three new GNSS sites (Sites 1, 2, and 4) and a previously reported GNSS site (Site 3) (Mosbeux et al., 2023; Klein et al., 2020) on the Ross Ice Shelf (Fig. 1). The three new GNSS units were installed during the 2019/2020 austral summer and the data were downloaded in December 2021 (Sites 1, 2, and 4 in Fig. 1). The geodetic-grade GNSS units were battery-powered and deployed year-round on the RIS to provide long-term continuous observations of intra-annual velocity variability. GNSS observations from Site 3 were previously reported by Klein et al. (2020). Site 3 recorded between November 2015 and December 2016 and is described in more detail in Klein et al. (2020), where it is referred to as DR10 (Fig. 1).
Site 1 is located close to Ross Island, which is a major pinning point, making it a sensitive region where changes in ice thickness are expected to influence the flow speed of the entire ice shelf (Gudmundsson et al., 2019; Fürst et al., 2016; Baldacchino et al., 2022; Reese et al., 2018) (Fig. 1). Pinning points such as Ross Island provide resistance to ice shelf flow by modifying the balance of forces within the floating ice (Still et al., 2019; Cuffey and Paterson, 2010). This modification of forces has an effect everywhere on the ice shelf due to the balance of forces in floating ice being non-local (Still et al., 2019; Cuffey and Paterson, 2010). High basal melt rates with a seasonal signal have been observed close to the Ross Island pinning point (Stewart et al., 2019). The Site 1 GNSS unit recorded every 30 s for 1 h every 6 h and has 80 d of data missing in July–October 2020 and 70 d in July–September 2021.
Site 2 is located close to the ice front approximately 50 km from Ross Island and is expected to be influenced by seasonal changes in basal melting (Fig. 1). High basal melt rates have been observed in this region and correlate with declines in sea ice cover and warming of the AASW during the austral summer (Stewart et al., 2019). Site 2 is located within the “passive” region of the ice shelf, and thus this region can be removed without reducing the buttressing potential of the ice shelf (Fürst et al., 2016). The Site 2 GNSS unit recorded every 30 s and has 104 d of data missing in June–November 2020 and 30 d in July–August 2021.
Site 3 is located in the mid-shelf region of the RIS (200 km from the calving front) and is the same site (referred to as DR10) previously reported in Klein et al. (2020) and Mosbeux et al. (2023) (Fig. 1). Ice flow in the central portion of the RIS is primarily extensional, which leads to along-flow thinning (Das et al., 2020). There are no pinning points or ice rises within 300 km of Site 3 and no observations of high basal (Adusumilli et al., 2020) or surface (Agosta et al., 2019) melt rates here. The Site 3 GNSS unit recorded every 30 s for 1 year (2015–2016), with a few days dropped in the austral winter of 2016 (Klein et al., 2020).
Finally, Site 4 is located at the KIS grounding line (Fig. 1). The KIS has been inactive for the last 160 years, likely due to a change in the subglacial hydrology (Retzlaff and Bentley, 1993; Thomas et al., 2013; Hulbe et al., 2016). The KIS used to flow at a speed of 350 m a−1 but currently flows at speeds of less than 5 m a−1 (Rignot et al., 2017; Ng and Conway, 2004). Studies have indicated that the KIS could reactivate this century due to its hydrological setting and the length of time it has been inactive (Bougamont et al., 2015; van der Wel et al., 2013). The Site 4 GNSS unit recorded every 30 s and operated continuously but was shifted approximately 2.7 km upstream in December 2020.
2.2 Global Navigation Satellite System processing
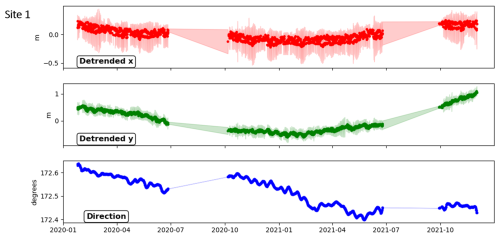
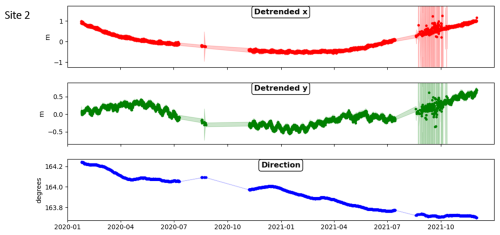
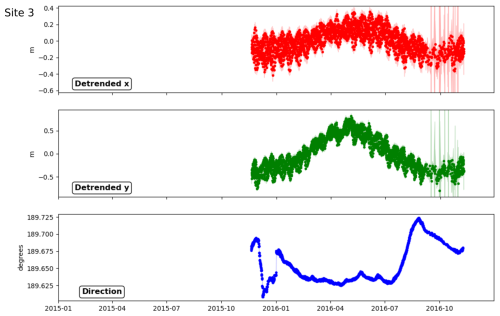
GNSS data were processed using the precise point positioning (PPP) methodology (Zumberge et al., 1997; Tétreault et al., 2005) and Natural Resources Canada's Canadian Spatial Reference System Precise Point Positioning (CSRS-PPP) post-processing service (https://webapp.csrs-scrs.nrcan-rncan.gc.ca/geod/tools-outils, last access: 15 August 2023). For the 30 s sampled continuous data (Sites 2, 3, and 4), data were divided into 3 h segments and processed statically to obtain a single position every 3 h. For Site 1, which has a different sampling frequency, the data were divided into 1 h segments every 6 h and a single position was obtained every 6 h. Data processing was iterated whereby the initial positions were updated with the first processing results and then reprocessed to obtain new position solutions. The position solutions were then projected into polar-stereographic coordinates (EPSG:3031) and used to estimate site velocity by weighted linear regression through x and y coordinates. The position weightings were provided by the reported processing uncertainty. Regression gradients provided velocities in the x and y directions (vx, vy), with gradient uncertainties propagated to provide uncertainties in velocity and direction. The linear regression of positions was estimated at every time step (either 3-hourly or 6-hourly) over centred time windows of 8 weeks in duration. This provides a low-noise time series with a high temporal fidelity (albeit smoothed) that shows the seasonal cycle in velocity without aliasing spring–neap tidal velocity signals. The use of the 8-week duration to estimate velocity means that otherwise rapid changes in velocity are smoothed over an 8-week period. Other time window lengths were tested and the seasonal signal was found to be largely independent of the length used. The resulting uncertainties are low, with 99 % of the 1σ velocity uncertainties less than 0.04 m a−1 for Sites 1 and 3, less than 0.06 m a−1 for Site 2, and less than 0.01 m a−1 for Site 4. We present all velocities as absolute velocity (Fig. 2) and as the deviation from the initial velocity to facilitate comparison with the modelling results (Fig. 4). We also present detrended position and direction results for each site (Figs. A1–A4).
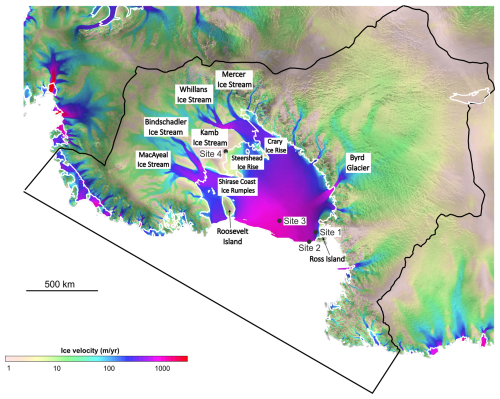
Figure 1GNSS station locations overlain on modelled Ross Ice Shelf surface velocities. The grounding line is marked in white. The GNSS sites shown are Site 1 (shear margin region), Site 2 (calving front), Site 3 (mid-shelf region), and Site 4 (KIS grounding zone). Other locations discussed in this study are also labelled. These are the Siple Coast ice streams: Mercer Ice Stream (MIS), Whillans Ice Stream (WIS), Kamb Ice Stream (KIS), Bindschadler Ice Stream (BIS), and MacAyeal Ice Stream (MacIS). Byrd Glacier (BG) and Ross Island are also labelled. In addition, the ice rises are labelled on the Siple Coast: Crary Ice Rise (CIR), Steershead Ice Rise (SIR), Shirase Coast Ice Rumples (SCIR), and Roosevelt Island. The projection of this map and all the others presented is polar-stereographic with a true scale at −71° (EPSG:3031).
2.3 Automatic differentiation
We use automatic differentiation (AD; Sagebaum et al., 2019) in the Ice-sheet and Sea-level System Model (ISSM) to explore the influence that changes in basal melt have on the ice velocity at each GNSS site. The complete model description is available in Baldacchino et al. (2022). Here, instead of computing the sensitivity of the model's final volume above flotation, we are interested in the sensitivity of the model velocity at these four GNSS sites. AD allows us to efficiently map how much the velocity at each site would be affected if we perturb the ocean-induced melt at the scale of the model mesh.
The model domain covers the entire RIS and has a non-uniform mesh with resolutions of 1 km at the grounding lines and at the shear margins, 20 km in the ice sheet interior, and at most 10 km within the ice shelf. The basal friction coefficient over grounded ice and the ice viscosity parameter of the floating ice, B, are inferred through a data assimilation technique (Morlighem et al., 2010, 2013) to reproduce observed InSAR surface velocities from the MEaSURES dataset (Rignot et al., 2017; Baldacchino et al., 2022). Environmental boundary conditions include RACMO2.3p2 surface mass balance (van Wessem et al., 2018) and Massachusetts Institute of Technology general circulation model (MITgcm) basal melt rates (Losch, 2008; Holland and Jenkins, 1999; Davis and Nicholls, 2019; Baldacchino et al., 2022). The ice sheet model is run forward for 20 years to allow the grounding line position and ice geometry to relax.
After relaxation, we run the AD model for 6 months and evaluate the sensitivity of the final velocity at each of the four GNSS sites to perturbations in basal melting rates under floating ice (). Automatic differentiation provides the gradient of the final velocity at each site, vi, to basal melt: . In other words, the first-order response of the velocity to a given perturbation in (where ϵ∈ℝ, and is defined over the entire model domain Ω that can be spatially variable) is given by
The gradient, (m−2), therefore highlights the regions where the modelled velocity at a given site is most sensitive to changes in and the regions where changes in would not affect the final velocity at first order.
This approach provides four sensitivity maps, one for each site. Figure A5 shows the areas where this sensitivity is higher than our threshold value of m−2. The sensitivity threshold value of m−2 is chosen to highlight the areas sensitive to basal melt changes. Choosing a lower sensitivity threshold would enlarge the surface area over which the perturbation would need to be applied, and a higher sensitivity threshold would have the opposite effect. We chose a sensitivity value of m−2 to highlight areas of high sensitivity over a surface area that is not too restrictive or extensive across the ice shelf (Fig. A5). We also include a lower sensitivity value of m−2 (Fig. A6) in our experiments to highlight that the modelled velocity variations are similar for both sensitivity thresholds. These sensitive regions, highlighted in dark red, show where an increase in basal melt rates leads to an increase in ice velocity for each site and therefore where changes in melt rates would impact ice velocity at these sites the most. Finally, we perform additional experiments where we only perturb the basal melt rates in the identified sensitive regions close to the Ross Island pinning point (Fig. A7). These experiments are performed to understand whether changes in basal melting at the calving front can solely reproduce the intra-annual velocity variations observed at the GNSS sites.
2.4 Modelled perturbed basal melt
We next perform a set of modelling experiments within ISSM to identify what magnitude of basal melt variability is needed to match the GNSS-observed changes in ice speed. In these modelling experiments, the MITgcm baseline basal melt rates are perturbed seasonally (using a sine function that includes both melting and refreezing) (Figs. A8 and A9) in regions identified as highly sensitive in the final AD map for each GNSS site:
where MITgcm(t) is the unperturbed melt rate from the MITgcm (Fig. A8) and p is the amplitude of the perturbation, taken here as 0, 20, 40, 60, or 80 m a−1. A sine function with two peaks is used to simulate two basal melt peaks per year (Fig. A9). These peaks occur in April and October using the +π phase shift. Two basal melt peaks per year are needed to reproduce the observed intra-annual velocities at the GNSS sites. The unperturbed MITgcm basal melt rates display a seasonal signal with a clear peak in the austral summer and multiple smaller peaks throughout the year, highlighting the fact that the basal melt rates already have large intra-annual variability (Fig. A8). However, the amplitude of this seasonal variability in the baseline MITgcm basal melt rates is not large enough and the phasing is incorrect for reproducing the GNSS-observed velocity variability. The model is run forward for an additional 20 years to allow the geometry and grounding line to stabilize using the same model set-up as described above (Sect. 2.3).
2.5 Modelled seasonal sea surface height
As discussed previously, Mosbeux et al. (2023) showed that variability in the RIS velocities can be attributed to seasonal variability in SSH. To explore this potential driver of velocity variability for our new GNSS datasets, we force our model with the SSH perturbations that Mosbeux et al. (2023) used in their study. Mosbeux et al. (2023) interpolated the SSH forcing from the ocean model of Tinto et al. (2019) as a monthly forcing and applied a parameterization of the friction in the grounding zone (refer to Mosbeux et al., 2023, for further details). We interpolate the SSH forcing onto our ISSM grid for the RIS, following the same model set-up described in Sect. 2.3. Mosbeux et al. (2023) highlight that there are two main effects of SSH variability on ice shelf velocities: (1) changes in driving stress and (2) changes in basal stress through grounding line migration. Our modelling experiments only account for hydrostatic-based grounding line migration and therefore do not account for the potential role of viscoelasticity (similar to modelling experiment ΔLB2 in Mosbeux et al., 2023).
3.1 GNSS velocities
3.1.1 Site 1
GNSS velocity observations for Site 1 are presented in Fig. 2. Site 1 velocities range from a maximum of 447 m a−1 to a minimum of 441 m a−1, with a clear decrease in the velocities of 4 m a−1 over the 2 years (Fig. 2). Figure 2 displays an intra-annual signal with two velocity peaks: one in June (austral winter) and one in January (austral summer). These velocity peaks are preceded by periods of acceleration (April–June and November–January) and periods of deceleration (February–April and July–October) (Fig. 2). Accelerations of 2 m a−1 for the peak in June 2020, 1.5 m a−1 for the peak in January 2021, and 1.5 m a−1 for the peak in June 2021 highlight the largest seasonal velocity variations at Site 1 (Fig. 2).
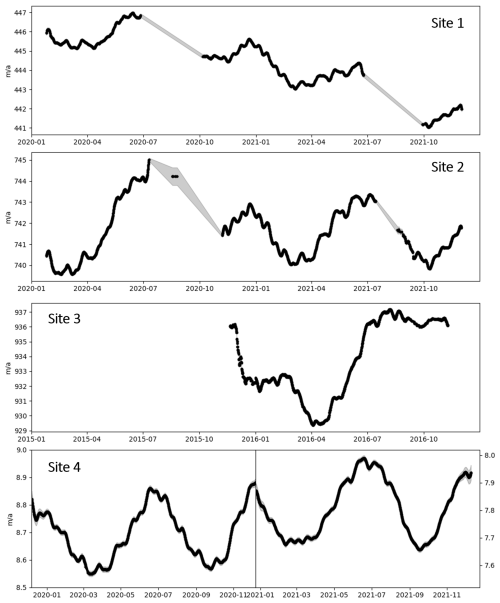
Figure 2The GNSS velocities (m a−1) at Site 1 (shear margin region), Site 2 (calving front), Site 3 (mid-shelf region), and Site 4 (KIS grounding zone). The uncertainties are provided in the grey windows enclosing the black lines. These uncertainties are not visible in a few places, as they are very small. The detrended position and direction for each site are shown in Figs. A1–A4.
3.1.2 Site 2
GNSS velocity observations for Site 2 are presented in Fig. 2. The velocities range from a maximum of 745 m a−1 to a minimum of 739 m a−1, with a clear intra-annual signal observed at Site 2 (Fig. 2). Two distinct velocity peaks are observed at Site 2: one in December (austral summer) and one in July (austral winter). These velocity peaks are preceded by periods of acceleration (April–July and October–December) and periods of deceleration (January–April and July–October) (Fig. 2). An acceleration of 5 m a−1 for the peak in July 2020, an apparent acceleration of 1.5 m a−1 for the peak in December 2020 (the lower limit was not observed), and an acceleration of 3 m a−1 for the peak in July 2021 highlight the largest seasonal velocity variations at Site 2 (Fig. 2). Site 2 displays a larger maximum velocity of 745 m a−1 compared to Site 1's maximum velocity of 447 m a−1.
3.1.3 Site 3
GNSS velocity observations for Site 3 range from a maximum of 937 m a−1 to a minimum of 929 m a−1 and thus display higher maximum velocities compared to Sites 1 and 2 (Fig. 2). However, Site 3's intra-annual signal is different to those of Sites 1 and 2, with a small peak observed in March (austral summer) and a large peak observed in August (austral winter) (Fig. 2). These velocity peaks are preceded by periods of acceleration (January–March and April–August) and periods of deceleration (March–April and September–December) (Fig. 2). A small acceleration of 1 m a−1 for the peak in March 2016 and a much larger acceleration of 8 m a−1 for the peak in August 2016 are observed (Fig. 2). Site 3 was also presented in Klein et al. (2020) and Mosbeux et al. (2023) (referred to as DR10), and they display similar results to ours. Both studies display a small velocity peak in January and a large velocity peak in July (Klein et al., 2020; Mosbeux et al., 2023). The velocity variability ranges from −6 m a−1 in March to +6 m a−1 in July, which is a similar range of velocity values to that found in this study (−7 m a−1 in April to +1 m a−1 in August) (Fig. 4). However, our velocity peaks (March and August) are offset by 1–2 months compared to the findings presented in Klein et al. (2020) and Mosbeux et al. (2023). These differences in the phasing of the intra-annual velocity variability are likely due to small differences in the methodologies of the studies, such as the use of T_TIDE analysis (Pawlowicz et al., 2002) and the time window used to smooth the datasets.
3.1.4 Site 4
The stagnation of the KIS results in Site 4's low velocities compared to Sites 1, 2, and 3 (Fig. 2). Site 4 displays a clear intra-annual signal which is similar to those of Sites 1 and 2 (Fig. 2). Two velocity peaks are observed at Site 4 for the years 2020 and 2021: one in December (austral summer) and one in June (austral winter) (Fig. 2). Site 4 has the most complete record of GNSS velocity measurements for 2 years and thus highlights the intra-annual velocity variation clearly. These velocity peaks are preceded by periods of acceleration (March–June and October–December) and periods of deceleration (January–March and July–August) (Fig. 2). Site 4 displays small accelerations of 0.4 m a−1 for the peak in June 2020, 0.3 m a−1 for the peak in December 2020, 0.3 m a−1 for the peak in July 2021, and 0.3 m a−1 for the peak in December 2021 (Fig. 2). The magnitude of the intra-annual variability at each site scales with the distance from the calving front, as also observed by Klein et al. (2020).
A fortnightly signal is found in the displacement at all the GNSS sites, and we attribute this to the response of the ice shelf to spring–neap variability in the tidal cycle (Padman et al., 2003; Ray et al., 2021; Rosier and Gudmundsson, 2020). This fortnightly tide-forced variability is dampened by our use of an 8-week window for our velocity estimates (Mosbeux et al., 2023).
3.2 Sensitivity maps
The AD-model-produced sensitivity maps show that high sensitivity is observed at the pinning points and ice rises downstream of the Siple Coast ice streams (i.e. Roosevelt Island, Crary Ice Rise, Steershead Ice Rise, and the Shirase Coast Ice Rumples) for all the GNSS sites (Figs. 1 and 3). For Sites 1, 2, and 3 we also see high sensitivity to changes in basal melting at the calving front near the Ross Island pinning point. Changes in basal melting can result in detachment from pinning points and ice rises, resulting in changes in ice speed (Still et al., 2019; Baldacchino et al., 2022; Reese et al., 2018). Ross Island is a structurally critical region, and Gudmundsson et al. (2019) found that melting there influences the flow speed of the entire RIS. Our sensitivity maps confirm this finding, highlighting that changes at and/or near the Ross Island pinning point influence velocities at Sites 1, 2, and 3. It is also important to highlight that Sites 1 and 2 are situated close to the Ross Island pinning point and thus have high sensitivity to local changes in basal melt.
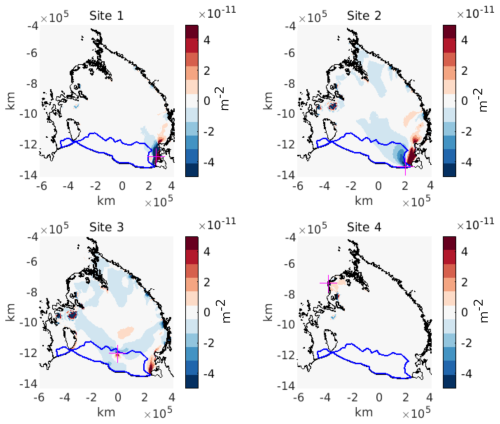
Figure 3Sensitivity maps of the final velocity at each of the four GNSS sites to basal melt rates under floating ice over 20 years (m−2). The sensitivity maps highlight that an increase (red) or decrease (blue) in basal melt rates in identified sensitive regions increases or decreases the velocities at the GNSS sites. The grounding line (black line) and passive ice (blue line) on the RIS identified by Fürst et al. (2016) are highlighted. The GNSS sites are identified using pink markers.
Additionally, high sensitivity is observed at the Siple Coast ice streams and Byrd Glacier grounding lines for Sites 2 and 3 (Figs. 1 and 3). The grounding lines show high sensitivity because changes in basal melting there can lead to changes in basal friction and grounding line retreat (Baldacchino et al., 2022). These changes in basal friction can drive changes in the ice streams and outlet glaciers' flow dynamics and discharge (Baldacchino et al., 2022; Pattyn, 2017; Shepherd et al., 2018). We observe high sensitivity in the near-stagnant KIS grounding zone for Site 4 and no sensitivity elsewhere for this GNSS site. This high sensitivity in the KIS grounding zone highlights that local changes in basal melt in the grounding zone can influence the velocities at Site 4 and that changes in basal melt elsewhere on the ice shelf do not affect Site 4 velocities.
Finally, high sensitivity within the interior of the ice shelf and directly downstream of active ice streams and outlet glaciers is observed for GNSS Sites 2 and 3 (Figs. 1 and 3). Sensitivity to changes in basal melting is also observed in the passive region (blue outline in Fig. 3 identified by Fürst et al., 2016) for Sites 2 and 3. This indicates that local changes in basal melt affect the velocities at Sites 2 and 3 as both these sites are located in the passive region. Overall, the sensitivity maps show that the velocities of GNSS Sites 2 and 3 have high sensitivity to basal melting across the majority of the ice shelf compared to Sites 1 and 4, which have higher sensitivities to local changes in basal melting.
3.3 Modelled velocities
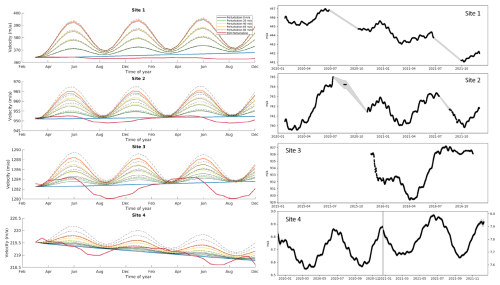
The modelled velocity variations are compared to the GNSS velocity variations (change from the initial velocity) for each site in Fig. 4. We model two distinct velocity peaks: one in January (austral summer) and one in June (austral winter) for the experiments using our idealized sinusoidal basal melt perturbation in the identified sensitive regions. For all the GNSS sites, we observe that the intra-annual velocity variation is small when we perturb the basal melt rates by a magnitude of 20 m a−1, and this intra-annual velocity variation quadruples when we perturb the basal melt rates by a magnitude of 80 m a−1 (Fig. 4). Figure 4 shows that for Sites 1, 2, and 3 the use of the lower sensitivity threshold (dotted black line) did not significantly affect the final modelled velocity variations. Additionally, Fig. 4 shows that for Sites 1, 2, and 3 the perturbation of basal melt rates close to Ross Island (solid black line) produces velocity variations that are similar to the other model experiments. However, for Site 4 the velocity variations are much smaller, even when large amplitudes are employed for the perturbation.
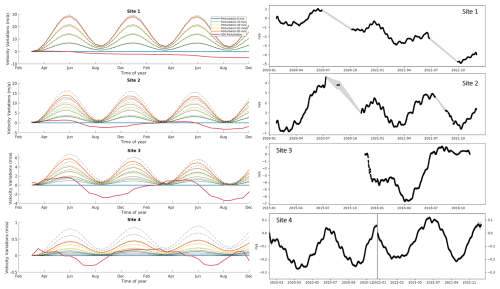
Figure 4The modelled (left) and GNSS (right) velocity variations (m a−1) at each GNSS site: Site 1 (shear margin region), Site 2 (calving front), Site 3 (mid-shelf region), and Site 4 (KIS grounding zone). The dotted black line represents the additional sensitivity threshold value experiment (lower sensitivity value of m−2) and the solid black line represents the additional sensitivity experiment where we only perturbed the basal melt rates close to Ross Island. Note here that we are comparing velocity changes induced by perturbed basal melt rates in identified sensitive regions to velocity changes induced by raw SSH over the entire domain.
Our basal-melt-perturbed model produces intra-annual variations in velocity at Site 1 ranging from 1 to 5 m a−1 for the 20 m a−1 basal melt perturbation and from 6 to 28 m a−1 for the 80 m a−1 basal melt perturbation (Fig. 4). An increase of 4 m a−1 for the velocity peaks in January and June is observed in the 20 m a−1 basal-melt-perturbed model experiments, which is most similar to Site 1's GNSS-observed accelerations of 2 m a−1 for the velocity peak in June 2020, 1.5 m a−1 for the velocity peak in January 2020, and 1.5 m a−1 for the velocity peak in June 2021 (Fig. 4). The seasonal SSH-perturbed model displays little to no intra-annual velocity variability for Site 1 (Fig. 4).
The basal-melt-perturbed modelled intra-annual velocity variations at Site 2 range from 0 to 3 m a−1 for the 20 m a−1 basal melt perturbation and from 2 to 13 m a−1 for the 80 m a−1 basal melt perturbation (Fig. 4). The phasing of the modelled velocity peaks (January and June) is offset by 1 month compared to the GNSS-observed velocity peaks (December and July) (Fig. 4). However, the 20 m a−1 basal-melt-perturbed modelled velocity variation is similar in amplitude to the GNSS velocity variations. An increase of 3 m a−1 for the peaks in January and June is observed in the 20 m a−1 basal-melt-perturbed model experiments, which is most similar to Site 2's GNSS-observed accelerations of 5 m a−1 for the peak in July 2020, 1.5 m a−1 for the peak in December 2020, and 3 m a−1 for the peak in July 2021 (Fig. 4). The seasonal SSH-perturbed model displays an intra-annual velocity variability with a different phasing but similar amplitude to the GNSS observations at Site 2 (Fig. 4). The SSH-forced velocities display one distinct peak per year (late May), with a velocity minimum in August (Fig. 4).
For Site 3, the modelled intra-annual velocity variations range from 0 to 1 m a−1 for the 20 m a−1 basal melt perturbation and from 1.5 to 4 m a−1 for the 80 m a−1 basal melt perturbation (Fig. 4). The phasing of the modelled velocity peaks (January and June) is offset by a couple of months compared to the GNSS-observed velocity peaks (March and August) (Fig. 4). Additionally, increases of 1 m a−1 for the peak in March and 8 m a−1 for the peak in August are observed by the GNSS receiver at Site 3 (Fig. 4). None of the basal-melt-perturbed modelled velocity variations captures an acceleration of 8 m a−1 in August (Fig. 4). We model two velocity peaks, whereas Klein et al. (2020) modelled one velocity peak in late May, with a smaller velocity range (−0.18 to +0.18 m a−1). Furthermore, the seasonal SSH-perturbed model displays an intra-annual velocity variability with a different phasing to the GNSS observations (Fig. 4), but the amplitude of the velocity variations is most similar to the observations. The SSH-forced velocities display a velocity maximum in May and a velocity minimum in August. Mosbeux et al. (2023) modelled a velocity peak in August for Site 3, highlighting that our modelled velocity peak is offset by a couple of months. This may be due to our modelling experiments not taking into account the potential role of viscoelasticity.
Finally, the modelled intra-annual velocity variations at Site 4 range from 0.01 to 0.04 m a−1 for the 20 m a−1 basal melt perturbation and from 0.04 to 0.15 m a−1 for the 80 m a−1 basal melt perturbation (Fig. 4). The phasing of the modelled velocity variations is similar to the GNSS-measured velocity variations, with a clear intra-annual signal observed. The modelled velocity peaks occur in January and June, which is similar to the GNSS-measured velocity peaks at the end of December and in June (Fig. 4). However, none of the modelled velocity variations of the basal melt perturbation experiments could reproduce the amplitudes of the GNSS-observed velocity variations. There were increases of 0.4 m a−1 for the peak in June 2020, 0.3 m a−1 for the peak in December 2020, 0.3 m a−1 for the peak in July 2021, and 0.3 m a−1 for the peak in December 2021 (Fig. 4). An increase of 0.11 m a−1 for the peaks in January and June is observed in the 80 m a−1 basal-melt-perturbed model experiments and is most similar to the GNSS-measured velocity variations at Site 4. The seasonal SSH-perturbed model displays an intra-annual velocity variability with only one velocity peak per year (February) (Fig. 4), but the amplitude of the velocity variations is most similar to the GNSS observations, ranging from −0.4 to 0.3 m a−1 (Fig. 4).
4.1 Local perturbations
In this study, instead of perturbing basal melt rates uniformly everywhere, as has been done previously (Klein et al., 2020), we only perturb basal melt rates in identified sensitive regions of the ice shelf. Our sensitivity maps highlight that very local perturbations in basal melt can have a significant effect on the ice flow speed, sometimes 1000 km away from GNSS sites (Fig. 3). We find that GNSS Sites 1, 2, and 3 are most sensitive to local perturbations in basal melt rates near the Ross Island pinning point. This can be explained by the loss of buttressing force triggered by ice shelf thinning near the Ross Island pinning point. This loss of buttressing force is due to reduced ice thickness near the Ross Island pinning point and a decreased transmission of stresses from the pinning point to the rest of the ice shelf. Previous studies have shown that Ross Island is an important pinning point for the RIS, with changes in ice thickness here found to significantly impact the overall ice shelf dynamics (Reese et al., 2018; Gudmundsson et al., 2019). Ice shelf thinning can reduce the buttressing force exerted by these pinning points (Larter, 2022; Arndt et al., 2018; Joughin et al., 2021; Dupont and Alley, 2005; Gudmundsson et al., 2019). Our sensitivity maps confirm this finding, highlighting that the ice speeds of Sites 1, 2, and 3 are highly sensitive to local changes in basal melt at the calving front near the Ross Island pinning point.
Furthermore, we find that, at GNSS Site 4, ice speed is most sensitive to local perturbations in basal melt rates in the KIS grounding zone, with changes in basal melt elsewhere on the ice shelf having almost no impact on ice speed at this site. Changes in basal melting near the grounding zones generally lead to ice thinning and grounding line retreat (Baldacchino et al., 2022; Ranganathan et al., 2021), which induces an increase in flow speed. Additionally, ice thinning reduces the buttressing effect from ice rises downstream of the KIS grounding zone, which drive changes in the velocities at Site 4 and elsewhere on the ice shelf.
4.2 Magnitude of variability
We perturb the basal melt rates to peak in April and October in order to match the observed intra-annual velocity variability on the ice shelf (Figs. 2 and 4). Current basal melt observations display large variability in melt rates throughout the year at the calving front near Ross Island, with large basal melt peaks in the austral summer (January–March) of >3 m a−1 and smaller basal melt peaks in the early (April and/or May) and late (October and/or November) austral winter of 1–2 m a−1 (Stewart et al., 2019; Jendersie et al., 2018; Årthun et al., 2013). These basal melt peaks in the early winter are due to the remnant heat from the summer AASW inflow and in late winter are due to the inflows of HSSW into the ice shelf cavity, when high heat loss and sea ice production lead to active cross-frontal flow that ventilates the cavity (Stewart et al., 2019; Jendersie et al., 2018; Årthun et al., 2013). These smaller basal melt peaks in the early and late austral winter align with the sinusoidal phasing of our idealized basal melt perturbations. However, we do not capture the variability in basal melt during the rest of the year or the significantly larger basal melt peaks observed in the austral summer (January–March) (Stewart et al., 2019) (Figs. A8 and A9). Therefore, our idealized sinusoidal perturbed basal melt rates do not align with current observations of basal melting on the RIS.
Additionally, we perturb the basal melt rates with a range of magnitudes (20–80 m a−1) to try to match the observed intra-annual velocity variability on the ice shelf. Our results show that we need to perturb the basal melt rates near the Ross Island shear zone by a magnitude of 20 m a−1 for Sites 1 and 2 to match the GNSS observations (Figs. 3, 2, and 4). Our AD-inferred sensitivity map shows that we do not need 20 m a−1 of perturbation under the entire ice shelf but only over 2 % of the ice shelf (i.e. the identified sensitive regions). The RIS has low annual average basal melt rates across the ice shelf (0–1 m a−1), with the highest average basal melt rates observed at the ice shelf front (>3 m a−1) near the Ross Island pinning point (Stewart et al., 2019; Stevens et al., 2020; Das et al., 2020; Adusumilli et al., 2020; Schodlok et al., 2016; Assmann et al., 2003; Holland et al., 2003; Stern et al., 2013). Recently, Stewart et al. (2019) observed high austral summer basal melt rates of 10–50 m a−1 at the calving front near Ross Island, due to the seasonal inflow of summer-warmed AASW from the adjacent Ross Sea polynya downwelling into the ice shelf cavity. However, these observed higher basal melt rates occur during the austral summer, and we perturb basal melt rates with magnitudes of ≥20 m a−1 in the early and late austral winter. For Site 4 we also need to perturb the basal melt rates with significantly high magnitudes (80 m a−1) in the KIS grounding zone, and Siple Coast ice rises to match the GNSS observations. Observed basal melt rates are low for the interior of the ice shelf (0–1 m a−1), with localized high basal melt rates of 22.2±0.2 m a−1 observed near the grounding lines of the Siple Coast ice streams (Marsh et al., 2016; Adusumilli et al., 2020). These studies show that the magnitudes that we use to perturb the basal melt rates on the RIS are significantly higher than the observed ones, which may indicate that our perturbation is not realistic. Additionally, our perturbation represents a sine function, and thus it peaks and troughs at the same magnitudes (i.e. peaks at 25 m a−1 and troughs at −25 m a−1) in order to include both melting and refreezing (Fig. A9). These negative basal melt rates (i.e. refreezing) are significantly higher than expected for the RIS, especially in the summer (Figs. A8 and A9) (Stewart et al., 2019).
Our findings indicate that basal melt rates are only capable of causing the observed velocity variations after we apply our idealized sinusoidal perturbations. As the required perturbations are significantly higher than expected, it is likely that other mechanisms are driving the observed velocity variations. However, we emphasize that, if melt alone was responsible and occurred only in sensitive regions of the ice shelf, a variability in basal melting with peaks of 20–80 m a−1 in April and October would be needed to match the GNSS observations at Sites 1, 2, and 4.
4.3 Other potential drivers of variability
We can match GNSS observations at Sites 1, 2, and 4 when applying our idealized sinusoidal basal melt perturbations in identified sensitive regions. However, we are unable to do so for Site 3, which is consistent with the conclusions of Klein et al. (2020). Here we list some other possible drivers.
Most recently, Mosbeux et al. (2023) showed that the seasonal variability of SSH modifies ice velocity by changing (1) the driving stress by locally tilting the ice shelf and (2) the basal condition in the grounding zone. Our results indicate that seasonal variability in SSH alone cannot reproduce the two velocity peaks per year observed at our new GNSS sites. We suggest that Mosbeux et al. (2023) were able to reproduce the velocity variability recorded at Site 3 due to implementing additional parameterization of viscoelastic processes in their model. However, we find a closer similarity in velocity amplitudes at Sites 2, 3, and 4 to the GNSS measurements when forced by changes in SSH compared to basal melt. Therefore, seasonal variations in SSH are likely contributing to velocity changes on the RIS, as indicated by Mosbeux et al. (2023).
Greene et al. (2018) found that changes in buttressing from sea ice can explain the seasonal cycle of Totten Glacier's ice shelf velocities. Sea ice cover in the Ross Sea decreases in the austral summer and increases in the austral winter, suggesting that ice shelf velocities would increase in the austral spring and decrease in the austral winter if forced by variations in sea ice backstress (Greene et al., 2018; Cassotto et al., 2015; Howat et al., 2010). However, we observe an acceleration in ice shelf velocities in the austral summer and austral winter, indicating that the GNSS velocity variations are likely not forced by variations in sea ice backstress.
Seasonal variations in surface air temperatures can also influence the surface melt rates of the ice shelf (Nicolas et al., 2017; Trusel et al., 2015; Zou et al., 2021a, b) and drive variations in velocities. For example, it has been shown that surface meltwater influences ice shelf velocity by percolating through and weakening the ice shelf shear margins (Cavanagh et al., 2017; Vaughan and Doake, 1996; Greene et al., 2018; Alley et al., 2018). However, the surface melt rates on the RIS are low, and the response of the ice shelf velocities to summer elevated surface melting has been shown to occur over short timescales (hours to weeks) (Stevens et al., 2022; Chaput et al., 2018; Nicolas et al., 2017). An El Niño event occurred in the summer of 2015/2016, when the GNSS measurements for Site 3 were recorded. This event may have increased surface melt rates on the RIS and modified wind patterns and ocean circulation (Klein et al., 2020; Paolo et al., 2015). Nicolas et al. (2017) observed 14 d of enhanced surface melting on the RIS between 10 and 21 January 2016 due to persistent air temperatures higher than −2 °C in the region of Site 3 (Klein et al., 2020; Chaput et al., 2018). Klein et al. (2020) suggested that the surface heat fluxes over the ocean during this surface melt event may have been substantially different than those used to drive the ocean models. Therefore, the MITgcm basal melt rates likely do not take into account this high surface melt event, and this may explain why we cannot reproduce the intra-annual velocity variability observed at Site 3.
Tides are known to cause substantial variations in velocity over short periods (Anandakrishnan et al., 2003; Gudmundsson, 2006; Bindschadler et al., 2003) and longer periods of up to a year (Murray et al., 2007). However, Klein et al. (2020) highlighted that the vertical signals of tides are too small to provide a significant forcing to the horizontal movement of the RIS through non-linear ice–ocean processes along the grounding zone, as suggested by Murray et al. (2007). Our GNSS processing smooths out short-term tidal effects, but the daily variability is likely to be large, with the Ross Sea tides being almost diurnal (Brunt et al., 2010; Padman et al., 2003). Therefore, small, solar-annual, or semi-annual (equinox) tides may drive the remaining variability in velocities observed at the GNSS sites that our model perturbations are unable to reproduce. Additionally, Mosbeux et al. (2023) observed a 6-month signal in their GNSS datasets on the RIS and tentatively attributed this signal to semi-annual changes in tides. This 6-month tidal signal may explain the observed intra-annual velocity variability at Site 4, and we suggest that it is likely that the tidal signal is playing a role in the observed velocity variability at all the GNSS sites.
Flow variability in the Siple Coast ice streams has also been shown to occur on short timescales due to changes in the distribution and supply of basal meltwater (Catania et al., 2012). Recently, high basal melt rates of 35 m a−1 were inferred in the KIS grounding zone within a narrow subglacially sourced basal channel (Whiteford et al., 2022). These high basal melt rates within a subglacial channel suggest that meltwater plumes could be driving changes in the subglacial hydrology system of the KIS. These changes in the subglacial hydrology may be driving variations in the velocities on intra-annual timescales by modifying the basal friction at the KIS grounding line. However, further work is needed to investigate these observed intra-annual velocity variations at Site 4, which is outside the scope of this study.
We set out to further understand the drivers of intra-annual velocity variability on the Antarctic ice shelves, using the RIS as a test bed. We present three new GNSS datasets that display an intra-annual velocity variability (two velocity peaks per year) that have not yet been explored in previous studies (Klein et al., 2020; Mosbeux et al., 2023). Notably, our new observations display a consistent periodicity that is different to previous year-round velocity observations from the RIS. We investigate the potential role of basal melt variability in the RIS ice flow by (1) identifying regions where changes in melt would have the highest impact on ice speed at our GNSS sites and (2) applying idealized sinusoidal basal melt perturbations in these sensitive regions to identify what magnitude of variability is needed to match the GNSS observations. We find that localized changes in basal melt can have a strong impact on the ice shelf flow. Our sensitivity maps highlight that the pinning points and grounding lines of the RIS are highly sensitive to changes in basal melting and have an impact on ice shelf flow speed. Additionally, we identify the magnitude of the variability needed to match the GNSS observations of velocity change at the GNSS sites. We are able to match the GNSS observations at Sites 1, 2, and 4 using our idealized sinusoidal basal melt perturbations with magnitudes of 20–80 m a−1. However, the required basal melt perturbations are significantly higher than expected for the RIS, which may indicate that these perturbations are not realistic. Therefore, isolated regions of periodically high basal melting are unlikely to be the main factor driving the observed GNSS velocity variability. We also show that seasonal variability in SSH alone cannot reproduce the intra-annual velocity variability observed at the new GNSS sites. However, it is likely that changes in SSH and tides in the Ross Sea are contributing to the observed variability in velocities at all the GNSS sites. We suggest that a combination of external forcings (e.g. SSH and tides) and internal mechanics (e.g. changes in buttressing forcings and basal friction) may be at play to produce the observed intra-annual velocity variability. We recommend that future work should focus on (1) continuing and expanding the multi-year GNSS records of seasonally resolved ice velocity changes on the RIS, (2) examining ice shelf interactions with basal melt rates on floating and grounded ice through coupled ocean–ice shelf models, and (3) exploring other potential drivers of intra-annual velocity variations.
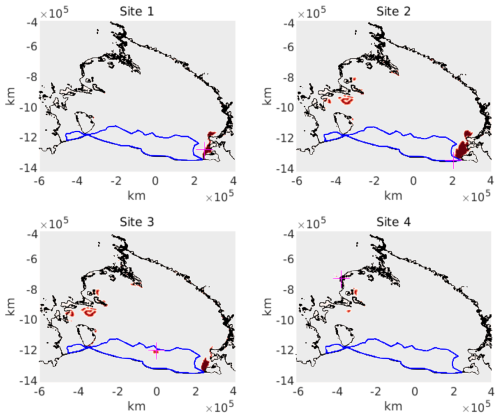
Figure A5Locations where idealized sinusoidal basal melt perturbations were applied when the AD-mapped sensitivity threshold was set to m−2 (dark red) for each GNSS site (pink markers). The grounding line (black line) and passive ice (blue line) on the RIS identified by Fürst et al. (2016) are highlighted.
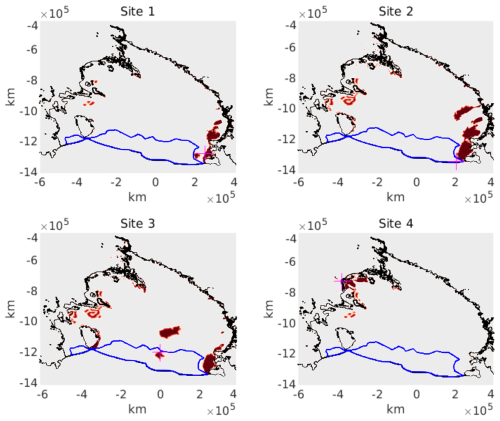
Figure A6Locations where idealized sinusoidal basal melt perturbations were applied when the AD-mapped sensitivity threshold was set to m−2 (highlighted in dark red) for each GNSS site (pink markers). The grounding line (black line) and passive ice (blue line) on the RIS identified by Fürst et al. (2016) are highlighted.
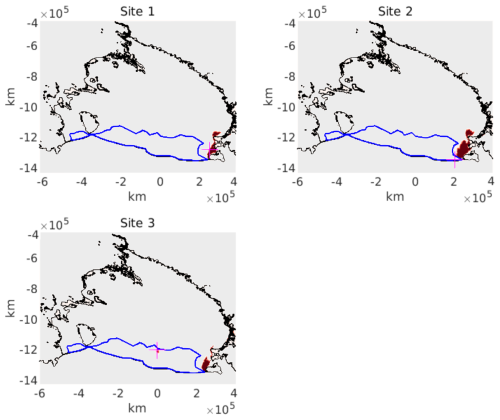
Figure A7Locations where idealized sinusoidal basal melt perturbations were applied when the AD-mapped sensitivity threshold was set to m−2 and limited to the calving front close to the Ross Island pinning point (highlighted in dark red) for GNSS Sites 1, 2, and 3 (pink marker). The grounding line (black line) and passive ice (blue line) on the RIS identified by Fürst et al. (2016) are highlighted.
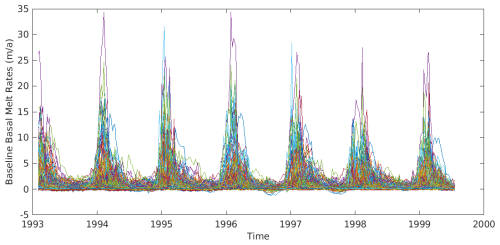
Figure A8The baseline MITgcm basal melt rates for the identified sensitive regions (greater than m−2) on the RIS. Each coloured line represents basal melt in different sensitive regions (i.e. different nodes of the mesh).
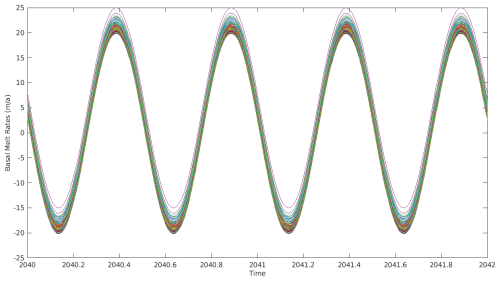
Figure A9The idealized sinusoidal perturbed MITgcm basal melt rates in the identified sensitive regions (greater than m−2) on the RIS. Each coloured line represents basal melt in different sensitive regions (i.e. different nodes of the mesh).
The model scripts and configuration files can be found here: https://doi.org/10.5281/zenodo.11098089 (Baldacchino, 2024). The Ice-sheet and Sea-level System Model v4.18 can be accessed at https://issm.jpl.nasa.gov (Larour et al., 2012). BedMachine Antarctica is available at NSIDC (https://doi.org/10.5067/FPSU0V1MWUB6; Morlighem, 2022). The InSAR-based ice velocity is found at NSIDC (https://doi.org/10.5067/D7GK8F5J8M8R; Rignot2017). The Antarctic surface mass balance (RACMO2.3p2) is available at https://doi.org/10.5281/zenodo.6602723 (van Wessem et al., 2022). The GNSS data can be found here: https://doi.org/10.5281/zenodo.14134876 (Horgan, 2024).
The project vision, funding acquisition, and field planning (2019/20 season) were led by NRG. The event leader for the 2021/2022 field season was AVAB. The field assistants for the fieldwork were FB, AG, DPL, and LvH. The Site 4 data acquisition and GNSS processing of all the sites were carried out by HH. The GNSS analysis was carried out by FB and HH. The ISSM simulations and AD analysis were carried out by FB under the guidance of MM. The AD simulations were carried out by MM. The MITgcm basal melt outputs were provided by AM. All the authors contributed to the manuscript.
At least one of the (co-)authors is a member of the editorial board of The Cryosphere. The peer-review process was guided by an independent editor, and the authors also have no other competing interests to declare.
Publisher's note: Copernicus Publications remains neutral with regard to jurisdictional claims made in the text, published maps, institutional affiliations, or any other geographical representation in this paper. While Copernicus Publications makes every effort to include appropriate place names, the final responsibility lies with the authors.
We are grateful to Antarctic New Zealand for facilitating and supporting our field campaigns to the Ross Ice Shelf to install and collect GNSS measurements. Additionally, we are grateful to Peter Bromirski for sharing the raw GNSS datasets collected on the Ross Ice Shelf in 2015–2016 that have been included in this study.
This research has been supported by the Ministry of Science and Innovation, New Zealand (grant nos. RTUV1705 (“NZSeaRise”) and ANTA1801 (“Antarctic Science Platform”)), and the Royal Society Te Apārangi (grant nos. VUW-1501 and VUW16-02).
This paper was edited by Jan De Rydt and reviewed by three anonymous referees.
Adusumilli, S., Fricker, H. A., Medley, B., Padman, L., and Siegfried, M. R.: Interannual variations in meltwater input to the Southern Ocean from Antarctic ice shelves, Nat. Geosci., 13, 616–620, https://doi.org/10.1038/s41561-020-0616-z, 2020. a, b, c, d, e, f
Agosta, C., Amory, C., Kittel, C., Orsi, A., Favier, V., Gallée, H., van den Broeke, M. R., Lenaerts, J. T. M., van Wessem, J. M., van de Berg, W. J., and Fettweis, X.: Estimation of the Antarctic surface mass balance using the regional climate model MAR (1979–2015) and identification of dominant processes, The Cryosphere, 13, 281–296, https://doi.org/10.5194/tc-13-281-2019, 2019. a
Alley, K. E., Scambos, T. A., Anderson, R. S., Rajaram, H., Pope, A., and Haran, T. M.: Continent-wide estimates of Antarctic strain rates from Landsat 8-derived velocity grids, J. Glaciol., 64, 321–332, https://doi.org/10.1017/jog.2018.23, 2018. a
Anandakrishnan, S., Voigt, D., Alley, R., and King, M.: Ice stream D flow speed is strongly modulated by the tide beneath the Ross Ice Shelf, Geophys. Res. Lett., 30, 1361, https://doi.org/10.1029/2002GL016329, 2003. a
Arndt, J. E., Larter, R. D., Friedl, P., Gohl, K., Höppner, K., and the Science Team of Expedition PS104: Bathymetric controls on calving processes at Pine Island Glacier, The Cryosphere, 12, 2039–2050, https://doi.org/10.5194/tc-12-2039-2018, 2018. a
Årthun, M., Holland, P. R., Nicholls, K. W., and Feltham, D. L.: Eddy-driven exchange between the open ocean and a sub–ice shelf cavity, J. Phys. Oceanogr., 43, 2372–2387, 2013. a, b
Assmann, K., Hellmer, H. H., and Beckmann, A.: Seasonal variation in circulation and water mass distribution on the Ross Sea continental shelf, Antarct. Sci., 15, 3–11, https://doi.org/10.1017/S0954102003001007, 2003. a
Baldacchino, F.: Modelling GNSS-observed seasonal velocity changes of the Ross Ice Shelf, Antarctica, using the Ice-sheet and Sea-level System Model (ISSM), Zenodo [code], https://doi.org/10.5281/zenodo.11098089, 2024. a
Baldacchino, F., Morlighem, M., Golledge, N. R., Horgan, H., and Malyarenko, A.: Sensitivity of the Ross Ice Shelf to environmental and glaciological controls, The Cryosphere, 16, 3723–3738, https://doi.org/10.5194/tc-16-3723-2022, 2022. a, b, c, d, e, f, g, h
Bindschadler, R. A., Vornberger, P. L., King, M. A., and Padman, L.: Tidally driven stick-slip motion in the mouth of Whillans Ice Stream, Antarctica, Ann. Glaciol., 36, 263–272, https://doi.org/10.3189/172756403781816284, 2003. a, b
Bougamont, M., Christoffersen, P., Price, S., Fricker, H. A., Tulaczyk, S., and Carter, S. P.: Reactivation of Kamb Ice Stream tributaries triggers century-scale reorganization of Siple Coast ice flow in West Antarctica, Geophys. Res. Lett., 42, 8471–8480, 2015. a
Brunt, K. M.: Tidal motion of the Ross Ice Shelf and its interaction with the Siple Coast ice streams, Antarctica, The University of Chicago, 2008. a
Brunt, K. M. and Macayeal, D. R.: Tidal modulation of ice-shelf flow: A viscous model of the Ross Ice Shelf, J. Glaciol., 60, 500–508, https://doi.org/10.3189/2014JoG13J203, 2014. a
Brunt, K. M., King, M. A., Fricker, H. A., and MacAyeal, D. R.: Flow of the Ross Ice Shelf, Antarctica, is modulated by the ocean tide, J. Glaciol., 56, 157–161, https://doi.org/10.3189/002214310791190875, 2010. a
Cassotto, R., Fahnestock, M., Amundson, J. M., Truffer, M., and Joughin, I.: Seasonal and interannual variations in ice melange and its impact on terminus stability, Jakobshavn Isbræ, Greenland, J. Glaciol., 61, 76–88, https://doi.org/10.3189/2015JoG13J235, 2015. a
Catania, G., Hulbe, C., Conway, H., Scambos, T. A., and Raymond, C.: Variability in the mass flux of the Ross ice streams, West Antarctica, over the last millennium, J. Glaciol., 58, 741–752, https://doi.org/10.3189/2012JoG11J219, 2012. a
Cavanagh, J., Lampkin, D., and Moon, T.: Seasonal variability in regional ice flow due to meltwater injection into the shear margins of Jakobshavn Isbræ, J. Geophys. Res.-Earth Surf., 122, 2488–2505, https://doi.org/10.1002/2016JF004187, 2017. a
Chaput, J., Aster, R., McGrath, D., Baker, M., Anthony, R. E., Gerstoft, P., Bromirski, P., Nyblade, A., Stephen, R., Wiens, D., Das, S. B., and Stevens, L. A.: Near-surface environmentally forced changes in the Ross Ice Shelf observed with ambient seismic noise, Geophys. Res. Lett., 45, 11–187, https://doi.org/10.1029/2018GL079665, 2018. a, b
Cuffey, K. M. and Paterson, W. S. B.: The Physics of Glaciers, Elsevier, Burlington, MA, USA, ISBN 978-0-12-369461-4, 2010. a, b
Das, I., Padman, L., Bell, R. E., Fricker, H. A., Tinto, K. J., Hulbe, C. L., Siddoway, C. S., Dhakal, T., Frearson, N. P., Mosbeux, C., Cordero, S. I., and Siegfried, M. R.: Multidecadal Basal Melt Rates and Structure of the Ross Ice Shelf, Antarctica, Using Airborne Ice Penetrating Radar, J. Geophys. Res.-Earth Surf., 125, e2019JF005241, https://doi.org/10.1029/2019JF005241, 2020. a, b
Davis, P. and Nicholls, K.: Turbulence observations beneath Larsen C Ice Shelf, Antarctica., J. Geophys. Res, 124, 5529–5550, https://doi.org/10.1029/2019jc015164, 2019. a
Depoorter, M. A., Bamber, J. L., Griggs, J. A., Lenaerts, J. T., Ligtenberg, S. R., Van Den Broeke, M. R., and Moholdt, G.: Calving fluxes and basal melt rates of Antarctic ice shelves, Nature, 502, 89–92, https://doi.org/10.1038/nature12567, 2013. a
Dinniman, Asay-Davis, X. S., Galton-Fenzi, B. K., Holland, P. R., Jenkins, A., and Timmermann, R.: Modeling ice shelf/ocean interaction in Antarctica: A review, Oceanography, 29, 144–153, https://doi.org/10.5670/oceanog.2016.106, 2016. a, b
Dirscherl, M., Dietz, A. J., Dech, S., and Kuenzer, C.: Remote sensing of ice motion in Antarctica – A review, Remote Sens. Environ., 237, 111595, https://doi.org/10.1016/j.rse.2019.111595, 2020. a
Dupont, T. and Alley, R.: Assessment of the importance of ice-shelf buttressing to ice-sheet flow., Geophys. Res. Lett., 32, L04503, https://doi.org/10.1029/2004GL022024, 2005. a
Fürst, J. J., Durand, G., Gillet-Chaulet, F., Tavard, L., Rankl, M., Braun, M., and Gagliardini, O.: The safety band of Antarctic ice shelves, Nat. Clim. Change, 6, 479–482, https://doi.org/10.1038/nclimate2912, 2016. a, b, c, d, e, f, g
Greene, C. A., Young, D. A., Gwyther, D. E., Galton-Fenzi, B. K., and Blankenship, D. D.: Seasonal dynamics of Totten Ice Shelf controlled by sea ice buttressing, The Cryosphere, 12, 2869–2882, https://doi.org/10.5194/tc-12-2869-2018, 2018. a, b, c, d, e
Gudmundsson, G.: Fortnightly variations in the flow velocity of Rutford Ice Stream, West Antarctica, Nature, 444, 1063–1064, https://doi.org/10.1038/nature05430, 2006. a
Gudmundsson, G. H.: Ice-shelf buttressing and the stability of marine ice sheets, The Cryosphere, 7, 647–655, https://doi.org/10.5194/tc-7-647-2013, 2013. a
Gudmundsson, G. H., Paolo, F. S., Adusumilli, S., and Fricker, H. A.: Instantaneous Antarctic Ice Sheet mass loss driven by thinning ice shelves, Geophys. Res. Lett., 46, 13903–13909, https://doi.org/10.1029/2019GL085027, 2019. a, b, c, d
Gwyther, D. E., O'Kane, T. J., Galton-Fenzi, B. K., Monselesan, D. P., and Greenbaum, J. S.: Intrinsic processes drive variability in basal melting of the Totten Glacier Ice Shelf, Nat. Commun., 9, 1–8, https://doi.org/10.1038/s41467-018-05618-2, 2018. a, b
Holland, D. and Jenkins, A.: Modeling Thermodynamic Ice–Ocean Interactions at the Base of an Ice Shelf, J. Phys. Oceanogr., 29, 1787–1800, https://doi.org/10.1175/1520-0485, 1999. a
Holland, D. M., Jacobs, S. S., and Jenkins, A.: Modelling the ocean circulation beneath the Ross Ice Shelf, Antarct. Sci., 15, 13–23, https://doi.org/10.1017/S0954102003001019, 2003. a
Holland, P. R., Bracegirdle, T. J., Dutrieux, P., Jenkins, A., and Steig, E. J.: West Antarctic ice loss influenced by internal climate variability and anthropogenic forcing, Nat. Geosci., 12, 718–724, https://doi.org/10.1038/s41561-019-0420-9, 2019. a
Horgan, H. J.: Ross Ice Shelf GNSS data reported in EGUSphere-2023-2793, Baldacchino et al., 2024, Zenodo [data set], https://doi.org/10.5281/zenodo.14134876, 2024. a
Howat, I. M., Box, J. E., Ahn, Y., Herrington, A., and McFadden, E. M.: Seasonal variability in the dynamics of marine-terminating outlet glaciers in Greenland, J. Glaciol., 56, 601–613, https://doi.org/10.3189/002214310793146232, 2010. a
Hulbe, C., Scambos, T., Klinger, M., and Fahnestock, M.: Flow variability and ongoing margin shifts on Bindschadler and MacAyeal Ice Streams, West Antarctica, J. Geophys. Res.-Earth Surf., 121, 283–293, https://doi.org/10.1002/2015JF003670, 2016. a
Jendersie, S., Williams, M. J. M., Langhorne, P. J., and Robertson, R.: The Density-Driven Winter Intensification of the Ross Sea Circulation, J. Geophys. Res.-Oceans, 123, 7702–7724, https://doi.org/10.1029/2018JC013965, 2018. a, b, c
Jenkins, A., Shoosmith, D., Dutrieux, P., Jacobs, S., Kim, T. W., Lee, S. H., Ha, H. K., and Stammerjohn, S.: West Antarctic Ice Sheet retreat in the Amundsen Sea driven by decadal oceanic variability, Nat. Geosci., 11, 733–738, https://doi.org/10.1038/s41561-018-0207-4, 2018. a, b
Joughin, I., Alley, R. B., and Holland, D. M.: Oceanic Forcing, Science, 338, 1172–6, https://doi.org/10.1126/science.1226481, 2013. a
Joughin, I., Smith, B. E., and Medley, B.: Marine ice sheet collapse potentially under way for the Thwaites Glacier Basin, West Antarctica, Science, 344, 735–738, https://doi.org/10.1126/science.1249055, 2014. a
Joughin, I., Shapero, D., Smith, B., Dutrieux, P., and Barham, M.: Ice-shelf retreat drives recent Pine Island Glacier speedup, Sci. Adv., 7, eabg3080, https://doi.org/10.1126/sciadv.abg3080, 2021. a
King, M., Makinson, K., and Gudmundsson, G. H.: Nonlinear interaction between ocean tides and the Larsen C Ice Shelf system, Geophys. Res. Lett., 38, 1–5, https://doi.org/10.1029/2011GL046680, 2011. a
Klein, E., Mosbeux, C., Bromirski, P. D., Padman, L., Bock, Y., Springer, S. R., and Fricker, H. A.: Annual cycle in flow of Ross Ice Shelf, Antarctica: Contribution of variable basal melting, J. Glaciol., 66, 861–875, https://doi.org/10.1017/jog.2020.61, 2020. a, b, c, d, e, f, g, h, i, j, k, l, m, n, o, p, q, r, s, t, u, v, w, x, y
Larour, E., Seroussi, H., Morlighem, M., and Rignot, E.: Continental scale, high order, high spatial resolution, ice sheet modeling using the Ice Sheet System Model, J. Geophys. Res., 117, F01022, https://doi.org/10.1029/2011JF002140, 2012 (data available at: https://issm.jpl.nasa.gov, last access: 10 September 2024). a
Larter, R. D.: Basal Melting, Roughness and Structural Integrity of Ice Shelves, Geophys. Res. Lett., 49, e2021GL097421, https://doi.org/10.1029/2021GL097421, 2022. a
Lipscomb, W. H., Leguy, G. R., Jourdain, N. C., Asay-Davis, X., Seroussi, H., and Nowicki, S.: ISMIP6-based projections of ocean-forced Antarctic Ice Sheet evolution using the Community Ice Sheet Model, The Cryosphere, 15, 633–661, https://doi.org/10.5194/tc-15-633-2021, 2021. a
Losch, M.: Modeling ice shelf cavities in a z coordinate ocean general circulation model, J. Geophys. Res.-Oceans (1978–2012), 113, https://doi.org/10.1029/2007jc004368, 2008. a
Malyarenko, A., Robinson, N. J., Williams, M. J. M., and Langhorne, P. J.: A Wedge Mechanism for Summer Surface Water Inflow Into the Ross Ice Shelf Cavity, J. Geophys. Res.-Oceans, 124, 1196–1214, https://doi.org/10.1029/2018jc014594, 2019. a
Marsh, O. J., Fricker, H. A., Siegfried, M. R., Christianson, K., Nicholls, K. W., Corr, H. F., and Catania, G.: High basal melting forming a channel at the grounding line of Ross Ice Shelf, Antarctica, Geophys. Res. Lett., 43, 250–255, https://doi.org/10.1002/2015GL066612, 2016. a
Moholdt, G., Padman, L., and Fricker, H. A.: Basal mass budget of Ross and Filchner-Ronne ice shelves, Antarctica, derived from Lagrangian analysis of ICESat altimetry, J. Geophys. Res.-Earth Surf., 119, 2361–2380, https://doi.org/10.1002/2014JF003171, 2014. a, b
Morlighem, M.: MEaSUREs BedMachine Antarctica. (NSIDC-0756, Version 3), Boulder, Colorado USA, NASA National Snow and Ice Data Center Distributed Active Archive Center [data set], https://doi.org/10.5067/FPSU0V1MWUB6, 2022. a
Morlighem, M., Rignot, E., Seroussi, H., Larour, E., Ben Dhia, H., and Aubry, D.: Spatial patterns of basal drag inferred using control methods from a full-Stokes and simpler models for Pine Island Glacier, West Antarctica, Geophys. Res. Lett., 37, 1–6, https://doi.org/10.1029/2010GL043853, 2010. a
Morlighem, M., Seroussi, H., Larour, E., and Rignot, E.: Inversion of basal friction in Antarctica using exact and incomplete adjoints of a higher-order model, J. Geophys. Res.-Earth Surf., 118, 1746–1753, https://doi.org/10.1002/jgrf.20125, 2013. a
Mosbeux, C., Padman, L., Klein, E., Bromirski, P. D., and Fricker, H. A.: Seasonal variability in Antarctic ice shelf velocities forced by sea surface height variations, The Cryosphere, 17, 2585–2606, https://doi.org/10.5194/tc-17-2585-2023, 2023. a, b, c, d, e, f, g, h, i, j, k, l, m, n, o, p, q, r, s, t, u, v, w, x, y
Mottram, R., Simonsen, S. B., Svendsen, S. H., Barletta, V. R., Sørensen, L. S., Nagler, T., Wuite, J., Groh, A., Horwath, M., Rosier, J., Solgaard, A., Hvidberg, C. S., and Forsberg, R.: An integrated view of Greenland Ice Sheet mass changes based on models and satellite observations, Remote Sens., 11, 1–26, https://doi.org/10.3390/rs11121407, 2019. a
Murray, T., Smith, A., King, M., and Weedon, G.: Ice flow modulated by tides at up to annual periods at Rutford Ice Stream, West Antarctica, Geophys. Res. Lett., 34, L18503, https://doi.org/10.1029/2007GL031207, 2007. a, b
Ng, F. and Conway, H.: Fast-flow signature in the stagnated Kamb Ice Stream, West Antarctica, Geology, 32, 481–484, https://doi.org/10.1130/G20317.1, 2004. a
Nicolas, J. P., Vogelmann, A. M., Scott, R. C., Wilson, A. B., Cadeddu, M. P., Bromwich, D. H., Verlinde, J., Lubin, D., Russell, L. M., Jenkinson, C., and Powers, H. H.: January 2016 extensive summer melt in West Antarctica favoured by strong El Niño, Nat. Commun., 8, 15799, https://doi.org/10.1038/ncomms15799, 2017. a, b, c
Padman, L., Erofeeva, S., and Joughin, I.: Tides of the Ross Sea and Ross Ice Shelf cavity, Antarct. Sci., 15, 31–40, https://doi.org/10.1017/S0954102003001032, 2003. a, b
Paolo, F. S., Fricker, H. A., and Padman, L.: Volume loss from Antarctic ice shelves is accelerating, Science, 348, 327–331, https://doi.org/10.1126/science.aaa0940, 2015. a
Pattyn, F.: Sea-level response to melting of Antarctic ice shelves on multi-centennial timescales with the fast Elementary Thermomechanical Ice Sheet model (f.ETISh v1.0), The Cryosphere, 11, 1851–1878, https://doi.org/10.5194/tc-11-1851-2017, 2017. a
Pattyn, F. and Durand, G.: Why marine ice sheet model predictions may diverge in estimating future sea level rise, Geophys. Res. Lett., 40, 4316–4320, https://doi.org/10.1002/grl.50824, 2013. a
Pattyn, F., Ritz, C., Hanna, E., Asay-Davis, X., DeConto, R., Durand, G., Favier, L., Fettweis, X., Goelzer, H., Golledge, N. R., Kuipers Munneke, P., Lenaerts, J. T., Nowicki, S., Payne, A. J., Robinson, A., Seroussi, H., Trusel, L. D., and van den Broeke, M.: The Greenland and Antarctic Ice Sheets under 1.5 °C global warming, Nat. Clim. Change, 8, 1053–1061, https://doi.org/10.1038/s41558-018-0305-8, 2018. a, b
Pawlowicz, R., Beardsley, B., and Lentz, S.: Classical tidal harmonic analysis including error estimates in MATLAB using T_TIDE, Comput. Geosci., 28, 929–937, 2002. a
Ranganathan, M., Minchew, B., Meyer, C. R., and Gudmundsson, G. H.: A new approach to inferring basal drag and ice rheology in ice streams, with applications to West Antarctic Ice Streams, J. Glaciol., 67, 229–242, https://doi.org/10.1017/jog.2020.95, 2021. a
Ray, R. D., Larson, K. M., and Haines, B. J.: New determinations of tides on the north-western Ross Ice Shelf., Antarct. Sci., 33, 89–102, https://doi.org/10.1017/S0954102020000498, 2021. a
Reese, R., Gudmundsson, G. H., Levermann, A., and Winkelmann, R.: The far reach of ice-shelf thinning in Antarctica, Nat. Clim. Change, 8, 53–57, https://doi.org/10.1038/s41558-017-0020-x, 2018. a, b, c
Retzlaff, R. and Bentley, C. R.: Timing of stagnation of Ice Stream C, West Antarctica, from short-pulse radar studies of buried surface crevasses, J. Glaciol., 39, 553–561, https://doi.org/10.3189/S0022143000016440, 1993. a
Rignot, Jacobs, S., Mouginot, J., and Scheuchl, B.: Ice-shelf melting around Antarctica, Science, 341, 266–270, https://doi.org/10.1126/science.1235798, 2013. a
Rignot, E., Mouginot, J., and Scheuchl, B.: MEaSUREs InSAR-Based Antarctica Ice Velocity Map (NSIDC-0484, Version 2), Boulder, Colorado USA, NASA National Snow and Ice Data Center Distributed Active Archive Center [data set], https://doi.org/10.5067/D7GK8F5J8M8R (last access: 20 February 2020), 2017. a, b
Rignot, E., Mouginot, J., Scheuchl, B., van den Broeke, M., van Wessem, M. J., and Morlighem, M.: Four decades of Antarctic Ice Sheet mass balance from 1979–2017, P. Natl. Acad. Sci. USA, 116, 1095–1103, https://doi.org/10.1073/pnas.1812883116, 2019. a, b
Rosier, S. H. R. and Gudmundsson, G. H.: Exploring mechanisms responsible for tidal modulation in flow of the Filchner–Ronne Ice Shelf, The Cryosphere, 14, 17–37, https://doi.org/10.5194/tc-14-17-2020, 2020. a
Sagebaum, M., Albring, T., and Gauger, N.: High-Performance Derivative Computations using CoDiPack, ACM T. Math. Software, 45, 38, https://doi.org/10.1145/3356900, 2019. a
Schlegel, N.-J., Seroussi, H., Schodlok, M. P., Larour, E. Y., Boening, C., Limonadi, D., Watkins, M. M., Morlighem, M., and van den Broeke, M. R.: Exploration of Antarctic Ice Sheet 100-year contribution to sea level rise and associated model uncertainties using the ISSM framework, The Cryosphere, 12, 3511–3534, https://doi.org/10.5194/tc-12-3511-2018, 2018. a
Schodlok, M., Menemenlis, D., and Rignot, E.: Ice shelf basal melt rates around Antarctica from simulations and observations, J. Geophys. Res., 121, 1085–1109, https://doi.org/10.1002/2015JC011117, 2016. a
Schoof, C.: Ice sheet grounding line dynamics: Steady states, stability, and hysteresis, J. Geophys. Res.-Earth Surf., 112, 1–19, https://doi.org/10.1029/2006JF000664, 2007. a
Shepherd, A., Ivins, E. R., Geruo, A., Barletta, V. R., Bentley, M. J., Bettadpur, S., Briggs, K. H., Bromwich, D. H., Forsberg, R., Galin, N., Horwath, M., Jacobs, S., Joughin, I., King, M. A., Lenaerts, J. T., Li, J., Ligtenberg, S. R., Luckman, A., Luthcke, S. B., McMillan, M., Meister, R., Milne, G., Mouginot, J., Muir, A., Nicolas, J. P., Paden, J., Payne, A. J., Pritchard, H., Rignot, E., Rott, H., Sørensen, L. S., Scambos, T. A., Scheuchl, B., Schrama, E. J., Smith, B., Sundal, A. V., Van Angelen, J. H., Van De Berg, W. J., Van Den Broeke, M. R., Vaughan, D. G., Velicogna, I., Wahr, J., Whitehouse, P. L., Wingham, D. J., Yi, D., Young, D., and Zwally, H. J.: A reconciled estimate of ice-sheet mass balance, Science, 338, 1183–1189, https://doi.org/10.1126/science.1228102, 2012. a
Shepherd, A., Fricker, H. A., and Farrell, S. L.: Trends and connections across the Antarctic cryosphere, Nature, 558, 223–232, https://doi.org/10.1038/s41586-018-0171-6, 2018. a, b
Stern, A. A., Dinniman, M. S., Zagorodnov, V., Tyler, S. W., and Holland, D. M.: Intrusion of warm surface water beneath the McMurdo ice shelf, Antarctica, J. Geophys. Res.-Oceans, 118, 7036–7048, https://doi.org/10.1002/2013JC008842, 2013. a
Stevens, C., Hulbe, C., Brewer, M., Stewart, C., Robinson, N., Ohneiser, C., and Jendersie, S.: Ocean mixing and heat transport processes observed under the Ross Ice Shelf control its basal melting, P. Natl. Acad. Sci. USA, 117, 16799–16804, https://doi.org/10.1073/pnas.1910760117, 2020. a, b, c
Stevens, L. A., Nettles, M., Davis, J. L., Creyts, T. T., Kingslake, J., Ahlstrøm, A. P., and Larsen, T. B.: Helheim Glacier diurnal velocity fluctuations driven by surface melt forcing, J. Glaciol., 68, 77–89, https://doi.org/10.1017/jog.2021.74, 2022. a
Stewart, C. L., Christoffersen, P., Nicholls, K. W., Williams, M. J., and Dowdeswell, J. A.: Basal melting of Ross Ice Shelf from solar heat absorption in an ice-front polynya, Nat. Geosci., 12, 435–440, https://doi.org/10.1038/s41561-019-0356-0, 2019. a, b, c, d, e, f, g, h, i, j, k
Still, H., Campbell, A., and Hulbe, C.: Mechanical analysis of pinning points in the Ross Ice Shelf, Antarctica, Ann. Glaciol., 60, 32–41, https://doi.org/10.1017/aog.2018.31, 2019. a, b, c
Tétreault, P., Kouba, J., Héroux, P., and Legree, P.: CSRS-PPP: an internet service for GPS user access to the Canadian Spatial Reference Frame, Geomatica, 59, 17–28, 2005. a
Thomas, R., Scheuchl, B., Frederick, E., Harpold, R., Martin, C., and Rignot, E.: Continued slowing of the Ross Ice Shelf and thickening of West Antarctic ice streams, J. Glaciol., 59, 838–844, https://doi.org/10.3189/2013JoG12J122, 2013. a
Tinto, K. J., Padman, L., Siddoway, C. S., Springer, S. R., Fricker, H. A., Das, I., Caratori Tontini, F., Porter, D. F., Frearson, N. P., Howard, S. L., Siegfried, M. R., Mosbeux, C., Becker, M. K., Bertinato, C., Boghosian, A., Brady, N., Burton, B. L., Chu, W., Cordero, S. I., Dhakal, T., Dong, L., Gustafson, C. D., Keeshin, S., Locke, C., Lockett, A., O'Brien, G., Spergel, J. J., Starke, S. E., Tankersley, M., Wearing, M. G., and Bell, R. E.: Ross Ice Shelf response to climate driven by the tectonic imprint on seafloor bathymetry, Nat. Geosci., 12, 441–449, https://doi.org/10.1038/s41561-019-0370-2, 2019. a, b, c
Trusel, L., Frey, K., Das, S., Karnauskas, K., Munneke, P., Meijgaard, E., and Van den Broeke, M.: Divergent trajectories of Antarctic surface melt under two twenty-first-century climate scenarios, Nat. Geosci., 8, 927–932, https://doi.org/10.1038/ngeo2563, 2015. a
van der Wel, N., Christoffersen, P., and Bougamont, M.: The influence of subglacial hydrology on the flow of Kamb Ice Stream, West Antarctica, J. Geophys. Res.-Earth Surf., 118, 97–110, https://doi.org/10.1002/2015GL065782, 2013. a
van Wessem, J. M., van de Berg, W. J., Noël, B. P. Y., van Meijgaard, E., Amory, C., Birnbaum, G., Jakobs, C. L., Krüger, K., Lenaerts, J. T. M., Lhermitte, S., Ligtenberg, S. R. M., Medley, B., Reijmer, C. H., van Tricht, K., Trusel, L. D., van Ulft, L. H., Wouters, B., Wuite, J., and van den Broeke, M. R.: Modelling the climate and surface mass balance of polar ice sheets using RACMO2 – Part 2: Antarctica (1979–2016), The Cryosphere, 12, 1479–1498, https://doi.org/10.5194/tc-12-1479-2018, 2018. a
van Wessem, J. M., van den Broeke, M. R., and Lhermitte, S.: Data set: Yearly RACMO2.3p2 variables, Zenodo [data set], https://doi.org/10.5281/zenodo.6602723, 2022. a
Vaughan, D. G. and Doake, C.: Recent atmospheric warming and retreat of ice shelves on the Antarctic Peninsula, Nature, 379, 328–331, https://doi.org/10.1038/379328a0, 1996. a
Whiteford, A., Horgan, H., Leong, W., and Forbes, M.: Melting and refreezing in an ice shelf basal channel at the grounding line of the Kamb Ice Stream, West Antarctica, J. Geophys. Res.-Earth Surf., 127, e2021JF006532, https://doi.org/10.1029/2021JF006532, 2022. a
Zou, X., Bromwich, D. H., Montenegro, A., Wang, S.-H., and Bai, L.: Major surface melting over the Ross Ice Shelf part I: Foehn effect, Q. J. Roy. Meteor. Soc., 147, 2874–2894, https://doi.org/10.1002/qj.4104, 2021a. a
Zou, X., Bromwich, D. H., Montenegro, A., Wang, S.-H., and Bai, L.: Major surface melting over the Ross Ice Shelf part II: Surface energy balance, Q. J. Roy. Meteor. Soc., 147, 2895–2916, https://doi.org/10.1002/qj.4105, 2021b. a
Zumberge, J., Heflin, M., Jefferson, D., Watkins, M., and Webb, F.: Precise point positioning for the efficient and robust analysis of GPS data from large networks, J. Geophys. Res.-Sol. Ea., 102, 5005–5017, https://doi.org/10.1029/96JB03860, 1997. a


