the Creative Commons Attribution 4.0 License.
the Creative Commons Attribution 4.0 License.
 | 06 Mar 2025
Effects of Arctic sea-ice concentration on surface radiative fluxes in four atmospheric reanalyses
Tereza Uhlíková
Timo Vihma
Alexey Yu Karpechko
Petteri Uotila
Spatiotemporal variations and climatological trends in the sea-ice concentration (SIC) are highly important for the energy budget of the lower atmosphere and the upper ocean in the Arctic. To better understand the local, regional, and global impacts of the recent rapid sea-ice decline, one of the key issues is to quantify the interactions of SIC and the surface radiative fluxes. We analyse these effects utilizing four global atmospheric reanalyses – ERA5, JRA-55, MERRA-2, and NCEP/CFSR – and evaluate the uncertainties arising from inter-reanalysis differences in the sensitivity of the surface radiative fluxes to SIC. Using daily data over the period 1980–2021, the linear orthogonal distance regression indicates similar sensitivity of surface upward longwave radiation to SIC in all reanalyses with the greatest sensitivity in the cold season November–April (over 150 W m−2 per −0.1 change in SIC) and up to 80 W m−2 per −0.1 change in SIC in May–October. We find that the effect of SIC on surface upward longwave and shortwave radiation has mostly weakened in all seasons between the study periods of 1980–2000 and 2001–2021. The decrease in the sensitivity of upward longwave radiation to SIC can be attributed to the increasing surface temperature of sea ice, which dominated in the inner ice pack, and to the sea-ice decline, which dominated in the marginal ice zone. Approximately 80 % of the decadal decrease in upward shortwave radiation in May–July was caused by a decrease in surface albedo controlled by SIC decrease, and the rest was caused by a decrease in downward shortwave radiation due to the increase in cloudiness that was mostly close to sea-ice margins.
- Article
(10786 KB) - Full-text XML
- Companion paper
-
Supplement
(11675 KB) - BibTeX
- EndNote


Sea ice in the Arctic Ocean affects and is affected by thermal longwave radiation and solar shortwave radiation. The former dominates the surface net radiation over most of the year and triggers the spring onset of snowmelt on top of sea ice (Mortin et al., 2016), whereas the latter is the key driver of summertime surface melt of snow and ice (Perovich et al., 2007).
In winter over the Arctic Ocean, the snow surface temperature occasionally drops below −40 °C, which strongly reduces the emitted longwave radiation (Persson et al., 2002). Simultaneously, open leads with a surface temperature close to −1.8 °C emit almost double the amount of longwave radiation, and refrozen leads have intermediate values for surface temperature and longwave radiation emission.
In summer, the surface conditions are close to isothermal, and the longwave radiation emitted is much less sensitive to the presence of sea ice, whereas the effects of sea ice and snow on reflected solar radiation are strong. New dry snow has a surface albedo of approximately 0.85, and even melting ice has a surface albedo of approximately 0.4 (Light et al., 2022), which is much higher than that of the open sea (less than 0.1). Hence, during spring and summer, the strong reflection from the snow or ice surface strongly reduces the surface net shortwave radiation.
Throughout the year, the open-water and sea-ice surfaces generally emit more longwave radiation than they receive from clouds and the atmosphere (Persson, 2012). This is due to the high emissivity of snow and ice, between 0.97–0.98 (Liang et al., 2014), which far exceeds the typical emissivity of the Arctic atmosphere, even under cloudy conditions (Garrett and Zhao, 2006). An exception occurs in the presence of thick water clouds in summer, which emit radiation almost like a black body and have base temperatures close to or even higher than that of the snow/ice surface (Persson, 2012).
The above-mentioned findings are based on data from rare field campaigns in the Arctic sea ice zone. To understand the processes on a regional scale, as well as their seasonal, inter-annual, and decadal variations and past trends, atmospheric and ocean reanalyses, as well as satellite remote sensing products, must be applied. Comparison of different reanalyses against each other and observations is vital to evaluate their uncertainty. Reanalysis products for surface radiative fluxes over sea ice have been compared and evaluated in several studies (Walsh et al., 2009; Graham et al., 2019; Jonassen et al., 2019; Yeo et al., 2022). The ERA5 (Hersbach et al., 2020) and NCEP/CFSR (Saha et al., 2010a, 2014) reanalyses generally perform better than others (Jonassen et al., 2019; Di Biagio et al., 2021), but challenges remain, especially for clouds and downward longwave radiation in winter (Graham et al., 2019). Additionally, reanalysis products for sea-ice concentration (SIC) have been compared (Graham et al., 2019). However, we are not aware of any study addressing inter-reanalysis differences in the relationship between SIC and radiative surface fluxes. This is a key question as SIC plays a crucial role in the radiative surface fluxes and the surface energy balance over the Arctic Ocean.
Relevant research questions include the spatial patterns of the relationships between SIC and radiative surface fluxes over the Arctic Ocean and the seasonal evolution of these relationships during the spring and autumn transitions. Considering the threshold value of SIC for sea ice to dominate the sign of the regional surface fluxes, it is known that for turbulent surface fluxes in winter, the threshold typically exceeds 0.9 (Vihma, 1995; Andreas et al., 2010), but for radiative fluxes, the threshold has not received as much attention. Regarding climatological trends, according to satellite passive microwave data from 1979–2021, the average yearly sea-ice extent in the Arctic has declined by more than 50 000 km2 yr−1 (Parkinson, 2022). To understand at the process level how the major sea-ice decline has affected the ocean and atmosphere locally, regionally, and globally, the necessary first step is to quantify the effects of SIC on the surface energy balance of the Arctic Ocean. Furthermore, the range of uncertainty in these effects and their changes over recent decades deserves attention.
To meet the above-mentioned challenges, we analyse the effects of SIC on surface upward shortwave and longwave radiation and clouds based on products of four atmospheric reanalyses. This is a follow-up study to Uhlíková et al. (2024) in which we addressed the effects of SIC on the turbulent surface fluxes of sensible and latent heat over the Arctic Ocean.
To investigate the relationship between SIC and radiative surface fluxes, we utilized data from four atmospheric reanalyses. Because this paper is a companion paper to Uhlíková et al. (2024) (hereafter referred to as “the companion paper”), we use data from (1) the same reanalyses (ERA5, Hersbach et al., 2023; JRA-55, Japan Meteorological Agency, 2013; MERRA-2, GMAO, 2015a, c, b; NCEP/CFSR, Saha et al., 2010b, 2011), (2) the same study periods (1980–2000 and 2001–2021), (3) the same seasons (November–December–January, February–March–April, May–June–July, and August–September–October), and the same temporal resolution (daily means of data) to make the two studies comparable. The term “NCEP/CFSR” refers to data from NCEP Climate Forecast System Reanalysis (CFSR; covering the period 1980–2010; spatial resolution 0.312° lat × 0.313° long) and NCEP Climate Forecast System Version 2 (CFSv2; covering the period 2011–2021; spatial resolution 0.204° × 0.205°). We unified the spatial resolution for the whole NCEP/CFSR data set to 0.4° × 0.4° using bilinear interpolation. Besides this adjustment, we worked with the original horizontal spatial resolution of the remaining reanalyses: 0.25° × 0.25° (ERA5), 0.561° × 0.563° (JRA-55), and 0.5° × 0.625° (MERRA-2).
From each reanalysis, we have used the following variables: sea-ice concentration (SIC), surface upward longwave radiation (ULW), surface temperature (Ts), surface upward shortwave radiation (USW), surface downward shortwave radiation (DSW), and cloud water (vertically integrated cloud liquid water + cloud ice; hereafter referred to as “cloud condensate content”, CCC). We chose CCC as a metric for cloud conditions as it provides a better available estimate of cloud radiative properties compared to total cloud cover (Senkova et al., 2007). All surface radiative fluxes (upward and downward) were defined as positive.
Using these data, we studied bilateral relationships between SIC and surface upward radiative fluxes (ULW and USW) utilizing linear bilateral orthogonal distance regression model (ODR; Boggs et al., 1988). Because all variables in the reanalyses include uncertainties, the ODR model is more optimal for these data than the ordinary least squares regression model (OLSR), which assumes no uncertainty in the independent variable (in our case SIC). Additionally, we performed a comparison study of bilateral ODR and OLSR outputs using data from the above-mentioned reanalyses and noted that while the coefficients of determination (R2) were “nearly identical” (identical to at least five decimal points) for both methods, the values of slopes of the regression line varied considerably. Based on these findings, we additionally decided to utilize OLSR analyses when only studying R2, as this regression method requires fewer computing resources to perform. We used a linear model for ODR and OLSR as we evaluated it as being the most applicable for our purposes primarily following from the finding that typically the first-order, i.e. linear, term dominates over higher-order ones when describing the relationship between two variables with the Taylor series.
The statistical significance testing of the results was performed using Student's t test (95 % confidence interval) with adjusted degrees of freedom (DFadj), according to Eq. (31) from Bretherton et al. (1999), to account for autocorrelation of the time series as follows:
where T stands for the number of days in one sample (in our case, days in seasons for the periods of 1980–2000 or 2001–2021), R1 is for the correlation coefficient of the lag 1 auto-correlation of SIC, and R2 is for the correlation coefficient of the lag 1 auto-correlation of surface radiative flux (ULW or USW). To test the field statistical significance of the coefficients of determination (OLSR) and differences in mean decadal seasonal values between the two study periods, we have used p value < 0.05 adjusted by αFDR = 0.10 (false discovery rate, according to Wilks, 2016) to reject the null hypothesis that the time series are independent.
As we concluded in the companion paper, the largest differences in the effects of Arctic SIC on surface turbulent fluxes in reanalyses come from the representation of the sea ice, which is modelled in NCEP/CFSR and prescribed in ERA5, JRA-55, and MERRA-2. In Table 1, we reiterate the most important differences in the representation of the sea ice in reanalyses and furthermore present differences in parameterization of the sea-ice albedo.
Ebert and Curry (1993)ECMWF (2016)Duynkerke and de Roode (2001)Table 1Forecast model and representation of the sea ice in reanalyses.
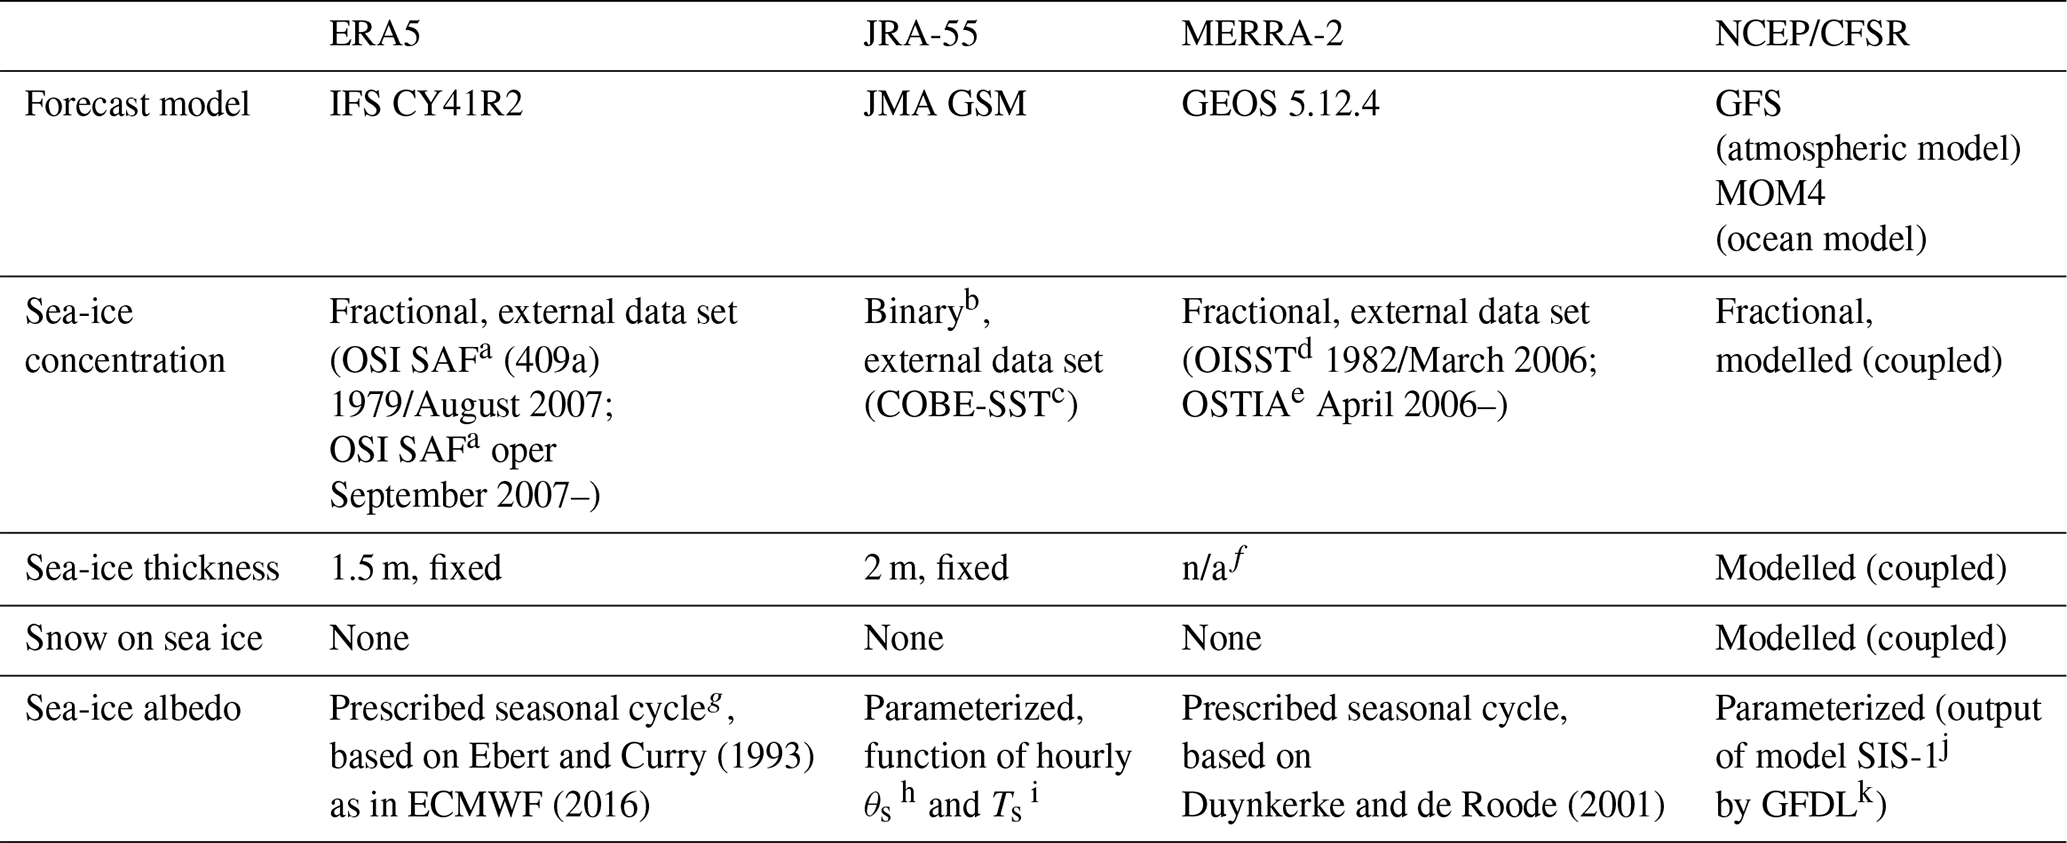
a Ocean and Sea Ice Satellite Application Facility. b SIC > 0.55 = 1, SIC ≤ 0.55 = 0. c Centennial In Situ Observation-based Estimates of the Variability of Sea Surface Temperatures and Marine Meteorological Variables. d Optimum Interpolation Sea Surface Temperature. e Operational Sea Surface Temperature and Ice Analysis. f A 7 cm ice layer for computing a prognostic ice surface temperature, which is then relaxed towards 273.15 K as a representation of the upward oceanic heat flux. g Considering albedo of fresh snow on top of sea ice (0.85) and its simplified metamorphosis (0.85–0.5). h Solar zenith angle. i Surface temperature. j Sea Ice Simulator. k Geophysical Fluid Dynamics Laboratory.
n/a: not applicable.
3.1 Effects of sea-ice concentration on surface upward longwave radiative flux
Utilizing linear bilateral ODR analysis, we assessed the effects of SIC on ULW. These two variables were negatively correlated in all seasons and both study periods (Fig. 1; see Figs. S1, S3, and S4 in the Supplement), meaning that less SIC leads to more ULW or more SIC leads to less ULW. The sign of the correlation was in agreement with the theoretical expectations as the open-ocean surface in the Arctic is usually warmer than the sea-ice surface (and much warmer in the cold season from November–April) and accordingly emits more longwave radiation. As depicted in the above-mentioned figures, the sensitivity of ULW to SIC (slope of the regression line) did not vary considerably among reanalyses, with the highest values over 150 W m−2 ULW per −0.1 change in SIC in November–April in the Central Arctic (north of 81.5° N). The dark grey areas in Figs. 1, S1, S3, and S4 indicate a failure of the linear bilateral ODR model to converge. For JRA-55 (panels b, f, and j in these figures), this was caused by the binary representation of SIC in the reanalysis, which assigns a value of 1 to SIC > 0.55 and a value of 0 to SIC ≤ 0.55. Then, because the SIC in these dark grey areas was never less than 0.55 during the 21-year periods, every grid cell was assigned a value of 1. Hence, no dependence with ULW or any other variable could be found. In other reanalyses, the ODR model failure also occurred either because of very low variability in SIC or due to high uncertainty in the slope of regression between the two variables (as shown in Figs. S1 and S2). In the warm season (May–October), the effect of SIC on ULW was generally weaker, with up to 80 W m−2 ULW per −0.1 change in SIC (Figs. S3 and S4).
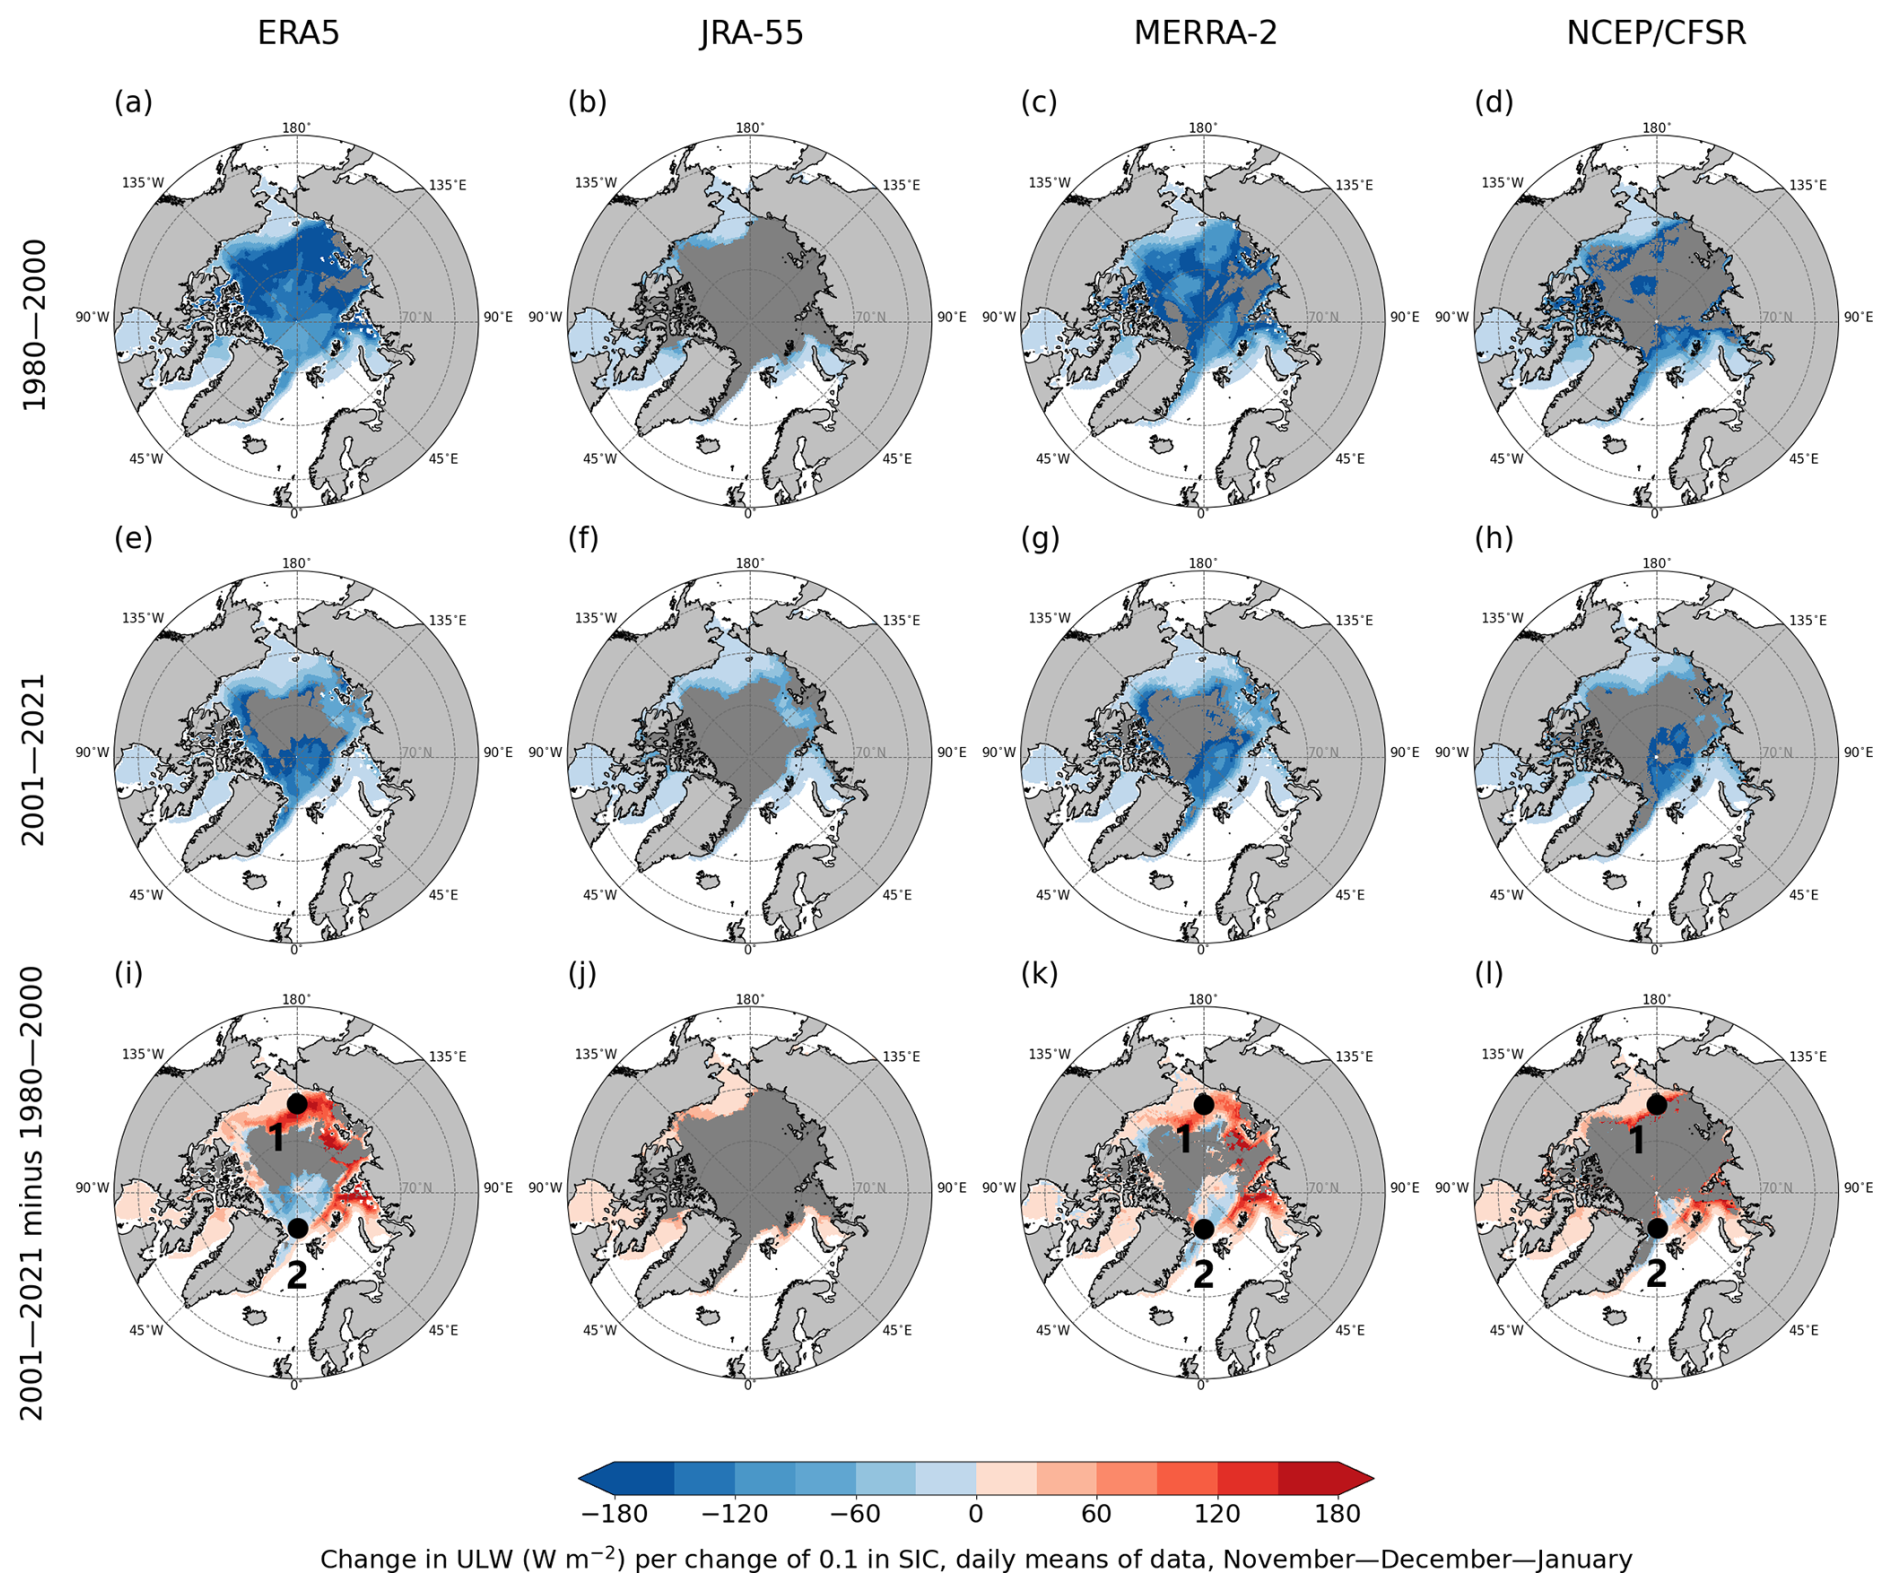
Figure 1Change in upward longwave radiative flux (W m−2) per change of 0.1 in the sea-ice concentration (slope of regression line) in the marine Arctic in November–December–January in four reanalyses (columns), based on the linear orthogonal distance regression (ODR) model. Dark grey indicates areas where the ODR model did not converge; in panels (i)–(l), dark grey shows these areas in 1980–2000 and/or 2001–2021. Only grid cells with a mean of SIC > 0.5 were considered, and only the slopes whose 95 % confidence intervals do not overlap zero are shown (others are masked in white). Points 1 and 2 (in black) from panels (i), (k), and (l) are further analysed in Fig. 2.
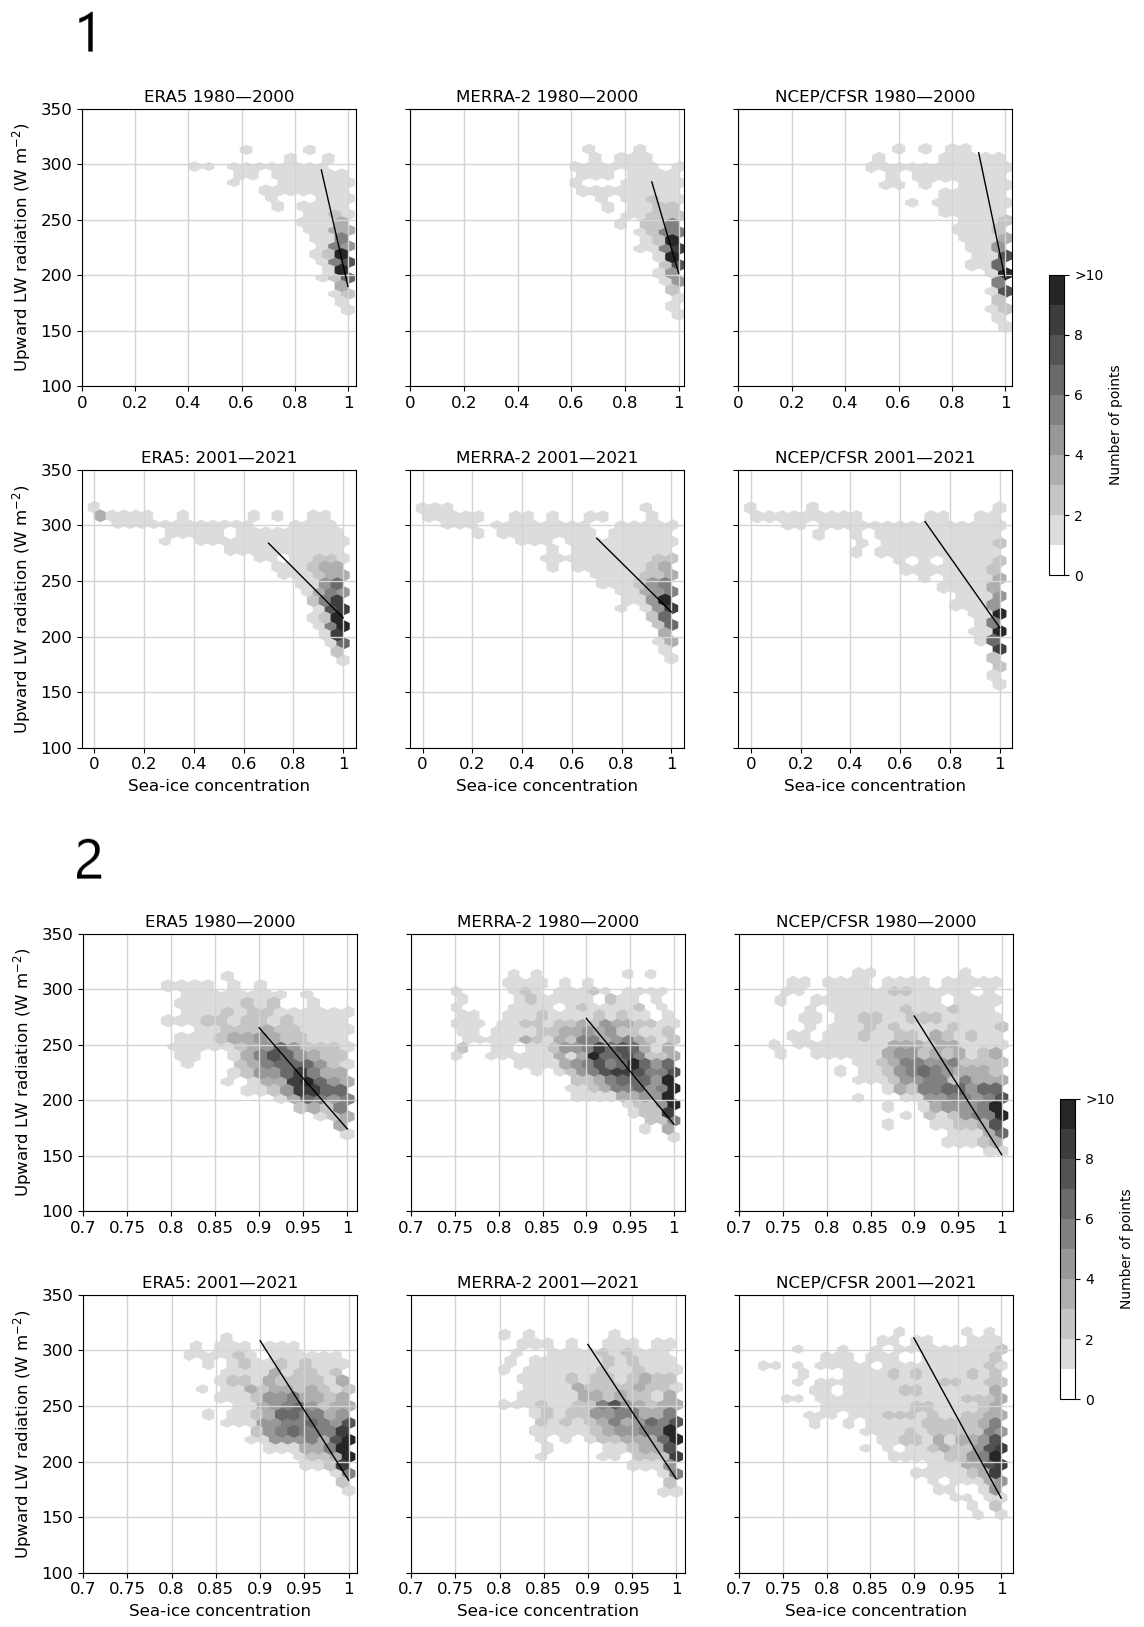
Figure 2Daily sea-ice concentration (SIC) and upward longwave radiative flux (ULW) in selected grid cells as indicated in Fig. 1 in panels (i), (k), and (l), where the sensitivity of ULW to SIC between 1980–2000 and 2001–2021 decreased (Point 1; grid cell nearest to 73° N, 180° W) and increased (Point 2; grid cell nearest to 83° N, 0° W). ERA5, MERRA-2, and NCEP/CFSR data show days in November–December–January (1932 d). Solid black lines depict (part of) the regression line and illustrate their slope.
The sensitivity of ULW to SIC mostly decreased in all seasons between 1980–2000 and 2001–2021 (shades of red in panels i–l in Figs. 1, S1, S3, and S4) but strengthened in the Central Arctic (shades of blue panels i–l in Figs. 1, S1, S3, and S4). To explain these changes, in Fig. 2, we show the daily values of SIC and ULW in grid cells from ERA5, MERRA-2, and NCEP/CFSR data, where the sensitivity changed considerably between 1980–2000 and 2001–2021 in November–December–January. While in Point 1 (see Fig. 1), from the border of the Chukchi and East Siberian seas, the slope of the regression line became less steep in 2001–2021 compared to 1980–2000, in Point 2, from the Central Arctic, the slope became steeper in the second (more recent) study period.
As shown in Uhlíková et al. (2024; Fig. 5), the surface temperature of the Arctic sea ice (bare or snow-covered; Tice) generally increased between the two study periods; hence, the difference between Tice and the sea surface temperature decreased, causing lower sensitivity of ULW to SIC in the majority of the Arctic in all seasons in the second study period. Also in this study, we show in Point 1 of Fig. 2 that ULW (and therefore the surface temperature) is generally higher in 2001–2021 (lower panels) than 1980–2000 (upper panels) in days with SIC = 1. Another cause of decreasing sensitivity of ULW to SIC is the fact that in areas where the SIC declined or disappeared completely between the two study periods, there is naturally a smaller effect or no effect of SIC on ULW in the second study period. ULW is also generally not so sensitive to SIC in regions where SIC is low because, in such regions, Tice is typically higher and closer to the sea surface temperature. This is illustrated in the lower panels of Point 1 of Fig. 2, where all the values of ULW in the grid cells with SIC lower than approximately 0.5 fluctuate close to 300 W m−2.
The increased sensitivity of ULW to SIC in smaller areas in the Central Arctic may be due to increased SIC in reanalyses in these areas in 2001–2021 compared to 1980–2000. As shown in Point 2 of Fig. 2, there is indeed higher SIC, as well as steeper slopes of the regression lines in the second study period (lower panels), than in the first one (upper panels). We discuss the possible mechanisms of the increased SIC in Sect. 4.1.
To further explore the effect of the surface type in the marine Arctic on ULW, we investigated whether the main driver of ULW is the SIC or Tice. To answer this question, we compared R2 (coefficient of determination) using SIC and Tice as explanatory variables for ULW. To calculate Tice from the grid-averaged surface temperature (Ts), we utilized the following equation:
where we assumed the temperature of the ocean (Tocean) at −1.8 °C (271.35 K). This assumption cannot be applied in the warm season (May–October) in the majority of adjacent seas outside the Central Arctic because the surface temperature of the ocean is likely often higher than −1.8 °C. Hence, we focused on the cold season (November–April) in these analyses. We are also aware that in the Greenland and Barents seas, even cold-season ocean temperature may be warmer than −1.8 °C due to the North Atlantic Current carrying warm Atlantic water to this area. We utilized data from only ERA5, MERRA-2, and NCEP/CFSR because JRA-55 comes with binary representation of SIC; hence, Eq. (2) is not applicable for this data set. As shown in Figs. 3 and S5, in November–April, Tice explained over 90 % of the variance of ULW in areas, where SIC is very high, whereas SIC explained only around 30 % of the variance in ULW in these areas. However, in the marginal ice zone, the coefficient of determination was higher for SIC (around 60 %) compared to Tice (< 30 %). These results were quantitatively very similar in both study periods, and we found very good agreement between the three reanalyses.

Figure 3Proportion of variance in the upward longwave radiation (ULW) explained by sea-ice concentration (SIC) and surface temperature of the ice (Tice) in November–December–January for 1980–2000 and 2001–2021 (columns), as represented in three reanalyses (rows), based on the linear ordinary least square regression model (coefficient of determination; R2) using daily means of data from ERA5, MERRA-2, and NCEP/CFSR. Only grid cells with a mean of SIC > 0.5 were considered, and only statistically significant results at the 5 % level of significance are shown (insignificant values are masked in white).
3.2 Effects of sea-ice thickness on surface upward longwave radiative flux
In addition to SIC, sea-ice thickness and snow depth on top of sea ice affect the surface temperature and, hence, the upward longwave radiation. Due to the limited amount and accuracy of data on sea-ice thickness and snow depth in the Arctic Ocean, we estimate their effect on ULW via analytic calculations, analogous to those in Uhlíková et al. (2024). We focus on the cold season when the insulating effects of ice and snow are largest. As a first approximation, we assume that the temperature profile through ice and snow is piecewise linear, resulting in the following expression for the conductive heat flux C (Makshtas, 1991):
where ki stands for the heat conductivity of ice, Ts for the ice surface temperature, Tb for the ice bottom temperature, hi for the ice thickness, ks for the heat conductivity of snow, and hs for snow thickness. We used −1.8 °C for Tb, 2.1 W m−1 K−1 for ki, and 0.3 W m−1 K−1 for ks. The turbulent fluxes of latent and sensible heat (LHF and SHF) were calculated by applying the following standard bulk formulae:
where ρ stands for the air density, LE for the latent heat of sublimation, cp for the specific heat of the air, and CHE for the turbulent exchange coefficient. (Qa−Qs) and (Ta−Ts) are the differences in the specific humidity and temperature between the lowest atmospheric level and the surface, and V stands for the wind speed at the lowest atmospheric level of the model applied in each reanalysis. The upward longwave radiation (ULW) was calculated as follows:
where σ stands for the Stefan–Boltzmann constant ( W m−2 K−4). As in Uhlíková et al. (2024), the downward longwave radiation (DLW) and the input for Eqs. (3) to (6) were taken from observations from the SHEBA campaign in the Central Arctic in February 1998 (Persson et al., 2002) when the mean values were as follows: 155 W m−2 for DLW, 5.0 m s−1 for V, −32 °C for Ta, and 0.9 for the relative humidity, yielding 0.17 g kg−1 for Qa. Then Eqs. (3) to (6) were solved by applying the following values of hi: 0.2, 0.5, 1.0, 1.5, 2.0, 2.5, and 3.0 m, with hs systematically set as 0.1 × hi. As Ts is unknown, and all the fluxes except DLW depend on it, a set of calculations with various Ts values was carried out for each combination of hi and hs until the Ts yielded a zero net heat flux (DLW − ULW + SHF + LHF + C) at the snow surface to represent equilibrium conditions.
The sensitivity of Ts, C, and ULW to snow and ice thickness is presented in Fig. 4. In the case of thin ice, the snow surface temperature is highly sensitive to ice thickness, but the sensitivity decreases when the ice gets thicker (Fig. 4a). This is reflected in ULW. For 0.2 m ice thickness (0.02 m snow depth), ULW is 227 W m−2, whereas for 3 m ice thickness (0.3 m snow depth) ULW is 183 W m−2, representing a difference of −44 W m−2. The difference in ULW between ice thicknesses of 2 and 3 m is minor (−2 W m−2), as the conductive heat flux through ice and snow is small already for 2 m thick ice (covered by 0.2 m snowpack). A comparison of Figs. 4 and S1 shows that in winter in the Bering Sea, the Sea of Okhotsk, and the Barents Sea, ULW is approximately equally sensitive to a decrease in ice thickness from 3 to 0.2 m and to a decrease in SIC by 0.1. However, closer to the central Arctic Ocean and in the Canadian Arctic archipelago, the sensitivity is higher for a decrease in SIC by 0.1. These high statistical sensitivities to SIC may be partly due to co-occurrence of low SIC and high ice surface temperatures.

Figure 4Sensitivity of snow surface temperature (a), conductive heat flux through snow and ice (b; dashed line), and upward longwave radiation (b; solid line) to sea-ice thickness and snow depth (set as 10 % of the ice thickness). The numbers are representative of February in the central Arctic Ocean.
3.3 Effects of sea-ice concentration on surface upward shortwave radiative flux
The sea-ice (bare or snow-covered) has much higher surface albedo (the proportion of incident shortwave radiation that is reflected back to space by the surface) than the open sea. Hence, as expected, we found a positive correlation between SIC and USW, meaning more SIC leads to more USW or less SIC leads to less USW in all seasons with solar radiation present in the Arctic (Figs. 5, S6, S8). USW was the most sensitive to SIC in May–June–July in the Central Arctic, with over 100 W m−2 USW per 0.1 change in SIC. The ODR model did not converge in large ares of the marine Arctic in February–March–April and August–September–October due to a lack of variability in incoming solar radiation, which was mostly very low during these months, and in SIC, which was very high. This is illustrated for representative grid cells in Figs. S6 and S7.
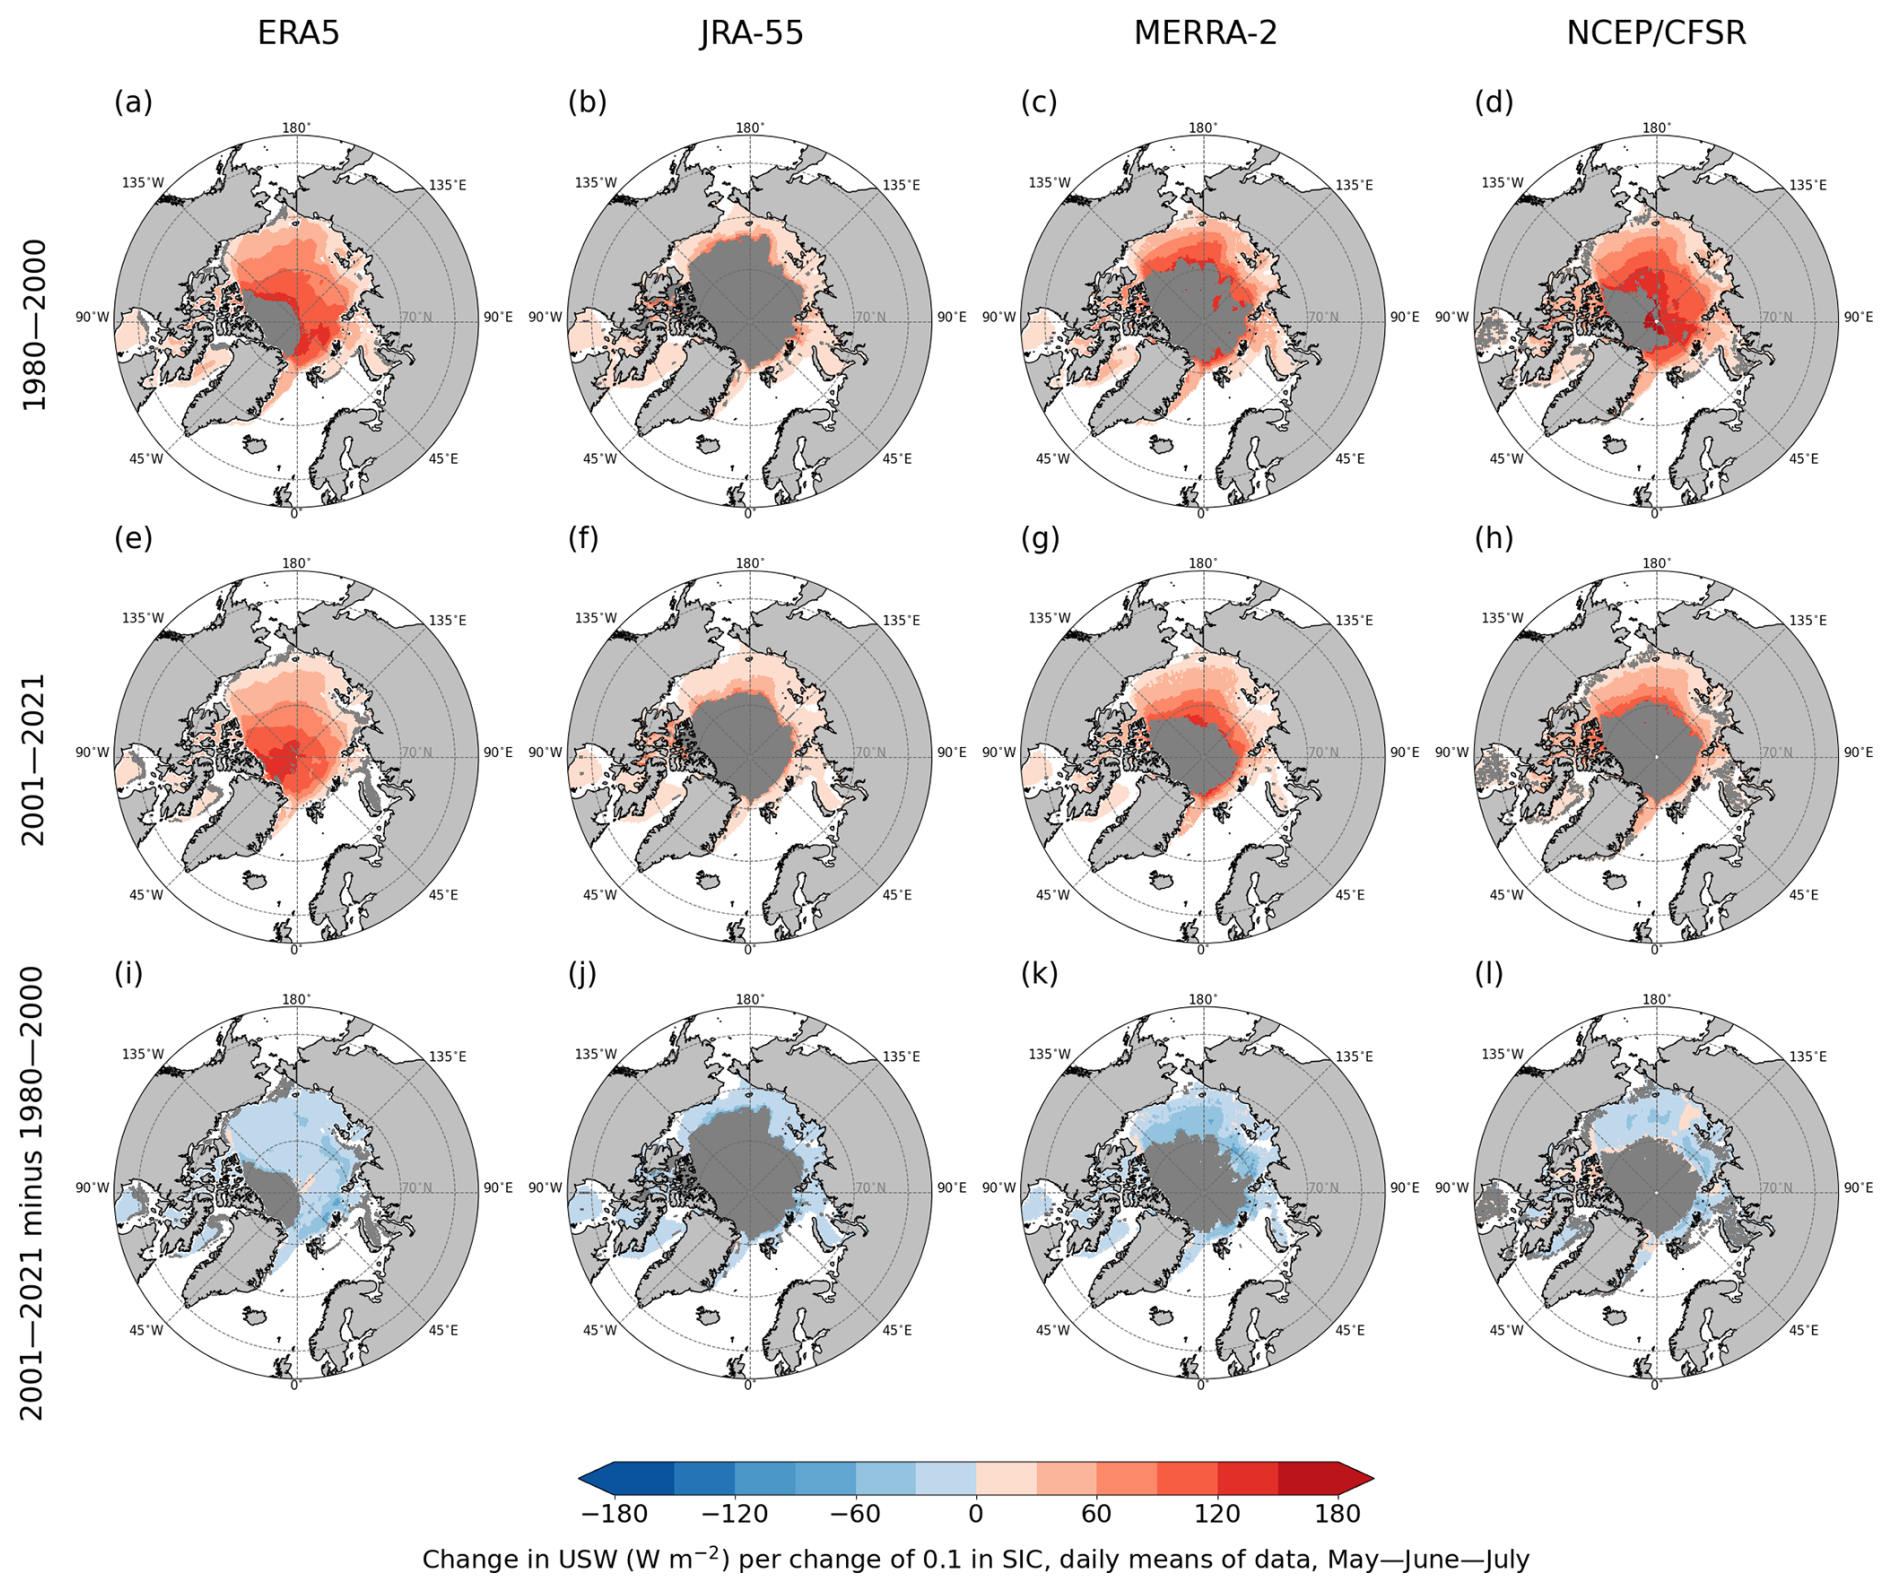
Figure 5Change in upward shortwave radiative flux (W m−2) per 0.1 change in sea-ice concentration (slope of regression line) in the marine Arctic in May–June–July in four reanalyses (columns), based on the linear orthogonal distance regression (ODR) model. Dark grey indicates areas where the ODR model did not converge; in panels (i)–(l), dark grey shows these areas in 1980–2000 and/or 2001–2021. Only grid cells with a mean of SIC > 0.5 were considered, and only the slopes whose 95 % confidence intervals do not overlap zero are shown (others are masked in white).
The effect of SIC on USW weakened between 1980–2000 and 2001–2021 in nearly all of the Arctic (shades of blue in panels i–l in Figs. 5 and S6). As discussed in Sect. 3.1, the sea-ice decline in adjacent Arctic seas naturally contributes to the decreased effect of SIC on ULW; the same applies also to SIC effect on USW. However, because USW is a result of the downward shortwave radiation (DSW) and the reflectivity of the surface (surface albedo), the decrease in USW sensitivity to SIC between the study periods could have been caused by changes in either or both of its above-mentioned drivers. To address this issue, we created Figs. 6, 7, and S10–S13, which show changes in the seasonal means of shortwave radiative fluxes between the periods (ΔDSW; ΔUSW), ΔUSW explained by change in DSW (ΔUSWDSW), and ΔUSW explained by change in surface albedo (b; ΔUSWb). The above-mentioned variables were calculated for each grid cell using daily data according to the following equations:
For May–June–July, Fig. 6a–d shows that the reanalyses agreed on the strongest decline (around −15 W m−2) in the mean DSW between 1980–2000 and 2001–2021 in the northern Barents Sea between Svalbard and Novaya Zemlya and some smaller degree of decline in this variable in other adjacent Arctic seas. All reanalyses also agreed on an increase around 10 W m−2 in the mean DSW between 1980–2000 and 2001–2021 in the Central Arctic, north of Greenland, and the Canadian archipelago. However, the areal extent of this increase varied considerably between the data sets, with NCEP/CFSR showing the largest one, followed by MERRA-2. According to Fig. 7 (row i), the areas of increased DSW correspond with those where CCC (vertically integrated cloud water + ice) diminished between the two study periods. Conversely, the area of the strongest decadal seasonal reduction in DSW in northern Barents Sea between Svalbard and Novaya Zemlya can be connected with the one where CCC increased.
Mean USW between 1980–2000 and 2001–2021 (Fig. 6e–h) declined in most of the adjacent Arctic seas by more than −25 W m−2 in all reanalyses. In agreement with theoretical expectations, most of the decadal seasonal reduction in USW outside the Central Arctic (around 80 %) was attributed to the decrease in surface albedo (shades of blue in Figs. 6m–p and 7, row ii) which, to a large degree, coincided with SIC decline (shades of blue in Fig. 7, row iii). However, the reduction in DSW (around −5 W m−2) also played a role (Fig. 6i–l). Furthermore, ERA5 and NCEP/CFSR indicated an increase in mean USW (around +10 W m−2) in 2001–2021 in the Central Arctic, north of Greenland, and the Canadian archipelago (shades of red in Fig. 6e, h) which spread about equally between an increase in albedo and DSW in this area (shades of red in Fig. 6i, l, m, p).
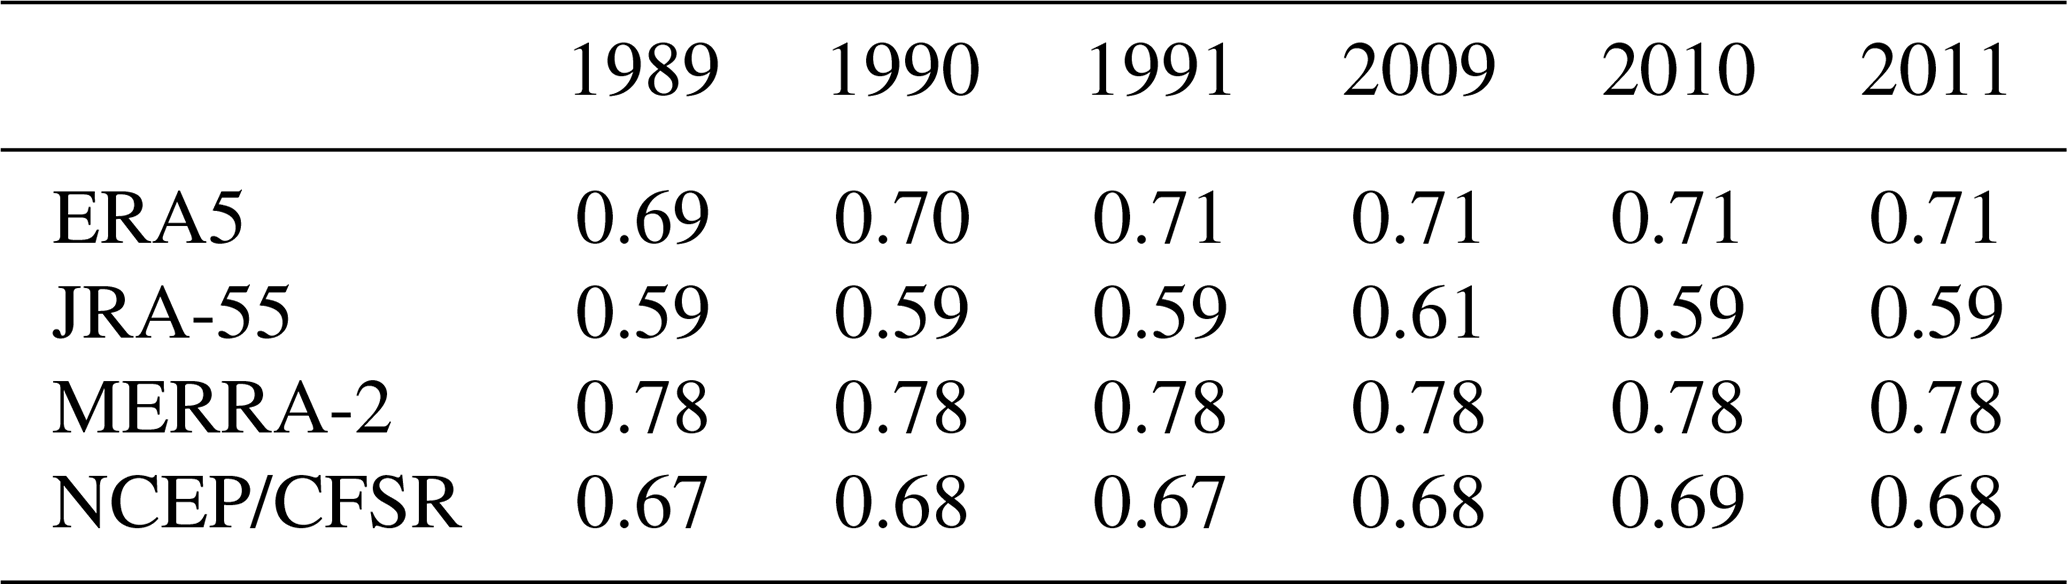
To offer a comparison of the absolute values of the sea-ice albedo between reanalyses, we calculated its daily and monthly means at the North Pole in six Junes in the middle of the two study periods (1989, 1990, 1991, 2009, 2010, and 2011). To obtain the sea-ice albedo (bice) from grid-averaged surface albedo (bs), we utilized the following equation:
where we assumed the albedo of the ocean bocean at 0.06. Monthly means of bice are shown in Table 2, and daily means are depicted in Fig. S9. In all selected peak summer months, the sea-ice albedo in MERRA-2, which has a prescribed seasonal cycle, was the highest among the reanalyses, and the albedo parameterized in JRA-55 was the lowest in the monthly and nearly all daily means. These two data sets varied by up to around 0.2. The June monthly means of the sea-ice albedo in ERA5 and NCEP/CFSR were very similar, even though the variable is modelled in NCEP/CFSR and prescribed in ERA5. The daily means of surface albedo between these two data sets varied by up to 0.1.
In February–March–April, we found very little statistically significant decadal differences in DSW; however, reanalyses generally agreed that there was an increase in CCC over the Barents Sea between Svalbard and Novaya Zemlya and a decline along the east coast of Greenland (Fig. S11, row i). We found mostly a decadal reduction in USW (around −15 W m−2) in the marginal ice zone (shades of blue; Fig. S10e–h). This reduction, similar to May–June–July, was mostly attributed to decline in surface albedo (Fig. S10m–p) but partly also to the reduction in DSW (Fig. S10i–l).
In August–September–October, we noted a decadal reduction in the mean DSW around −10 W m−2 in adjacent Arctic seas. All reanalyses also agreed on a decadal reduction in the mean USW, though they disagreed on the magnitude over the Beaufort, Chukchi, East Siberian, and Laptev seas. In these areas, the decrease in USW ranged between around −20 W m−2 in JRA-55 and around −10 W m−2 in MERRA-2 (Fig. S12e–h). As in the two previously mentioned seasons, more of the mean USW reduction between 1980–2000 and 2001–2021 was attributed to the decline in surface albedo than a decline in the DSW. Regarding decadal changes in the mean CCC, we found a strong increase across the Arctic, though reanalyses showed a large scatter on the magnitude and spatial pattern of this change (Fig. S13, row i).
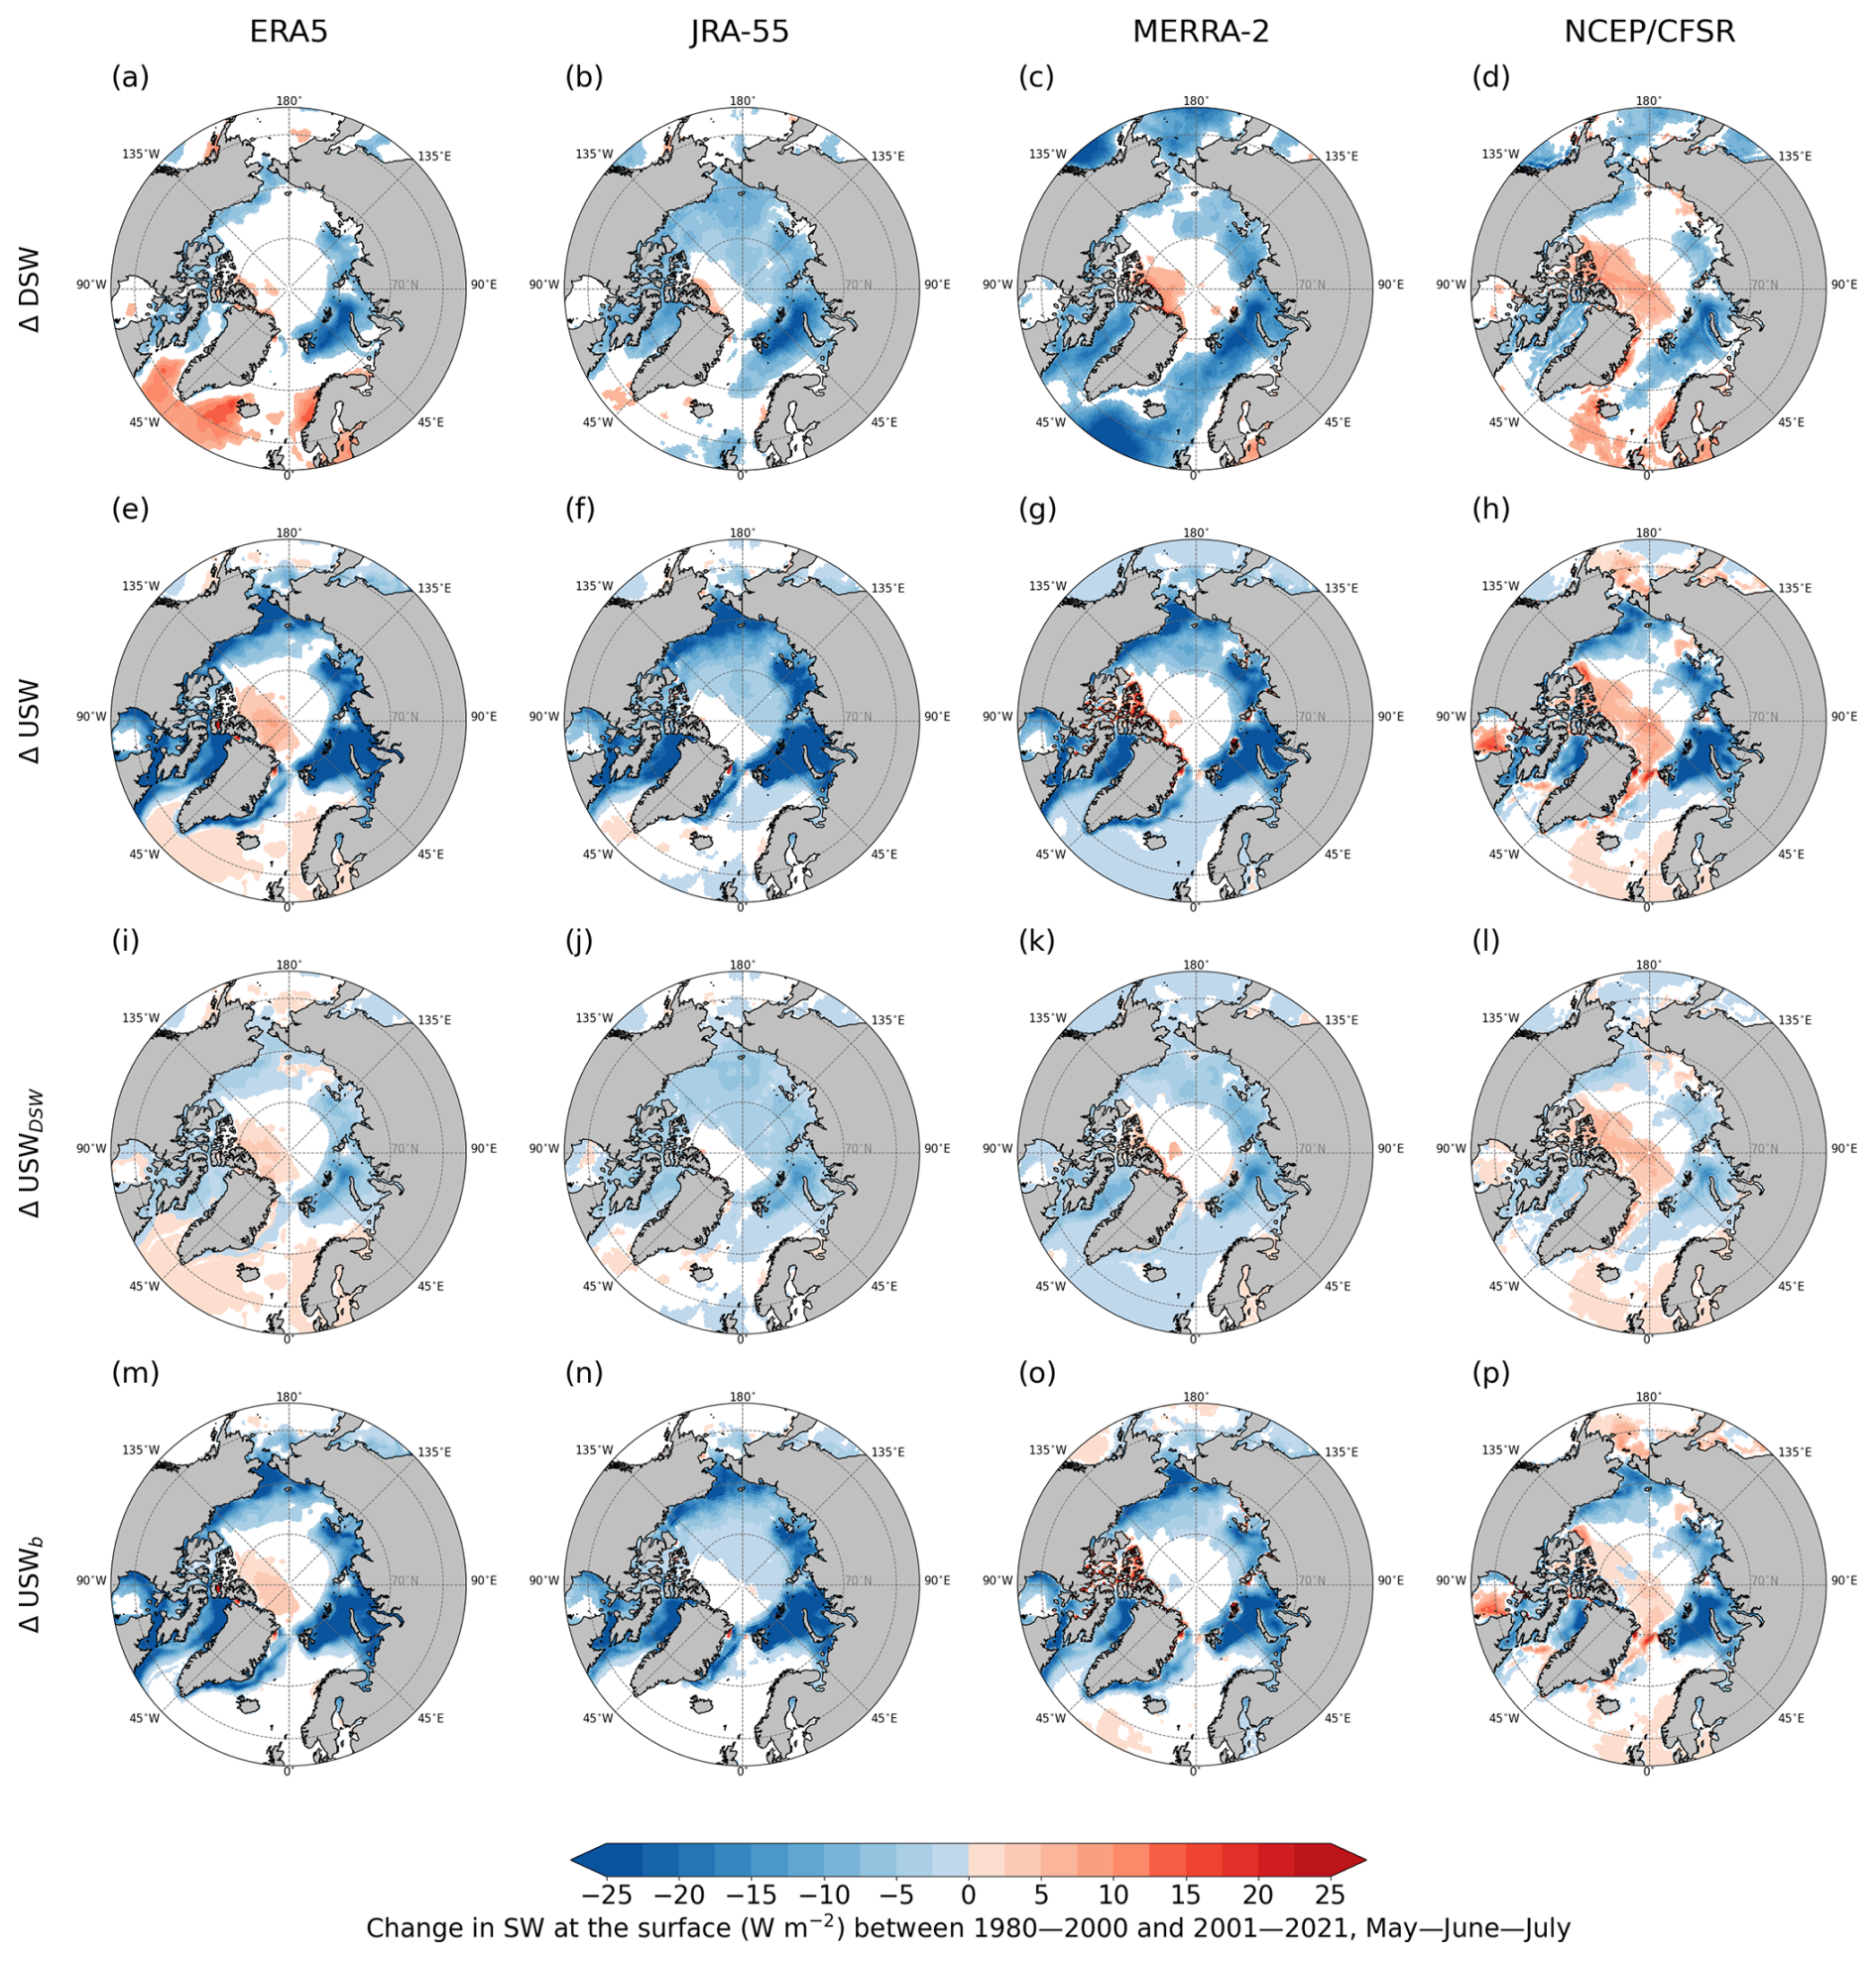
Figure 6Changes in decadal means (calculated from daily means) between 1980–2000 and 2001–2021 in May–June–July. Panels (a)–(h) show changes in surface downward and upward shortwave radiative fluxes (ΔDSW; ΔUSW), panels (i)–(l) show changes in USW explained by changes in DSW (ΔUSWDSW), and panels (m)–(p) show changes in USW explained by changes in albedo (ΔUSWb). Only statistically significant results at the 5 % level of significance are shown (insignificant values are masked in white); statistically significant grid cells for ΔUSW, ΔUSWDSW, and ΔUSWb are identical. Values within an interval W m−2 are also masked in white.
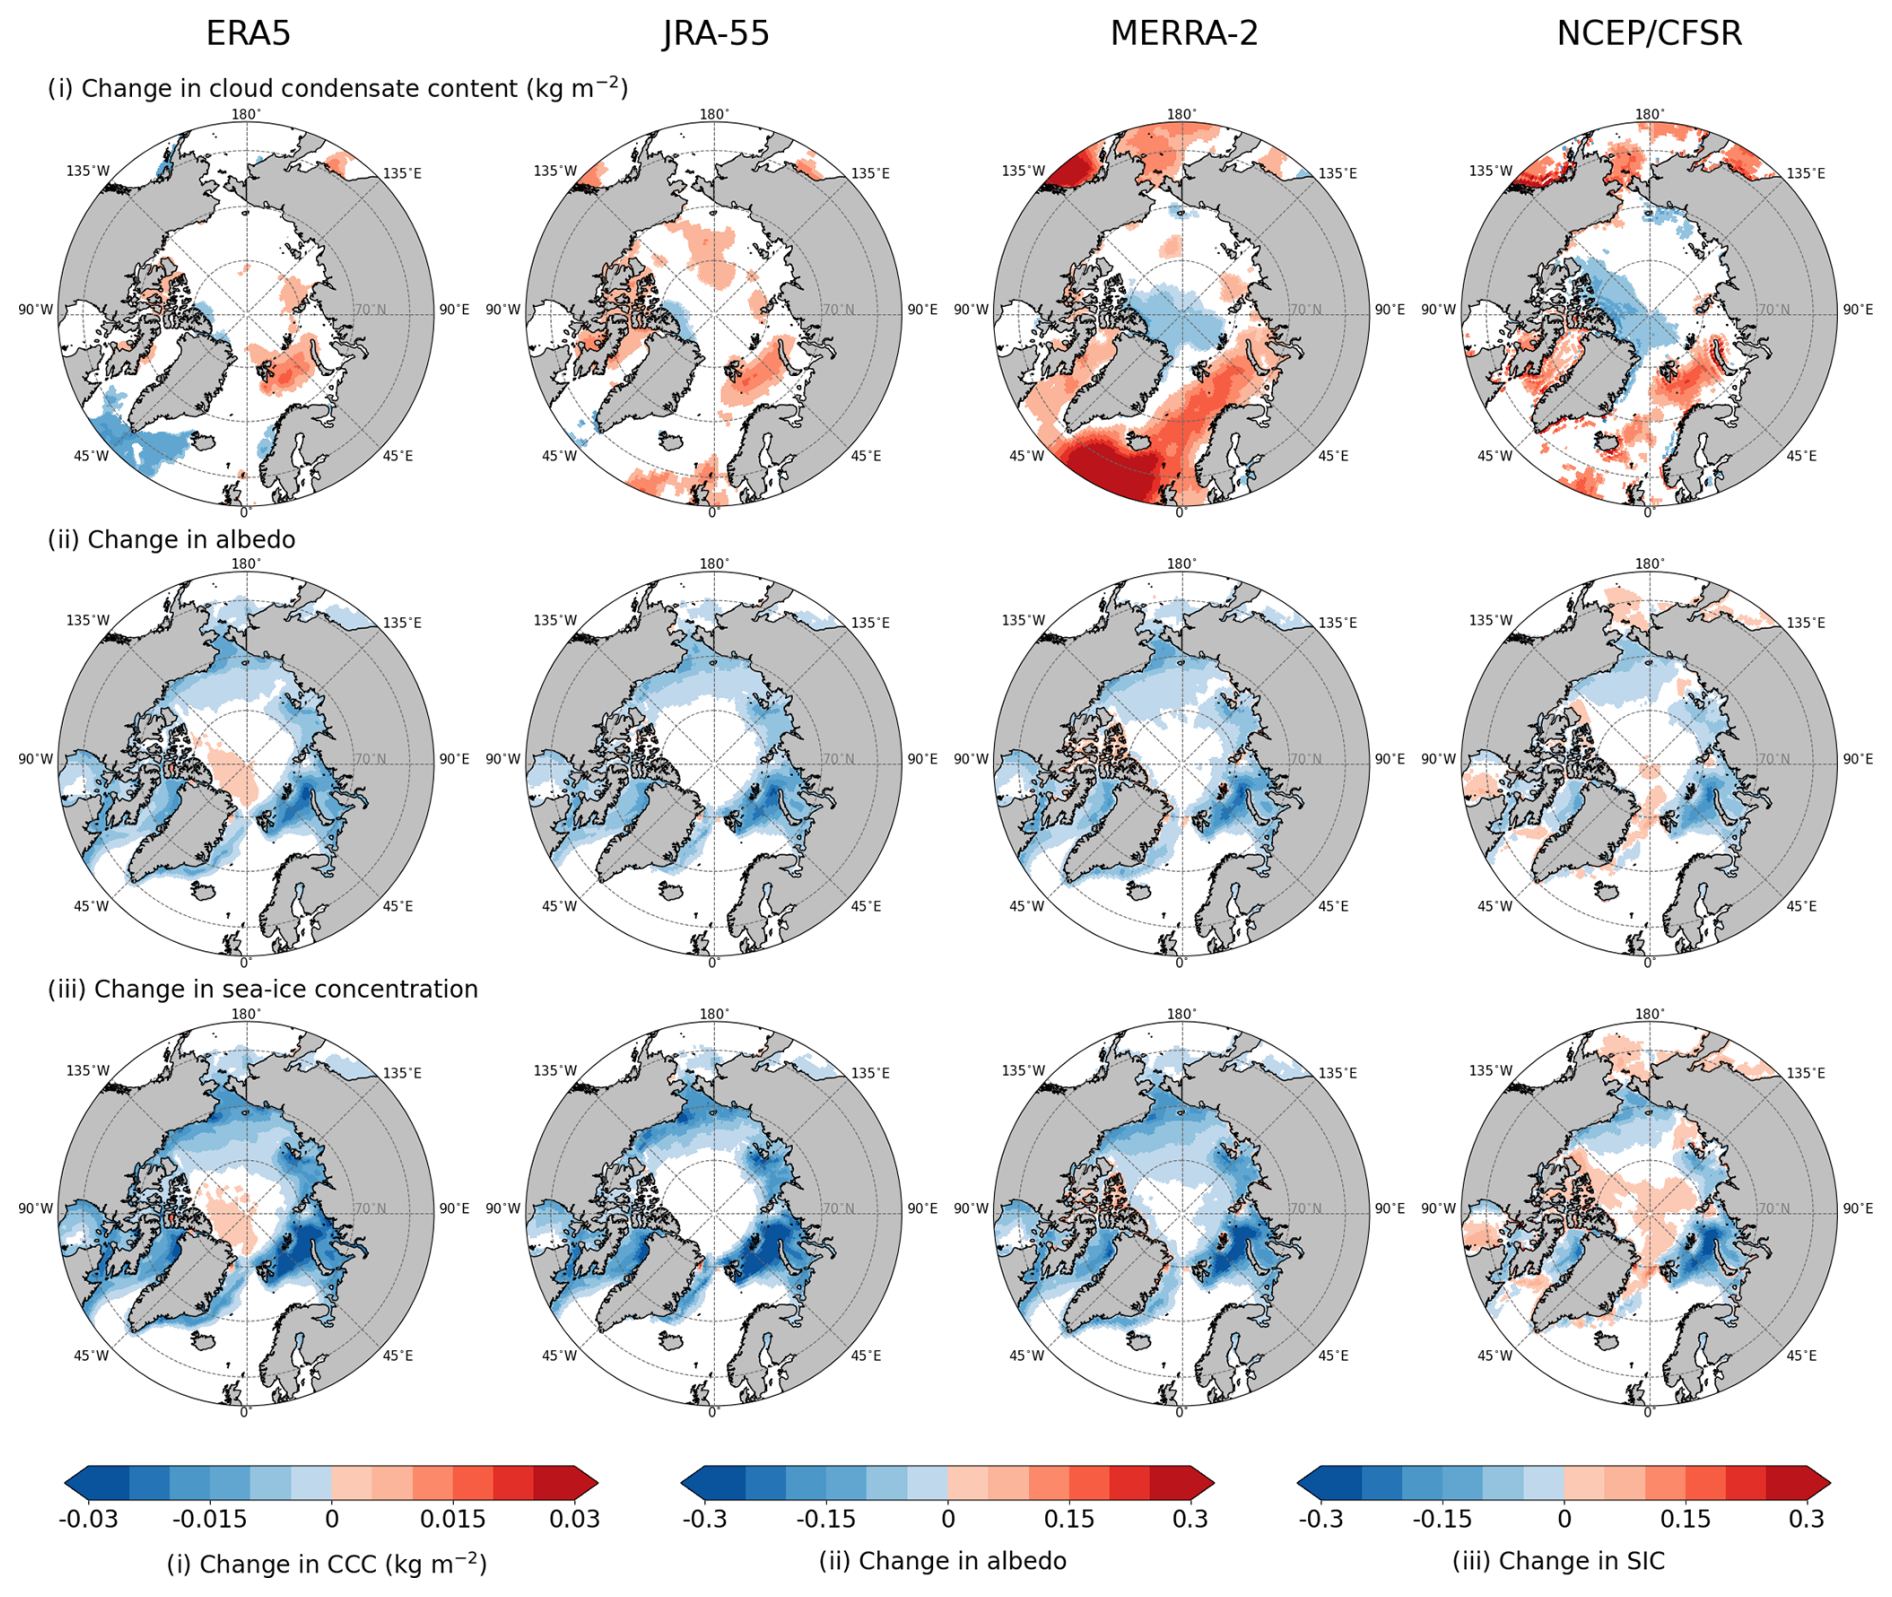
Figure 7Changes in decadal means (calculated from daily means) for 2001–2021 minus 1980–2000 in May–June–July. Row (i) shows the cloud condensate content (CCC; vertically integrated cloud liquid water + ice), row (ii) shows the surface albedo, and row (iii) shows the sea-ice concentration (SIC). Only statistically significant results at the 5 % level of significance are shown (insignificant values are masked in white). In rows (ii) and (iii), values within an interval are also masked in white.
Table 2Monthly mean sea-ice albedo in the grid cell nearest to the North Pole (90° N, 0° W) in three Junes in the middle of the first study period (1989, 1990, and 1991) and three Junes in the middle of the second study period (2009, 2010, and 2011).
4.1 Differences between reanalyses in the effects of sea-ice concentration on surface upward longwave radiation
We found a negative correlation between SIC and ULW in all seasons and generally the highest sensitivity of ULW to SIC in the cold season November–April in the Central Arctic (Figs. 1 and S1). The magnitude of the highest sensitivities of ULW to SIC was similar among reanalyses, though their spatial extent differed to some extent.
The effect of the Arctic SIC on ULW mostly decreased in all seasons between 1980–2000 and 2001–2021 due to SIC decline and warming of the sea-ice surface; however, we also noted an increased sensitivity of ULW to SIC in the Central Arctic and north and northeast of Greenland in November–December–January. As shown in Fig. 2 (Point 2), the daily SIC in November–December–January increased in the Atlantic sector of the Central Arctic between 1980–2000 and 2001–2021 in ERA5, MERRA-2, and NCEP/CFSR. Figure S11 (row iii) also indicates a statistically significant decadal increase in SIC in this area for February–March–April. Greater daily SIC is then directly connected to increased sensitivity of ULW to SIC. The SIC increase may be related to the thinning of the Arctic sea ice, which reduces the internal resistance of the ice field and allows certain atmospheric and oceanic forcing to generate faster ice drift (Leppäranta, 2011). Higher drift speeds along the Transpolar Drift Stream (TDS) favour the increased accumulation of ice north of Greenland (Kwok, 2015), resulting in increased SIC. Another potential factor favouring faster ice drift is increased wind speeds along the TDS (Smedsrud et al., 2017). However, trends in the wind speeds are sensitive to the region and period addressed (Spreen et al., 2011; Vihma et al., 2012).
4.2 Differences between reanalyses in the effects of sea-ice concentration and clouds on surface upward shortwave radiation
Our results indicated a positive correlation between SIC and USW in all seasons, with the highest sensitivity of USW to SIC in May–June–July in the Central Arctic (Fig. 5). The magnitude of the effect of SIC on USW was similar in all reanalyses and mostly weakened between 1980–2000 and 2001–2021. While the sea-ice and its surface albedo decline plays an undeniable role in the weakening of this effect, decadal changes in DSW must also be considered when assessing decadal changes in USW.
Considering May–June–July, we found the magnitude of the decadal change in mean USW and its spatial pattern similar among reanalyses in adjacent Arctic seas; however, this variable differed somewhat in the Central Arctic (Fig. 6e–h). For example, ERA5 and NCEP/CFSR showed a decadal increase in the mean USW north of Greenland and the Canadian archipelago, whereas JRA-55 indicated a decadal reduction in the mean USW where other reanalyses did not show significant changes. Such results are similar to those of Cao et al. (2016), who considered the surface albedo product from the Satellite Application Facility on Climate Monitoring clouds, albedo, and radiation data set (CLARA-SAL), in addition to reanalyses data from 1982–2009. According to their findings, JRA-55 data agreed the best with the satellite observations, which did not show any increase in annual surface albedo north of Greenland and the Canadian archipelago that we saw in ERA5 and NCEP/CFSR data.
4.3 The role of clouds on surface radiative fluxes and their differences between reanalyses
The clouds in the Arctic typically have a positive net radiative effect on the surface for most of the year as they have more impact by emitting longwave radiation towards the surface (DLW) and warming it than cooling it by reflecting the shortwave radiation back to space (Wendish et al., 2019; Morrison et al., 2019). In May–June–July, however, incoming solar radiation in the Arctic is very high, and clouds regulate the melting of sea ice and partly offset the strength of the sea ice–albedo feedback (Choi et al., 2020). The sign and strength of the radiative effect of clouds mostly depend on the cloud fraction, longevity, opacity (liquid-/ice-phase partitioning), and temperature of the cloud layer. The presence and properties of clouds have the potential to considerably affect the surface and near-surface temperature and humidity. As we showed in Figs. 3 and S5, in areas with high SIC, changes in Tice are important for explaining the variance in ULW in November–April, and these may be, to a large extent, driven by changes in clouds. At the same time, SIC also affects the formation of clouds via turbulent surface fluxes of sensible and latent heat. As shown in observational studies by Palm et al. (2010) and Liu et al. (2012) and in the study of Schweiger et al. (2008), who used reanalysis data from ERA40 (predecessor of ERA5), cloud cover variability near sea ice margins is strongly linked to sea-ice variability, and areas with increased mid-level cloudiness coincide with those of recent sea-ice decline. Also, in our results, throughout the seasons, we saw the decadal increase in CCC in areas of strong SIC decline, although the reanalyses did not always agree on the magnitude or spatial extent of this increase. The increase in CCC is in line with Sledd and L'Ecuyer (2021).
Despite their importance for the Arctic surface energy budget, clouds appear to be one of the largest sources of uncertainty as a variable in reanalyses and as a component of the Arctic climate system. This is mostly because the retrieval of the cloud fraction and cloud properties (such as optical depth, top pressure, or cloud condensate content) from satellite measurements includes considerable uncertainties when using different sensors or even different approaches to derive the data from measured radiances (Devasthale et al., 2020). Also, the insufficiency of a supporting ground-based observational network in the Arctic contributes to the uncertainties. In our study, we only calculated decadal seasonal differences in the mean CCC, but even by using this simple calculation and just one cloud parameter, we noted a large spread in values between the reanalyses (row i in Figs. 7, S11, and S13).
In reality, aerosols also affect the radiative properties of Arctic clouds (Garrett and Zhao, 2006). These effects have undergone notable changes due to shifts in aerosol sources and regional atmospheric conditions (Warneke et al., 2010; Platt et al., 2022). Among the reanalyses applied in this study, MERRA-2 is based on the daily assimilation of aerosol data, whereas ERA5, JRA-55, and NCEP/CFSR apply climatological aerosol concentrations. In principle, it should be possible to distinguish the contribution of aerosols to the radiative transfer and its seasonal and decadal changes; however, the output available from the reanalyses is not sufficient for such analyses.
4.4 The role of surface albedo and its differences between reanalyses
Surface albedo is a key component of Arctic climate system. This property of the surface is the most important in May–June–July when the incoming shortwave radiation peaks and low albedo allows a much larger part of it to penetrate into (and warm) the surface. While the snow and sea ice and their properties control the surface albedo, at the same time, surface albedo controls the mass balance of snow and sea ice. This effect has a seasonal cycle when (1) the bare sea ice with a large number of melt ponds and lower albedo during the melt season accelerates further ice melt by allowing more shortwave radiation to be absorbed, while (2) the dry snow on top of the sea ice generates greater surface albedo before and after the melt season, protecting the sea ice from shortwave radiative warming. Pistone et al. (2014) showed the close relationship of SIC and the surface albedo in satellite data from the Clouds and Earth's Radiant Energy System (CERES) and the Special Sensor Microwave/Imager (SSM/I), and our results demonstrated that the patterns of diminishing SIC coincided with the patterns of the surface albedo decrease (rows ii and iii in Figs. 7, S11, and S13).
The albedo of the sea ice is parameterized in JRA-55 and NCEP/CFSR, considering summer melt ponds and surface temperature, whereas in ERA5 and MERRA-2, it has a prescribed seasonal cycle that is the same for the whole study period of our analyses. Pistone et al. (2014) observed pan-Arctic darkening with clear-sky albedo decreasing from 0.39 to 0.33 and all-sky albedo decreasing from 0.54 to 0.48 during 1979–2011. These findings and their consequences for the prescribed surface albedo in reanalyses are demonstrated in the comparison study by Pohl et al. (2020), who utilized satellite data from the Medium Resolution Imaging Spectrometer (MERIS) to derive the albedo of Arctic sea ice. In their analyses, utilizing data from May to September 2003–2011, ERA5 was found to generally overestimate the albedo of first-year ice and underestimate the albedo of multiyear ice. An overestimation of the albedo likely happens due to not accounting (1) for the warming of the sea ice and (2) for the increasing amount of melt ponds on top of the sea ice during the melt seasons in recent decades. In our analyses, we observed differences up to around 0.2 in June albedo at the North Pole in daily and monthly means between MERRA-2 and JRA-55 and around 0.1 between MERRA-2 and ERA5 and NCEP/CFSR (Table 2; Fig. S9). These findings indicate a large uncertainty in the representation of the Arctic surface energy budget in these data sets during summer.
In the present study, we quantified the uncertainties in the effects of Arctic sea-ice concentration on surface radiative fluxes as represented in four atmospheric reanalyses to complement Uhlíková et al. (2024), where we addressed turbulent surface fluxes of sensible and latent heat. Our results showed the greatest sensitivity of surface upward longwave radiation to SIC in the cold season November–April (over 150 W m−2 per −0.1 change in SIC) and greatest sensitivity of surface upward shortwave radiation to SIC in May–July (over 100 W m−2 USW per 0.1 change in SIC). We found that the effect of SIC on the surface upward longwave and shortwave radiation has mostly weakened in all seasons between the study periods of 1980–2000 and 2001–2021. Unlike in the case of the effects of SIC on turbulent surface fluxes, we did not find a generally higher sensitivity of surface upward radiative fluxes to SIC in NCEP/CFSR (which includes modelled sea-ice thickness and snow depth on the sea ice and accounts for their insulating effects) compared to other reanalyses (which assume a constant sea-ice thickness and do not account for the snow on sea ice). Furthermore, we analysed decadal changes in surface downward and upward shortwave radiation and quantified differences among reanalyses in these variables and additionally in the surface albedo, sea-ice concentration, and cloud condensate content. These analyses indicated that approximately 80 % of the decadal decrease in upward shortwave radiation in May–July was caused by a decrease in surface albedo, controlled by SIC decrease, and the rest was caused by a decrease in the downward shortwave radiation due to an increase in cloudiness, mostly close to sea-ice margins.
Expanding quantitative knowledge on the differences in the representation of the Arctic surface energy budget in atmospheric reanalyses is needed because the Arctic amplification of climate warming is primarily surface-based (Serreze et al., 2009; Taylor et al., 2022), and reanalyses are broadly utilized and relied upon in studies on past climate and related processes in the Arctic.
The code used in this paper is available at https://doi.org/10.5281/zenodo.11565044 (Uotila and Uhlíková, 2024).
The data used in this paper are available at https://a3s.fi/uhlitere-2000789-pub/* (last access: 11 June 2024) (Hersbach et al., 2023: https://doi.org/10.24381/cds.adbb2d47; Japan Meteorological Agency, 2013: https://doi.org/10.5065/D6HH6H41; GMAO, 2015a: https://doi.org/10.5067/7MCPBJ41Y0K6; GMAO, 2015b: https://doi.org/10.5067/Q9QMY5PBNV1T; GMAO, 2015c: https://doi.org/10.5067/VJAFPLI1CSIV; Saha et al., 2010b: https://doi.org/10.5065/D69K487J; Saha et al., 2011: https://doi.org/10.5065/D61C1TXF). To download the desired file, the name of it must be entered after the last forward slash instead of *. The names of the files can be found in the code. The data description can be found at https://a3s.fi/uhlitere-2000789-pub/README2_data2.odt (last access: 13 May 2024).
The supplement related to this article is available online at https://doi.org/10.5194/tc-19-1031-2025-supplement.
TU prepared the paper with contributions of TV, PU, and AYK. TV, PU, and AYK designed the concept of the study with contributions from TU. PU developed the code with the contribution of TU. TU collected and processed the data and performed the analyses.
The contact author has declared that none of the authors has any competing interests.
Neither the European Commission nor ECMWF is responsible for any use that may be made of the Copernicus information or data it contains.
Publisher’s note: Copernicus Publications remains neutral with regard to jurisdictional claims made in the text, published maps, institutional affiliations, or any other geographical representation in this paper. While Copernicus Publications makes every effort to include appropriate place names, the final responsibility lies with the authors.
The data of Hersbach et al. (2023) were downloaded from the Copernicus Climate Change Service (C3S) Climate Data Store. The results contain modified Copernicus Climate Change Service information from 2024. Furthermore, we acknowledge the providers of the data in the other three reanalyses used in our study: the Japan Meteorological Agency, the National Center for Atmospheric Research (JRA-55, NCEP/CFSR, CFSv2), and the Global Modeling and Assimilation Office (MERRA-2).
During most of the work, Tereza Uhlíková was a university-funded doctoral researcher at the University of Helsinki. The work of Alexey Yu Karpechko, Petteri Uotila, Timo Vihma, and, in the final stage, Tereza Uhlíková has been supported by the European Commission's Horizon 2020 Framework Programme (PolarRES; grant no. 101003590).
Open-access funding has been provided by the Helsinki University Library.
This paper was edited by Stephen Howell and reviewed by two anonymous referees.
Andreas, E. L., Persson, P. O. G., Grachev, A. A., Jordan, R. E., Horst, T., Guest, P. S., and Fairall, C.: Parameterizing Turbulent Exchange over Sea Ice in Winter, J. Hydrometeorol, 11, 87–104, https://doi.org/10.1175/2009JHM1102.1, 2010. a
Boggs, P. T., Donaldson, J. T., Schnabel, R. B., and Spiegelman, C. H.: A Computational Examination of Orthogonal Distance Regression, J. Econometrics, 38, 169–201, https://doi.org/10.1016/0304-4076(88)90032-2, 1988. a
Bretherton, C. S., Widmann, M., Dymnikov, V. P., Wallace, J. M., and Bladé, I.: The Effective Number of Spatial Degrees of Freedom of a Time-Varying Field, J. Climate, 12, 1990–2009, https://doi.org/10.1175/1520-0442(1999)012<1990:TENOSD>2.0.CO;2, 1999. a
Cao, Y., Liang, S., He, T., and Chen, X.: Evaluation of Four Reanalysis Surface Albedo Data Sets in Arctic Using a Satellite Product, IEEE Geosci. Remote S., 13, 384–388, https://doi.org/10.1109/LGRS.2016.2515159, 2016. a
Choi, Y.-S., Hwang, J., Ok, J., Park, D.-S. R., Su, H., Jiang, J. H., Huang, L., and Limpasuvan, V.: Effect of Arctic clouds on the ice-albedo feedback in midsummer, Int. J. Climatol., 40, 4707–4714, https://doi.org/10.1002/joc.6469, 2020. a
Devasthale, A., Sedlar, J., Tjernström, M., and Kokhanovsky, A.: A Climatological Overview of Arctic Clouds, in: Physics and Chemistry of the Arctic Atmosphere, edited by: Kokhanovsky, A. and Tomasi, C., Springer International Publishing, Chap. 5, 331–360, 2020. a
Di Biagio, C., Pelon, J., Blanchard, Y., Loyer, S., Hudson, S. R., Walden, V. P., Raut, J.-C., Kato, S., Mariage, V., and Granskog, M. A.: Toward a better surface radiation budget analysis over sea ice in the high Arctic Ocean: a comparative study between satellite, reanalysis, and local-scale observations, J. Geophys. Res.-Atmos., 126, e2020JD032555, https://doi.org/10.1029/2020JD032555, 2021. a
Duynkerke, P. and de Roode, S.: Surface energy balance and turbulence characteristics observed at the SHEBA Ice Camp during FIRE III, J. Geophys. Res.-Oceans, 106, 15313–15322, https://doi.org/10.1029/2000JD900537, 2001. a
Ebert, E. E. and Curry, J. A.: An intermediate one-dimensional thermodynamic sea ice model for investigating ice-atmosphere interactions, J. Geophys. Res.-Oceans, 98, 10085–10109, https://doi.org/10.1029/93JC00656, 1993. a
ECMWF: IFS Documentation CY41R2 – Part IV: Physical Processes, No. 4, ECMWF, https://doi.org/10.21957/tr5rv27xu, 2016. a
Garrett, T. and Zhao, C.: Increased Arctic cloud longwave emissivity associated with pollution from mid-latitudes, Nature, 440, 787–789, https://doi.org/10.1038/nature04636, 2006. a, b
GMAO (Global Modeling and Assimilation Office): Tavg1_2d_flx_Nx: MERRA-2 2D, 1-Hourly, Time-Averaged, Single-Level Assimilation, Single-Level Diagnostics, Goddard Earth Sciences Data and Information Services Center (GES DISC) [data set], Greenbelt, MD, USA, https://doi.org/10.5067/7MCPBJ41Y0K6, 2015a. a, b
GMAO (Global Modeling and Assimilation Office): Tavg1_2d_rad_Nx: MERRA-2 2D, 1-hourly, Time-Averaged, Single-Level Assimilation, Surface Flux Diagnostics V5.12.4, Goddard Earth Sciences Data and Information Services Center (GES DISC) [data set], Greenbelt, MD, USA, https://doi.org/10.5067/Q9QMY5PBNV1T, 2015b. a, b
GMAO (Global Modeling and Assimilation Office): Tavg1_2d_slv_Nx: MERRA-2 2D, 1-Hourly, Time-Averaged, Single-Level Assimilation, Single-Level Diagnostics, Goddard Earth Sciences Data and Information Services Center (GES DISC) [data set], Greenbelt, MD, USA, https://doi.org/10.5067/VJAFPLI1CSIV, 2015c. a, b
Graham, R. M., Cohen, L., Ritzhaupt, N., Segger, B., Graversen, R. G., Rinke, A., Walden, V. P., Granskog, M. A., and Hudson, S. R.: Evaluation of Six Atmospheric Reanalyses over Arctic Sea Ice from Winter to Early Summer, J. Climate, 32, 4121–4143, https://doi.org/10.1175/JCLI-D-18-0643.1, 2019. a, b, c
Hersbach, H., Bell, B., Berrisford, P., Hirahara, S., Horányi, A., Muñoz Sabater, J., Nicolas, J., Peubey, C., Radu, R., Schepers, D., Simmons, A., Soci, C., Abdalla, S., Abellan, X., Balsamo, G., Bechtold, P., Biavati, G., Bidlot, J., Bonavita, M., and Thépaut, J.-N.: The ERA5 global reanalysis, Q. J. Roy. Meteor. Soc., 146, 1999–2049, https://doi.org/10.1002/qj.3803, 2020. a
Hersbach, H., Bell, B., Berrisford, P., Biavati, G., Horányi, A., J., M. S., Nicolas, J., Peubey, C., Radu, R., Rozum, I., Schepers, D., Simmons, A., Soci, C., Dee, D., and Thépaut, J.-N.: ERA5 hourly data on single levels from 1940 to present, Copernicus Climate Change Service (C3S) Climate Data Store (CDS) [data set], https://doi.org/10.24381/cds.adbb2d47, 2023. a, b, c
Japan Meteorological Agency (JMA): JRA-55: Japanese 55-year Reanalysis, Daily 3-Hourly and 6-Hourly Data, Research Data Archive at the National Center for Atmospheric Research, Computational and Information Systems Laboratory [data set], https://doi.org/10.5065/D6HH6H41, 2013. a, b
Jonassen, M. O., Välisuo, I., Vihma, T., Uotila, P., Makshtas, A. P., and Launiainen, J.: Assessment of atmospheric reanalyses with independent observations in the Weddell Sea, the Antarctic, J. Geophys. Res.-Atmos., 124, 12468–12484, https://doi.org/10.1029/2019JD030897, 2019. a, b
Kwok, R.: Sea ice convergence along the Arctic coasts of Greenland and the Canadian Arctic Archipelago: Variability and extremes (1992–2014), Geophys. Res. Lett., 42, 7598–7605, https://doi.org/10.1002/2015GL065462, 2015. a
Leppäranta, M.: The Drift of Sea Ice, Springer, Berlin Heidelberg, https://doi.org/10.1007/978-3-642-04683-4, 2011. a
Liang, S., Zhang, X., Xiao, Z., Cheng, J., Liu, Q., and Zhao, X.: Longwave Emissivity, in: Global LAnd Surface Satellite (GLASS) Products, Springer Briefs in Earth Sciences, Springer, Cham, 63–77, https://doi.org/10.1007/978-3-319-02588-9_4, 2014. a
Light, B., Smith, M. M., Perovich, D. K., Webster, M. A., Holland, M. M., Linhardt, F., Raphael, I. A., Clemens-Sewall, D., Macfarlane, A. R., Anhaus, P., and Bailey, D. A.: Arctic sea ice albedo: Spectral composition, spatial heterogeneity, and temporal evolution observed during the MOSAiC drift, Elementa: Science of the Anthropocene, 10, 000103, https://doi.org/10.1525/elementa.2021.000103, 2022. a
Liu, Y., Key, J. R., Liu, Z., Wang, X., and Vavrus, S. J.: A cloudier Arctic expected with diminishing sea ice, Geophys. Res. Lett., 39, L05705, https://doi.org/10.1029/2012GL051251, 2012. a
Makshtas, A. P.: The heat budget of the Arctic ice in the winter, edited by: Andreas, E. L., Cambridge, International Glaciological Society, ISBN 0 946417 12 1, 1991. a
Morrison, A. L., Kay, J. E., Frey, W. R., Chepfer, H., and Guzman, R.: Cloud response to Arctic Sea ice loss and implications for future feedback in the CESM1 climate model, J. Geophys. Res.-Atmos., 124, 1003–1020, https://doi.org/10.1029/2018JD029142, 2019. a
Mortin, J., Svensson, G., Graversen, R. G., Kapsch, M.-L., Stroeve, J. C., and Boisvert, L. N.: Melt onset over Arctic sea ice controlled by atmospheric moisture transport, J. Geophys. Lett., 43, 6636–6642, https://doi.org/10.1002/2016GL069330, 2016. a
Palm, S. P., Strey, S. T., Spinhirne, J., and Markus, T.: Influence of Arctic sea ice extent on polar cloud fraction and vertical structure and implications for regional climate, J. Geophys. Res., 115, D21209, https://doi.org/10.1029/2010JD013900, 2010. a
Parkinson, C. L.: Arctic sea ice coverage from 43 years of satellite passive-microwave observations, Frontiers in Remote Sensing, 3, 1021781, https://doi.org/10.3389/frsen.2022.1021781, 2022. a
Perovich, D. K., Nghiem, S. V., Markus, T., and Schweiger, A.: Seasonal evolution and interannual variability of the local solar energy absorbed by the Arctic sea ice–ocean system, J. Geophys. Res., 112, C03005, https://doi.org/10.1029/2006jc003558, 2007. a
Persson, P. O. G.: Onset and end of the summer melt season over sea ice: Thermal structure and surface energy perspective from SHEBA, Clim. Dynam., 39, 1349–1371, https://doi.org/10.1007/s00382-011-1196-9, 2012. a, b
Persson, P. O. G., Fairall, C. W., Andreas, E. L., Guest, P. S., and Perovich, D. K.: Measurements near the Atmospheric Surface Flux Group tower at SHEBA: Near-surface conditions and surface energy budget, J. Geophys. Res., 107, 8045, https://doi.org/10.1029/2000JC000705, 2002. a, b
Pistone, K., Eisenman, I., and Ramanathan, V.: Observational determination of albedo decrease caused by vanishing Arctic sea ice, P. Natl. Acad. Sci. USA, 111, 3322–3326, https://doi.org/10.1073/pnas.1318201111, 2014. a, b
Platt, S. M., Hov, Ø., Berg, T., Breivik, K., Eckhardt, S., Eleftheriadis, K., Evangeliou, N., Fiebig, M., Fisher, R., Hansen, G., Hansson, H.-C., Heintzenberg, J., Hermansen, O., Heslin-Rees, D., Holmén, K., Hudson, S., Kallenborn, R., Krejci, R., Krognes, T., Larssen, S., Lowry, D., Lund Myhre, C., Lunder, C., Nisbet, E., Nizzetto, P. B., Park, K.-T., Pedersen, C. A., Aspmo Pfaffhuber, K., Röckmann, T., Schmidbauer, N., Solberg, S., Stohl, A., Ström, J., Svendby, T., Tunved, P., Tørnkvist, K., van der Veen, C., Vratolis, S., Yoon, Y. J., Yttri, K. E., Zieger, P., Aas, W., and Tørseth, K.: Atmospheric composition in the European Arctic and 30 years of the Zeppelin Observatory, Ny-Ålesund, Atmos. Chem. Phys., 22, 3321–3369, https://doi.org/10.5194/acp-22-3321-2022, 2022. a
Pohl, C., Istomina, L., Tietsche, S., Jäkel, E., Stapf, J., Spreen, G., and Heygster, G.: Broadband albedo of Arctic sea ice from MERIS optical data, The Cryosphere, 14, 165–182, https://doi.org/10.5194/tc-14-165-2020, 2020. a
Saha, S., Moorthi, S., Pan, H.-L., Wu, X., Wang, J., Nadiga, S., Tripp, P., Kistler, R., Woollen, J., Behringer, D., Liu, H., Stokes, D., Grumbine, R., Gayno, G., Wang, J., Hou, Y.-T., Chuang, H.-Y., Juang, H.-M., Sela, J., and Goldberg, M.: The NCEP climate forecast system reanalysis, B. Am. Meteorol. Soc., 91, 1015–1058, https://doi.org/10.1175/2010BAMS3001.1, 2010a. a
Saha, S., Moorthi, S., Pan, H.-L., Wu, X., Wang, J., Nadiga, S., Tripp, P., Kistler, R., Woollen, J., Behringer, D., Liu, H., Stokes, D., Grumbine, R., Gayno, G., Wang, J., Hou, Y.-T., Chuang, H.-Y., Juang, H.-M. H., Sela, J., Iredell, M., Treadon, R., Kleist, D., Van Delst, P., Keyser, D., Derber, J., Ek, M., Meng, J., Wei, H., Yang, R., Lord, S., van den Dool, H., Kumar, A., Wang, W., Long, C., Chelliah, M., Xue, Y., Huang, B., Schemm, J.-K., Ebisuzaki, W., Lin, R., Xie, P., Chen, M., Zhou, S., Higgins, W., Zou, C.-Z., Liu, Q., Chen, Y., Han, Y., Cucurull, L., Reynolds, R. W., Rutledge, G., and Goldberg, M.: NCEP Climate Forecast System Reanalysis (CFSR) 6-hourly Products, January 1979 to December 2010, Research Data Archive at the National Center for Atmospheric Research, Computational and Information Systems Laboratory [data set], https://doi.org/10.5065/D69K487J, 2010b. a, b
Saha, S., Moorthi, S., Pan, H.-L., Wu, X., Wang, J., Nadiga, S., Tripp, P., Kistler, R., Woollen, J., Behringer, D., Liu, H., Stokes, D., Grumbine, R., Gayno, G., Wang, J., Hou, Y.-T., Chuang, H.-Y., Juang, H.-M. H., Sela, J., Iredell, M., Treadon, R., Kleist, D., Van Delst, P., Keyser, D., Derber, J., Ek, M., Meng, J., Wei, H., Yang, R., Lord, S., van den Dool, H., Kumar, A., Wang, W., Long, C., Chelliah, M., Xue, Y., Huang, B., Schemm, J.-K., Ebisuzaki, W., Lin, R., Xie, P., Chen, M., Zhou, S., Higgins, W., Zou, C.-Z., Liu, Q., Chen, Y., Han, Y., Cucurull, L., Reynolds, R. W., Rutledge, G., and Goldberg, M.: NCEP Climate Forecast System Version 2 (CFSv2) 6-hourly Products, Research Data Archive at the National Center for Atmospheric Research, Computational and Information Systems Laboratory [data set], https://doi.org/10.5065/D61C1TXF, 2011. a, b
Saha, S., Moorthi, S., Wu, X., Wang, J., Nadiga, S., Tripp, P., Behringer, D., Hou, Y.-T., ya Chuang, H., Iredell, M., Ek, M., Meng, J., Yang, R., Mendez, M. P., van den Dool, H., Zhang, Q., Wang, W., Chen, M., and Becker, E.: The NCEP Climate Forecast System Version 2, J. Climate, 27, 2185–2208, https://doi.org/10.1175/JCLI-D-12-00823.1, 2014. a
Schweiger, A. J., Lindsay, R. W., Vavrus, S., and Francis, J. A.: Relationships between Arctic Sea Ice and Clouds during Autumn, J. Climate, 21, 4799–4810, https://doi.org/10.1175/2008JCLI2156.1, 2008. a
Senkova, A., Rontu, L., and Savijarvi, H.: Parameterization of orographic effects on surface radiation in HIRLAM, Tellus A, 59, 279–291, https://doi.org/10.1111/j.1600-0870.2007.00235.x, 2007. a
Serreze, M. C., Barrett, A. P., Stroeve, J. C., Kindig, D. N., and Holland, M. M.: The emergence of surface-based Arctic amplification, The Cryosphere, 3, 11–19, https://doi.org/10.5194/tc-3-11-2009, 2009. a
Sledd, A. and L'Ecuyer, T. S.: Emerging trends in Arctic solar absorption, Geophys. Res. Lett., 48, e2021GL095813, https://doi.org/10.1029/2021GL095813, 2021. a
Smedsrud, L. H., Halvorsen, M. H., Stroeve, J. C., Zhang, R., and Kloster, K.: Fram Strait sea ice export variability and September Arctic sea ice extent over the last 80 years, The Cryosphere, 11, 65–79, https://doi.org/10.5194/tc-11-65-2017, 2017. a
Spreen, G., Kwok, R., and Menemenlis, D.: Trends in Arctic sea ice drift and role of wind forcing: 1992–2009, Geophys. Res. Lett., 38, L19501, https://doi.org/10.1029/2011GL048970, 2011. a
Taylor, P. C., Boeke, R. C., Boisvert, L. N., Feldl, N., Henry, M., Huang, Y., Langen, P. L., Liu, W., Pithan, F., Sejas, S. A., and Tan, I.: Process Drivers, Inter-Model Spread, and the Path Forward: A Review of Amplified Arctic Warming, Frontiers in Earth Science, 9, 758361, https://doi.org/10.3389/feart.2021.758361, 2022. a
Uhlíková, T., Vihma, T., Karpechko, A. Y., and Uotila, P.: Effects of Arctic sea-ice concentration on turbulent surface fluxes in four atmospheric reanalyses, The Cryosphere, 18, 957–976, https://doi.org/10.5194/tc-18-957-2024, 2024. a, b, c, d, e
Uotila, P. and Uhlíková, T.: Codes used for calculations and plotting in manuscript: Effects of Arctic sea-ice concentration on surface radiative fluxes in four atmospheric reanalyses, Version v1, Zenodo [code], https://doi.org/10.5281/zenodo.11565044, 2024. a
Vihma, T.: Subgrid parameterization of surface heat and momentum fluxes over polar oceans, J. Geophys. Res., 100, 22625–22646, https://doi.org/10.1029/95JC02498, 1995. a
Vihma, T., Tisler, P., and Uotila, P.: Atmospheric forcing on the drift of Arctic sea ice in 1989–2009, Geophys. Res. Lett., 39, L02501, https://doi.org/10.1029/2011GL050118, 2012. a
Walsh, J. E., Chapman, W. L., and Portis, D. H.: Arctic Cloud Fraction and Radiative Fluxes in Atmospheric Reanalyses, J. Climate, 22, 2316–2334, https://doi.org/10.1175/2008JCLI2213.1, 2009. a
Warneke, C., Froyd, K. D., Brioude, J., Bahreini, R., Brock, C. A., Cozic, J., de Gouw, J. A., Fahey, D. W., Ferrare, R., Holloway, J. S., Middlebrook, A. M., Miller, L., Montzka, S., Schwarz, J. P., Sodemann, H., Spackman, J. R., and Stohl, A.: An important contribution to springtime Arctic aerosol from biomass burning in Russia, Geophys. Res. Lett., 37, L01801, https://doi.org/10.1029/2009GL041816, 2010. a
Wendish, M., Macke, A., Ehrlich, A., et al.: The Arctic Cloud Puzzle: Using ACLOUD/PASCAL Multiplatform Observations to Unravel the Role of Clouds and Aerosol Particles in Arctic Amplification, B. Am. Meteorol. Soc., 100, 841–871, https://doi.org/10.1175/BAMS-D-18-0072.1, 2019. a
Wilks, D. S.: “The Stippling Shows Statistically Significant Grid Points”: How Research Results are Routinely Overstated and Overinterpreted, and What to Do about It, B. Am. Meteorol. Soc., 97, 2263–2273, https://doi.org/10.1175/BAMS-D-15-00267.1, 2016. a
Yeo, H., Kim, M.-H., Son, S.-W., Jeong, J.-H., Yoon, J.-H., Kim, B.-M., and Kim, S.-W.: Arctic cloud properties and associated radiative effects in the three newer reanalysis datasets (ERA5, MERRA-2, JRA-55): Discrepancies and possible causes, Atmos. Res., 270, 106080, https://doi.org/10.1016/j.atmosres.2022.106080, 2022. a