the Creative Commons Attribution 4.0 License.
the Creative Commons Attribution 4.0 License.
 | 20 Feb 2024
Partial melting in polycrystalline ice: pathways identified in 3D neutron tomographic images
Christopher J. L. Wilson
Mark Peternell
Filomena Salvemini
Vladimir Luzin
Frieder Enzmann
Olga Moravcova
Nicholas J. R. Hunter
In frozen cylinders composed of deuterium ice (Tm+3.8 ∘C) and 10 % water ice (Tm 0 ∘C), it is possible to track melt pathways produced by increasing the temperature during deformation. Raising the temperature to +2 ∘C produces water (H2O) which combines with the D2O ice to form mixtures of HDO. As a consequence of deformation, HDO and H2O meltwater are expelled along conjugate shear bands and as compactional melt segregations. Melt segregations are also associated with high-porosity networks related to the location of transient reaction fronts where the passage of melt-enriched fluids is controlled by the localized ductile yielding and lowering of the effective viscosity. Accompanying the softening, the meltwater also changes and weakens the crystallographic fabric development of the ice. Our observations suggest meltwater-enriched compaction and shear band initiation provide instabilities and the driving force for an enhancement of permeability in terrestrial ice sheets and glaciers.
- Article
(17470 KB) - Full-text XML
-
Supplement
(1337 KB) - BibTeX
- EndNote


There is a widespread agreement that meltwater plays an important role in the evolution of ice sheets and glaciers while they are undergoing deformation (e.g. Duval, 1977; Engelhardt and Kamb, 1997; Kamb, 2001; Llubes et al., 2006; Minchew et al., 2018; Haseloff et al., 2019). Inferences have been widely drawn from this suggesting that as temperature and meltwater proportions increase, the overall volume increase will lead to a sea level rise (Rignot et al., 2019). While this general conclusion is intuitively attractive, it is still necessary to establish a strong evidence base for such arguments, which considers the mechanistic processes that would lead to the inferred outcomes. In addition, the foliation development that accompanies the deformation of ice masses is defined by variations in crystal size, shape, debris content, and air bubbles (Hudleston, 2015). Rather than being purely a combination of snow accumulation and deformation, many of these foliations are attributed to the percolation of meltwater (Lliboutry, 1996; Nye and Mae, 1972), which is localized to bands of high porosity and permeability.
It is also recognized that the refreezing of meltwater produces the distinct basal and marginal ice units within ice sheets (Bell et al., 2014). There is an inference that meltwater networks or hydraulic pathways, generated elsewhere in the ice sheet, are the primary source of water feeding the formation of basal and marginal ice units (Bell et al., 2007). It has also been suggested that shear heating concentrated in the sheared margins of ice streams induces the onset of deformation-induced meltwater (Perol and Rice, 2015). How this meltwater is extracted and focused remains an unresolved question. It has also been proposed that water-filled through-going fractures (crevasses) reach bedrock and connect with the subglacial drainage system (Van der Veen, 2007; Alley et al., 1988; Weertman, 1971), which therefore influences the dynamics of ice flow by lubrication (Kamb, 2001; Engelhardt and Kamb, 1997), and this causes ice flow to speed up (Zwally et al., 2002).
In natural ice masses, glacio-hydraulic processes and subglacial-hydraulic pathways occur as viscous forces that dominate over capillary forces (Grant and Sletten, 2002). The relative permeability versus saturation function together with absolute permeability has a large influence on the transport of meltwater. Meltwater can freeze when it flows from an area of relatively high pressure to an area of relatively low pressure without equilibrating its internal energy to the local pressure-dependent melting point (Röthlisberger, 1972; Shreve, 1972; Creyts and Clarke, 2010). Despite the large literature on meltwater flow summarized by Fowler and Iverson (2022), there is still considerable debate about structural controls on melt migration as well as permeability creation, but it is clear that meltwater flow paths must exist over a wide range of length and timescales. Although hydrofracturing and crevasse formation (Melton et al., 2022; Van der Veen, 2007) may be the most efficient mechanism of permeability development in glaciers, microcracks and shearing may be a smaller-scale mechanism. It has also been suggested that meltwater flow through hydrofractures (crevasses) to the basal region of an ice mass is analogous to magmatic processes (Alley et al., 1988; Weertman, 1971), and this can influence glacial dynamics. Other than summer meltwater, which drains through moulins and crevasses (Van der Veen, 2007; Zwally et al., 2002), what other processes drive the subglacial water along the bedrock topography in the interior of an ice mass?
Ice is a remarkably brittle solid compared to other materials at high homologous temperatures (Rist and Murrell, 1994). However, it is known that with high strains and strain rates a complex combination of mechanical processes including creep, shear, and tensile failure occur (Barnes et al., 1971). Many studies of ice mechanics also assume that differential changes in viscosity occur primarily due to crystallographic preferred orientation (CPO) development (Gow et al., 1997; Castelnau et al., 1998; Jacka and Li, 2000). However, the foliation in natural ice masses suggests strain partitioning, which permits CPOs to vary between layers, and is attributed to meltwater segregations (Nye and Mae, 1972). If the strength of the CPOs is constant (Minchew et al., 2018), then shear, including melting, and temperature changes are the only mechanisms that can drive variations in ice rheology. In order to understand the rheology in a viscously anisotropic material such as natural water ice (Duval et al., 1983) and its deuterium analogue (Wilson et al., 2020), it is still necessary to invoke the role of interstitial water and some atomic-scale mechanisms during deformation.
Our present understanding of the role of meltwater on rheological behaviour in terrestrial ice sheets is still incomplete with regard to deformation mechanisms under different temperatures and strain regimes. It is well-known from many experimental studies that pressure melting in ice enhances creep rates (e.g. Mellor and Testa, 1969; Barnes et al., 1971; Morgan, 1991) and has led to the conclusions that grain boundary wetting by melt (Fowler and Iverson, 2022, and references therein) either introduces new deformation mechanisms or enhances unsteady interface morphologies (Droria et al., 2017). It has been identified to be a process predominantly controlled by the properties of the melt, with the solid contributing by its grain-scale dihedral angles determining how melt migrates through the linear viscous matrix. Wilson et al. (1996) have demonstrated and modelled how localized deformation in a polycrystalline ice mass controls the location of meltwater in high-strain zones and in grain boundary areas. What remains an open question is how the dissolution and reprecipitation of ice and meltwater migration is controlled by plastic deformation and an external stress field. Moreover, experiments to understand how meltwater affects the mechanical properties (Duval, 1977; Morgan, 1991; Adams et al., 2021) in an ice mass once meltwater is generated are hard to perform.
In the current investigation, we simulate a situation where an ice mass is exposed to a heat source, such as a geothermal gradient (Harrington et al., 2015; Engelhard, 2004; Reading et al., 2022) while being deformed simultaneously in a pure shear manner. By using in situ neutron diffraction deformation experiments (Wilson et al., 2019, 2020), combined with neutron tomography (Garbe et al., 2015), a non-destructive imaging technique, we can use the attenuation coefficients of ice to identify contrasting water phases produced during melting (Khan et al., 2012). Such information in combination with the microstructure, porosity, and the connectivity of the melt phases is imperative if we are to understand and model the complex meltwater flow in ice sheets. In this contribution we present evidence that meltwater is driven by instabilities, which control permeability, rather than meltwater migrating through the ice matrix in small portions via grain boundary wetting processes or hydrofracturing.
2.1 Nature of the samples
Supplement Fig. S1 presents a flow chart of the methods used in this investigation. As a first step prior to deformation, blocks of frozen distilled water ice were crushed, sieved through 500 to 100 µm meshes and mixed with ∼ 90 % crushed deuterium ice, dry-compacted and refrozen in a cylindrical mould (DC samples). In some samples a small quantity of D2O water was added to better bond the grains together to produce the DH samples. However, when there is a small quantity of liquid D2O present, mixtures of deuterium and ordinary water can form ideal solutions of DHO or HDO (Droria et al., 2017; Li and Ross, 1994). This may be explained in terms of proton disorder in hydrogen-bonded molecular networks (Kunst and Warman, 1980) within the perfect hexagonal lattice formed by the oxygen atoms (Li et al., 1994). In neutron diffraction the position of the hydrogen atoms can be determined because of their large coherent scattering (its incoherent cross section is some 20 times greater than for deuterium) and a small incoherent scattering cross section of deuterium (Li et al., 1994).
2.2 Deformation and analysis of samples
Cylindrical samples were deformed in an Instron 100 kN load frame, while in situ neutron diffraction and load cell measurements were performed using the constant wavelength neutron diffractometer KOWARI at the Australian Centre for Neutron Scattering (ACNS). KOWARI is fed by OPAL (Open Pool Australian Lightwater), a 20 mW open-pool light-water reactor using low-enriched uranium fuel and a liquid deuterium cold neutron source (Bennett, 2008), located at Lucas Heights. Deformation experiments were undertaken as described by Wilson et al. (2019, 2020), with a constant displacement rate of 2.5 × 10⁻⁶ s−1, no confining pressure, and initial temperature set to −7 ∘C during an initial 14.6 % shortening. The temperature was then rapidly increased to +2 ∘C during the remaining 5.4 % shortening (Table 1). These conditions resulted in experimentally feasible durations of ca. 22 h, which is equal to 20 % shortening. The experimental temperature of −7 ∘C (0.96 Th in D2O) corresponds to −10.7 ∘C for H2O according to the difference in the melting temperature of D2O and H2O (Petrenko and Whitworth, 1999). These experiments were accompanied by in situ neutron diffraction and texture measurements prior to being subject to neutron tomography. A 3D tomographic data set was reconstructed for all samples by the stacking of neutron diffraction slices (over the entire range of XYZ coordinates of the detector) enabling us to investigate the nature of the internal structure of the samples (Supplement Figs. S2, S3).
Table 1Summary of samples and deformation experiments on deuterated ice aggregates. Sample are (1) dry-compacted (DC), (2) a composite with D2O bonding ice grains (DH), (3) layered (DHC) with a DH and DC layer, and (4) layered (LDH) with a DH + DC + calcite-rich (cc) layer. The coordination number relates to the characteristics of the porous network, which is the number of connected pores or air bubbles.
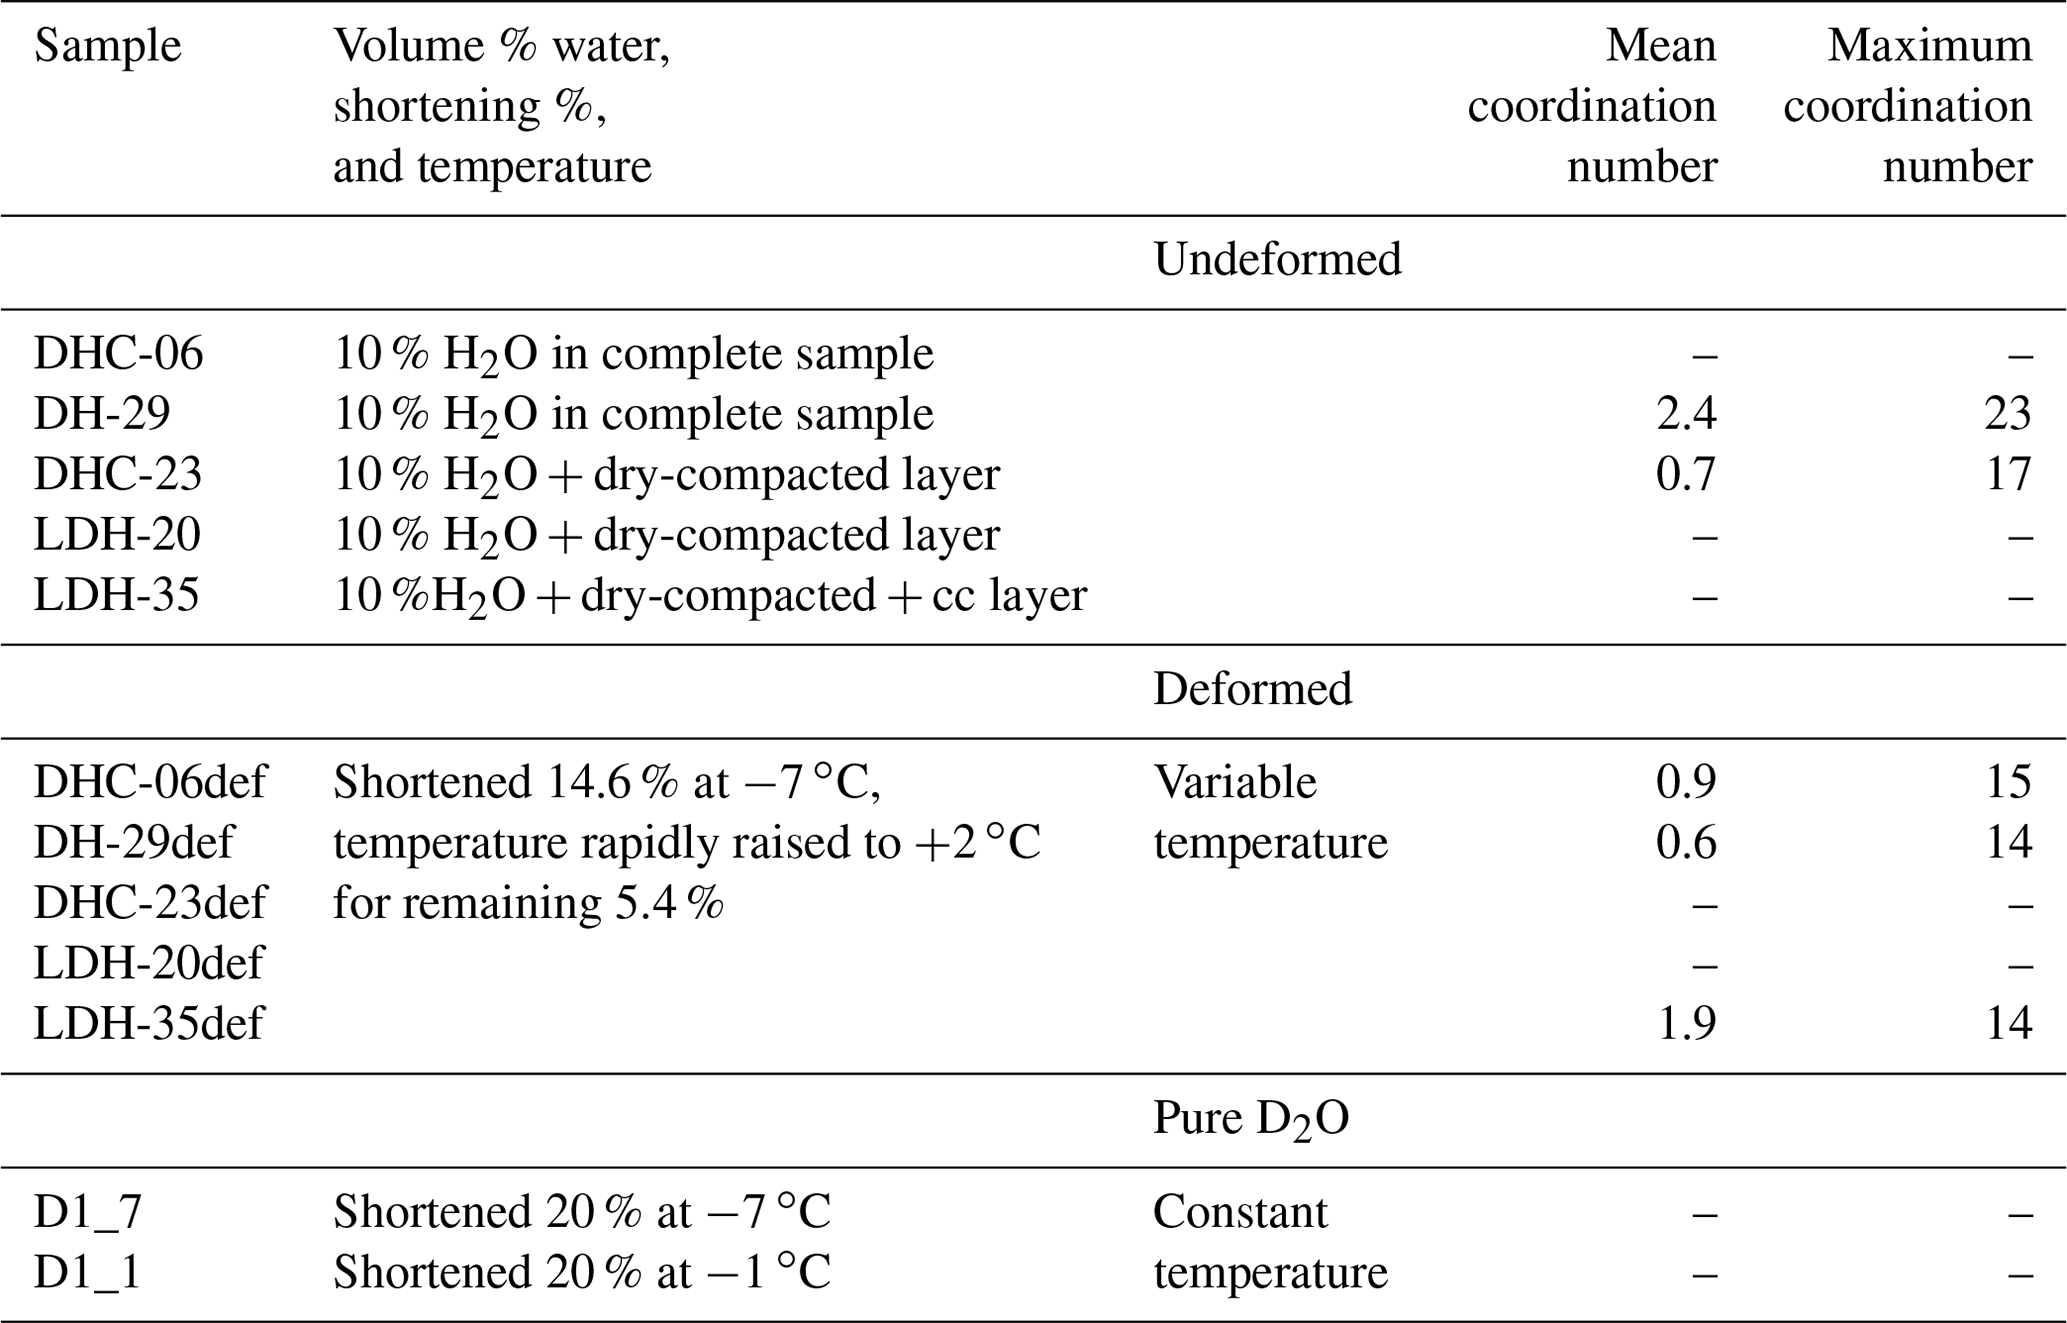
The testing took place inside an aluminium chamber, transparent to neutrons, which controls the temperature to within ±0.2 ∘C. The average length and diameter of the samples were ∼ 3.2–4 × 2.5 cm for a length to diameter ratio of ∼ 1.5 to 1. The horizontal neutron beam passed through the sample, which was constrained by aluminium pistons (for details of the setup, see Wilson et al., 2019). Table 1 lists the four types of samples deformed: (1) samples composed of dry-compacted D2O ice with ∼ 10 % H2O and a higher porosity (DC samples); (2) samples identical to (1) but with grains bonded together by a film of D2O water (DH samples); (3) layered samples (DHC) dominated by DH ice, with one end layer (<15 mm wide) composed of DC ice; and (4) layered samples (LDH) of DH ice (∼ 20 mm wide), a layer of 80 % D2O + 20 % calcite powder (∼ 10 mm wide), and a DC layer (∼ 15 mm wide). The layering provided a rheological contrast, and the calcite powder (diameter ca 20 µm) was identical to that described by Wilson et al. (2019). In the DH ice types, a packing or pore closure was applied by adding a small quantity of liquid D2O water during compaction and prior to the final freezing. The porosity of the initial DHC samples was higher than the intergranular networks in the DH and calcite-rich regions. Samples were then left to anneal for 1 month at −5 ∘C. During deformation samples were shortened 14.6 % at −7 ∘C and temperature raised to +2 ∘C during a further increment of 5.4 % shortening. At this stage the melting temperature for the H2O ice was exceeded but below the melting temperature for the D2O ice. The measurement of stress variations was recorded with differential pressure transducers. In addition, the average grain number in a sample was obtained from the intensity oscillation of the measured diffraction pattern (Wilson et al., 2019). Following an experiment, neutron diffraction data were collected and CPOs analysed (Hunter et al., 2023). The final microstructures were obtained using a fabric analyser microscope (Wilson and Peternell, 2011), with ±5.7 % error regarding grain size, grain number, and orientation of correctly indexed grains (Hammes and Peternell, 2016).
2.3 Neutron tomography and segmentation
Prior to an experiment on KOWARI and after deformation was completed the cylindrical samples were stored in a −80 ∘C freezer before being transferred to the DINGO neutron tomography facility at ANSTO (Garbe et al., 2015). A cryostat operating at −20 ∘C was mounted on the instrument stage with the sample sealed in the centre of a cylindrical aluminium sample holder. In order to visualize the 3D distribution of H2O, HDO, DHO (further referred to as mixtures of HDO), and distribution of pores or air bubbles, a tomographic analysis was performed at a 20 µm pixel size by coupling the Zeiss 100 mm fixed focal length lens with the 50 µm 6LiF/ZnS(Ag) scintillation screen to the ANDOR Ikon-l CCD camera; the scan consisted of 1200 projections equiangularly spaced over 180∘ with an exposure time of 60 s per single acquisition. The projections were treated for flat field normalization with dose correction and dark current subtraction. An outlier filter was also applied for noise reduction. The tomographic reconstruction was obtained with the Octopus package (Dierick et al., 2004) and analysed using Aviso software (https://www.fei.com/software/avizo3d/, last access: 8 February 2024). Distinguishing the two ice types during the neutron tomography depends on the attenuation coefficient. It was experimentally determined that the neutron beam instrument spectrum had a Maxwellian distribution with a peak at approximately 1.5 Å. The attenuation coefficient is about 2.4 cm−1 for H2O and 0.35 cm−1 for D2O, and mixtures of HDO have intermediate values. This meant that a sufficient difference in contrast is present to discriminate different phases in the tomographic reconstructions. A representative greyscale visualization highlights the water phase as bright blue (Supplement Fig. S2).
The 3D tomographic reconstructions were then analysed using machine-learning image segmentation techniques available via the GeoDict software package (https://www.math2market.com/geodict-software, last access: 8 February 2024). The reconstructed images were first filtered with a non-local means filter to reduce noise for edge preservation. Then the fluid phases were segmented using a watershed-based segmentation method followed by a clean-up step using morphological operations as described in Wang et al. (2015) and Andrew (2020). Different groups of features were extracted from the reconstructed images in order to show the local distribution of HDO mixes, H2O, and pores, where similar pixel values are clustered into distinct groups or classes, using machine-learning algorithms (Chauhan et al., 2016). Examples of segmented images of porosity distribution are shown in Supplement Fig. S2 in white, while the blue is D2O, and green, pink, and yellow colours correspond to the water phase. All initial samples had a variable porosity defined by air bubbles, with the highest values in the areas of dry-compacted ice. Probability distribution plots depicting distribution and the relationship between pore structure and coordination number with sphericity were established using the techniques described by Andrew (2020) and Thomson et al. (2018). Pore sphericity gives a volume-normalized, dimensionless measure of how close a particular component of the pore space is to an ideal sphere (with a sphere having a value of 1.0).
3.1 Processes to locate meltwater
The image segmentation process of the tomographic data, based on the intensity value of the acquired voxels, yielded up to six different semi-quantitative components in the samples (Fig. 1). These are identified by their colours and include pores (white), D2O (light blue), H2O (black), and different concentrations of hydrogen in the D2O, which are henceforth referred to as Mix-1 (yellow), Mix-2 (pink), and Mix-3 (green). It is important to note that Mix-1 to Mix-3 are gradations of DHO or HDO reflecting different amounts of the hydrogen ion within the deuterium-rich matrix and that mixes are to a degree intertwined. The hydrogen thus becomes a tracer to map out the molten-phase migration path through an ice matrix on a sub-millimetre to centimetre scale, correlating it with compositional and structural controls.
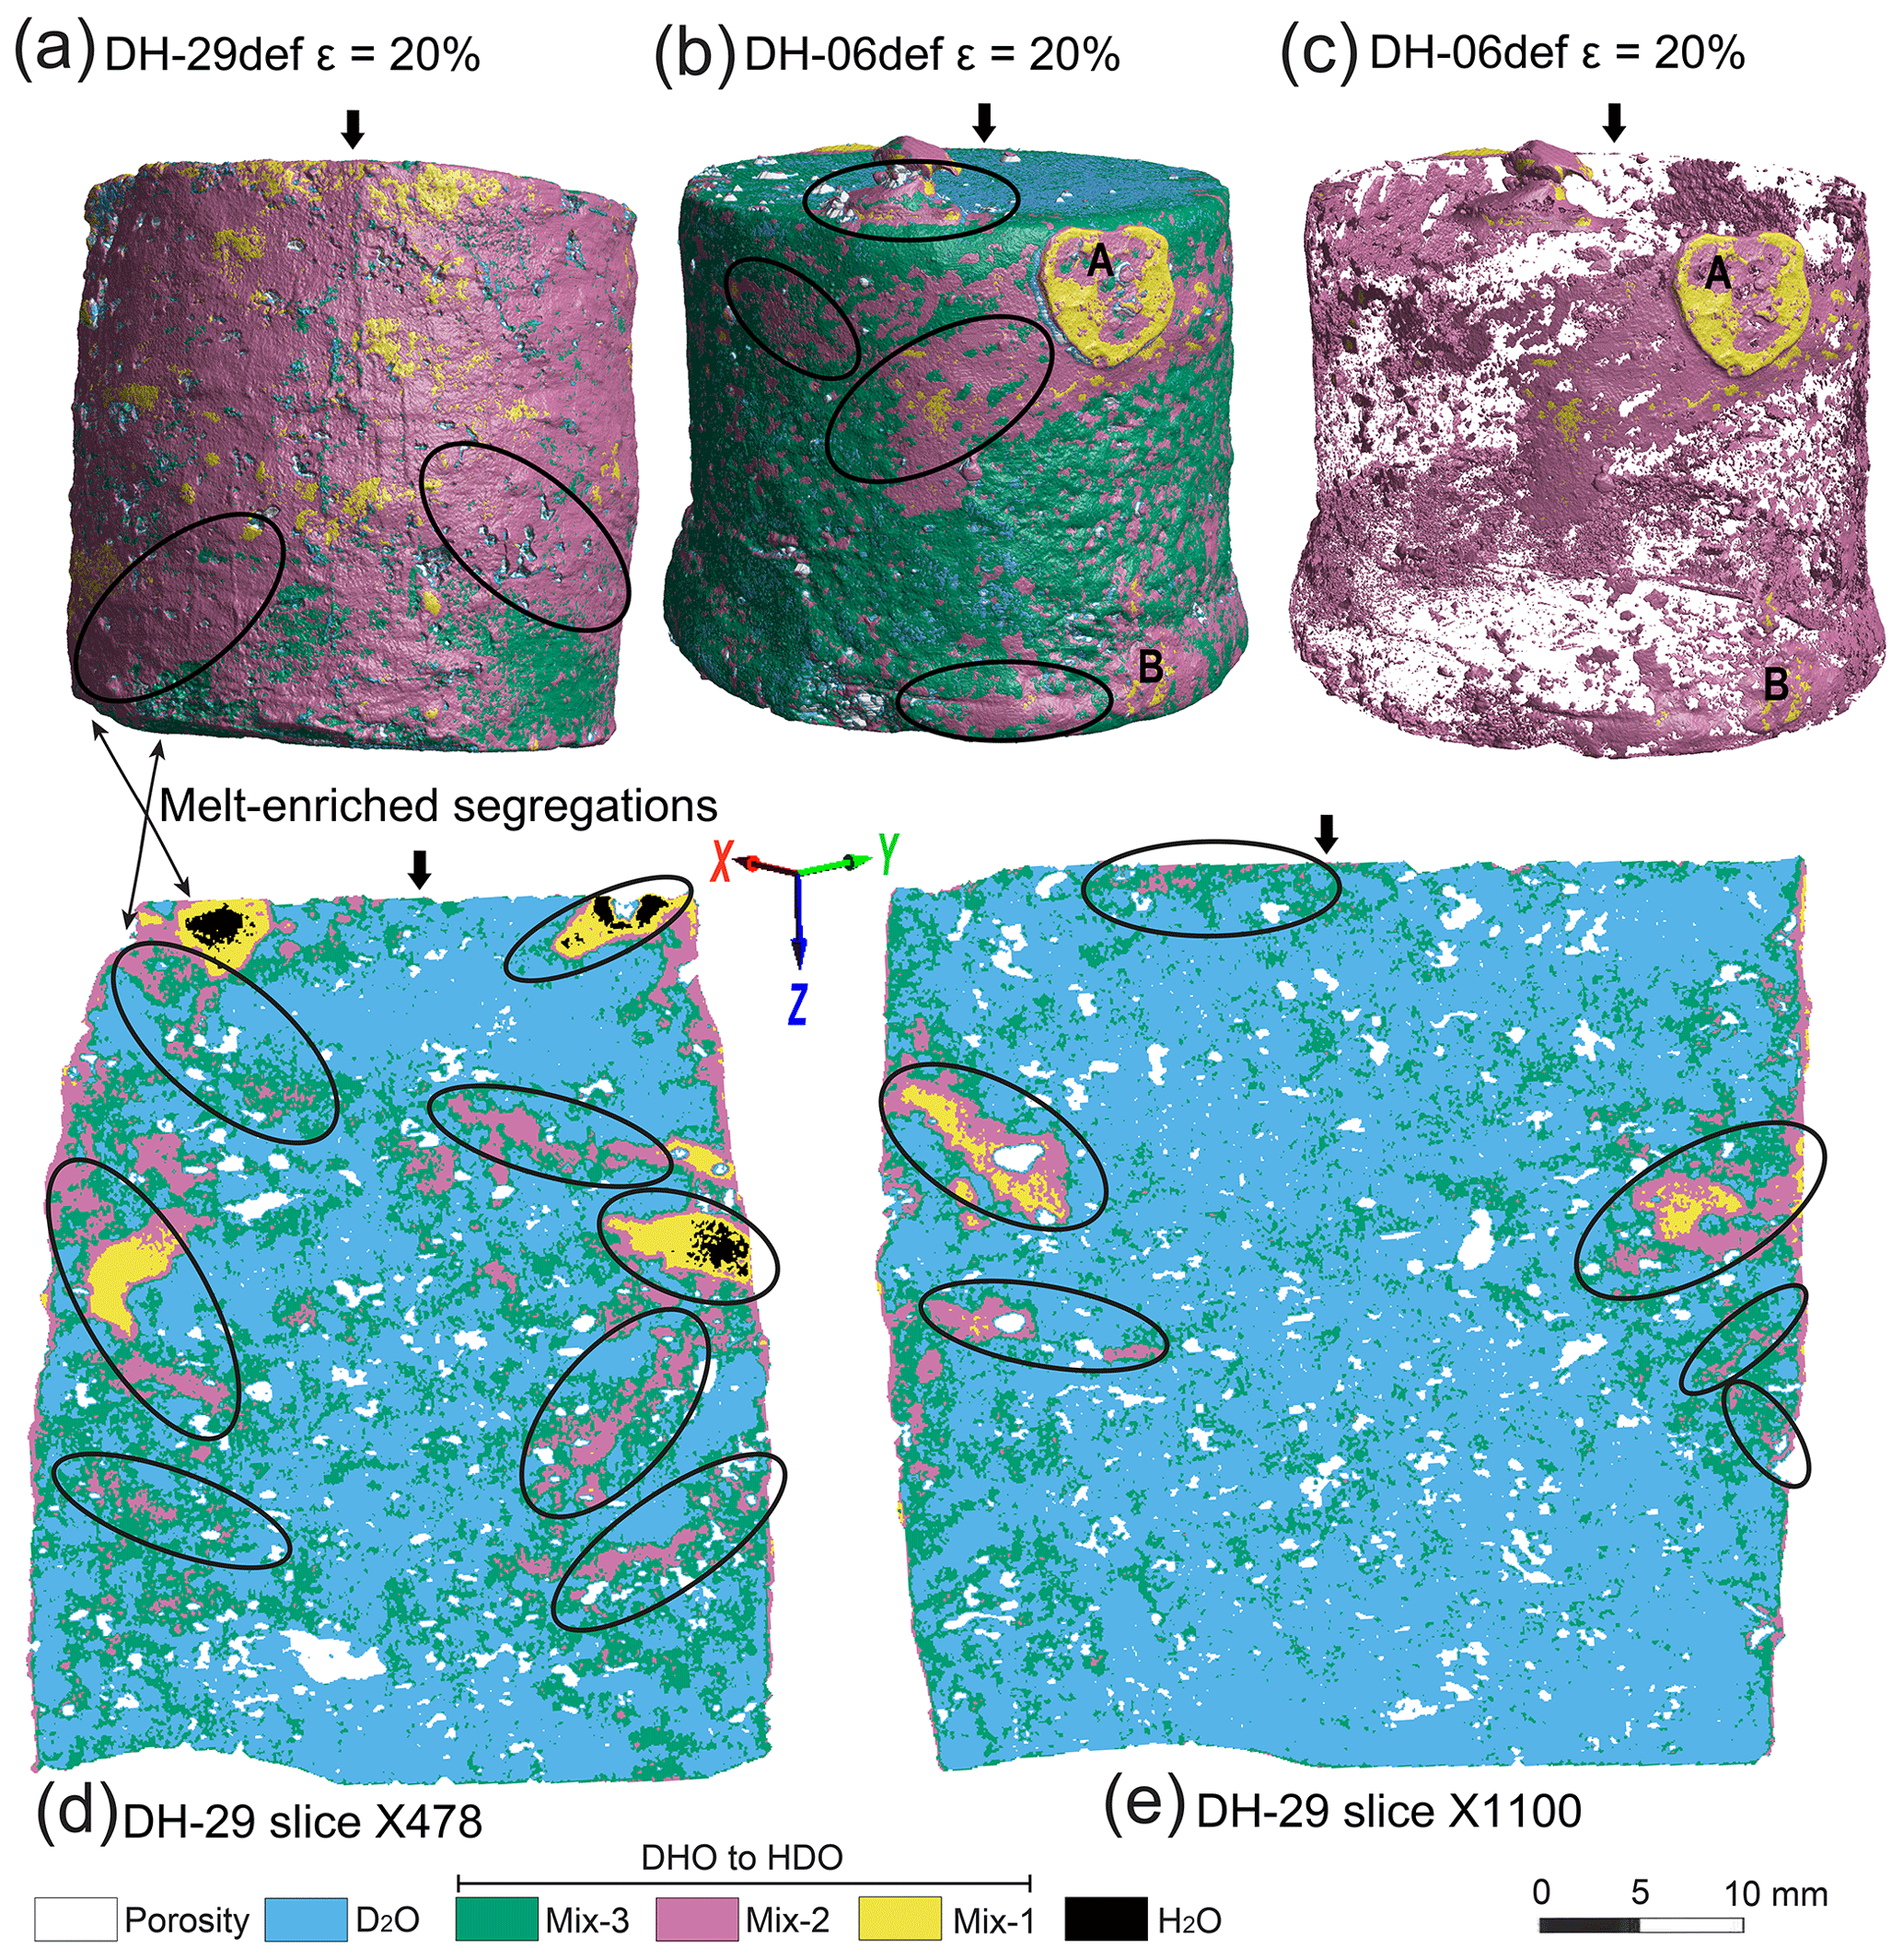
Figure 1Visualization of melt distributions from tomographic images in the deformed samples DH-29 and DH-06. The arrows show the orientation of the compression axis during deformation. The legend shows the transition of increasing proton exchange between deuterium-rich to hydrogen-rich ice. (a–c) 3D surface rendering of the mixed water phases migrating through the deformed sample, where ellipses outline the concentrations of Mix-2. At A and B there are two single circular concentrations of melt phases highlighted by Mix-2 and an increase in porosity. The initial samples had 10 % H2O, which after deformation was reduced to 1.1 % in DH-06 and <8.7 % in DH-29 (Table 2) and predominantly located on the outer perimeter of the samples. In (c) Mix-3 has been removed to illustrate the underlying distribution of pores, Mix-2, and Mix-1. (d) 2D segmentation along DH-29 slice X478 where ellipses show distribution of Mix-1-, Mix-2-, and H2O-enriched bands at oblique angles to the compression direction. Water can be seen concentrated on the margin of the sample. (e) DH-29 slice X1100 with ellipses outlining the distribution of Mix-2.
Volume rendering was the method used for visualizing 3D data from the 2D neutron diffraction slices (e.g. Fig. 1a–c, Supplement Fig. S3). Individual phases can be isolated over the entire volume or within a slice (Fig. 1d, e) and can be used to create volume-rendering data output. This method has been summarized by Khan et al. (2012) and is used here to identify the location and volume of H2O and water-based HDO melts (Table 2), which are quenched within the frozen D2O ice sample. As an example, the distribution of phases within 3D samples can be observed in slices parallel to either X, Y, or Z axes (Fig. 2). The locations of former meltwaters are identified as H2O + Mix-1 + Mix-2 (Fig. 1d–e) and are not uniformly distributed over a sample. This distribution suggests the underlying influence of plastic deformation. Due to the total volume of H2O in each deformed sample, Mix-3 cannot have been meltwater during the +2 ∘C deformation after 14.6 % strain. However, this phase, Mix-3 (Table 2), is distributed as narrow rims abutting the D2O matrix grains (Fig. 1d–e), whereas larger areas of Mix-2 and Mix-3 occur at the outer rims of the melt regions (Fig. 3a–c). We interpret Mix-3 as a reaction phase between molten phases, Mix-2, and D2O. This means that finely dispersed meltwater was present during the second part of deformation and is no longer visible in the final images.
Table 2Volume fraction of H2O, HDO mixes, D2O, and pores after deformation, representing the former liquid phase during the +2 ∘C part of the deformation. Samples are (1) dry-compacted (DC), (2) a composite with D2O bonding ice grains (DH), (3) layered (DHC) with a DH and DC layer, and (4) layered (LDH) with a DH + DC + calcite-rich (cc) layer.
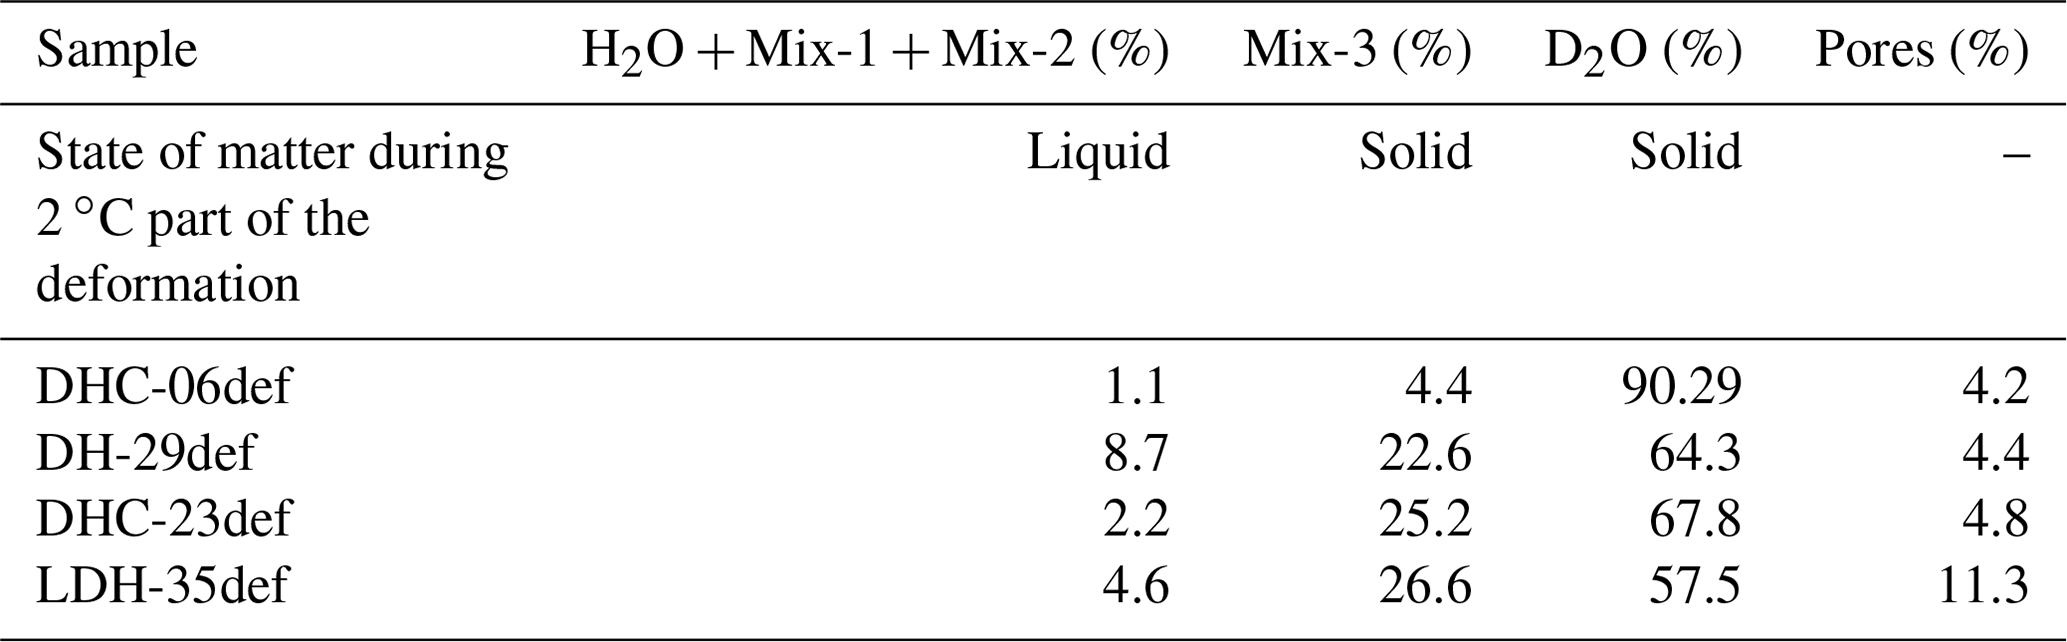
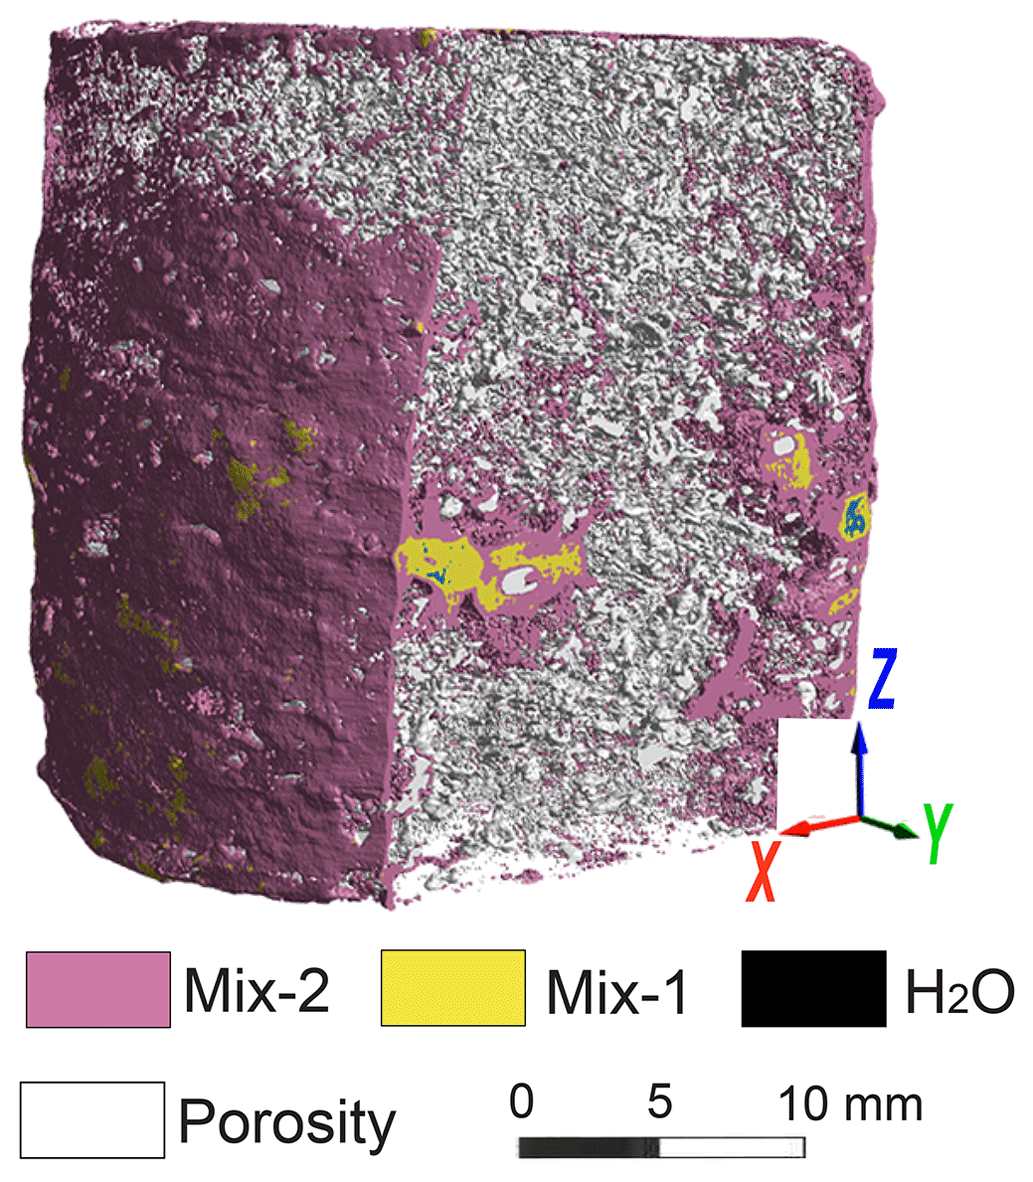
Figure 2Sample DH-29 sliced parallel to X. This sample shows the internal distribution of Mix-1, Mix-2, pores, and minor H2O in a longitudinal slice. Slice numbers originate from the base of the sample and are parallel to either the X, Y, or Z axis.
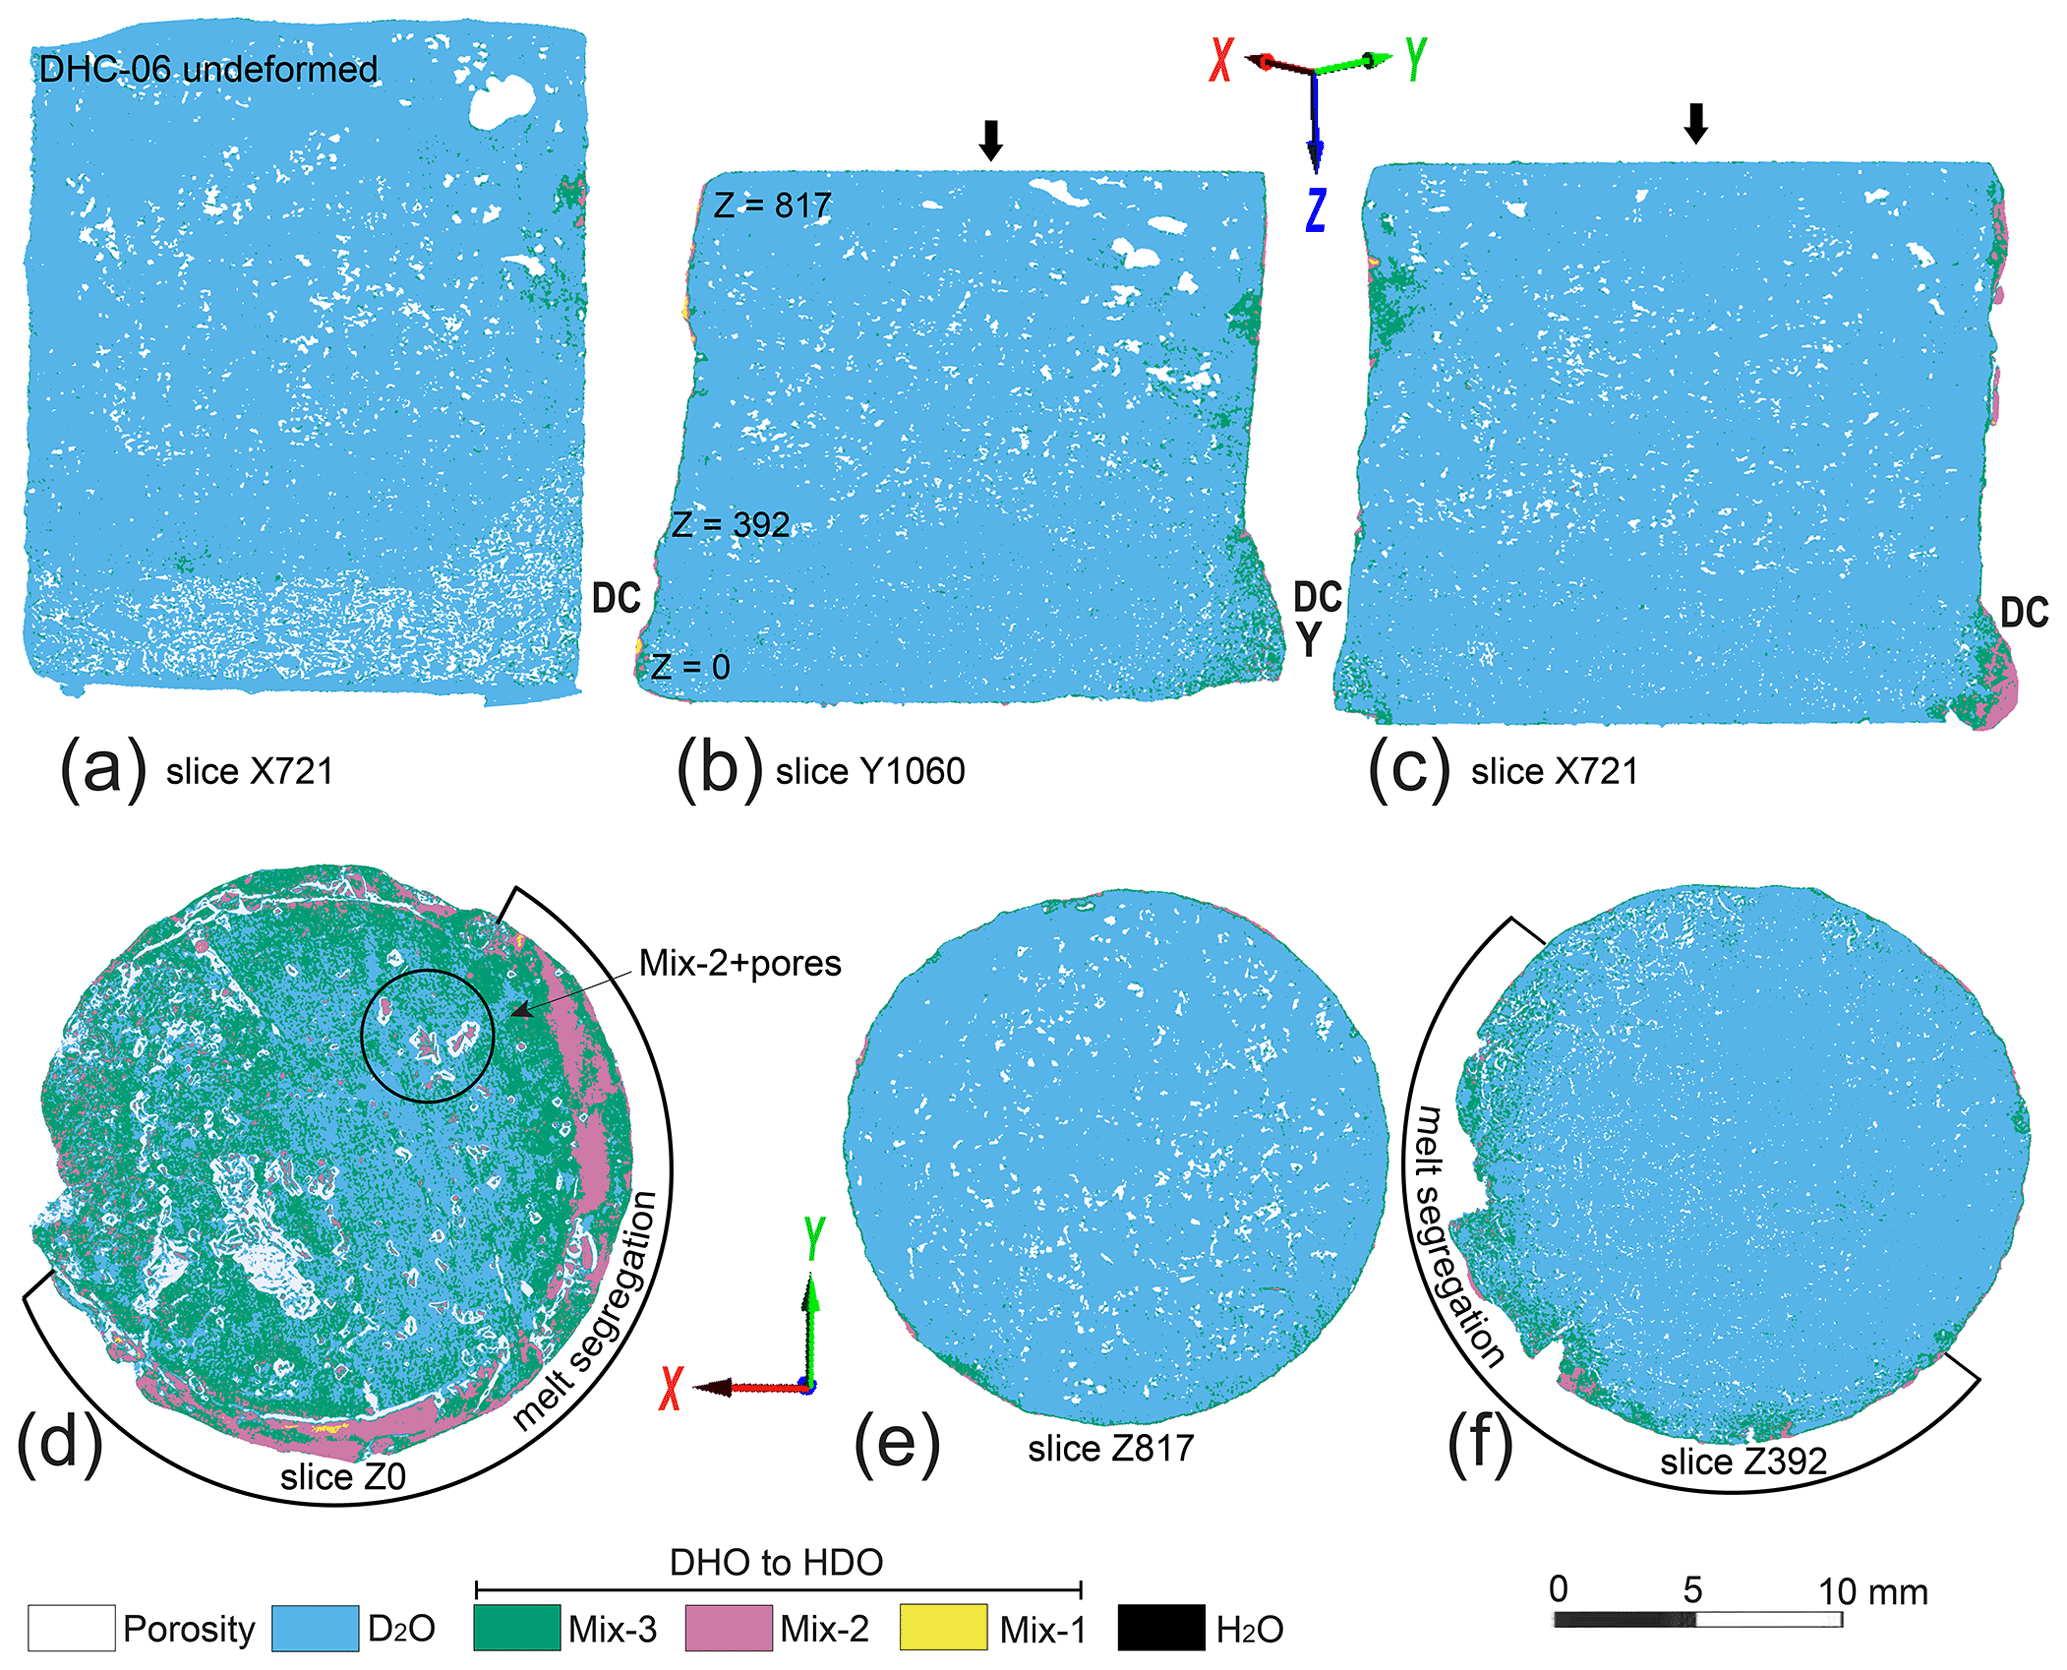
Figure 3Visualization of the mixed HDO phase and porosity distributions from tomographic images related to DHC-06. The arrows show the orientation of the compression axis during deformation. The legend shows the transition of increasing proton exchange between deuterium-rich to hydrogen-rich ice. (a) 2D segmentation of undeformed sample DHC-06 along slice X934 illustrating the initial high porosity (white) in the dry-compacted ice (DC) at the base of the sample. (b–c) 2D segmentation slices illustrating a concentration of melt phases highlighted by Mix-2 and Mix-3 in the former dry-compacted layer (DC) and location of horizontal (XY) tomographic slices. (d) Horizontal slice at base of deformed sample with indication of melt segregations. Black circle encloses an example of Mix-2 + pores, where the pores surround and are attached to the Mix-2 phase. This also occurs in other areas of the sample where there is a Mix-2 phase that is particularly noticeable in the melt segregation area on the outer rim of the sample. (e) Horizontal slice Z817 with minor peripheral concentrations of Mix-3 and Mix-2 in a slice adjacent to indenting piston. (f) Horizontal slice Z392 with melt segregations adjacent to a zone containing a higher density of pores on righthand side of sample.
3.2 Location of melt-enriched regions
The frozen-in melt-enriched regions or segregations predominantly occupy conjugate shear bands (Fig. 1) with their long axes initially sub-parallel to the plane of maximum-resolved shear stress (i.e. ∼ 35∘ to compression axis). With progressive strain these melt-enhanced regions are rotated towards the XY plane. A visual inspection of different slices in the X and Y directions shows that melt-enriched shear bands are more common in the outer margin of the sample (Fig. 1d) than in the central regions (Fig. 1e). The regions of Mix-1, Mix-2, and H2O resemble “ribbons” and vary in length from 5 to 12 mm in 2D (Fig. 1). These mixed phases are disconnected, forming individual clusters (enclosed by ellipses in Fig. 1) that suggest the relative permeability of the melt increases towards low-pressure regions or non-deforming portions of the sample (Supplement Fig. S4). However, adjacent to the deforming indenter are compaction bands parallel to the XY plane, with concentrations of Mix-1 + Mix-2 + H2O (Fig. 1d).
In all samples there was an initial uniform 10 % distribution of water-ice grains throughout a matrix of D2O. During the deformation of DHC-06, there was significant loss of the water phases with only 1.1 % remaining (Table 2) and deposition on the outer margin of the sample (Fig. 3). Following deformation, DH-29 retained 8.7 % water (Table 2), which was concentrated on the outer edge of the sample (Supplement Fig. S5), with a complete absence in the central region of the sample (Fig. 1), whereas the distribution of overall porosity in DH-29 was not radically changed, with a slight reduction in the areas where meltwater was concentrated (Supplement Fig. S6). How this meltwater was expelled and redistributed can only be explained by diffusion and/or migration associated with the shear and compaction bands identified in all of the deformed samples.
In initial samples, where there are layers of dry-compacted ice, there was a barrelling of the deformed specimen (region DC in Fig. 3a–c). These are also regions where there were circular concentrations of Mix-1 + Mix-2 + H2O (A and B in Figs 1b–c). In X and Y slices through the deformed sample the network of pores is aligned at ∼ 35∘ to the compression axis and pores are larger than in comparable undeformed slices (Fig. 4). From a stack of XY-oriented slices, located in longitudinal sections, there are vertical changes in the porosity (Fig. 3d–f). At the ends of a deformed sample, irregular concentrations of Mix-2 are accompanied and fringed by an increase in porosity (identified as diffuse red streaks in Fig. 3d). At the end of the sample (Fig. 3e, Supplement Fig. S3a), pores are larger with a discrete decrease in number in the central region and concentration to peripheral regions (Fig. 3f). Also, adjacent to the end of the sample there is a circular arc (parallel to the dry-compacted layer DC) with a diffuse concentration of pores + Mix-2, including the presence of H2O + Mix-1 (Fig. 3d).
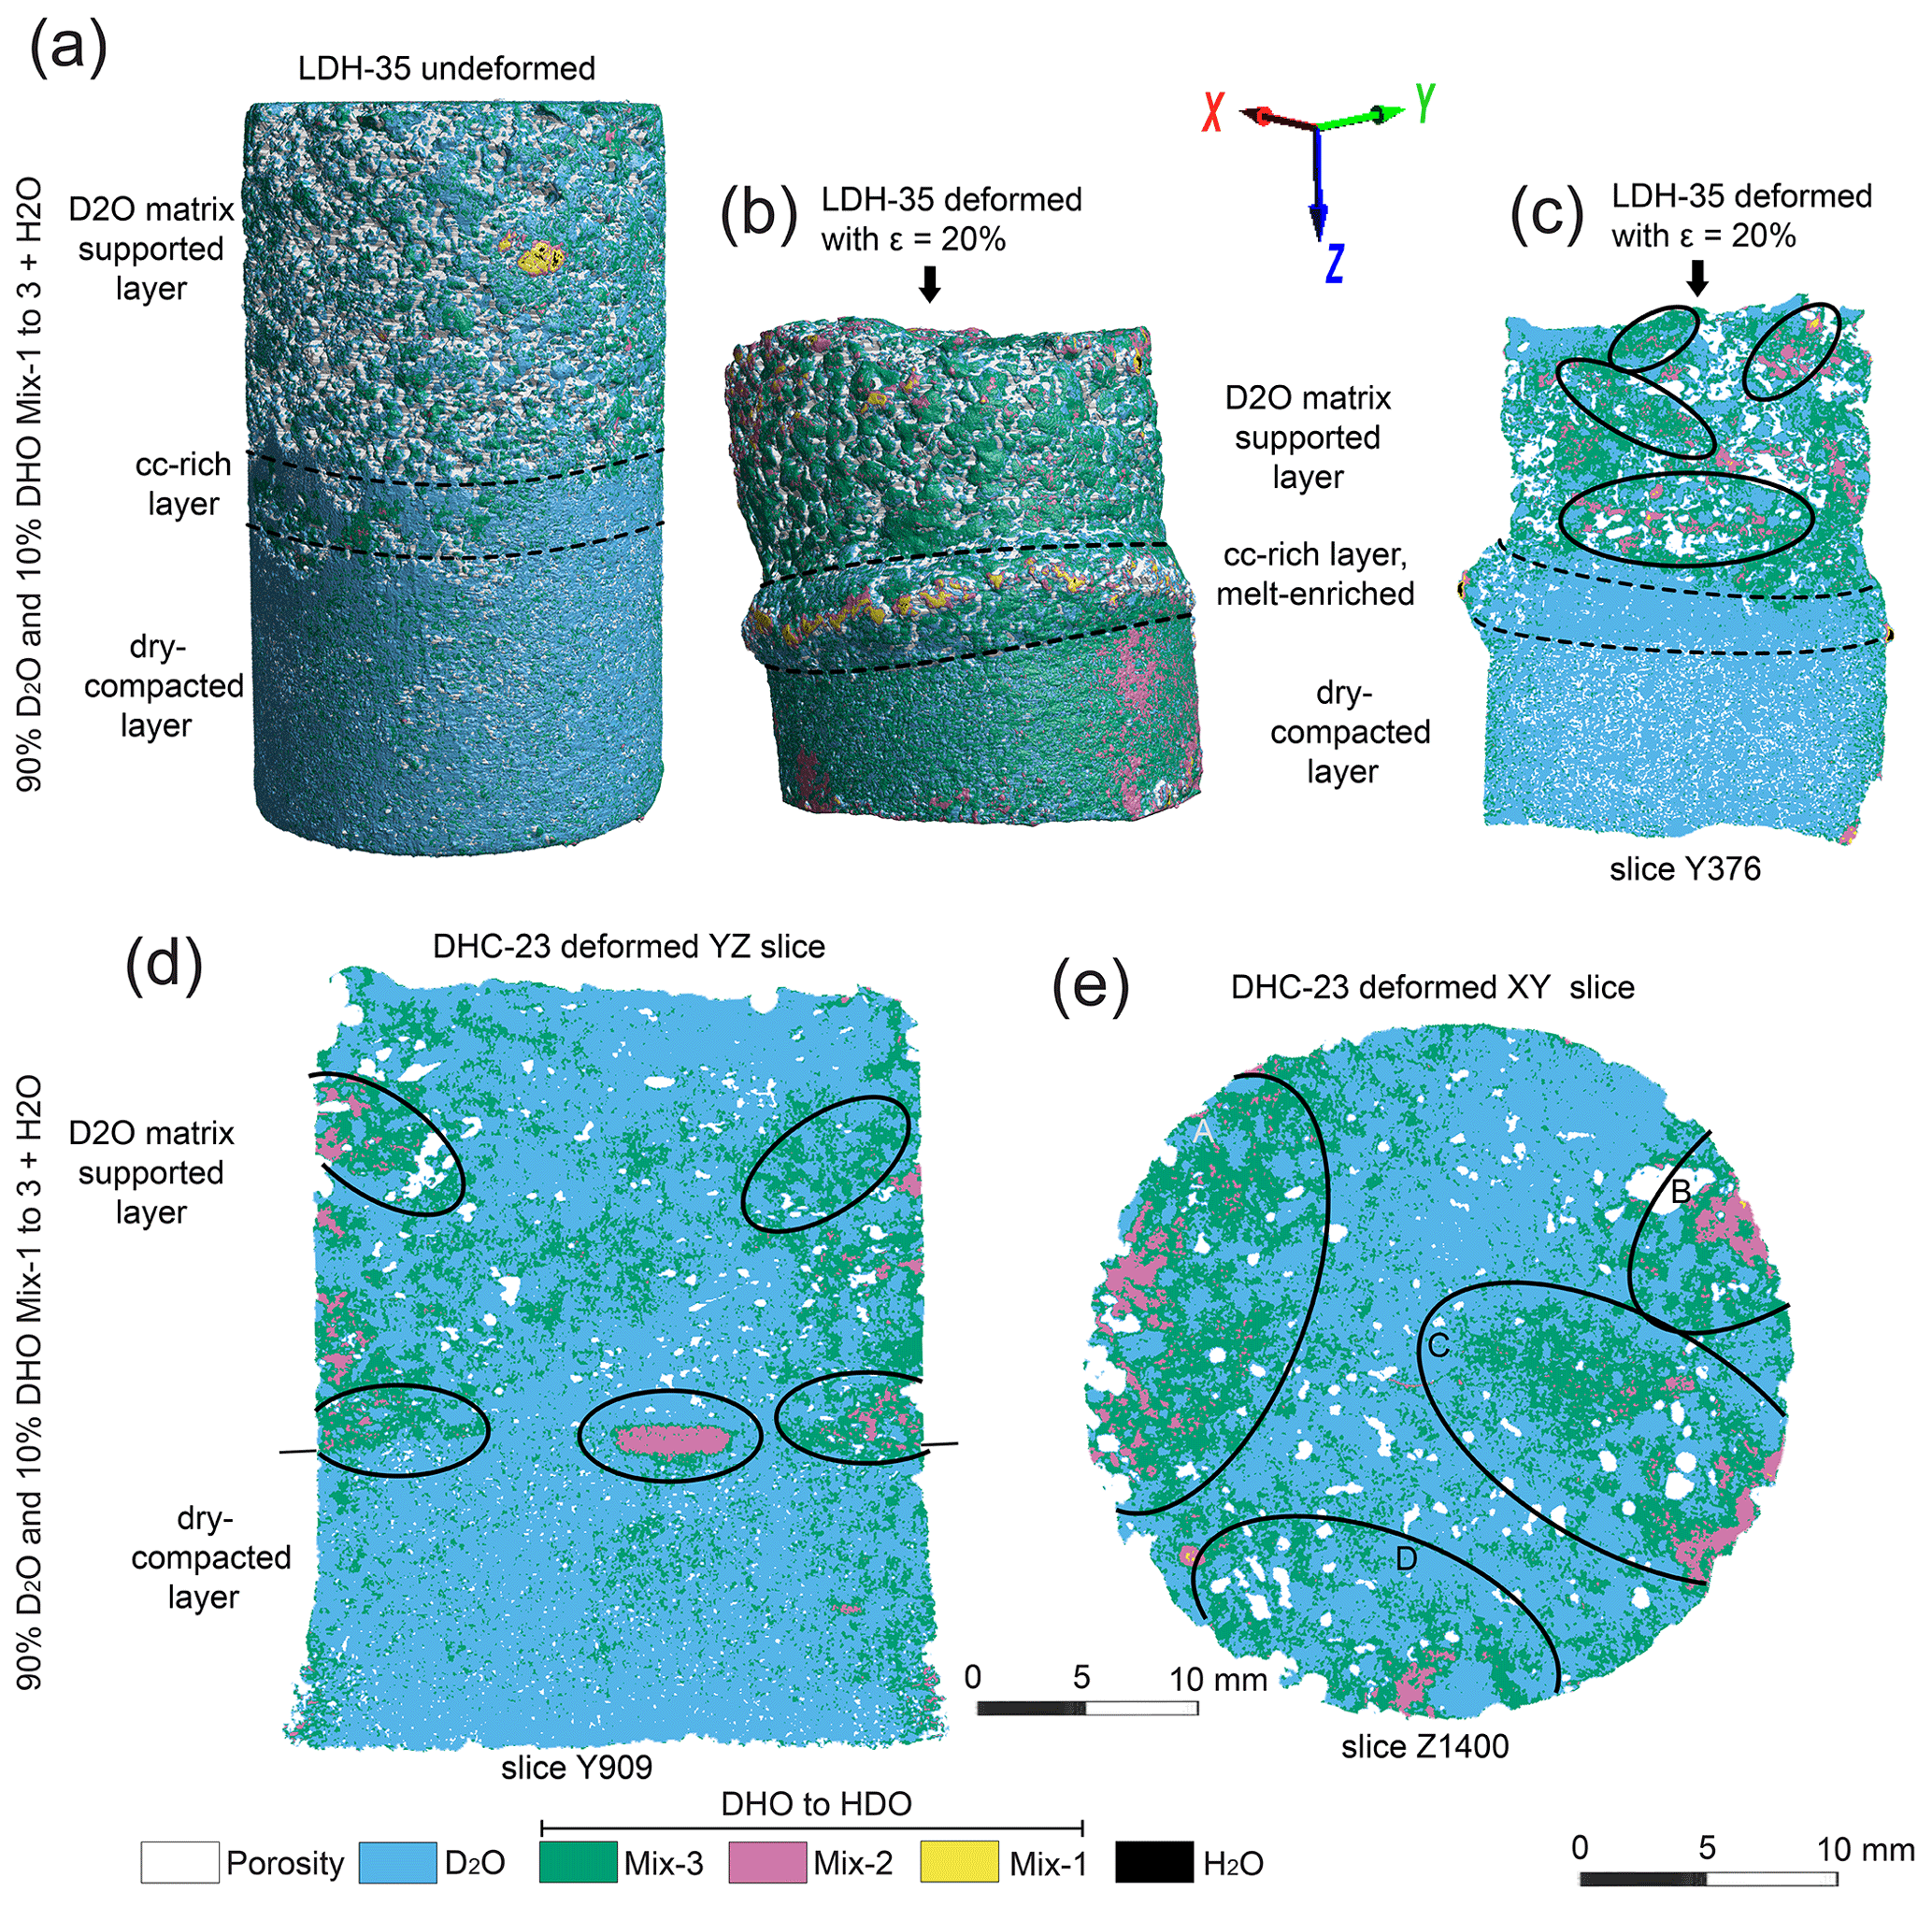
Figure 4Visualization of melt distributions from tomographic images in LDH-35 and DHC-23. (a) 3D surface rendering of water and deuterium phases in the undeformed sample. The legend shows the transition of increasing proton exchange between deuterium-rich to hydrogen-rich ice. (b) 3D visualization of phase distributions on the outer surface of LDH-35def. The ellipse identifies a melt-enriched band of Mix-1 + Mix-2 along the boundary of the calcite-rich (cc) layer. The arrow shows the orientation of the compression axis during deformation. (c) Segmentation along slice Y376 of deformed sample and ellipses showing distribution of Mix-2 at oblique angles to the compression direction and on the boundary of the calcite-rich layer. (d) 2D segmentation along slice Y909 in DHC-23def with conjugate shear bands containing Mix-2 in the upper DH portion of the sample with horizontal concentrations at the interface with the dry-compacted ice; which forms the lower half of the sample. (e) XY slice of DHC-23def showing concentrations at A–D of Mix-2 adjacent to the outer edge of the deformed sample.
In layered samples (Fig. 4), particularly where a calcite impurity was included in the D2O, there were higher strains and barrelling at the interface, with melt-enriched mixtures concentrated in a direction normal to the compression axis parallel to the interface (Fig. 4b, c), whereas in the DH layer the melt-enriched areas occupy conjugate shear bands sub-parallel to the plane of maximum-resolved shear stress (Fig. 4c). Melt-enriched areas were also developed along the boundary between water-rich and dry-compacted ice in DHC-23def (Fig. 4d, Supplement Fig. S3b). This distribution into shear and compaction bands is all part of a connected network. In longitudinal slices, conjugate shear bands are observed to localize melt-enriched mixtures in the water-rich portion of the sample, whereas in horizontal sections much of the melt-enriched transport is observed in isolated high-permeable channels associated with areas of increased porosity. For instance, concentrations of Mix-3 and Mix-2 are identified in the edge close to the indenter, as in areas A–D in Fig. 4e. If this is compared with the porosity distribution in the YZ slice (Fig. 4d), these concentrations also correspond to a marked increase in the volume of pores.
3.3 Changes in porosity and pore size distribution
Porosity determined from the reconstructed tomographs (Table 2 and Supplement Figs. S2, S3) shows irregularities because of initial variations in trapped air bubbles in the starting materials. However, the geometrical pore size distribution was determined by a morphological approach fitting spheres into the pores and using the coordination number (Table 1). The mean and maximum coordination numbers are higher in the deformed samples than their undeformed counterparts and can be displayed as histograms (Fig. 5a–c). The method does not distinguish between pores, closed pores, and blind pores and is purely a geometrical cumulative measure of the pore size range and the number of pores connected. Figure 5d depicts the trend lines of cumulative and volume percentages before and after deformation. The initial pore volume fraction distribution has a peak in the range of 50 µm in diameter (Fig. 5d). The final maximum diameter of the deformed samples at the 100 % cumulative amounts to ∼ 120 µm. This indicates that during deformation the overall pore size diameter increases and becomes interconnected. These differences in pore topography (shape) can also be explained by computing the sphericity from the images (Fig. 5e). The pores within the deformed sample DHC-06def are slightly more spherical than those with intergranular water (DH-29def) or with a layering (LDH-35def; Fig. 5e).
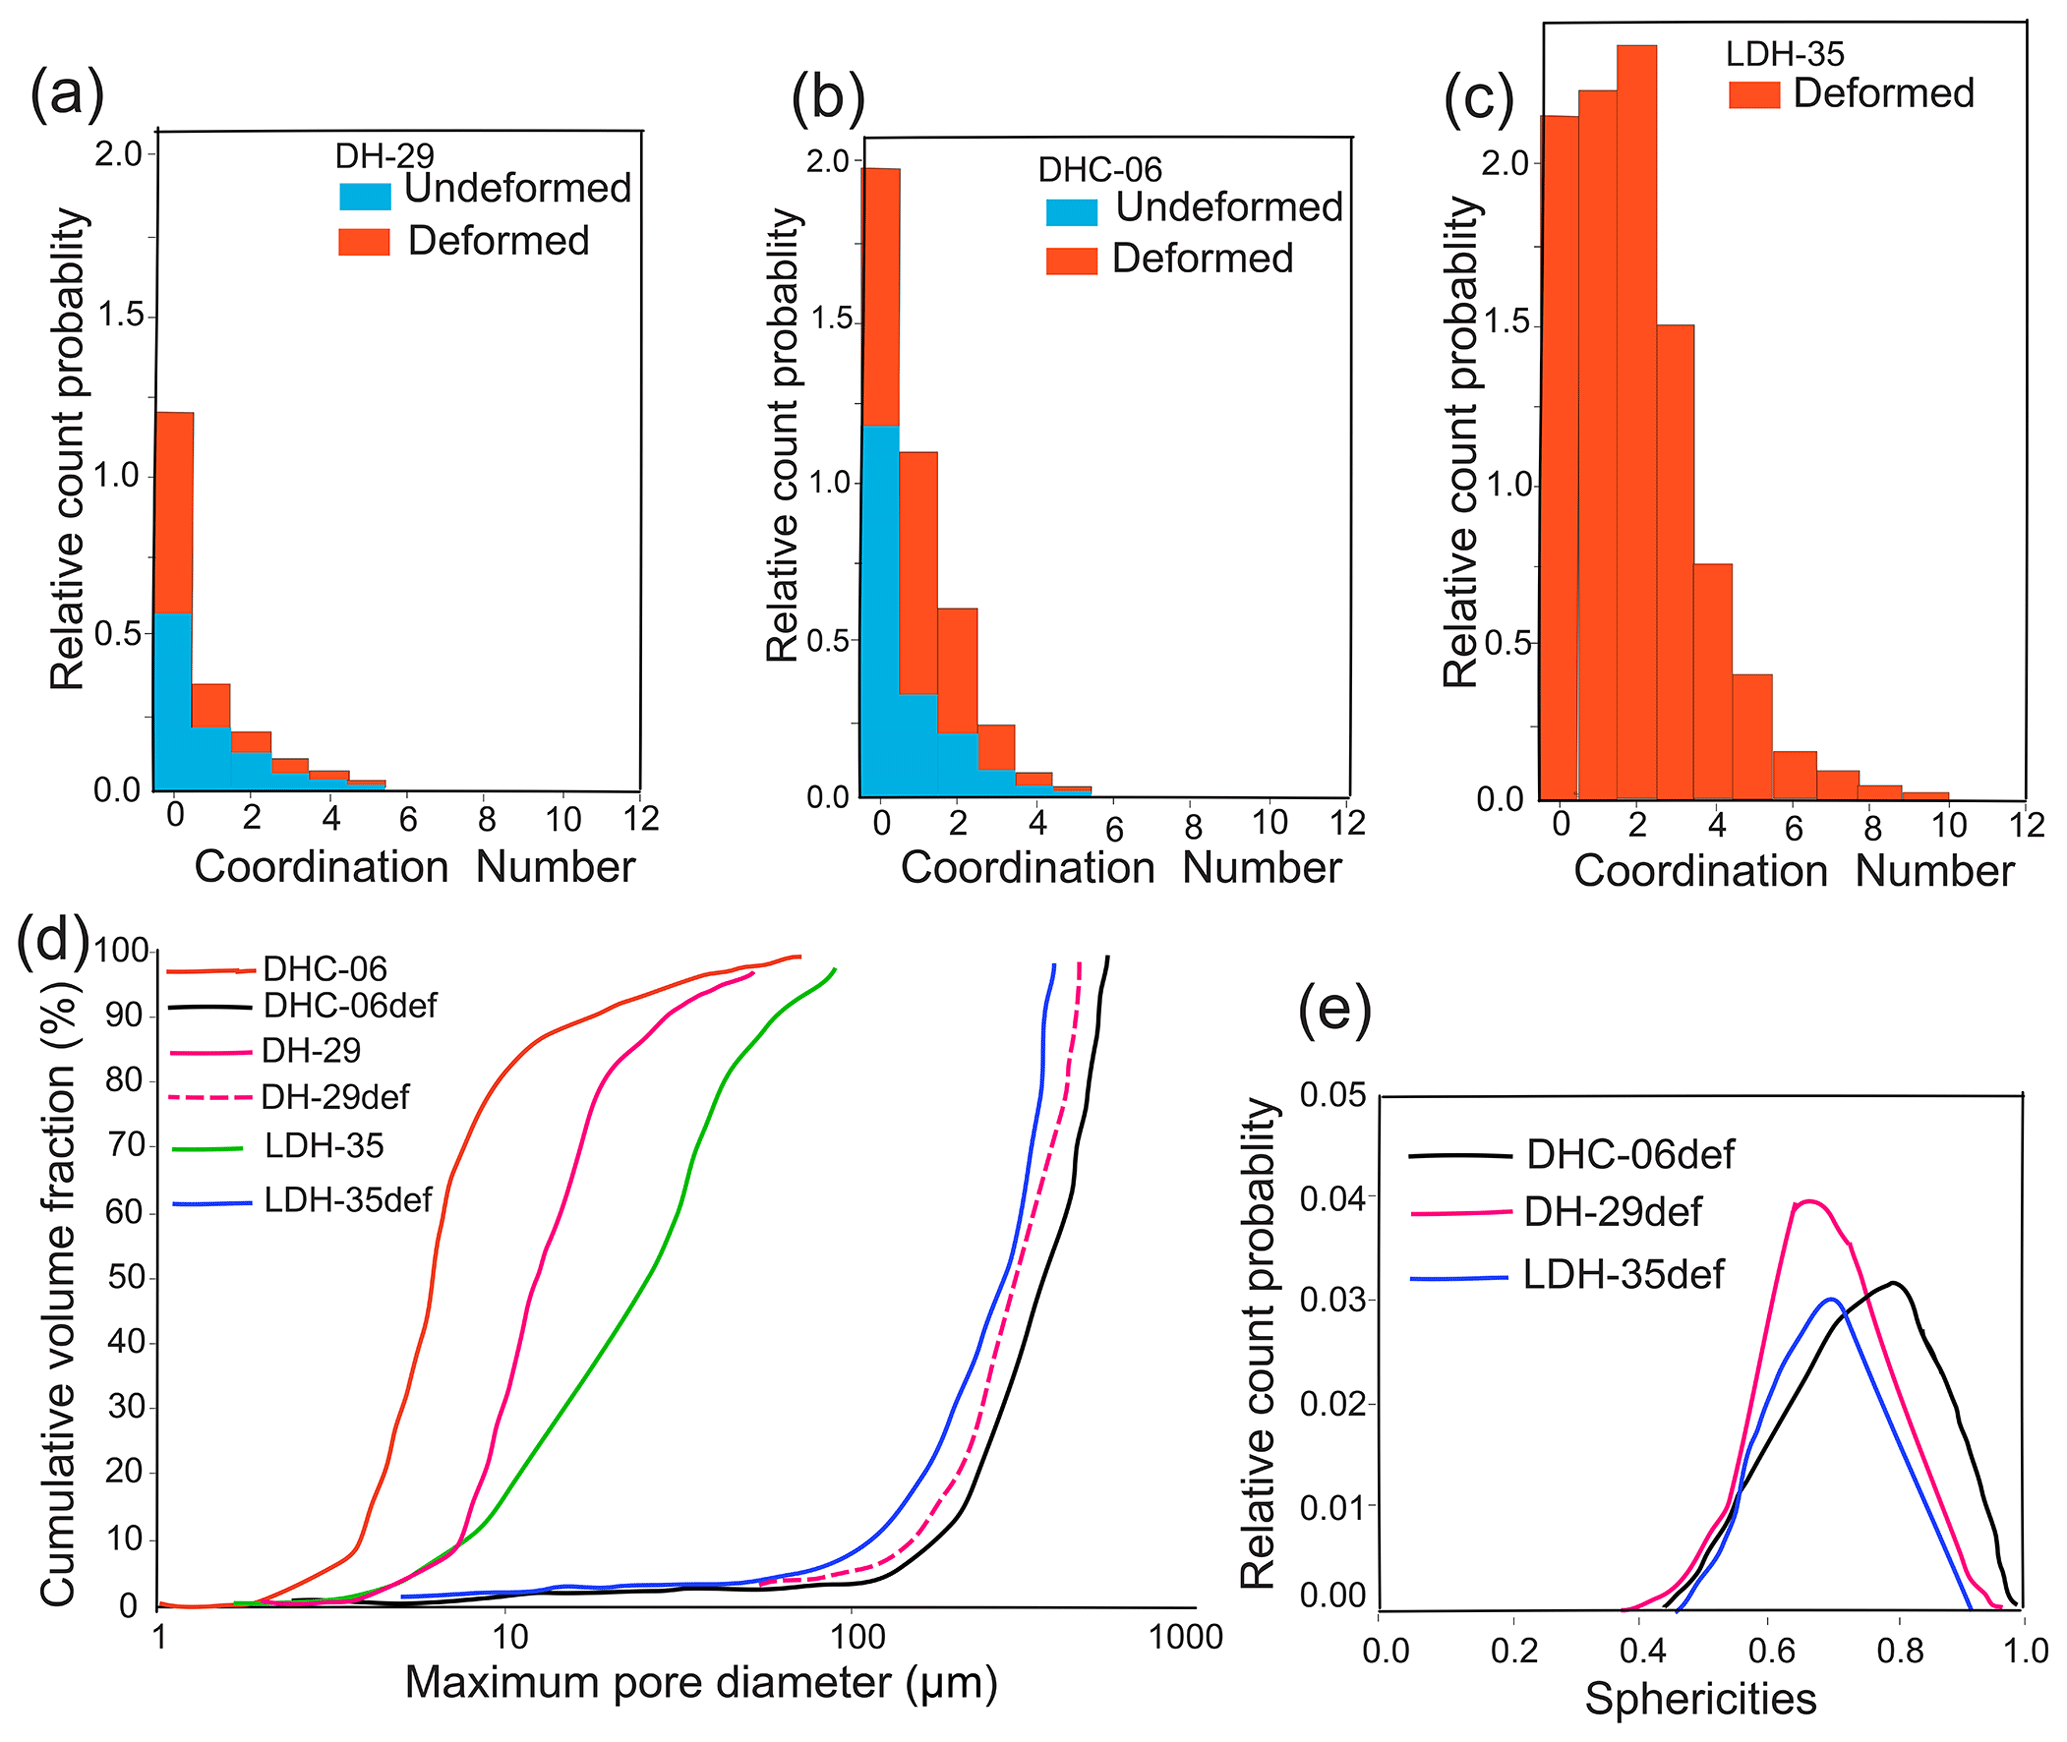
Figure 5Plots comparing the pore network data of undeformed and deformed samples. (a–c) Probability distribution plots of the coordination number of pores. We report the median values in Table 1. (d) Comparison between pore size distribution versus cumulative volume fraction (%), which are plotted for both before and after deformation. The cumulative pore curves were determined to allow the geometrical pore size distribution to be interpreted in terms of micro- and macro-pore contributions to the total volume. (e) Distribution of sphericities in deformed samples. Pore sphericity is a volume-normalized, dimensionless measure of how close a particular component of the pore space is to an ideal sphere (with a sphere having a value of 1.0).
Qualitative investigation of thin sections of the undeformed samples is reflected in a relatively uniform distribution of pores or bubbles, whereas in deformed samples, pores or bubbles are concentrated in what were melt regions. Within the melt-enriched paths identified in the samples, there were networks of bubbles or pores that align with shear bands at <35∘ and in the end faces of samples (Fig. 3d). The network consists of pores situated on grain boundaries and serves as the junction between grains. Our analysis indicates that the number of pores, their medium coordination number, and fraction of connected pore space were highest in the layered sample LDH-35def (Fig. 5c).
The evolution of coexisting meltwater globules in the DHO matrix and attached bubbles or pores produces a close-packed solid framework. This suggests the pores have a strong tendency to nucleate against and remain attached to water owing to surface tension effects. As a consequence, there is a noticeable weak alignment parallel to compaction bands and a faint foliation in the ice matrix.
3.4 Crystallographic preferred orientations
The effect of melt-enriched areas on the crystallographic preferred orientations (CPOs) provides an insight into the mechanisms of high-temperature plastic deformation active during the segregation and reorganization of meltwater. CPOs provide a clear indication of pervasive partitioning of strain between the melt-depleted areas and the network of melt-enriched deformation bands. In addition to rheological weakening, meltwater concentrations may influence the relative activity of particular slip systems activated during deformation. This has been clearly identified in quartz (Kronenberg et al., 2020, and references therein), which is an ice analogue (Wilson et al., 2014).
Examination of the CPO in meltwater-free D2O ice samples (Wilson et al., 2020; Hunter et al., 2023) provides a reference point for analysing the CPO of similarly axially deformed samples with meltwater-enriched deformation bands. Pole figures obtained on the meltwater-free pure D2O ice deformed to 20 % shortening at a constant displacement rate of 2.5 × 10⁻⁶ s−1 at −1 ∘C (Fig. 5h) and at −7 ∘C (Fig. 6i) provide a reference frame (Wilson et al., 2020). At lower temperatures (−7 ∘C) the deformed pure ice has a distinct cone pattern of [c] axes with a polar angle χ=30∘ (Fig. 6i). At −1 ∘C, [c]-axis poles (Fig. 6h) have preferentially aligned as clusters in a small circle with a polar angle χ=33∘. Corresponding maxima for <a>-axis pole figures (Supplement Fig. S7) are concentrated around the equatorial circle in directions perpendicular to σ1. In all samples of melt-enriched DH ice (e.g. Fig. 6a–b) a similar but weaker cluster-dominant pattern is observed with a wider spread of poles (Fig. 6e–g). Many of these clusters correspond to melt-enriched shear bands (ellipse in Fig. 6b) as identified by analysing individual c axes using a fabric analyser microscope (Fig. 6e).
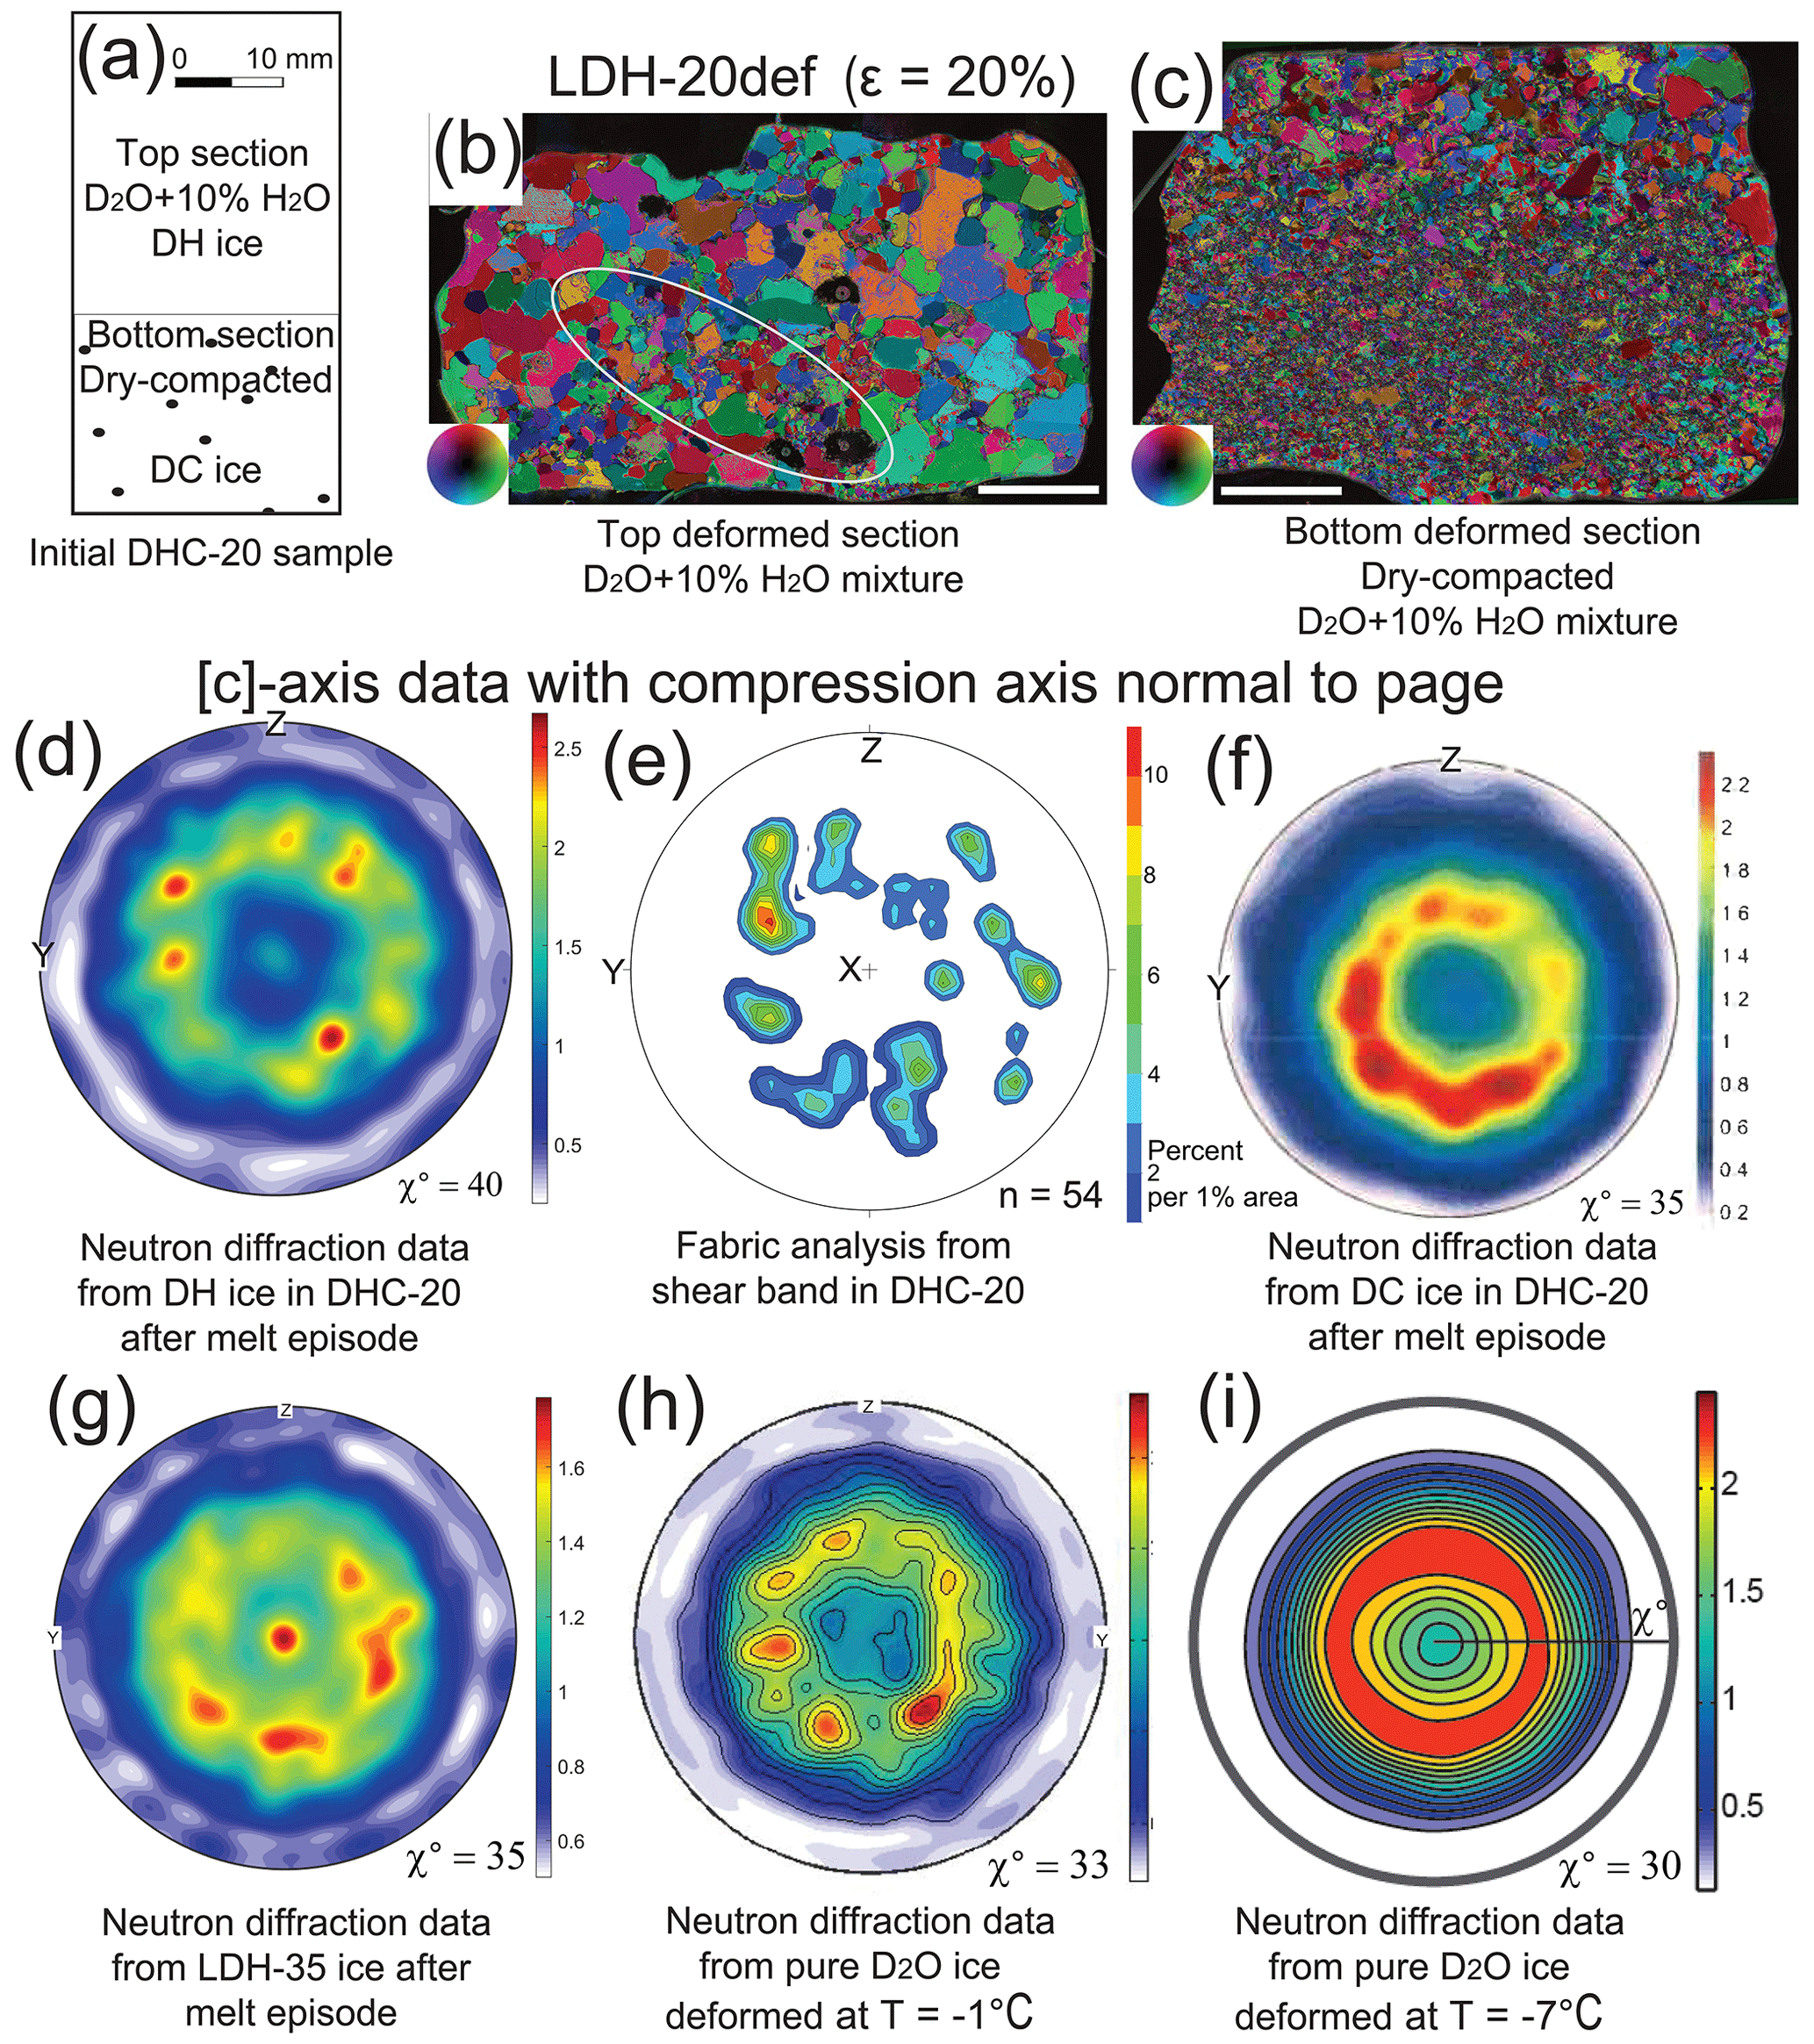
Figure 6Microstructure and textural changes in samples deformed at a displacement rate () of 2.5 × 10⁻⁶ s−1. (a) Sketch of initial DHC-20 sample (width 24.7 mm) with top section composed of DH ice (length 27.7 mm) and bottom section of DC ice (length 17 mm). (b) Final microstructure of deformed top half of sample; the colour of each pixel shows crystal [c]-axis direction perpendicular to the paper. The inset colour wheel image indicates [c]-axis directions with respect to vertical compression axis. The ellipse encloses a melt-enriched band identified by finer grain size at oblique angle to the compression direction. Scale bar is 5 mm. (c) Final microstructure of deformed bottom half of sample composed of dry-compacted ice. (d–i) Pole figures showing a cluster of [c] axes around the centre of the pole figure corresponding to compression axis (X). The polar angle χ is the angle between the compression axis (χ=0∘) and the maximum contour for the [c] axes. Fabric analyser [c]-axis orientations from the elliptical area shown in (b) (n is the number of [c] axes measured). Minima and maxima of density are indicated to the right of each pole figure.
In regions of deformed dry-compacted ice the fabric is weaker than pure or DH ice and has a pronounced development of a cone in [c]-axis distributions with a radius of χ=35∘. While <a> and <m> axes are spread closer to the periphery of the pole figure and are more defined, samples with distinct compaction band (Fig. 4b–d) intensities are weaker with a cone-like distribution of [c] axes (χ=35∘) and a significant maximum parallel to σ1 (Fig. 6g).
3.5 The effect on rheology by increasing temperature from −7 to +2 ∘C
From the slope of the creep curves, four stages can be distinguished during the initial 14.6 % shortening of the dry-compacted and D2O-bonded ice (Fig. 7). Stage I is a hardening phase (0 % < strain <1.5 %), Stage II transitions from hardening to weakening (1 %< strain 10 %), Stage III is a weakening, and Stage IV is a quasi-steady state. As the temperature was increased to +2 ∘C there was a change in the rheology with an increase to a peak stress before a stress drop becoming apparent in the curves. This stress drop we attribute to the softening of the ice with the onset of melting, grain boundary migration, and initiation of the deformation bands. This ductile-to-shear transition can be explained by the competition between different timescales corresponding to the relatively slow melting of the H2O ice, as well as broken atomic bonds as the HDO mixes were generated.
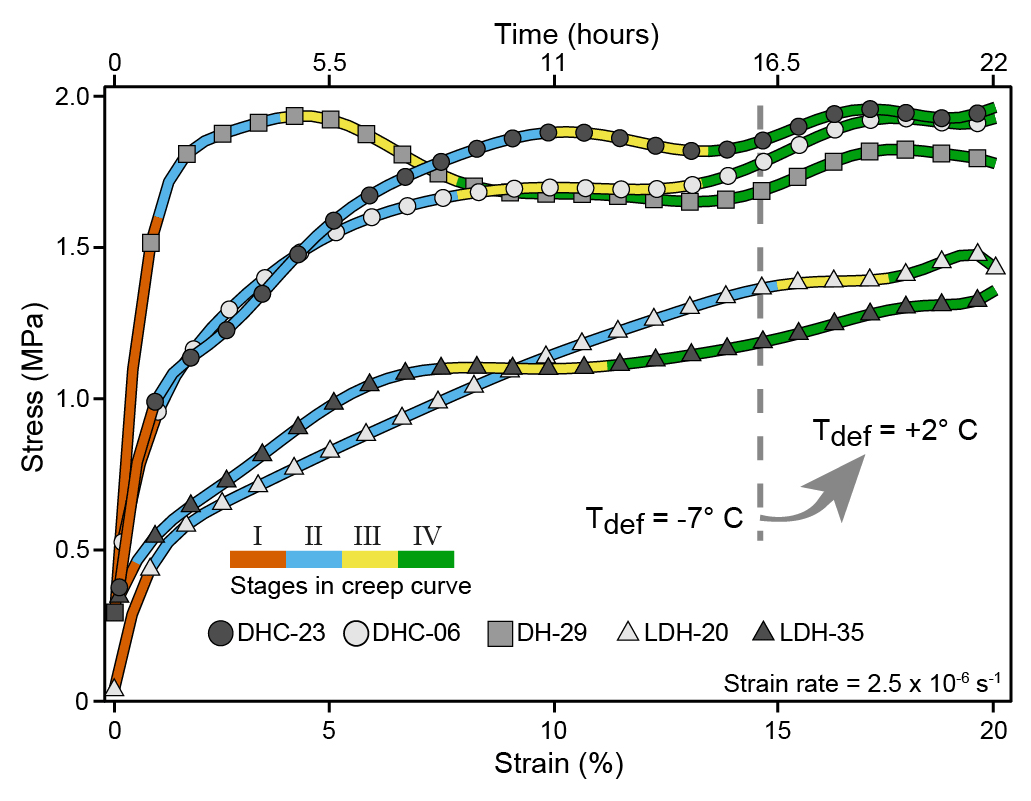
Figure 7Nature of the stress–strain relationships. The first 14.6 % shortening at a temperature range of −7 ∘C was followed by a temperature increase for a remaining 5.4 % shortening. All experiments were undertaken at a constant displacement rate (2.5 × 10⁻⁶ s−1). The maximum variation in stress for each curve is <2 MPa. After the increase in temperature there is a minor increase in stress, which we reconcile with an expansion of the aluminium of the rigid deforming indenter.
In the strongly layered samples with notable compaction bands (LDH-20 and LDH-35; Fig. 7) the transition from hardening to weakening occurs at a lower stress after and during the −7 ∘C temperature regime. For the duration of the remaining 5.4 % shortening, where there is the impact of an increasing temperature, there is both a modest increase followed by a decrease in stress or softening of the ice. This modest increase in stress we attribute to an expansion of the aluminium piston as the temperature is increased. This also probably reflects the kinetics of meltwater migration, reorganization, and the balance between solid state processes such as new grain nucleation and grain boundary migration.
3.6 Grain size and grain number evolution
Initial microstructures of the D2O and H2O mixtures consist of a homogeneous aggregate of equidimensional grains with a near-uniform distribution of pores. Grain boundaries are straight to gently curved with mean grain size of ∼ 0.5 mm. At the conclusion of the temperature increase (Fig. 8b, c) there is a noticeable increase in grain sizes to 3–5 mm. Grains in the D2O-water-rich ice areas (Fig. 8b, c) display irregular shapes, are free of undulose extinction, have diffuse low-angle boundaries, and have a pore shape preferred orientation (Fig. 8d). These irregular grains may be bounded by aggregates of smaller (<1 mm) equant grains that are generally confined to shear bands (Fig. 8d). Within the shear bands is a greater percentage of Mix-2 melt and air bubbles, and there is an abundance of Mix-1 melt along grain boundaries (Fig. 8d).
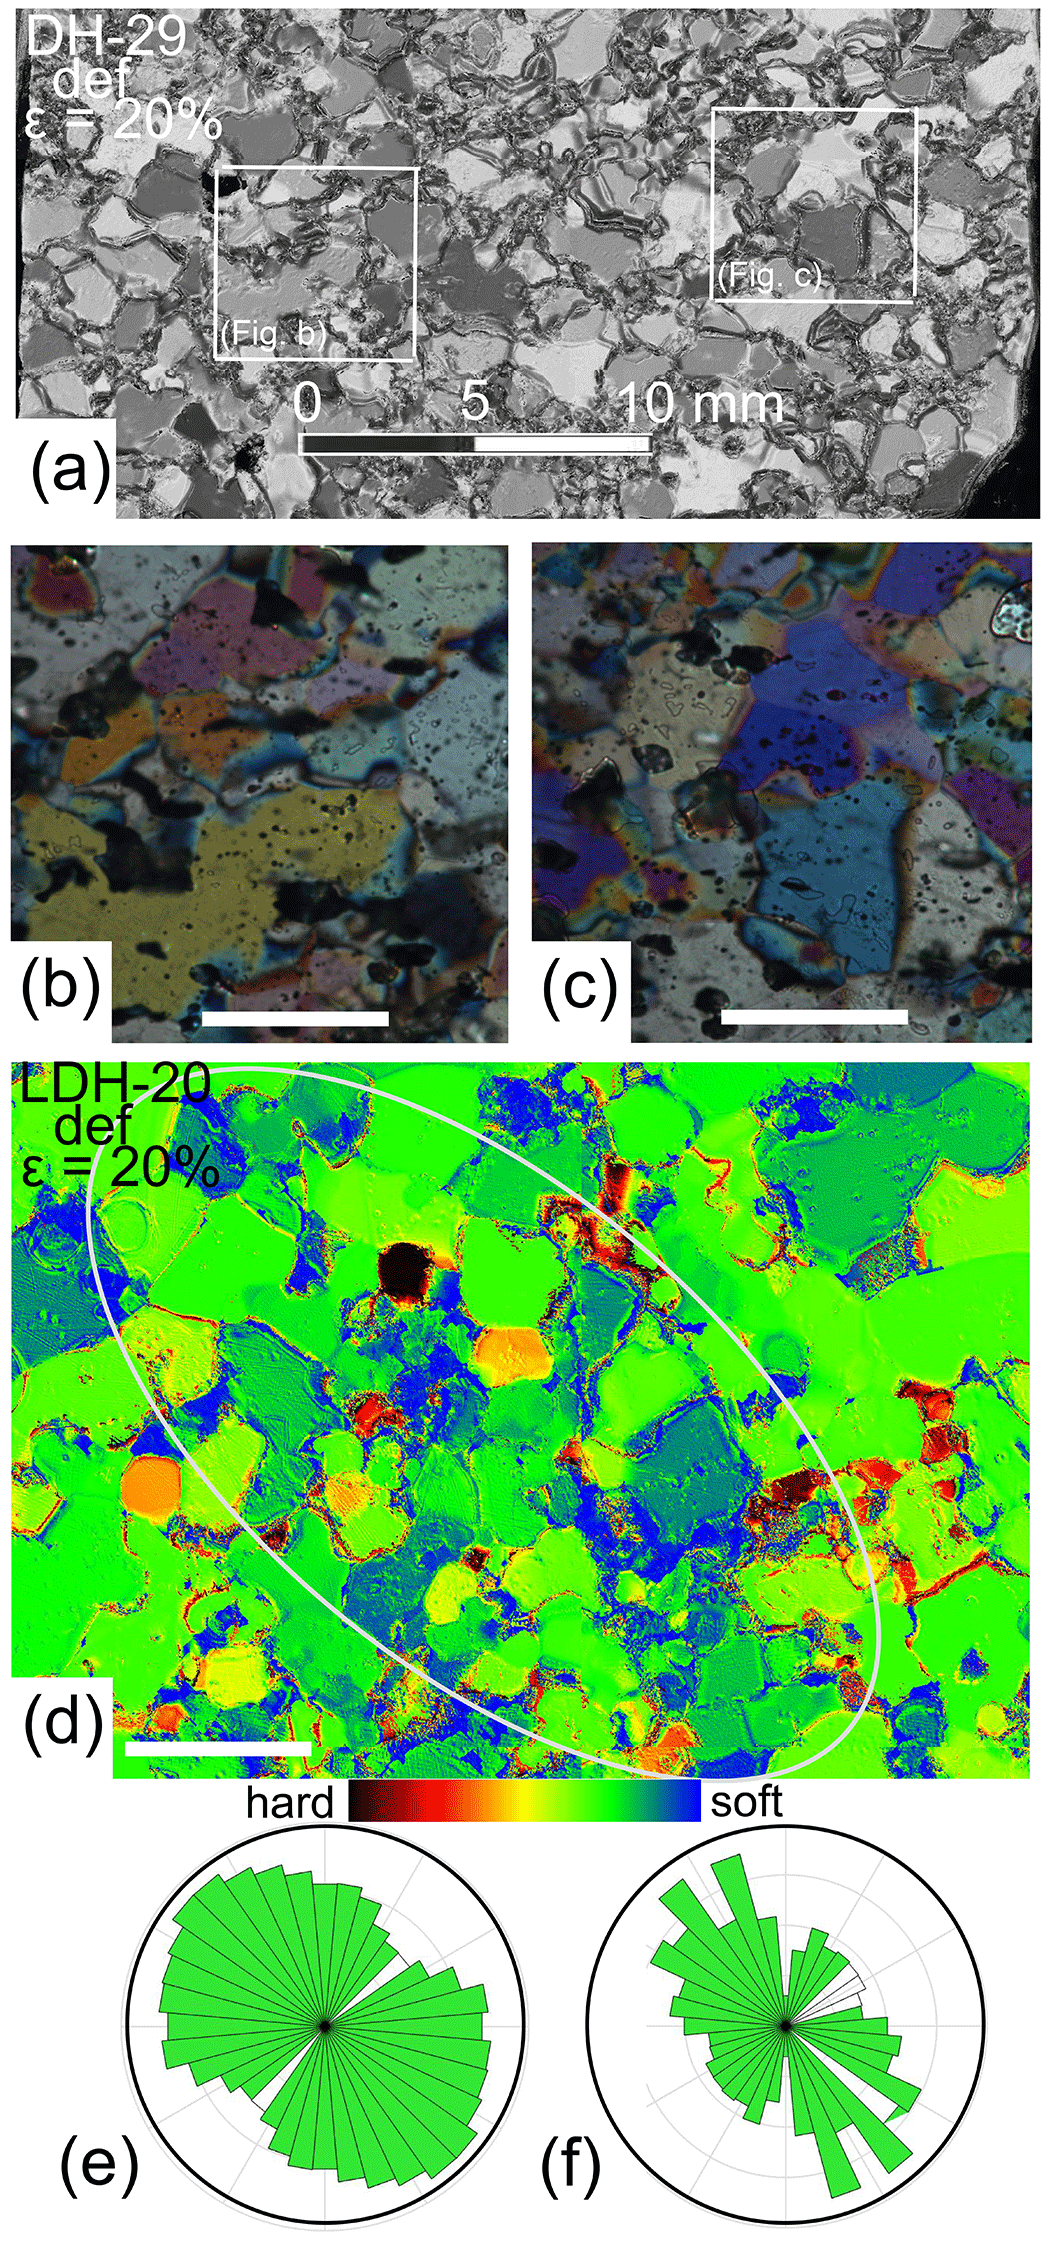
Figure 8Images from thin sections of ice samples showing post-deformation microstructures. (a) Greyscale image through a portion of DH-29def showing location of enlargements (b) and (c). (b, c) Plane polarized images illustrating irregular grain structures in DH-29def. White scale bars are 2 mm. (d) A grain softness map (Peternell et al., 2019) of a portion of LDH-20def. The blue areas preferentially located along grain boundaries represent Mix-2 + Mix-1 and H2O and are soft areas that can accommodate easy glide in the ice in contrast to the hard grains (green and red-black). (e) Rose diagrams illustrate the grain shape preferred orientation outside the white ellipse (f) Rose diagram of grain shape within a shear band corresponding to the elliptical area in LDH-20 that is dominated by soft grains and grain boundaries (Peternell et al., 2019).
In layered samples (DHC and LDH; Table 1), the final deformation grain sizes vary significantly between layers (Fig. 9a–c). The matrix of the deformed dry-compacted ice is dominated by small grains (<1 mm) and an abundance of air bubble trains (fine red and yellow lines superimposed on green background in Fig. 9c). Layers composed of a rheological hard and insoluble calcite powder (±20 vol % of calcite grains with grain diameter <20 µm) dominate over the isolated and dispersed D2O grains in the calcite-rich (cc) layers (Fig. 9b, c). This was because during sample preparation it was impossible to obtain a completely uniform dispersion of the calcite between the ice particles, and boundaries with adjacent layers were irregular. Also, during thin section preparation, the softer ice grains were preferentially removed, leaving behind a greater concentration of the calcite.
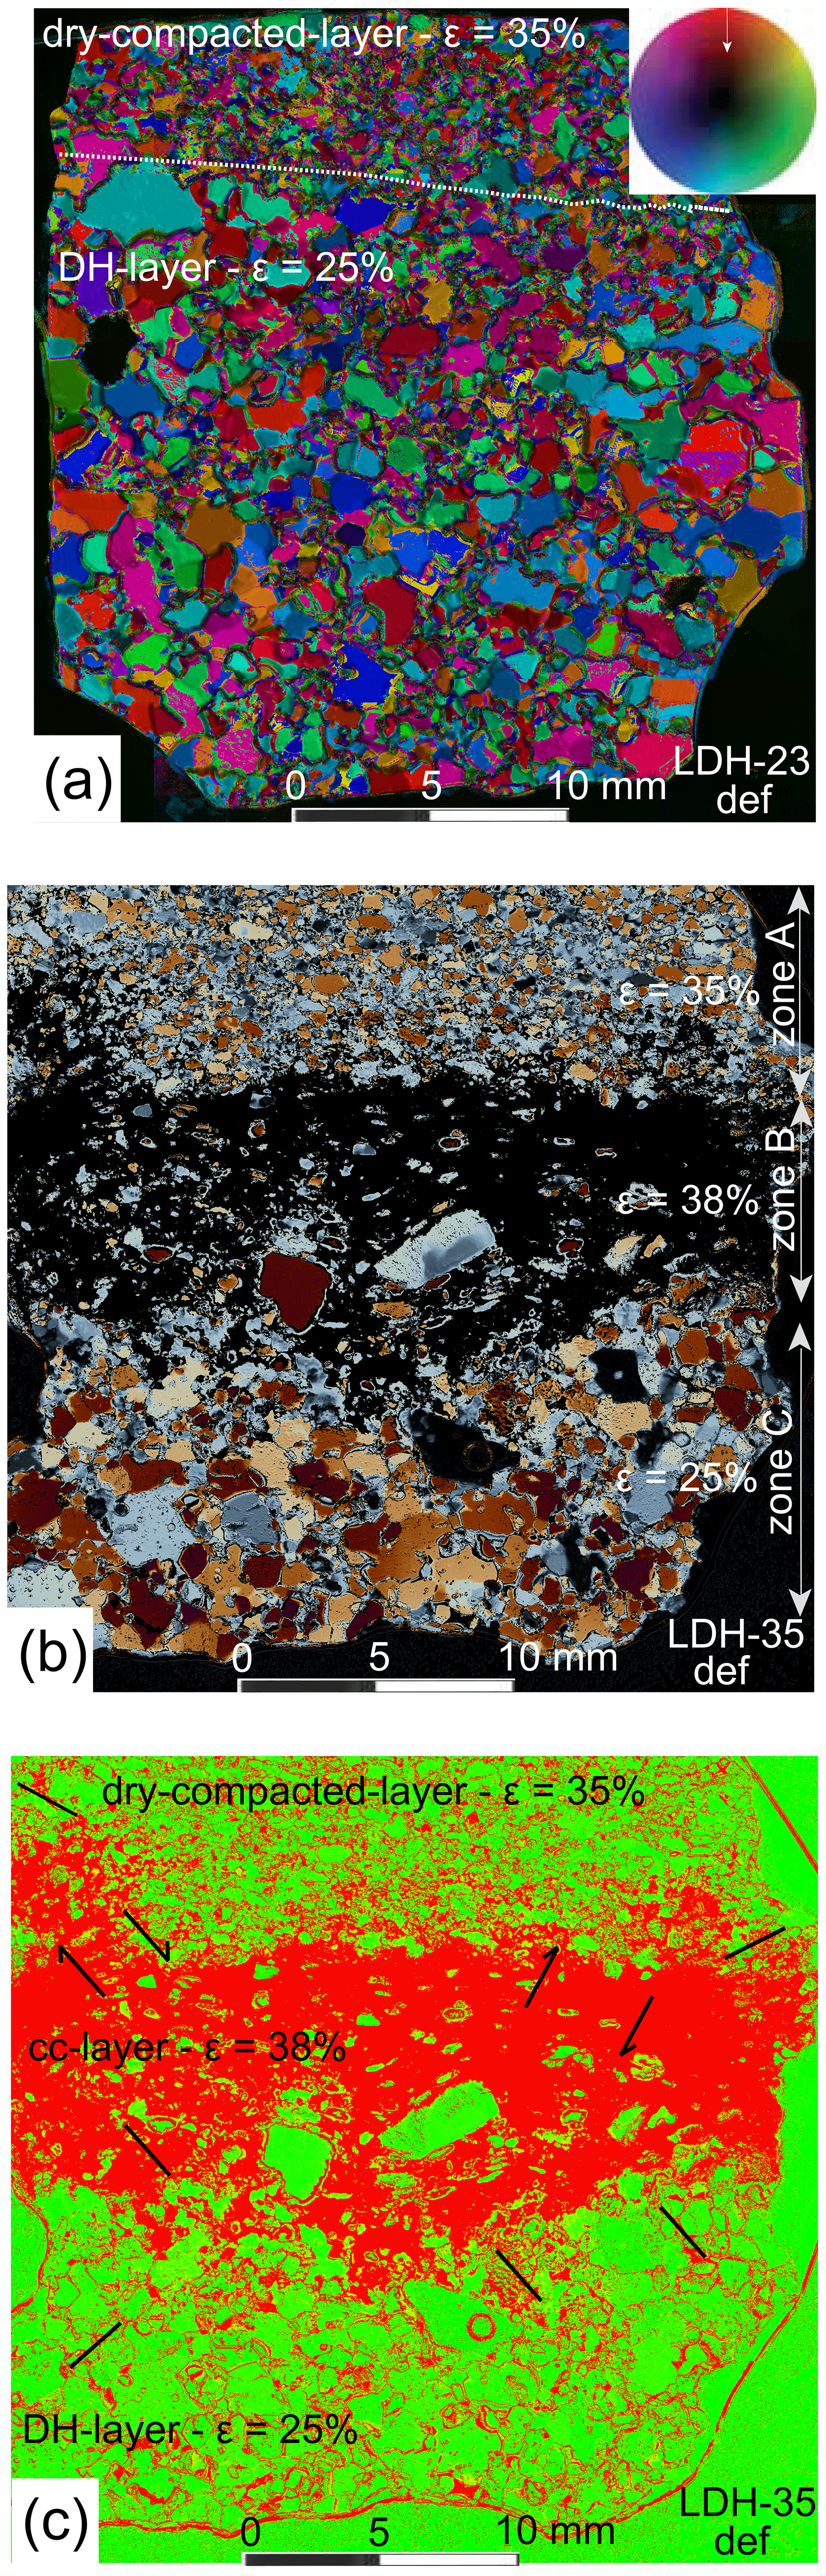
Figure 9Images from deformed layered samples with details of microstructure and strain distributions. (a) Axial distribution analysis (AVA) image, obtained using a fabric analyser (Wilson and Peternell, 2011), of DHC-23. The finer-grained dry-compacted ice is more strained than the deuterium-rich ice (DH) below the interface indicated by the broken white line. (b–c) Deformed sample LDH-35 with compaction band in zone A, calcite-rich (cc) layer (zone B) which preserves an open warping of the elongate fine-grained ice, and water-rich layers (zone C). (c) Superimposed on the green background is the distribution of grain boundaries which are host to a network of pores. The dominant red area in the centre corresponds to where there was a concentration of the calcite powder, but most of the ice was removed during thin section preparation. The black lines reflect the 2D orientation of shear bands in the areas of greater strain.
The microstructure in these calcite–ice mixtures is dominated by a bimodal population of large irregular-shaped pure-ice grains in a matrix of finer (<0.5 mm) elongate grains (Fig. 9b). The elongate recrystallized grains are located in widely spaced high-angle conjugate shear bands that produce an open warping of the layering (zone B in Fig. 9b and black lines in Fig. 9c), which may be related to the onset of shear-enhanced compaction (Wong et al., 2001). These shear bands have a higher orientation in the stronger calcite layer (Fig. 9c) and are refracted as they pass into the adjoining weaker ice-rich layers. In the deformation band region, adjoining dry-compacted ice (zone A in Fig. 9b), the grain size is significantly reduced. In the water-rich ice (zone C in Fig. 9b), a bimodal microstructure is observed with larger irregular interlocking grains (>2 mm) in a matrix of smaller (<0.5 mm) ice grains. All larger grains have interlobate or amoeboid shapes, as well as irregular boundaries, which transition into smaller recrystallized grains.
Although the morphologies (e.g. thickness of and spacing between melt-enriched bands) differed among samples, the general character of the microstructure was similar from one sample to the next. An estimate of individual grain-numbers in a sample (Fig. 10) was evaluated through statistical analysis of particular angular positions and hkl crystallographic reflections collected during the in situ deformation (Wilson et al., 2019, 2020). By using the technique described in Wilson et al. (2019) we can establish the relative number of grains or sub-grains in a given volume of the sample at any stage during the deformation. Because of the differences between D2O water-rich (DH) versus layered samples (LDH), there was a wide variation in initial grain numbers (150 000–200 000 ± 500) and number of new grains evolving (100 000–480 000 ± 500) during the ensuing deformation. However, there are four stages, with common characteristics, which precede the development of the final microstructural pattern: (1) an initial increase in sub-grains within the first 2 % strain (Wilson et al., 2020); (2) a strain-dependent increase in grain nucleation of new recrystallized grains up to 14.6 % strain; (3) a decrease in the number of grains as the temperature rose from −7 to the +2 ∘C, which can be related to an increasing grain growth; and (4) a variable but decreasing number of grains in the final deformation stage (15.4 %–20 % strain).
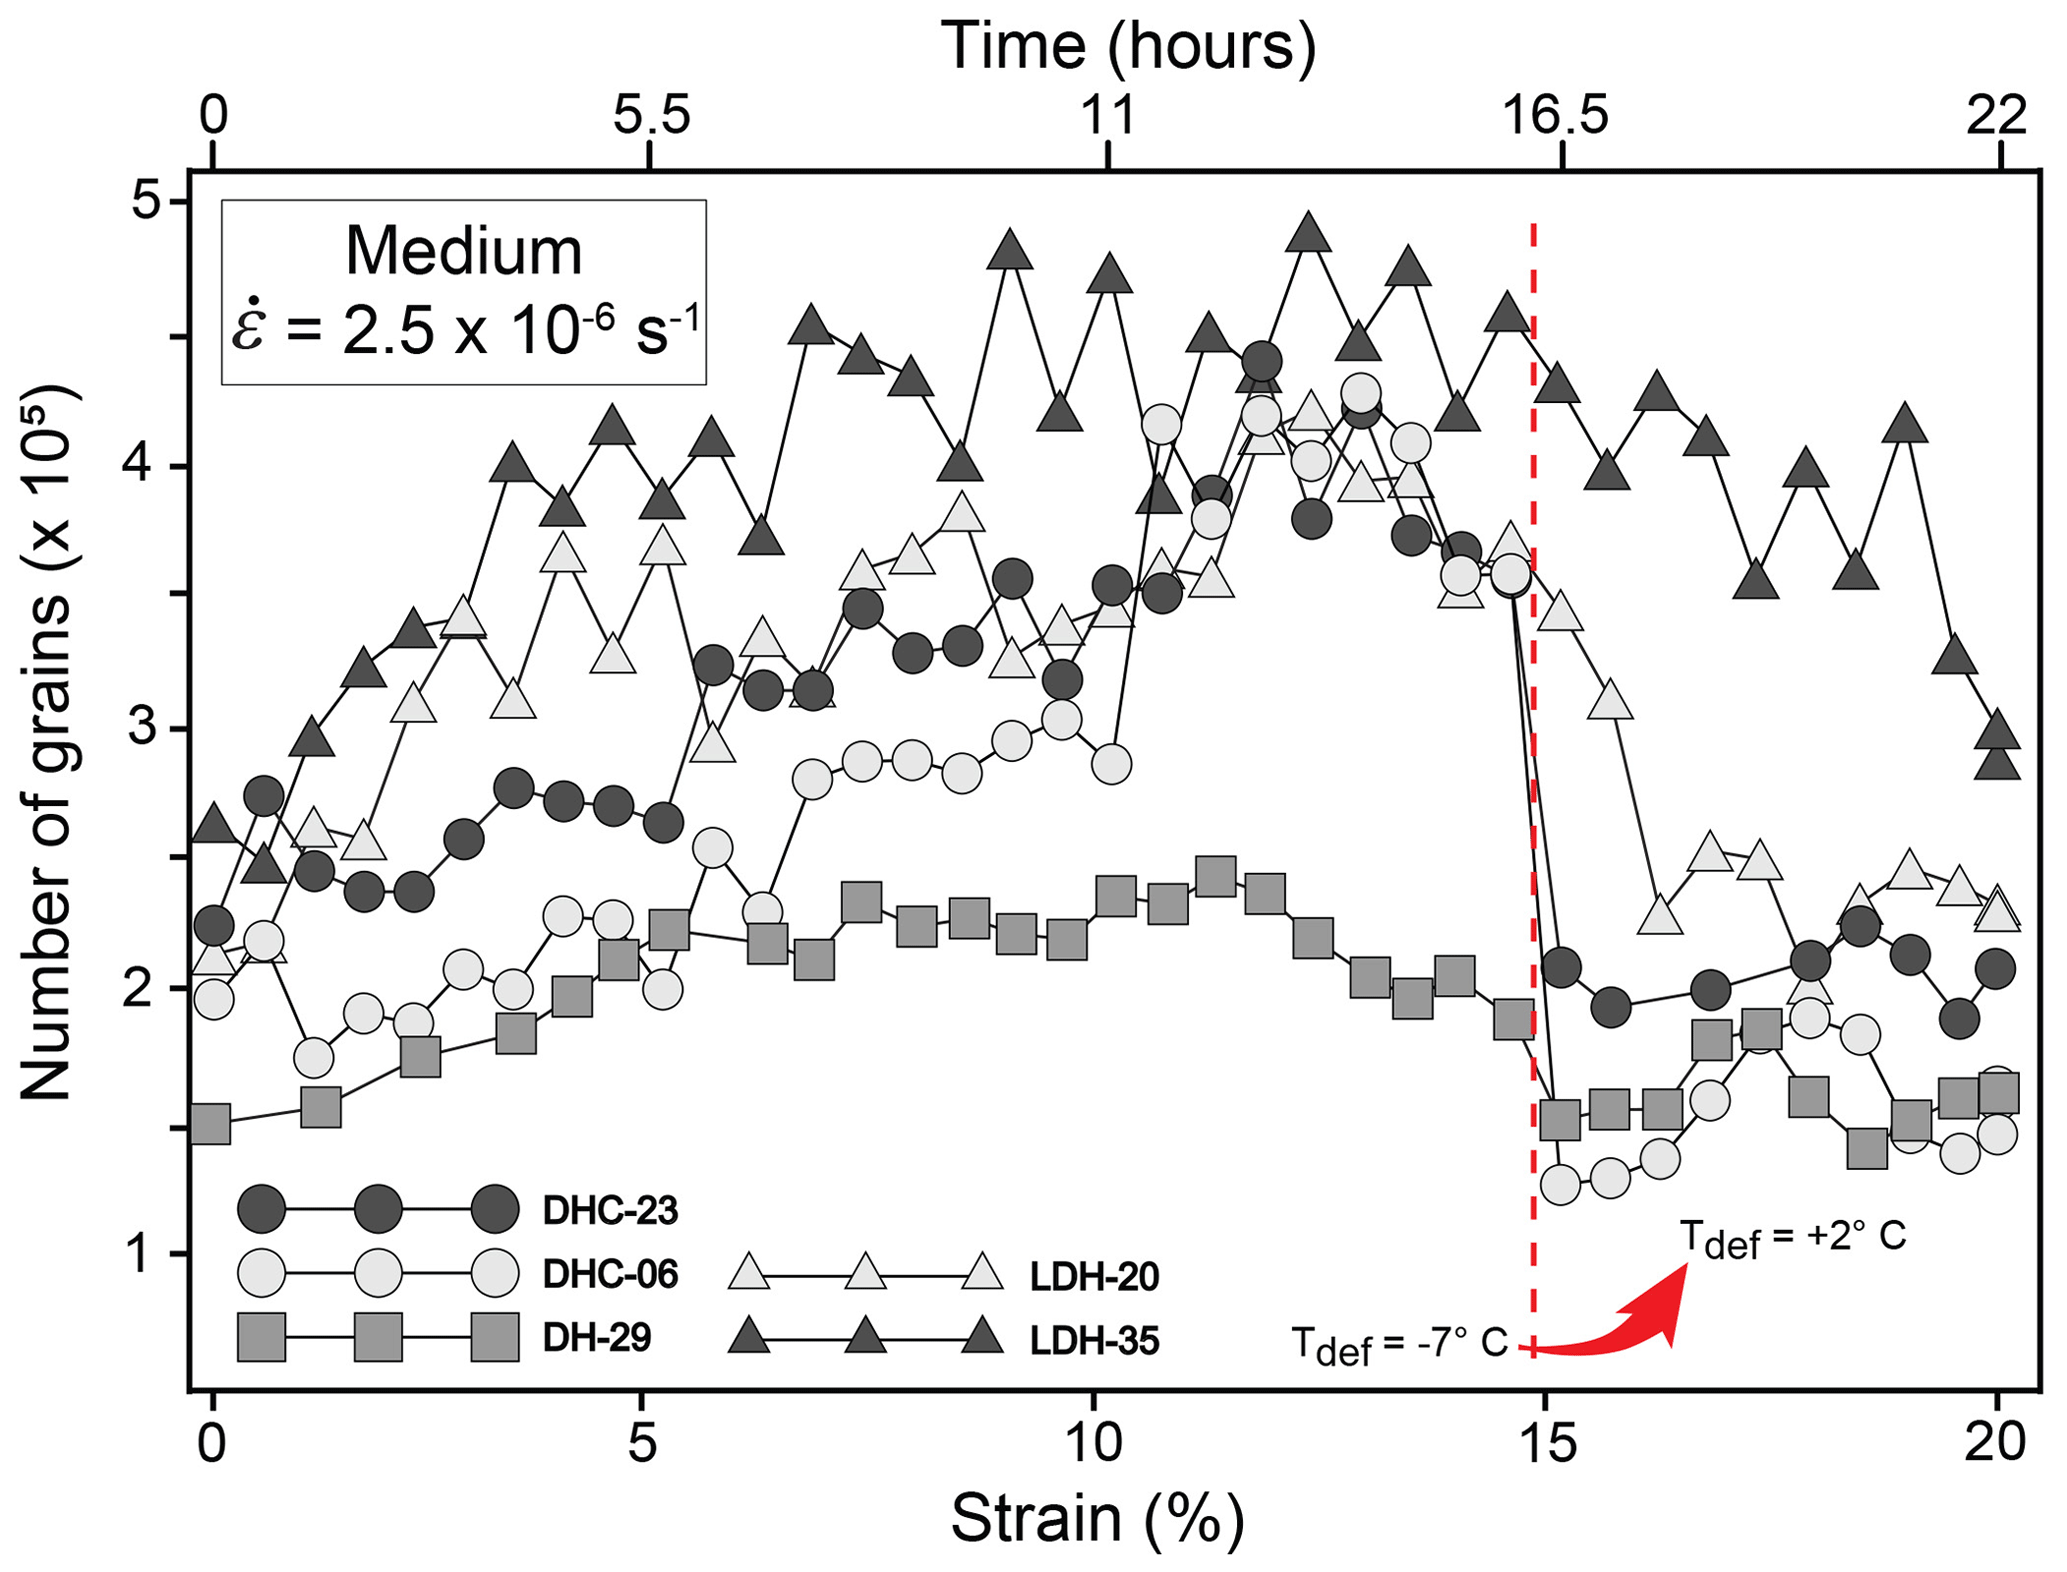
Figure 10A grain number evaluation at different stages during deformation. The error in the grain number determination is approximately ±500. The initial deformation temperature is −7 ∘C until 14.6 % shortening; the temperature is then raised to +2 ∘C, which is accompanied by a decrease in grain numbers. At 20 % shortening the temperature is rapidly decreased to −10 ∘C, and any water phase freezes. The method of obtaining these grain numbers is described in Wilson et al. (2019).
The slowest set of changes in grain size evolution was noted in sample DH-29 where initial grains were bonded together by D2O water. Where there is a single layer of dry-compacted ice abutting the water-bonded ice (DHC-06, -23 and LDH-20, -35) there was a steep reduction in grain numbers after the temperature was increased, corresponding to a rapid increase in the grain size. The pattern in the triple-layered sample LDH-35 is a steep increase in grain numbers during the first ∼ 7 % strain at −7 ∘C, followed by a grain size fluctuation until 14.6 % and a slow but significant decrease in the number during temperature increase, representing a slower grain size increase than the DHC samples.
Using neutron tomography, we can identify sites of former meltwater as mixes of HDO (Mix-1 and Mix-2) and concentrations of H2O, which are primarily confined to shear and compaction bands. The situation is complicated, as different HDO mixes have been identified and the temperature dependence for the mobility of the proton is not accurately known (Kunst and Warman, 1980). However, at −5 ∘C the mobility of protons in H2O ice has been determined to be 6.4 × 10⁻³ cm2 V−1 s−1 and of deuterons in D2O ice to be 2.4 × 10⁻³ cm2 V−1 s−1. These values increase at elevated temperatures, and a maximum mobility is predicted (Kunst and Warman, 1980). Moreover, as these experiments have shown, the diffusion of hydrogen, which is a tracer for the location of meltwater, through conjugate shear zone formation or basal compaction, contributes significantly to overall meltwater transport. During deformation, the solid matrix of D2O can receive the stresses, and the overall bulk behaviour is that of a solid. There is a timescale for meltwater initiation, and its diffusion/transport is related to the evolution of the shear bands and the location of soft grains (Fig. 8d). The volumetric compaction of the solid matrix appears to be the source of the instabilities, and there are regions where the meltwater fraction is mobilized via shear-induced failure modes (Supplement Fig. S5). In the pore-rich dry-compacted regions and on the boundaries of the calcite-rich layers the meltwater segregations coincide with the compactive/dilational Z direction with compaction bands parallel to the XY plane. It is therefore obvious that in the layered samples there is a pressure gradient with different behaviours between layers.
The channelized flow of meltwater mixes produces a disequilibrium in a solid ice matrix, with much of the meltwater transport occurring in isolated, highly permeable interconnected channels (Supplement Fig. S4). The spacing of the channels does not depend on sample size but is controlled by the physical properties of individual layers. While the resolution obtained in our images is generally good enough to obtain complete characterization of the pore or bubble network, it is not sufficient to identify initiation sites of melt. However, it is observed that there is a coupling process between pores with the melt mixes reflected in the increased coordination numbers (Fig. 5a–c) and location on grain boundaries (Fig. 8d). This coupling process, induced by the deformation, is also accompanied by an increase in pore diameters (Fig. 5d). This coalescence of pores and association with melt-enriched bands form connected pathways for the flow and concentrations of former meltwater to areas of low pressure on the margins of the deformed sample.
4.1 Failure modes in the ice
The observed influence of meltwater is reflected in the state of stress after the effective viscosity, reaching a steady state at ∼ 14.6 % shortening. As melting proceeds during the remaining 5.4 % of shortening the stress increases before a noticeable weakening, which we attribute to grain boundary migration. Also, once the temperature starts to exceed the melting point of the H2O ice two kinematic-based failure modes develop, namely conjugate shear bands and/or as melt-enriched compactional bands. The latter are developed perpendicular to the maximum (compressive) stress σ1 (Fig. 11). These are identical to geological observations where pore space compacts and ductile failure develops with deformation distributed in a localized manner (Wong et al., 2001). The first increments of strain appear to form as shear zones ≤35∘ to the compression axis and are oblique to the finite strain-sensitive XY plane of flattening adjacent to any inherited layering and the face of the deforming piston. This shear band failure would involve the pore pressure of the meltwater increasing with the Mohr stress touching the yield surface (Fig. 11a). The common way to use a Mohr–Coulomb failure criterion is with no cap on the yield surface (Borja and Aydin, 2004). The lack of inclusion of a cap implies an ice mass can sustain unlimited compressive stresses without yielding. If a yield cap is included (Reiweger et al., 2015), the yield in compression is considered to be grain crushing, and compaction bands are the result (Fossen et al., 2007; Hobbs and Ord, 2023).
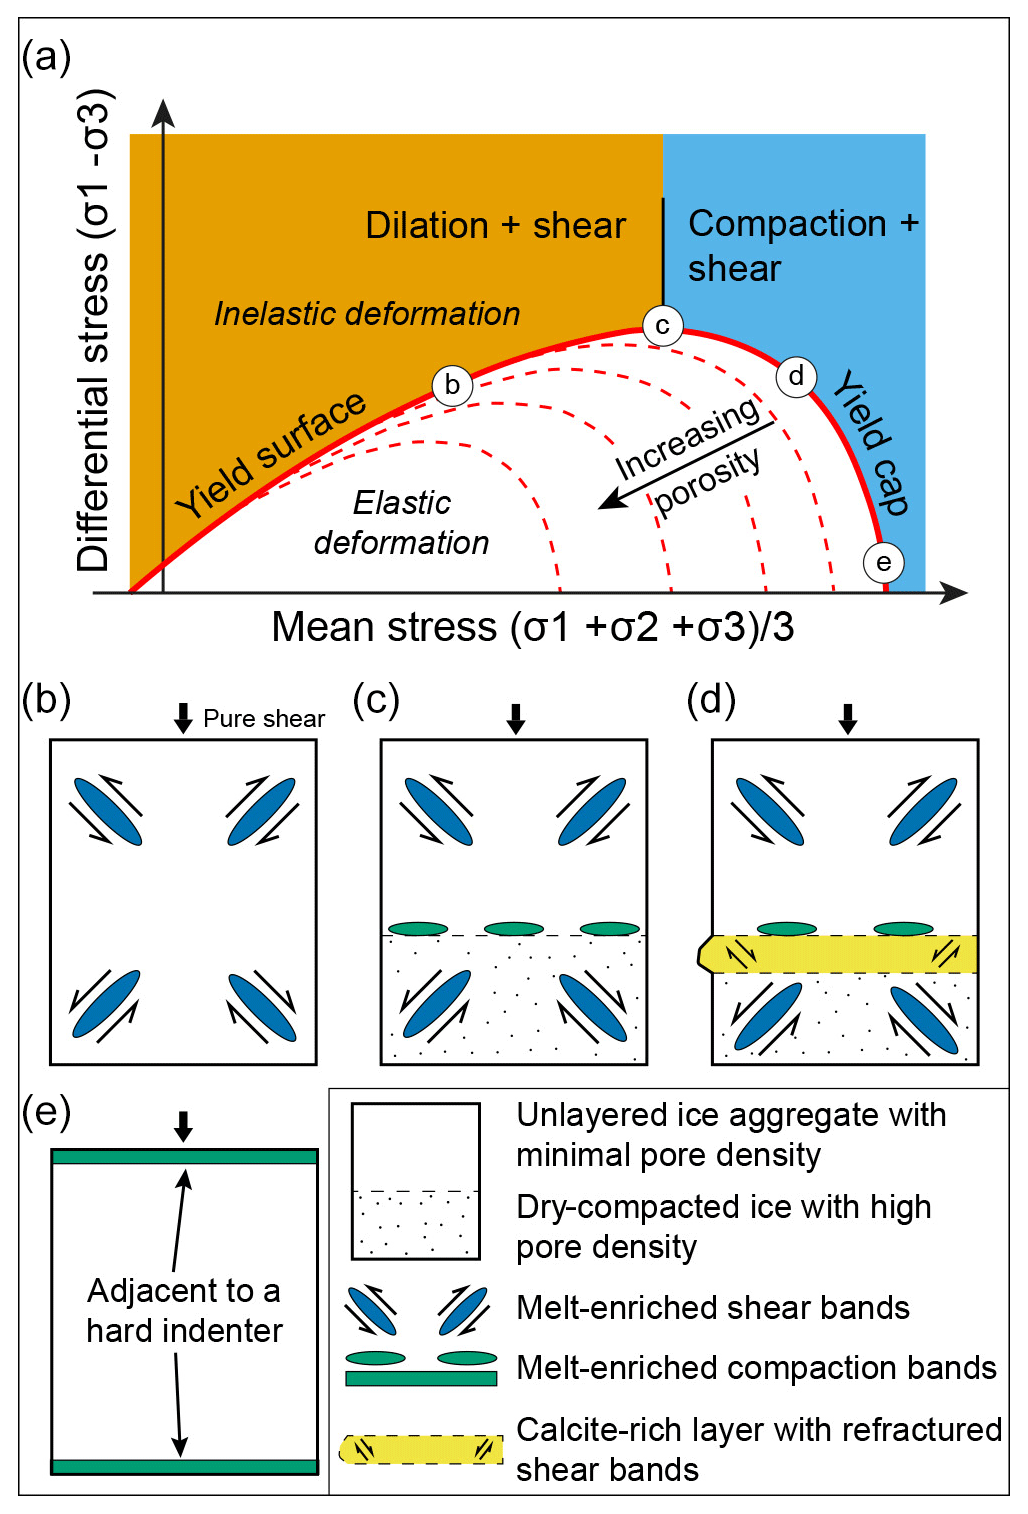
Figure 11Schematic representation of a Mohr–Coulomb failure criterion with a capped yield surface with deformation modes identified in these experiments. (a) Nature of the yield surface or Mohr–Coulomb envelope and cap, which depends on porosity, grain size, and the low (0.04–0.02) coefficient of friction for the ice (adapted from Reiweger et al., 2015, and Fossen et al., 2007). With decreasing cohesive strength and increasing porosity the shear failure envelope moves to a lower pore-fluid factor and differential stress. The various 2D modes of yielding identified in the deformed cylindrical samples (b–e) are shown with a vertical stress σ1. (b) Samples with no differences in material properties, dominated by conjugate shear bands. (c) Samples with weaker dry-compacted (DHC) and stronger water-rich ice (DH) with localized shear bands and a melt-enriched compaction band between the two ice types. (d) Triple-layered samples with stress σ1 normal to the interface between a calcite-rich layer, bounded by weaker material on either side. (e) Compaction bands developed at the interface with indenting piston, and no stress refraction occurs.
Initiation of the compaction bands may be promoted by a higher meltwater content. Initiation is also noticeably influenced by the collapsible nature of the high-porosity dry-compacted ice layers and the stronger impure calcite-rich layer as a result of compression normal to the layering. The compaction band failures appear to be cases of pure compressive loading, i.e. without any shear stress. This behaviour is quite typical of other (porous) granular materials (Borja and Aydin, 2004) or snowpack layers (Reiweger et al., 2015). The compaction bands are equivalent to opening mode veins, which in compressed geological materials can also involve solution seams parallel to the veins (Fossen et al., 2007). As pointed out by Reiweger et al. (2015) where there is a weak layer in a compacted ice sample, then a Mohr–Coulomb failure criterion does not account for the compressive failure, and a cap needs to be added to the yield surface (Fig. 11). This would allow the layered ice to yield by increasing the meltwater-induced fluid pressure (Pf) which must be greater than the least compressive stress (Pf >σ3) where Pf is approximately the average mean stress (σmean) in the bulk of the sample. As well as the fluid pressure there are other factors that may change with time, including confining pressure, deviatoric stress, volume (either positive or negative), and the nature of the ice matrix.
The cap model (Fig. 11) is applicable to any material that changes volume during deformation (Issen and Rudnicki, 2000), including a rate-sensitive visco-plastic material such as ice (Duval et al., 1983). The nature of the deformation will also depend on the heat involved and the relative rates of endothermic/exothermic processes. In the current study meltwater generation, confined to shear and compaction bands, is coupled to the addition of heat during an endothermic deformation. In other situations, the melting process may be controlled by localized higher strains involving increased internal stresses and/or shear heat dissipation, producing an exothermic reaction and a dilatant change (Hobbs and Ord, 2023). Insights into the latter process were observed in the 2D experiment described and modelled by Wilson et al. (1996). Here the driving force for the melting process is higher spot temperature increases initiated adjacent to the indenter, which is normal to the maximum principal compressive stress, σ1, and in conjugate dilatational slip lines oriented ∼ 35∘ to σ1. The 2D features described by Wilson et al. (1996) would be equivalent to the compaction and shear bands described in the current 3D experiments.
In the layered samples there were different behaviours across and within the layering; therefore the state of stress will vary, or refract, across the interface of the contact. This is clearly observed in LDH-35 (Fig. 9b, c). The type of deformation band that forms will depend on the state of stress at the moment of plastic yielding, i.e. on the point of intersection between loading path and the yield surface. For example, the melt-enriched shear bands are formed at relatively low confining pressure (Fig. 11b), whereas compactional bands are formed at higher confining pressures (Fig. 11c). Figure 10d illustrates complications that may occur in a layered ice mass as stress and shear strains refract between layers. The critical pressure, occurring adjacent to a rigid indenter (Fig. 11e), is the pressure at which compaction occurs in the absence of shearing, resulting in only compaction bands. The development of the compactional bands is also a competition between the rate and magnitude of deformation and the rate at which melt-enriched fluids can be generated.
4.2 Influence of melt distribution on CPO development
If we compare the results of pure D2O ice deformed at colder temperatures (−7 and −1 ∘C; Fig. 6h–i), the CPO development in the melt-enriched areas in D2O-water-rich ice (DH) is weaker. The [c]-axis clusters in the melted samples have a radius of 40∘ (Fig. 6d), which can be related to small-scale shear bands (Fig. 6e). These melt-enriched segregations are localized instabilities, correspond to the dominance of soft versus hard grains identified in the shear bands (Fig. 8d), and represent weak and strong regions with their CPO strongly influencing the rheological properties. In contrast, dry-compacted ice (DC) deformed under identical conditions has a more pronounced cone-like distribution of [c] axes, a 35∘ radius (Fig. 6h), and a greater spread of <a> axes in the peripheral region (Supplement Fig. S7). In the DC ice the grain and pore network produces a greater compaction (area DC in Fig. 3), which is the reason for the evolution of the stronger CPO. These observations are highly reproducible in all samples.
The CPO data in the LDH-35 sample are a composite measured across the layering (Fig. 6g) where there is clear evidence for the formation of compaction bands. However, there is an anomalous concentration of [c] axes parallel to σ1 at the centre of a weak [c]-axis cluster (radius 35∘) with a weak development of <a>-axis distribution (Supplement Fig. S3c). Comparing this to terrestrial ice cores, the [c]-axis maxima parallel to σ1 are clearly identified in areas of high compactional strains (Castelnau et al., 1998; Gow et al., 1997) or in accumulation areas near the surface of an ice sheet (Li and Jacka, 2017). A compressional component, with [c] axes parallel to σ1, is also observed in partial pole figure data obtained during the first increment of deformation (Wilson et al., 2020). This is not an experimental artefact; rather it is a boundary condition imposed by an initial increment of flattening and high pressures imposed by the indenting piston.
The ubiquitous [c]-axis patterns in melt-free samples deformed at lower temperatures (Fig. 6i) break down in the presence of meltwater, particularly in samples with networks of melt-enriched shear bands. The usual interpretation of a cone or cluster fabric (Hunter et al., 2023) is that slip is dominant on the basal plane (0001) with preferred slip vectors parallel to [a] (Wilson et al., 2014). However, there is no mechanistic reason to argue that the presence of melt activates a glide of dislocations with other slip vectors. The change to weaker CPOs in melt-enriched areas, along with a strong compressional component, suggests that this is highly relevant to any interpretation of weaker fabrics observed in many natural ice cores.
4.3 Ice sheet and glacial implications
By design, these experiments impose simple boundary conditions, and extrapolation to larger scales may need to be modified because in the natural environment, there are complex boundary conditions with a stress or strain-rate dependence for ice viscosity, and most regions at the base of an ice sheet will be undergoing ductile deformation of the solid framework. This will also result in grain-scale dilatancy (Duval, 1977) especially at elevated confining and fluid pressures. In addition, this may well produce additional porosity, permeability, and the generation of fluid pressure gradients alongside the deformation rate gradients. The driving forces for the movement of meltwater are most likely driven by variations in temperature and meltwater fluid pressure variations (Hooke and Hudleston, 1978) and will be constantly teetering on the edge of shear and/or brittle failure. Any passive accumulation of a significant meltwater fraction in the source is extremely unlikely. With the meltwater being driven along deformation rate gradients in the form of an interconnected channelized flow, whereas buoyancy forces due to density differences will be small and will not drive the meltwater migration, except perhaps in the upper levels of temperate glaciers (Lliboutry, 1996).
As shown by these experiments, ductile shear zones produce an enhanced porosity. The porosity creation will result in a lower pressure within the shear zone, providing a potentially important permeability for meltwater migration from the surrounding, more slowly deforming ice mass. In addition, the enhanced permeability will encourage the sucking out or a channelized flow of meltwater along the shear zone to the lower-pressure areas, as seen by the circular concentration of water mixes on the outer edges of the deformed samples (Fig. 1, Supplement Fig. S5). This could be an explanation for the channelized flow during the deformation of natural ice masses forming the distinct basal and marginal ice units recognized in ice sheets (Bell et al., 2014). In such an environment the deviatoric stress and meltwater migration are always complex, in part because the rheological controls of the processes are sensitive to timescale and length scale. As shown by our observations, as meltwater migrates from its source to its final destination it passes through a range of conditions in which the thermodynamic state and material properties along the melt-enriched bands and ice-matrix are changing. There may also be time-dependent recovery of cohesive strength due to meltwater freezing with loss of associated permeability or the transition of the ice mass to a new site during progressive deformation. These will be key factors influencing whether or not the meltwater-enriched shear bands and the associated permeability enhancement will occur in a pre-existing area or on a new optimally oriented shear zone.
Observations in natural ice masses suggest there is a widespread occurrence of parallel foliation bands or lenses with localized zones of high porosity produced under conditions of shearing or compression (Hudleston, 2015). Thin sections of such ice reveal coarse, clear grains and bubble concentrations, similar to the deformation bands in these experiments. However, because of higher strains these bands are rotated into the plane of flattening as described by Hooke and Hudleston (1978). Complications occur, as foliation development may be influenced by confining pressure or by the deformation of pre-existing inhomogeneities, for example sedimentary layers, or a deformation band as described in this investigation. As demonstrated by the current experiments partially molten ice aggregates deformed in pure shear develop localized compaction bands with high porosity and enhanced strain perpendicular to the direction of maximum compression, which could account for some of the foliations recognized in ice sheets. The presence of melt-enriched bands would also explain why there are many significant CPO changes observed in vertical profiles through terrestrial ice masses (Gow et al., 1997). Accompanying this, there may be increased dissolution along a deformation band or, more commonly, after deformation that may be promoted by impurities or an increase in porosity (Fossen et al., 2007).
4.4 Conclusion
This is an analysis of a unique set of deformation experiments on the melting of ice mixtures and changes driven by a temperature increase. The solid skeleton of the ice matrix is supporting the applied stresses, and thus the rheology can be non-linear during the melting process. We have shown that solid-matrix-controlled volumetric instabilities, namely conjugate shear bands and compaction bands, emerge during the melting process. These are characterized by localized high-porosity melt zones that are interspersed inside the compacting matrix and provide pathways for meltwater flow to low-pressure areas. There is a timescale for meltwater initiation and its diffusion/transport related to the evolution of the shear and compaction bands. At higher strains these features could account for foliation parallel bands or lenses recognized in glaciers and in ice sheets. These pockets of former meltwater are responsible for weaker crystallographic preferred orientations and enhanced grain growth and are relevant to any interpretation of weaker c-axis fabrics observed in natural ice cores.
The software used to process the original neutron diffraction data is not publicly available; however, processed data are available on request from the authors. Original tomographic data are available from the Australian Antarctic Data Centre – https://data.aad.gov.au/metadata/AAS_4581_neutron_diffraction (last access: 8 February 2024; DOI: https://doi.org/10.26179/2rw2-7y07, Wilson et al., 2024) – and can be accessed with permission of the authors.
The three supplementary videos (S4–S6) can be obtained at https://doi.org/10.5446/63236 (Wilson, 2023a), https://doi.org/10.5446/63237 (Wilson, 2023b), and https://doi.org/10.5446/63238 (Wilson, 2023c).
The supplement related to this article is available online at: https://doi.org/10.5194/tc-18-819-2024-supplement.
CJLW and MP conceptualized the original idea of this study. CJLW led the data acquisition and analysis, wrote the majority of the text, and was involved in figure preparation. Data acquisition and initial data analysis were overseen by VL and FS with help from MP, who was also involved in figure preparation. The segmentation and first working visualizations were undertaken by FE and OM, with the CPO data analysed by NJRH. The final manuscript was reviewed and edited by CJLW, MP, FS, VL, FE, and NJRH.
The contact author has declared that none of the authors has any competing interests.
Publisher’s note: Copernicus Publications remains neutral with regard to jurisdictional claims made in the text, published maps, institutional affiliations, or any other geographical representation in this paper. While Copernicus Publications makes every effort to include appropriate place names, the final responsibility lies with the authors.
This work was undertaken in collaboration with the Centre for Neutron Scattering at the Australian Nuclear Science and Technology Organisation (ANSTO), Lucas Heights, Australia. Data for this paper come from project 6396, with technical support and discussions with ANSTO staff gratefully acknowledged. In particular Norman Booth, part of the Sample Environment Team who constructed and monitored the cryo-assembly on DINGO, was responsible for saving a number of samples from melting. Ruth Wasmund is thanked for her assistance during sample preparation. The primary segmentation was undertaken at Mainz University by students in Frieder Enzmann's working group and assembled by Uzochukwu Akwuba at Gothenburg University. The original neutron tomography data sets are stored in the Australian Antarctic Data Centre at part of project 4581. We thank the anonymous reviewers and editorial comments by Kaitlin Keegan.
This research has been supported by the Australian Nuclear Science and Technology Organisation (grant no. 6396), the Australian Antarctic Division (grant no. 4581), the bilateral DAAD Australia–Germany Joint Research Co-operative Scheme (project 57316937), and the Swedish Research Council (grant 2020-03222).
This paper was edited by Kaitlin Keegan and reviewed by two anonymous referees.
Adams C. J. C., Iverson, N. R., Helanow, C., Zoet, L. K., and Bate, C. E.: Softening of temperate ice by interstitial water, Front. Earth Sci., 9, 702761, https://doi.org/10.3389/feart.2021.702761, 2021.
Alley, R. B., Dupont, T. K., Parizek, B. R., and Anandakrishnan, S.: Access of surface meltwater to beds of sub-freezing glaciers: preliminary insights, Ann. Glaciol., 40, 8–14, https://doi.org/10.3189/172756405781813483, 1988.
Andrew, M.: Comparing organic-hosted and intergranular pore networks: topography and topology in grains, gaps and bubbles, J. Geol. Soc. Lond. Spec. Pub., 484, 241–253, https://doi.org/10.1144/SP484.4, 2020.
Barnes, P., Tabor, D., and Walker, J. C. F.: The Friction and Creep of Polycrystalline Ice, Proc. Roy. Soc. Lond., A324, 127–155, https://doi.org/10.1098/rspa.1971.0132, 1971.
Bell, R. E., Studinger, M., Shuman, C. A., Fahnestock, M. A., and Joughin, I.: Deformation, warming and softening of Greenland's ice by refreezing meltwater, Nat. Geosci., 445, 904–907, https://doi.org/10.1038/nature05554, 2007.
Bell, R. E., Tino, K., Das, I., Wolovick, M., Chu, W., Creyts, T. T., Frearson, N., Abdi, A., and Paden, J. D.: Large subglacial lakes in east Antarctica and the onset of fast-flowing ice streams, Nature, 7, 497–502, https://doi.org/10.1038/NGEO2179, 2014.
Bennett, J.: Commissioning of NAA at the new OPAL reactor in Australia, J. Radioanal. Nucl. Ch., 278, 671–673, https://doi.org/10.1007/s10967-008-1502-0, 2008.
Borja, R. I. and Aydin, A.: Computational modeling of deformation bands in granular media: I. Geological and mathematical framework, Comput. Methods Appl. Mech. Eng., 193, 2667–2698, https://doi.org/10.1016/j.cma.2003.09.019, 2004.
Castelnau, O., Shojib, H., Mangeney, A., Milsch, H., Duval, P., Miyamoto, A., Kawadaf, K., and Watanabe, O.: Anisotropic behaviour of GRIP ices and flow in Central Greenland, Earth Planet. Sc. Lett., 154, 307–322, https://doi.org/10.1016/S0012-821X(97)00193-3, 1998.
Chauhan, S., Rühaak, W., Kahn, F., Enzmann, F., Mielke, P., Kersten, M., and Sass, I.: Processing of rock core microtomography images: Using seven different machine learning algorithems, Comput. Geosci., 86, 120–128, https://doi.org/10.1016/j.cageo.2015.10.013, 2016.
Creyts, T. T. and Clarke, G. K.: Hydraulics of subglacial supercooling: Theory and simulations for clear water flows, J. Geophys. Res., 115, F03021, https://doi.org/10.1029/2009JF001417, 2010.
Dierick, M., Masschaele, B., and Van Hoorebeke, L.: Octopus, a fast and user-friendly tomographic reconstruction package developed in LabView, Meas. Sci. Technol., 15, 1366–1370, https://doi.org/10.1088/0957-0233/15/7/020, 2004.
Droria, R., Holmes-Cerfond, M., Kahra, B., Kohnd, R. V., and Warda, M. D.: Dynamics and unsteady morphologies at ice interfaces driven by D2O–H2O exchange, P. Natl. Acad. Sci. USA, 114, 11627–11632, https://doi.org/10.1073/pnas.1621058114, 2017.
Duval, P.: The role of the water content on the creep rate of polycrystalline ice, International Association of Hydrological Sciences Publication, 118, 29–33, 1977.
Duval, P., Ashby, M. F., and Anderman, I.: Rate-controlling processes in the creep of polycrystalline ice, J. Phys. Chem., 87, 4066–4074, https://doi.org/10.1021/j100244a014, 1983.
Engelhard, H.: Thermal regime and dynamics of the West Antarctic ice sheet, Ann. Glaciol., 39, 85–92, https://doi.org/10.3189/172756404781814203, 2004.
Engelhardt, H. and Kamb, B.: Basal hydraulic system of a West Antarctic ice stream: Constraints from borehole observations, J. Glaciol., 43, 207–230, https://doi.org/10.3189/S0022143000003166, 1997.
Fossen, H., Schultz, R. A., Shipton, Z. K., and Mai, K.: Deformation bands in sandstone: a review, J. Geol. Soc. Lond., 164, 755–769, https://doi.org/10.1144/0016-76492006-036, 2007.
Fowler, J. R. and Iverson, N. R.: A permeameter for temperate ice: first results on permeability sensitivity to grain size, J. Glaciol., 68, 764–774, https://doi.org/10.1017/jog.2021.136, 2022.
Garbe, U., Randall, T., Hughes, C., Davidson, G., Pangelis, S., and Kennedy, S. J.: A New Neutron Radiography/Tomography/Imaging Station DINGO at OPAL, Physcs. Proc., 69, 27–32, https://doi.org/10.1016/j.phpro.2015.07.003, 2015.
Gow, A. J., Meese, D. A., Alley, R. B., Fitzpatrick, J. J., Anandakrishnan, S., Woods, G. A., and Elder, B. C.: Physical and structural properties of the Greenland Ice Sheet Project 2 ice core: A review, J. Geophys. Res., 102, 26559–26575, https://doi.org/10.1029/97JC00165, 1997.
Grant, S. A. and Sletten, R. S.: Calculating capillary pressures in frozen and ice-free soils below the melting temperature, Environ. Earth Sci., 42, 130–136, https://doi.org/10.1007/s00254-001-0482-y, 2002.
Hammes, D. M. and Peternell, M.: FAME: Software for analysing rock microstructures, Comput. Geosci., 90, 24–33, https://doi.org/10.1016/j.cageo.2016.02.010, 2016.
Harrington, J. A., Humphrey, N. F., and Harper, J. T.: Temperature distribution and thermal anomalies along a flowline of the Greenland ice sheet, Ann. Glaciol., 56, 98–104, https://doi.org/10.3189/2015AoG70A945, 2015.
Haseloff, M., Hewitt, I. J., and Katz, R. F.: Englacial pore water localizes shear in temperate ice stream margins, J. Geophys. Res.-Earth, 124, 2521–2541, https://doi.org/10.1029/2019JF005399, 2019.
Hobbs, B. E. and Ord, A.: Failure modes in fluid saturated rocks: deformation processes and mode-switching, Geol. Mag., 159, 2002–2019, https://doi.org/10.1017/S0016756822000516, 2023.
Hooke, R. I. B. and Hudleston, P. J.: Origin of foliation in glaciers, J. Glaciol., 20, 285–299, https://doi.org/10.3189/S0022143000013848, 1978.
Hudleston, P. J.: Structures and fabrics in glacial ice: A review, J. Struc. Geol., 81, 1–27, https://doi.org/10.1016/j.jsg.2015.09.003, 2015.
Hunter, N. J. R., Wilson C. J. L., and Luzin, V.: Crystallographic preferred orientation (CPO) patterns in axially compressed deuterated ice: quantitative analysis of historical data, J. Glaciol., 69, 737–748, https://doi.org/10.1017/jog.2022.95, 2023.
Issen, K. A. and Rudnicki, J. W.: Conditions for compaction bands in porous rock, J. Geophys. Res., 105, 21529–21536, https://doi.org/10.1029/2000JB900185, 2000.
Jacka, T. H. and Li, J.: Flow rates and crystal orientation fabrics in compression of polycrystalline ice at low temperature and stresses, in: Physics of ice core records I., edited by: Hondoh, T., Hokkaido University Press, Sapporo, 83–113, ISBN 4832902822, 2000.
Kamb, B.: Basal zone of the West Antarctic ice streams and its role in lubrication of their rapid motion, in: The West Antarctic ice sheet: behaviour and environment, edited by: Alley, R. B. and Bindschadler, R. A., Am Geophys. Union, Washington DC, 157–199, https://doi.org/10.1029/AR077p0157, 2001.
Khan, F., Enzmann, F., Kersten, M., Wiegmann, A., and Steiner, K.: 3D simulation of permeability tensor in a soil aggregate on basis of nanotomographic imaging and LBE solver, J. Soil. Sediment., 12, 86–96, https://doi.org/10.1007/s11368-011-0435-3, 2012.
Kronenberg, A. K., Ashley, K. T., Francsis, M. K., Holyoke III, C. W., Jezek, L., Kronenberg, J. A., Law, R. D., and Thomas, J. B.: Water loss during dynamic recrystallization of Moine thrust quartzites, northwest Scotland, Geology, 48, 557–561, https://doi.org/10.1130/G47041.1, 2020.
Kunst, M. and Warman, J. M.: Proton mobility in ice, Nature, 288, 465–467, https://doi.org/10.1038/288465a0, 1980.
Li, J. and Jacka, T. H.: Crystal-growth rates in firn and shallow ice at high-accumulation sites, Ann. Glaciol., 29, 169–175, https://doi.org/10.3189/172756499781821508, 2017.
Li, J.-C. and Ross, D. K.: Inelastic neutron scattering studies of defect modes of H in D2O ice Ih, J. Phys.-Condens. Mat., 6, 10823–10837, https://doi.org/10.1088/0953-8984/6/49/023, 1994.
Li, J.-C., Nield, V. M., Ross D. K., Whitworth, R. W., Wilson, C. C., and Keen, D. A.: Diffuse neutron-scattering study of deuterated ice Ih, Philos. Mag. B, 69, 1173–1181, https://doi.org/10.1080/01418639408240187, 1994.
Lliboutry, I.: Temperate ice permeability, stability of water veins and percolation of internal meltwater, J. Glaciol., 42, 201–211, https://doi.org/10.3189/S0022143000004068, 1996.
Llubes, M. C., Lanseau, C., and Remy, F.: Relations between basal condition, subglacial hydrological networks and geothermal flux in Antarctica, Earth Planet. Sc. Lett., 241, 655–662, https://doi.org/10.1016/j.epsl.2005.10.040, 2006.
Mellor, M. and Testa, R.: Effect of Temperature on the Creep of Ice, J. Glaciol., 8, 131–145, https://doi.org/10.3189/S0022143000020803, 1969.
Melton, S. M., Alley, R. B., Anandakrishnan, S., Parizek, B. R., Shahin, M. G., Stearns, L. A., LeWinter, A. L., and Finnegan, D. C.: Meltwater drainage and iceberg calving observed in hig-spatiotemporal resolution at Helheim Glacier, Greenland, J. Glaciol., 68, 812–828, https://doi.org/10.1017/jog.2021.141, 2022.
Minchew, B. M., Meyer, C. R., Robel, A. R., Gudmundsson, G. H., and Simons, M.: Processes controlling the downstream evolution of ice rheology in glacier shear margins: case study on Rutford Ice Stream, West Antarctica, J. Glaciol., 64, 583–594, https://doi.org/10.1017/jog.2018.47, 2018.
Morgan, V. I.: High-temperature Ice Creep Tests, Cold Reg. Sci. Tech., 19, 295–300, https://doi.org/10.1016/0165-232X(91)90044-H, 1991.
Nye, J. F. and Mae, S.: The effect of non-hydrostatic stress on intergranular water veins in ice, J. Glaciol., 11, 81–101, https://doi.org/10.3189/S0022143000022528, 1972.
Perol, T. and Rice, R.: Shear heating and weakening of the margins of West Antarctic ice streams, Geophys. Res. Lett., 42, 3406–3413, https://doi.org/10.1002/2015GL063638, 2015.
Peternell, M., Wilson, C. J. L., and Hammes, D. M.: Strain rate dependence for evolution of steady state grain sizes: Insights from high-strain experiments on ice, Earth Planet. Sc. Lett., 506, 168–174, https://doi.org/10.1016/j.epsl.2018.10.037, 2019.
Petrenko, V. F. and Whitworth, R. W.: Physics of Ice, Oxford Univ. Press, New York, ISBN 0198518951, 1999.
Reading, A. M., Stål, T., Halpin, J. A., Lösing, M., Ebbing. J., Shen, W., McCormack, F. S., Siddoway, C. S., and Hasterok, D.: Antarctic Geothermal Heat Flow and Its Implications for Tectonics and Ice Sheets, Nat. Rev. Earth Environ., 3, 814–831, https://doi.org/10.1038/s43017-022-00348-y, 2022.
Reiweger, I., Gaume, J., and Schweizer, J.: A new mixed-mode failure criterion for weak snowpack layers, Geophys. Res. Lett., 42, 1427–1432, https://doi.org/10.1002/2014GL062780, 2015.
Rignot, E., Mouginot, J., Scheuchi, B., van der Broeke, M., van Wessem, M. J., and Morlighem, M.: Four decades of Antarctic Ice Sheet mass balance from 1979–2017, P. Natl. Acad. Sci. USA, 116, 1095–1103, https://doi.org/10.1073/pnas.1812883116, 2019.
Rist, M. A. and Murrell, S. A. F.: Ice triaxial deformation and fracture, J. Glaciol., 40, 305–318, https://doi.org/10.3189/S0022143000007395, 1994.
Röthlisberger, H.: Water pressure in intra- and subglacial channels, J. Glaciol., 11, 177–203, https://doi.org/10.3189/S0022143000022188, 1972.
Shreve, R. L.: Movement of water in glaciers, J. Glaciol., 11, 205–214, https://doi.org/10.3189/S002214300002219X, 1972.
Thomson, P.-R., Aituar-Zhakupova, A., and Hier-Majumder, S.: Image segmentation and analysis of pore network geometry in two natural sandstones, Front. Earth. Sci., 6, 1–14, https://doi.org/10.3389/feart.2018.00058, 2018.
Van der Veen, C. J.: Fracture propagation as means of rapidly transferring surface meltwater to the base of glaciers, Geophys. Res. Lett., 34, L01501, https://doi.org/10.1029/2006GL028385, 2007.
Wang, Y., Lin, C. L., and Miller, J. D.: Improved 3D image segmentation for X-ray tomographic analysis of packed particle beds, Miner. Eng., 83, 185–191, https://doi.org/10.1016/j.mineng.2015.09.007, 2015.
Weertman, J.: Theory of water-filled crevasses in glaciers applied to vertical magma transport beneath oceanic ridges, J. Geophys. Res., 76, 1171–1183, https://doi.org/10.1029/JB076i005p01171, 1971.
Wilson, C. J. L.: Supplementary Fig. 4, TIB [video], https://doi.org/10.5446/63236, 2023a.
Wilson, C. J. L.: Supplementary Figure 5, TIB [video], https://doi.org/10.5446/63237, 2023b.
Wilson, C. J. L.: Supplementary Figure 6, TIB [video], https://doi.org/10.5446/63238, 2023c.
Wilson, C. J. L. and Peternell, M.: Evaluating ice fabrics using fabric analyser techniques in Sørsdal Glacier, East Antarctica, J. Glaciol., 57, 881–894, https://doi.org/10.3189/002214311798043744, 2011.
Wilson, C. J. L., Zhang, Y., and Stüwe K.: The effects of localized deformation on melting processes in ice, Cold Reg. Sci. Tech., 24, 177–189, https://doi.org/10.1016/0165-232X(95)00024-6, 1996.
Wilson, C. J. L., Peternell, M., Piazolo, S., and Luzin, V.: Microstructure and fabric development in ice: Lessons learned from in situ experiments and implications for understanding rock evolution, J. Struct. Geol., 61, 50–77, https://doi.org/10.1016/j.jsg.2013.05.006, 2014.
Wilson, C. J. L., Hunter, N. J. R., Luzin, V., Peternell, M., and Piazolo, S.: The influence of strain rate and presence of dispersed second phases on the deformation behaviour of polycrystalline D2O ice, J. Glaciol., 65, 101–122, https://doi.org/10.1017/jog.2018.100, 2019.
Wilson, C. J. L., Peternell, M., Hunter, N. J. R., and Luzin V.: Deformation of polycrystalline D2O ice: Its sensitivity to temperature and strain rate as an analogue for terrestrial ice, Earth Planet. Sc. Lett., 532, 115999, https://doi.org/10.1016/j.epsl.2019.115999, 2020.
Wilson, C. J. L., Peternell, M., Salvemini, F., and Luzin, V.: Neutron diffraction data on D2O and H2O ice analysed at ANSTO, Ver. 1, Australian Antarctic Data Centre [data set], https://doi.org/10.26179/2rw2-7y07, 2024.
Wong, T.-F., Baud, P., and Klein, E.: Localized failure modes in a compactant porous rock, J. Geophys. Res., 28, 2521–2524, https://doi.org/10.1029/2001GL012960, 2001.
Zwally, H. J., Abdalati, T., Herring, T., Larson, K., Saba, J., and Steffen, K.: Surface melt-induced acceleration of Greenland ice-sheet flow, 297, 218–222, https://doi.org/10.1126/science.1072708, 2002.